Article

Framework for the Detection, Diagnosis, and Evaluation of Thermal Bridges Using Infrared Thermography and Unmanned Aerial Vehicles

Illinois Institute of Technology, Chicago, IL 60616, USA
*
Author to whom correspondence should be addressed.
Buildings 2019, 9(8), 179; https://doi.org/10.3390/buildings9080179
Submission received: 1 July 2019 / Revised: 27 July 2019 / Accepted: 30 July 2019 / Published: 1 August 2019
(This article belongs to the Special Issue IT in Design, Construction, and Management)

Abstract

:
The glass curtain wall system is an architectural, functional innovation where failures of insulation systems create areas of reduced resistance to heat transfer—thermal bridges—during a building’s operational lifetime. These failures enable energy flows that trigger unanticipated temperature changes and increased energy consumption, ultimately damaging the façade structure and directly impacting occupants. Our study aims to design and test an innovative method for rapidly identifying thermal bridges in façade systems, with minimum or no occupant disturbance. The research focus is in the classification of damage as either a local failure or as being related to a poor systematic construction/assembly. A nontraditional approach is adopted to survey an entire fully operational building using infrared thermography and an unmanned aerial vehicle (UAV) using a noncontact infrared camera mounted on and operated from the UAV. The system records the emissivity of the façade materials and calculates the thermal radiation to estimate localized temperatures. The system records thermal radiation readings which are analyzed using graphs to be compared with the American Society of Heating, Refrigerating and Air Conditioning Engineers (ASHRAE) standards, under ideal conditions using the THERM software. The results enable discussion relating to the most common failure areas for existing structures, facilitating the identification of focus areas for the improvement of construction methods through improved processes.

1. Introduction

The curtain wall system is a building enclosure technique comprising several crystal panels assembled to bear its own weight and resist exterior loads such as wind or rain [1]. The most common curtain wall structural components are made of aluminum, single floor span, and are supported by the main structure [2]. Thermal bridges are discontinuities in the curtain wall’s thermal barrier, which is the building enclosure that provides an insulated interior environment for Heating, Ventilation, and Air Conditioning (HVAC) systems, controls vapor transfer, and impacts thermal efficiency. The negative thermal effect increases in the presence of highly conductive material, like metal-exterior curtain walls [3]. A metal-exterior curtain wall is formed by vertical and horizontal exterior structures, crystal panels, and sealant finishing. Thermal bridges are most commonly located on the interface between the glass and metal panels or between different crystal panels where the sealant is placed [4]. A highly conductive material (e.g., aluminum) needs sealant—employed as a thermal break, made from a nonconductive material such as plastic or rubber—to prevent heat transfer and to provide resistance to condensation.
There are multiple components of the curtain walls that could perform poorly and produce a thermal bridge. For example, a common cause of problems is the failure of the gaskets and sealings [5]. Gaskets are strips of synthetic rubber or plastic that may damper the glass when the structure suffers movements. Although small displacements are allowed within the structure due to the flexibility of the sealant, the glass is fragile and stiff. With age, gaskets dry out, shrink, and the elasticity degrades, generating air spaces. The spaces admit air and moisture inside the system components, leading to condensation, drafts, and leaks. The air spaces and the resulting infiltration of condensation may lead to failure, thereby compromising the thermal performance and aesthetics of the components. As the gaskets further disintegrate, as an extreme example, they may detach and pull away from the frame. Unattached gaskets generate a lack of support within the curtain wall system, whereby the glass may lose stability and may shatter or blow out. Poor performance can also occur when the sealing requirements specified by the architect are not followed in the installation of the system (construction phase). In this case, thermal isolation systemically fails, which means that as well as water leakage, there is air leakage, further compromising the building’s envelope. Poor performance requires costly corrective actions, including the need to repair all the seals of the curtain wall system.
To evaluate the existence of thermal bridges within curtain wall systems, a method using nondestructive analysis was developed in the form of infrared radiation measurement. Infrared thermography (IRT) is a method that focuses on the acquisition and processing of thermal information from noncontact measurement devices [6]. The infrared radiation is electromagnetic radiation with wavelengths longer than those of visible light [7]. The human eye is only capable of observing a small and narrow range of radiation along the visible spectrum [8]. The use of sensors that capture such radiation is required for its measurement. The radiation is mainly a function of their temperature. This is a physical principle whereby all objects that are not at absolute zero temperature emit infrared radiation [9]. Although there are other tests using specific ranges within the electromagnetic spectrum, such as the x-ray test, they are difficult to implement on curtain wall systems and involve significant use of costly resources. Infrared thermography provides a solution for accurate, inexpensive, nondestructive, and nonlabor-intensive results. Remotely operated unmanned aerial vehicles (UAVs) were used in this study to provide an effective and rapid data collection method covering a wide area of curtain walls through the use of portable thermal sensors mounted in the UAV. Resembling existing roof inspection processes using IR cameras, this research approach aimed to develop a novel systematic data collection method that enables inspections to be easily conducted on roofs or tall constructions without an operator [10]. The collected data will be used for the analysis of heat losses, missing or damaged thermal insulation—thermal bridges in particular—as well as air leakage and moisture intrusions [11] along the building envelope. Inspections target specific areas of the building structures for repairs, thereby reducing labor costs while simultaneously saving on the existing heating and cooling costs.

2. Background and Methodology

2.1. Evolution of Curtain Wall Systems

The first appearance of a glass wall system was in the Crystal Palace project, built in Hyde Park, London, in 1851 [1]. It was built in a cast iron and plate glass systems. The glass wall is considered to have been the first step in the evolution of curtain wall systems, despite having an only vague similarity to glass as used nowadays as a component of building envelopes. By the end of the nineteenth century, the use of glass walls had spread into large department stores. For example, the Bon Marche in Paris was designed to display products using a glass wall system. Glass wall technology was developed in the interwar period in Europe. In Germany [1], there were notable contributions such as from the architect Walter Gropius with the design of the Staatliches Bauhaus building in 1919. Gropius promoted the fusion of efficient design and aesthetics. He devoted his knowledge to primarily design factories in Germany. Other important figures in modern architecture, such as [12], suggested the use of horizontal windows to take advantage of natural ventilation and light. Experiments showed that a horizontally windowed room had eight times more illumination than the same room lit by vertical windows with the same window area. In addition, he suggested a design for a free façade, projecting the floor beyond the supporting pillars, like a cantilever beam all around the building, so that the windows may extend at will. A window could then be as much as 10 meters long for a dwelling house of 200 meters.
An example in North America is the Polk’s Hallidie building in San Francisco [1]. Designed in 1917, it is a whole crystal façade building. It was credited as the first American building to feature glass curtain walls, though it was predated by Louis Curtiss’s Boley Clothing Company building in Kansas City, Missouri, completed in 1909.
The curtain walls relied on existing technologies like glass, metal, and others. In 1935, the Bohn Aluminum and Brass Corporation designed “integrally extruded hollow shapes” based on the available techniques to avoid the use of lock seams, dovetail pieces, or welded seams. Cold-formed steel sections welded together were already produced by Henry Hope in Britain. This technology was also used in some of the earliest glass curtain walls. The Peter Jones store in London used such a technique, fixing the steel frames within a concrete spandrel wall to provide a large glass surface. In this case, it is the most similar advancement to curtain walls because the window in the horizontal plane was set to a different depth level on the head and sill, with only the nonstructural mullions being continuous. Henry Hope’s suggested model was used in university laboratory buildings such as Drake University (1948) and Massachusetts Institute of Technology (1950), with a slight variation in construction using glazing with a continuous vertical plane and pressed steel mullions.
There are several types of frame and fastening for curtain wall systems [13]. Composed of steel, aluminum, multi-laminate glass, or other resilient materials, the frame is the support grid that holds the glass in place. The frame must be designed separately to determine the possible causes of failure [14] (for example, the required control of the water vapor passage to the cold side of the panels to provide an adequate weather seal between them). A description of two approaches using frame and fastening for curtain wall glazing follows.

2.1.1. Mechanically Fixed System

This is a mechanical fastening system for the insulating glass. The exterior mechanical restraint is thermally isolated from the interior frame. The quality of the system depends on the high skill level of the personnel involved in the assembling processes. A drawback is the exterior air infiltration due to gasket shrinkage when aging. The following are multiple arrangements of mechanically fixed systems.
  • Stick system is a structure of extruded horizontal and vertical metallic frame members (sticks) whose mullions are long elements generally made of aluminum or cold-rolled steel with coating paint. The materials are cut in the factory and assembled on site. Elastic gaskets are used under pressure plates. This system requires high level of quality control, given that the system is built on site and depends heavily on the equipment and personnel involved in its construction.
  • Unitized is the most commonly used type of curtain wall for high-quality finishing. Consisting of a cluster of preassembled glazing panels manufactured in controlled factory conditions, the metallic frame is directly attached to the different glass layers. The whole façade is sealed using elastic gaskets. It is more expensive than the stick system, but is faster and easier to install, with fewer onsite operations. It is a more cost-effective approach due to its better performance and reduced quality control requirements.
  • Panelized is similar to the unitized system but consists of prefabricated panels. The panels generally have a store span height and a bay span width. This approach seeks to avoid midspan supports to avoid the problems of deflection.
  • Spandrel panel ribbon glazing has long continuous glazed panels that are fixed between spandrel panels connected to the building’s floor slab. They are made of prefabricated metallic, composite panels, or precast concrete units. The glazed panels may be assembled on site with horizontal transoms fixed to spandrel panels. Vertical mullions may be arranged to simplify construction. The glazed parts may be from preassembled units that will be fixed on the bottom and top to the spandrel panels and on the sides to one another. The level of prefabrication and repetitive assembly contributes to achieving high performance and quality control demands.

2.1.2. Structural Glazing

This system provides the most luminous space due to a bigger glass area in the design—practically the entire façade—and a reduction in support systems. This is achieved by means of assembling the panels with special brackets. Generally, the panels are fixed to the substructure at the corners, with brackets providing support for the panels. The gaps between the panels are weather sealed using wet-applied sealants. There are two types of assemblies: bolted and patched (suspended). The differences between the two lie in the fixture of the panels and the attachment of the brackets.

2.2. Thermal Bridges in Curtain Wall Systems

There are different types of thermal bridges that can be detected, depending on the design and origin and on the thermal performance of the components or sections of the wall system. Common types of thermal bridges and conceptualizations include the following:
  • Linear thermal bridges are discontinuities in the thermal envelope that are found along an imaginary line across the building envelope. They are typically found on balcony connections with the floor slab through the wall, wall edges, floor supports, and windows. The energy losses in a linear thermal bridge are defined as the linear thermal transmittance, ψ [15].
  • Point thermal bridges are localized losses detected in a single spot. Examples include fastening elements such as dowels or curtain wall supports and anchors that penetrate the insulating layer. The energy losses in a point thermal bridge are defined as point thermal transmittance, χ.
  • Geometrical thermal bridges are found in a change of direction in the building envelope’s surfaces, like a corner, or where there is a local reduction of these surfaces. It can be a linear or punctual thermal bridge [16].
  • Structural thermal bridges are discontinuities in the insulation of the building envelope produced by elements used in the assembly or construction. Examples are discontinuities in corner junctions between different building components such as an I-beam that passes through an assembly.
  • Systematic thermal bridges are repeated energy losses throughout the length of the façade. This conceptualization is used to facilitate designs of building envelopes as a structure with one-dimensional heat flow, which simplifies the calculation of heat losses. For example, heat losses due to wall ties or joints in masonry.
  • Convective thermal bridges are energy losses due to air movements inside the construction—specifically, unintended air movements inside the structure. Possible causes are convections in gaps among components or within the insulation itself. Heat losses may increase due to the direct influence of the outside air through the insulation. Interior air may also filter into the structure, generating ventilation loss. The air stream will cause moisture accumulation in the outer part of the building envelope, resulting in a reduction in the insulation performance. Increasing conductivity or thermal transmittance in the design compensates for connective thermal bridges. They can also be reduced with proper plans and workmanship in the assembly process.
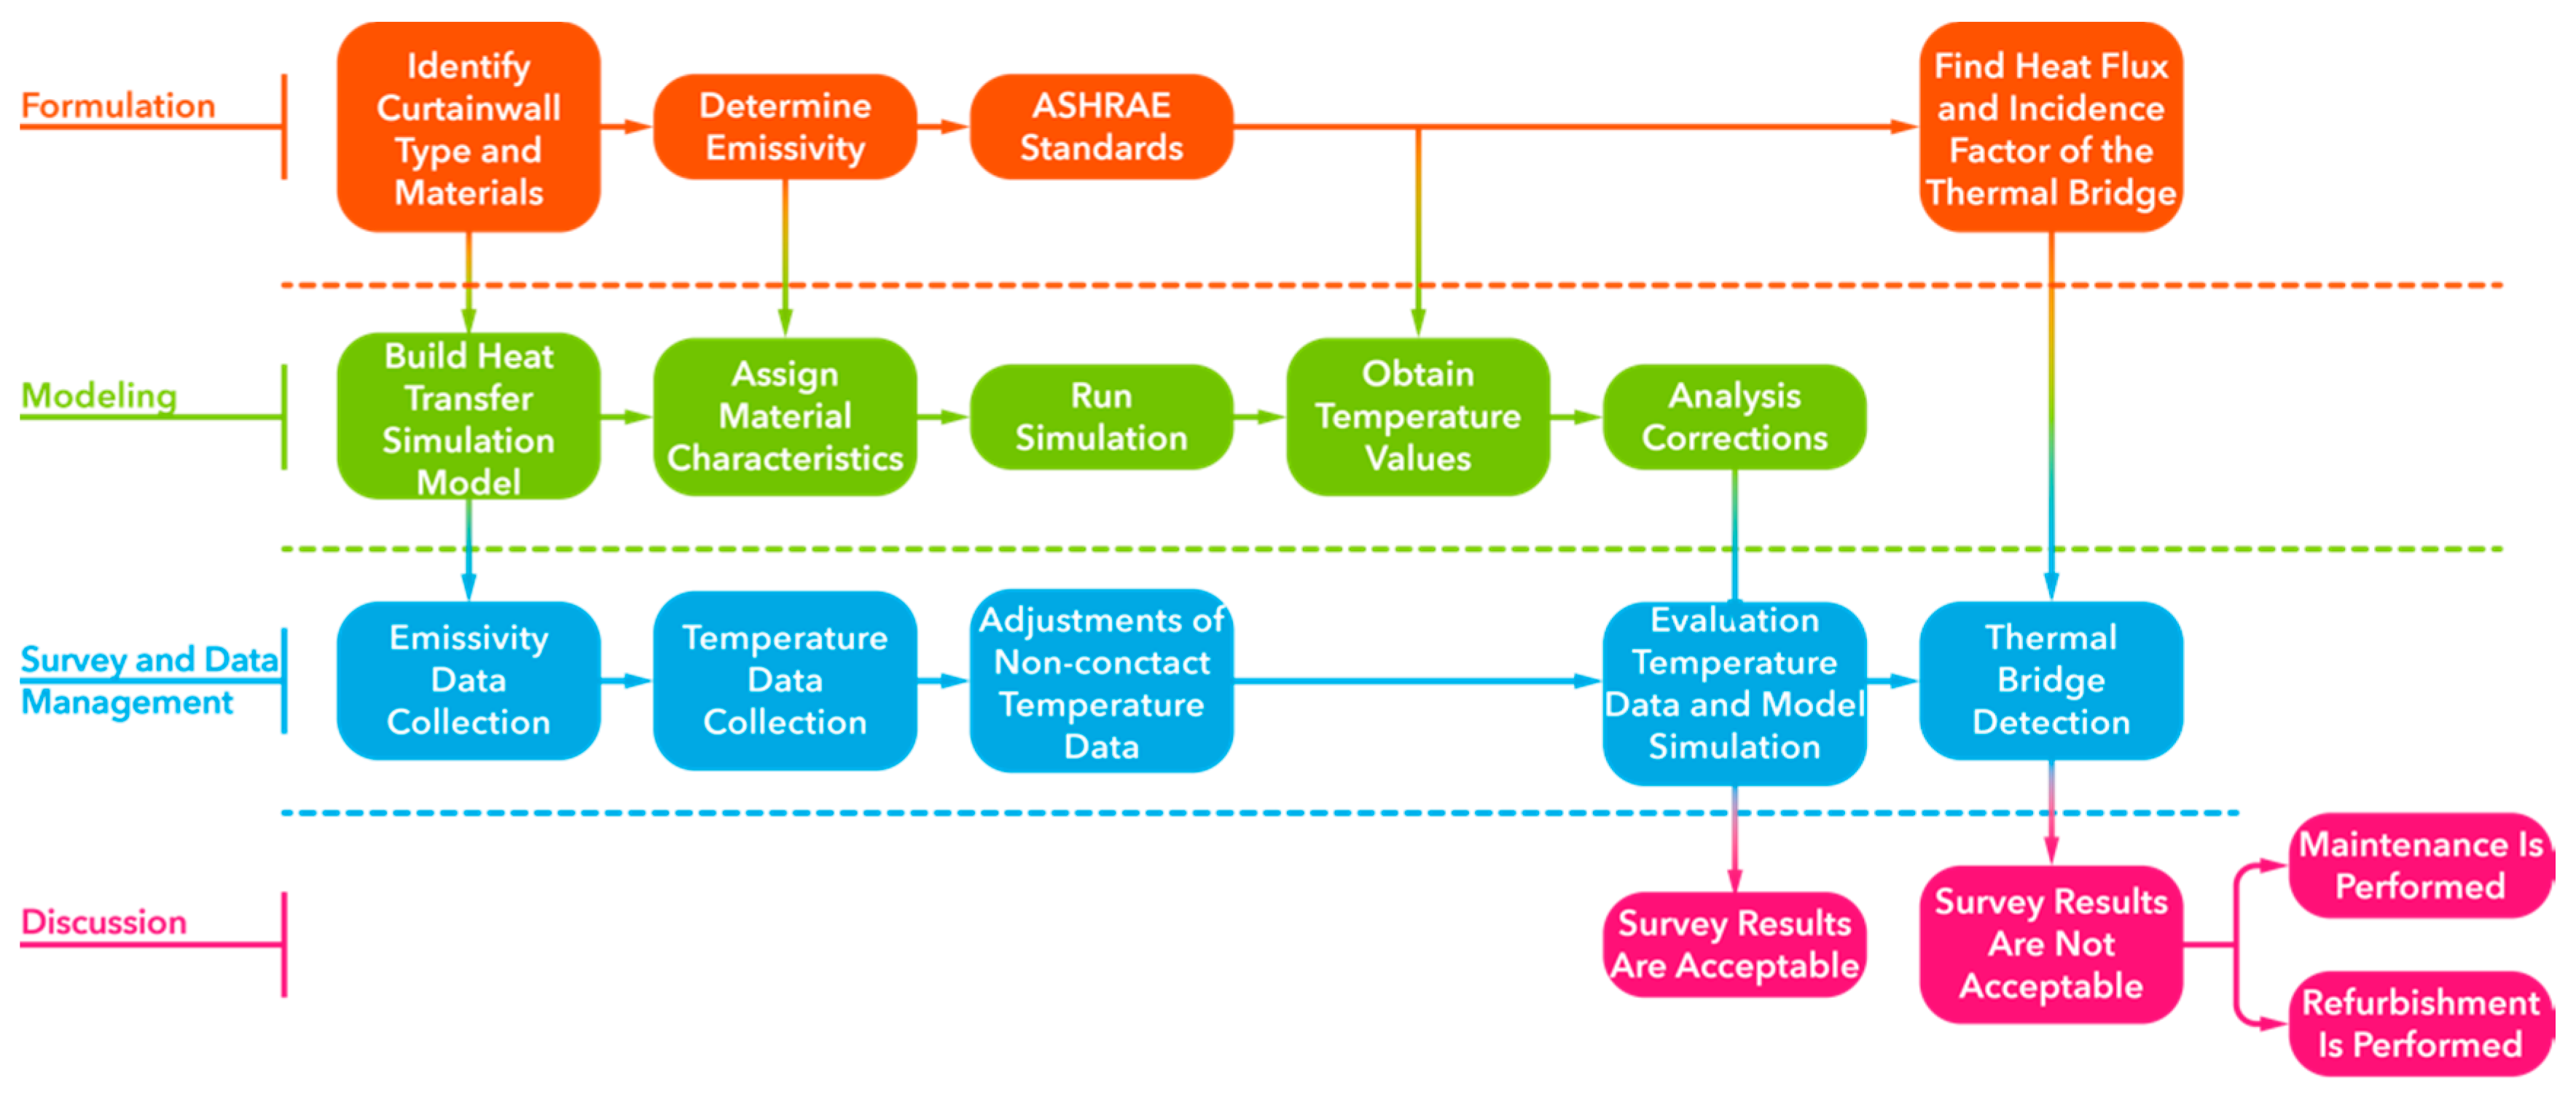
2.3. Methodology

Approaches to estimating thermal bridges have relied on building energy simulation programs, which use advanced algorithms to achieve accurate energy-efficient designs [17]. A significant amount of effort is required to run such simulations since data input demands aspects of indoor air quality and three-dimmentional (3D) conduction capabilities of design components. Other approaches include the thermally equivalent wall analysis [18]. They consist of working on an equivalent multilayer wall, to be compared to others with the same steady, dynamic thermal behavior to estimate the thermal properties (conductivity, design, specific heat) for similar layers [19]. Other approaches include finite element analysis using detailed computational models [20] (e.g., ANSYS Workbench). Although finite element analysis has high precision on thermoproperty estimates of all materials involved in the geometry [21], the complexity of developing and implementing the resulting models impact their practicality. For example, any small change in the parameters will lead to changes in the thermal bridge estimates as they follow a linear relation.
To evaluate the existence of thermal bridges, a nondestructive analysis using infrared radiation measurements (infrared thermography) was performed. Infrared thermography (IRT) is a method that detects emitted infrared energy from objects. The energy is then further measured and converted into temperature. IRT focuses on the effective detection and processing of infrared radiation to calculate thermal information from noncontact measurement devices [6]. To detect, measure, and visualize infrared radiation, the use of special sensors is required.
IRT was deployed as it offers accurate, inexpensive, nondestructive, and nonlabor-intensive results [22], covering a wide range of radiation and areas, depending on the sensors and lenses selected. Due to their portability, noncontact sensors were used, assembled into a camera for added mobility, and used to capture wide areas of façade systems. The camera was mounted onto a remotely operated UAV, as shown in Figure 1.
The mounted IR camera has been used for other types of quality control of building elements for maintenance, such as in roof inspections [11]. In the present research, a mounted IR camera on a UAV was used to detect heat losses to identify missing or damaged building façade components. The detection, diagnosis, and evaluation of heat losses were made on buildings’ thermal insulation, focusing on thermal bridges, air leakage, and moisture intrusions on the façade system.
The detection, collection, and processing of information for diagnosis and evaluation are inspection activities. Inspection of building envelopes are designed to review and control the status of the components of the façade system and, if necessary, identify repair requirements after the diagnosis and evaluation. Inspections would ultimately reduce costs through savings on heating and cooling through the identification of repair requirements in the system.
To systematically address heat losses, in this research, we designed a framework for the detection, diagnosis, and evaluation of thermal bridges. Detection refers to all aspects of thermal bridge identification of defects and an assessment of performance. Diagnosis and evaluation incorporate analysis of the failure based on the materials, impacted functionality, and effects on the structure. Environmental effects and possible latent defects or failures that cannot be discovered from observations are identified in the evaluation phase based on the collected information. The framework is divided into different phases, as shown in Figure 2. Each phase includes some of the steps of the overall process, designed to determine the existence of a thermal bridge and ultimately diagnose building envelope pathologies, including the impact of repairs or remedial actions. The analysis of each phase from the framework is as follows.

2.3.1. Formulation

The aim is to form an understanding of the overall thermal performance of the curtain wall system. Measurements of the thermal flux [23] are performed, including the overall heat-transfer coefficient (U in [W/m2 °C]). The coefficient, U, specifies the ability of a component to resist heat transfer. The transfer coefficient is a property inherent to the material or assembly [4]. For example, all the properties of the glazing materials and sealants are required in order to calculate the net radiation of the window. Knowing that heat transfer is the movement of energy due to a temperature difference, it is formulated as a function of the heat-transfer rate (Q in [W]), the area (A in [m2]), and the temperature difference (ΔT in [°C]) [8], as in Equation (1).
U = Q n e t A ( T o u t T i n )
Although there are more specific formulas for heat transfer including phenomena like convection, solar incidence, wind velocity and direction, time of the day, and orientation of the wall, the framework adopts U to define and analyze the response of the building envelope in a steady state over a longer period of time, rather than at a specific point in time. Under this assumption, the tests can be carried out during different conditions to compare the performance.
There are three physical mechanisms of heat transfer: conduction, convection, and radiation. Therefore, the focus is on a more detailed formulation for energy flux within the wall system, which incorporates crystal assemblies with more than one layer. Energy flux is the transfer of energy through a surface per unit area. The energy flux is defined in Equation(2), where the intensity on the kth surface is named Qkr [W in J/s]. In the expression, the superscript r stands for radiation, and the nth layers are boundaries identified as surfaces 2n and 2n-1 [24].
Q 2 n r = S 2 n r + R 2 n Q 2 n + 1 r + T n Q 2 n 2 r Q 2 n 1 r = S 2 n 1   r + R 2 n 1 Q 2 n 2 r + T n Q 2 n + 2 r
where Rk is the infrared reflectance of the layer measured from the kth surface, and Tn is the transmittance for the nth layer. In addition, transmittance multiplied by the flux gives the transmissivity. The same happens for the reflexivity. The emitted energy flux from the kth surface, Sk is defined in Equation (3),
S k = ε k σ θ n 4
where εk is the emissivity of the kth surface, and θn is the temperature of the layer n. The emissivity is the ratio of the radiation emitted compared to that emitted by a black body, which absorbs all radiation. Emissivity has a range of values between 0 and 1. The emissivity is a key value for infrared measurement since it is directly detected by the infra-red (IR) sensors. A correction must be included in the emissivity estimation to reduce the interference of other radiation such as conduction, convection, and solar radiation. Finally, given the desired inner temperature, energy flux can be obtained as a net flux by means of Equation(4) to isolate the necessary U-factor from the first formula,
Q n e t = Q 2 n r Q i n r + Q 2 n c Q i n c + T s o l
where Tsol is the solar transmittance, including wind effects, and I is the solar intensity, which depends on the season and the hour of the day.
The purpose of the framework formulation is to estimate the energy flux to quantitatively determine the possible presence of thermal bridges on certain areas of a curtain wall system. Having an indication of the distribution of energy flux on areas of the curtain wall system enables the characterization of the effect of thermal bridges. This indication is possible to obtain through the use of thermographs (thermal images). Thermographs yield information in every pixel about the radiation emitted from physical surfaces [25]. Using the proposed methodology, the thermal transmittance can be estimated with a confidence level of 95% from IR tests. The estimation is possible via a reverse analysis of the linear thermal bridge formulation [26], as shown in Equation (5),
Ψ = L 2 D J = 1 N j U j l j
where Ψ [W/(m °C)] is the linear thermal transmittance, L2D is the thermal coupling coefficient for a 2D space, Uj is the linear perpendicular thermal transmittance for the element separating the two environments, and lj [m] is the length of the element, which leads to the determination of a parameter that notices the presence of a thermal bridge using only the thermograph itself. The incidence factor of the thermal bridge Itb is then defined as the ratio between the actual and the theoretical heat flowing in [25],
I t b = Q t b Q 0 = h t b   A p p = 1 n ( T e x t T p ) h i   A ( T e x t T 1 D ) = p = 1 n ( T e x t T p ) N ( T e x t T 1 D ) = U t b U 1 D
where Qtb is the heat flux through a hypothetical thermal bridge, Q0 is the theoretical heat flow, htb is the laminar coefficient of the thermal bridge, and hi is the internal laminar coefficient. The temperatures Text and Tp represent the external air and the temperature of the thermograph pixel, respectively, and T1D is the unaltered temperature. Ap is the area of a pixel and A is N × Ap, the total number of pixels. When considering the limited domain of the image area, the laminar coefficient is constant, htb = hi, and the result in Equation(6) is the U thermal transmittance.
To set logical boundaries to the temperature’s formulation, American Society of Heating, Refrigerating and Air Conditioning Engineers (ASHRAE) standards were incorporated in the formulation of the framework, specifically the Energy Standard for Buildings manual guides. The ASHRAE/IESNA Standard 90.1-2007 [27] provides a range of temperatures according to the purpose of the building and the type of frame.
Indication of a thermal bridge can be made from an abnormal distribution of energy flux on the surfaces. Once detected, it is possible to analyze the effects on the building envelope by considering the effect of heat losses on a normal surface. To estimate the thermal bridge, a dimension factor needs to be considered. If it is a linear thermal bridge, then the thermal bridge is characterized by the linear thermal transmittance [21] defined in Equation(5). If there is a point thermal bridge, then the point thermal transmittance is defined in ISO 14683 [26] and in ISO 10211-1 [21], as in Equation(7),
χ = L 3 D i = 1 N i U i A i j = 1 N j ψ j l j
where χ [W/°C] is the point thermal transmittance, L3D is the thermal coupling coefficient for a 3D space, Uj is the linear perpendicular thermal transmittance for the element separating the two environments, Ai [m2] is the surface area of the element, and Ψ [W/(m °C)] is the linear thermal transmittance. In case there is a linear thermal bridge, lj [m] is the length of the element where a thermal bridge is detected.
The total heat flow with linear and point thermal bridges is calculated by adding the heat flow through the thermal bridges to those through the clear field of the surface area [28], as in Equation (8),
U e f f e c t i v e = U 0 + i = 1 N i Ψ i l i + j = 1 N j χ j l j A T o t a l
where U0 [W/m2 K] is the undisturbed surface area heat transmittance (including frequent and distributed bridging losses), A is the surface area, Ψ is the linear thermal bridge heat transmittance, L is the length of the linear thermal bridge, and χ is the point thermal bridge heat transmittance. All in all, it is a matter of adding the regular flux due to solar radiation or wind effect and others to the negative effect of the thermal bridges. Finally, the heat flow through a surface with existing thermal bridges [29] is estimated using Equation (9),
Q = [ U o A + i = 1 N i Ψ i l i + j = 1 N j χ j l j ] T
where Q is the heat flow, Uo is the overall clear U value, A is the surface area (Uo * A is the clear heat flow), ψ * L is the linear transmission heat flow, and χ * L is the point of transmittance heat flow where χ is the number of occurrences, and T is the differential between the surface temperatures.

2.3.2. Modeling

This phase of the framework enables the analysis to determine the U-factor, comparison of heat transmittance and the temperature data from baselines scenarios, and comparison of the values obtained in the measurements with other baselines as references. This phase incorporates ASHRAE standards to define the boundary conditions of temperatures and materials as well as geometric properties of the measured surfaces of curtain wall systems.

2.3.3. Survey and Data Management

This phase consists of collecting emissivity data. IR sensors are used to survey existing radiation on curtain wall surfaces during the experiments. Although there are multiple factors that influence emissivity data, such as incident solar radiation, transmittance, and air leakage rating, the approach focuses on detecting the abnormal distribution of the emissivity values. Emissivity refers to the physical property of how effectively the material transmits energy as thermal radiation. Thermal radiation is electromagnetic radiation that ranges from visible (light) to infrared radiation, which is not visible to human eyes. IR sensors detect such radiation to record the surveyed data. While thermal radiation can be present in the form of conduction or convection, the registered variation of the temperature on the surface offers an indication of the presence of a thermal bridge, represented by different emissivity values on the surface [30]. Multiple data collection tasks at different times of the day reduce the effect of these factors on emissivity.
Different types of materials in curtain wall systems may produce radiant barriers [31]. For example, elements like aluminum alloys could produce a low-emissivity response, which reduces the ability of emissivity recording from the infrared sensors. Therefore, special attention to such elements is required during survey activities. For most nonmetallic materials, the value is usually above 0.80. However, for metallic surfaces, especially when polished, the emissivity values drop down between 0.05 and 0.2. Therefore, the adoption of corrective measures is required to more-effectively determine the temperature of surveyed materials. The values of metals specified in emissivity tables must not be considered alone, since the surface conditions have higher impact and influence on emissivity measurements than the materials themselves [32].
Data collection. The approach incorporated the practices under ASTM E1933–14 [33] that specifies data collection for contact thermometer methods and the conditions to correct the emissivity. Although they are not specified for IR measurements under UAV flight conditions, the suggested adjustments were adapted.
The test was carried out using an IR camera, model Flir Vue Pro-R, mounted on the UAV. Its technical specifications include: 30 Hz (NTSC) frame rate; 9 mm (69° × 56°) optical lens; 640 × 12 pixels sensor resolutions; −20 °C to 50 °C operating temperature range; 7.5 μm to 15.5 μm spectral band; and 4 oz weight. The camera was carefully located to adequately align the device at the target element for emissivity recording. Corrections of emissivity were executed from surfaces such as polished metals. An example of such a correction is the function used to measure and compensate reflectance on polished metals, where a high reflected temperature is found.
A contact thermometer was used to measure and serve as baseline for emissivity values and temperature recording corrections. By focusing on the same location where contact measurements were taken, the emissivity control was adjusted until the IR camera indicated the same temperature as measured by the contact thermometer. The indicated emissivity value is the measured emissivity of the specimen at this temperature and spectral waveband. This procedure is repeated a minimum of three times, and the emissivity values are averaged to obtain an approximate actual emissivity.
There were other environmental factors during the data collection that may have generated error or noise in the measurement [11]. These factors include large particles present in the atmosphere from water vapor or gas molecules, as well as the ambient air temperature and the distance or angle of incidence from the sample. Those interferences may have altered the measurements. For this reason, and to reduce their effect on the registered emissivity, the ASTM E1933 recommendations to take measurements as close as possible to the surface was followed. Other practices that were considered were letting the IR camera warm to acclimatize to the current temperature environment. For example, the sample should be at a temperature that is at least 10 °C warmer or cooler than the ambient temperature, to minimize the error in the emissivity results. Wind is a disruptive environmental factor, which may have impacted the results. For winds exceeding 5 m/s, it is recommended to perform a correction. Wind effects may result in a temperature differential of as much as much 3 °C, depending on the humidity or atmospheric conditions [25]. To reduce the impact of environmental disturbances on temperature data collection, IR measurements should be performed at night or on a cloudy day, with low wind speeds, to minimize convective heat losses. Moisture may also induce measurement disturbances.
Measurements were also taken from different angles to avoid the reflection from other objects that may interfere [9]. When measuring, special attention was given to determining the reflected temperature. For materials with emissivity less than 0.5, radiometric temperature measurements and emissivity measurements have higher errors.

3. Case Example

The experiments took place in a two-story 70,000-square-foot educational building, with rectangular plans and top-level cantilevers over the lower floor. This 45-million-dollar facility is in Chicago, United States. The most important steps of the framework (see Figure 2) are further elaborated through this case example.

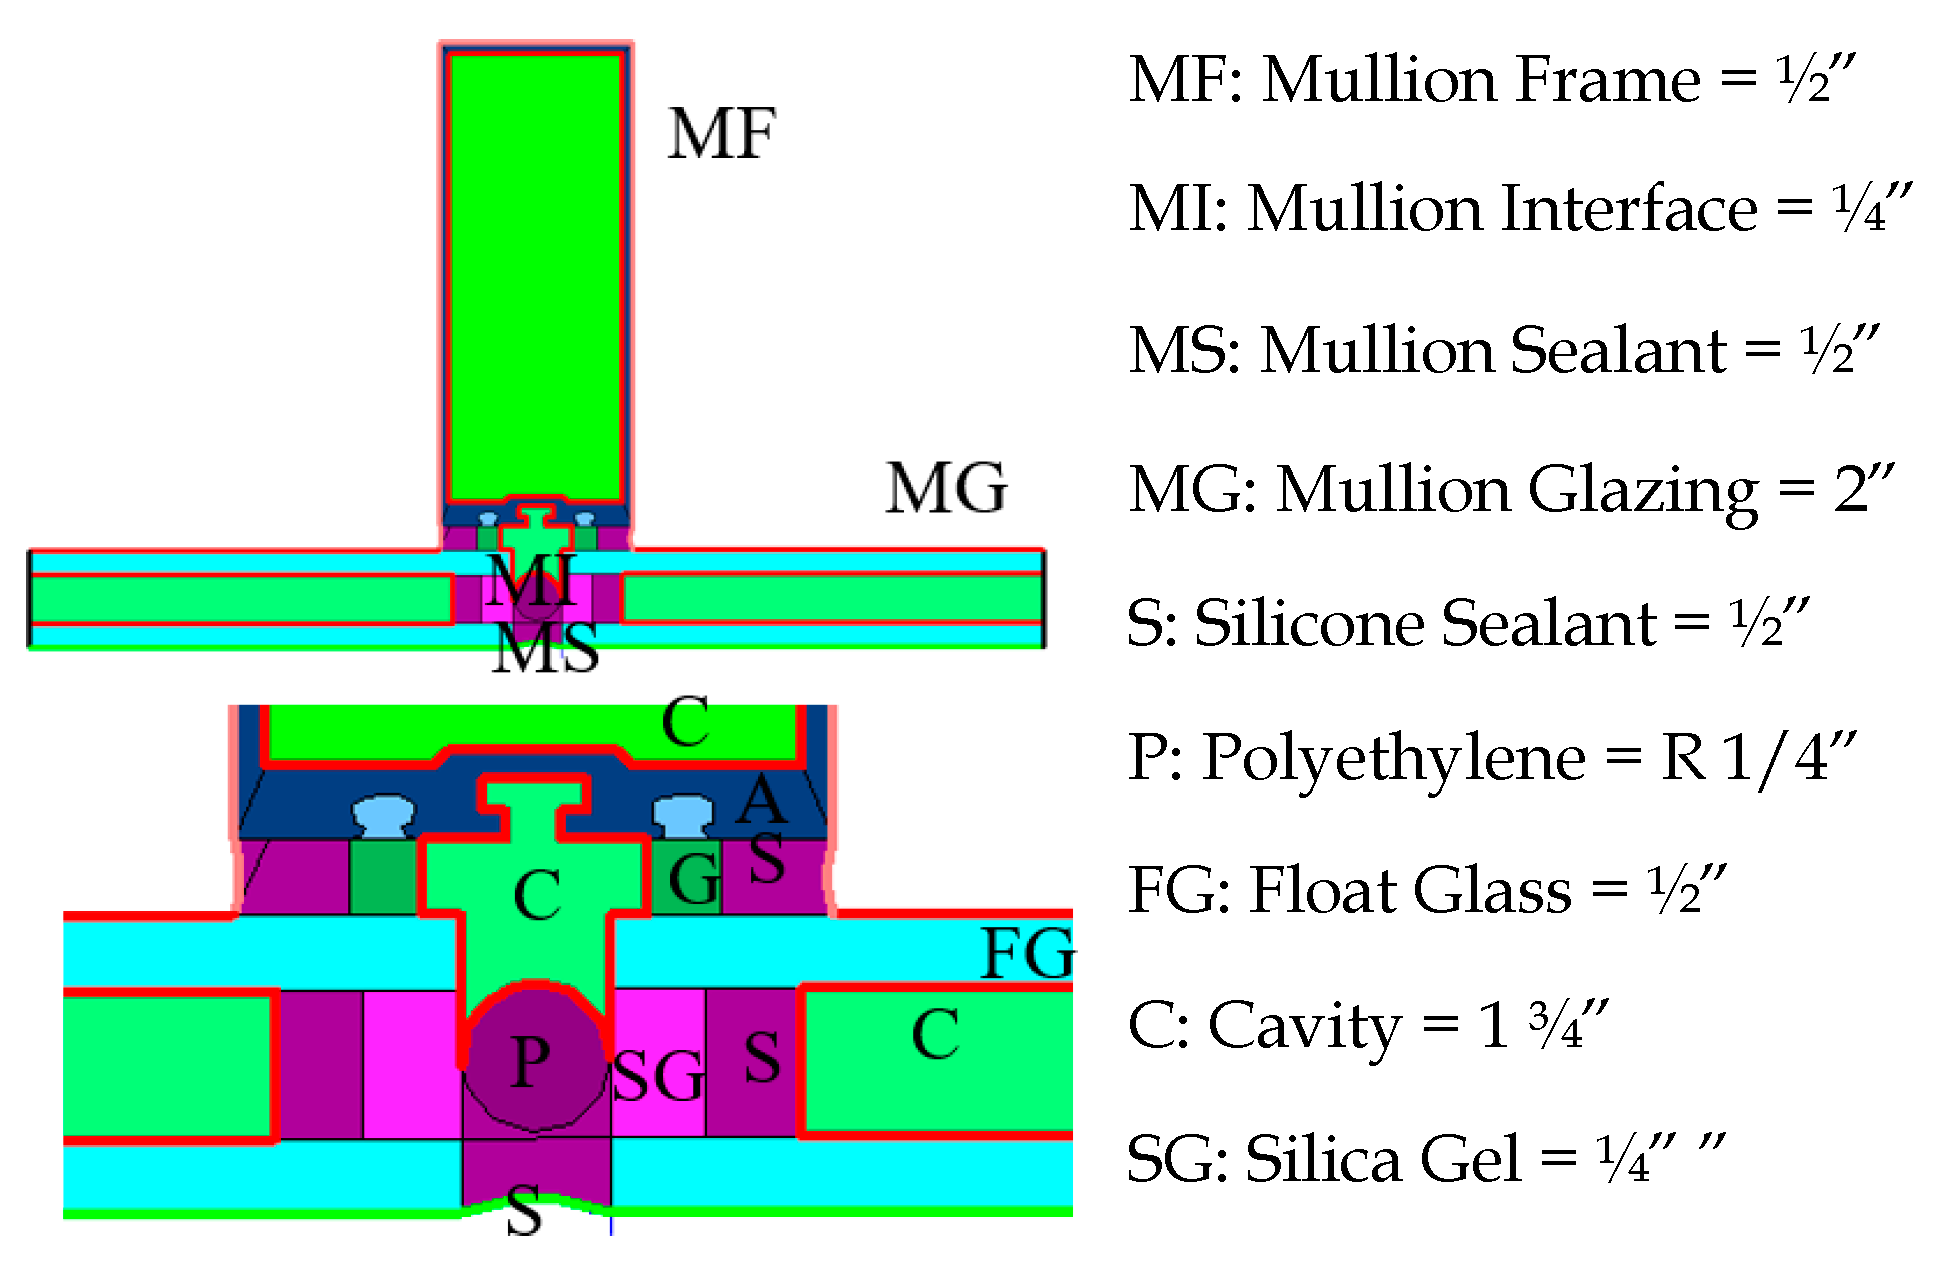
3.1. Identify the Type of Curtain Wall

The building was designed with two curtain wall systems: a glass-framed system and dynamic ETFE (ethylene tetrafluoroethylene). The conventional-glazed and metal-framed system was designed to bring natural light deep into the floor plate. The ETFE system is a façade’s fritted inner layer with back and forth movements through pneummatic mechanisms to modulate the amount of solar energy that enters the building, including foil cushions that mitigate solar heat gain, providing shade to its glazed wall system (see Figure 5b). The research team experimented and analyzed the glazed system for the detection, diagnosis, and evaluation of thermal bridges.

Conduction Heat-Transfer Simulation Model

To build and analyze the heat-transfer model, a computer simulation application (THERM) modeled the two-dimensional heat-transfer effects in windows. The application used two-dimensional conduction heat-transfer analysis, enabling the evaluation of the product’s energy efficiency and local temperature patterns. Inputs included the manufacturer’s specifications for glazed system products, which were provided by the representative of the owner, the boundary conditions of indoor and outdoor geometries, and the temperature and relative humidity. Outputs included the minimum and maximum temperatures and U-factors. An example of the materials for the heat-transfer model is shown in Figure 3. To frame the simulation on the desired components of curtain wall systems, a limited area of the glazed-framed façade was analyzed (the glazed window section). Given the symmetry of the frame, segments with an equivalent distance between mullions were studied with the intention of covering a broader area for thermal analysis. The segments were located on areas with reduced environmental disturbance conditions or on areas away from locations where the position or geometry of the frame led to the prevalence of high-temperature effects. For the exterior surface, for example, the origin was the interface, and the endpoint was the midpoint of the crystal, between mullions. Temperature and relative humidity for indoor and outdoor surfaces were 27.2 °C and 65% and 26.0 °C and 72%, respectively. Wind conditions were calm (<1 m/s). These parameters were included as boundary conditions in the model. They were simultaneously collected for consistency when the IR experiments using the UAV were carried out.
The simulation determined a range of temperature values. Figure 4 shows an example of the temperature distribution output, representing the area covered from the middle point of a mullion to the next mullion. Thermal distribution served as a baseline to compare recorded temperatures with the IR sensors, and as factor for heat transfer analysis of the thermal properties of the materials within the geometry.

3.2. Emissivity Data Collection

Data was collected using an IR camera designed to operate on a UAV, as shown in Figure 5. This sensing device captured accurate, noncontact temperature measurements with calibrated temperature data that was embedded within every pixel from the image frame. Noncontact measurements from a UAV enables an aerial view of the façade and collection of data from the external position off the building envelope at any height from ground level. Thermal image data and UAV data sampling are shown in Figure 6. Data were postprocessed, tagged, and organized for systematic retrieval.

3.2.1. Adjustments for Non-Contact Temperature Data
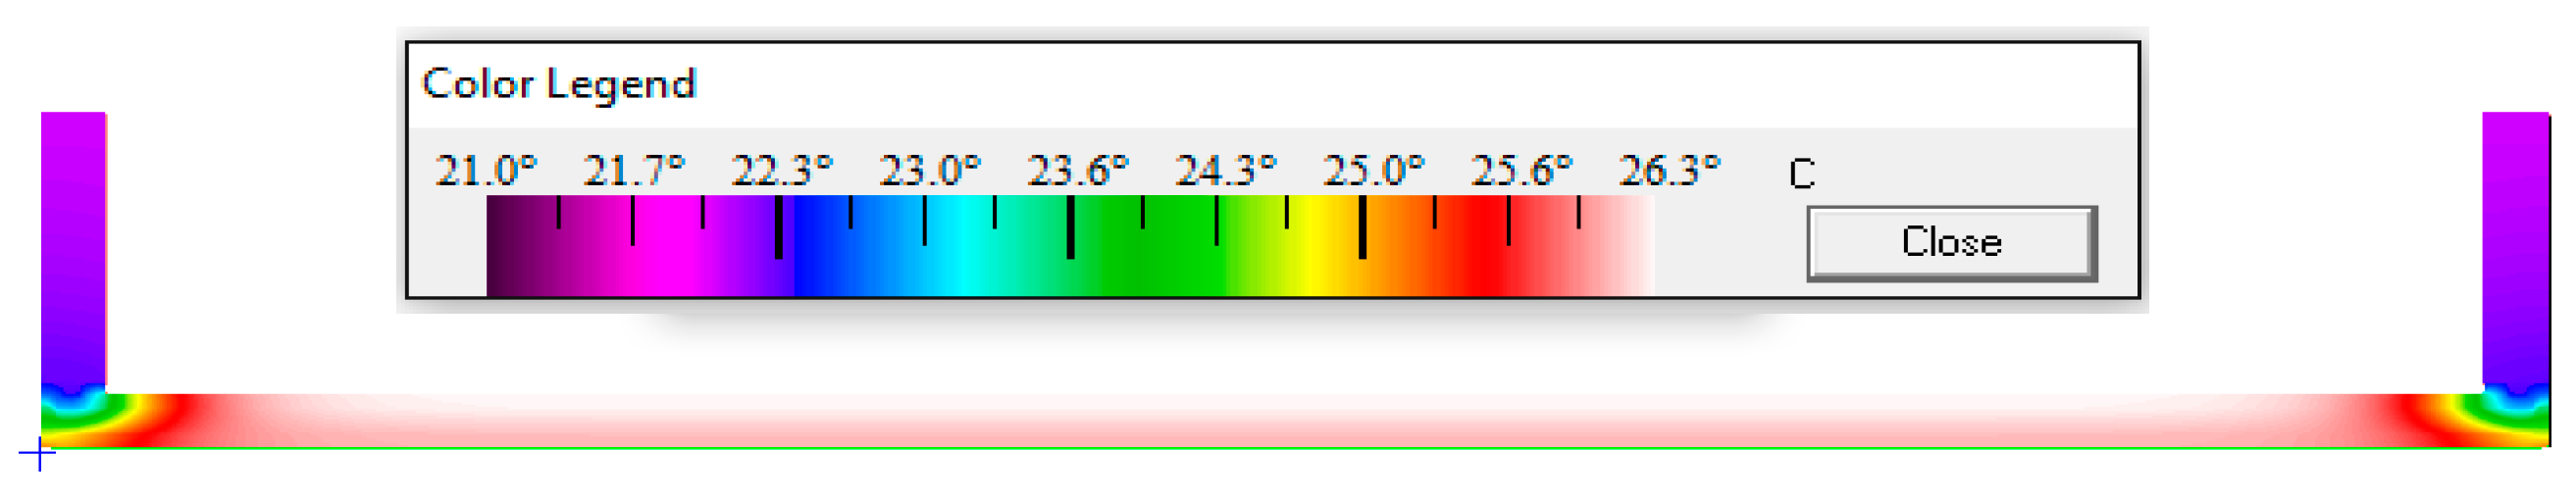
The interior and exterior surface temperatures were collected on the curtain wall on easy-to-access locations to determine the need for adjustments. Data were collected along multiple points within the geometry of the area on a selected location of the glaze-framed window. A four-channel data-logging thermometer with a type K surface thermometer probe [33] was used for temperature data collection. Data from the exterior surface were further analyzed to identify differences from the thermal image data. The observed differences informed whether adjustments for the emissivity of the glass material were required. For example, if data from the thermal sensing device have fluctuations along the geometry of the glazing area, then variations due to factors such as environmental conditions need to be considered. The assumption is that the adjustment for emissivity will pervade along the curtain wall structure, given the perfect symmetry of the window assembly and the type of glass and materials used. Slight variations may still occur due to the IR sensing camera angle inclination or slight angle variations encountered during the UAV flights.

3.2.2. Analysis

The variation of temperature along the length of the window in a graph enables the identification of energy flux through the sealant via the interface. Figure 7 shows the differences in temperature data and the results from the simulation. The data demonstrate the close similarities along the curve, meaning that the simulation does not have significant discrepancies with the IR imagery data. It can be inferred that the thermal performance was as designed—or that the thermal performance data fall within the expected range of temperature values.
A close observation of the curves suggests a high-temperature differential in the interface. The differentials in the interface indicate the existence of critical points on the geometry of the window. These differenctials must be analyzed by estimating incidence factors (Itb), which may inform the potential existence of thermal bridges. From Equation(6), the incidence factor (the ratio between the actual heat flowing in and the theoretical heat flowing) was 1.261 for the glazed-framed window studied. This value does not fall into a thermal bridge range. The glazed window from which data were collected was recently assembled. Therefore, the age of the curtain wall may have contributed to the low or nonexistent degradation of materials within areas such as the interface and sealants. Low incidence factors may be an indication of a proper assembly process for thermal insulation reduction. Low influence on distortion of the emissivity of the material from the mullion frame and sealant was observed, since the diffrence between the temperature data from the experimental probes and IR camera were significalntly low. Thermal conductivity was lower on the glazing portion of the mullion.

4. Discussion

A framework for the detection, diagnosis, and evaluation of thermal bridges in curtain wall systems was introduced to facilitate rapid identification, estimation, and analysis by practitioners and researchers. A case example was presented along with a methodology for estimating the factors of emissivity of materials using noncontact IR-sensing cameras mounted on a UAV. The framework provides guidance on the factors that influence emissivity and energy transmission between the window layers of a building envelope. The case example demonstrates that there is a minimum (<3%) difference among IR thermographic data, data from thermometer probes, and output data form simulation models for exterior temperature. The difference also falls within the 5% uncertainty range provided by the IR-sensing device manufacturer. This finding is useful for designing methods for rapid estimations of temperatures within an uncertainty range for materials with nonhomogenous properties that have significant differences in apparent temperature measurements.
An evaluation of window areas informed the general performance of the building envelop, including its actual state of deterioration, obsolescence, energy consumption, and functionality. Based on this foundation, the framework facilitates the definition of actions for retrofitting to make the best use of the existing structure, and to determine possible scenarios such as (1) the current state of the building or curtain wall is acceptable; (2) the current state is not acceptable, and maintenance is required; (3) the current state is not acceptable; and (4) refurbishment is required. In the presented case example, incidence factors were estimated to draw conclusions on energy transmittance based on thresholds for tolerable temperatures in interior and exterior spaces. From the incidence factor result, the current state of the analyzed portion of the glaze-frame system was found to be acceptable. Temperature data analysis also showed critical areas for evaluation along the interface between the crystal panel and the mullion. The temperature data did not show high-temperature differences within geometries that indicate thermal conductivity changes (thermal bridges) in the building enclosure.
The framework contributes to the design of plans for building a strategy for diagnosing curtain wall systems with higher durability and structural stability. It enhances our understanding of the requirements for building methods for rapid implementations of nondestructive tests using thermographic images. These new methods should address the reduction inspection efforts for the interpretation of thermal pathologies. The approach benefits the methods for energy retrofit interventions in facades for existing buildings. The framework also contributes to the reduction in energy demands and the environmental impact associated with manufacturing and maintenance of building envelopes, including associated life-cycle costs.

Author Contributions

Conceptualization, I.M.; methodology, A.F. and I.M.; investigation: A.F.; formal analysis, A.F.; writing-original draft prepapration, A.F. and I.M.; review and editing, I.M.

Funding

This research received no external funding.

Acknowledgments

In this section, you can acknowledge any support given which is not covered by the author contribution or funding sections. This may include administrative and technical support, or donations in kind (e.g., materials used for experiments).

Conflicts of Interest

The authors declare no conflict of interest.

References

  1. Yeomans, D. The Origins of the Modern Curtain Wall. APT Bull. J. Preserv. Technol. 2001, 32, 13–18. [Google Scholar] [CrossRef]
  2. Murray, S. The Curtain Wall in Architectural Education: Technology, History and Design; Association of Collegiate Schools of Architecture (ACSA): Portland, OR, USA, 2009. [Google Scholar]
  3. Totten, P.E.; O’Brien, S.M.; Pazera, M. The Effects of Thermal Bridging at Interface Conditions; National Institute of Building Sciences (NIBS): Minneapolis, MN, USA, 2019. [Google Scholar]
  4. Song, J.-H.; Lim, J.-H.; Kim, Y.-I.; Song, S.-Y. Thermal insulation performance of metal-exterior curtain wall panel systems with thermal bridges in winter. Procedia Eng. 2016, 146, 8–16. [Google Scholar] [CrossRef]
  5. McCowan, D.B.; Kivela, J.B. Lessons Learned From Curtain Wall Failure Investigations. In Proceedings of the RCI 2010 Building Envelope Technology Symposium, San Antonio, TX, USA, 8–9 November 2010. [Google Scholar]
  6. Maldague, X. Theory and Practice of Infrared Technology for Nondestructive Testing; Wiley: New York, NY, USA, 2001. [Google Scholar]
  7. Modest, M.F. Radiative Heat Transfer. 2003. Available online: http://site.ebrary.com/id/10188172 (accessed on 1 June 2018). (In English).
  8. Beard, J. Introduction to Infrared Thermography. Lecture presented at IT 570, The University of Tennessee, Knoxville. Available online: https://web.utk.edu/~jbeard8/IT570/Introduction to Infrared Thermography.pdf (accessed on 15 June 2019). (In English).
  9. Stockton, G.R.; Allen, L.R. Using Infrared Thermography to Determine the Presence and Correct Placement of Grouted Cells in Single-Width Concrete Masonry Unit (CMU) Walls; International Society for Optics and Photonics: Washington, DC, USA, 1999. [Google Scholar]
  10. Krawczyk, J.; Mazur, A.; Sasin, T.; Stokłosa, A. Infrared building inspection with unmanned aerial vehicles. Trans. Inst. Aviat. 2015, 32–48. [Google Scholar] [CrossRef]
  11. Balaras, C.; Argiriou, A. Infrared thermography for building diagnostics. Energy Build. 2002, 34, 171–183. [Google Scholar] [CrossRef]
  12. Conrads, U. Programs and Manifestoes on 20th-century Architecture, 1st English language ed; MIT Press: Cambridge, MA, USA; 192p.
  13. Carbary, L.D.; Albert, F. A Thermal Modeling Comparison of Typical Curtainwall Glazing Systems. In Proceedings of the Glass Processing Days 2007, Tampere, Finland, 15–18 June 2007. [Google Scholar]
  14. Patterson, M.R. Structural Glass Facades; University of Southern California: Los Angeles, CA, USA, 2008. [Google Scholar]
  15. Janssens, A.; Van Londersele, E.; Vandermarcke, B.; Roels, S.; Standaert, P.; Wouters, P. Development of limits for the linear thermal transmittance of thermal bridges in buildings. In Proceedings of the 10th Thermal Performance of the Exterior Envelopes of Whole Buildings Conference: 30 Years of Reearch, Atlanta, GA, USA, 2–7 December 2007; American Society of Heating, Refrigerating and Air-Conditioning Engineers: Atlanta, GA, USA, 2007. [Google Scholar]
  16. OPET. Thermal Bridges in Residential Buildings; Organization for the Promotion of Energy Technologies: Brno, Czech Republic, 2002. [Google Scholar]
  17. Theodosiou, T.; Tsikaloudaki, K.; Tsoka, S.; Chastas, P. Thermal bridging problems on advanced cladding systems and smart building facades. J. Clean. Prod. 2019, 214, 62–69. [Google Scholar] [CrossRef]
  18. Martin, K.; Escudero, C.; Erkoreka, A.; Flores, I.; Sala, J.M. Equivalent wall method for dynamic characterisation of thermal bridges. Energy Build. 2012, 55, 704–714. [Google Scholar] [CrossRef]
  19. Kossecka, E.; Kosny, J. Equivalent Wall as a Dynamic Model of a Complex Thermal Structure. J. Therm. Insul. Build. Envel. 1997, 20, 249–268. [Google Scholar] [CrossRef]
  20. Theodosiou, T.; Tsikaloudaki, K.; Bikas, D. Analysis of the Thermal Bridging Effect on Ventilated Facades. Procedia Environ. Sci. 2017, 38, 397–404. [Google Scholar] [CrossRef]
  21. ISO 10211:2017, Thermal Bridges in Building Construction—Heat Flows and Surface Temperatures—Detailed Calculations; International Organization for Standardization: Geneva, Switzerland, 2017.
  22. Baldinelli, G.; Bianchi, F.; Rotili, A.; Costarelli, D.; Seracini, M.; Vinti, G.; Asdrubali, F.; Evangelisti, L. A model for the improvement of thermal bridges quantitative assessment by infrared thermography. Appl. Energy 2018, 211, 854–864. [Google Scholar] [CrossRef]
  23. Incropera, F.P.; DeWitt, D.P. Fundamentals of Heat Transfer; Wiley: New York, NY, USA, 1981. (In English) [Google Scholar]
  24. De La Perrelle, E.T.; Moss, T.S.; Herbert, H. The Measurements of Absorptivity and Reflectivity. Infrared Phys. 1963, 3, 35–43. [Google Scholar] [CrossRef]
  25. Asdrubali, F.; Baldinelli, G.; Bianchi, F. A quantitative methodology to evaluate thermal bridges in buildings. Appl. Energy 2012, 97, 365–373. [Google Scholar] [CrossRef]
  26. ISO 14683:2017, Thermal Bridges in Building Construction—Linear Thermal Transmittance—Simplified Methods and Default Values; International Organization for Standardization: Geneva, Switzerland, 2017.
  27. 90.1 User’s Manual: ANSI/ASHRAE/IESNA Standard 90.1-2007; American Society of Heating, Air-Conditioning Engineers (ASHRAE): Atlanta, GA, USA, 2008; ISBN 9781933742410.
  28. 2013 ASHRAE Handbook: Fundamentals; ASHRAE: Atlanta, GA, USA, 2013; Available online: http://app.knovel.com/hotlink/toc/id:kpASHRAEC1/2013-ashrae-handbook (accessed on 1 June 2018).
  29. Roppel, P.; Lawton, M.; Norris, N. Thermal performance of building envelope details for mid- and high-rise buildings. ASHRAE Trans. 2012, 118, 569–584. [Google Scholar]
  30. NFRC. Independent Energy Ratings. Available online: https://www.nfrc.org/energy-performance-label/ (accessed on 15 June 2018).
  31. Department of Energy. Radiant Barriers. Available online: https://www.energy.gov/energysaver/weatherize/insulation/radiant-barriers (accessed on 1 July 2018).
  32. Gruner, K.-D. Principles of Non-Contact Temperature Measurement. Available online: support.fluke.com/raytek-sales/Download/Asset/IR_THEORY_55514_ENG_REVB_LR.PDF (accessed on 1 July 2018).
  33. ASTM E1933-14 (2018), Standard Practice for Measuring and Compensating for Emissivity Using Infrared Imaging Radiometers; American Society for Testing and Materials: West Conshohocken, PA, USA, 2018; Available online: https://www.astm.org/Standards/E1933.htm (accessed on 15 June 2018).
Figure 1. Data collection using IRT with UAV. (a) Operations with UAV and noncontact IR camera; and (b) UAV (DJI Matrice 100) with IR camera (Flir Vue Pro-R 640 9 mm).
Buildings 09 00179 g001
Figure 2. Framework for the detection, diagnosis, and evaluation of thermal bridges.
Buildings 09 00179 g002
Figure 3. Parts of the mullion and the shadow box of the curtain wall.
Buildings 09 00179 g003
Figure 4. Temperature distribution along the façade surface of the mullion and the shadow box of the curtain wall.
Buildings 09 00179 g004
Figure 5. Instruments used for emissivity data collection and building façade project. (a) IR sensor: Flir Vue Pro-R 640 9 mm camera; and (b) façade for experimentation.
Buildings 09 00179 g005
Figure 6. Collecting noncontact temperature from the building envelope using UAV. (a) Frame of thermal image; and (b) data collection using UAV.
Buildings 09 00179 g006
Figure 7. Comparison of thermocouple, IR and THERM software temperature distributions.
Buildings 09 00179 g007

