Article

An Analysis of Eco-Technology Allowing Water and Energy Saving in an Environmentally Friendly House—A Case Study from Poland

1
Department of Infrastructure and Water Management, Rzeszow University of Technology, 35-959 Rzeszów, Poland
2
Department of Thermodynamics, Rzeszow University of Technology, 35-959 Rzeszów, Poland
*
Author to whom correspondence should be addressed.
Buildings 2019, 9(8), 180; https://doi.org/10.3390/buildings9080180
Submission received: 29 June 2019 / Revised: 27 July 2019 / Accepted: 1 August 2019 / Published: 6 August 2019

Abstract

:
The Life Cycle Cost (LCC) analysis on selected alternative systems was carried out to reduce the demand for potable water and energy in a detached house designed in accordance with the concept of environmentally friendly house. The tests included a rainwater harvesting system, graywater recycling system, solar panels, photovoltaic panels, air heat pumps, ground heat pumps, wind turbines, drain water heat recovery units, and biomass boilers. The analysis was made for many investment variants where different combinations of the mentioned solutions were applied. In addition to the LCC analysis, some tests were also carried out to determine an impact of the investment options on the environment. This was done by calculating CO2, SO2, NOx, CO and dust emissions. The research was carried out for a different number of occupants and variable levels of water consumption, which allowed determining the impact of these parameters on the results obtained. They showed that for any of the computational cases the traditional option of the installation was not the most advantageous solution in financial and environmental terms, and the systems in question could be an alternative to this option. Thanks to their implementation, the consumption of fossil energy resources and natural water resources will be reduced, and the emission of pollutants will be limited, which will contribute to an improvement of the natural environment.

1. Introduction

Currently the world is facing serious environmental problems related to climate changes, population growth, urbanization, depletion of the ozone layer and global warming. In addition, constantly growing demand for various types of raw materials causes over-exploitation of natural resources. There is more and more evidence that climate change is intensified by human activities including the use of fossil fuels, which continue to be heavily used for energy production worldwide [1,2]. The sector is considered to be one of the largest sources of greenhouse gas emissions [3,4]. In recent years high emissions of carbon dioxide have caused a significant increase in global temperature to the extent that our climate is changing drastically. Actions taken by many countries, resulting from conventions and international commitments, aim to limit global warming [5]. These activities are based on a strategy for an implementation of distributed decentralized energy systems that connect local renewable and recoverable energy resources [6,7]. Such solutions guarantee not only flexibility and security of energy supply, but are beneficial in financial and environmental terms.
The development of various branches of economy and an increase in the number of people in the world not only adversely affect fossil fuel resources, but also water resources. Satisfying the needs of an ever-growing population results in an increased pressure on these resources [8] and leads to water deficits in many regions. Taking into consideration a current annual population growth of 1.1% resulting in an increase of around 83 million people per year, the human population is expected to reach 9.8 billion in 2050 [9]. According to forecasts this will cause the global demand for water to increase by 55% by over the same period [10].
The influence of urbanization [11] also affects the quality and quantity of water resources. Currently, almost 54% of the world′s population lives in urban areas, and it is predicted that this percentage will increase to 66% in 2050 [12]. The progressing urbanization creates new challenges in the scope of ensuring the broadly understood safety of occupants and an appropriate standard of their lives. An increase in population migration to cities necessitates their expansion causing, among others, disorders in the natural hydrological cycle [13]. Human interference in the natural water balance carries many adverse effects, both for the natural environment and the functioning of the technical infrastructure of cities [14,15,16]. Among them the most important are: an excessive desiccation of land, lowering of groundwater level [17], qualitative and quantitative changes in rainwater receivers [18], an intensification of flood events, and hydraulic overloading of sewerage systems and sewage treatment plants [19,20].
It is well known that urbanization and changes in land development even on a local or regional scale result in global climate change [21]. Therefore, a contemporary approach to city planning and management should be based on the idea of sustainable development whose purpose is to maintain proper equations between economic development, quality of life and care for the natural environment [22]. The cities of the future need to be more dynamic, balanced, smarter, and healthier so that further civilization development can be possible [23,24]. Taking this into account, it is necessary to introduce pro-ecological technologies whose task is to reduce the amount of water and energy consumed in all sectors of the economy, including the construction sector [25].
Housing construction in most developed countries occupies a leading position in equation to energy consumption [26,27]. For instance, households in the European Union are the third largest (25.9%) sector for energy consumption, after transport (33.2%) and industry (25.9%) [28]. However, in some EU countries, including Poland, this hierarchy is reversed and households are characterized by the largest share of energy demand. In Poland this share is 19%, with 16% and 15% in the transport and industrial sectors, respectively [28].
In response to such significant and largely irreversible changes that occur in the environment and take place as a result of urbanization and industrialization, there is a “green revolution” in the construction sector [29]. This revolution aims at fundamentally changing the construction environment by creating energy-conscious, healthy, and productive buildings that will have a negligible negative impact on urban life and the natural environment [30,31]. In recent years there have been many definitions and concepts of buildings that fall under the banner of the “green revolution”. The most important of them are: the green building [32], sustainable building [33], eco-building [34], and the environmentally friendly building [35]. Regardless of the names, the main purpose of using such structures is the same—the reduction of the negative impact of buildings on the environment and an increase of comfort and quality of life [36]. This applies to both materials used to make a building and installations a building will be equipped with [37]. An interesting approach to provide sustainable buildings through using low-energetic household appliances was also shown in reference [38].
In buildings, the use of fossil fuels is limited by the use of solar energy solutions [39], air [40], land [41], wind [42], and biomass [43]. In recent years there has been an increase in interest in the use of waste energy in buildings, including graywater [44,45,46]. The raising society awareness is crucial to better identify some opportunities for utilizing wastewater for energy purposes [47].
When striving to design buildings that are environmentally friendly, one pays attention not only to the reduction of energy demand [48], but also to water demand. This can be achieved by the use of water-efficient appliances [49], rainwater harvesting [50,51,52,53,54] and graywater recycling [55]. An application of these systems in various types of buildings and an assessment of their financial effectiveness were widely discussed in the world, including [56,57,58]. Also, the graywater reuse gives an opportunity to save tap water, which was shown by researchers in many publications [59,60].
An application of these alternative systems to reduce the demand for water and energy used for residential buildings in Poland often meets with the lack of acceptance of investors and users. It means that the systems are rarely used. This is due to the generally prevailing conviction about the unprofitability of using unconventional technologies and the lack of public awareness of the beneficial effects of these solutions on the natural environment. This is also due to the lack of information campaigns promoting such systems and the lack of guidelines regarding their implementation and analyzes supporting investment decisions.
The research conducted in this article is justified by the data on the use of renewable energy sources in Poland, where gross inland consumption, depending on the type of fuel, is 49.24% provided by solid fuels, mainly hard coal, and only 8.59% provided by renewables [28]. When analyzing the detailed share of individual renewable sources, biomass and renewable wastes occupy the leading position (7.71%), and the share of wind and solar energy is 0.66% and 0.02%, respectively [28]. Without appropriate measures, it will be difficult to reach the level of a 15% emissions reduction by 2020, which was established by the European Commission for Renewable Energy Targets (RET). However, in regards to alternative sources of water, there are no detailed data on the use of rainwater and graywater in installations in buildings in Poland. On the basis of the information provided by contractors and manufacturers of these systems, it can be concluded that rainwater harvesting systems and graywater recycling systems are very rarely used. The lack of appropriate actions in this area is incomprehensible as Poland′s water resources are rated as one of the lowest in Europe and in dry years they reach the value of 1100 m3/person/year [61].
Taking the above into account, an analysis of the profitability of unconventional technologies implemented in a single-family house located in Poland was carried out. It was assumed that this building, by using its appropriate construction and unconventional installations, would be an environmentally friendly house. The analysis included solutions such as: solar panels, photovoltaic panels, air heat pumps, ground heat pumps, wind turbines, drain water heat recovery units, biomass boilers, rainwater harvesting, and graywater recycling systems. The financial analysis was made for many investment variants where different combinations of the solutions mentioned were applied. An important stage of the research was to determine an impact of the analyzed investment options on the natural environment. This was done by calculating the emission of air pollutants: CO2, SO2, NOx, CO and dust. This approach, taking into account financial and environmental analysis for so many configurations of alternative solutions, is rare and is new not only in Poland but also in the world. So far, many researchers have conducted studies for single-family houses, but they have only dealt with an analysis of the profitability of using individual systems to reduce water demand [59,62] or energy [63,64].

2. Materials and Methods
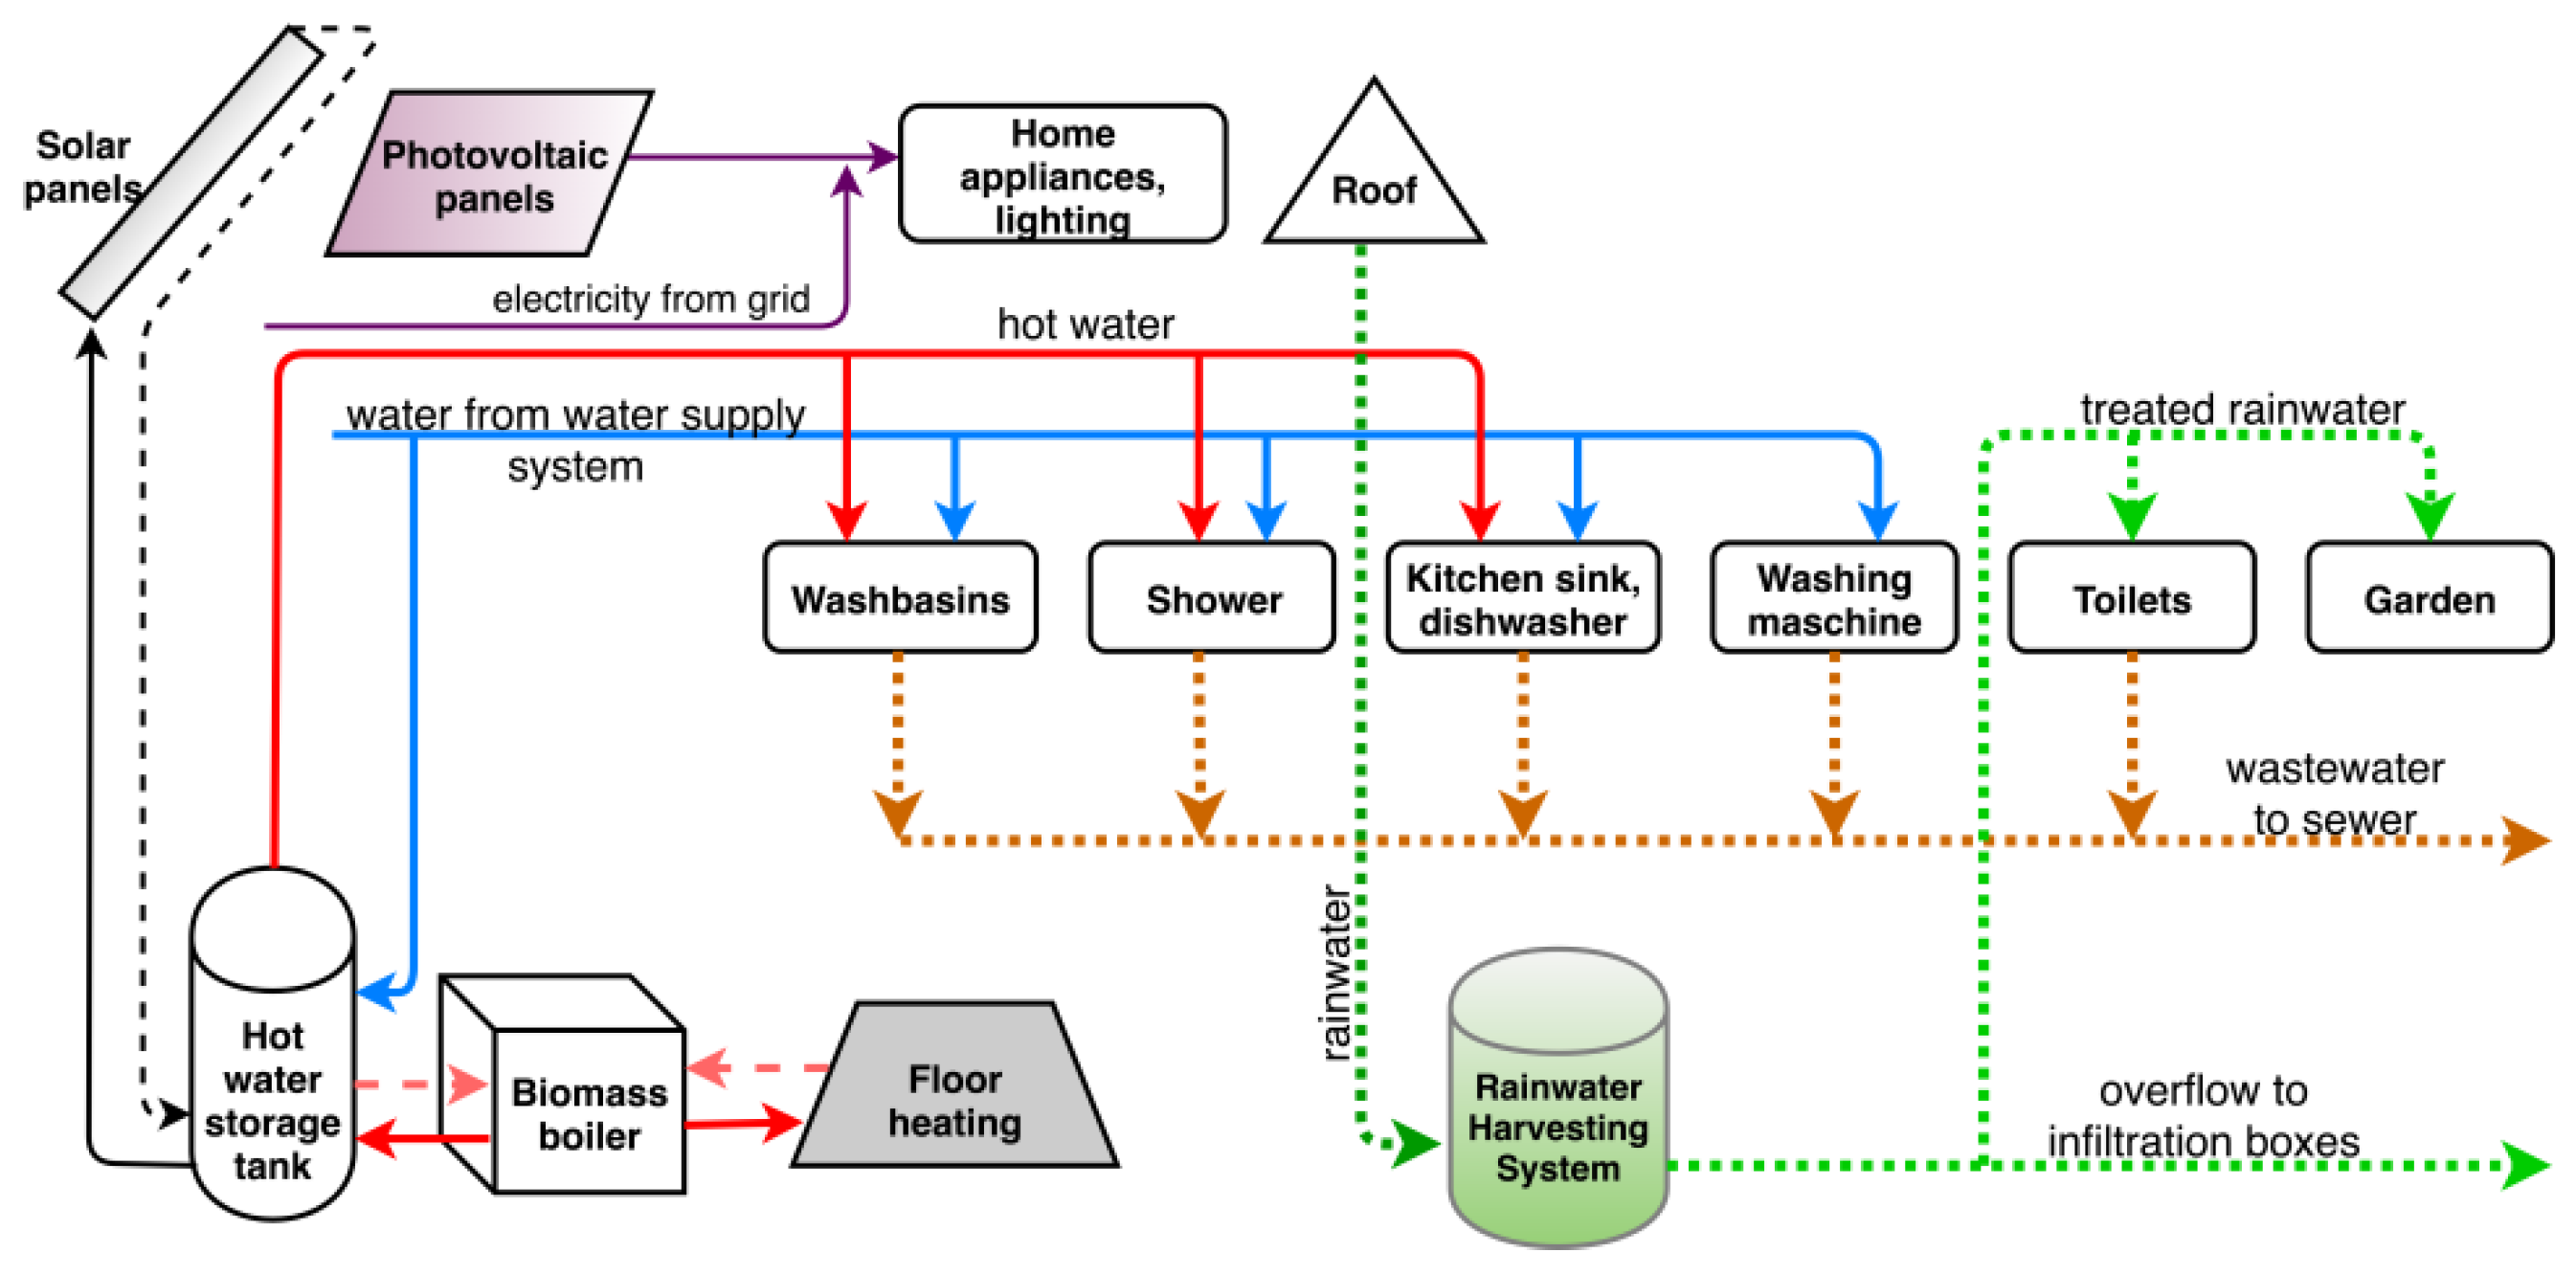
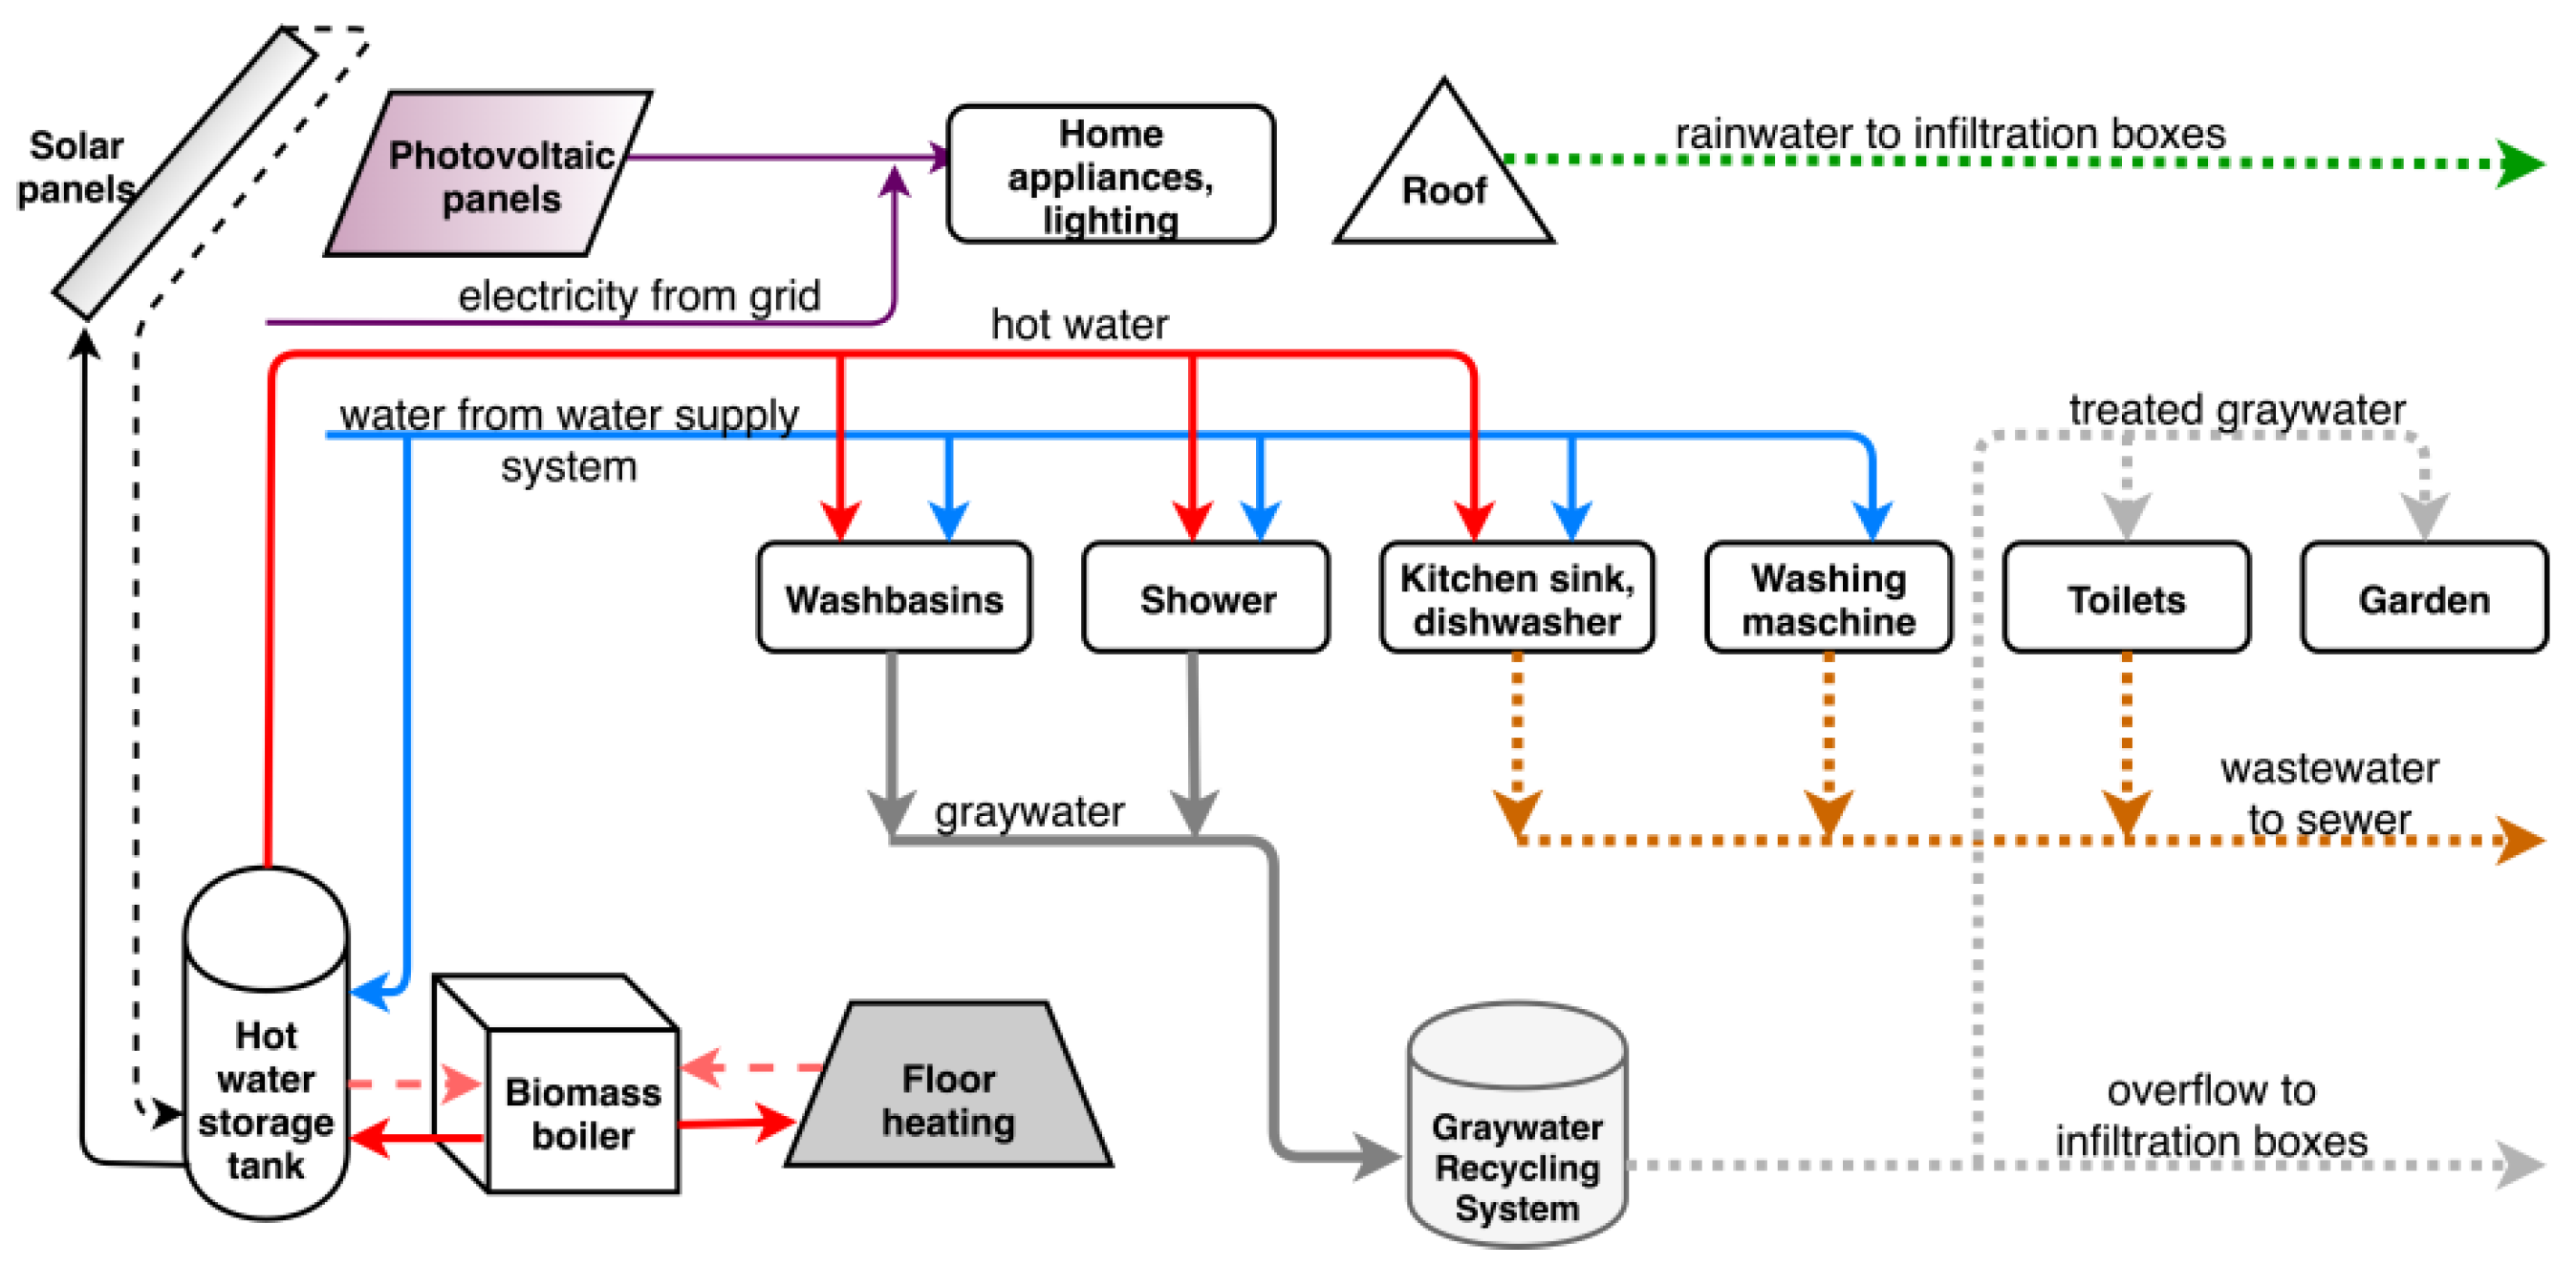
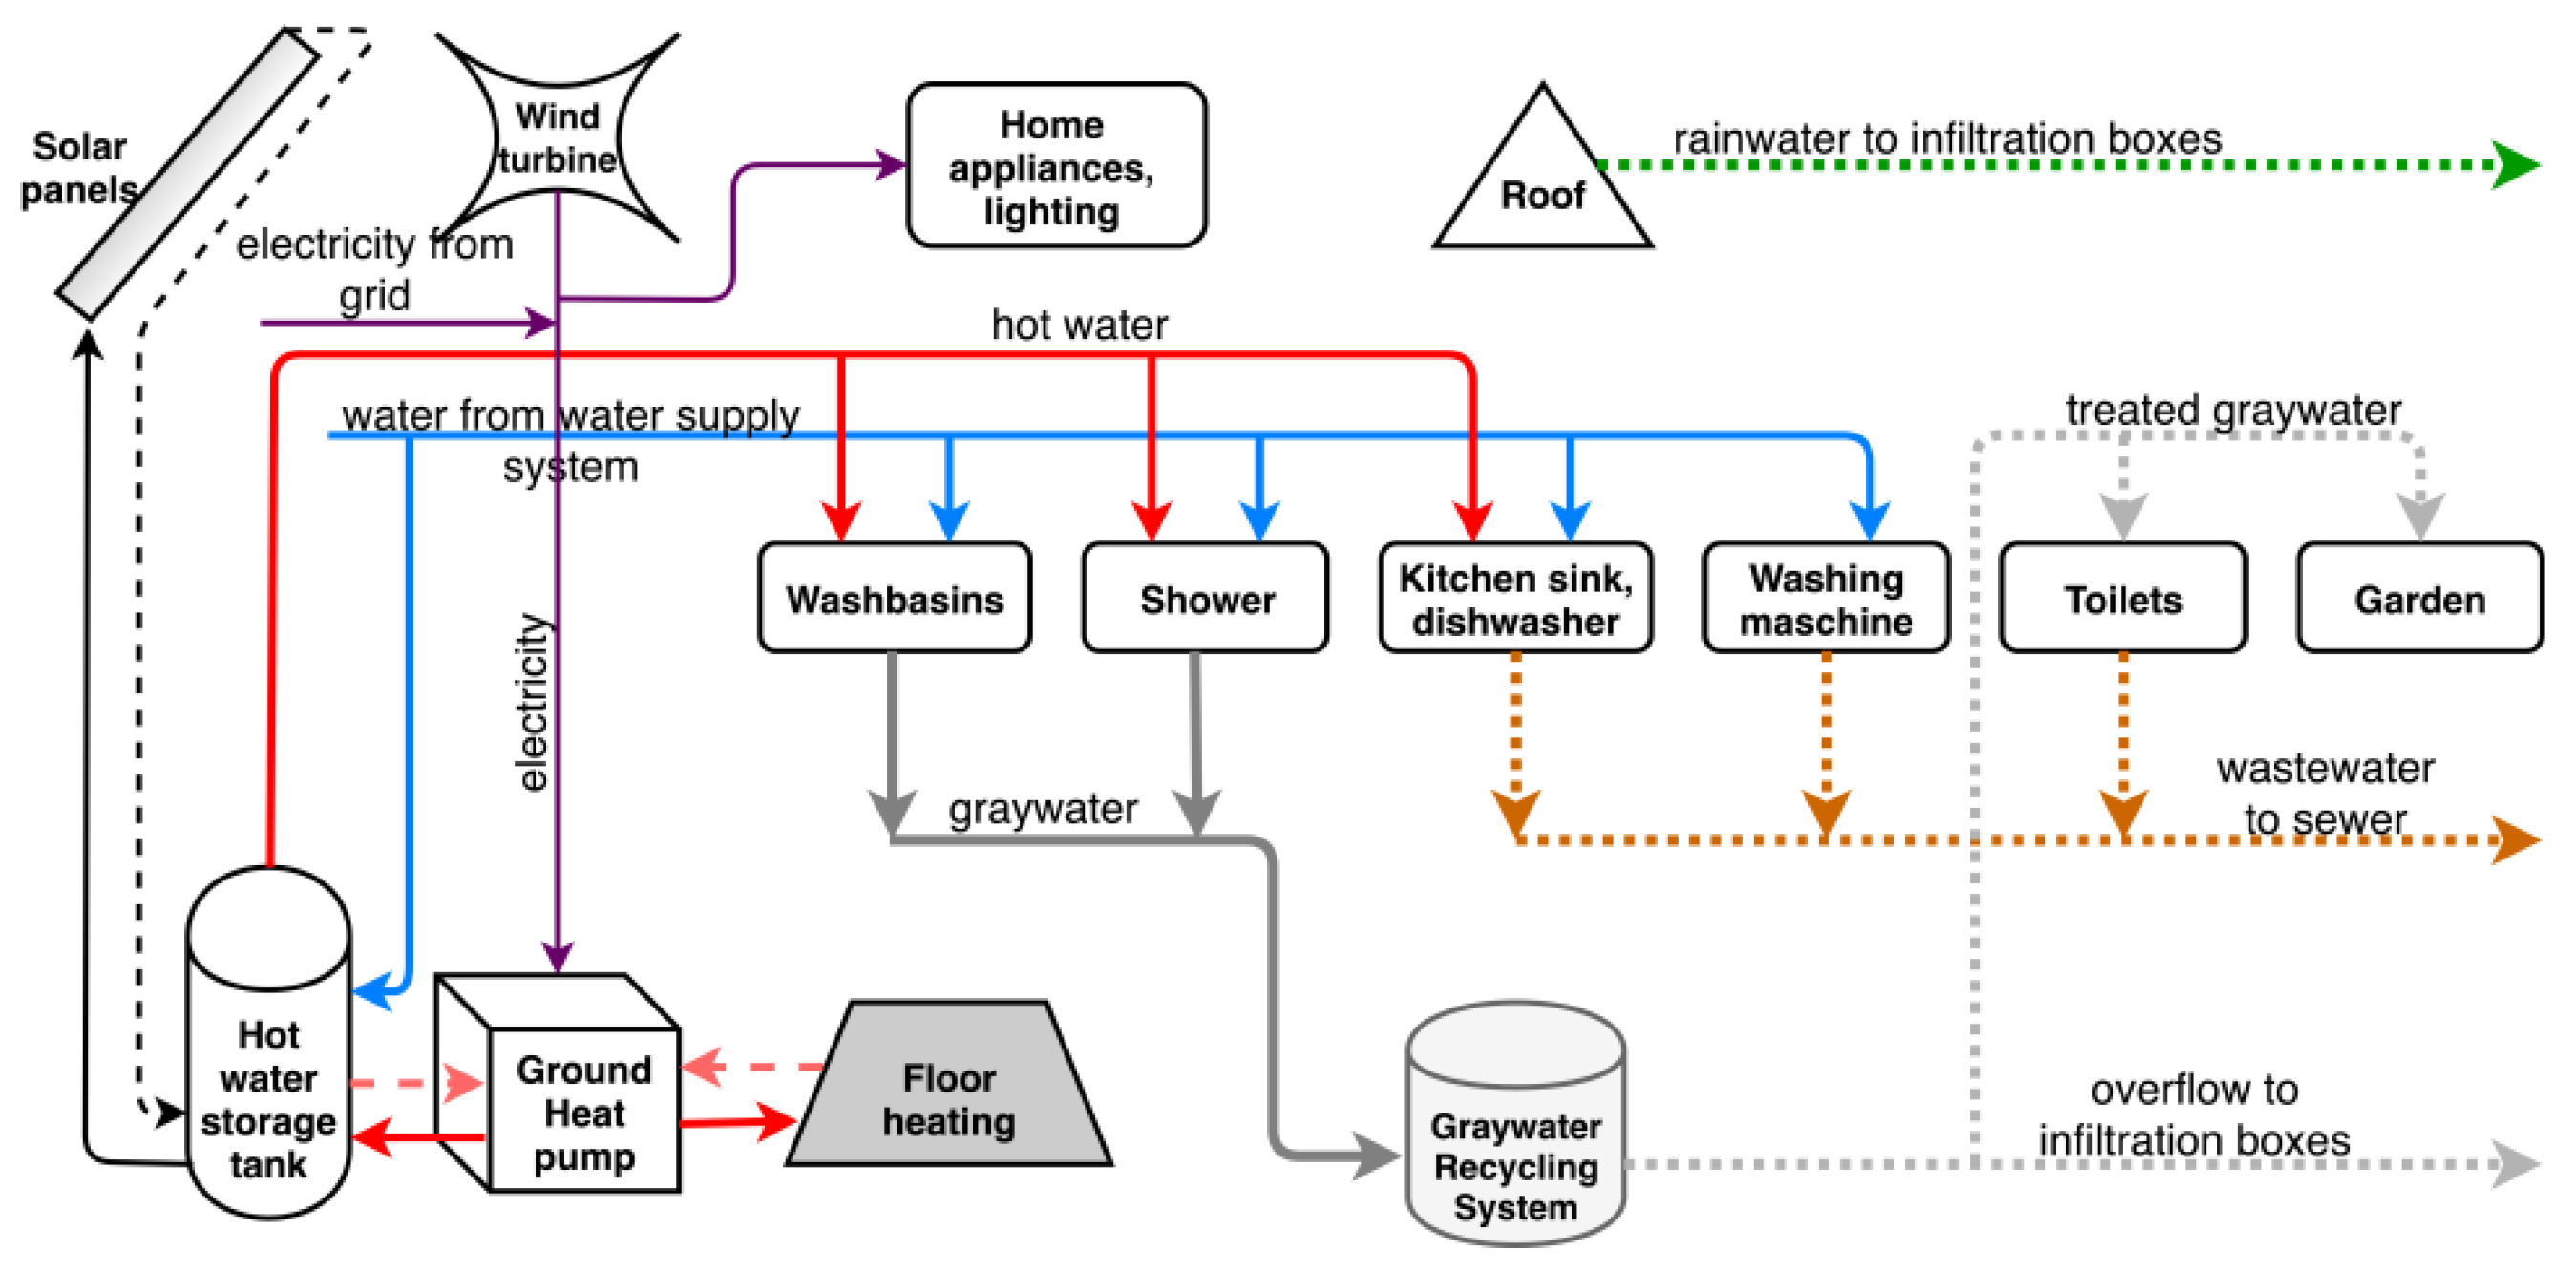
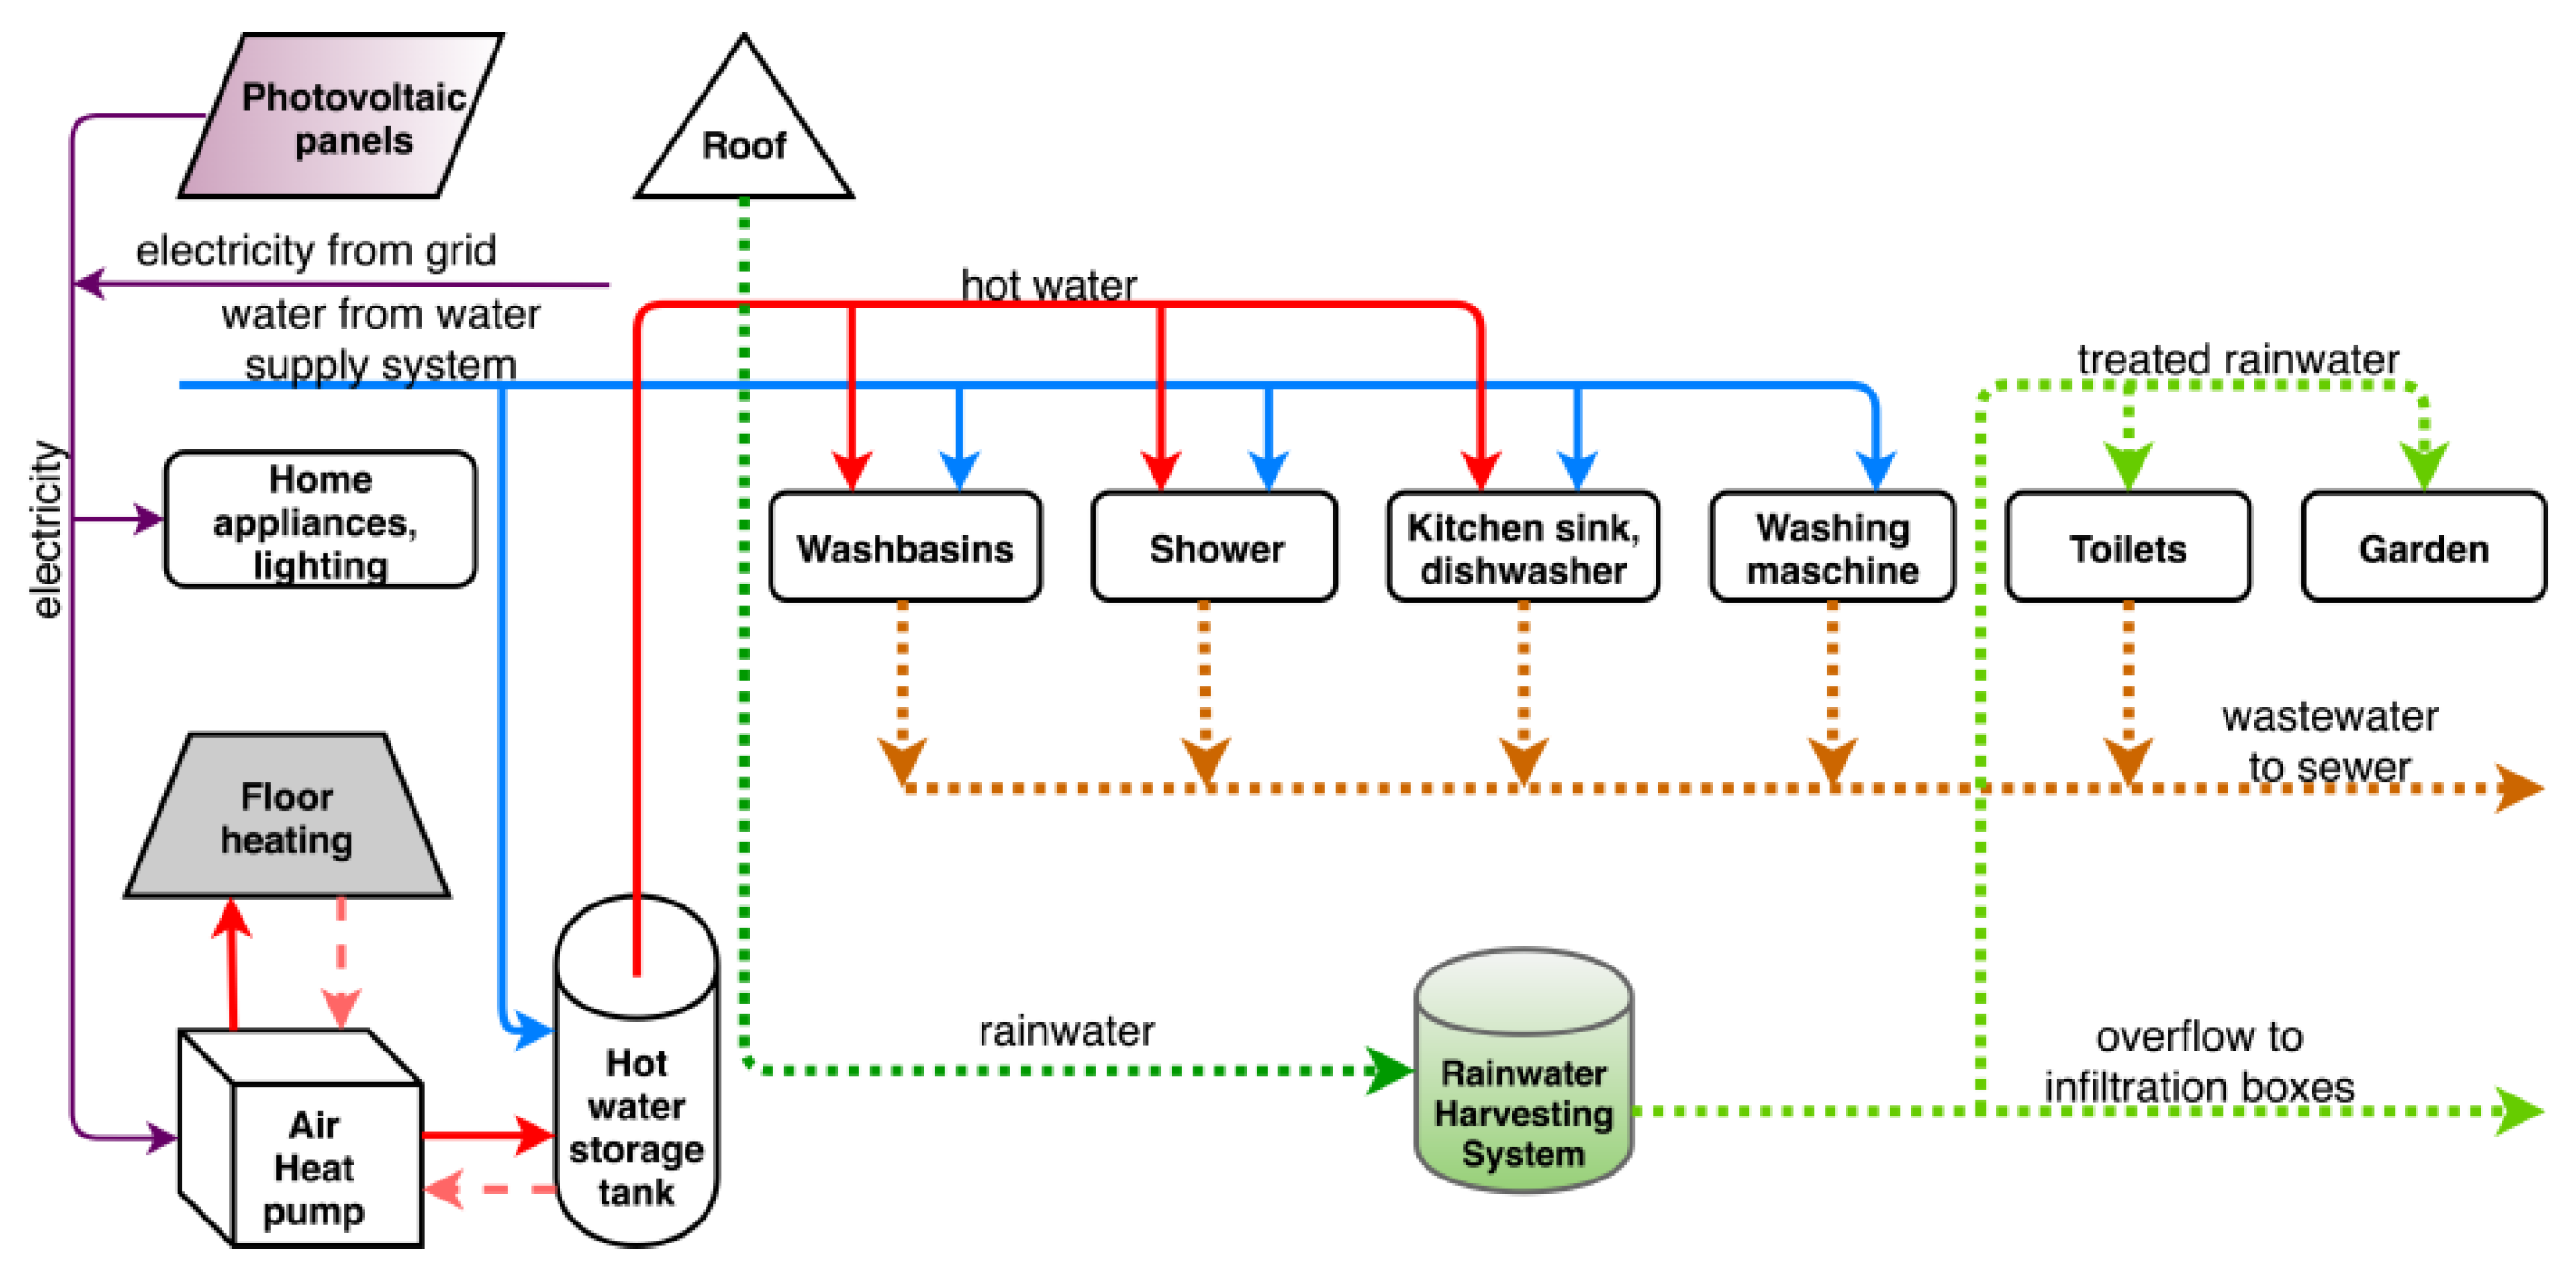
2.1. Case Study

A single-family residential building located in the south-east of Poland in the city of Rzeszów was selected for the research Figure 1. The building has two floors with a total usable area of 164 m2. It was assumed that the construction of the analyzed building and its equipment would be a part of the concept of environmentally friendly house. This solution brings many benefits both for the environment and for the owners. Figure 2 presents solutions that allow a building to become one with a reduced demand for energy and water, and thus an environmentally friendly building.
Referring to the construction of the building, it meets all the requirements specified by the German Passive House Institute in Darmstadt (PHI) for objects constructed in a passive standard. An indicator of a unit annual usable energy demand for central heating and ventilation purposes was designated and it is 11.77 kWh/(m2·year). The building uses a mechanical ventilation supply system and an exhaust with heat recuperator. Due to the specificity of climatic conditions prevailing in Poland, the building also provides underfloor heating. On the basis of the PN-EN12831 standard, the heating demand for the building, which is 6 kW, was calculated. The maximum thermal power was also determined for the preparation of hot usable water, which, depending on the number of occupants and an individual daily demand for hot water, ranges from 1.7 to 6.6 kW.
Considering the fact that such buildings in Poland are very rarely constructed, a cost-effectiveness analysis of the use of alternative installation solutions was carried out. The analysis focused only on internal systems because the solution of the construction in the building in each investment variant was the same. It was assumed that the building analyzed was equipped with: a shower, 2 washbasins, 2 toilet bowls, a washing machine, and a sink. It was assumed that the characteristics of water and energy consumption in individual calculation cases was the same for all users of the installation. The variable parameters in the studies were the number of occupants and the duration of showering. This allowed determining the impact of changes in these parameters on the financial performance of the project.
In order to compare various investment scenarios, eight different internal sanitary installations were analyzed in such a facility, including variant 0 - the most common one in Poland, which assumes connecting the building to conventional networks. Referring to Polish conditions, as well as public opinion and concerns, many different systems and their combinations are taken into consideration, which will allow a potential investor to make the right financial and/or environmental decisions. The research includes the following solutions whose implementation allows reducing water and energy consumption in a building.
  • Graywater Recycling System (GWRS),
  • Rainwater Harvesting System (RWHS),
  • Solar Collectors (SC),
  • Photovoltaic Panels (PP),
  • Air Heat Pump (AHP),
  • Ground Heat Pump (GHP),
  • Wind Turbine (WT),
  • Drain Water Heat Recovery (DWHR),
  • Biomass Boiler (BB).
Individual systems and principles of their functioning are characterized later in this article.
As already mentioned, the cost-effectiveness analysis was carried out for 8 different sanitary installation concepts in the building, which are shown in Figure 3, Figure 4, Figure 5, Figure 6, Figure 7, Figure 8, Figure 9 and Figure 10.

2.2. GWRS Description

The article assumes that the graywater recycling system (GWRS) will be used for flushing the toilet bowls and in spring and summer, that is from April 15 to September 15 for watering the green areas around the building. An excess of wastewater generated in the autumn-winter period will be directed to underground drainage devices, thanks to which it will not be necessary to pay fees for the discharge of wastewater to the sewage system. Two polypropylene draining boxes were adopted. Each box measured 100/50/40 cm.
Taking into account the composition of graywater and the purpose of its use, it was assumed that only the graywater generated during showering and from the wash basin would flow into the pre-treatment system. The amount of inflowing FGWRS wastewater was determined from dependence (1) and depended on the number of occupants Oc and on the daily unit water consumption while showering dsh and body wash in washbasins dwb. Daily water consumption in washbasins dwb was determined based on literature data [65] and daily water consumption for showering dsh was calculated from the Equation (2). However, the demand for non-potable use results from the Equation (3).
F GWRS   =   d sh O c + d wb O c ,
d sh   =   d wm l sh ,
D np   =   d tf O c + d g G a ,
where: FGWRS—inflow of graywater to the system of tanks, dm3/day; dsh—daily water consumption for showering, dm3/person/day; Oc—the number of occupants, dwb—daily water consumption in washbasins, dm3/person/day; dwm—mixed water flow from the showerhead, dm3/min; lsh—showering length, min; Dnp—water demand for non-potable use in analyzed building, dm3/day; dg—daily water consumption for green areas watering, dm3/m2/day; dtf—daily water consumption for toilet flushing, dm3/person/day; Ga—surface of green areas, m2.
Based on the calculations three different graywater recycling systems were selected, whose operation was based on the ultrafiltration process. The choice of these solutions was influenced by the number of people and the duration of the showering time. Depending on the calculation case, a system with a capacity of 250, 500 and 750 L per day was selected.

2.3. RWHS Description
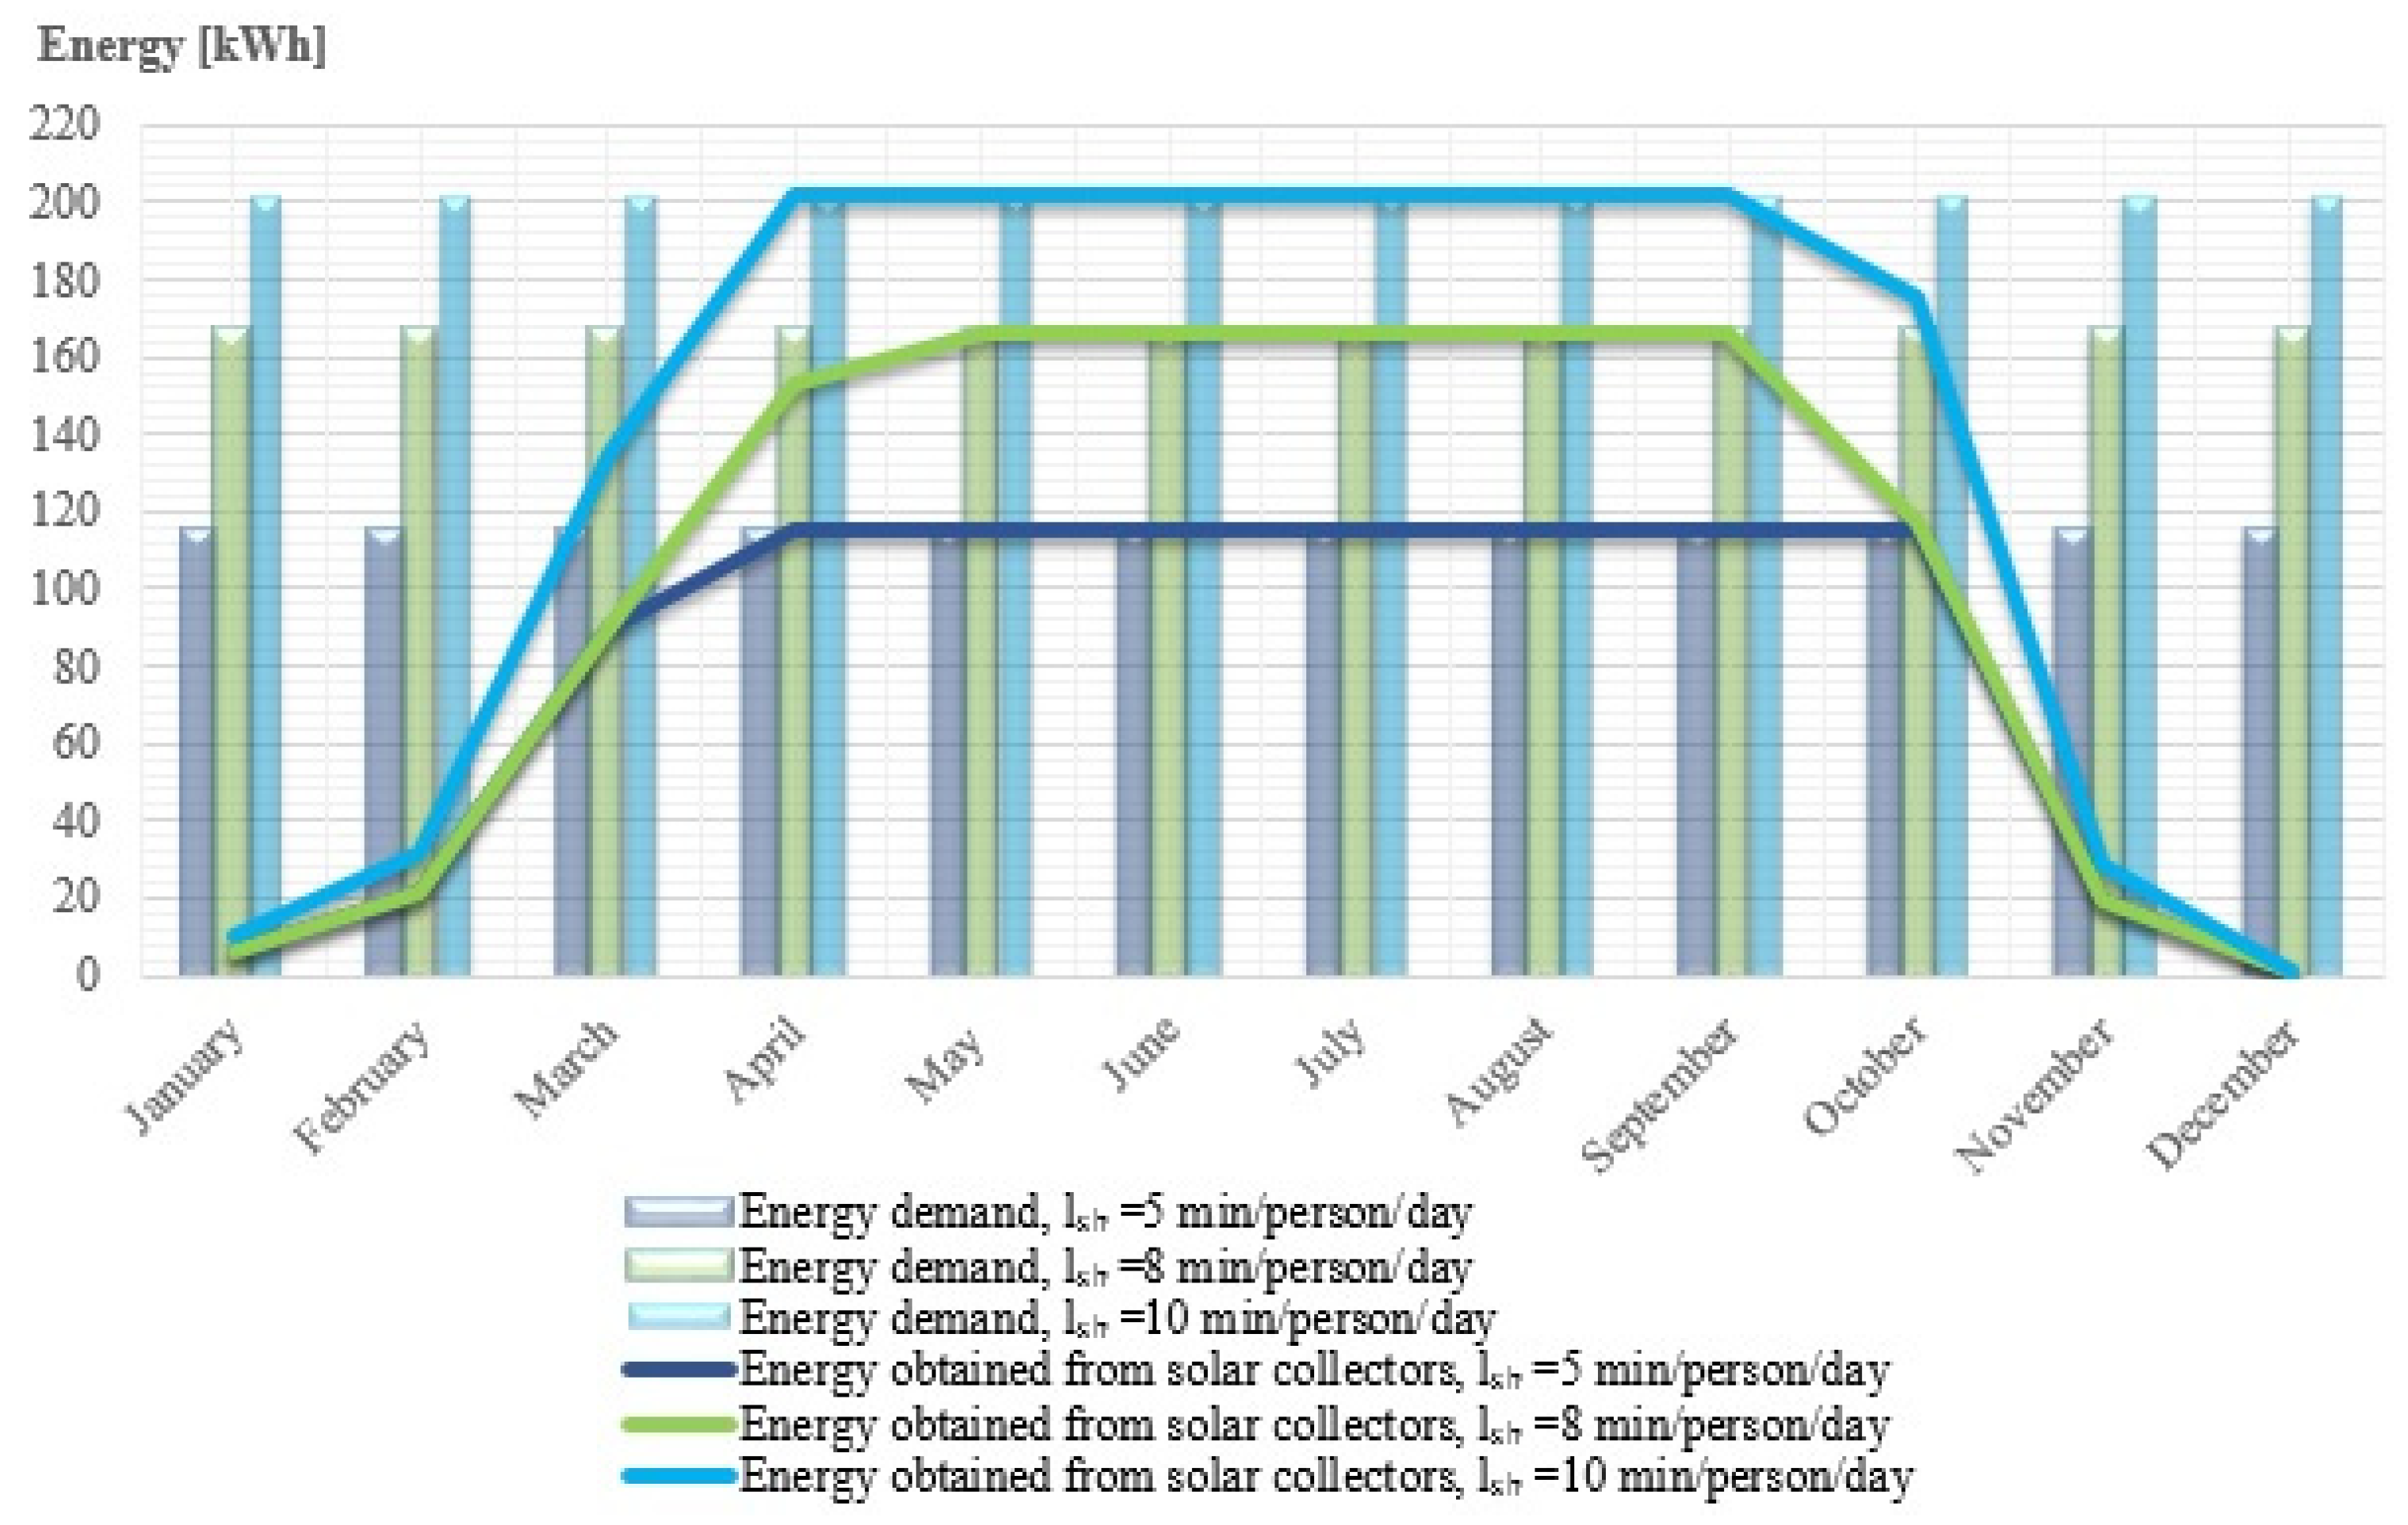
In the studies conducted, the amount of rainwater that can be used for toilet flushing and watering the garden in the examined single-family house was determined by using the simulation model described in the publication [66]. This model is based on a calculation algorithm that allows determining the daily water balance. These studies used archival daily rain data from the period of 10 years (2003–2012) from a meteorological station located on the outskirts of Rzeszów city. During this period, the average annual precipitation H was 695 mm, as shown in Table 1.
In the case analyzed, it was assumed that amounts of rainwater from the roof of the building was supplied by a system of ducts to the underground tank where they were pre-treated. Water was transported from the tank using a pump for internal installation in the building. An important parameter of the model that affected the effectiveness of RWHS was the daily demand for non-potable water Dnp which was determined from the Equation (3). Similarly to the variants using gray water, the demand for water for watering the garden was only taken into account for spring and summer.
Based on the calculated demand for non-potable water Dnp and the amount of rainwater that flows from the roof to the tank designated from simulation tests and guidelines of rainwater harvesting systems producers, the required capacity of the Vt tank was determined. Depending on the calculation case, this capacity was 2.5 m3 or 3.0 m3. In periods when the inflow of rainwater to the reservoir was insignificant, the reservoir was topped up with water from the water supply network, and during heavy rainfall, an excess of rainwater was discharged to the drainage boxes. On the basis of the calculated inflow of water to these devices and manufacturer′s guidelines, 2 separation boxes with dimensions of 100/50/40 cm and a volume of 200 dm3 were selected.
In order to determine an impact of model parameters on the financial viability of each variant, the capacity of the Vt reservoir and the number of occupants Oc were changed.

2.4. SC Description

In Poland, due to the high variability of time of insolation during the year, solar installations are mainly used as systems supporting other sources of energy in hot water preparation systems. A properly installed and operated installation with solar collectors is able to cover about 60% of the annual demand for hot water. In the summer months, this share can be up to 90%, while in winter it is only 30%. Table 2 shows monthly solar sums for the city of Rzeszów where the analyzed building is located.
Due to the fact that flat collectors are the most popular type of solar collectors for residential use, this type of collectors was selected for the research. Solar collectors are situated at an angle of 38°, on the roof oriented towards the south. This angle is consistent with an inclination of the roof structure of the building, so the solar collectors adhere directly to the roof slope. Based on the calculations made, including the resources of the region solar energy r and the demand for hot water, 1 to 6 solar collectors by Hewalex company were adopted depending on the variant. The selection of collectors and other elements of the installation was made on the basis of Kolektorek 2.0 computer program. In order to optimally select solar installations for output data, two models of solar collectors KS2100 and KS2400 were used, with an active area (apertures) of 1.82 and 2.19 m2, respectively, and an optical efficiency of 80.8%. The calculated design percentage coverage of the annual heat demand for the purposes of hot water preparation varies from 62.1 to 68.3%. Figure 11 presents the monthly energy demand for heating hot water and the amount of energy possible to obtain and use from solar collectors in the following months for three example cases—option 1, number of occupants Oc = 2 persons, duration of having a bath lsh: 5, 8 and 10 min/persons/day.
As shown in Figure 11, in the summer season solar collectors are able to cover practically 100% of the demand for thermal energy for preparing domestic hot water. However, due to the possibility of cloudy days, electric heaters with a capacity of 1.5–2 kW for the water tank were selected as a reserve heat source.

2.5. PP Description

Solar energy can be effectively used not only for the production of heat in solar collectors but also for the production of electricity by photovoltaic panels (PP). However, they are affected by the environmental parameters such as an irradiation level, partial or complete shading, dust, dye or other factors [67]. Photovoltaic panels do not require any other fuel to work, which means that such solutions have zero emissions of CO2 and other pollutants [68], thus offering clean and environmentally sustainable electricity production.
On the basis of the determined demand for electricity in the analyzed single-family house including appliances, lights and power supply of other devices accepted for testing in various installation variants and on the basis of solar radiation, Hewalex polycrystalline photovoltaic modules in the amount of 10 to 32 panels were selected depending on a calculation variant and other necessary elements of the installation using the PV Calculator from the module manufacturer. The annual total electricity demand for the variants under consideration ranges from 2650 to 9293 kWh. The efficiency of the adopted photovoltaic module is 16.5%. Figure 12 shows the monthly yields of photovoltaic electricity in option 2 and for the duration of having a bath lsh = 5 min/persons/day depending on the number of occupants Oc, as well as the intensity of solar radiation for the city of Rzeszów.
As shown in Figure 12, the electricity yield from the PP plant is closely related to the intensity of solar radiation and grows in a direct proportion to the size of the selected installation. Due to the practicality of using the photovoltaic installation, an on-grid system was established, i.e., a system cooperating with the power grid-in the period of high insolation, the installation gives energy to the grid, and if there is not enough sunlight, when electricity consumption is greater than its production, it draws electricity from the network. It is assumed that settlement with the power plant of the amount of electricity produced and taken from the grid will be implemented through the so-called net-metering, or semi-annual settlement system. It consists of balancing the consumption of electricity on a semi-annual scale. Due to the unevenness of energy production in relation to the needs, it is assumed that 10% of the annual electricity demand will be additionally taken from the electricity network.

2.6. AHP and GHP Description

In research in two variants of investment (Variant 3 and Variant 4), a ground-source heat pump, as well as two successive air-source heat pumps were applied (Variant 5 and Variant 6).
The required heat pump power, which is the basis for the selection of an appropriate device, was determined using the formula [69] (4):
Q PC   =   24 24 t z · Q z ,
where: tz—tank utilization time (heat pump pause time), h; Qz—computational demand for thermal power (reduced power of the system) for preparing hot water, kW.
Groundwater heat pumps by Vikersønn were selected. They included the following models: Bjørn 10, Bjørn 12 and Bjørn 15 in accordance with the assumed calculation data and the calculated power required for the analyzed variant. Thermal energy will be absorbed from the ground through U-shaped vertical heat exchangers made of HDPE 40 × 3.0 pipes with lengths of 204 m, 261 m, and 273 m, respectively. An advantage of using vertical probes as the lower heat source is a more efficient and more stable operation of the heat pump which is related to an increase of the ground temperature along with the depth of the well and then its stabilization.
Air heat pumps with direct evaporation of Danfoss refrigerant, model DHP-AQ sizes 11, 13 and 16 were selected. They correspond to nominal powers of 10.8 kW, 12.2 kW and 15.3 kW, respectively. It is assumed that the devices will work both for the needs of preparing hot usable water and central heating.

2.7. Wind Turbine

Wind conditions in Poland are described as good ones. Large wind farms are located mainly in the north of the country, while the southern and south-eastern part where there are areas with very good wind conditions are focused on the use of small and micro wind turbines [70]. The south-eastern region of Poland, where the analyzed building is located, is characterized by a very high wind energy potential whose value calculated on the basis of measurement results in the speed range above 4 m/s at a height of 10 m is 750–1000 kWh/m2·year, and on height 30 m 1000–1500 kWh/m2·year.
In this article, on the basis of the demand for electricity used for lighting and supplying devices in the building, a small wind turbine with a capacity of 1.5, 2, 3 or 4 kW was selected in accordance with the considered variant. Taking into account the location of the facility, the value of the annual production of electricity by the wind turbine was estimated, which is analogous to the power of the devices: 2628, 3504, 5256 and 7008 kWh. It was assumed that the wind turbine would be mounted on the roof of the building and connected to the power grid in the on-grid system. The annual demand for electricity in the analyzed cases ranges from 2603 to 6296 kWh. Due to the series of power devices every 1 kW in some variants there is a large surplus of energy production, which will be sold to the power grid. Settlements of energy generated and collected from the grid will be implemented in the net-metering system.

2.8. DWHR Description

Graywater may not only be an alternative source of water in a building, but it can also be a source of energy. In order to recover the energy carried by graywater, a heat exchanger called drain water heat recovery (DWHR) is applied.
For the research a vertical DWHR heat exchanger—Showersave QB1-21 from Q-Blue B.V. installed on the outflow of graywater from the shower was used. It is a “tube-in-tube” type of an exchanger with a length of 210 cm through which cold water and warm graywater flow counter-currently. Pre-heated water from the exchanger will be fed to the shower mixing valve. On the basis of the data of the manufacturer of the analyzed device and the assumed calculation data, the water temperature increase ΔT = 18 °C was estimated, resulting from the water flow through the device based on the methodology described in reference [71]. Directing the stream of pre-heated water to the shower mixing value reduces the hot water demand (55 °C), and the determination of the water flow rate using a heat transfer balance is the basis for calculating the amount of the recovered heat energy. It is estimated that thanks to the DWHR system at the outflow of graywater from the shower to the sewage system, it is possible to recover from 537 to 3421 kWh of energy per year depending on the adopted variant of data.

2.9. BB Description

In Poland, forests constitute 28.8% of the country′s area (about 8.9 million ha) and a further increase in forest cover to 32% is assumed to 2020. The General Directorate of State Forests estimates that the total technical potential of timber from forestry, which can be directly used for energy purposes, is approx. 6.1 million m3. Also, significant amounts of wood waste generated in the wood industry show a great potential for their use in energy production. It is estimated that the amount of wood waste from the wood industry and other sources is around 8.3 million m3 [72].
Taking the above into account, the research assumes that in three investment variants (Variant 1, Variant 2 and Variant 7), the biomass boiler will be a source of heat in the analyzed house. This boiler was selected on the basis of the determined demand for central heating and hot water preparation. A solid fuel boiler—hornbeam wood with a nominal power of 12 kW was chosen. The average efficiency of heat generation is 84%.

2.10. Financial and Environmental Analysis

The main goal of the research was to determine the cost-effectiveness of using different installation options in a single-family residential building. The analysis was carried out using the Life Cycle Cost (LCC) methodology, which allows determining costs throughout the life cycle of a given product or facility. The LCC methodology is also used as cost-effectiveness analysis in buildings, especially for energetic modernization of buildings [73,74]. This method of financial analysis takes into account the initial investment and operating costs incurred during the exploitation of the facility as well as the residual value, which is the remaining value at the end of the study period [75]. LCC enables an optimization of investment projects′ costs [76] and making sustainable decisions [77].
In the studies, LCC cost analysis was performed using the Equation (5). Considering the length of life of the building and the installation it is equipped with, the analysis does not consider residual value (RV), which is in line with the guidelines [78], and other authors′ research, for example [79].
LCC k   =   INV k + t = 1 T ( 1 + r ) t OC k + RV k ,
where: INVk—investments for k-variant of installation, €; OCk —operating costs in a year t for k-variant of installation, €; RVk—residual value dla k-variant of installation, €; T-duration of the LCC analysis, years; r-constant discount rate; t-the number of years after installation.
Initial investments INVk, including the cost of a purchase and an assembly of the installation together with devices allowing to reduce energy and water consumption in the building, was determined on the basis of producer prices of individual systems. In all variants, based on the obtained data from simulation models and the data from the ArCADia-TERMO 6.6 computer program, annual operating costs OCk resulting from the purchase of water, gas, electricity and biomass as well as costs caused by sanitary and rainwater sewage to sewage systems were calculated. The operating costs also include the cost of replacing some system components whose consumption occurs after the time specified by their producers. The detailed data accepted for the tests are presented in Table 3.
When determining the total LCC costs of all investment variants considered, different values of the installation operating parameters were taken into account, which allowed determining their impact on the financial viability of the project. The variable parameters were the number of occupants Oc and the duration of showering lsh. The data adopted for calculations are shown in Table 4, Table 5 and Table 6 for installations related to the production of heat and hot water, electrical installations and water and sewage installations, respectively.
Calculations for heat demand for the purposes of preparing domestic hot water and central heating, as well as operating costs related to heating installations were made using the ArCADia-TERMO 6.6 computer program. The calculated annual seasonal hot water demand, which is the starting value for further calculations resulting from the various calculation variants adopted, for central heating installations is QH,nd = 2427.5 kWh/year, and for installations for domestic hot water preparation is QW,nd = 1376–7226 kWh/year depending on the length showering lsh and the number of occupants Oc. According to the accepted methodology the total average annual efficiency of the installation that consists of: the efficiency of heat generation in the heat source, the efficiency of heat accumulation in capacitive elements, the efficiency of heat transfer to dredging points, and the efficiency of heat utilization for all variants was determined. Then, the percentage share of covering the heat demand was estimated for the case where there was more than one heat source in the installation. This was the basis for determining consecutively required annual amounts of fuels to cover the heat demand, and then the total operating costs including annual inspections of installations and spare parts.
In principle, the building analyzed was to be an eco-friendly one, therefore, in addition to financial aspects, the research also took into account its impact on the environment. For each investment variant, the emission of pollutants to the atmosphere resulting from the use of various types of energy sources was determined. The calculations were based on the indicators contained in the ArCADia-TERMO 6.6 program. This program allowed estimating the level of emissions, such as CO2, CO, SO2, NOx, dust, and soot.

2.11. Sensitivity Analysis

A sensitivity analysis is one of the methods of investment risk assessment which consists in examining an impact of future changes in the development of basic investment variables on the level of its profitability. This technique is used to determine the sensitivity of the results of cost-effectiveness assessment caused by the occurrence of specific types of risk. The method applied in the research is a “what if” analysis, which allows answering the question “what will happen if …”. One of the types of sensitivity analysis was chosen. It was used to examine the percentage change in the size of the variable explained due to a specific change in a given independent explanatory variable. For the analyzed case, it was the determination of the total LCC costs assuming that changes in investment expenditure INVk, or individual components of the operating costs of OCk by the adopted percentage, i.e., ±10% and ±50%, would change. Due to the depth of the test results, the sensitivity analysis for several selected calculation cases was conducted. The following change scenarios were adopted for the research:
  • Scenario A—a change in the initial value of investments.
  • Scenario B—a change in the value of operating costs resulting from the amount of consumed electricity.
  • Scenario C—a change in the value of operating costs resulting from the amount of used tap water and the amount of sanitary sewage discharged from the building to the sewage system.
  • Scenario D—a change in the value of operating costs resulting from the amount of used electricity and tap water, and the amount of sanitary sewage discharged from the building to the sewage system.
The research adopted four characteristic change scenarios (A–D) for which the greatest impact on the final value of LCC costs was observed. The value of the remaining components of operating costs, such as the costs of purchase of gas, biomass and costs of discharging rainwater to the network occurred only in some variants and, therefore, they were not taken into account in the sensitivity analysis.

3. Results and Discussion

The financial and environmental analysis showed that the selection of an appropriate installation variant in the examined single-family house had a decisive impact on the total amount of costs incurred in the period of functioning of a given system and on the amount of pollutant emissions to the atmosphere. The research results confirmed that the construction of a house equipped with installations supplied from alternative sources of water and energy (environmentally friendly house) was not only financially viable, but also had a positive impact on the natural environment.

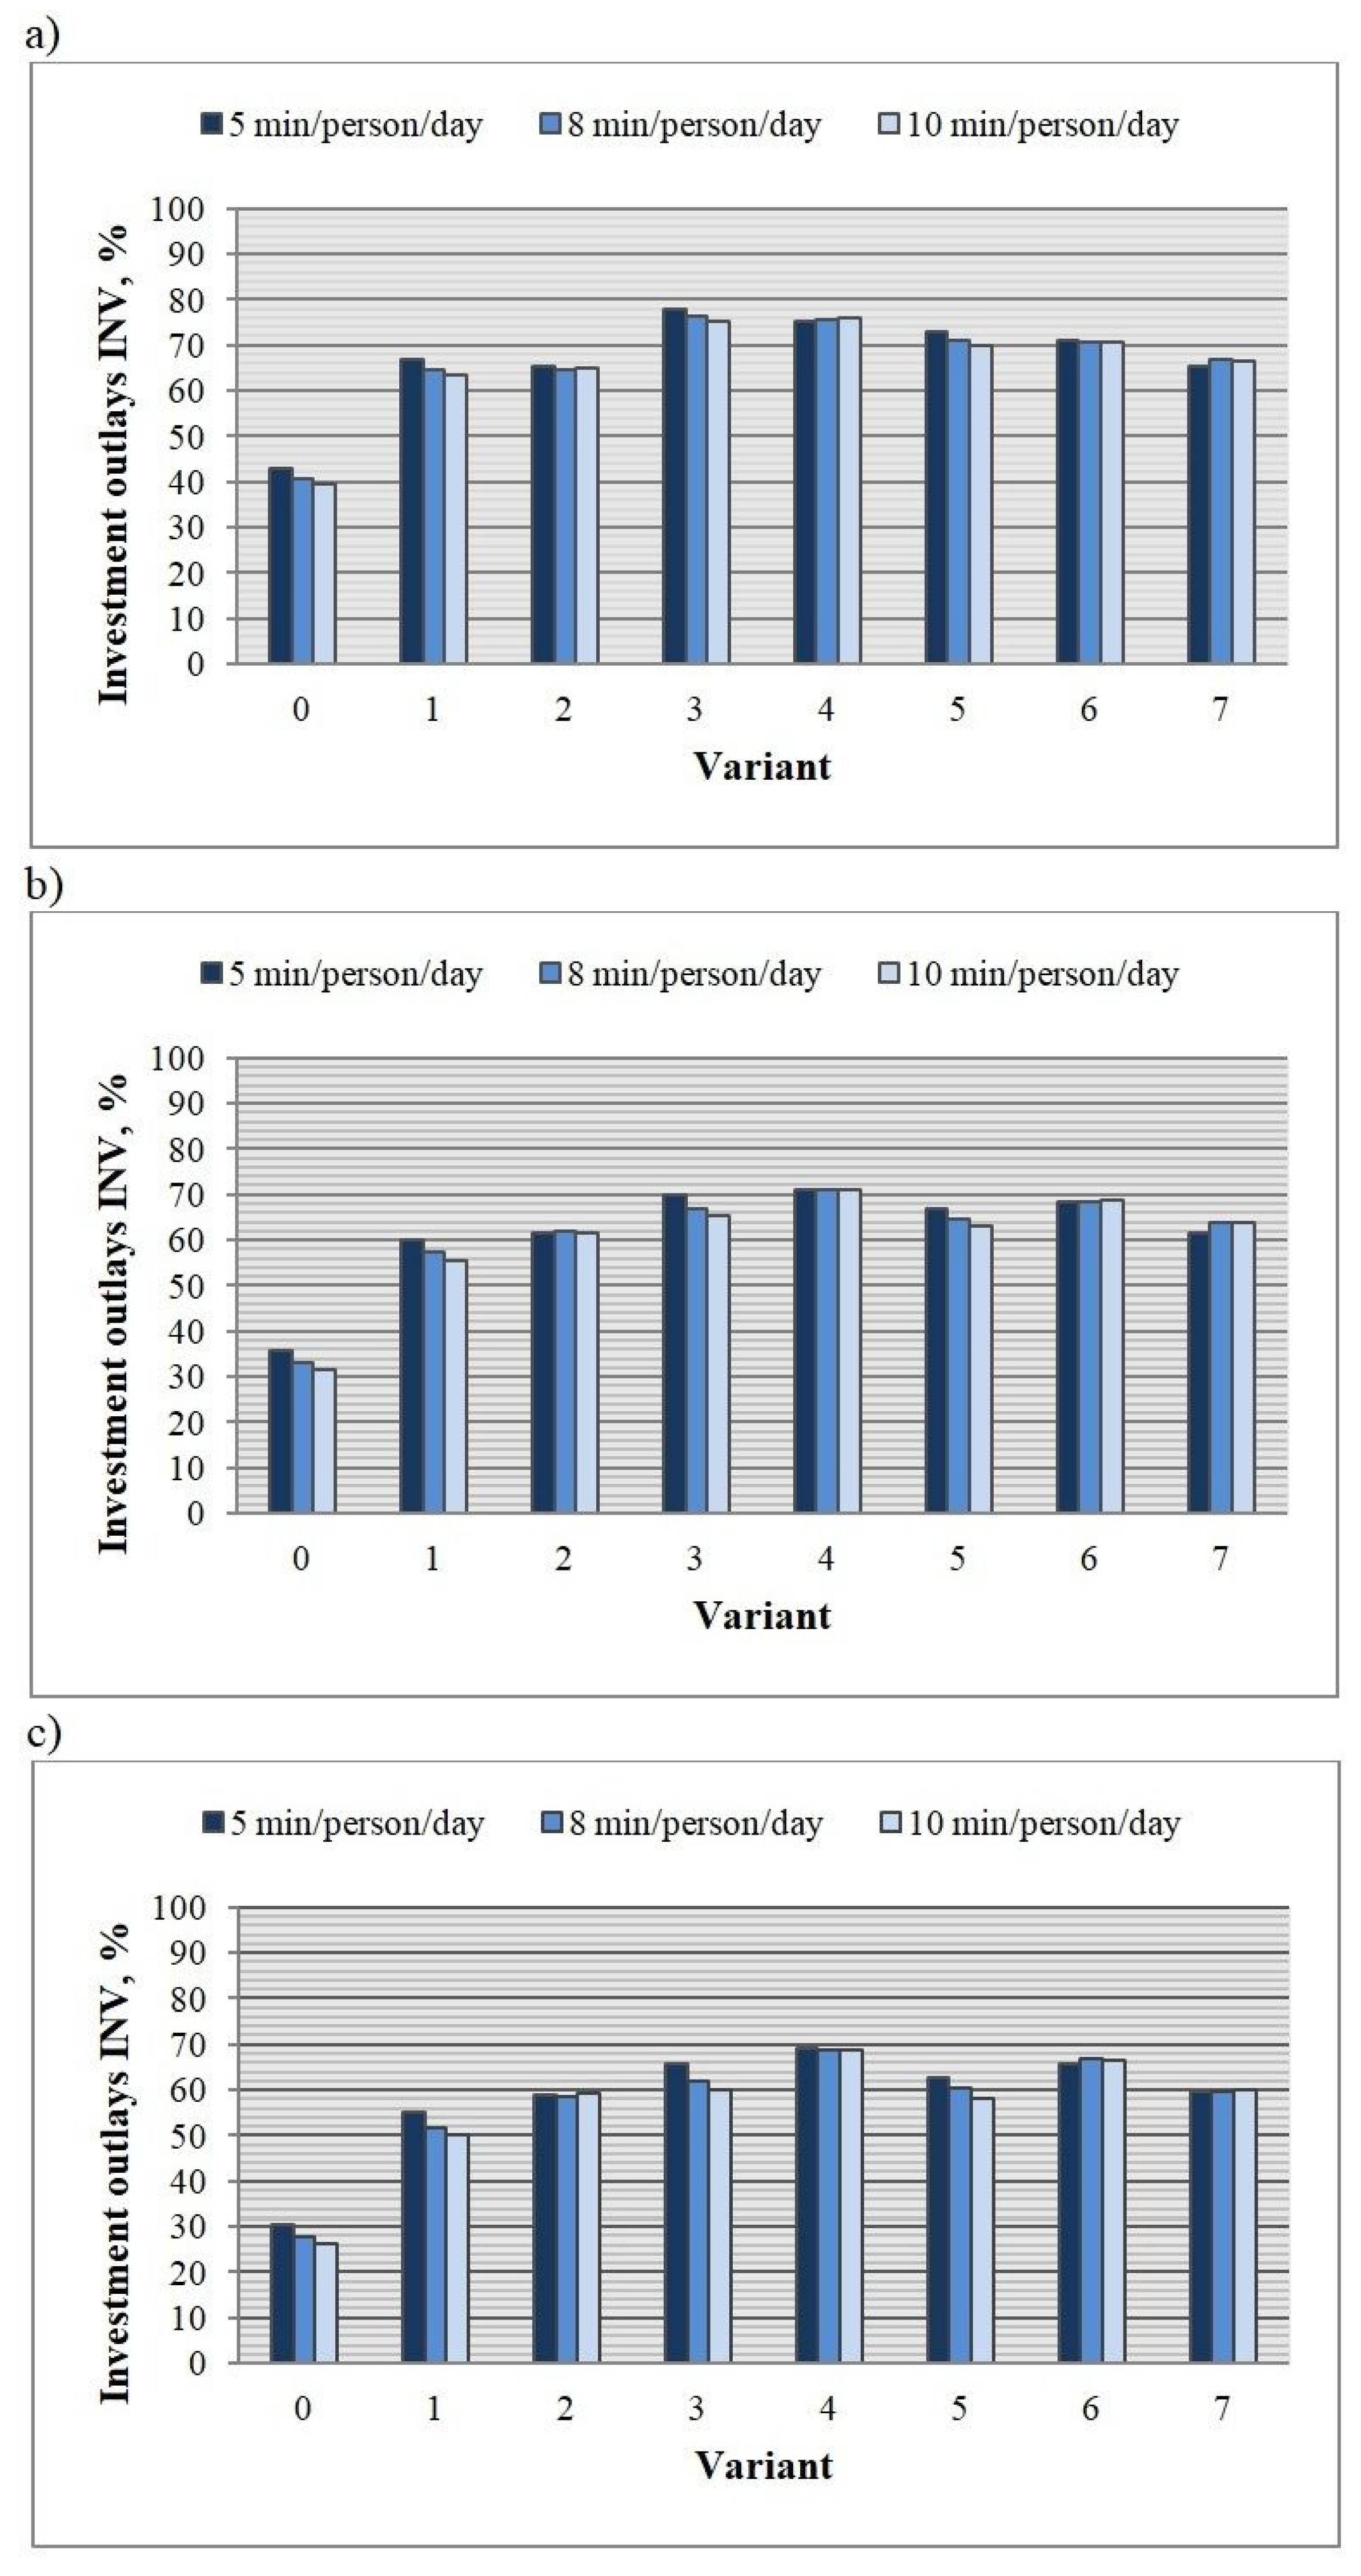
3.1. The Results of the LCC Analysis

The test results shown in Table 7 for different system configurations in the analyzed single-family house show that the LCC costs, and thus the cost-effectiveness of using individual variants are affected by both the number of occupants Oc and individual water demand for showering determined by the length of duration time lsh.
Based on the results of the financial analysis, it was found that the Variant 0 was not the most advantageous solution in financial terms for any of the computational cases considered. This was due to significantly higher operating costs incurred in the analyzed period of 25 years, compared to alternative installation options, whose implementation required much higher INV investments, as shown in Figure 13. Depending on the number of people and the duration of showering, capital expenditure was only from 26% to 43% of the total LCC costs in Variant 0 and as much as from 60% to 78% in Variant 3. The selection of the investment variant only on the basis of the initial investment costs, as occurs in the vast majority of cases in Poland, may lead to a wrong decision. The results of research in this respect confirm the correctness of carrying out a full financial analysis for various investment variants, even those characterized by high investment expenditure as operating costs resulting from their use over a long period of time are often lower than the traditional solution.
The LCC values obtained indicated that the most favorable variant in a situation where the installation was operated by 2 occupants regardless of the showering time lsh was always Variant 1, where rainwater is used and energy needs of the building are covered by biomass boiler, solar panels and photovoltaic panels. Similar results were also obtained for the case when the building was inhabited by 4 occupants and the assumed showering time was (lsh = 5 min/person/day). In all four calculating cases for Variant 1, capital expenditure was 38% to 44% higher than for Variant 0, despite the fact that the reduction of water and energy consumption for 25 years as a result of an implementation of alternative sources caused the total LCC costs to be lower than 12–14% from the conventional installation solution (Variant 0).
Together with an increase in the number of occupants, the demand for water and energy in the building increases, which affects the change in the profitability of using individual variants of the installation. Based on the results obtained, it was observed that for 4 occupants and their use of a shower for 8 or 10 min/person/day and for 6 occupants and time of 5, 8 or 10 min/person/day Variant 7 was the most advantageous financial option. This concept of installation with electricity supplied by wind turbines, heating the building and preparation of hot water by the biomass boiler system, solar collectors and drain water heat recovery unit and using pre-treated gray water is a solution that will contribute to the greatest savings during the analyzed period of 25 years. Comparing Variant 7 with Variant 0, it was noticed that depending on the duration of showering and the number of occupants (4 or 6 persons), the traditional installation solution (Variant 0) generated 52% to 59% higher operating costs than Variant 7. The LCC value for Variant 7 was 17% lower for the case where the installation was used by 4 people and the showering time lsh was is 8 min/person/day and 19% for lsh = 10 min/person/day in relation to Variant 0. Considering the same comparison for only 6 occupants, it was observed that depending on the duration of showering, the total LCC costs were 17% to 25% lower.
When analyzing the value of the LCC index for all variants and the full range of adopted variable parameters of the conducted analysis (Oc and lsh), it was found that Variant 4 or Variant 0 turned out to be the least advantageous option. The first one was characterized by the highest LCC costs in relation to all other variants, for 2 occupants and duration of showering from 5 to 10 min and for 4 occupants and lsh time = 5 min/person/day. This was due to very high investments resulting from the use of expensive equipment such as a ground heat pump, a wind turbine, and a gray water recycling system. Their use in the analyzed single-family house reduced the consumption of water and energy from the network and limited the amount of discharged wastewater to the sewage system, but this did not compensate for the costs that were necessary to bear in order to implement them. An increase in the number of occupants to 4 and the extension of the lsh showering time to 8 and 10 min/person/day resulted in the change of the least profitable variant from Variant 4 to Variant 0. Similar results were also obtained for 6 occupants. This means that in these cases operating costs in the period of 25 years were so large in Variant 0 that it is profitable to use any other variant with alternative sources of water and energy, despite the need to incur significant investments.
The study also analyzed the structure of OC25 operating costs for all considered investment variants. The percentage share of individual components of these costs for three characteristic calculation cases is shown in Figure 14. When analyzing these costs, it was noted that when the installation was only used by 2 occupants in Variant 0, the largest cost was the electricity costs, which were around 28%. In all other variants, regardless of the number of occupants Oc and the duration of showering lsh, the largest share in operating costs were fees for the purchase of water from the water supply network. This share ranged from 23% to 51% and from 26% to 48% for 2 occupants and 4 and 6 occupants, respectively. The reduction in the share in total costs of electricity charges and the simultaneous increase in the share of costs resulting from the use of tap water means that the analyzed alternative water sources, gray water and rainwater, within the scope of the adopted parameters are not an effective solution for the analyzed single-family building. The use of a rainwater harvesting system and gray water recycling system will reduce the demand for water from the water supply network, and thus contribute to the protection of water resources, but due to the high cost of their purchase compared to the relatively small savings that they provide, their use in this case is not viable financially.

3.2. The Results of Sensitivity Analysis

The investment sensitivity analysis carried out for the A-D scenarios described in Section 2.11 allowed determining an impact of changes in particular parameters of calculation models on the value of total LCC costs. Due to the volume of data received, the article presents the results of this analysis for the following case:
  • the number of occupants: Oc = 4 persons,
  • shower length: lsh = 8 min/person/day.
The results of the obtained tests are shown in Figure 15. When analyzing an impact of the changes in the initial investments INV (Scenario A), it was noticed that only an increase in their amount of above 30% would result in a change of the most profitable variant from Variant 7 into Variant 1. However, since investments were determined very precisely, large fluctuations in their value are considered to be unlikely. On the other hand, an increase of investments in the considered alternative variants of the installation means that the traditional variant of the installation (Variant 0) gains on attractiveness. An increase in the value of INV by only by 5% to 10% affects the position of Variant 0 in the profitability hierarchy of individual variants, making its implementation more financially advantageous than Variant 3 and Variant 4. A decrease in the value of INV from −10% to −50% will not negatively affect the profitability of Variant 7. Their reduction by more than 30% only results in the replacement of the profitability of individual variants of installations supplied from alternative sources of water and energy.
The research also showed that a change in the amount of fees incurred for the purchase of electricity from the network (Scenario B) had the lowest impact on the value of the LCC indicator. An increase in the value of these costs by up to 50% will not affect the cost-effectiveness of individual variants at all, which is caused by the fact that a significant part of the energy necessary for the functioning of the analyzed building comes from renewable energy sources. However, reducing these costs by about 20% will increase the cost-effectiveness of Variant 0 in relation to Variant 4, which uses a wind turbine. This means that in this case the amount of energy produced by it and the resulting savings do not compensate for the amount of capital expenditure that is necessary to bear on its installation. When analyzing an increase in LCC costs for this scenario, one noticed that it was insignificant, from about 1% for a 10% increase in these costs to more than 7% for a 50% increase.
Similar tendencies of changes in the cost-effectiveness hierarchy of the analyzed installation variants were observed for scenarios C and D. In the case of the first one, which assumed a change in the value of costs incurred for the purchase of water from the water supply network and sewage disposal to the sewage system (Scenario C), it was noticed that their increase in the scope of 50% would not cause significant changes in the profitability hierarchy of investment options. Such a change is observed only at an increase of these costs by about 40%, which is very unlikely. A similar situation takes place while reducing the value of these costs. However, the change in the profitability of the application of the analyzed variants is noticeable with the value of around −30%.
When analyzing the obtained research results for the scenario, which allowed determining an impact of simultaneous change in the value of operating costs related to the purchase of water and electricity from the network and sanitary wastewater (Scenario D), it was found, similarly to in Scenario C, that an increase in the value of these costs caused a change in profitable implementation of individual investment variants only at the level of approximately 40%. In turn, lowering the value of these costs led to noticeable changes in the profitability hierarchy of the analyzed installation variants in the scope from −10% to −25%.
As demonstrated by the sensitivity analysis, the investment under consideration is most sensitive to changes in the value of the initial capital expenditure (Scenario A). Their increase in the range from 5% to about 40% results in a significant increase in the cost-effectiveness of Variant 0 and an increase in the LCC value for variants that become less profitable (Variant 3, 4, 5 and 6) than the traditional variant, on average around 6% to over 26%. Such a high susceptibility to changes in these variants is caused by a significant share of capital expenditure in the total LCC costs, which in turn results from the necessity to implement expensive equipment for alternative energy sources in these solutions.

3.3. The Results of the Environmental Analysis

Table 8 presents the results of the analysis of the emission of five pollutants: SO2, NOX, CO, CO2 and dust arising from the use of installations configured in various variants in a residential building for the adopted analysis period T = 25 years.
The results of research obtained in this area showed that the highest concentration of pollutants emitted into the atmosphere was CO2. Its value was affected by the consumption of electricity collected from the network in each of the analyzed investment variants. The lowest CO2 emissions were obtained for Variant 3 and Variant 4 where a ground heat pump and a wind turbine were an alternative heat source, except when the installation was used by 4 people and the duration of showering lsh was 8 min/person/day or 10 min/person/day. For these parameters, Variant 7 was characterized by the lowest CO2 emission. This was due to a small surplus of energy production by a wind turbine that would be sold to the electricity grid. The power of this turbine in these two cases was chosen optimally without its oversizing as in the other calculation cases. When analyzing this in terms of an impact of these two options on the natural environment, a better solution would be oversizing the installation, which in turn would cause an unfavorable increase in investments, from the investor′s point of view.
The annual value of CO2 emissions was also determined depending on the number of people and the installation variant, as shown in Figure 16. In the traditional variant of the installation with natural gas and electricity supplied from the grid (Variant 0) CO2 emission ranged from almost 3000 kg/year up to 5500 kg/year. Calculated per one person, in this variant, the annual emission of this gas was from 773 kg (Oc = 6 persons and lsh = 5 min/person/day) to 1555 kg (Oc = 2 persons and lsh = 10 min/person/day). In other variants, the equivalent figure was up to 196 kg/person/year.
When analyzing the remaining pollution values, it was noticed that SO2 emission was also significant in Variant 0. This was mainly due to coverage of electricity demand entirely from the electricity grid. In other variants, due to the use of wind turbines or photovoltaic panels, SO2 emissions were significantly reduced. On the other hand, in Variants 1, 2 and 7, where the biomass boiler was used, the second largest emission, apart from CO2, was the emission of dust.
By comparing all variants with alternative energy sources in relation to the variant of a traditional installation, a reduction of pollutant emissions in the range from 83.5% to almost 100% was achieved. The maximum emission reduction in some variants resulted from a larger production of renewable energy and its sales than the demand for it.
As shown by the research, the use of ecological installations in the analyzed building contributed mainly to a significant reduction of CO2 emissions, which is most responsible for the greenhouse effect. Taking this into account, countries around the world are taking measures to reduce the amount of CO2 emitted into the environment, mainly by conducting an appropriate energy policy based on renewable energy sources.

4. Conclusions

The life-cycle cost (LCC) analysis was carried out using selected unconventional systems to reduce water and energy consumption in environmentally friendly house. The purpose of this analysis was to show that in the long run, it was not always cost-effective to implement expensive alternatives from the point of view of the average investor.
Based on the results obtained, it was found that the traditional variant of the installation, which occurred in the vast majority of single-family houses in Poland, in none of the analyzed cases was the solution with the lowest LCC value despite the fact that it was characterized by the lowest investments. It is the initial capital expenditure that is most often used as a decision criterion, and as research showed, this may lead to a wrong decision, which will result in high operating costs during the use of the facility.
The analysis conducted also showed that the use of unconventional installation solutions in the tested single-family house was not only financially viable, but also allowed for significantly reducing the consumption of potable water and energy, which in turn would reduce the exploitation of fossil energy resources and natural water resources. An application of these solutions, as shown by the results of research, will also contribute to the reduction of pollutant emissions entering the environment, which is mainly responsible for the greenhouse effect involving CO2.
The achievements presented in this article allows proceeding in a way of getting a more completed approach that maximizes the main two dimensions of sustainability: economical and environmental.
In spite of the growing ecological awareness of Polish society, alternative installation solutions are not very readily used at present. Therefore, in the next stage of the research, the third main dimension of sustainable development, i.e., the social aspect should be taken into account. Therefore, there is a need to formulate a set of questions and carry out surveys that will determine the causes of such a state. Research in this area will help indicate further directions of activities and develop local pro-ecological strategies.

Author Contributions

Conceptualization, A.S. and A.M.; methodology, A.S. and A.M.; software, A.S. and A.M.; validation, A.S.; formal analysis, A.S.; investigation, A.S. and A.M.; resources, A.S.; writing—original draft preparation, A.S.; writing—review and editing, A.S.; visualization, A.S. and A.M.; supervision, A.S.

Funding

This research received no external funding.

Conflicts of Interest

The authors declare no conflict of interest.

References

  1. Urbaniec, K.; Mikulčić, H.; Rosen, M.A.; Duić, N. A holistic approach to sustainable development of energy, water and environment system. J. Clean. Prod. 2017, 155, 1–11. [Google Scholar] [CrossRef]
  2. Balibar, S. Energy transitions after COP21 and 22. Comptes Rendus Physique 2017, 18, 479–487. [Google Scholar] [CrossRef]
  3. US EPA. Inventory of U.S. Greenhouse Gas Emissions and Sinks:1990–2014. EPA 430-R-16-002; U.S. Environmental Protection Agency: Washington, DC, USA, 2016.
  4. Cao, Y.; Pawłowski, A. Biomass as an answer to sustainable energy. Opportunity versus challenge. Environ. Prot. Eng. 2013, 1, 153–161. [Google Scholar] [CrossRef]
  5. Huisingh, D.; Zhang, Z.; Moore, J.C.; Qiao, Q.; Li, Q. Recent advances in carbon emissions reduction: Policies, technologies, monitoring, assessment and modeling. J. Clean. Prod. 2015, 103, 1–12. [Google Scholar] [CrossRef]
  6. Mohammadi, M.; Ghasempour, R.; Astaraei, F.; Ahmadi, E.; Aligholian, A.; Toopshekan, A. Optimal planning of renewable energy resource for a residential house considering economic and reliability criteria. Int. J. Electr. Power 2018, 96, 261–273. [Google Scholar] [CrossRef]
  7. Wan Alwi, S.R.; Klemeš, J.J.; Varbanov, P.S. Cleaner energy planning, management and technologies: Perspectives of supply-demand side and end-of-pipe management. J. Clean. Prod. 2016, 136, 1–13. [Google Scholar] [CrossRef]
  8. Couto, E.; Calijuri, M.L.; Assemany, P.; Fonseca Santiago, A.; Lopes, L. Greywater treatment in airports using anaerobic filter followed by UV disinfection: An efficient and low cost alternative. J. Clean. Prod. 2015, 106, 372–379. [Google Scholar] [CrossRef]
  9. UN. World Population Prospects: The 2017 Revision. Population Division. ESA/P/WP/248; United Nations, Department of Economic and Social Affairs: New York, NY, USA, 2017. [Google Scholar]
  10. WWAP (United Nations World Water Assessment Programme). The United Nations World Water Development Report 2015: Water for a Sustainable World; UNESCO: Paris, France, 2015. [Google Scholar]
  11. Salvadore, E.; Bronders, J.; Batelaan, O. Hydrological modelling of urbanized catchments: A review and future directions. J. Hydrol. 2015, 529, 62–81. [Google Scholar] [CrossRef]
  12. United Nations, Department of Economic and Social Affairs, Population Division. World Urbanization Prospects: The 2014 Revision, Highlights; United Nation: New York, NY, USA, 2015. [Google Scholar]
  13. Oudin, L.; Salavati, B.; Furusho-Percot, C.; Ribstein, P.; Saadi, M. Hydrological impacts of urbanization at the catchment scale. J. Hydrol. 2018, 559, 774–786. [Google Scholar] [CrossRef] [Green Version]
  14. Chang, N.; Lu, J.; Chui, T.; Hartshorn, N. Global policy analysis of low impact development for stormwater management in urban regions. Land Use Policy 2018, 70, 368–383. [Google Scholar] [CrossRef]
  15. Eckart, K.; McPhee, Z.; Bolisetti, T. Performance and implementation of low impact development—A review. Sci. Tot. Environ. 2017, 607–608, 413–432. [Google Scholar] [CrossRef] [PubMed]
  16. Liu, Y.; Ahiablame, L.M.; Bralts, V.F.; Engel, B.A. Enhancing a rainfall-runoff model to assess the impacts of BMPs and LID practices on storm runoff. J. Environ. Manag. 2015, 147, 12–23. [Google Scholar] [CrossRef] [PubMed]
  17. Rose, S.; Peters, N.E. Effects of urbanization on streamflow in the Atlanta area (Georgia, USA): A comparative hydrological approach. Hydrol. Process. 2001, 15, 1441–1457. [Google Scholar] [CrossRef]
  18. Fletcher, T.D.; Andrieu, H.; Hamel, P. Understanding, management and modelling of urban hydrology and its consequences for receiving waters: A state of the art. Adv. Water Resour. 2013, 51, 261–279. [Google Scholar] [CrossRef]
  19. Słyś, D.; Stec, A. Effect of development of the town of Przemysl on operation of its sewerage system. Ecol. Chem. Eng. S 2013, 20, 381–396. [Google Scholar] [CrossRef]
  20. Stovin, V.R.; Moore, S.L.; Wall, M.; Ashley, R.M. The potential to retrofit sustainable drainage systems to address combined sewer overflow discharges in the Thames Tideway catchment. Water Environ. J. 2013, 27, 216–228. [Google Scholar] [CrossRef]
  21. Deng, X.; Zhao, C.; Yan, H. Systematic modeling of impacts of land use and land cover changes on regional climate: A review. Adv. Meteorol. 2013, 2013. [Google Scholar] [CrossRef]
  22. Al-Kodmany, K. Sustainability and the 21st Century Vertical City: A Review of Design Approaches of Tall Buildings. Buildings 2018, 8, 102. [Google Scholar] [CrossRef]
  23. Zhang, X.; Bayulken, B.; Skitmore, M.; Lu, W.; Huisingh, D. Sustainable urban transformations towards smarter, healthier cities: Theories, agendas and pathways. J. Clean. Prod. 2018, 173, 1–10. [Google Scholar] [CrossRef] [Green Version]
  24. Childers, D.L.; Cadenasso, M.L.; Grove, J.; Marshall, V.; McGrath, B.; Pickett, S. An Ecology for Cities: A Transformational Nexus of Design and Ecology to Advance Climate Change Resilience and Urban Sustainability. Sustainability 2015, 7, 3774–3791. [Google Scholar] [CrossRef] [Green Version]
  25. Pedersen Zari, M. Biomimetic Urban Design: Ecosystem Service Provision of Water and Energy. Buildings 2017, 7, 21. [Google Scholar] [CrossRef]
  26. Gurgun, A.P.; Arditi, D. Assessment of Energy Credits in LEED-Certified Buildings Based on Certification Levels and Project Ownership. Buildings 2018, 8, 29. [Google Scholar] [CrossRef]
  27. Lü, X.; Lu, T.; Kibert, C.J.; Viljanen, M. Modeling and forecasting energy consumption for heterogeneous buildings using a physical-statistical approach. Appl. Energy 2015, 144, 261–275. [Google Scholar] [CrossRef]
  28. EU. EU Energy in Figures. Statistical Pocketbook; European Commission: Brussels, Belgium, 2016. [Google Scholar]
  29. Gou, Z.; Prasad, D.; Siu-Yu Lau, S. Are green buildings more satisfactory and comfortable? Habitat Int. 2013, 39, 156–161. [Google Scholar] [CrossRef]
  30. US EPA. Definition of Green Building US; Environmental Protection Agency: Washington, DC, USA, 2009.
  31. Diamond, R.C.; Ye, Q.; Feng, W.; Yan, T.; Mao, H.; Li, Y.; Guo, Y.; Wang, J. Sustainable Building in China—A Green Leap Forward? Buildings 2013, 3, 639–658. [Google Scholar] [CrossRef]
  32. Hwang, B.G.; Tan, J.S. Green building project management: Obstacles and solutions for sustainable development. Sustain. Dev. 2012, 20, 335–349. [Google Scholar] [CrossRef]
  33. Shealy, T. Do sustainable buildings inspire more sustainable buildings? Procedia Eng. 2016, 145, 412–419. [Google Scholar] [CrossRef]
  34. Maruejols, L.; Ryan, D.L.; Young, D. Eco-houses and the environment: A case study of occupant experiences in a cold climate. Energy Build. 2013, 62, 368–380. [Google Scholar] [CrossRef]
  35. Volf, M.; Lupíšek, A.; Bureš, M.; Nováček, J.; Hejtmánek, P.; Tywoniak, J. Application of building design strategies to create an environmentally friendly building envelope for nearly zero-energy buildings in the central European climate. Energy Build. 2018, 165, 35–46. [Google Scholar] [CrossRef]
  36. Gou, Z. Human Factors in Green Building: Building Types and Users’ Needs. Buildings 2019, 9, 17. [Google Scholar] [CrossRef]
  37. Dahy, H. Materials as a Design Tool’ Design Philosophy Applied in Three Innovative Research Pavilions Out of Sustainable Building Materials with Controlled End-Of-Life Scenarios. Buildings 2019, 9, 64. [Google Scholar] [CrossRef]
  38. Matias, J.C.O.; Santos, R.; Abreu, A. A Decision Support Approach to Provide Sustainable Solutions to the Consumer, by Using Electrical Appliances. Sustainability 2019, 11, 1143. [Google Scholar] [CrossRef]
  39. Abd-ur-Rehman, H.M.; Al-Sulaiman, F.A.; Mehmood, A.; Shakir, S.; Umer, M. The potential of energy savings and the prospects of cleaner energy production by solar energy integration in the residential buildings of Saudi Arabia. J. Clean. Prod. 2018, 183, 1122–1130. [Google Scholar] [CrossRef]
  40. Vieira, A.S.; Stewart, R.A.; Beal, C.D. Air source heat pump water heaters in residential buildings in Australia: Identification of key performance parameters. Energy Build. 2015, 91, 148–162. [Google Scholar] [CrossRef] [Green Version]
  41. Rivoire, M.; Casasso, A.; Piga, B.; Sethi, R. Assessment of Energetic, Economic and Environmental Performance of Ground-Coupled Heat Pumps. Energies 2018, 11, 1941. [Google Scholar] [CrossRef]
  42. Xydis, G. Wind Energy Integration through District Heating. A Wind Resource Based Approach. Resources 2015, 4, 110–127. [Google Scholar] [CrossRef]
  43. Las-Heras-Casas, J.; López-Ochoa, L.M.; Paredes-Sánchez, J.P. Implementation of biomass boilers for heating and domestic hot water in multi-family buildings in Spain: Energy, environmental, and economic assessment. J. Clean. Prod. 2018, 176, 590–603. [Google Scholar] [CrossRef]
  44. Mazur, A. An assessment of the financial efficiency of a heat recovery system from graywater in a hotel. In Proceedings of the E3S Web of Conferences Volume 45—VI International Conference of Science and Technology INFRAEKO 2018 Modern Cities, Infrastructure and Environment, Krakow, Poland, 7–8 June 2018; p. 00051. [Google Scholar] [CrossRef]
  45. Mazur, A. The impact of using of a DWHR heat exchanger on operating costs for a heat water preparation system and the amount of carbon dioxide emissions entering the atmosphere. In Proceedings of the E3S Web of Conferences Volume 45—VI International Conference of Science and Technology INFRAEKO 2018 Modern Cities, Infrastructure and Environment, Krakow, Poland, 7–8 June 2018; p. 00052. [Google Scholar] [CrossRef]
  46. Kordana, S.; Pochwat, K.; Słyś, D.; Starzec, M. Opportunities and threats of implementing drain water heat recovery units in Poland. Resources 2019, 8, 88. [Google Scholar] [CrossRef]
  47. Kretschmer, F.; Neugebauer, G.; Stoeglehner, G.; Ertl, T. Participation as a Key Aspect for Establishing Wastewater as a Source of Renewable Energy. Energies 2018, 11, 3232. [Google Scholar] [CrossRef]
  48. Mazhar, A.R.; Liu, S.; Shukla, A. A Key Review of Non-Industrial Greywater Heat Harnessing. Energies 2018, 11, 386. [Google Scholar] [CrossRef]
  49. Willis, R.M.; Stewart, R.A.; Giurco, D.P.; Talebpour, M.R.; Mousavinejad, A. End use water consumption in households: Impact of socio-demographic factors and efficient devices. J. Clean. Prod. 2013, 60, 107–115. [Google Scholar] [CrossRef]
  50. Amos, C.C.; Rahman, A.; Mwangi Gathenya, J. Economic analysis and feasibility of rainwater harvesting systems in urban and peri-urban environments: A review of the global situation with a special focus on Australia and Kenya. Water 2016, 8, 149. [Google Scholar] [CrossRef]
  51. Bashar, M.; Karim, R.; Imteaz, M.A. Reliability and economic analysis of urban rainwater harvesting: A comparative study within six major cities of Bangladesh. Resour. Conserv. Recycl. 2018, 133, 146–154. [Google Scholar] [CrossRef]
  52. Vranayova, Z.; Kaposztasova, D.; Poorova, Z. Water management of “smart” buildings and cities. J. Civ. Eng. Environ. Arch. 2018, 65, 45–52. [Google Scholar] [CrossRef]
  53. Imteaz, M.A.; Matos, C.; Shanableh, A. Impacts of climatic variability on rainwater tank outcomes for an inland city, Canberra. Int. J. Hydrol. Sci. Technol. 2014, 4, 177–191. [Google Scholar] [CrossRef]
  54. Kaposztasova, D.; Vranayova, Z.; Markovic, G.; Purcz, P. Rainwater Harvesting, Risk Assessment and Utilization in Kosice-city, Slovakia. Procedia Eng. 2014, 89, 1500–1506. [Google Scholar] [CrossRef] [Green Version]
  55. García-Montoya, M.; Sengupta, D.; Nápoles-Rivera, F.; Ponce-Ortega, J.M.; El-Halwagi, M.M. Environmental and economic analysis for the optimal reuse of water in a residential complex. J. Clean. Prod. 2016, 130, 82–91. [Google Scholar] [CrossRef]
  56. Słyś, D.; Stec, A. The analysis of variants of water supply systems in multi-family residential building. Ecol. Chem. Eng. S 2014, 21, 623–635. [Google Scholar] [CrossRef]
  57. Stec, A.; Zeleňáková, M. An Analysis of the Effectiveness of Two Rainwater Harvesting Systems Located in Central Eastern Europe. Water 2019, 11, 458. [Google Scholar] [CrossRef]
  58. Imteaz, M.A.; Ahsan, A.; Shanableh, A. Reliability analysis of rainwater tanks using daily water balance model: Variations within a large city. Resour. Conserv. Recycl. 2013, 77, 37–43. [Google Scholar] [CrossRef]
  59. Jeong, H.; Broesicke, O.A.; Drew, B.; Crittenden, J.C. Life cycle assessment of small-scale greywater reclamation systems combined with conventional centralized water systems for the City of Atlanta, Georgia. J. Clean. Prod. 2018, 174, 333–342. [Google Scholar] [CrossRef]
  60. Leong, J.Y.C.; Oh, K.S.; Poh, P.E.; Chong, M.N. Prospects of hybrid rainwater-greywater decentralised system for water recycling and reuse: A review. J. Clean. Prod. 2017, 142, 3014–3027. [Google Scholar] [CrossRef]
  61. Walczykiewicz, T. Scenarios of Water Resources Development in Poland up to 2030. Water Resour. 2014, 41, 763–773. [Google Scholar] [CrossRef]
  62. Morales-Pinzón, T.; Rieradevall, J.; Gasol, C.M.; Gabarrell, X. Modelling for economic cost and environmental analysis of rainwater harvesting systems. J. Clean. Prod. 2015, 87, 613–626. [Google Scholar] [CrossRef]
  63. Ramadan, M.; Lemenand, T.; Khaled, M. Recovering heat from hot drain water—Experimental evaluation, parametric analysis and new calculation procedure. Energy Build. 2016, 128, 575–582. [Google Scholar] [CrossRef]
  64. Słyś, D.; Kordana, S. Financial analysis of the implementation of a Drain Water Heat Recovery unit in residential housing. Energy Build. 2014, 71, 1–11. [Google Scholar] [CrossRef]
  65. Chudzicki, J.; Sosnowski, S. Instalacje Wodociągowe: Projektowanie, Wykonanie, Eksploatacja (Water Supply Systems: Design, Construction, Operation), 2nd ed.; Seidel-Przywecki Sp.: Warszawa, Poland, 2009. [Google Scholar]
  66. Słyś, D. Potential of rainwater utilization in residential housing in Poland. Water Environ. J. 2009, 23, 318–325. [Google Scholar] [CrossRef]
  67. Bayrak, F.; Ertürk, G.; Oztop, H.F. Effects of partial shading on energy and exergy efficiencies for photovoltaic panels. J. Clean. Prod. 2017, 164, 58–69. [Google Scholar] [CrossRef]
  68. Dávi, G.; Caamaño-Martín, E.; Rüther, R.; Solano, J. Energy performance evaluation of a net plus-energy residential building with grid-connected photovoltaic system in Brazil. Energy Buildings. 2016, 120, 19–29. [Google Scholar] [CrossRef] [Green Version]
  69. Pisarev, V. Alternatywne Źródła Energii—Instalacje z Pompami Ciepła (Alternative Energy Sources—Installations with Heat Pumps); Oficyna Wydawnicza Politechniki Rzeszowskiej: Rzeszów, Poland, 2012. [Google Scholar]
  70. Wiśniewski, W. Określenie Potencjału Energetycznego Regionów Polski w Zakresie Odnawialnych Źródeł Energii-Wnioski dla Regionalnych Programów Operacyjnych na Okres Programowania 2014–2020; Wydawnictwo Instytutu Energetyki Odnawialnej: Warszawa, Poland, 2011. [Google Scholar]
  71. Fidewicz, S. Wykorzystanie Ciepła Odpadowego Jako Działanie Proefektywnościowe w Dziedzinie Gospodarki Energetycznej (Exploitation of Waste Heat as Pro-Effectiveness Actions in the Field of Energy Management). Available online: http://ilabepro.polsl.pl/spep/raporty/energetyka-odpadowa/Fidewicz%20Sz.%20Ciep%C5%82o%20odpadowe%20w%20domu.pdf (accessed on 5 February 2019).
  72. Janowicz, L. Biomasa w Polsce. Energetyka I Ekologia 2006, 8, 601–604. [Google Scholar]
  73. Moschetii, R.; Brattebø, H. Combining Life Cycle Environmental and Economic Assessments in Building Energy Renovation Projects. Energies 2017, 10, 1851. [Google Scholar] [CrossRef]
  74. Fantozzi, F.; Gargari, C.; Rovai, M.; Salvadori, G. Energy Upgrading of Residential Building Stock: Use of Life Cycle Cost Analysis to Assess Interventions on Social Housing in Italy. Sustainability 2019, 11, 1452. [Google Scholar] [CrossRef]
  75. Fuller, S.; Petersen, S. Life Cycle Costing Manual for the Federal Energy Management Program/National Institute of Standards and Technology. NIST Handbook 135; U.S. Department of Energy: Washington, DC, USA, 1996. Available online: www.fire.nist.gov/bfrlpubs/build96/PDF/b96121.pdf.
  76. Spickova, M.; Myskova, R. Costs Efficiency Evaluation Using Life Cycle Costing as Strategic Method. Procedia Econ. Financ. 2015, 34, 337–343. [Google Scholar] [CrossRef]
  77. Bierer, A.; Götze, U.; Meynerts, L.; Sygulla, R. Integrating life cycle costing and life cycle assessment using extended material flow cost accounting. J. Clean. Prod. 2015, 108, 1289–1301. [Google Scholar] [CrossRef]
  78. DOE. Life Cycle Cost Handbook. Guidance for Life Cycle Cost Estimation and Analysis. Office of Acquisition and Project Management. U.S. Department of Energy: Washington, DC, USA, 2018. Available online: www.directives.doe.gov%2Fdirectives-documents%2F400-series%2F0413.3-EGuide-21A%2F%40%40images%2Ffile&usg=AOvVaw3IH9WzkaxdeQmJ8Edx59Qg (accessed on 21 June 2019).
  79. Rahman, A.; Keane, J.; Imteaz, A.M. Rainwater harvesting in Greater Sydney: Water savings, reliability and economic benefits. Resour. Conserv. Recycl. 2012, 61, 16–21. [Google Scholar] [CrossRef]
Figure 1. Location of the case study city in Poland.
Buildings 09 00180 g001
Figure 2. The concept of the analyzed environmentally friendly house.
Buildings 09 00180 g002
Figure 3. Diagram of system operation in Variant 0.
Buildings 09 00180 g003
Figure 4. Diagram of system operation in Variant 1.
Buildings 09 00180 g004
Figure 5. Diagram of system operation in Variant 2.
Buildings 09 00180 g005
Figure 6. Diagram of system operation in Variant 3.
Buildings 09 00180 g006
Figure 7. Diagram of system operation in Variant 4.
Buildings 09 00180 g007
Figure 8. Diagram of system operation in Variant 5.
Buildings 09 00180 g008
Figure 9. Diagram of system operation in Variant 6.
Buildings 09 00180 g009
Figure 10. Diagram of system operation in Variant 7.
Buildings 09 00180 g010
Figure 11. Energy demand for hot water heating and energy obtained from solar collectors.
Buildings 09 00180 g011
Figure 12. Monthly energy yields from PP installations [kWh] and solar radiation intensity [kWh/m2].
Buildings 09 00180 g012
Figure 13. The amount of INV capital expenditure depending on the installation variant for (a) Oc = 2 persons, (b) Oc = 4 persons, (c) Oc = 6 persons.
Buildings 09 00180 g013
Figure 14. The structure of operating costs incurred over a period of 25 years for a computational case: (a) Oc = 2 persons and lsh = 5 min/person/day, (b) Oc = 4 persons and lsh = 8 min/person/day, (c) Oc = 6 persons and lsh = 10 min/person/day.
Buildings 09 00180 g014
Figure 15. Graph of LCC ratio dependence on percentage changes of analyzed variables for the case: Oc = 4 persons and lsh = 8 min/person/day.
Buildings 09 00180 g015
Figure 16. Annual emission of CO2.
Buildings 09 00180 g016
Table 1. The amount of rainfall in the years 2003-2012 for Rzeszów city.
Year2003200420052006200720082009201020112012Average
Annual precipitation H, mm497761777600679737768973609552695
Table 2. Monthly insolation sums for the city of Rzeszów.
MonthSolar Irradiation (kWh/m2)
January24.4
February40.7
March81.4
April114
May140.7
June164
July162.8
August141.9
September98.9
October65.1
November27.9
December18.6
Table 3. Data used in the calculation of LCC costs.
ParameterParameter Value
Investments
The cost of purchasing and installing the GWRS INVGWRS3222 €, 3580 €, 4010 €
The cost of purchasing and installing the RWHS INVRWHS1670 €, 1790 €
The cost of purchasing and installing the SC INVSC1866–4765 €
The cost of purchasing and installing the PP INVPP3510–9788 €
The cost of purchasing and installing the AHP INVAHP9337–11.266 €
The cost of purchasing and installing the GHP INVGHP10128–11.994 €
The cost of purchasing and installing the WT INVWT3571 €, 3810 €, 4286 €, 4762 €
The cost of purchasing and installing the DWHR unit INVDWHR680 €
The cost of purchasing and installing the BB INVBB1310 €
The cost of purchasing and installing the sanitary systems INV01320 €
The cost of purchasing and installing the infiltration boxes in variants with GWRS or RWHS INVB120 €
The cost of purchasing and installing the infiltration boxes in Variant 0 INVB0478 €
The cost of making an installation of the floor heating in each variant4909 €
The cost of making a chimney with a flue pipe in Variant 0, 1, 72381 €
The cost of connection to the gas network in Variant 0595 €
The cost of making connections to the power grid in each variant357 €
The cost of purchasing and installing recuperation installations in each variant4286 €
The cost of purchasing and installing condensing gas boiler in Variant 01548 €
The cost of purchasing and installing water tank in Variant 0264–448 €
Operating costs
The annual increase in electricity prices (purchasing and selling) ie1.5%
The annual increase in gas prices ig2%
The annual increase in the prices of purchase of water from the water-pipe network iw6%
The annual increase in the prices of rainwater discharge to the sewage network ir3%
The annual increase in the prices of sanitary sewage discharge to the sewage system is6%
The annual increase in the prices of purchase wood iwd3%
The cost of filter change in GWRS after 10 years477 €, 549 €, 597 €
The cost of purchasing electricity in the year 0 ce0.139 €/kWh
The cost of purchasing gas in the year 0 cg0.488 €/m3
The cost of purchasing wood in the year 0 cw61.905 €/m3
The cost of selling electricity in the year 0 cse0.045 €/kWh
The cost of purchasing water from the water-pipe network in the year 0 cw1.076 €/m3
The cost of sanitary sewage discharge to the sewage network in the year 0 cs0.921 €/m3
The cost of the discharge of rainwater to the sewage network in the year 0 cr0.715 €/m3
The cost of purchasing wood for biomass boiler in the year 0 cwd50 €/m3
Other parameters
Analysis period T25 years
The discount rate r5%
Table 4. Data accepted for calculations for heating installations.
ParameterParameter Value
Biomass boiler efficiency0.84
Bifunctional, condensing gas boiler efficiency 0.94
The efficiency of a ground-source heat pump3.0
The efficiency of an air-to-water heat pump2.6
The efficiency of solar collectors0.64
The efficiency of the recuperator0.9
Projected external temperature−20 °C
Average annual external temperature for the Rzeszów-Jasionka meteorological station7.6 °C
Cold water temperature Twc9 °C
Daily hot water consumption for purposes other than showering dsh9 dm3/person/day
Density of water985.63–999.78 kg/m3
Hot water temperature Twh55 °C
Mixed water flow from the showerhead dwm8 dm3/min
Mixed water flow from washbasins and kitchen sink taps qwm’4 dm3/min
Mixed water temperature Twm40 °C
Shower length lsh5, 8, 10 min/person/day
Specific heat of water cp4176.5–4193.0 J/(kg·K)
The number of occupants Oc2, 4, 6 persons
Heat pump standby time (tank utilization time) tz8 h
Accumulation coefficient φ0.3
Table 5. Data accepted for calculations for electrical installations.
ParameterParameter Value
Electricity demand for lighting, household appliances1468–2698 kWh/year
Electricity demand for recuperator338 kWh/year
Electricity demand for auxiliary equipment for heating installations376–485 kWh/year
Efficiency of the solar module16.5%
Table 6. Data accepted for calculations for water and sewage installations.
ParameterParameter Value
Daily water consumption for garden watering dg1.25 dm3/m2/day
Daily water consumption for toilet flushing dtf35 dm3/person/day
Garden area Ga300 m2
Roof area Ra200 m2
Runoff coefficient Ψ0.9
Shower length lsh5, 8, 10 min/person/day
Soil infiltration rate kf10–4 m/s
Storage volume in GWRS VGWRS 250 dm3, 500 dm3, 750 dm3
Storage volume in RWHS VRWHS2.5 m3, 3.0 m3
The number of occupants Oc2, 4, 6 persons
Table 7. Financial analysis results.
Variantlsh = 5 min/Person/Daylsh = 8 min/Person/Daylsh = 10 min/Person/Day
INV
OC25
LCC
INV
OC25
LCC
INV
OC25
LCC
2 persons016.12921.56137.69016.12923.37439.50316.15824.60040.758
122.19110.94433.13522.21512.24234.45722.67112.97935.650
224.22012.82837.04824.24413.19237.43524.70013.40338.103
329.405837737.78130.830956240.39231.28610.26641.552
431.43310.26241.69532.85810.51243.37033.31410.61043.925
524.395976734.16224.59010.90835.49724.78411.60536.389
626.42411.65238.07626.61811.85738.47526.81211.95038.762
724.37212.89937.27124.97212.40037.37224.99612.57637.572
4 persons016.16129.24845.40916.23232.87449.10716.27535.32751.602
123.27415.57138.84523.94517.83241.77724.15019.51143.661
225.30315.72741.03026.33216.20442.53626.53716.68443.221
331.26213.42744.68931.97015.73447.70432.63917.20649.845
433.29113.58346.87434.35714.10648.46335.02614.31249.338
526.94714.23441.18128.09716.68444.78128.51517.98546.500
628.97614.39043.36630.48415.09645.58030.90215.15846.060
725.11115.59440.70526.24414.85341.09726.52415.08941.614
6 persons016.23236.93553.16716.27542.37558.65016.31346.05262.365
124.58619.92844.51425.13523.54548.68025.98525.73351.719
226.85418.61545.46927.40219.34846.75028.68219.68748.370
332.69916.98849.68833.51820.48153.99934.17422.75356.927
434.96715.67550.64235.78516.25752.04236.87116.69753.568
528.84418.62647.46931.27121.82753.09831.69024.39956.089
631.11117.30448.41433.53917.60351.14234.38618.39652.783
726.45317.81544.26827.19818.33945.53828.18018.67346.853
Table 8. Emission of pollutants over a period of 25 years.
Variantlsh = 5 min/Person/Daylsh = 8 min/Person/Daylsh = 10 min/Person/Day
SO2NOXCOCO2pyłSO2NOXCOCO2pyłSO2NOXCOCO2pył
kgkgKgkgkgkgkgkgkgkgkgkgkgkgkg
2 persons04971424269.798824971454374.511824971474477.75182
1171212516814125614230515045766147316055466
2211222520664136514430592045979150327210468
3000000000000000
4000000000000000
5701856275129825787471697257865816
675196666012107278951718110288981318
754129274933412011924151416012425158434
4 persons06361845592.8871056361915710.23131056361955810.8794105
1621513256974845416835498455192192418453606
26415232589048560170365561552103195429416608
30000022621949460155534110
40000028722526571185630312
512030910.69220176441315.6662917344131547429
612231910.88520182461416.2443018447141643630
760144305525461014128180495014930189520
6 persons077622767115.97612877623670130.11612877624272139.834129
1651693559515451162084510.5766441092234710.006701
2621683557595451202094510.9616451182254810.776702
3000000000000000
4000000000000000
5169431315.11628188481416.79831250631922.28741
6167421314.92428193491517.18332258652023.05743
7014329181500015932202558017034216594

