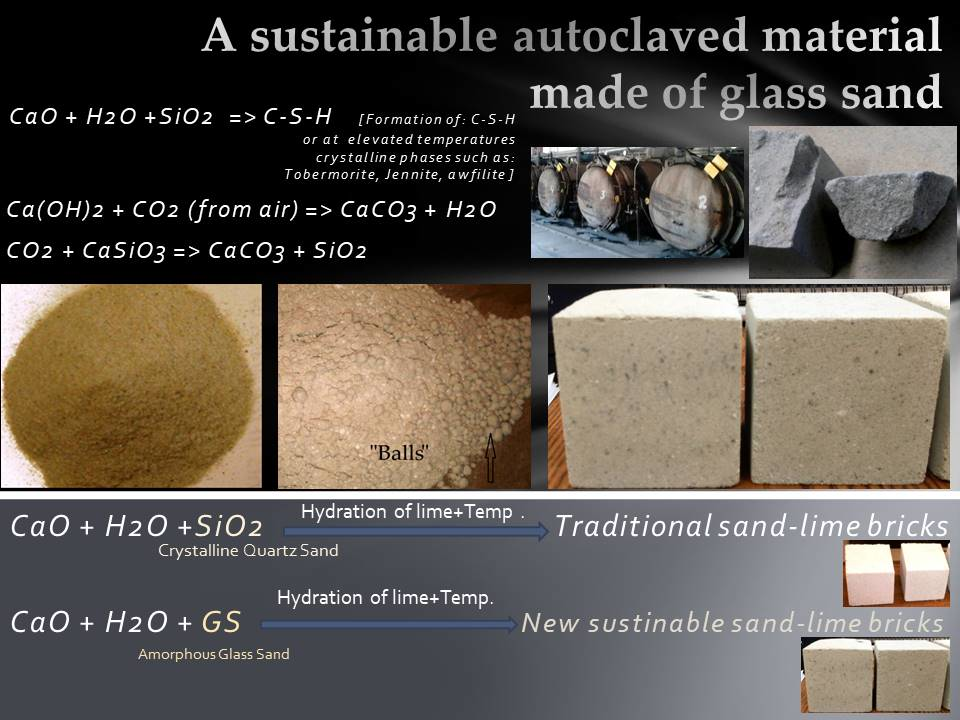
A Sustainable Autoclaved Material Made of Glass Sand


Abstract

1. Introduction
2. Methodology, Hydrothermal Conditions, and the Laboratory Tests
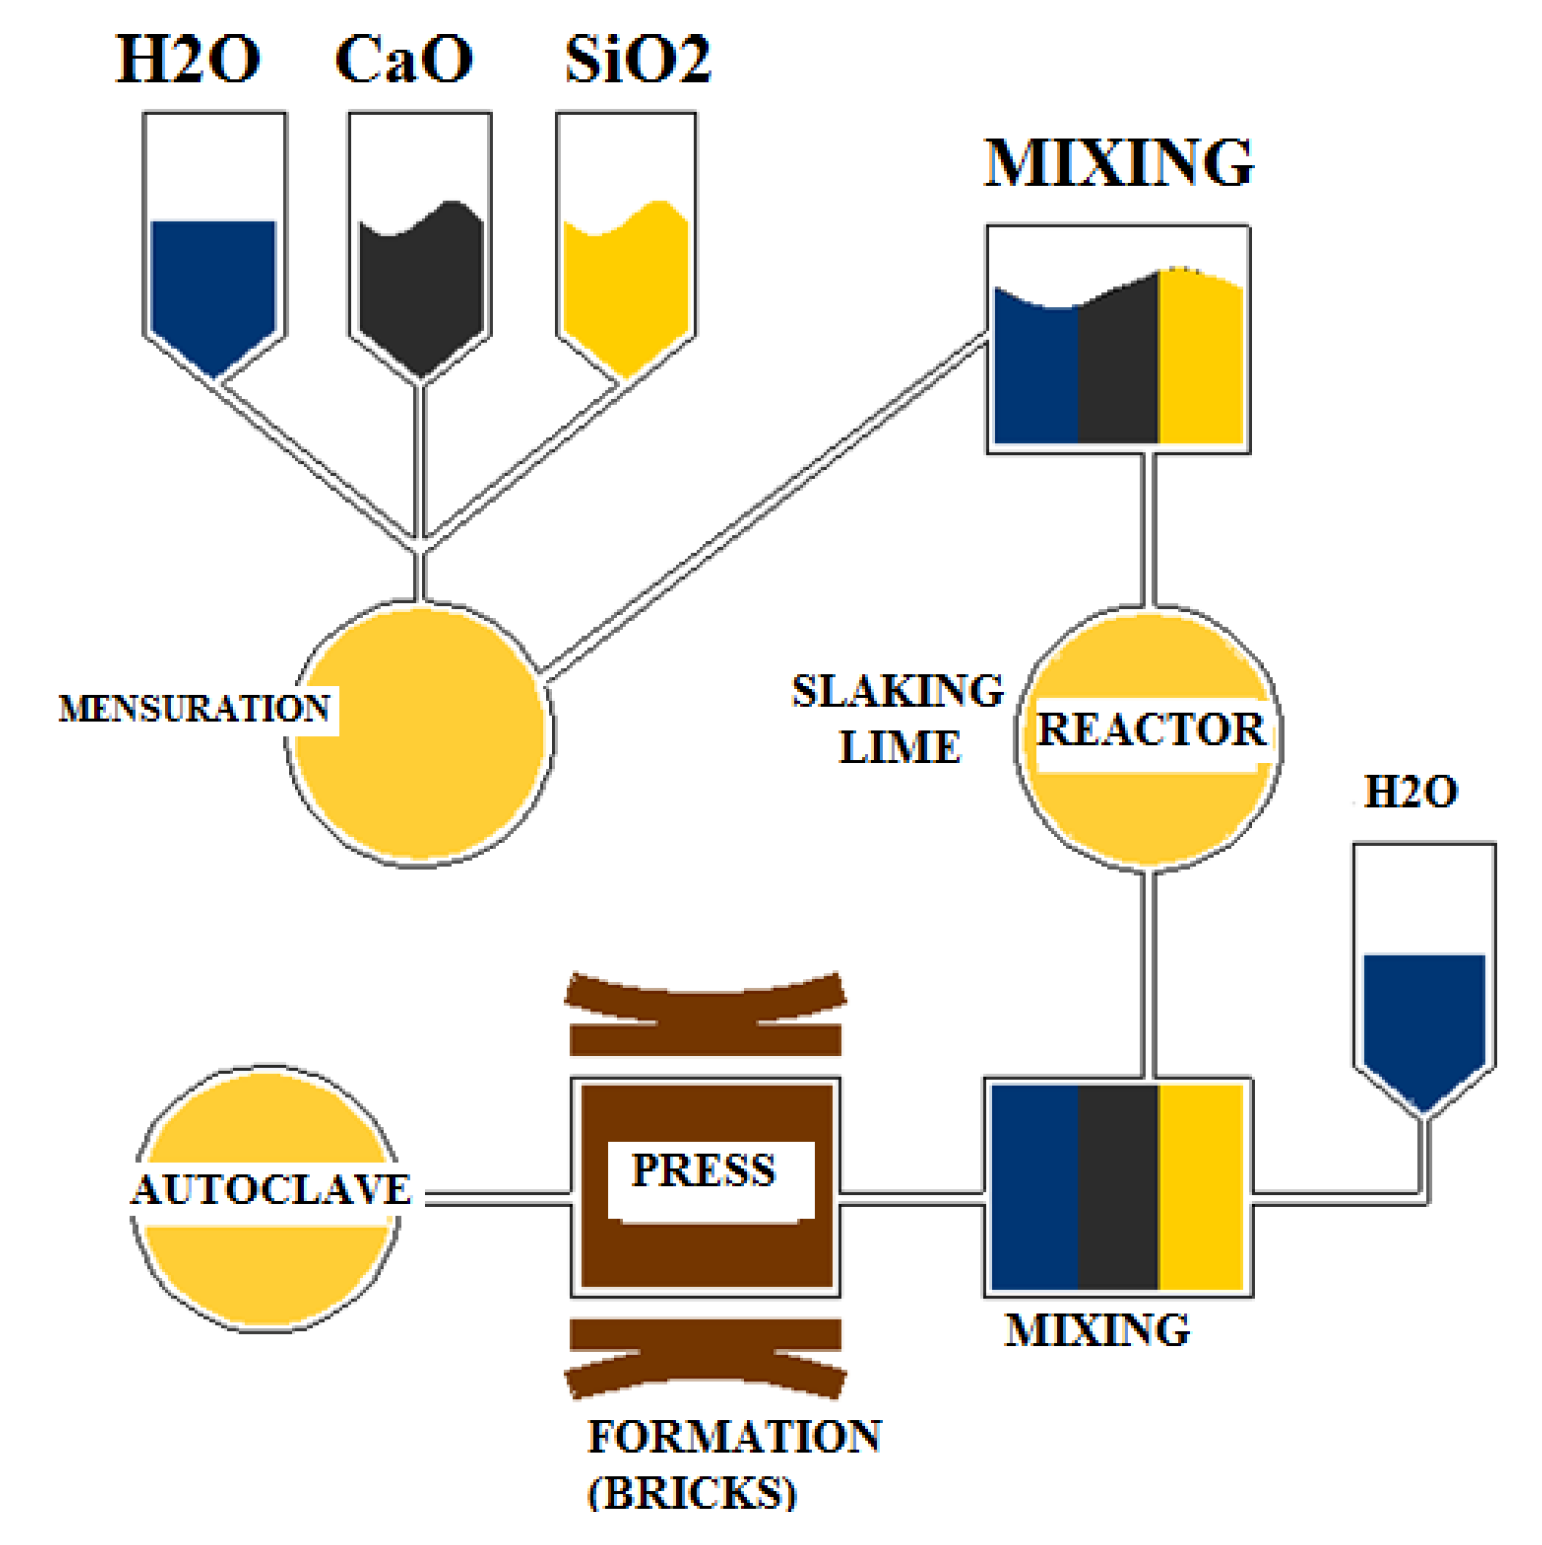
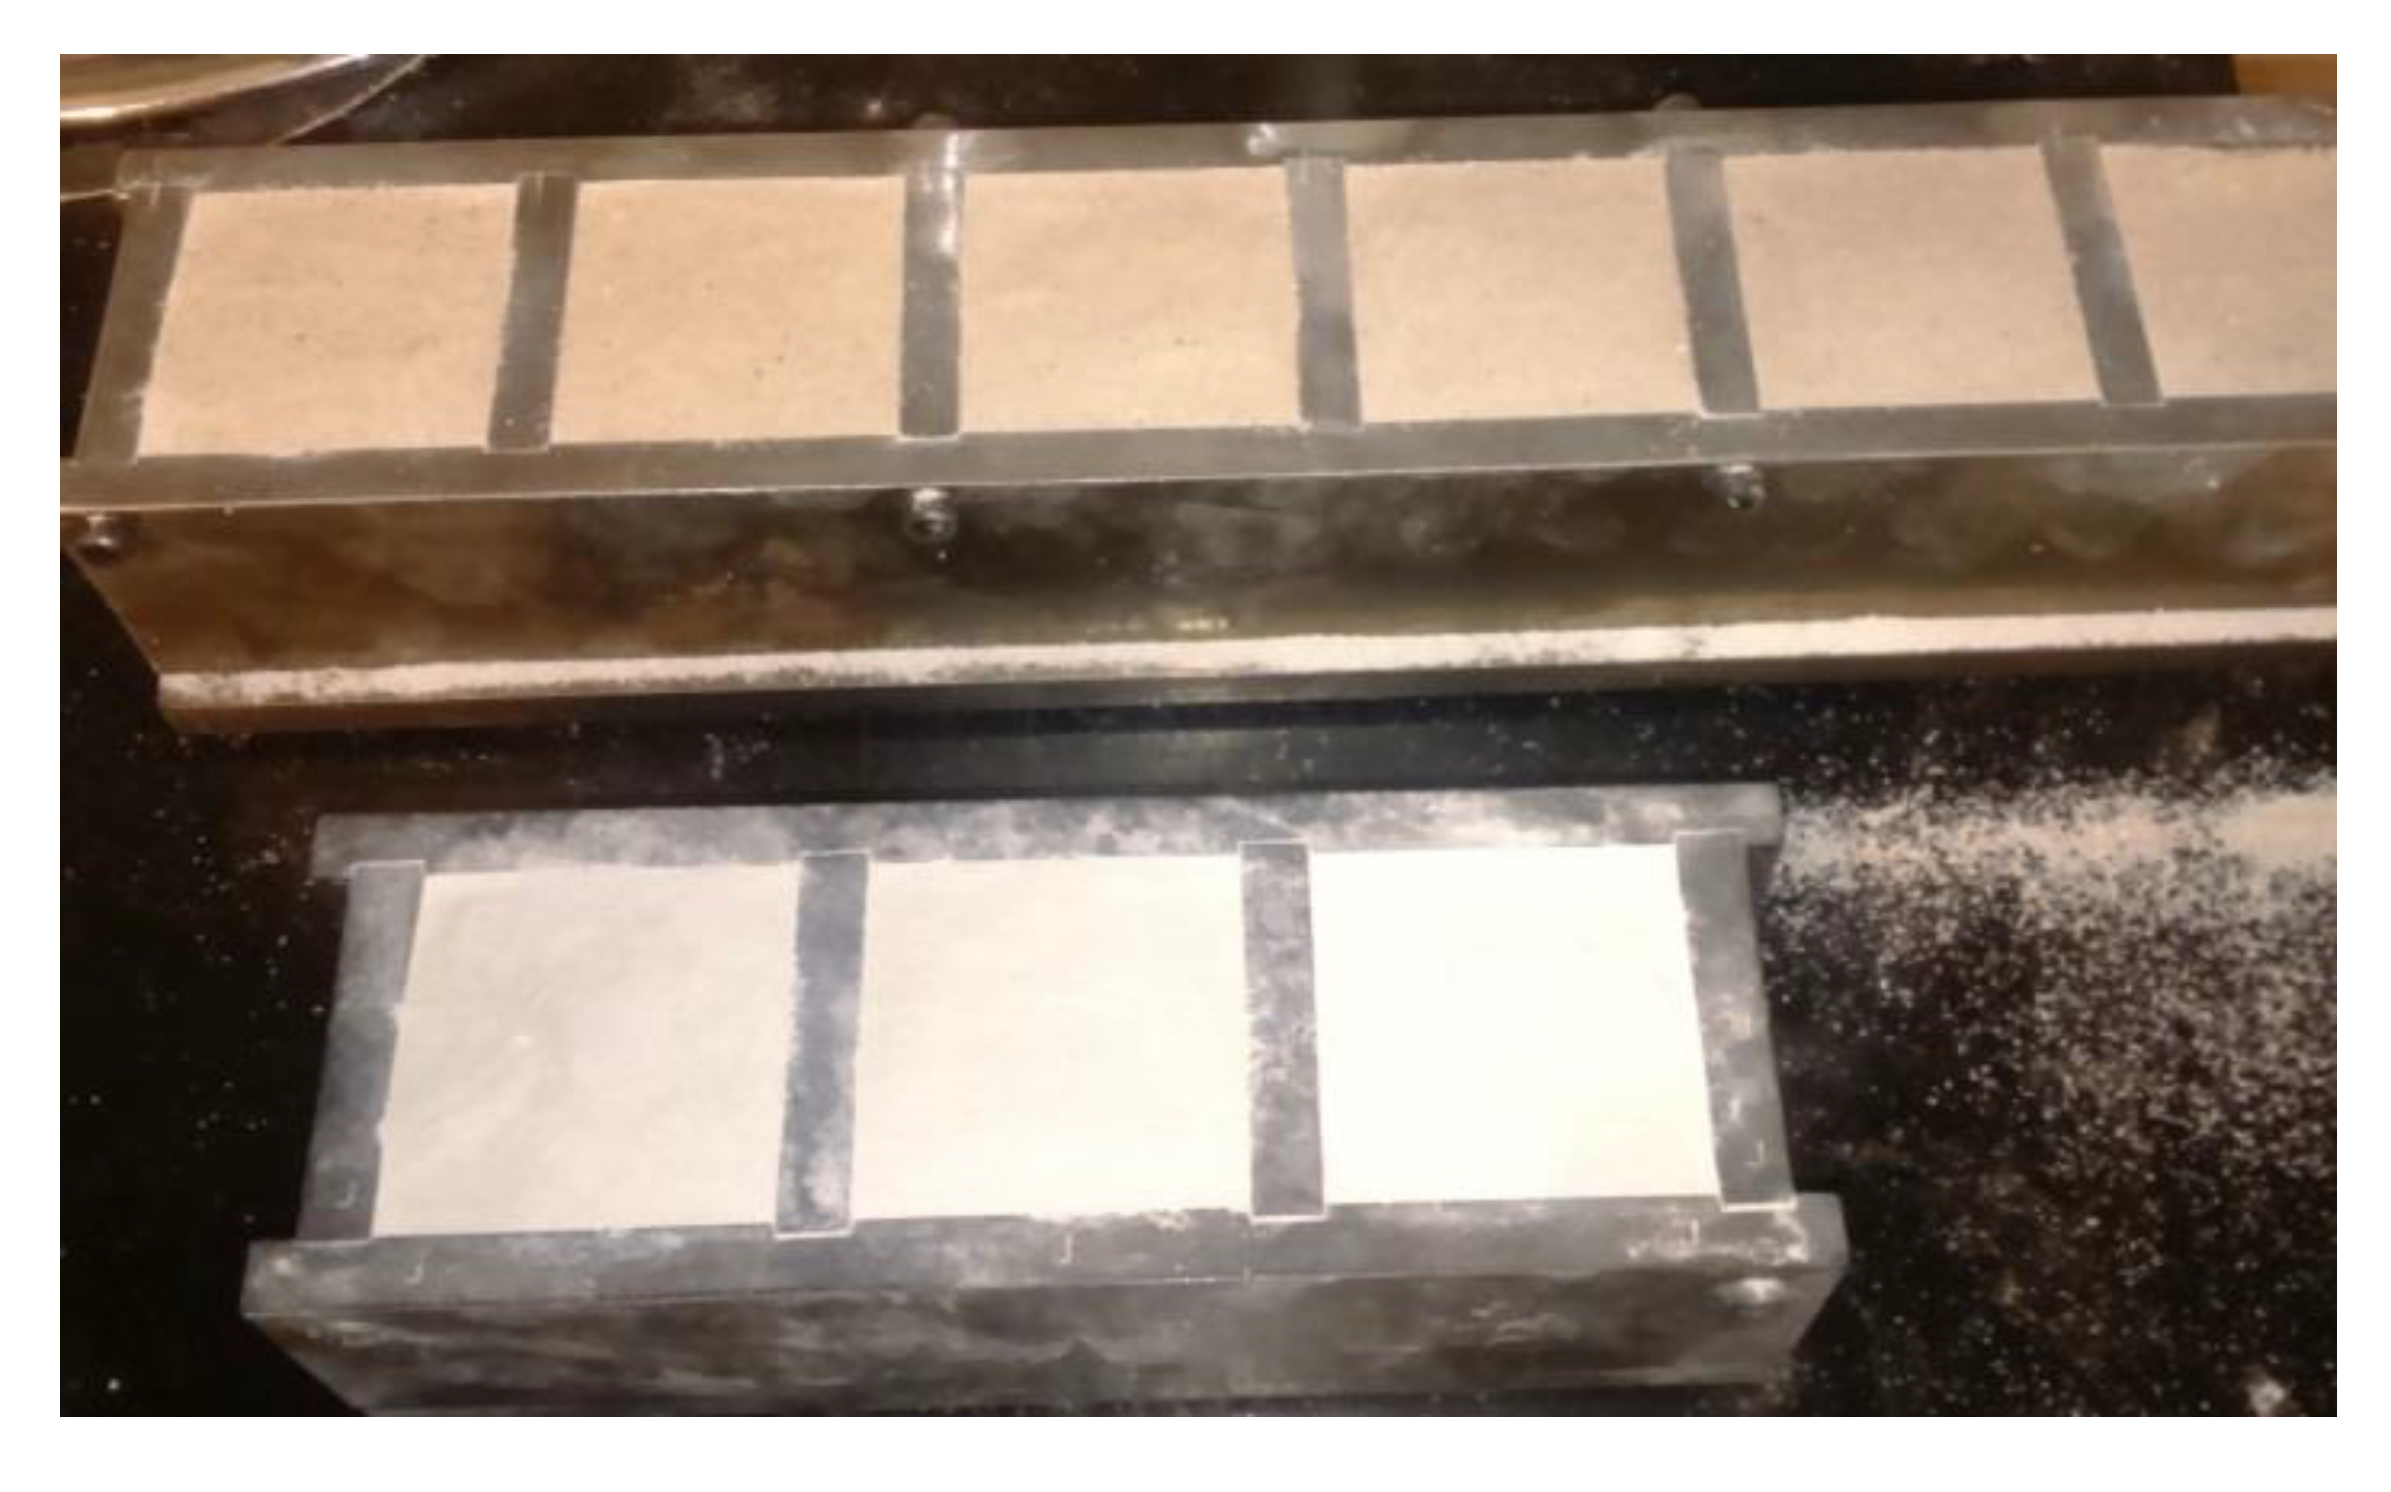
2.1. Sand–Lime Mixture
2.2. Hydrothermal Conditions
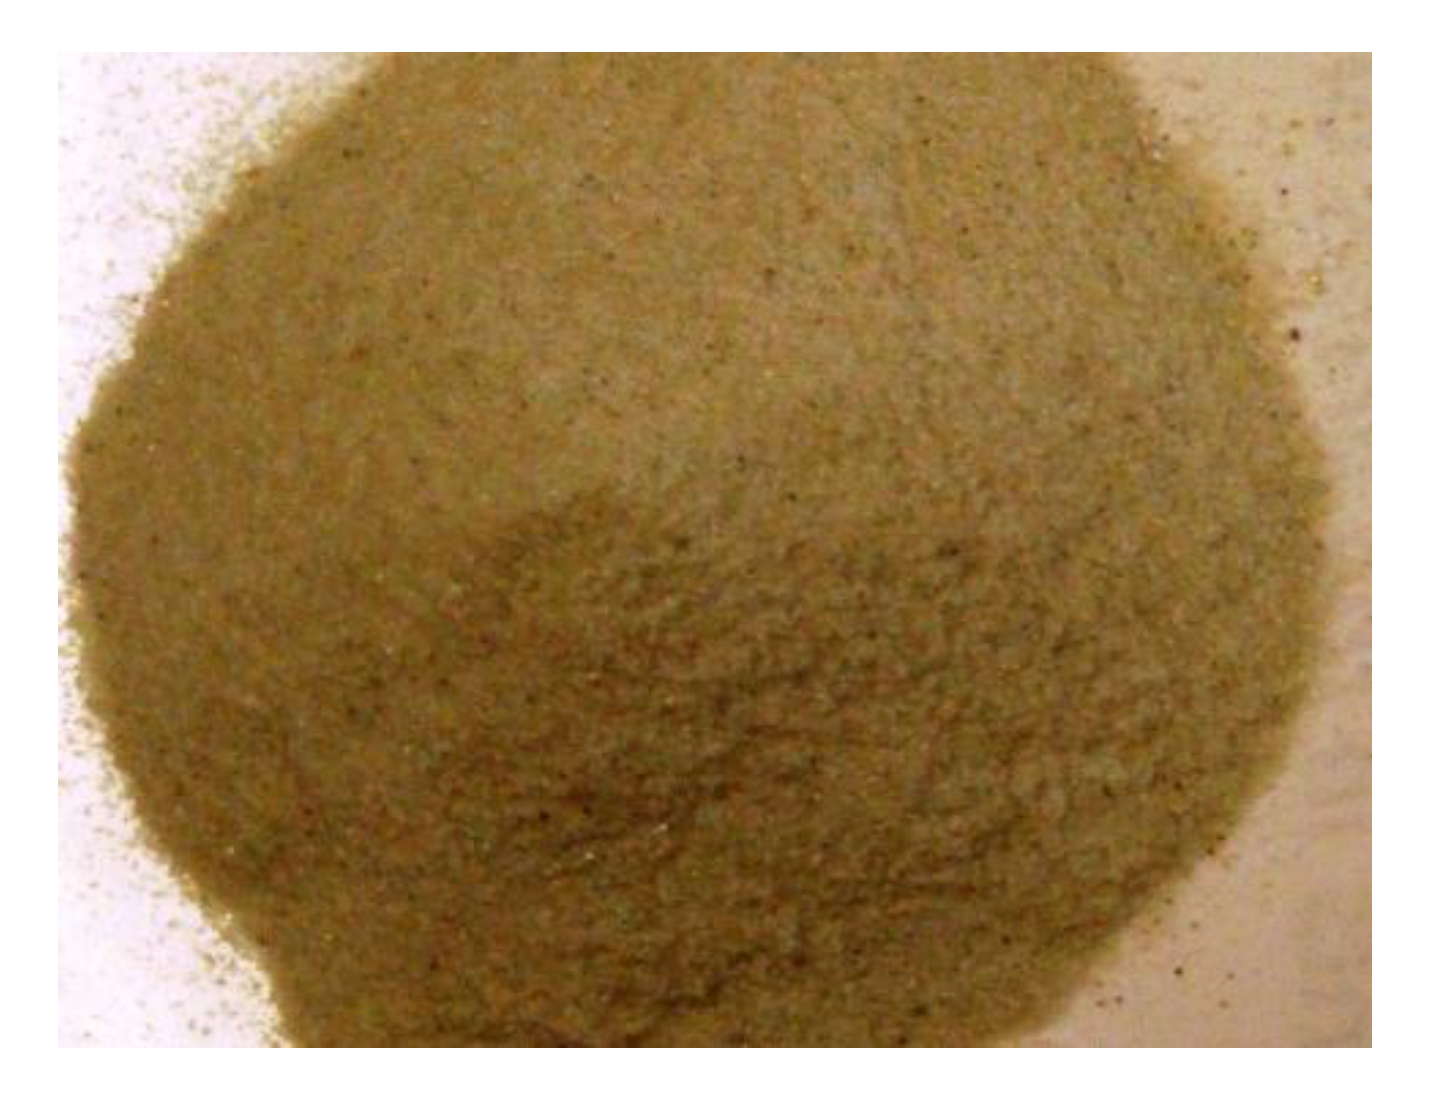
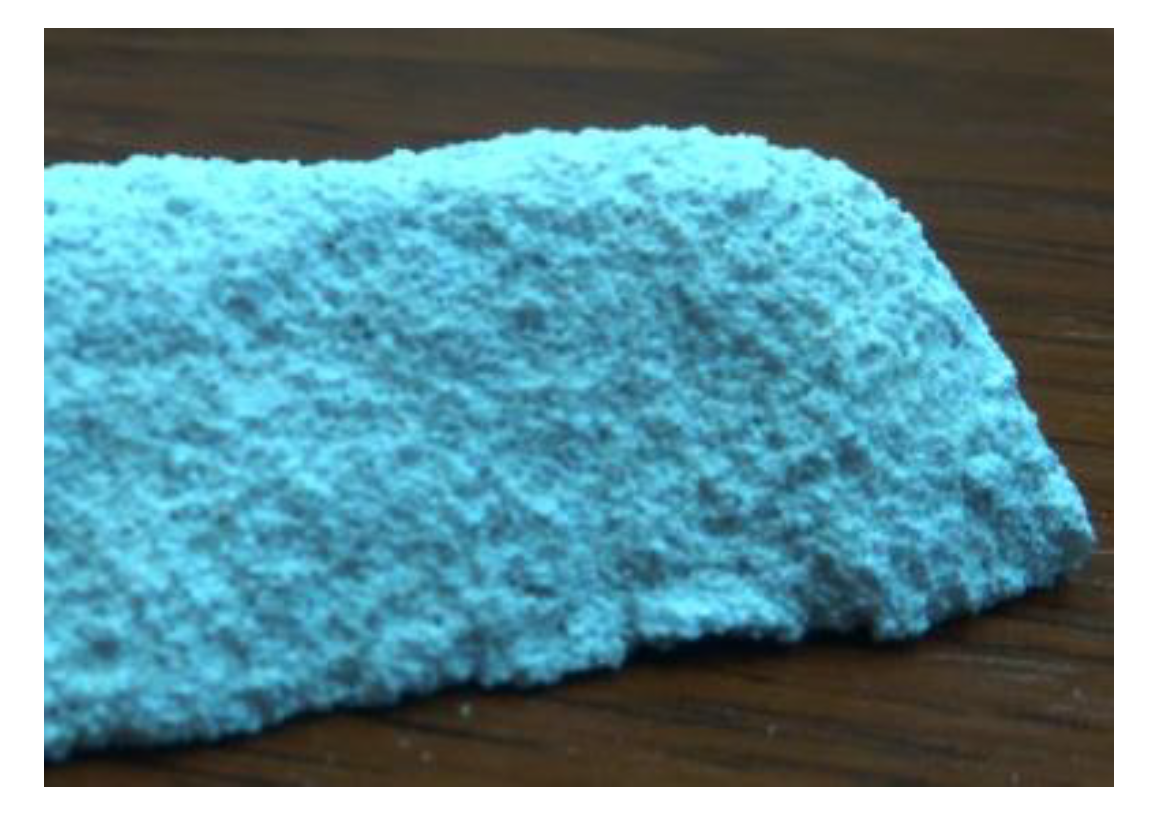
2.3. Materials: Glass Sand Characteristics
- -
- the strength of sand–lime bricks depends on the temperature of the reaction between lime and sand (CaO + SiO2), the quality of lime and sand, and the pressing process (compression);
- -
- the amount of water depends on the moisture content of the sand;
- -
- an activity CaO which is not less than 89.90%;
- -
- SiO2 sand containing at least 92% silica;
- -
- the reaction temperature between CaO, SiO2, and H2O should be 60–70 °C (and for quartz sand, this temperature is reached);
- -
- compression of the fresh mass: 1.6–2.5 MPa;
- -
- the temperature inside the autoclave (200 °C);
- -
- the pressure inside the autoclave: 1.5–1.6 MPa.
3. Results
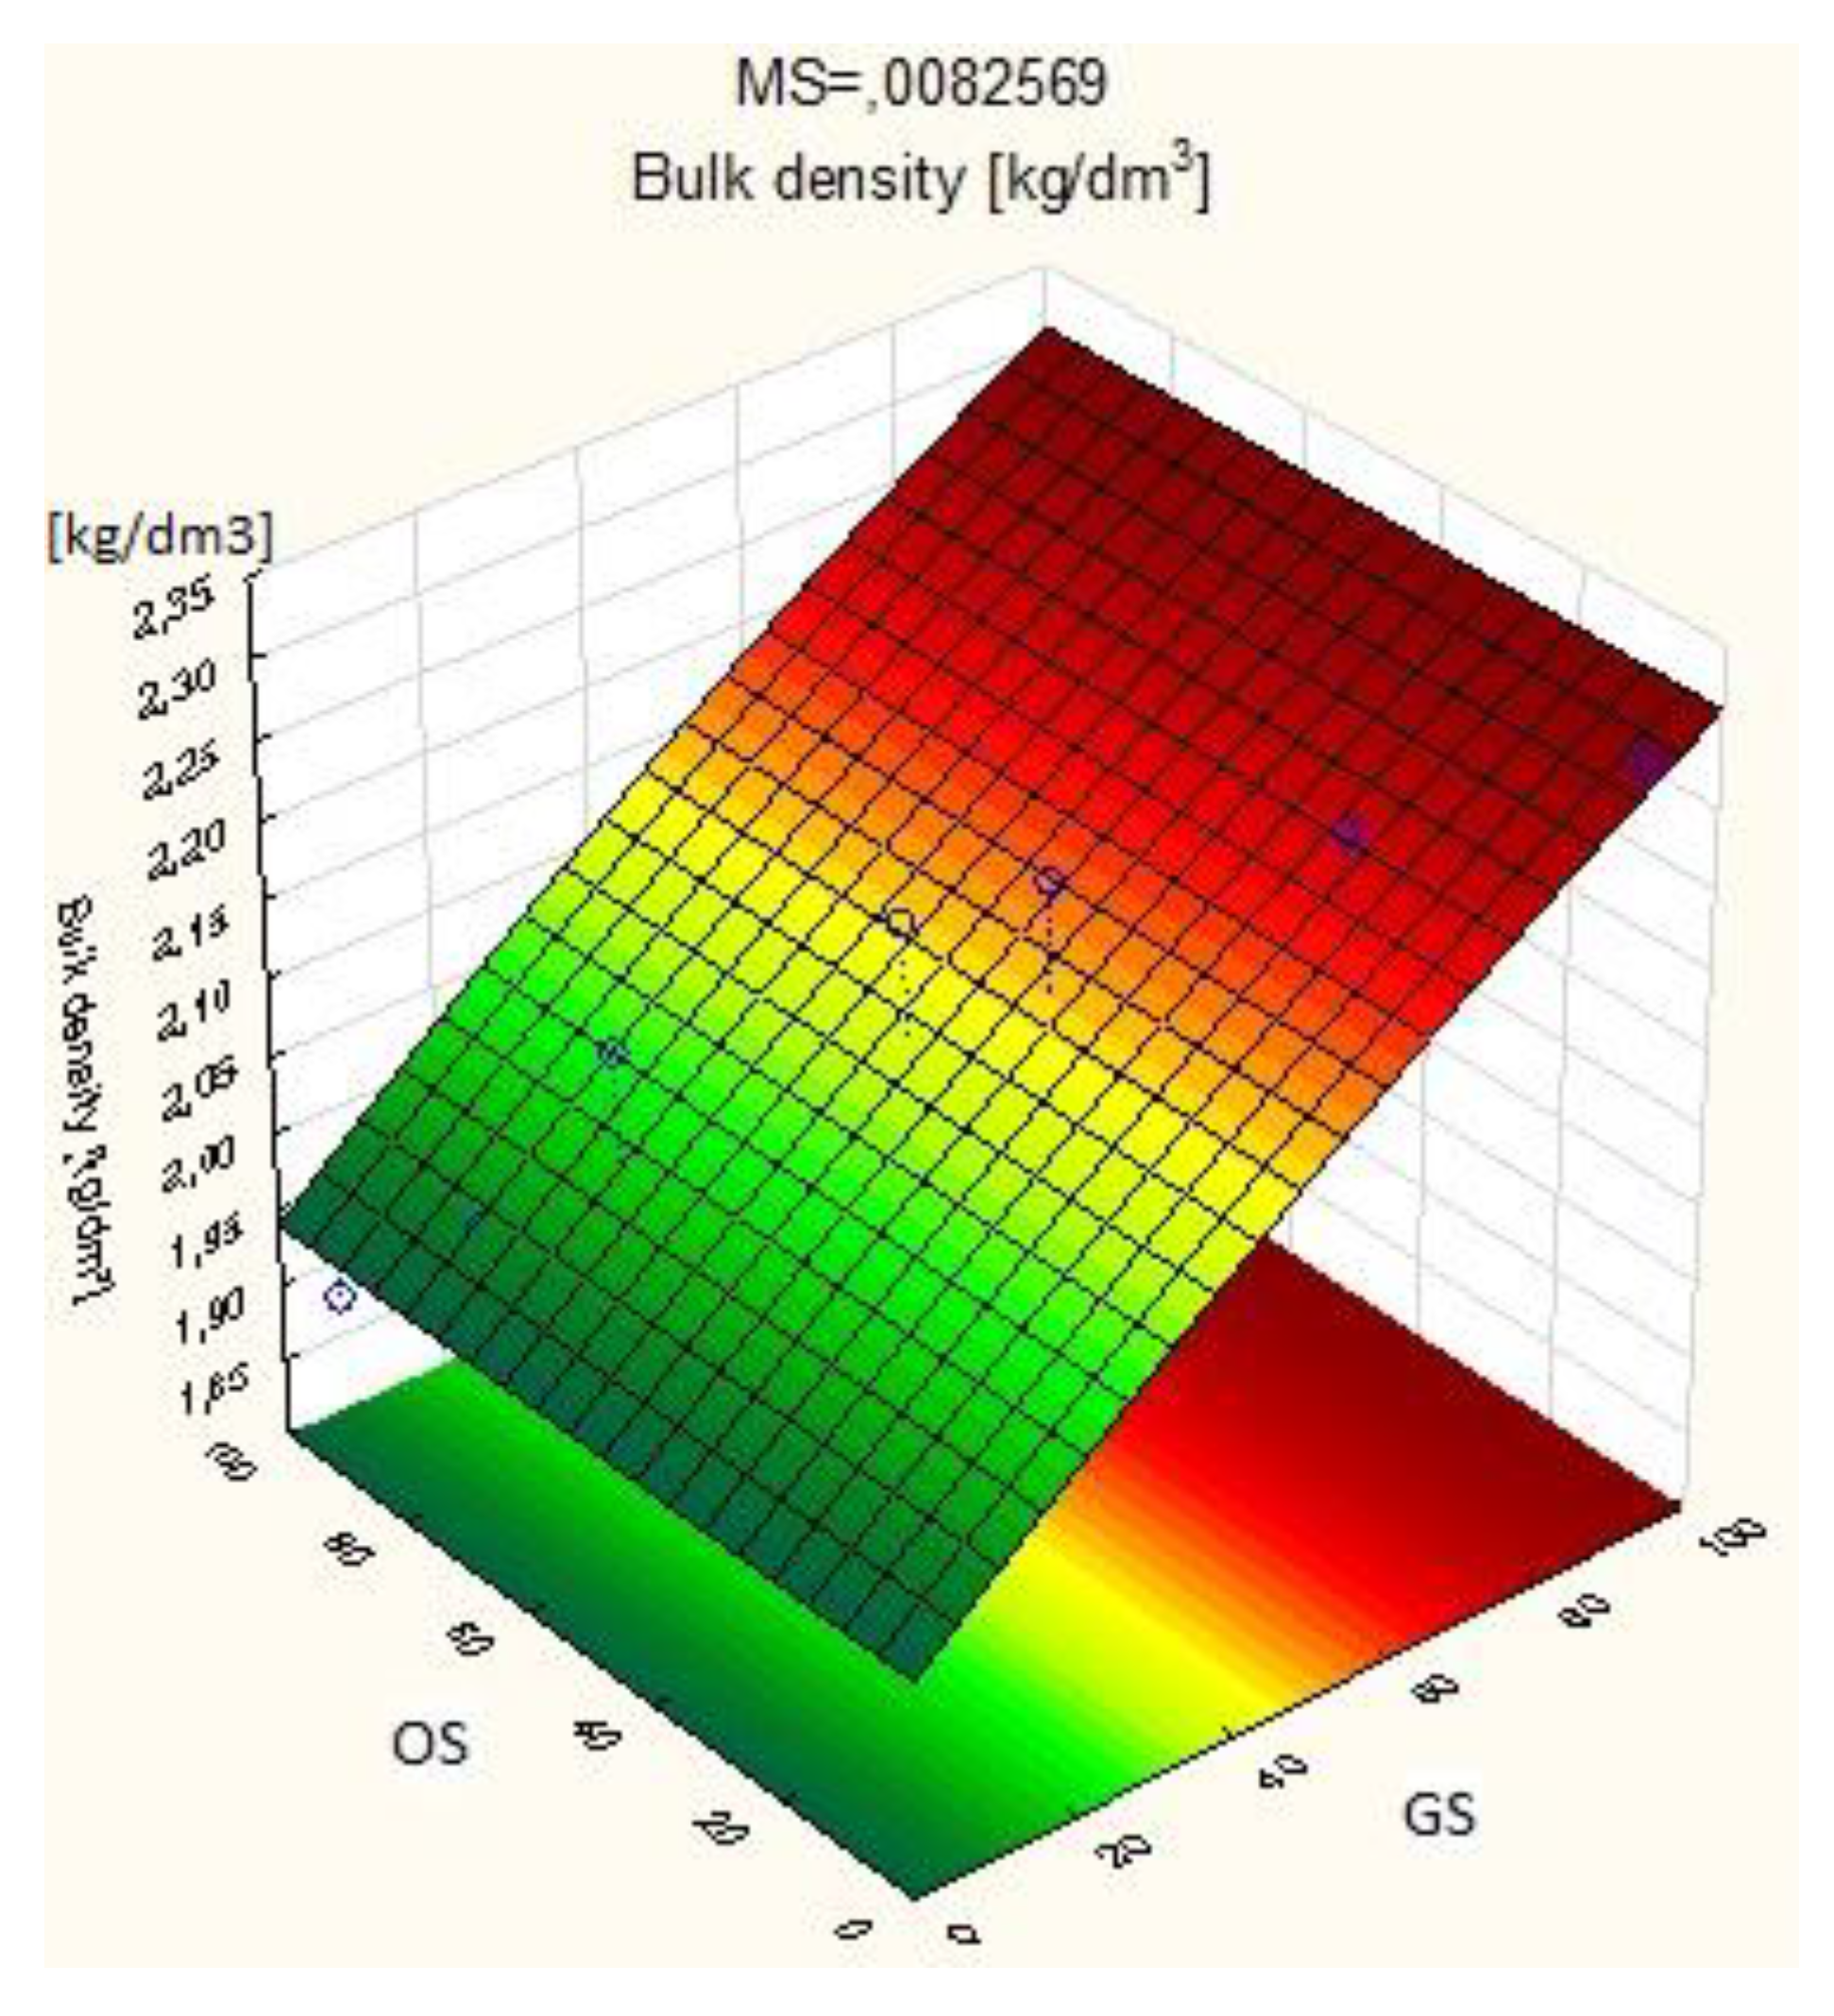
- o—bulk density,
- ms—the mass of the dry sample;
- vo—the volume of the sample
- nw—impregnability of weight;
- mn—the weight of the wet samples;
- m—the weight of the dry samples.
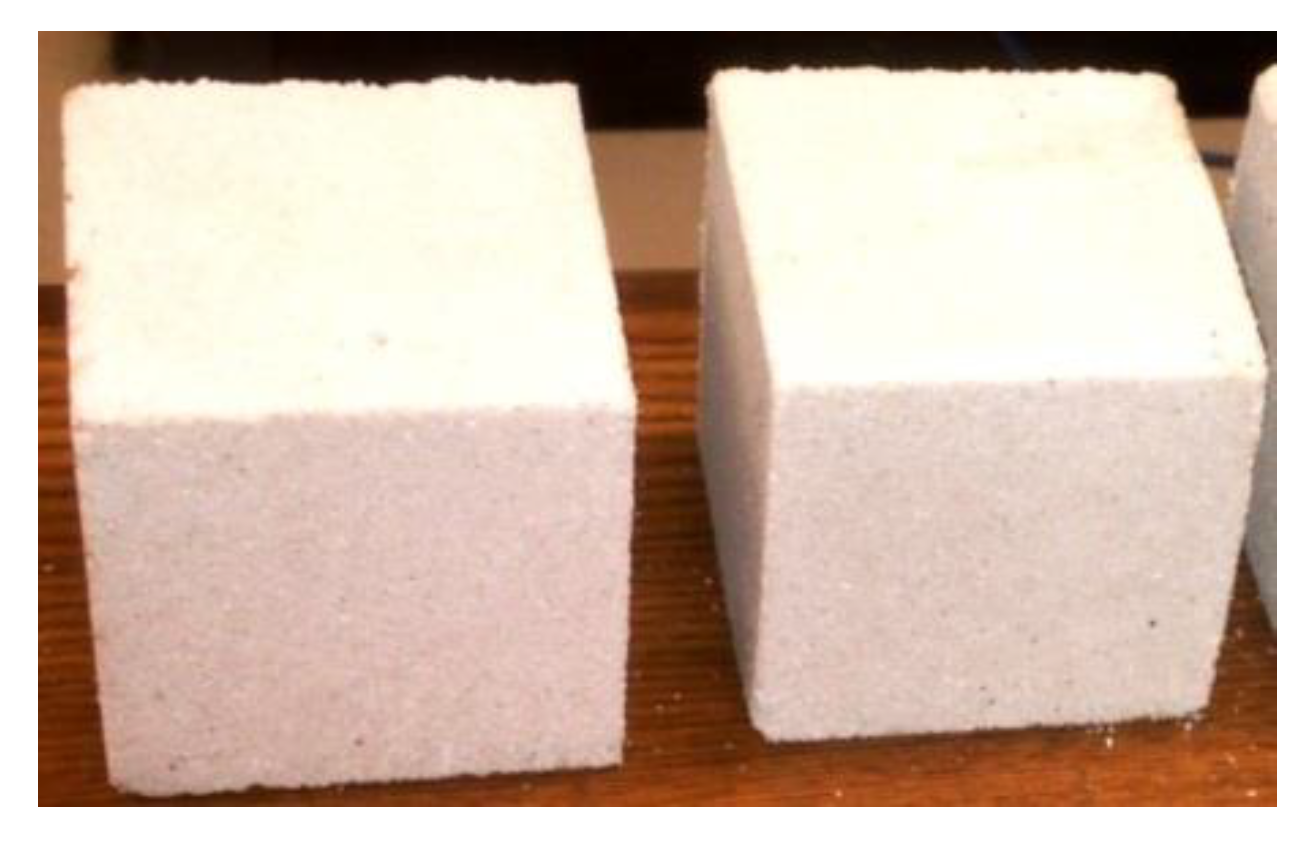
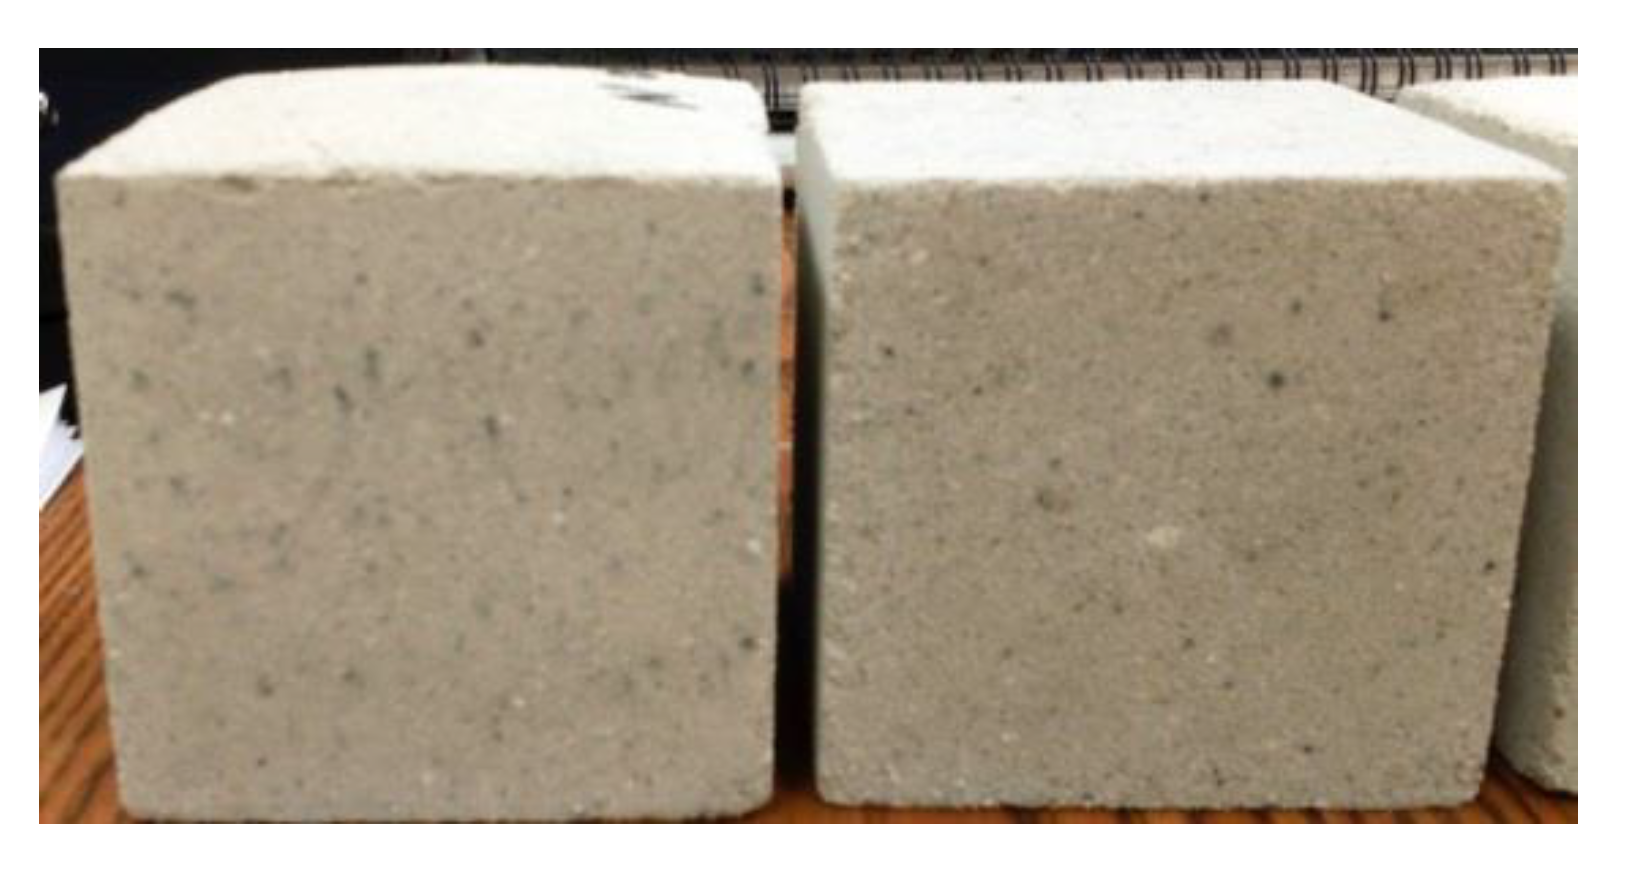
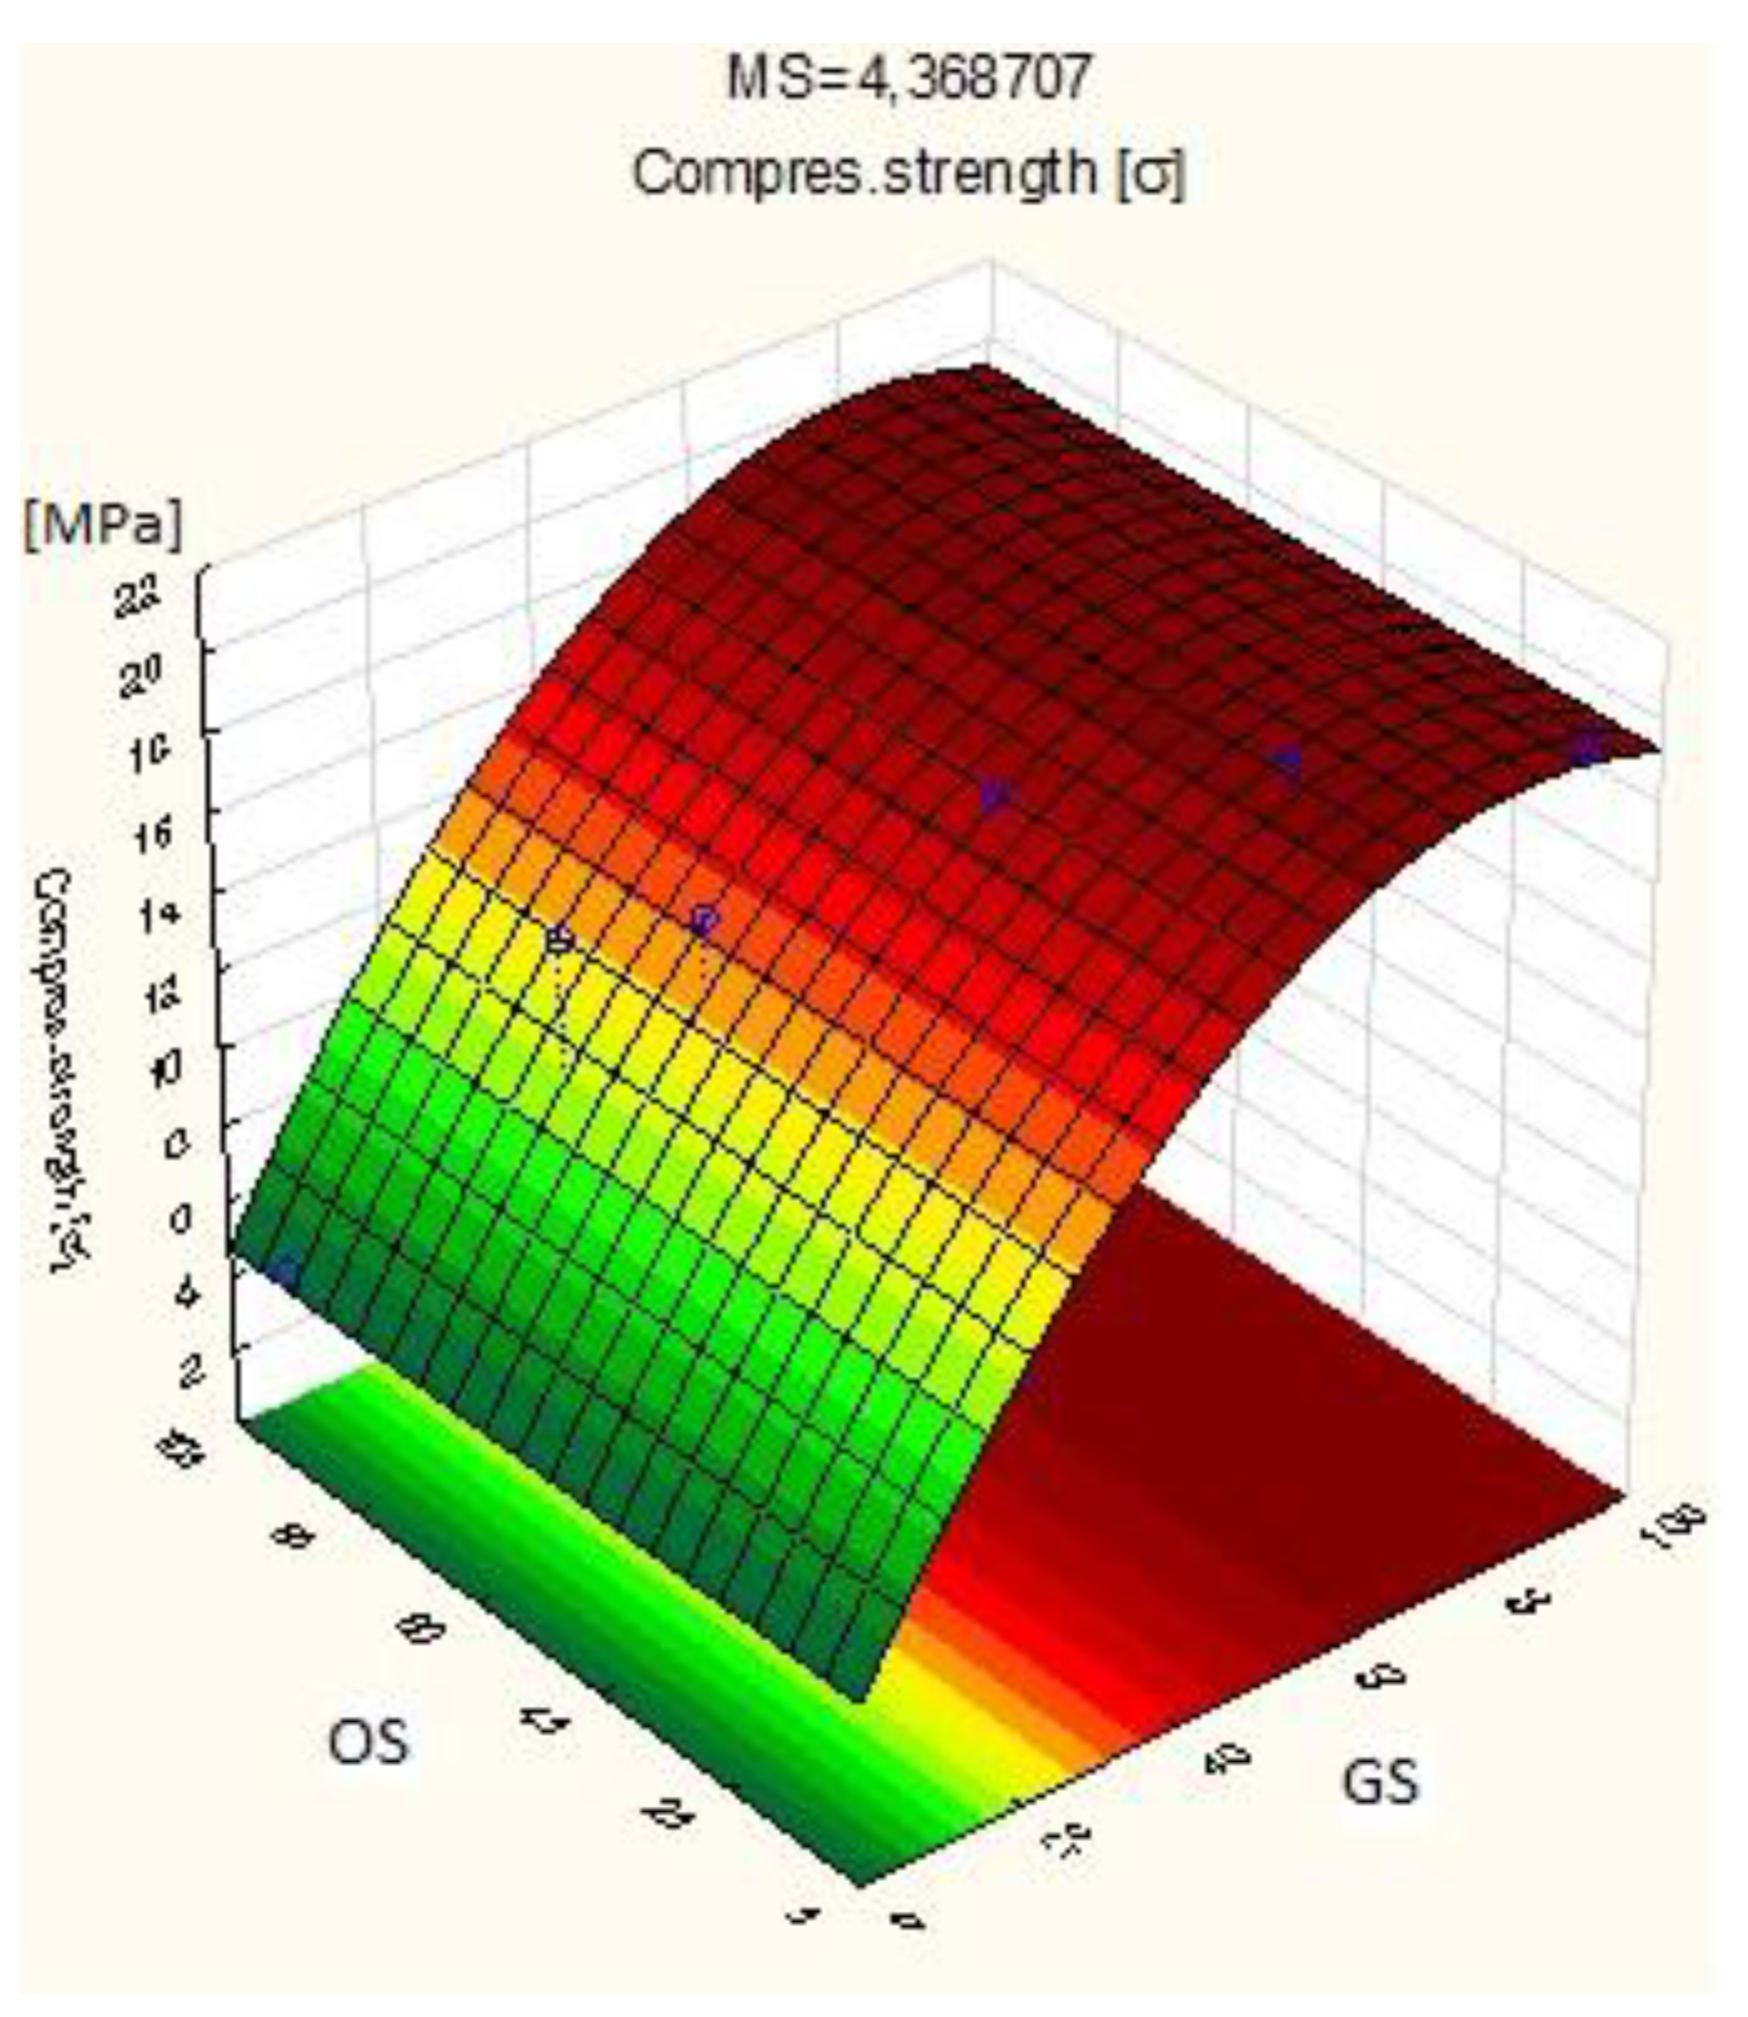
3.1. Compressive Strength of the Bricks with GS
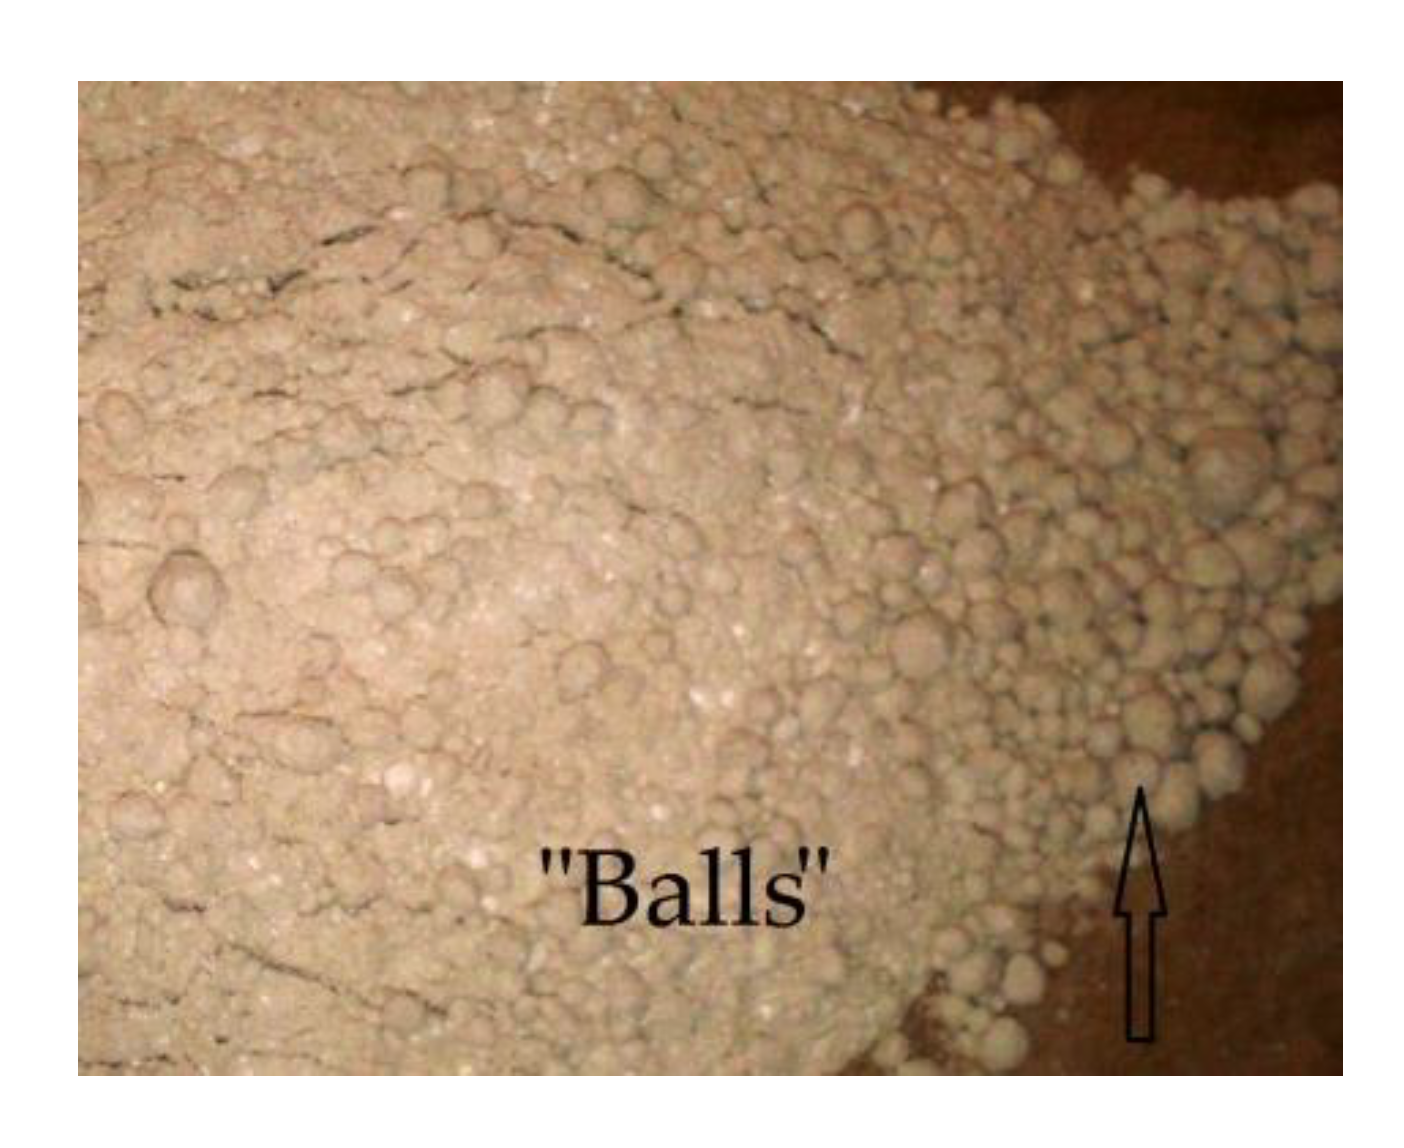
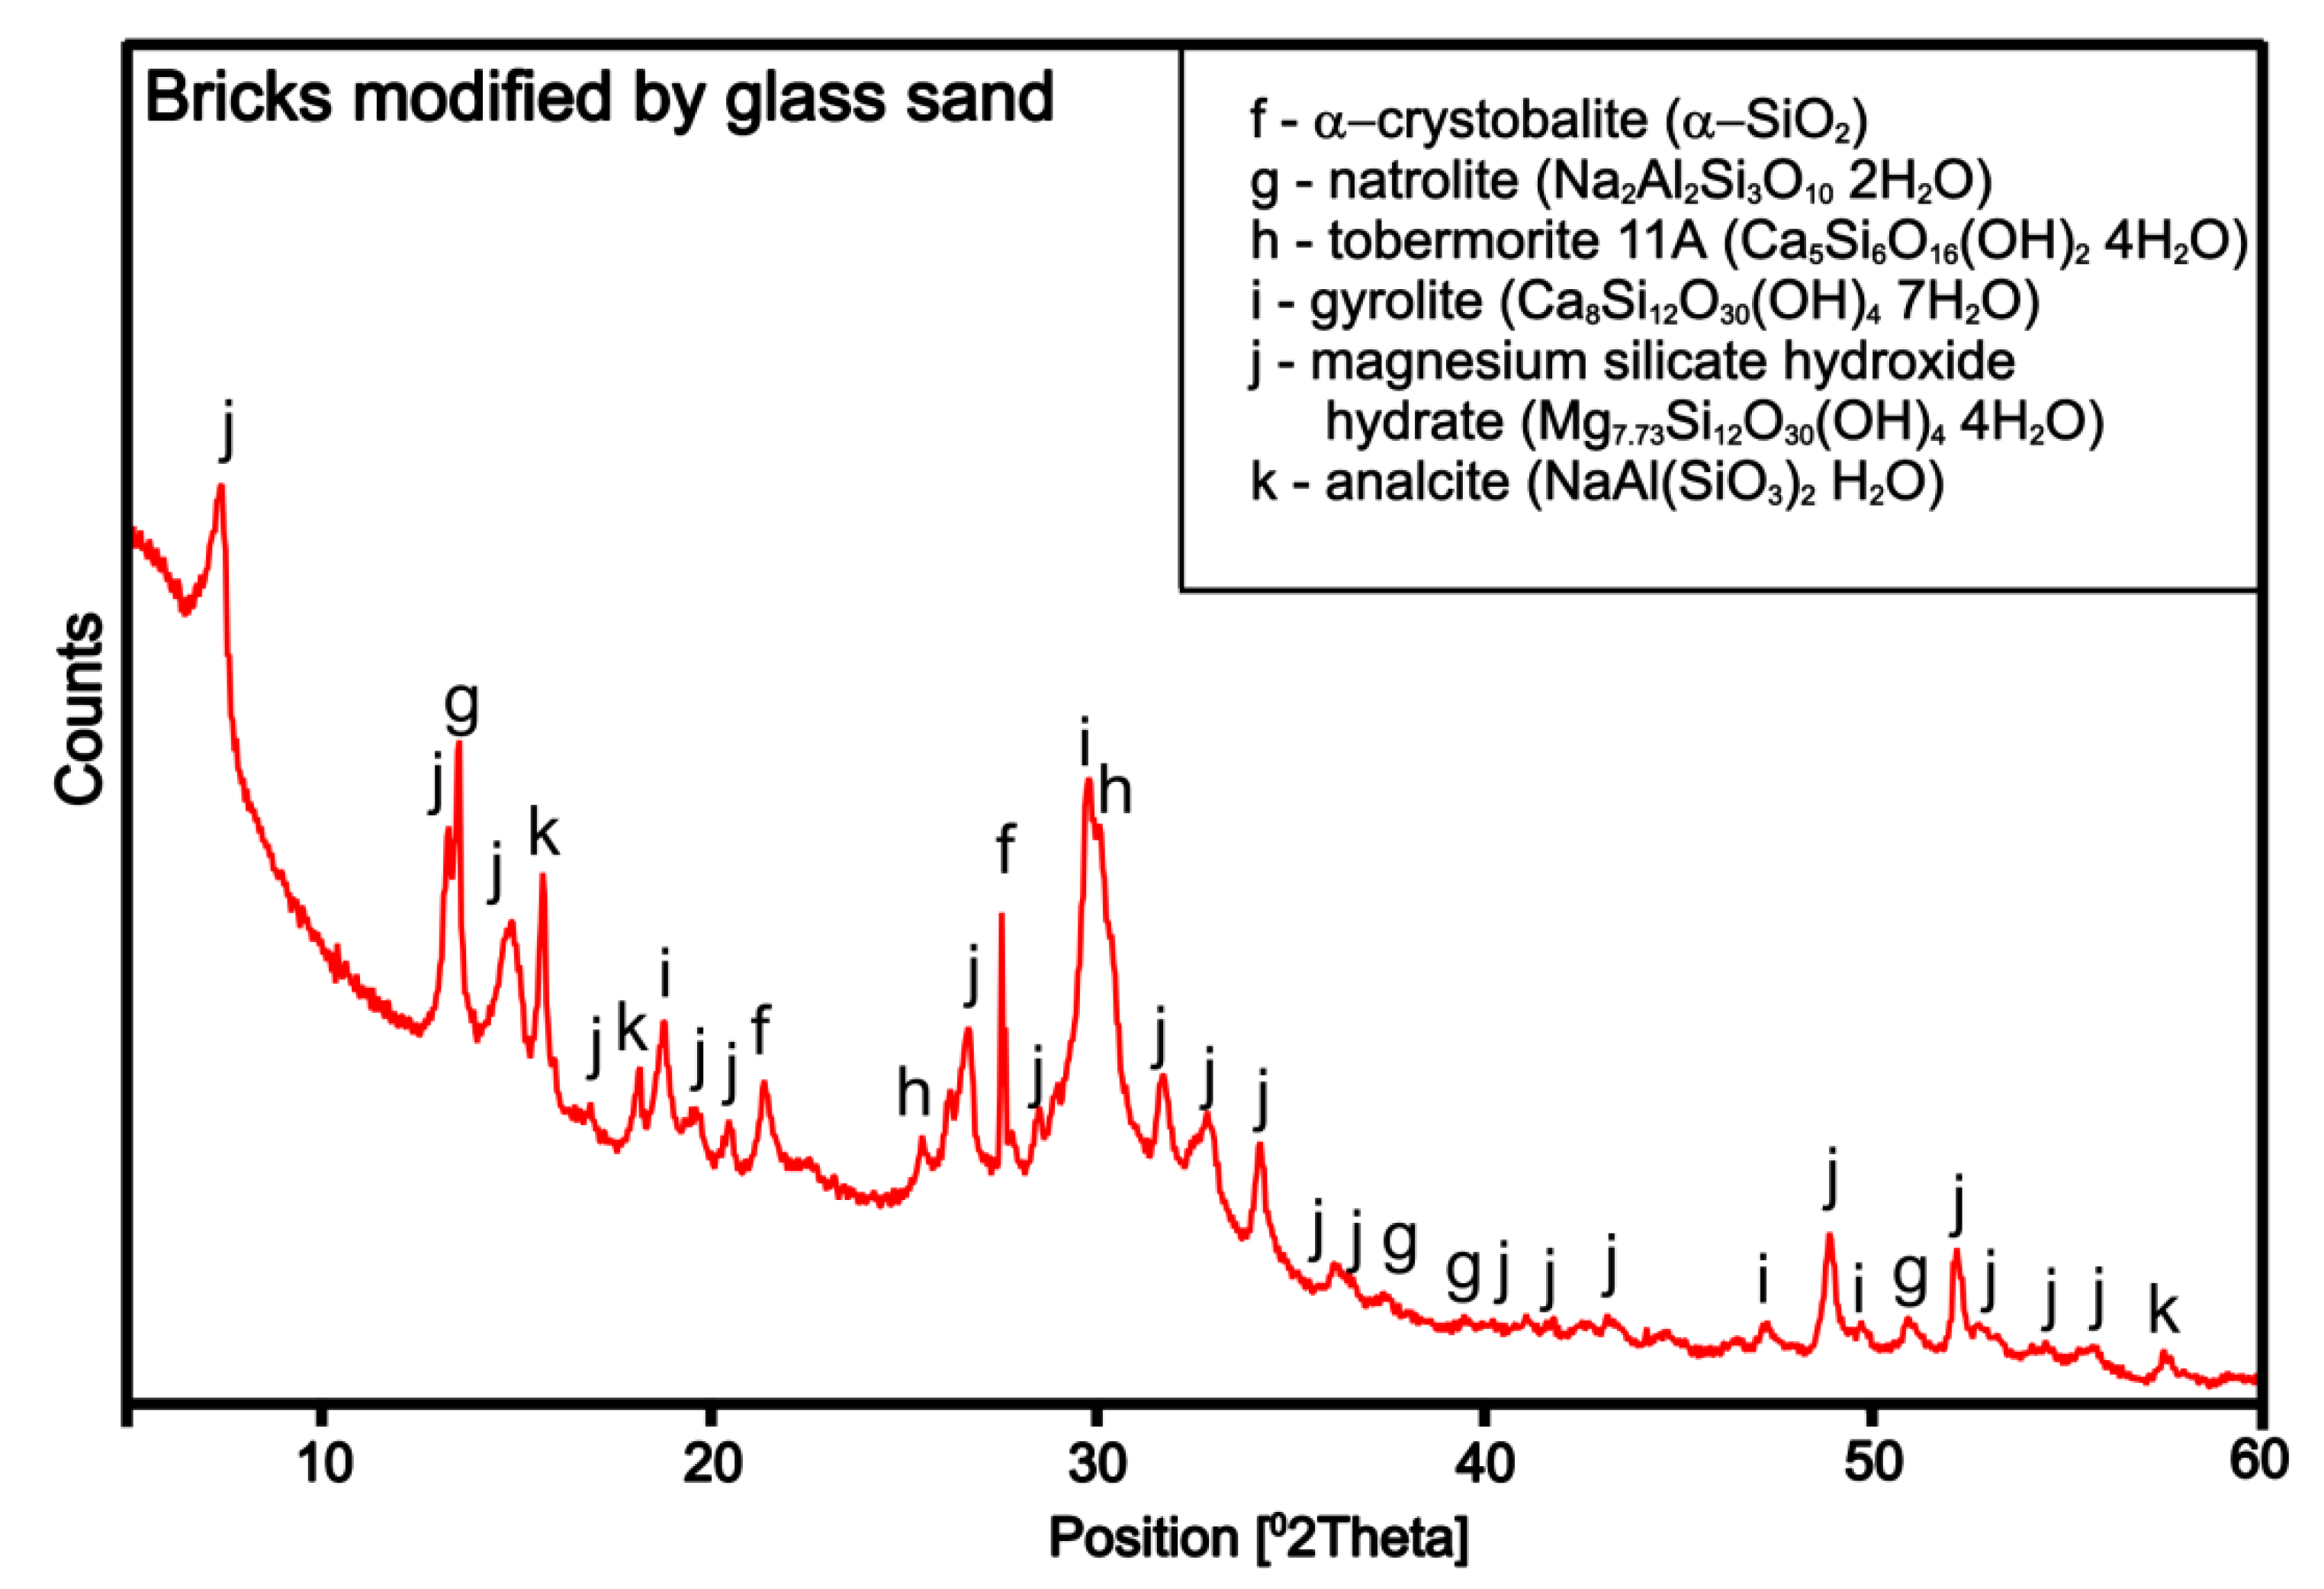
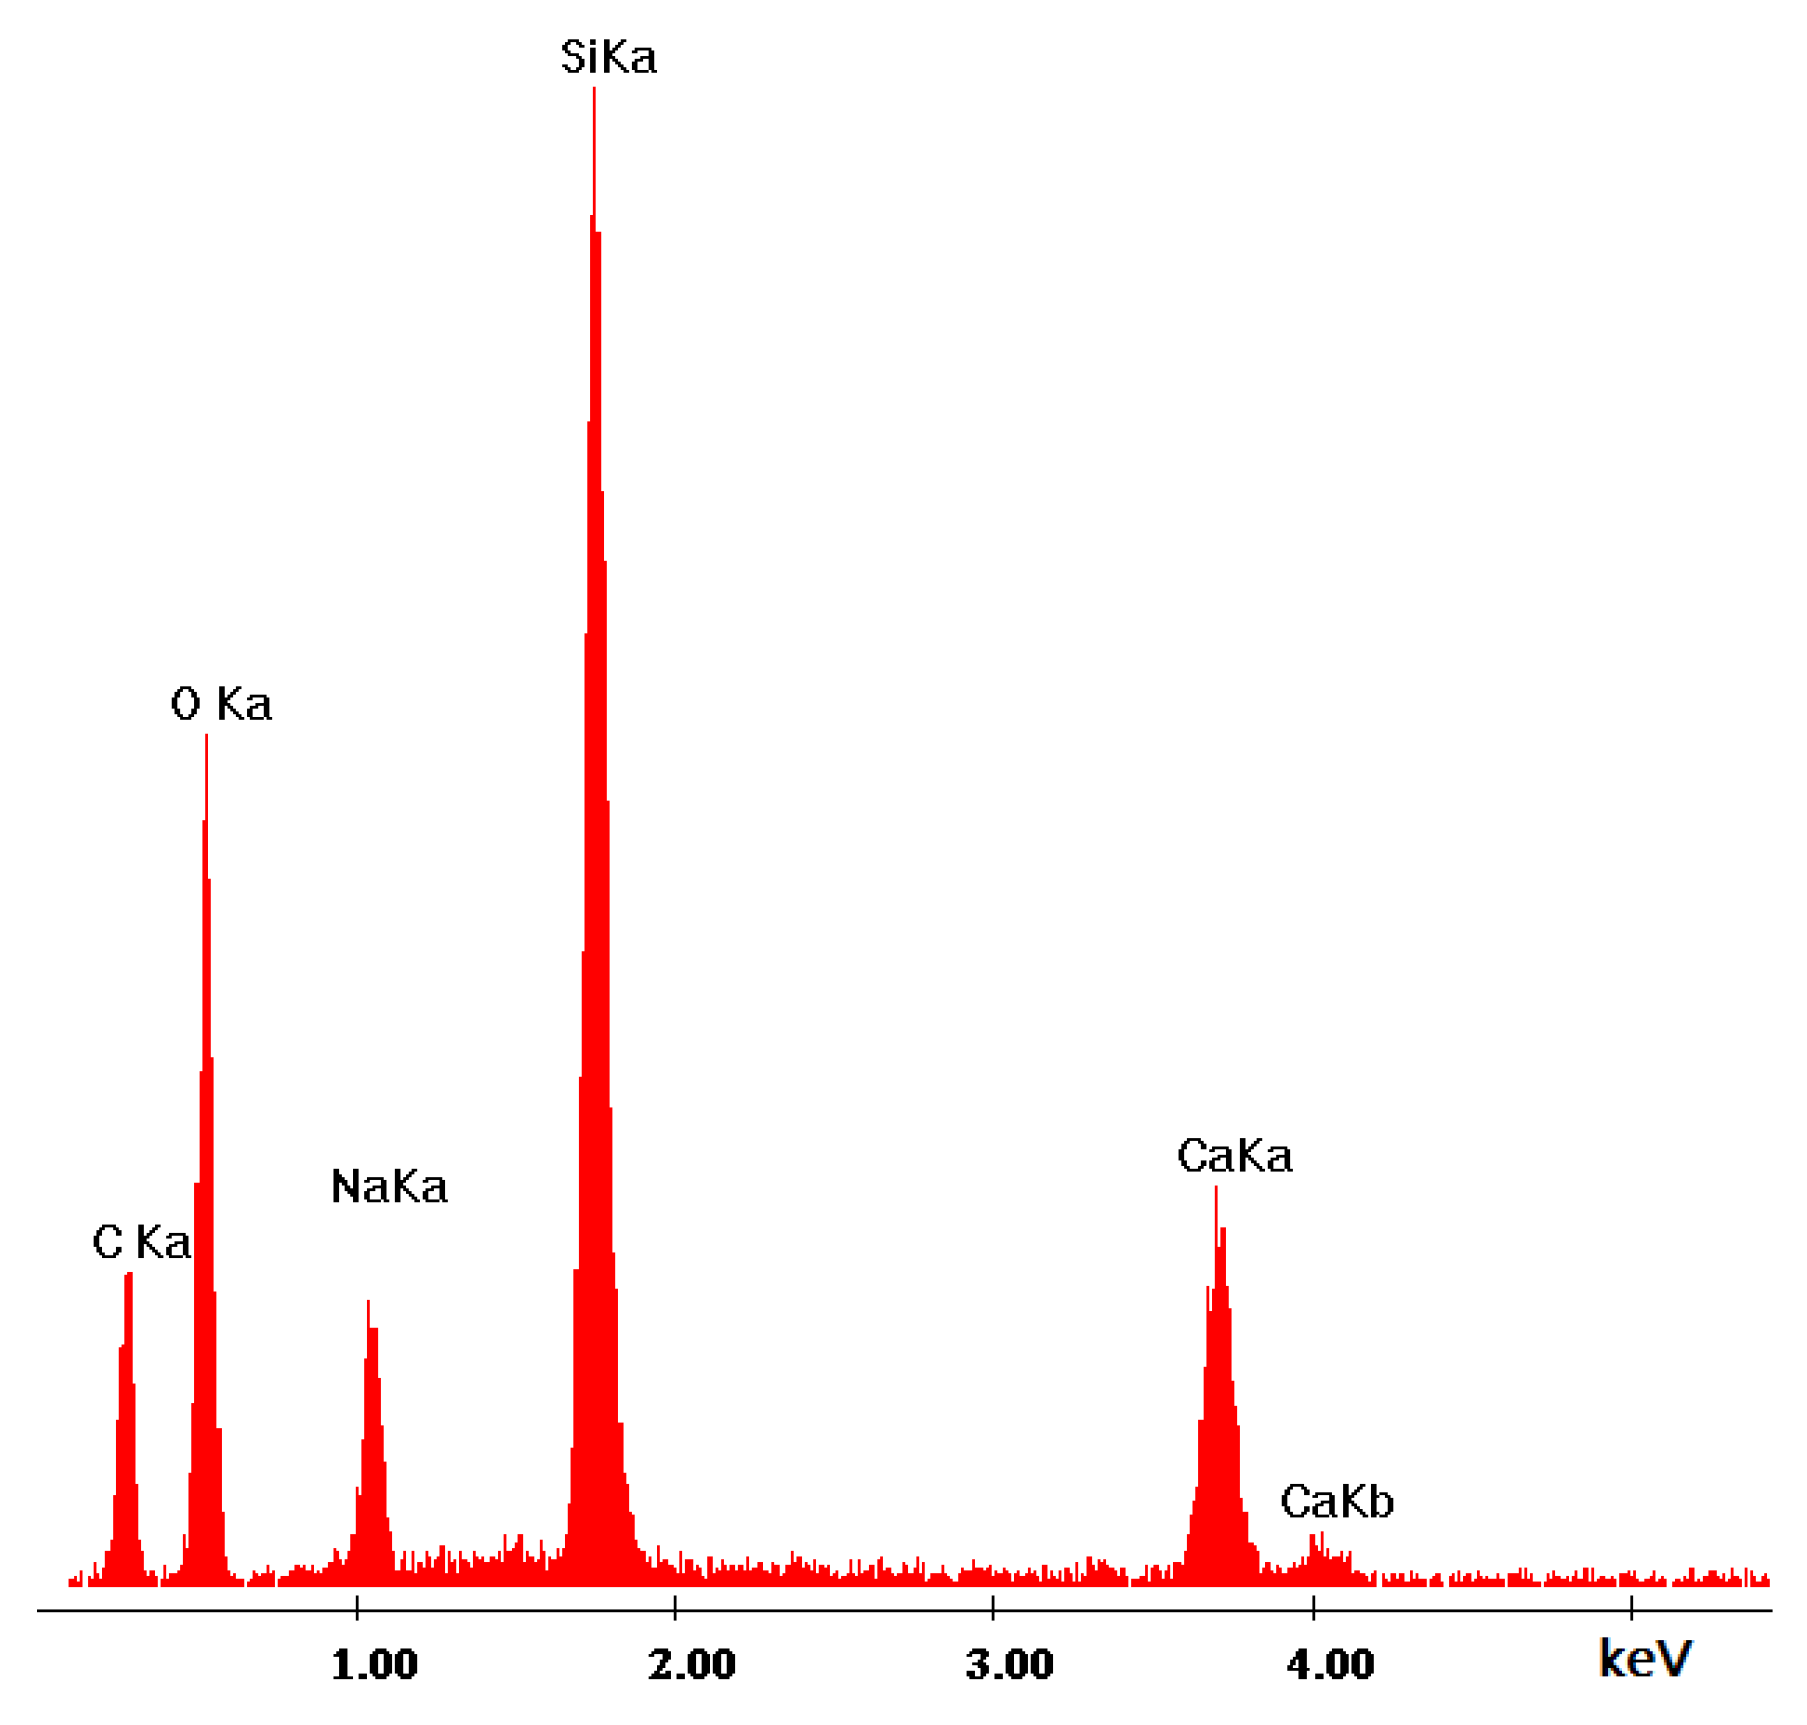
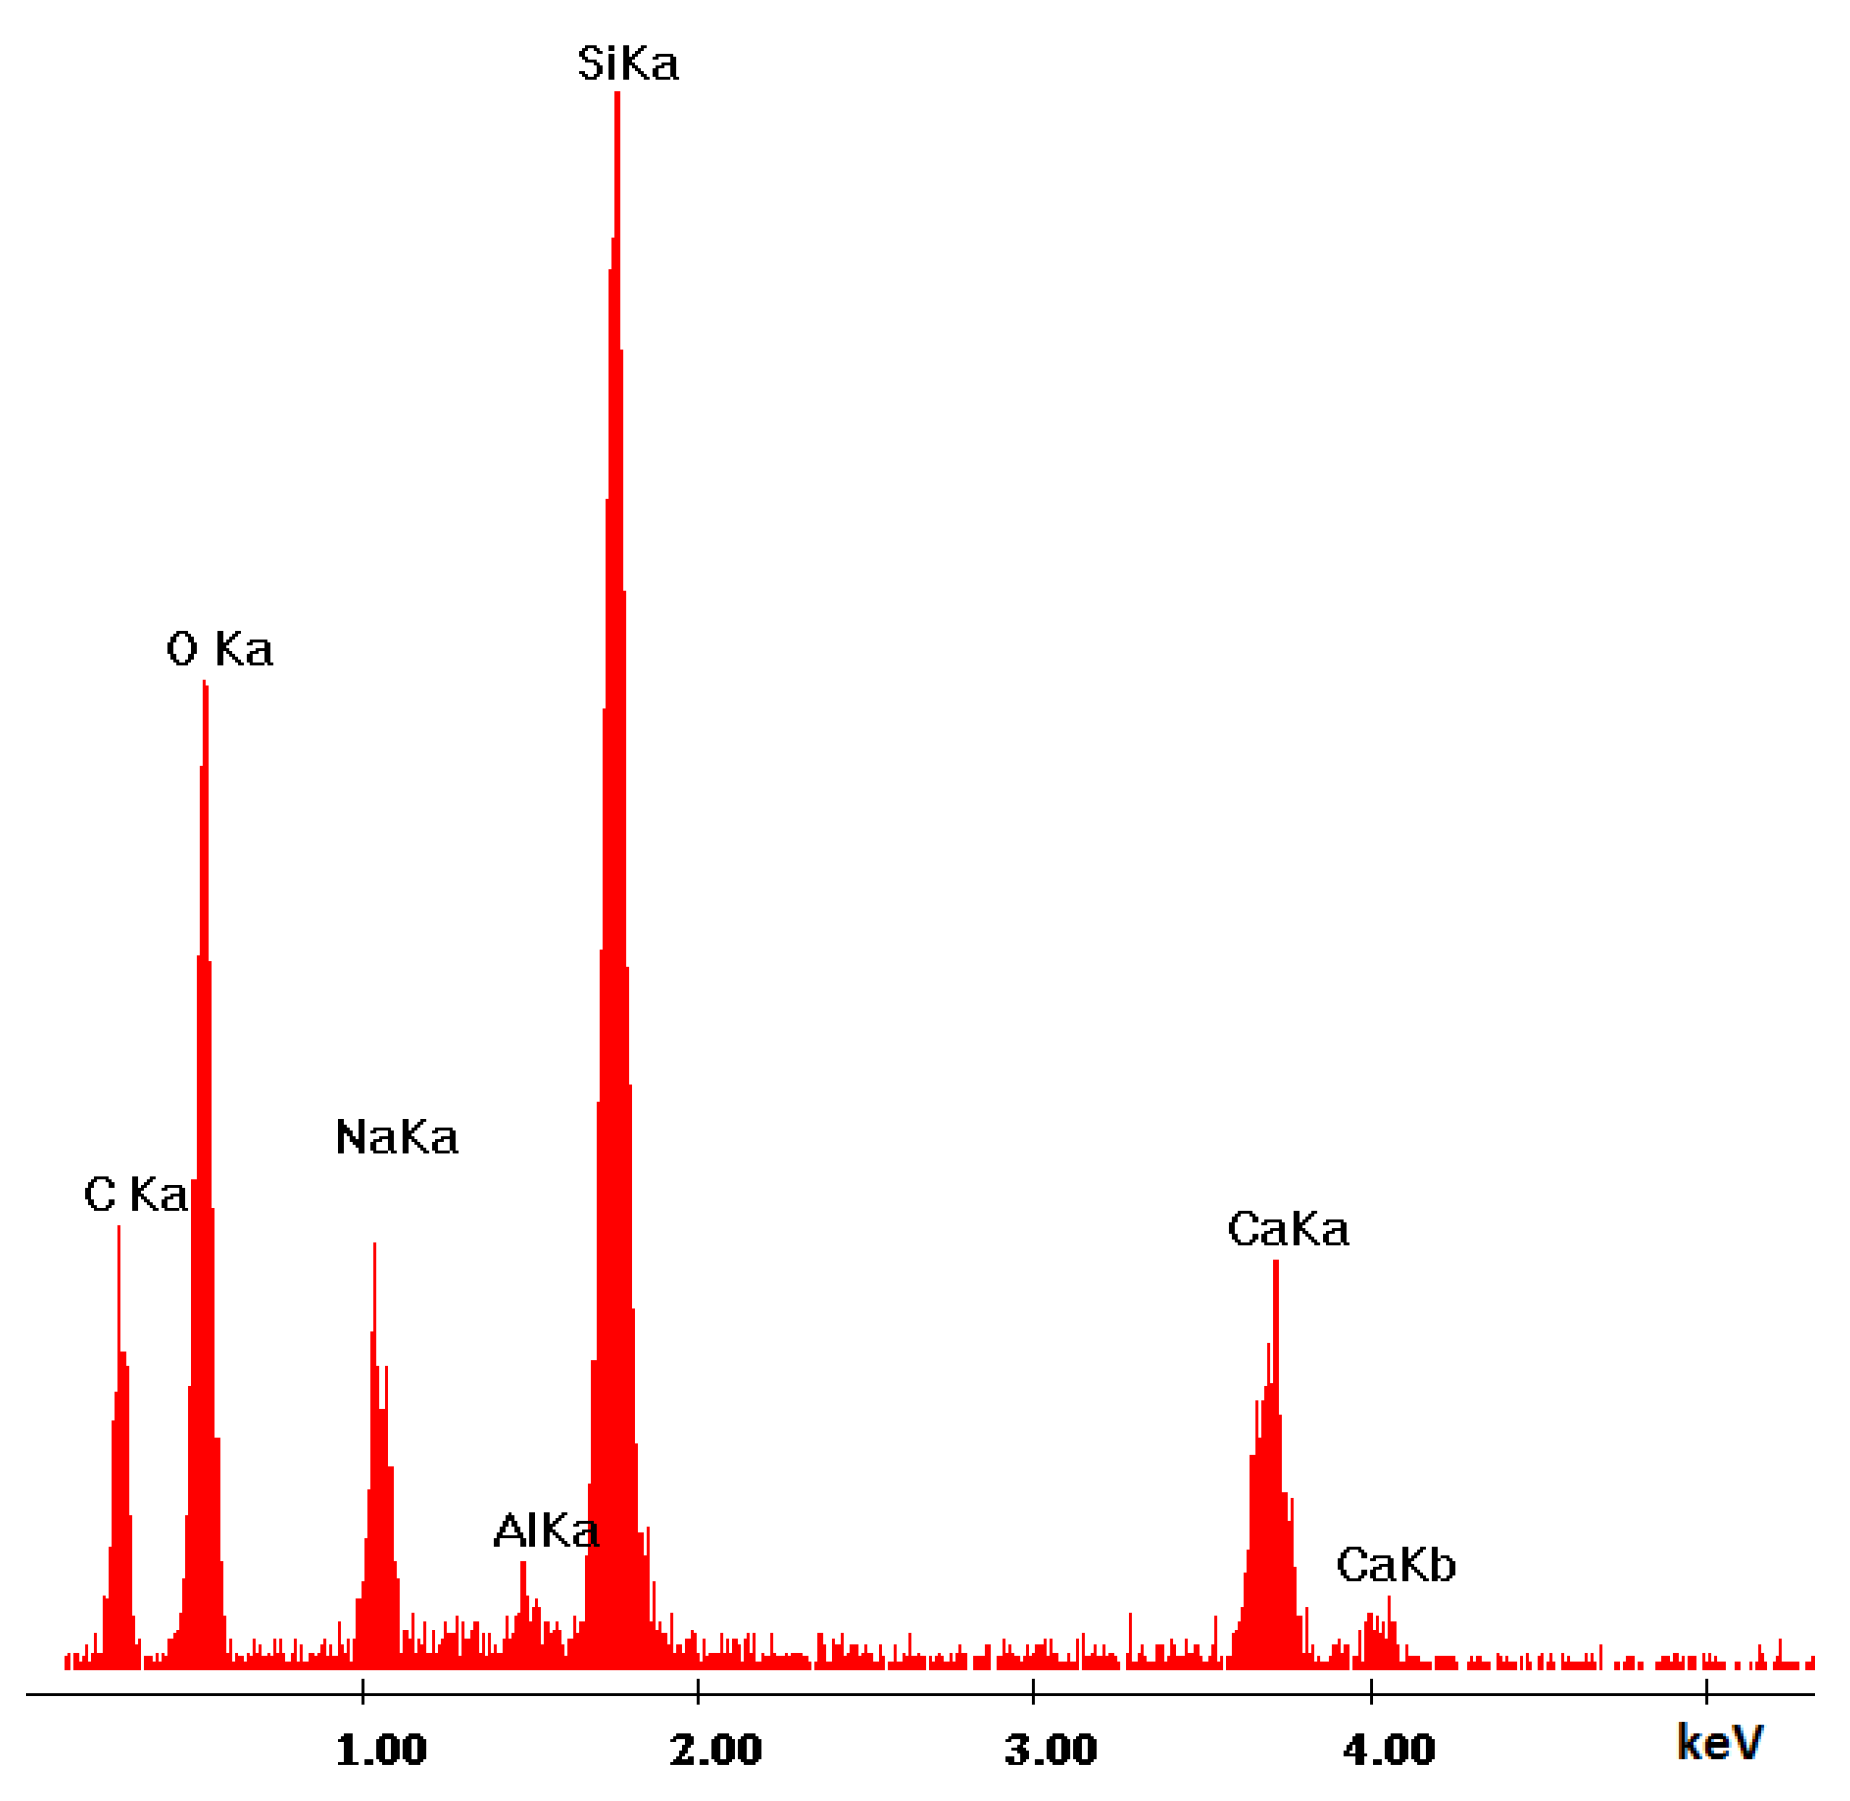
3.2. Structural and Microstructural Analysis
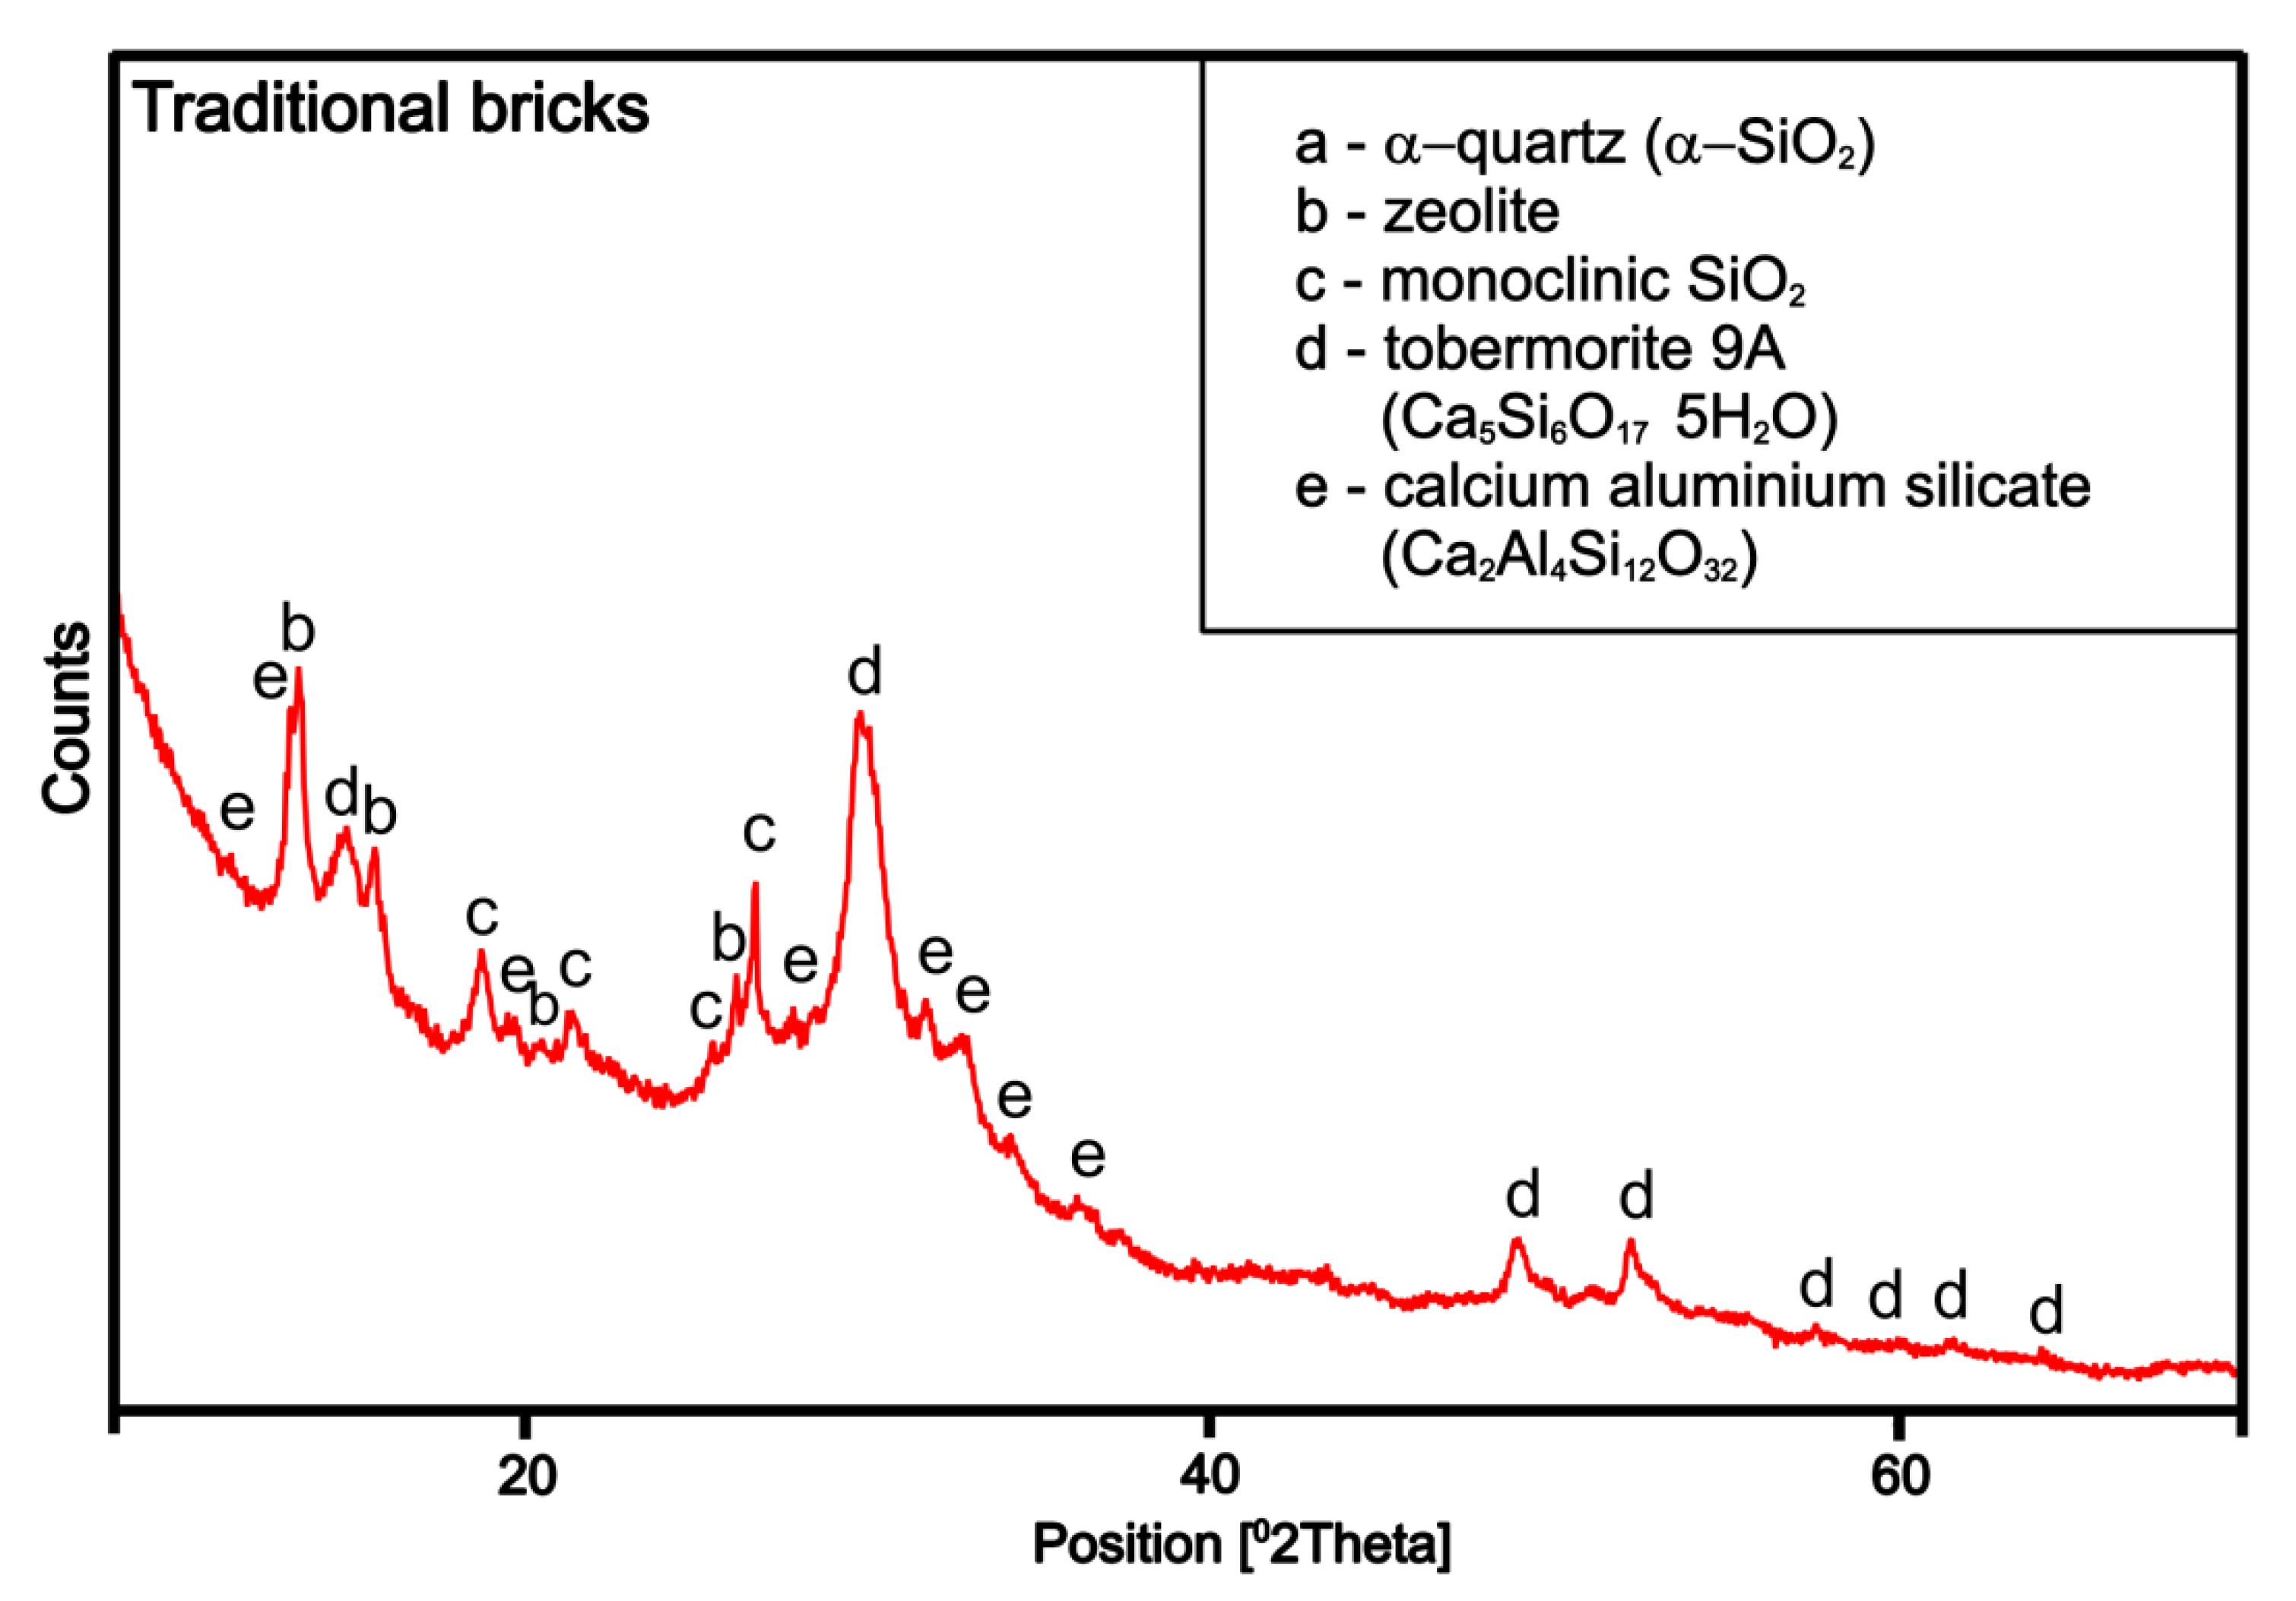
3.2.1. Structure Analysis
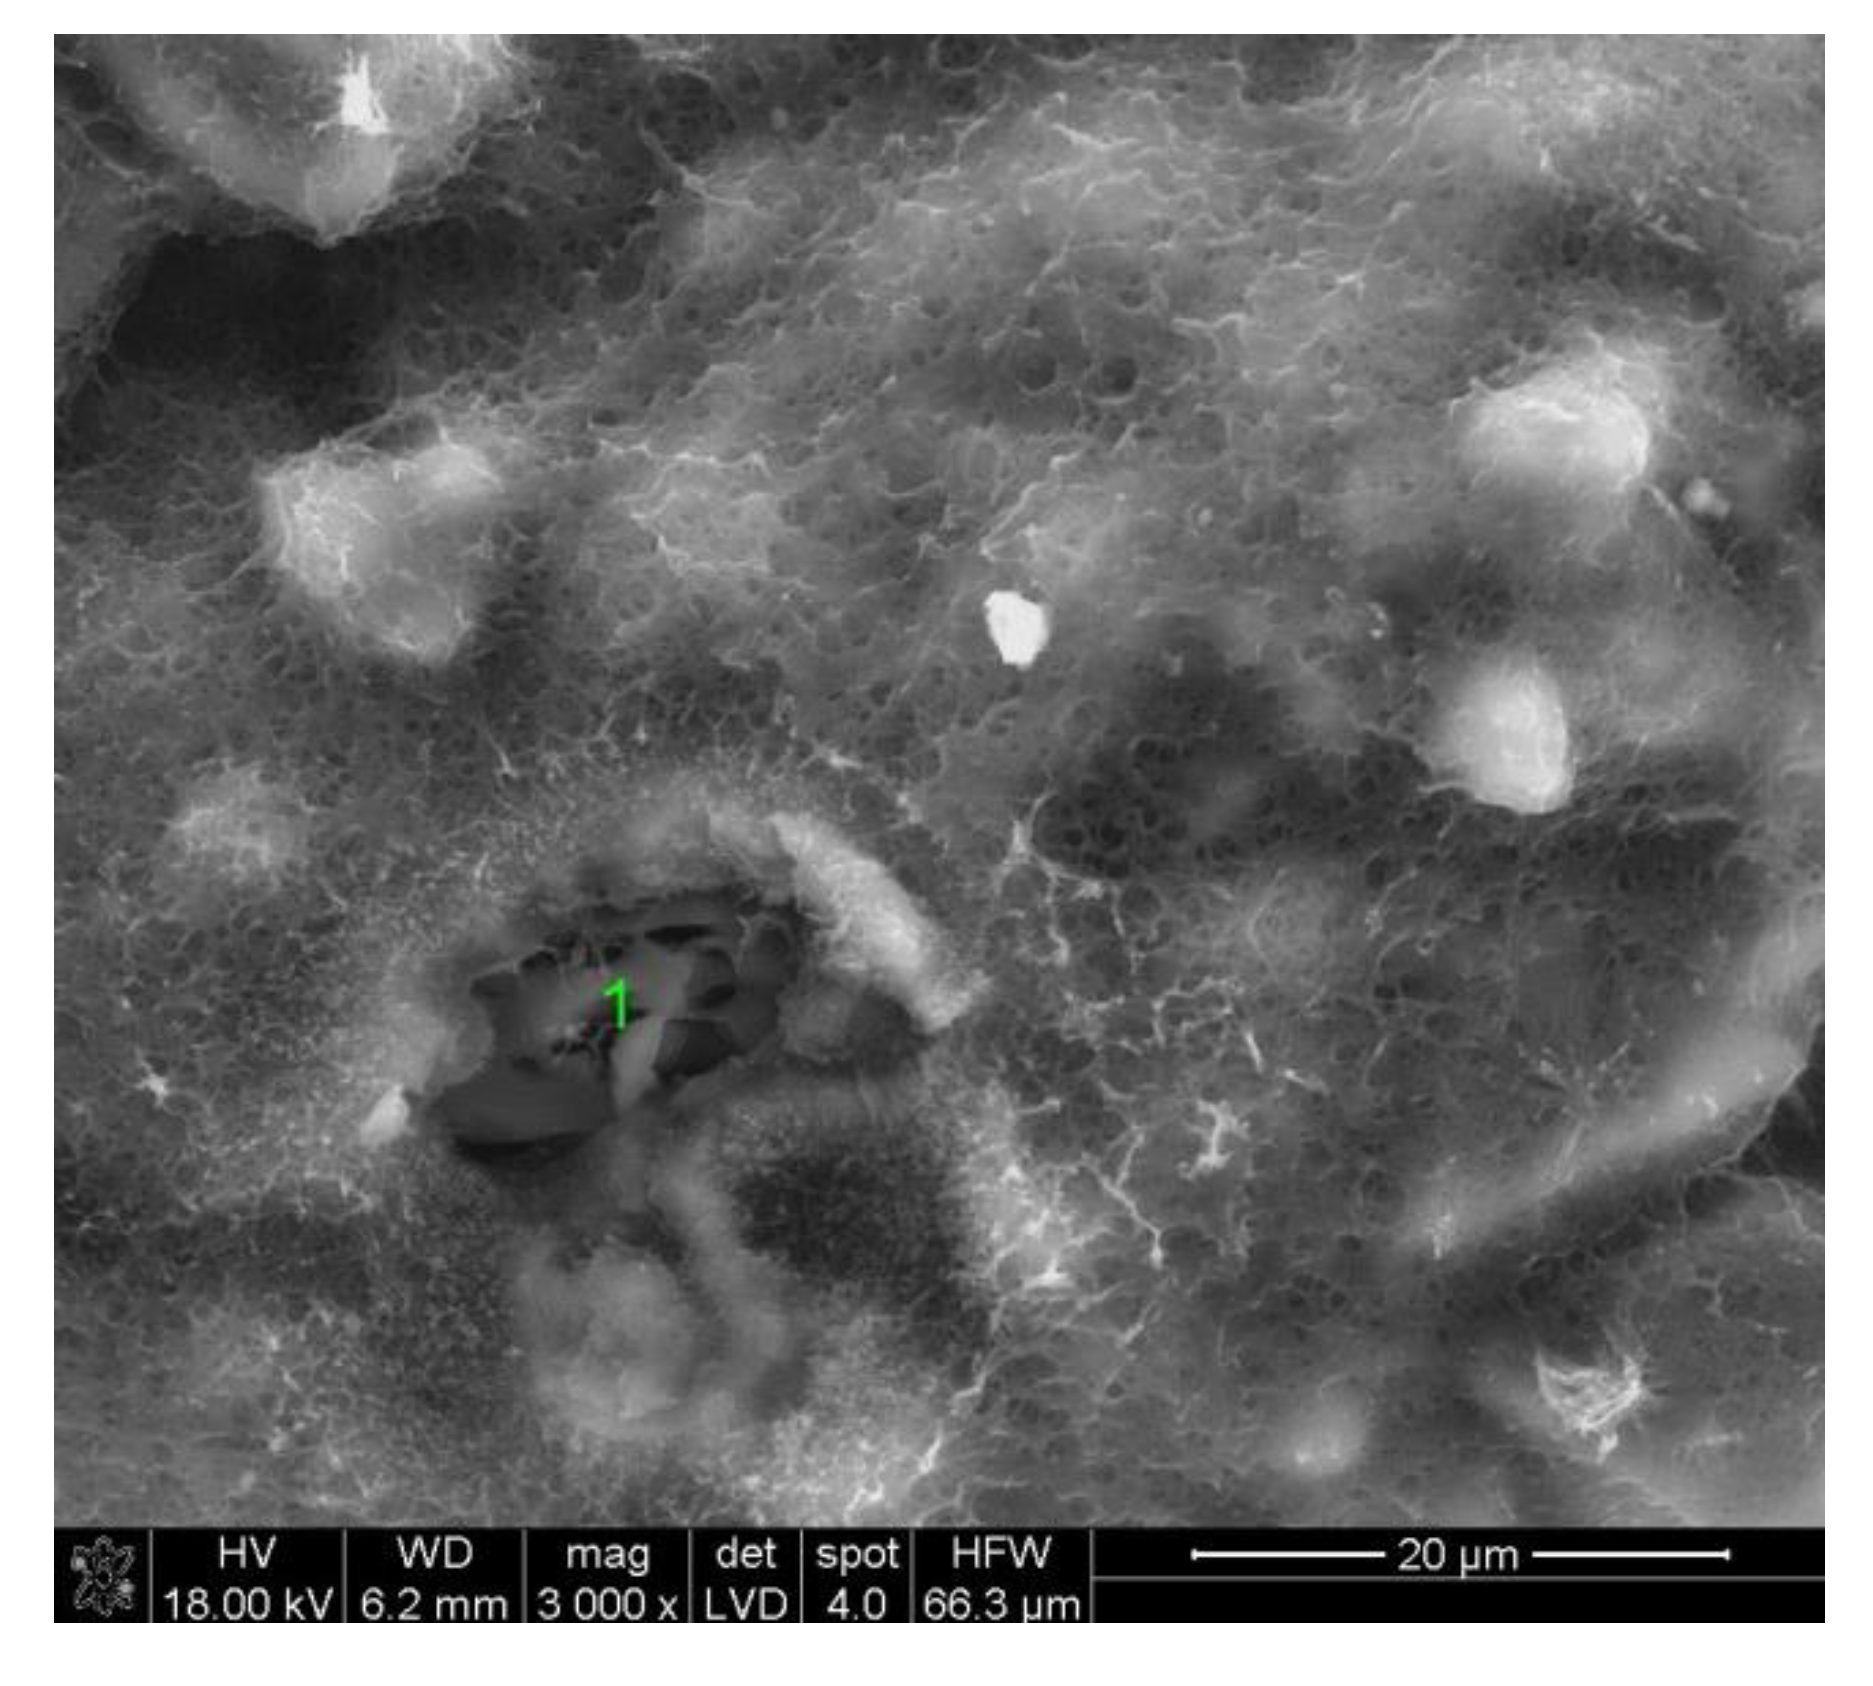
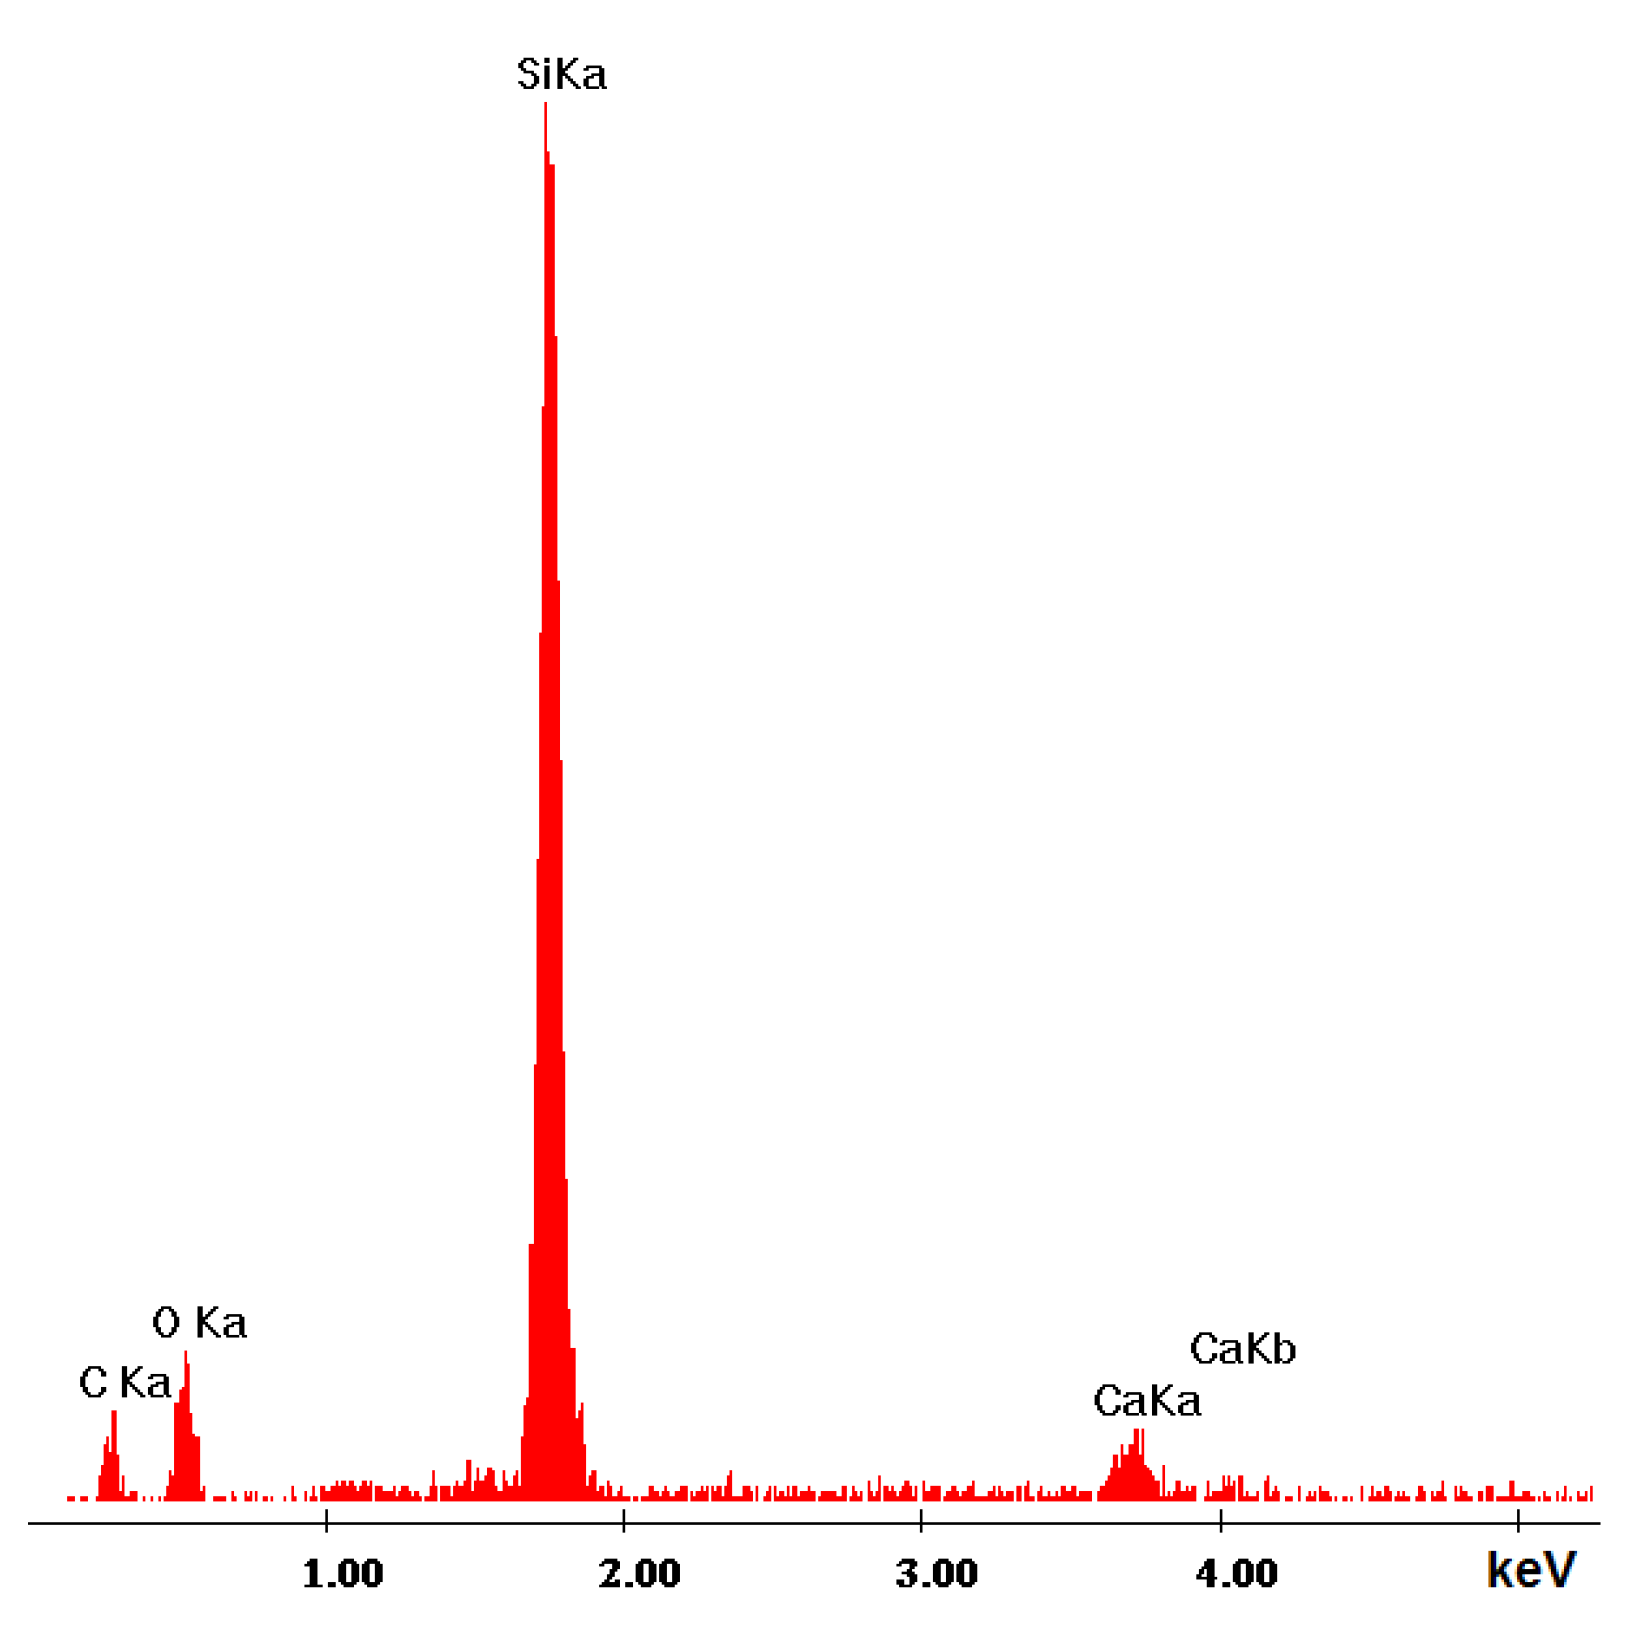
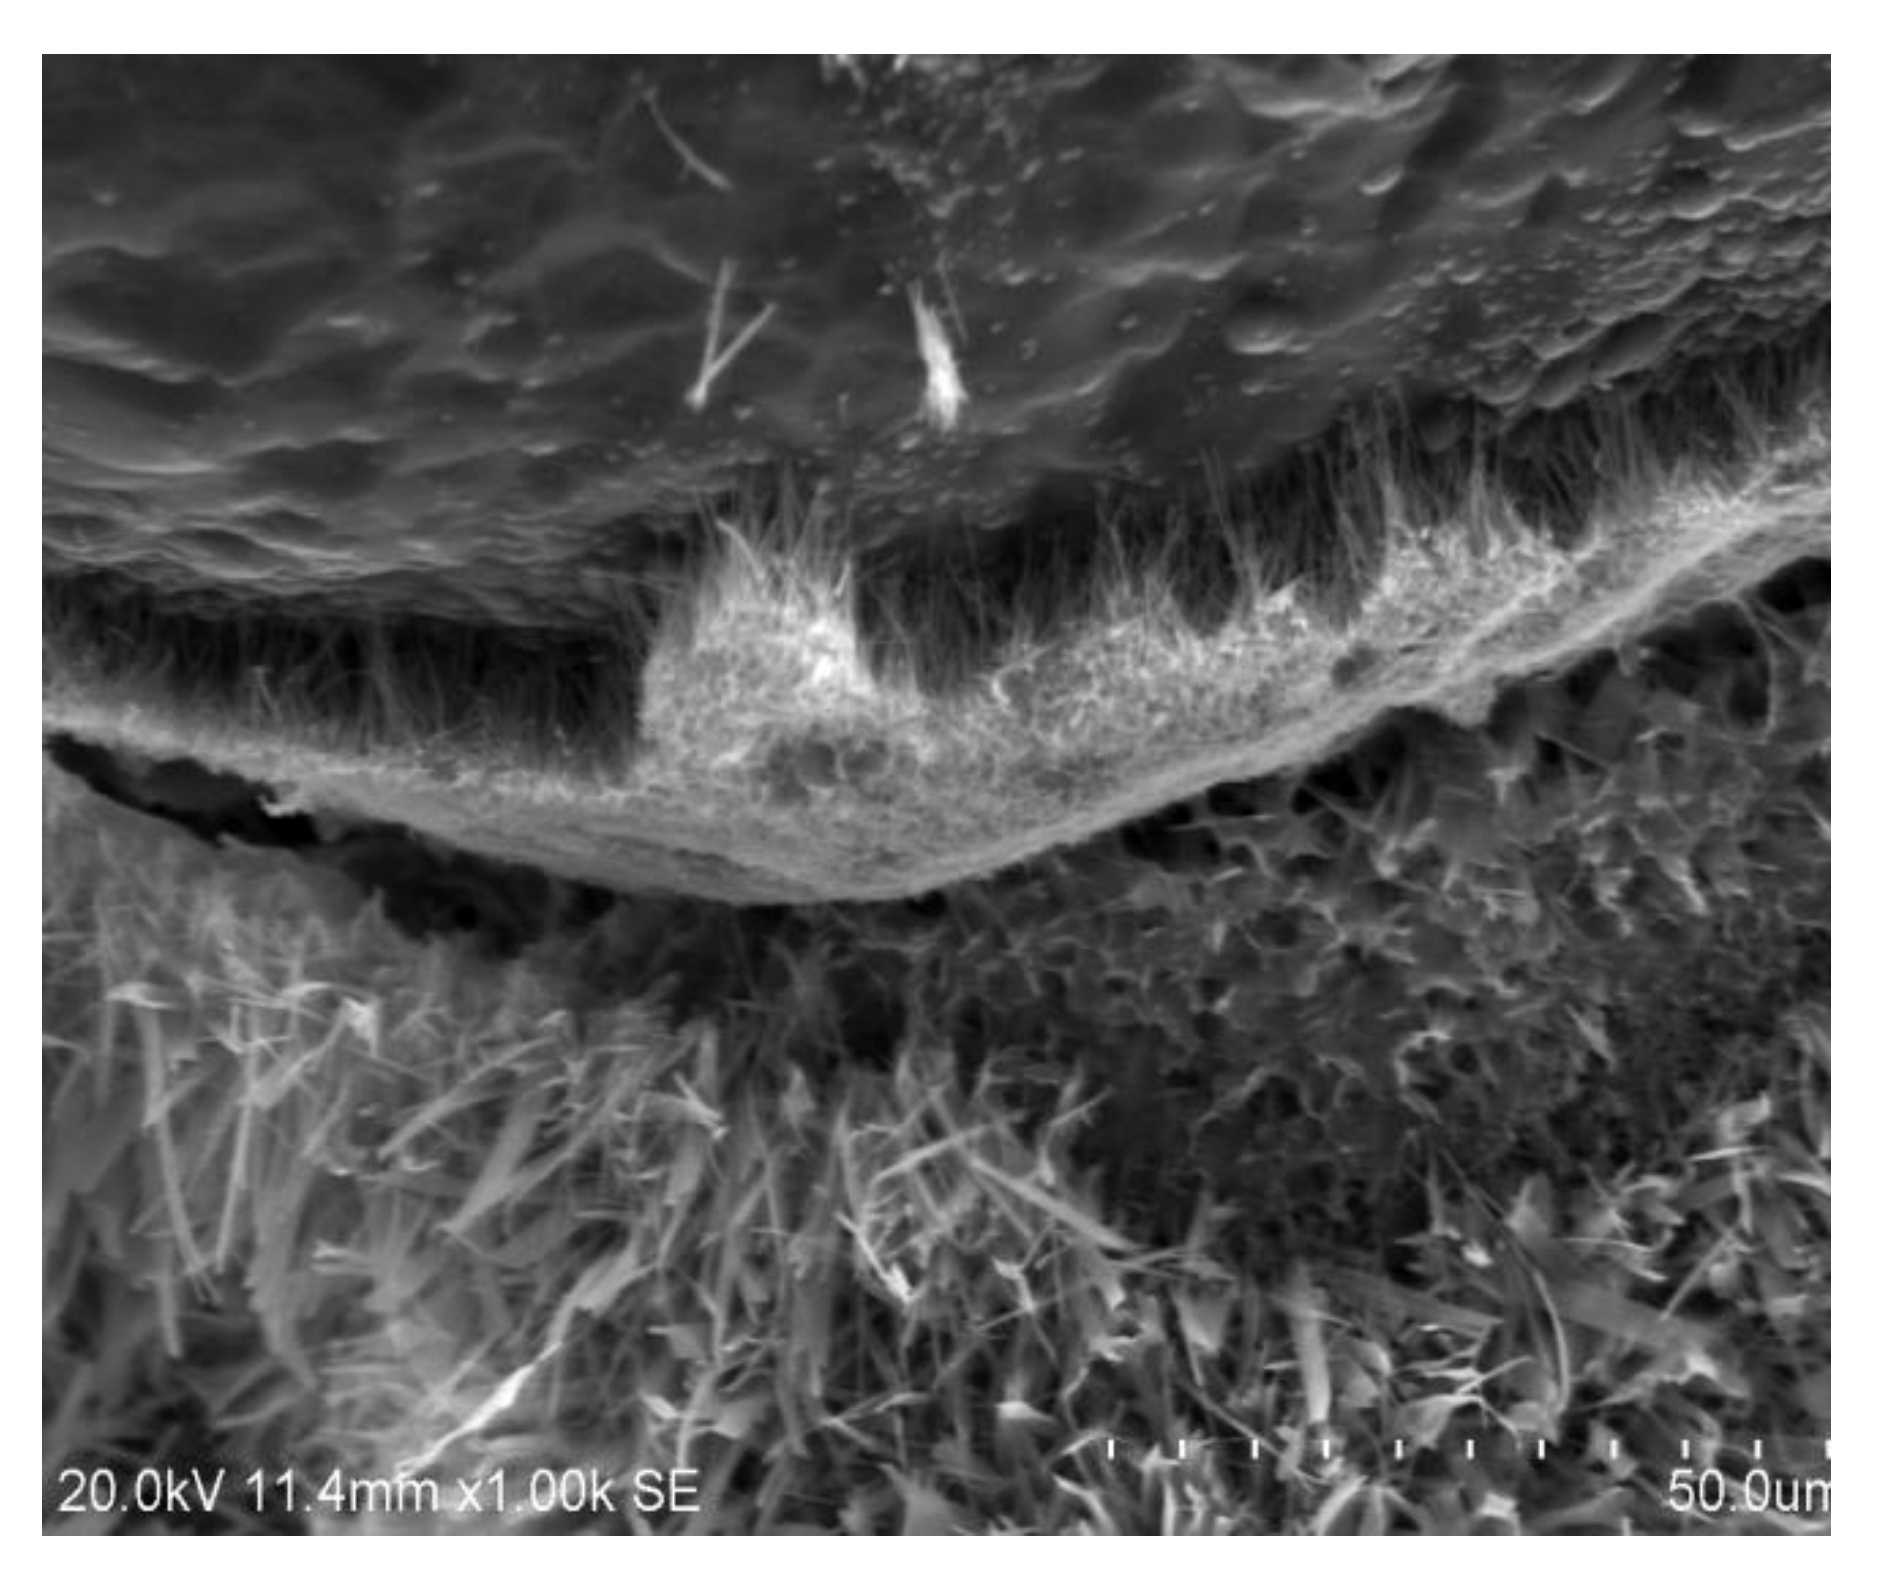
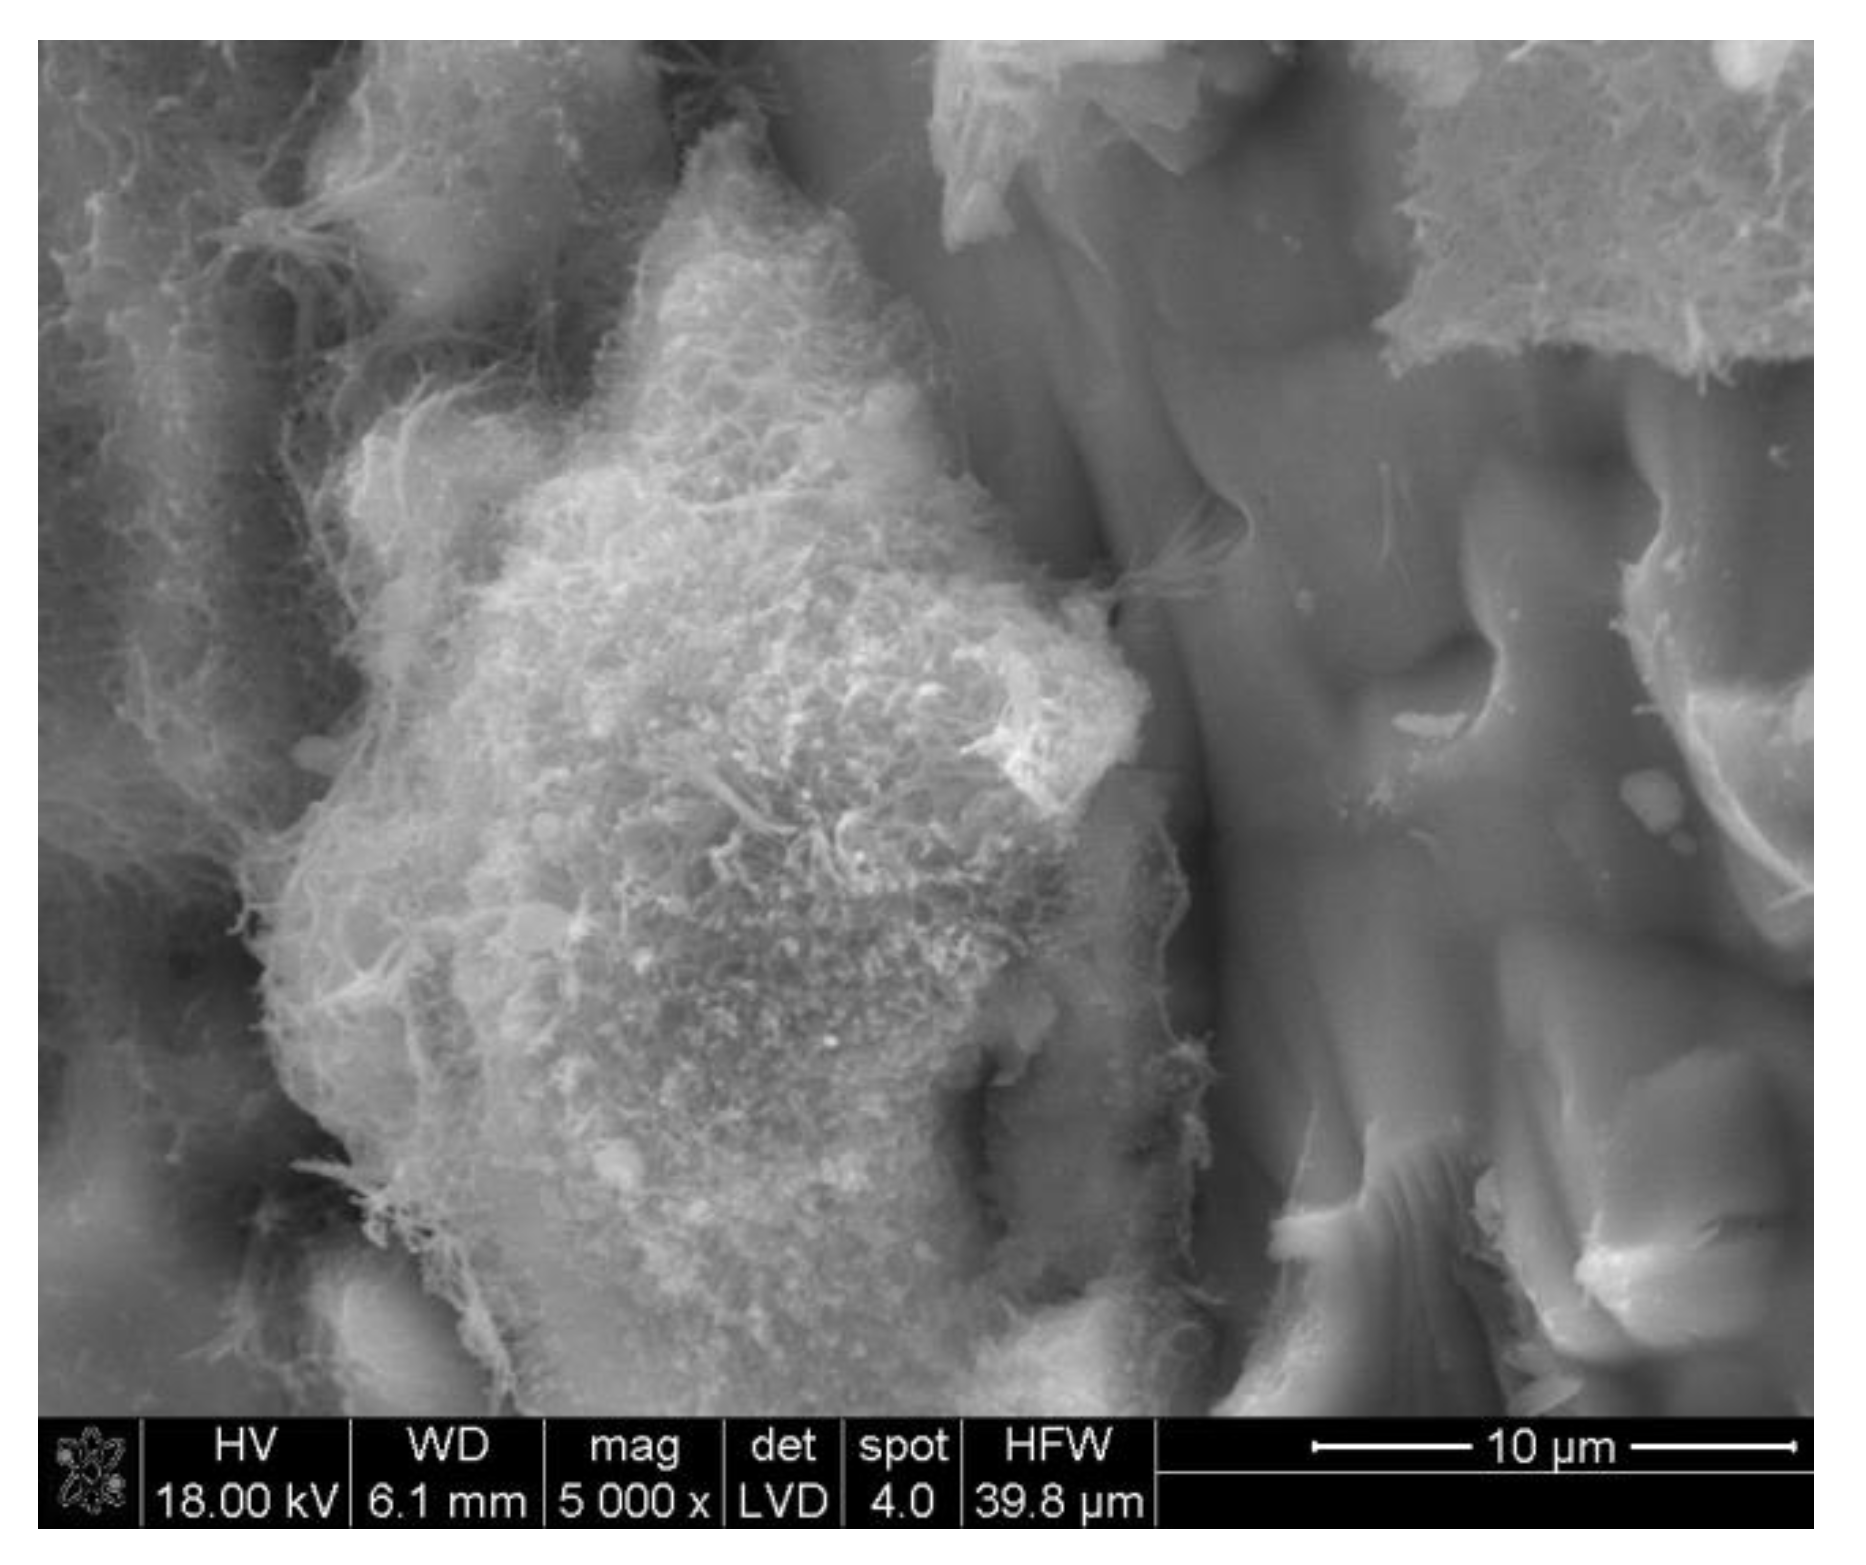
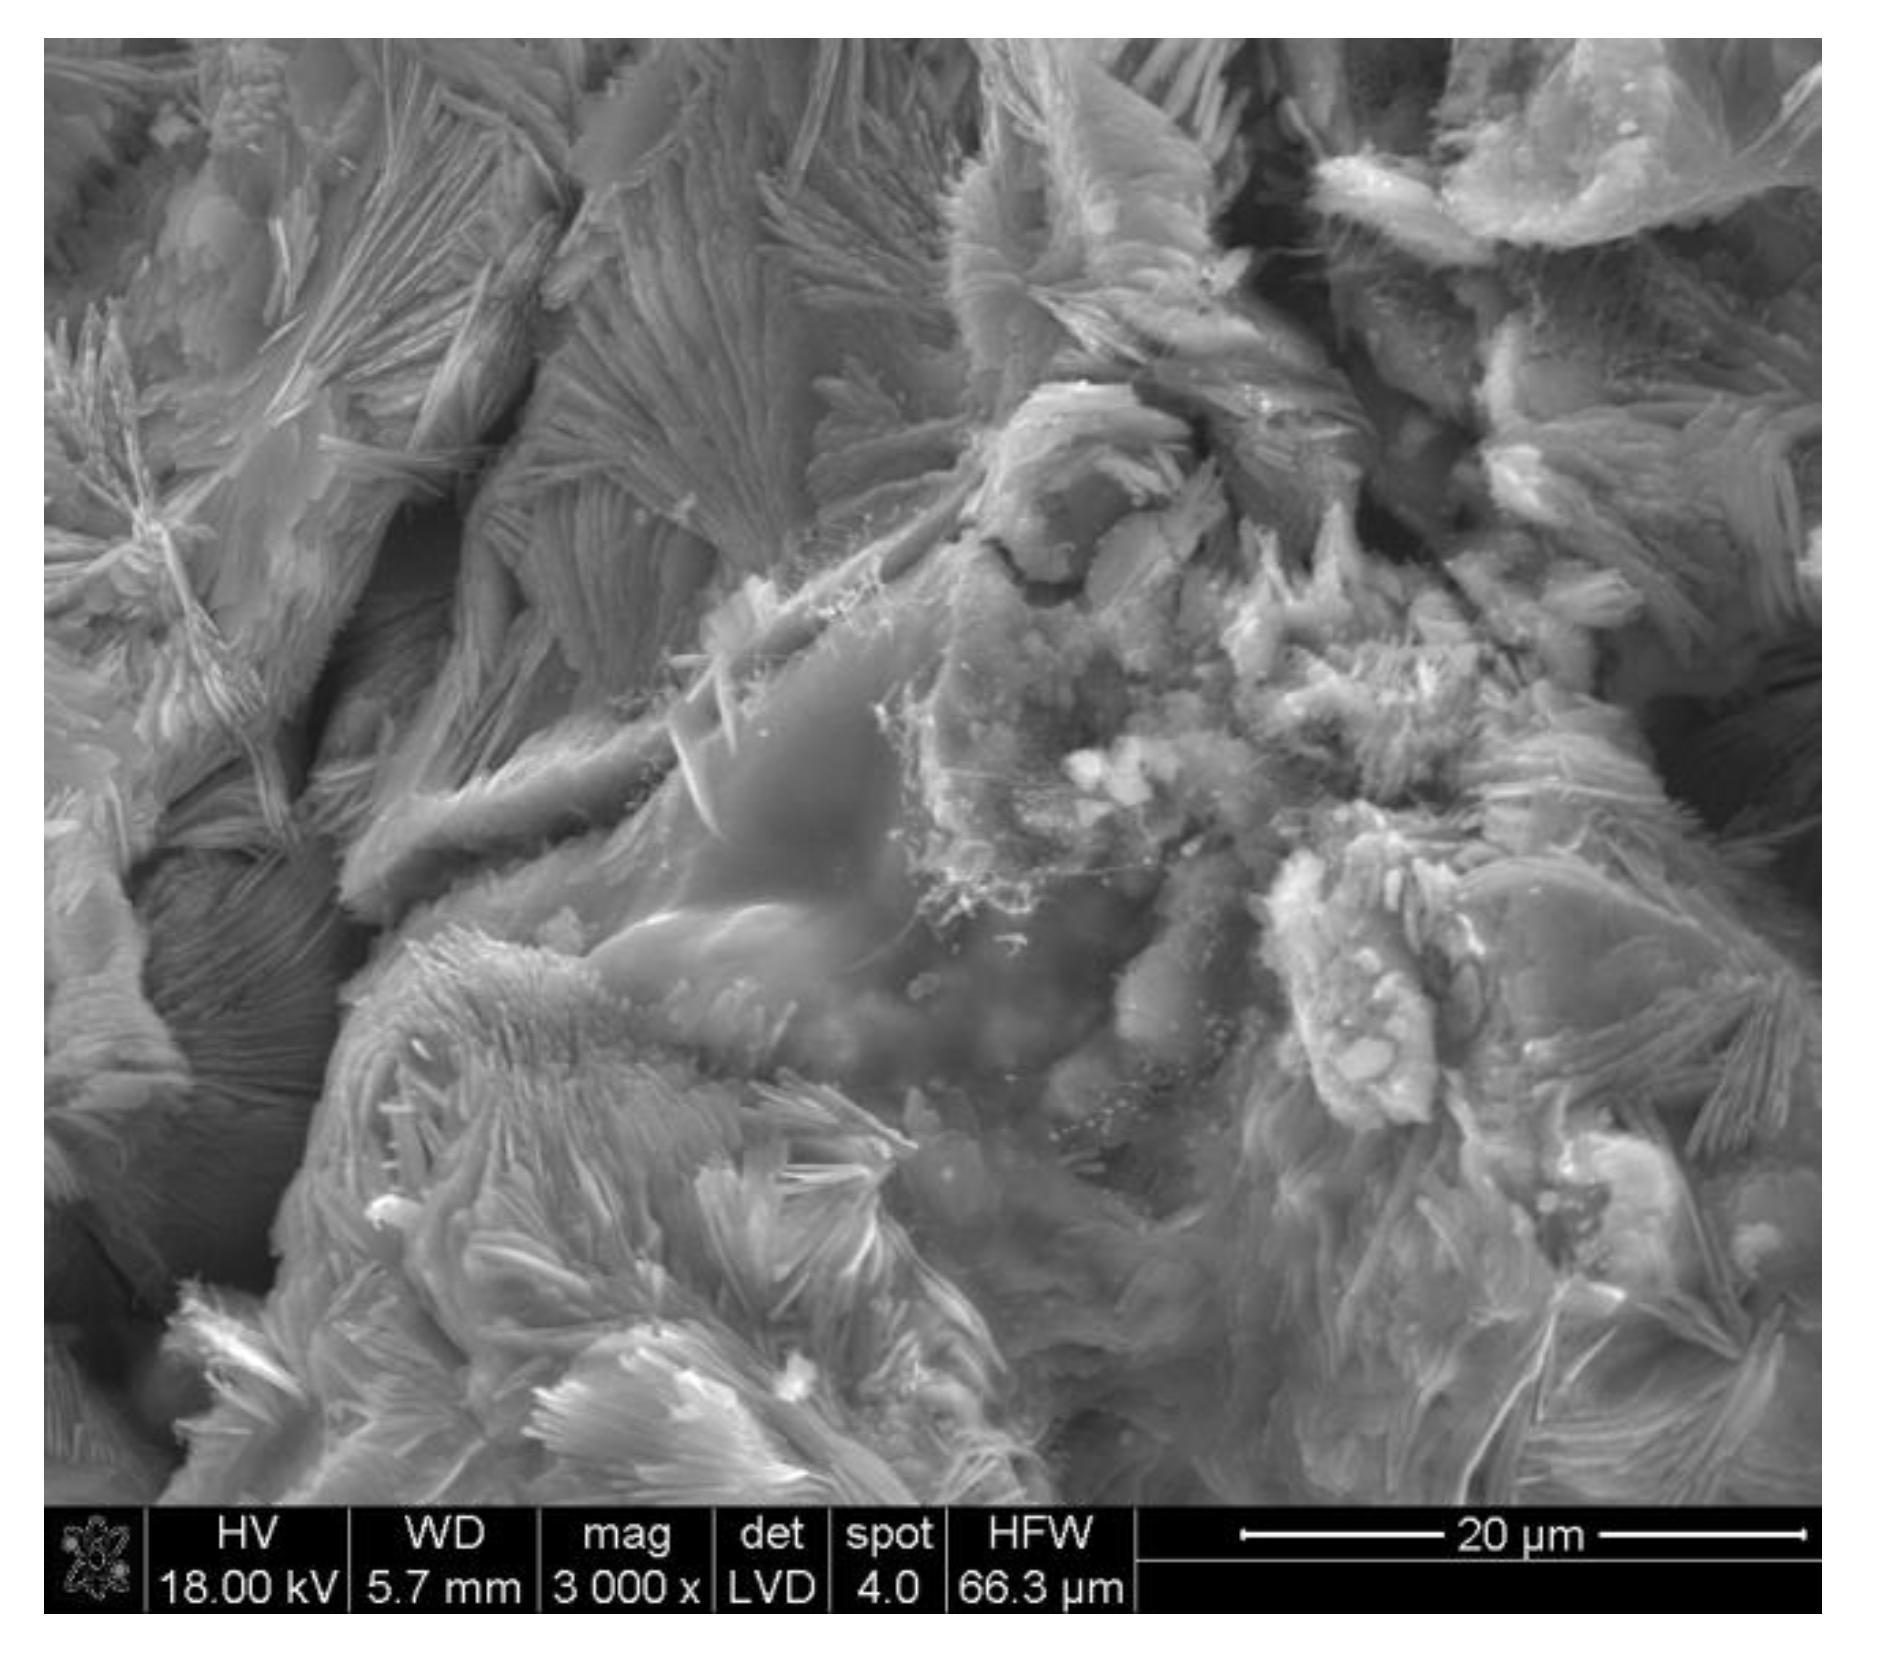
3.2.2. Microstructure SEM Analysis
4. Conclusions
Author Contributions
Funding
Acknowledgments
Conflicts of Interest
Nomenclatures
| OS | Quartz sand |
| GS | Glass sand |
| XRF | X-ray Fluorescence |
| SEM | Scanning Electron Microscope |
| XRD | X-ray Powder Ddiffraction [keV] |
| ρo | bulk density [kg/dm3] |
| δ | compressive strength [MPa] |
| ms | the mass of the dry sample |
| nw | impregnability of weight |
| mn | the weight of the wet samples |
| m | the weight of the dry samples |
References
- Burnol, A.; Blanc, P.; Xu, T.; Spycher, N.; Gaucher, E.C. Uncertainty in the Reactive Transport Model Response to an Alkaline Perturbation in a Clay Formation. In Proceedings of the Tough Symposium 2006 Lawrence Berkeley National Laboratory, Berkeley, CA, USA, 15–17 May 2006. [Google Scholar]
- Hong, S.Y.; Glasser., F.P. Phase relations in the CaO–SiO2–H2O system to 200 °C at saturated steam pressure. Cem. Concr. Res. 2004, 34, 1529–1534. [Google Scholar] [CrossRef]
- Galvánková, L.; Másilko, J.; Solný, T.; Štepánková, E. Tobermorite synthesis under hydrothermal conditions, International Conference on Ecology and new Building materials and products. Procedia Eng. 2016, 151, 100–107. [Google Scholar]
- Johnson, G.K.; Florow, H.E.; O’Hene, P.A.G. Thermodynamic Studies of Zeolites: Natrolite, Mesolite, and Scoleciter; Argonne National Laboratory: Argonne, IL, USA, 1983.
- Baltušnikas, A.; Lukošiūtė, I.; Baltakys, K. XRD Characterization of Organically Modified Gyrolite. Mater. Sci. 2009, 15, 1320–1392. [Google Scholar]
- Siauciunas, R.; Baltakys, K. Formation of gyrolite during hydrothermal synthesis in the mixtures of CaO and amorphous SiO2 or quartz. Cem. Concr. Res. 2004, 34, 2029–2036. [Google Scholar] [CrossRef]
- Merlino, S.; Bonaccorsi, E.; Armbruster, T. The real structures of tobermorite 11A: OD character and polytypic modifications. Eur. J. Mineral. 2001, 13, 577–590. [Google Scholar] [CrossRef]
- Kalousek, G.L.; Mitsuda, T.; Taylor, H.F.W. Xonotlite: Cell parameters thermogravimetry and analytical electron microscopy. Cem. Concr. Res. 1977, 7, 305–312. [Google Scholar] [CrossRef]
- Olenets, M.O.; Piotrowski, J.Z.; Stroy, A.F. Heat transfer and air movement in the ventilated air gap of passive solar heating systems with regulation of the heat supply. Energy Build. 2015, 103, 198–205. [Google Scholar] [CrossRef]
- Piotrowski, J.Z.; Stroy, A.F.; Olenets, M.O. Mathematical model of the thermal-air regime of a ventilated attic. J. Civ. Eng. Manag. 2015, 21, 710–719. [Google Scholar] [CrossRef]
- Arabi, N.; Jauberthie, R. Calcium Silicate Materials: Substitution of Hydrated Lime by Ground Granulated Blast Furnace Slag in Autoclaving Conditions. J. Mater. Civ. Eng. 2012, 24, 1230–1236. [Google Scholar] [CrossRef]
- Dachowski, R.; Kostrzewa, P. The Use of Waste Materials in the Construction Industry. Procedia Eng. 2016, 161, 754–758. [Google Scholar] [CrossRef]
- Dachowski, R.; Stepien, A. Mass of Silicate Products. Patent application P.396499, September 2011. [Google Scholar]
- Stepien, A.; Potrzeszcz-Sut, B.; Kostrzewa, P. Influence and application of glass cullet in autoclaved materials. IOP Conf. Ser. Mater. Sci. Eng. 2019. [Google Scholar] [CrossRef]
- Pytel, Z. The Influence of Ground Limestone on the Properties of Sand-Lime Bricks; Polish Ceramic Society: Krakow, Poland, 2005. [Google Scholar]
- Nocun-Wczelik, W. The Structure and the Most Important Properties of Selected Hydrated Calcium Silicate, Ceramika 59; Polish Ceramic Bulletin No 18: Kraków, Poland, 1999. [Google Scholar]
- Stepien, A. The impact of barium sulfate on the microstructural and mechanical properties of autoclaved silicate products. In Proceedings of the 9th International Conference Environmental Engineering (9th ICEE)-Selected Papers, Vilnius, Lithuania, 22–24 May 2014. [Google Scholar]
- Żórawski, W.; Makrenek, M.; Goral, A. Mechanical properties and corrosion resistance of HVOF sprayed coatings using nanostructured carbide powders. Arch. Met. Mater. 2016, 61, 1839–1846. [Google Scholar] [CrossRef]
- Balonis, M. Thermodynamic modelling of temperature effects on the mineralogy of Portland cement systems containing chloride. Cem. Concr. Res. 2019, 120, 66–76. [Google Scholar] [CrossRef]
- Deja, J.; Gołek, Ł.; Kołodziej, Ł.; Borowiec, P.; Bytnar, M. Formation of C–S–H, C–A–S–H and N–A–S–H gels in alkali activated fly ash binders. In Proceedings of the 13th CCC International Congress on the Chemistry of Cement, Madrid, Spain, 3–8 July 2011. [Google Scholar]
- Bekir Topc, L.; Canbaz, M. Properties of concrete containing waste glass. Cem. Concr. Res. 2004, 34, 267–274. [Google Scholar] [CrossRef]
- Niang, A.; Roy, N.; Tagnit-Hamou, A. Structural Behavior of Concrete Incorporating Glass Powder Used in Reinforced Concrete Columns. J. Struct. Eng. 2014. [Google Scholar] [CrossRef]
- Schwarz, N.; Hieu, C.; Narayanan, N. Influence of a fine glass powder on the durability characteristics of concrete and its comparison to fly ash. Cem. Concr. Res. 2008, 30, 486–496. [Google Scholar] [CrossRef]
- Shayan, A.; Xu, A. Performance of glass powder as a pozzolanic material in concrete: A field trial on concrete slabs. Cem. Concr. Res. 2006, 36, 457–468. [Google Scholar] [CrossRef]
- Shayan, A.; Xu, A. Value-added utilisation of waste glass in concrete. Cem. Concr. Res. 2004, 34, 81–89. [Google Scholar] [CrossRef]
- Tagnit-Hamou, A.; Soliman, N. Ultra-High Performance Glass Concrete and Method for Producing Same. International App. U.S. Patent 9,856,171, 2 January 2018. [Google Scholar]
- Levinskas, R.; Baltušnikas, A.; Lukošiūtė, I.; Baltakys, K.; Kalpokaitė-Dičkuvienė, R.; Grybėnas, A. Modification of structure of synthetic gyrolite. Mater. Res. Innov. 2013, 17, 495–500. [Google Scholar] [CrossRef]
- Kim, Y.S.; Grybėnas, A. Effect of load ratio and hydrogen concentration on the crack growth rate in Zr-2.5 Nb tubes. Mater. Sci. Eng. 2009, 520, 147–152. [Google Scholar] [CrossRef]
- Kunchariyakun, K.; Asavapisit, S.; Sombatsompop, K. Effect of Fine Al-Containing Waste in Autoclaved-Aerated. Concrete Incorporating Rice-Husk Ash. J. Mater. Civ. Eng. 2015, 27. [Google Scholar] [CrossRef]
- Kyristis, K.; Hall, C.; Bentz, D.P.; Meller, N.; Wilson, M.A. Relationship Between Engineering Properties, Mineralogy, and Microstructure in Cement-Based Hydroceramic Materials Cured at 200–350 °C. J. Am. Ceram. Soc. 2009, 92, 694–701. [Google Scholar]
- Milestone, N.B.; Ghanbari Ahari, K. Hydrotermal Processing of Xonotlite Based Compositions, Advances in Applied Ceramics (Structural, Functional and Bioceramics); Taylor & Francis: Abingdon, UK, 2013. [Google Scholar]
- Różycka, A.; Kotwica, Ł.; Małolepszy, J.; Jaśkiewicz, G. Synthesis of Gyrolite in the CaO–SiO2–Na2O–H2O System; Association of Cement Producers: Wisła, Poland, 2014. [Google Scholar]
- CEN. PN-EN 771-2: Specification for Masonry Units. Part 2: Calcium Silicate Masonry Units; CEN: Brussels, Belgium, 2010. [Google Scholar]
- Baltušnikas, A.; Lukošiūtė, I.; Levinskas, R.; Grybėnas, A.; Baltakys, K.; Eisinas, A. Analysis of rietveld method application for gyrolite crystal structure refinement. Mater. Sci. 2012, 18, 379–384. [Google Scholar] [CrossRef][Green Version]
- Baltakys, K.; Jauberthie, R. Formation and stability of C–S–H (I) of various degrees of crystallinity in the Ca(OH)2/CaO–Hi-Sil–H2O system. Mater. Sci. 2019, 27, 1077–1089. [Google Scholar]
- Baltakys, K.; SIauciunas, R.; Kitrys, S. Surface microstructure and specific surface area of pure and Na-substituted gyrolites. Mater. Sci. Poland 2008, 26, 633–645. [Google Scholar]
- Stepien, A. The impact of glass additives on the functional and microstructural properties of sand-lime bricks. In Proceedings of the 19th International Conference on Civil Engineering and Adapting Civil Engineering Practice, Rome, Italy, 5–6 March 2017. [Google Scholar]
- Bunaciu, A.A.; Udristioiu, E.G.; Aboul-Enein, H.Y. X-Ray Diffraction: Instrumentation and Applications. Crit. Rev. Anal. Chem. 2015, 45, 289–299. [Google Scholar] [CrossRef]
- Alhozaimy, A.; Fares, G.; Al-Negheimish, A.; Jaafar, M.S. The autoclaved concrete industry: An easy-to-follow method for optimization and testing. Constr. Build. Mater. 2013, 49, 184–193. [Google Scholar] [CrossRef]
- Bell, N.S.; Venigalla, S.; Gill, P.M.; Adair, J.H. Morphological Forms of Tobermorite in Hydrothermally Treated Calcium Silicate Hydrate Gels. J. Am. Ceram. Soc. 1996, 78, 2175–2178. [Google Scholar] [CrossRef]
- Taha, B.; Nounu, G. Utilizing Waste Recycled Glass as Sand/Cement Replacement in Concrete. Cem. Concr. Compos. 2008, 30, 497–505. [Google Scholar] [CrossRef]
- Riman, R.E.; Thomas, E.; Atakan, V.; Vakifahmetoglu, C.; Li, Q.; Tang, L. Synthetic Formulations and Methods of Manufacturing and Using Thereof. U.S. Patent No US 9.216,926 B2, 22 December 2015. [Google Scholar]
- Potrzeszcz-Sut, B.; Dudzik, A. The structural reliability analysis using explicit neural state functions. MATEC Web Conf. 2019, 262. [Google Scholar] [CrossRef]
- Wątroba, J. Wspomaganie Statystycznej Analizy Wyników Badań Empirycznych w Statistica 9, StatSoft Polska. 2009. Available online: https://www.statsoft.pl (accessed on 20 May 2019).
- Available online: http://www.metalogis.com/pl/baza-wiedzy/baza-wiedzy-spektrometry-xrf/304-spektrometria-xrf-podstawy-teoretyczne (accessed on 03 June 2019).
- Schott–Glass Made of Idea. Available online: www.schott.com/poland/polish/index.html (accessed on 12 December 2018).
- Nonat, A. Thermodynamic Modelling of C-S-H Composition in Neat and Blended Cement Pastes. In Proceedings of the 19th Ibausil Conference, Weimar, Germany, 16–18 September 2015. [Google Scholar]
- Richardson, I. Tobermorite/jennite-and tobermorite/calcium hydroxide-based models for the structure of C-S-H: Applicability to hardened pastes of tricalcium silicate, beta-dicalcium silicate, Portland cement, and blends of Portland cement with blast-fumace slag, metakaolin, or silica fume. Cem. Concr. Res. 2004, 34, 1733–1777. [Google Scholar]


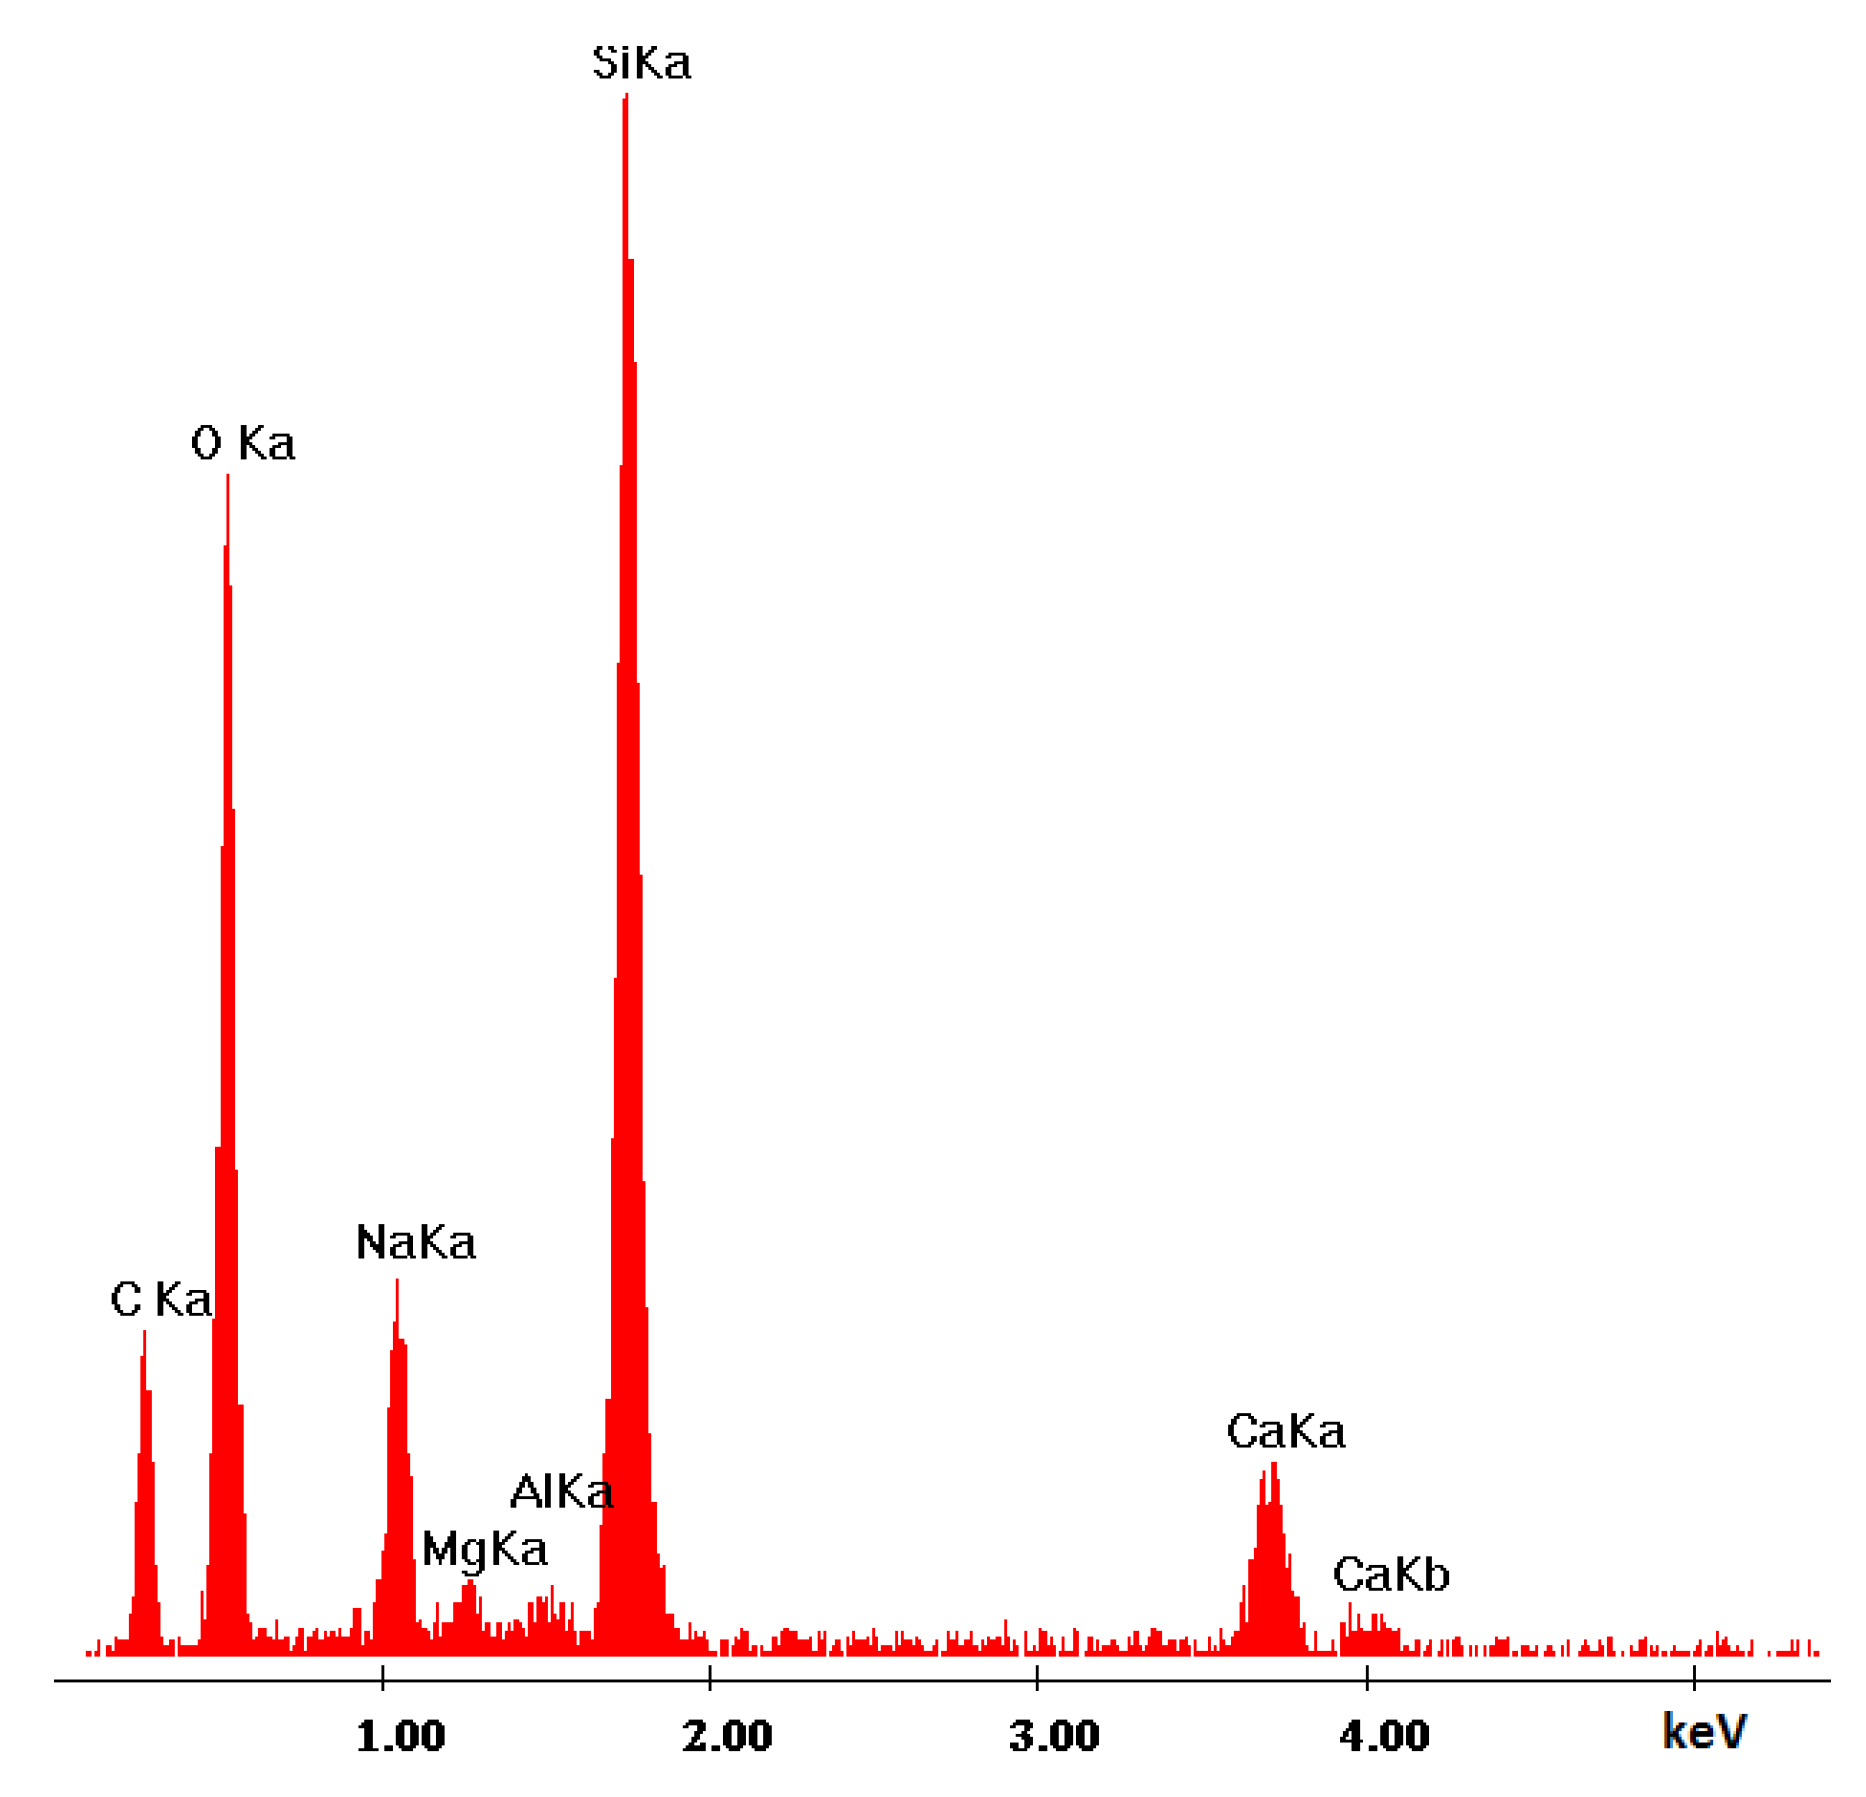
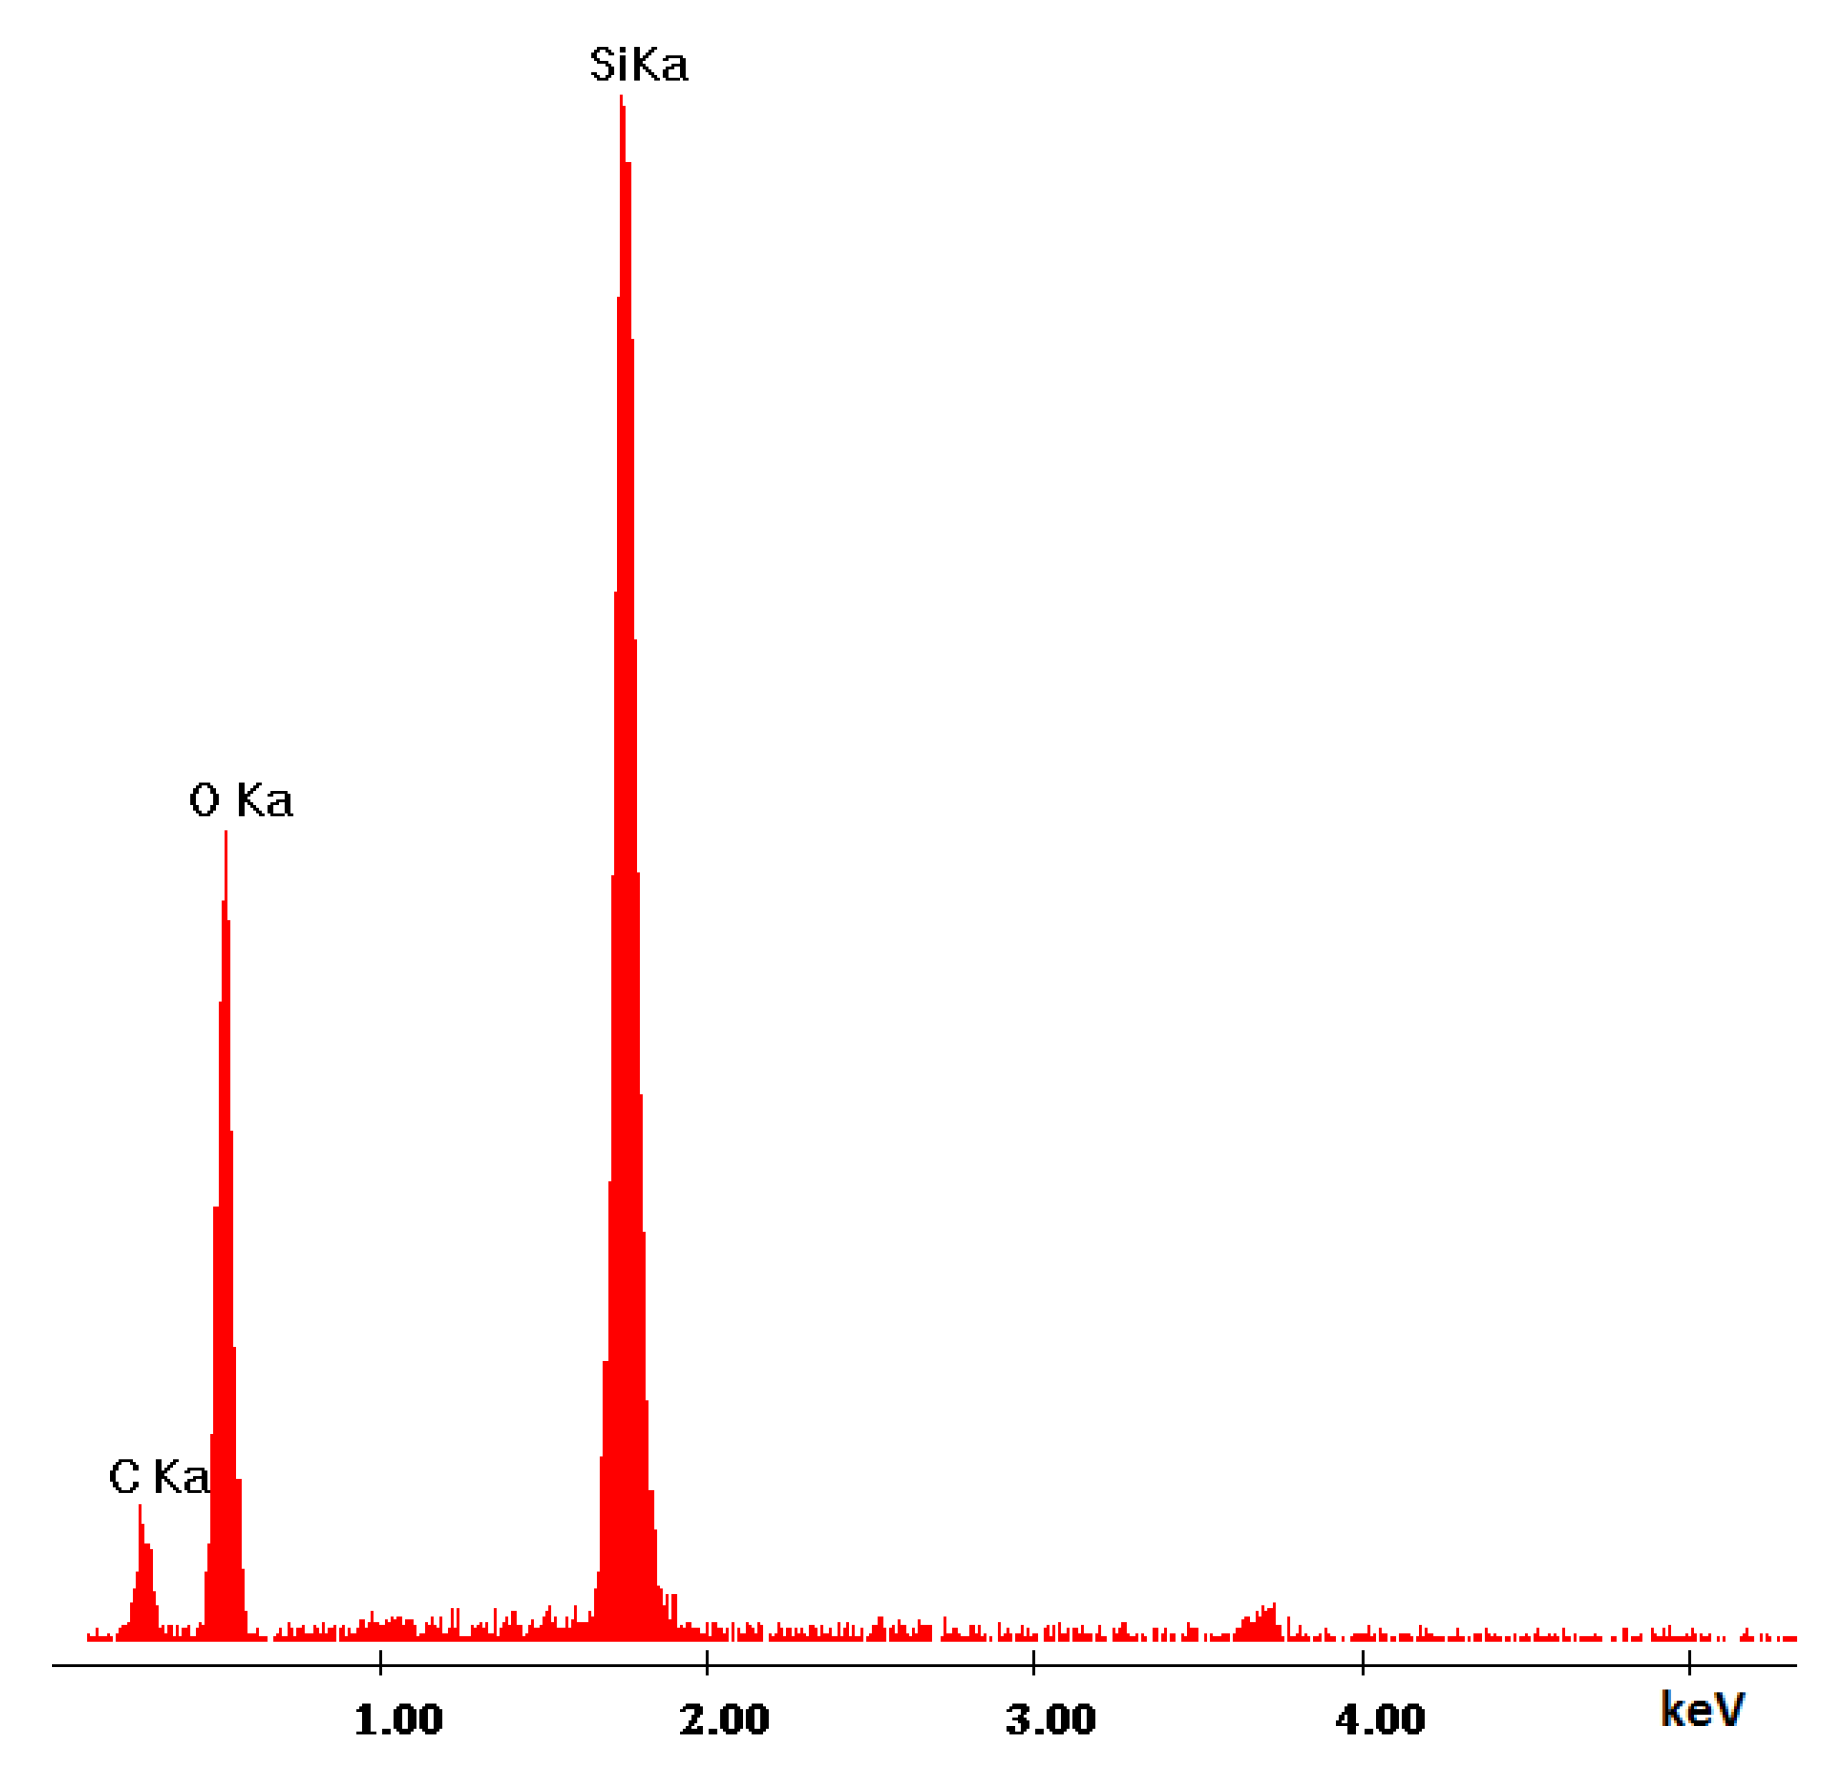
| Ref. Sample | With GS |
|---|---|
| Si | Si |
| Ca | Ca |
| Mg | Na |
| O | Mg |
| C | Al |
| Al | O |
| Fe | C |
| Plan of the Experiment | ||||
|---|---|---|---|---|
| OS [%] | GS [%] | Compressive Strength [MPa] | Bulk Density [kg/dm3] | Case |
| 90 | 0 | 5.25 | 1.92 | OS 90% + G S0% |
| 80 | 10 | 5.11 | 1.97 | OS 80% + GS 10% |
| 70 | 20 | 14.25 | 2.09 | OS 70% + GS 20% |
| 60 | 30 | 15.03 | 2.00 | OS 60% + GS 30% |
| 50 | 40 | 14.13 | 2.18 | OS 50% + GS 40% |
| 40 | 50 | 18.31 | 2.21 | OS 40% + GS 50% |
| 30 | 60 | 17.47 | 2.01 | OS 30% + GS 60% |
| 20 | 70 | 19.50 | 2.25 | OS 20% + GS 70% |
| 0 | 90 | 20.23 | 2.30 | OS 0% + GS 90% |
| XRF-CaO | XRF-Reference | XRF-GS | ||||||
|---|---|---|---|---|---|---|---|---|
| Final Weight CaO: | 7.7113 g | Final Weight SiO2: | 7.7073 g | Final Weight GS: | 7.7046 g | |||
| LOI (%): | 0.018 | LOI (%): | 0.018 | LOI (%): | 1.304 | |||
| Compound | Value | Unit | Compound | Value | Unit | Compound | Value | Unit |
| SiO2 | 1.691 | % | SiO2 | 100.306 | % | SiO2 | 71.2 | % |
| TiO2 | 0.026 | % | TiO2 | 0.022 | % | TiO2 | 0.1 | % |
| Al2O3 | 0.342 | % | Al2O3 | 0.091 | % | Al2O3 | 1.8 | % |
| Fe2O3 | 0.182 | % | Fe2O3 | 0.061 | % | Fe2O3 | 0.4 | % |
| Mn3O4 | 0.024 | % | Mn3O4 | 0.003 | % | Mn3O4 | 0 | % |
| MgO | 0.921 | % | MgO | 0.018 | % | MgO | 1.1 | % |
| CaO | 96.034 | % | CaO | 0.084 | % | CaO | 10.6 | % |
| K2O | 0.049 | % | Na2O | 12.4 | % | |||
| P2O5 | 0.006 | % | K2O | 0.6 | % | |||
© 2019 by the authors. Licensee MDPI, Basel, Switzerland. This article is an open access article distributed under the terms and conditions of the Creative Commons Attribution (CC BY) license (http://creativecommons.org/licenses/by/4.0/).
Share and Cite
Stepien, A.; Leśniak, M.; SITARZ, M. A Sustainable Autoclaved Material Made of Glass Sand. Buildings 2019, 9, 232. https://doi.org/10.3390/buildings9110232
Stepien A, Leśniak M, SITARZ M. A Sustainable Autoclaved Material Made of Glass Sand. Buildings. 2019; 9(11):232. https://doi.org/10.3390/buildings9110232
Chicago/Turabian StyleStepien, Anna, Magdalena Leśniak, and Maciej SITARZ. 2019. "A Sustainable Autoclaved Material Made of Glass Sand" Buildings 9, no. 11: 232. https://doi.org/10.3390/buildings9110232
APA StyleStepien, A., Leśniak, M., & SITARZ, M. (2019). A Sustainable Autoclaved Material Made of Glass Sand. Buildings, 9(11), 232. https://doi.org/10.3390/buildings9110232