Article

Ammonia in Fly Ashes from Flue Gas Denitrification Process and its Impact on the Properties of Cement Composites

Building Structures, Geotechnics and Concrete Department, Instytut Techniki Budowlanej, Filtrowa 1, 00-611 Warsaw, Poland
*
Author to whom correspondence should be addressed.
Buildings 2019, 9(11), 225; https://doi.org/10.3390/buildings9110225
Submission received: 28 August 2019 / Revised: 18 October 2019 / Accepted: 24 October 2019 / Published: 26 October 2019
(This article belongs to the Special Issue Advances in Sustainable Building Material Engineering)

Abstract

:
The paper presents the results of research on the properties of fly ashes from the process of flue gas denitrification by selective non-catalytic reduction (SNCR), consisting of dosing urea into the coal combustion chamber. The research was carried out on two types of fly ash: Silica fly ash from flue gas denitrification and ash from a traditional boiler without the flue gas denitrification process. The scope of comparative studies included physicochemical and structural features of ashes, as well as slurries and mortars with the addition of ashes. Fly ash from denitrification, whose ammonia content at the time of sampling was 75 mg/kg at the maximum, was examined. Our own research has shown that fly ash from flue gas denitrification is characterized by a higher value of losses on ignition and ammonia content in comparison to ashes without denitrification. It was shown that the ammonia content in the analyzed range does not limit the use of fly ash as an additive to cement and concrete.

1. Introduction

The management of fly ash—the byproducts of coal combustion—has long been a major issue in all countries that have based their energy mix on solid fuels. The system for the disposal of fly ash in the building materials industry has been well developed for many years. Nowadays, thanks to its properties and competitive price, siliceous fly ash is no longer a waste from coal combustion processes, but, above all, a valuable mineral additive used in the construction industry, which matches the definition of a sustainable building material. In concrete technology, fly ash is used as the main component of common cements and as an additive to concrete. Siliceous fly ash enters the so-called pozzolanic reaction with cement components to form a durable calcium silicate hydrate (CSH) phase responsible for the strength of cement composites [1,2,3]. In addition, the spherical shape of fly ash results in better workability of concrete products. It is also possible to use fly ash as an additive in the process of production of pre-cast concrete flooring items (vibropressed paving stones, etc.), bricks, hollow bricks, as a bulk and filling material, and as a material for improving building soils. The properties of fly ashes are determined by many factors, the most important of which include: Type of coal burnt; type of installation in which coal is burnt, i.e., boiler type; method of fuel preparation and technological conditions of combustion; method of ash capture, removal, and storage; and technology for removing harmful SO2 and NOx oxides emitted from flue gases to the atmosphere [4,5,6,7,8].
The principles of sustainable development, based on environmental protection and public safety [9,10], introduce and oblige the European Union countries to comply with increasingly stringent environmental requirements. Directive 2010/75/EU of the European Parliament and of the Council of 24 November 2010 on industrial emissions (integrated pollution prevention and control)—commonly referred to as the IED Directive [11]—imposes new, more restrictive requirements on power plants and combined heat and power plants with respect to industrial gas emissions, including carbon oxides, sulphur oxides, and nitrogen oxides. Meeting these new standards, especially with regard to nitrogen oxides, entails the need to modify coal combustion installations in power plants and combined heat and power plants.
Currently, the methods of nitrogen oxide reduction, which allow to meet the requirements concerning NOx emissions, include methods based on the injection of ammonium compounds [12,13,14]. This process is usually carried out in one of two ways: Selective catalytic reduction (SCR) and selective non-catalytic reduction (SNCR). In this study, the tested fly ashes originate from flue gas denitrification by the SNCR method, in which ammonium compounds (e.g., urea) are injected into the combustion chamber.
More and more often, it is reported that the processes of flue gas denitrification, apart from the beneficial effect of removing nitrogen oxides from flue gases, also result in the presence of ammonia or ammonium compounds in fly ashes (so-called ammonia slip) [13,14,15,16,17,18]. These changes may significantly affect the quality of volatile siliceous ashes, widely used in concrete technology as the main component of common cements and as an additive to concrete [19,20,21]. There is a concern that ammonia present in fly ash after denitrification may impair the properties of fly ash and thus affect the performance characteristics of cement and ash products. Deterioration in the performance of fly ash relevant to construction may result in a reduction in demand for ash in this market area.
The issue is all the more difficult because in the current standard requirements for fly ash used in construction (in cement and concrete), there are no requirements for the content of ammonia in ash. Another important aspect is the emission of gaseous ammonia from construction products [22,23,24,25] containing fly ash from denitrification, which is important for buildings and other enclosed spaces (risk of poisoning).
Widely used siliceous fly ash is a sustainable material in the building industry through the use of waste material and simultaneous improvement of the properties of cement composites. Identifying the changes that will occur in the new fly ash after the process of denitrification of flue gases, which may affect their further use, makes this study justified.
The paper presents the results of investigations of ammonia content in fly ash from the process of denitrification by SNCR, consisting of injection of urea solution into the combustion chamber and the necessity of lowering the combustion temperature. The results of investigations of physicochemical properties of fly ash and selected features of cement slurries and mortars containing fly ash are also presented.

2. Materials and Methods

2.1. Materials

In this study, siliceous fly ash from combustion of hard coal in one of the Polish power plants was used. Material for the study was collected in five batches at two-month intervals. Samples of fly ash were taken from the power plant simultaneously from two power units—one with a flue gas denitrification installation using the method of SNCR (these samples were marked as ODA—fly ash from denitrification), and the other (reference) which did not have a denitrification installation and had a similar load (unit active power) as the boiler with denitrification (these samples were marked as WZ—reference fly ash without denitrification). Fly ash for tests came from combustion of hard coal only, except for the reference sample from the fourth sampling (4 WZ), which came from co-combustion of coal and biomass (biomass mass share 1.8%).
Samples from electrostatic precipitators were taken every two hours during one day, then averaged, and thus a daily sample for laboratory tests weighing about 50 kg was created. Power plant lab personnel determined the ammonia content in ash in daily samples. After delivery to the laboratory, the material was homogenized again and then stored for testing in sealed containers at 20 °C.
Samples taken in pairs at four different dates were marked as 1 WZ, 1 ODA, 2 WZ, 2 ODA, 3 WZ, 3 ODA, 4 WZ, and 4 ODA, respectively, and were subjected to the tests described herein. In addition, three samples labeled as 5 ODA, 6 ODA, and 7 ODA were taken to investigate the changes in ammonia content.

2.2. Methods

Almost all tests (except for tests for ammonia content) were carried out in a comparative manner for each batch of fly ash—fly ash from SNCR denitrification (ODA) and reference ash (WZ) without denitrification were simultaneously tested. In addition to testing the properties of fly ash, tests were carried out on cement slurry and mortar with the addition of fly ash. The slurry was characterized by its composition: 30% fly ash (WZ or ODA), 70% CEM I 42.5 R cement, and water-binding index w/s = 0.28. The amount of fly ash (30%) was selected due to the fact that, according to current standards of production of cement/ash composites, this amount is usually added to cement and ash concretes as maximum. The amount of water was selected from the standard consistency in the ash setting time study. For structural tests, beams of 40 × 40 × 160 mm from slurry were formed in accordance with the PN-EN 196-1 [26] standard and tested after 7 days of curing in temperature 20 ± 2 °C and relative humidity ≥95%. The mortars studied consisted of 450 g of binder (30% mass of WZ or ODA ash, 70% mass of CEM I 42.5 R cement), 1350 g of CEN standard sand, and 225 g of tap water.
Ash tests included: Ammonia content tests, chemical tests, physicochemical tests according to PN-EN 450-1 [27] standard requirements, granulometric composition, phase composition tests, and microscopic structural tests. Mortars were tested for phase composition by thermal analysis and X-ray diffraction, as well as the structure under a scanning microscope. For cement and ash mortars, the following measurements were made: Consistency, air content, bulk density of fresh mortar, flexural and compressive strength, shrinkage, and absorbability.
Tests of ammonia content were performed on water leachate at a weight ratio of 1:10, in accordance with PN-EN 12457-4 [28]. The ammonia content was evaluated by spectrophotometric method. The result obtained from the ammonia concentration in the solution was then converted into ammonia content in ash. The research was carried out in different time intervals: Short-term measurements (about one month—two months from the moment of collecting from the power plant) and long-term measurements (after about two years) were made. Ashes were stored in laboratory conditions in tightly closed plastic containers. During the first 100 days, the containers were opened, the samples were mixed for sampling for other tests, and afterwards the containers were not opened until the ammonia test.
The analysis of the particle size distribution was performed with the use of the Mastersizer 2000 particle size analyzer.
The chemical composition was studied using fluorescent X-ray spectrometry with wavelength dispersion (WD-XFR), Philips PW 2400 spectrometer (melted samples).
Phase composition by X-ray diffraction analysis was examined on VEB Freiberger Pragisionsmechanik TUR-M-62 X-ray apparatus. The diffractograms were performed in the range of 2θ 6–66°, the source of radiation was CuK X-ray tube with monochromator, working parameters 40 kV/20 mA, step 0.05 s, time constant 5 s. The tests were carried out on samples sieved entirely through a 0.063 mm sieve. For phase identification, the X-Rayan program and PDF-2 database were used.
Tests using the TG/DTA/DTG thermal differential analysis method were performed on the STD Q600 temogravimetric analyzer manufactured by TA Instruments. The measurements were made in the air atmosphere in the temperature range of 20–1000 °C. The temperature was increased 10 °C /min. Platinum crucibles were used to test the samples. The weighted amount of each sample was about 20 mg. TG, DTA, and DTG curves were recorded in the temperature range of 20–1000 °C.
Structural microscopic examinations were carried out with a Jeol 35C microscope and with a LEO 1430 scanning electron microscope equipped with an Oxford ISIS 300 energy dispersion detector (EDS). Both fresh fractures and polished sections of selected samples were examined. The image was recorded both in the spectrum of back scattered electrons (BSE) and secondary electrons (SE). The samples were vapor deposited with gold (fractions) and carbon (polished sections).
Tests of fly ash properties according to PN-EN 450-1 [27] standard included: Chemical composition (content of chlorides, sulphates, calcium, magnesium, phosphates, alkali, free calcium oxide, reactive calcium oxide CaO, reactive silicon dioxide, content of sum of SiO2, Al2O3, Fe2O3, loss on ignition), fineness, (pozzolanic) activity index, soundness, grain density, initial setting time, water requirement.
Tests of performance characteristics of cement and ash mortars were performed in accordance with the following standards: Consistency (with the method of flow table according to PN-EN 1015-3 [29]), air content (with pressure method according to PN-EN 1015-7 [30]), volume density of fresh mortar (according to PN-EN 1015-6 [31]), flexural and compressive strength (according to PN-EN 1015-11 [32]), shrinkage and water absorption (according to PN-B-04500 [33]).

3. Results

3.1. Fly Ash Tests

3.1.1. Ammonia Content in Fly Ash

The results of analysis of the ammonia content in fly ash from denitrification with the SNCR method (ODA samples) at different time intervals are shown in Table 1 and Figure 1. Ammonia was found in all fly ash samples from the denitrification process. At the time of collection (at t0 time), its amount oscillated between 25–75 mg/kg and quickly decreased due to laboratory operations (in the first 20 days, it decreased to 20 to 60% of the initial value). Further storage in tightly closed containers did not cause any drastic change: The ammonia content decreased slowly and the difference did not exceed approximately 10 mg/kg for 2 years.
In order to determine the effect of homogenization and frequent opening of containers upon significant ammonia loss during the first 100 days, two additional samples (6 ODA and 7 ODA) were used for short-term ammonia testing. Contrary to the previous samples, the containers with these samples were only opened for testing ammonia content (Figure 2).
Sample 6 ODA was characterized by an abnormally high (as for the examined ashes) concentration of ammonia, −171 mg/kg, while sample 7 ODA was typical (46 mg/kg). Short-term studies have shown that fly ash, regardless of its initial concentration and frequency of opening, similarly to fly ash studied in long-term studies, shows a large loss of ammonia during the first 20 days, and then its content stabilizes.

3.1.2. Comparative Ash Testing

The chemical composition (by WD-XFR method) of the samples taken is presented in Table 2. The variability in the composition of ODA and WZ ashes was not significant. No clear correlation was found between the type of ash and the chemical composition. The exception was the loss on ignition (LOI), which was significantly higher in the ashes from denitrification than in the reference ashes (higher by 1.3 to 2.6 times). The grain size of both types of ash was similar. The maximum grain size did not exceed 500 μm. According to the results, fly ashes from the ODA flue gas denitrification process usually have a slightly higher percentage of grains, with a diameter of about 100 µm and a lower percentage of grains in the range of 10 µm, than WZ ashes. Figure 3 shows the grain size distribution by laser diffraction for 1 WZ and 1 ODA ash. The other samples show a similar grain distribution.
The results of the above tests were confirmed by microscopic observations under the scanning microscope, presented in Figure 4. Microscopic observations were made at a magnification of 400× and 1000×, for both WZ and ODA ashes. Both types of ash were dominated by regular, round grains of different sizes, typical of fly ashes. However, ODA samples were characterized by a remarkably higher amount of large, irregular grains, which were unburnt parts of coal (loss on ignition).
Figure 5 shows the phase composition of 1 WZ and 1 ODA samples; the other batches showed similar phase composition. The samples did not show any significant quality differences, either between individual batches or between ODA and WZ reference samples. The phase composition analyzed by X-ray diffraction of WZ and ODA ashes was dominated by the phases typical for silica ashes: Mullite (3Al2O3–2SiO2), quartz (β-SiO2), hematite (α-Fe2O3), and trace amounts of magnetite (Fe3O4), hercynite (FeAl2O4), and periclase (MgO). The reflections of the latter were usually superimposed by the reflections of stronger phases. Elevated background in the range 15–40 2θ indicated the presence of significant amounts of amorphous phase.
Figure 6 shows thermogravimetric curves of fly ash samples with denitrification and without denitrification for an exemplary batch 1 (1 WZ and 1 ODA). During heating of the samples in air atmosphere to 1000 °C, in both samples, exothermic effect with maximum at temperature of about 600 °C was observed due to the presence of unburnt coal in the ashes. Mass loss in the temperature range of 400–800 °C confirms previous studies on higher value of losses on ignition (unburnt coal) in fly ashes from flue gas denitrification. Fly ashes from the other batches showed a similar phase composition.
For samples numbered from 1 to 4, full tests were additionally performed according to PN-EN 450-1 [27] standard—fly ash for concrete, part 1: Definitions, specifications and conformity criteria (Table 3). The results of chemical tests confirmed the XRF tests—no significant differences were found in the chemical composition, including the content of free calcium oxide, reactive calcium oxide, or reactive silicon dioxide. No correlation was found between the type of ash and such features as: Density, soundness, and the initial setting time. The case looked slightly different in respect to fineness, pozzolanic activity index, and water demand. As expected, the fineness of ODA ashes was significantly higher than that of WZ samples (with the exception of ash from co-combustion, 4 WZ, which was characterized by greater fineness and greater pozzolanic activity than the ash from the boiler with denitrification). ODA ashes were also characterized by significantly higher water requirement and lower pozzolanic activity index (both after 28 and 90 days).

3.2. Testing of Cement and Ash Slurries and Mortars

3.2.1. Comparative Testing of Slurries Made from Denitrification Ash and Reference Ash

After 7 days of hydration, cement slurries with 30% addition of WZ showed the same phase composition as slurries with 30% addition of ODA ashes (Figure 7). The main phases were cement hydration products: Alite 3CaO–SiO2 (tricalcium silicate), belite 2CaO–SiO2 (dicalcium silicate), tricalcium aluminate 3CaO–Al2O3, portlandite Ca(OH)2, calcite (CaCO3), and fly ash phases such as mullite 3Al2O3–2SiO2 and quartz β-SiO2. A diffractogram of cement slurries with 30% of 1 ODA and 1 WZ ashes after 28 days had the same characteristics and the same crystalline phases.
The thermal analysis of the phase composition of cement slurries with the addition of fly ash from the third sampling (3 WZ and 3 ODA) after 28 days of curing are presented in Figure 8 and Figure 9. The tests showed small quantitative differences between the samples of WZ and ODA ashes. The same thermal effects, characteristic of typical cement slurries, related to the dehydration of C–S–H and C–A–S–H gel phase (endothermal effect in the temperature range 50–300 °C), portlandite dehydration (endothermal effect in the range 400–500 °C), and carbonate decarboxylation (endothermal effect in the range 500–700 °C) could be identified on all thermograms. The differences concerned mainly the loss of weight associated with the decomposition of portlandite and carbonates. ODA samples were usually characterized by slightly lower portlandite content and higher carbonate content. Mass losses in other temperature ranges were similar.
Figure 10 depicts selected photographs of fracture surfaces of analyzed cement slurry samples with the addition of 30% of traditional silica ash without denitrification (WZ), taken with the use of a scanning electron microscope after 7 days of hydration. Figure 11 presents the microstructure of slurries with 30% of fly ash from flue gas denitrification (ODA). In Figure 12, the structures of both slurries in the BSE image were compared. No significant changes in microstructure were observed.
In both types of samples (Figure 10, Figure 11 and Figure 12), the structure is comparable, typical for cement slurry with fly ash, compact, with the C–S–H gel phase. In some places, the fibers of the C–S–H phase, occasionally ettryngite or portlandite plates, are visible.

3.2.2. Comparative Tests of the Performance Characteristics of Cement and Ash Mortars

Table 4 presents a summary of the results of tests of selected performance characteristics of mortars with the addition of the tested fly ashes. No clear correlation between ash origin and consistency, air content, volume density, or shrinkage was found. Small dependencies were observed in the case of absorbability (mortars with ashes from the denitrification showed slightly higher absorbability) and strength (compression strength of mortars with ashes from the denitrification was slightly lower than of mortars with WZ ashes). The exception was a pair of ashes number 4, where ODA ashes showed higher strength.

4. Discussion

Ammonia was found in fly ash from SNCR denitrification. Figure 1 shows that the concentration of ammonia in fly ash from the moment of collecting in a power plant decreases quite quickly through homogenization, reduction, quartering, and frequent sampling for other tests in a laboratory. The results of the study show that the initial rapid decrease in ammonia concentration ceased after 20 days and then the concentration remained at a similar level, without any tendency for a regular, steady decrease.
The analysis of the microstructural and phase composition test results allows to state that the process of urea injection into the coal combustion chamber did not cause the formation of new crystalline phases in ash, and the WZ and ODA ashes were characterized by a similar phase composition. Also, cement slurry with 30% WZ fly ash addition after 7 days of hydration showed the same phase composition as slurry with 30% ODA ash addition. Thermal analysis tests lead to a statement that slurry with 30% ODA ash is usually characterized by a slightly lower amount of portlandite and a slightly higher amount of calcite than slurries with 30% WZ ash. However, these differences are not large enough to allow to consider, at this stage, a different course of the hydration process. Different contents of portlandite and calcite may have been caused by different porosity of the samples, which resulted in a different degree of carbonization of the slurries during drying. After converting the calcite content into the original content of the portlandite it originated from, it can be concluded that there are no significant differences between slurries containing the ODA and WZ ashes.
Microscopic images of slurries with 30% ODA ash after 7 days of hydration show no significant differences in comparison to slurries with WZ ash. In both cases, the hydration of cement resulted in the formation of C–S–H gel phase form, shallow forms of portlandite, and needle forms of ettringite. Spherical grains of unreacted fly ash are seen (Figure 11b) and grains whose surface has been modified by hydration (Figure 11c,d). The structure of the 7-day cement and ash slurries (ODA) is typical.
All tested samples met the requirements of PN-EN 450-1 [27] for fly ash of ignition loss category A and fineness N. No significant differences were observed in the chemical composition of ashes from boilers with flue gas denitrification installation (ODA) compared to reference ashes from boilers without such a system (WZ).
When analyzing the effect of denitrification on the change in physical properties of fly ash (Table 3), small differences in the fineness and activity index (pozzolan) were observed. ODA samples from batches 1 to 3 were slightly finer, while 4 ODA samples were smaller than WZ samples from the same batch. The activity of ODA ashes was also lower than that of WZ ashes, with the exception of samples from the fourth batch. Differing results of some tests for sample 4 WZ may be caused by the fact that it was the only one created in the process of co-combustion of coal dust with biomass.
A significant influence of the denitrification process on the increase of the value of ignition losses in ashes from ODA denitrification was found (Table 3), which ranged from 160 to 220% of the value of the reference WZ ashes. It should be noted, however, that in no case did the increase in ignition losses result in a change in the category of ash assessed in accordance with the requirements of PN- EN 450-1 [27]. The higher content of ignition losses in ODA ashes may have been the cause for the observed increased water requirement of ODA ashes and may have had an impact on some of the tested performance characteristics of slurries and mortars.
Differences between the results of mortar tests (Table 4) were compared to the uncertainties of test methods, and if they were in the range of double value of uncertainty, they were classified as “not significant”. The value of uncertainty for each method was calculated using the knowledge about used instruments for analyses and standard variations of results received in series of tests
Analyzing the characteristics of fresh cement mortar with 30% ash addition, no significant differences were found between ashes derived from ODA flue gas denitrification and WZ standard ashes. Shrinkage tests after 3, 7, 14, 28, and 90 days of hardening did not show any significant differences in the values of linear changes in mortars containing ODA ashes compared to ones with WZ reference ashes. Mortar bending and compressive strength tests were also carried out in various hardening periods (after 7, 28, 90, and 180 days). Mortars with the addition of ODA and WZ ashes were characterized by similar values of flexural and compressive strength. However, a slight increase in water absorption of mortars containing 30% of ODA ashes was observed in comparison to mortars containing 30% of WZ ashes. However, these differences are not large enough to be relevant for concrete technology. The results of the above investigations show that there were no significant differences in selected properties of fresh and hardened cement mortars containing ODA ashes compared to mortars with WZ ashes (Table 4).

5. Conclusions

  • The studies conducted so far to analyze the influence of the selective non-catalytic reduction denitrification process on the quality of fly ashes have shown that differences in the properties of fly ashes from the flue gas denitrification by SNCR as compared to traditional ashes are mainly limited to the increase of loss on ignition of ash and to the ammonia content in the ashes. The observed changes appear to be reasonable, taking into account the modification of the combustion process itself.
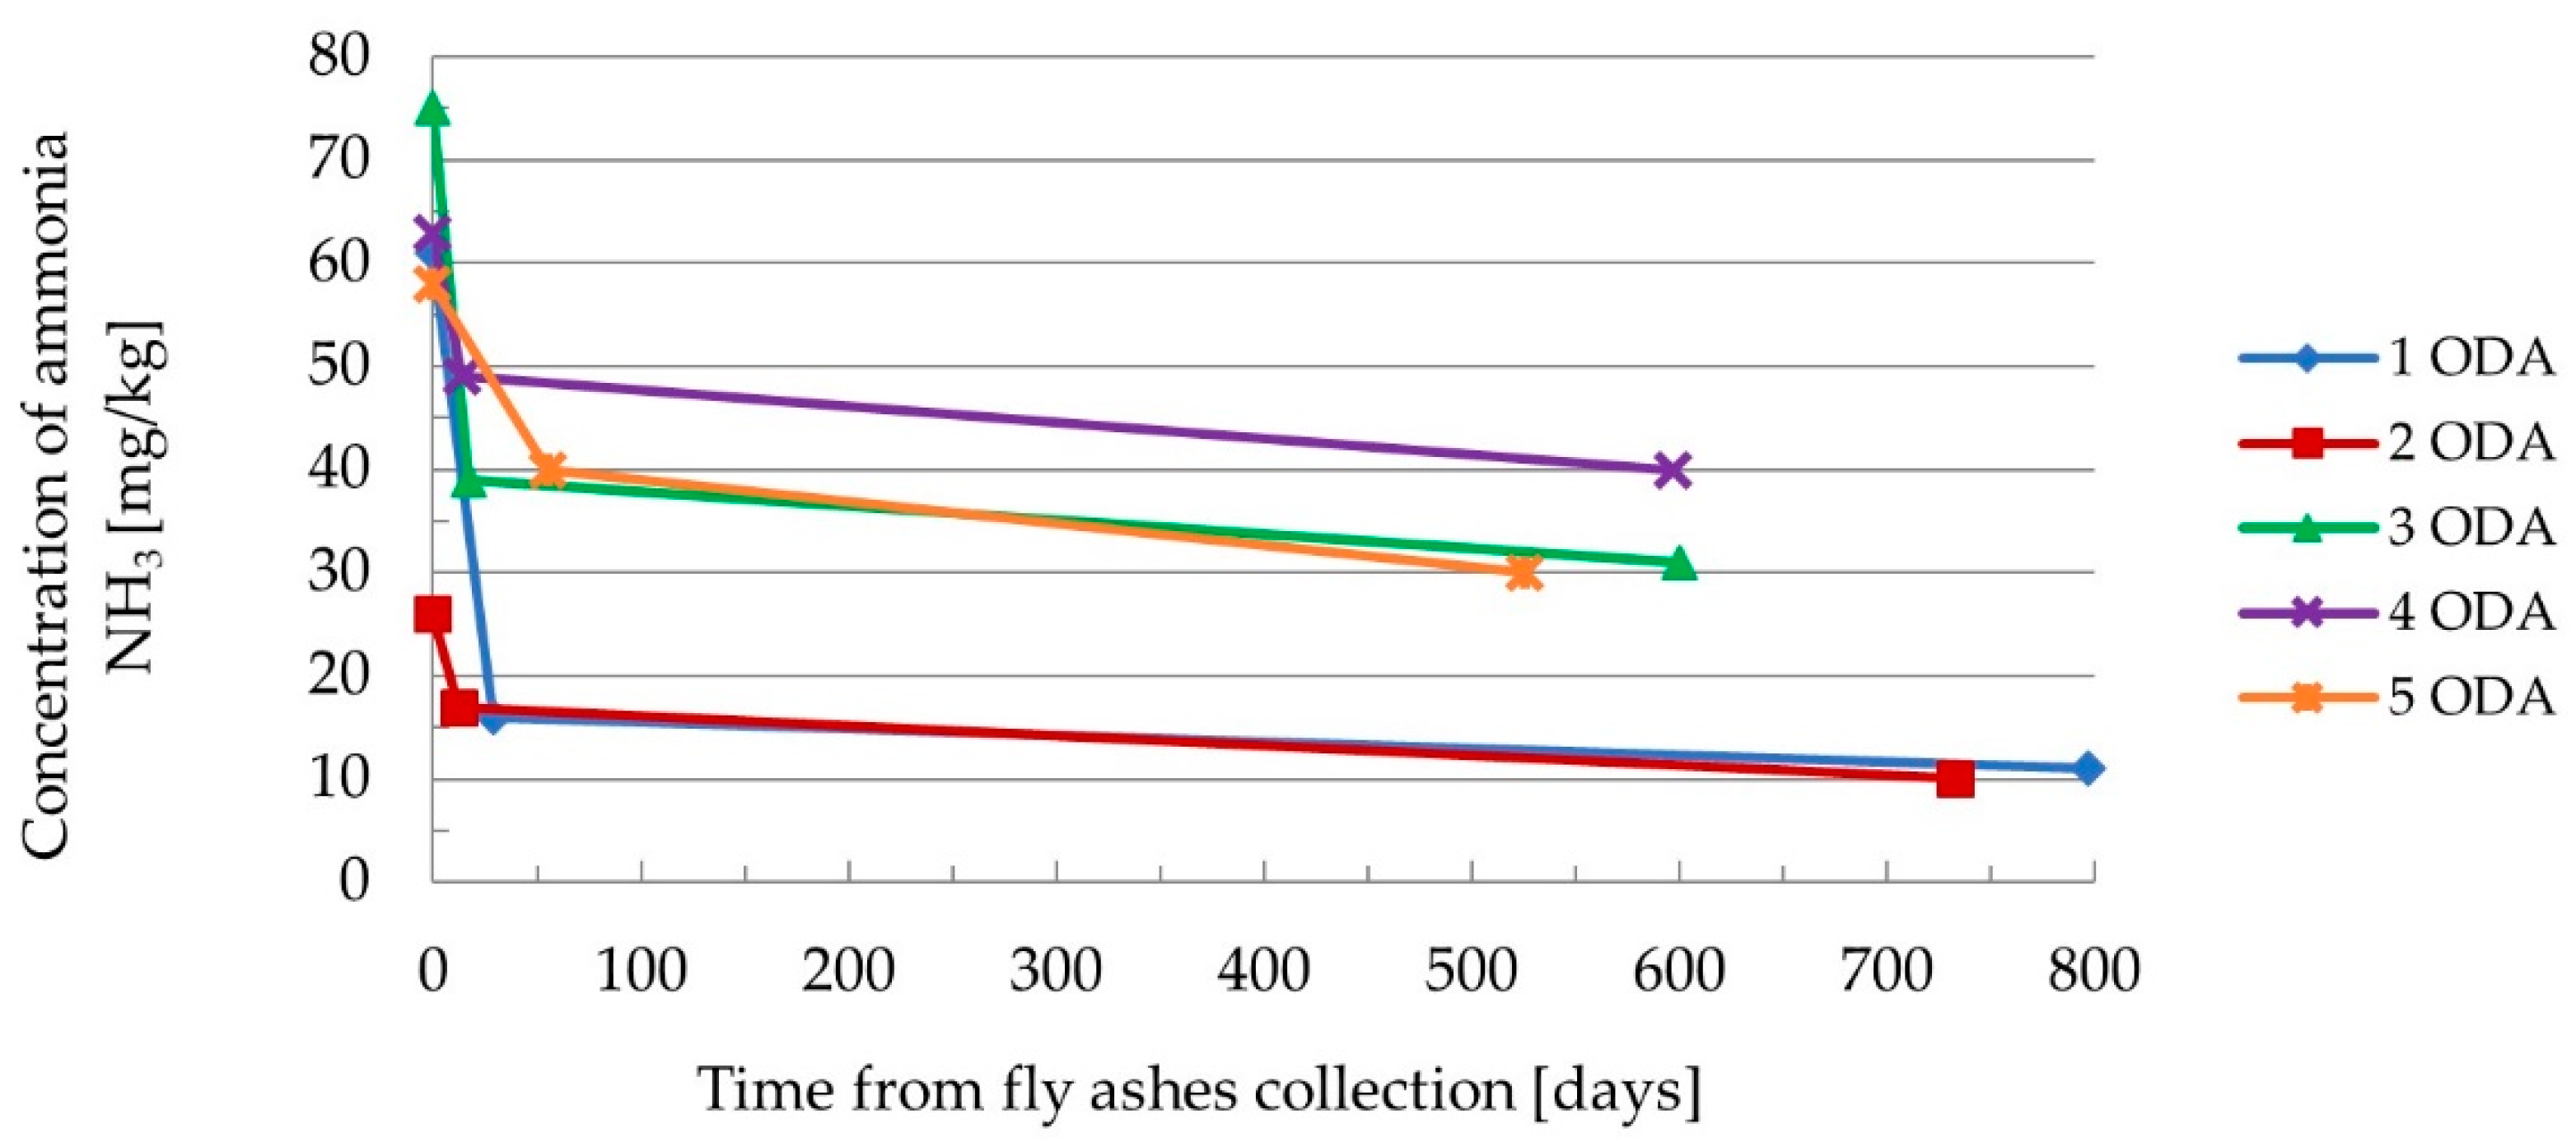
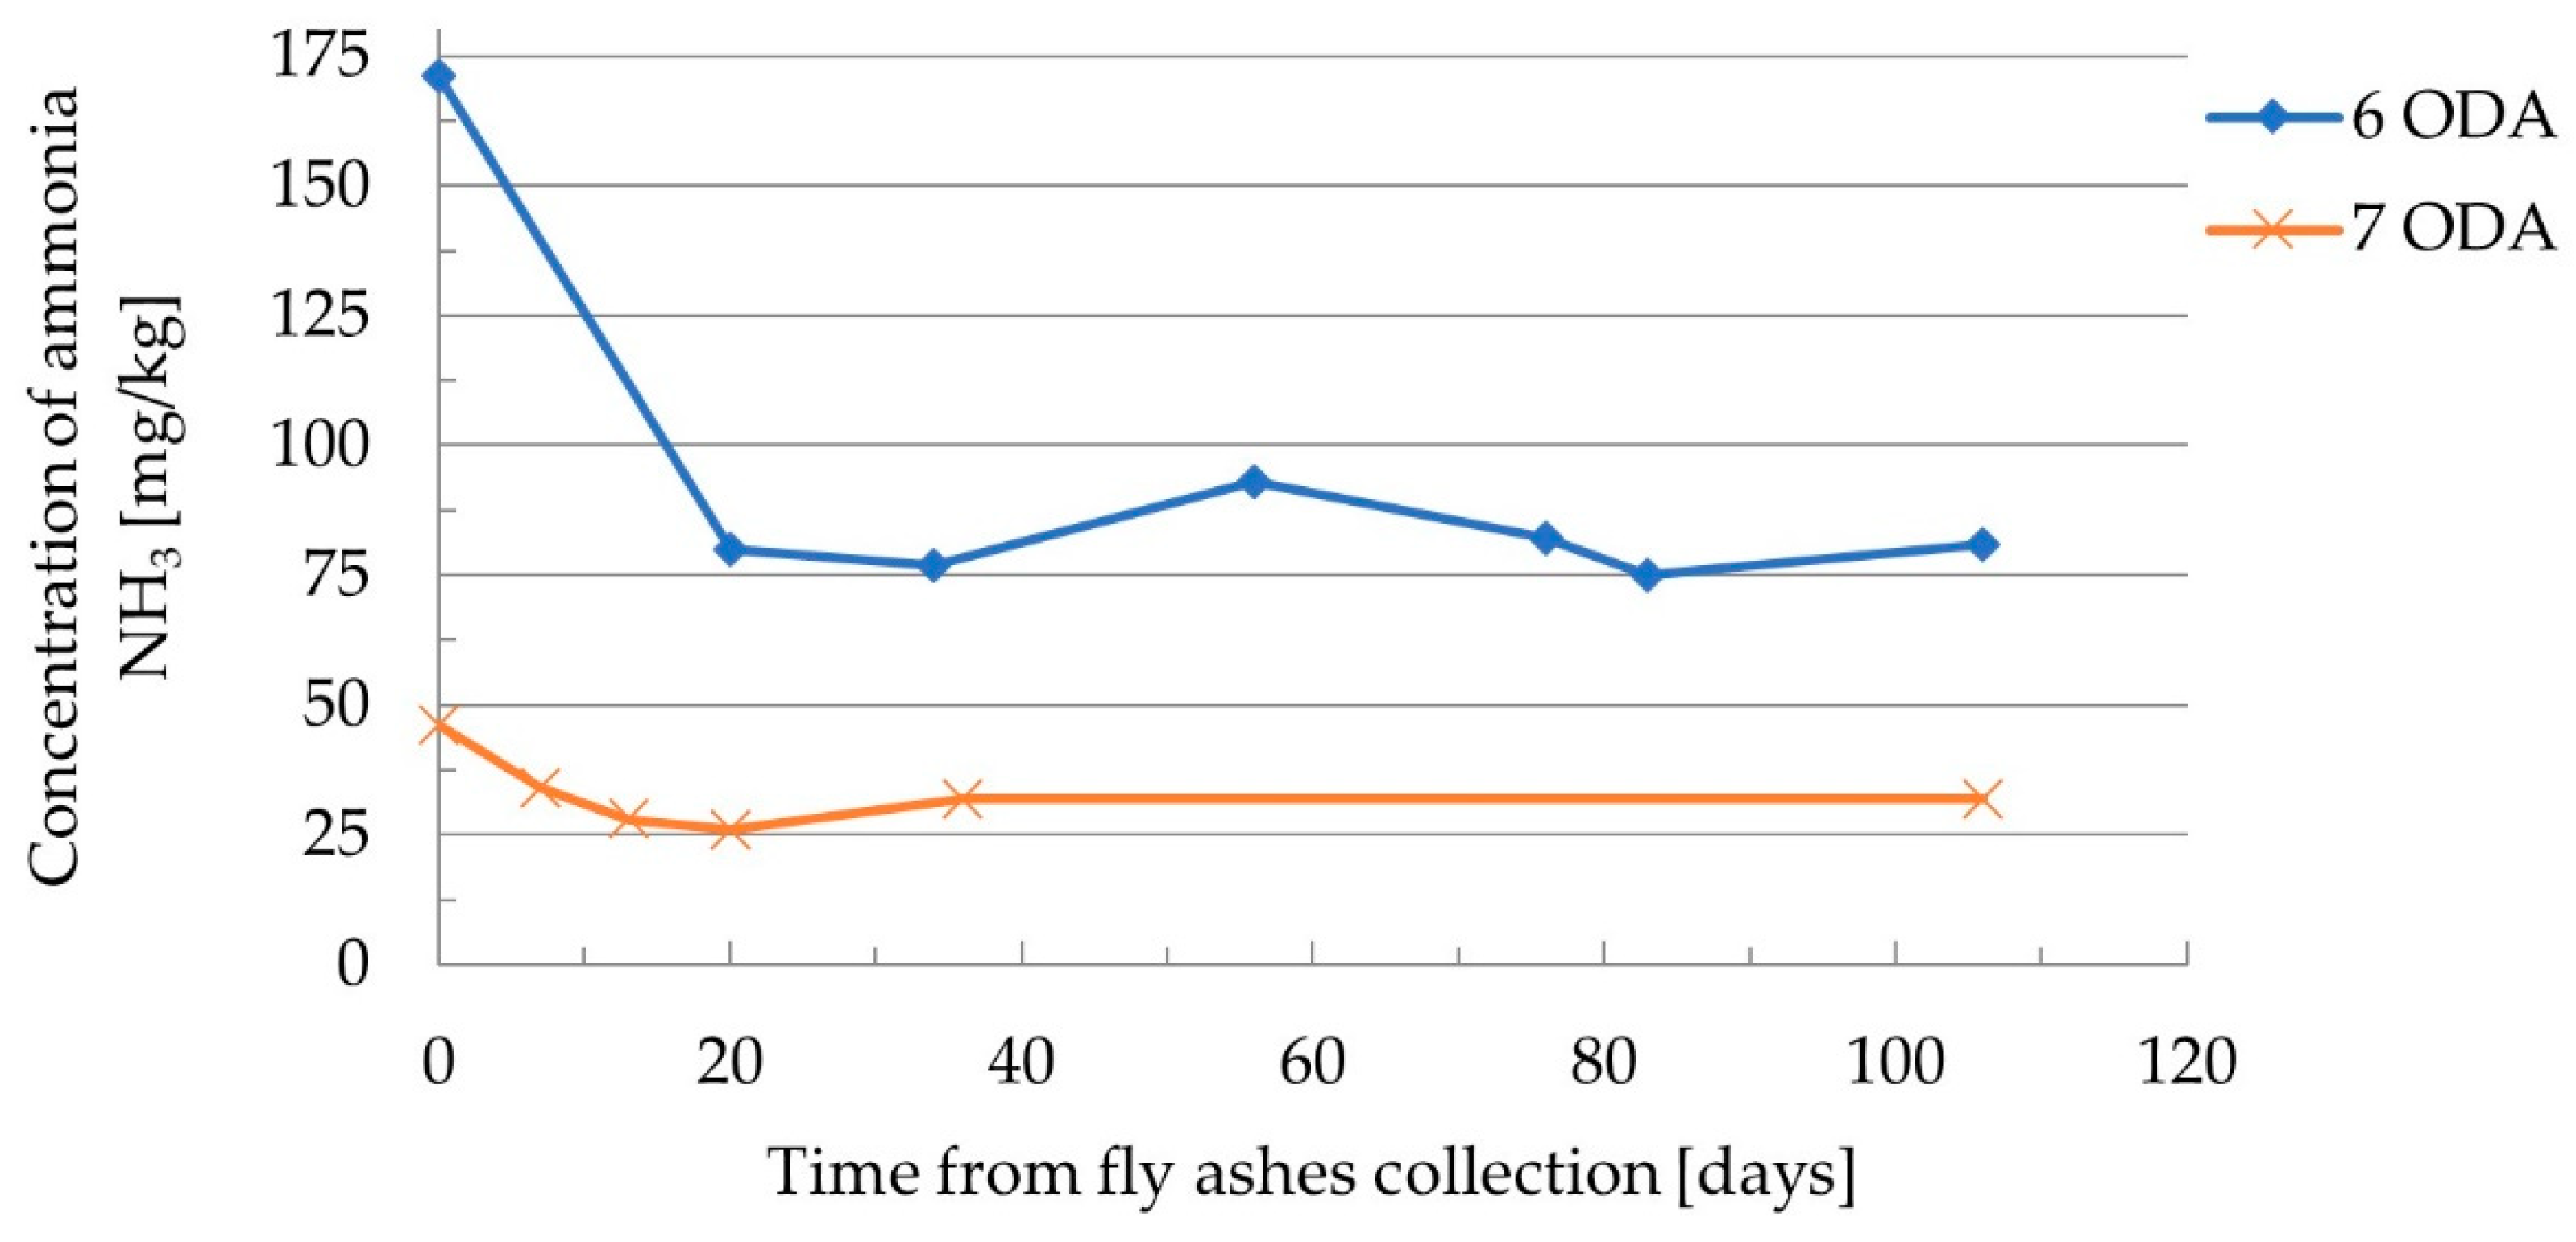
  • In the tested samples, however, the changes in losses on ignition were not so drastic as to demonstrate any differences in performance characteristics of ash-containing cement mortars, which would be of significance for concrete technology. A completely new issue for fly ash is the presence of ammonia in it. The PN-EN 450-1 [27] standard does not contain any requirements regarding the content of this compound. The tests of change of ammonia content in ash over time showed that in the initial period up to about 20 days, the compound is relatively easily released during activities such as homogenization and periodic mixing. After a long period of passive storage (up to 2 years), the concentration of ammonia decreases slowly and is still around 20–30% of the initial value.
  • In this study, volatile ashes from denitrification were investigated, whose ammonia content at the time of sampling was maximum 75 mg/kg. Conclusions can be drawn that the threshold value does not restrict the use of fly ash in cement and concrete, given its physical and chemical properties. Another issue is the emission of ammonia from the finished product [6,16], but such research will be carried out in the topic follow up studies. In some countries, a voluntary system of labeling emissions from construction products, including ammonia emissions, has been introduced [14].
  • It should be noted that the tests were carried out on a laboratory scale and that the results were assessed against the relevant requirements. Micro-scale ammonia release studies may not necessarily translate into macro-scale results. The process of releasing ammonia from a large volume of ash may have different dynamics. Also, the results of tests of large-scale use of fly ash from denitrification in construction works (product emissions) may differ.
  • Further investigations are currently underway into the properties of fly ash from denitrification, but with a much higher ammonia content (at the level of 200 mg/kg and above). Apart from the impact on the physical and chemical properties of cement and ash mortars, the studies will also be carried out with respect to ammonia emission from cement products containing fly ash from denitrification.
  • The assessment of the possibility of using fly ash containing ammonia is very important as its outcome will affect the possibility of further safe use of fly ash as a component of construction products in sustainable construction [1,8].

Author Contributions

Conceptualization, A.M.; Formal analysis, A.M. and F.C.; Funding acquisition, A.M.; Investigation, A.M., J.B. and F.C.; Methodology, A.M., J.B. and F.C.; Project administration, A.M.; Resources, A.M. and F.C.; Supervision, A.P.; Visualization, A.P.; Writing—original draft, A.M.; Writing—review & editing, J.B. and A.P.

Funding

This research was funded by Narodowe Centrum Nauki, granted on basis of decision number DEC-2012/05/N/ST8/02810.

Acknowledgments

The authors would like to thank Professor Lech Czarnecki for scientific supervision over the research project from the National Science Center. Additional thanks to the technical team from the Building Research Institute, including Piotr Kupisz, Łukasz Zacharski and Katarzyna Niemyjska, for their help in carrying out the research.

Conflicts of Interest

The authors declare no conflicts of interest.

References

  1. Bhatt, A.; Priyadarshini, S.; Acharath Mohanakrishnan, A.; Abri, A.; Sattler, M.; Techapaphawit, S. Physical, Chemical, and Geotechnical Properties of Coal Fly Ash: A Global Review. Case Stud. Constr. Mater. 2019, 11, e00263. [Google Scholar] [CrossRef]
  2. Majhi, R.K.; Nayak, A.N. Properties of Concrete Incorporating Coal Fly Ash and Coal Bottom Ash. J. Inst. Eng. Ser. A 2019, 100, 459–469. [Google Scholar] [CrossRef]
  3. Sevim, Ö.; Demir, İ. Optimization of Fly Ash Particle Size Distribution for Cementitious Systems with High Compactness. Constr. Build. Mater. 2019, 195, 104–114. [Google Scholar] [CrossRef]
  4. Neville, A.M. Properties of Concrete; Longman Scientific & Technical: New York, NY, USA, 1995; Volume 4. [Google Scholar]
  5. Han, X.; Yang, J.; Feng, J.; Zhou, C.; Wang, X. Research on Hydration Mechanism of Ultrafine Fly Ash and Cement Composite. Constr. Build. Mater. 2019, 227, 116697. [Google Scholar] [CrossRef]
  6. Panda, B.; Singh, G.B.; Unluer, C.; Tan, M.J. Synthesis and Characterization of One-Part Geopolymers for Extrusion Based 3D Concrete Printing. J. Clean. Prod. 2019, 220, 610–619. [Google Scholar] [CrossRef]
  7. Yao, Z.T.; Ji, X.S.; Sarker, P.K.; Tang, J.H.; Ge, L.Q.; Xia, M.S.; Xi, Y.Q. A Comprehensive Review on the Applications of Coal Fly Ash. Earth Sci. Rev. 2015, 141, 105–121. [Google Scholar] [CrossRef]
  8. Gollakota, A.R.K.; Volli, V.; Shu, C.-M. Progressive Utilisation Prospects of Coal Fly Ash: A Review. Sci. Total Environ. 2019, 672, 951–989. [Google Scholar] [CrossRef] [PubMed]
  9. Czarnecki, L.; Kapron, M. Sustainable Construction as a Research Area. Int. J. Soc. Mater. Eng. Resour. 2010, 17, 99–106. [Google Scholar] [CrossRef] [Green Version]
  10. Czarnecki, L.; Justnes, H. Sutainable & Durable Concrete. Cem. Lime Concr. 2012, 17, 341–362. [Google Scholar]
  11. Directive 2010/75/EU of the European Parliament and of the Council of 24 November 2010 on Industrial Emissions (Integrated Pollution Prevention and Control); Parliament, Council of the European Union; Official Journal of the European Union: Brussels, Belgium, 2010.
  12. Dvořák, R.; Chlápek, P.; Jecha, D.; Puchýř, R.; Stehlík, P. New Approach to Common Removal of Dioxins and NOx as a Contribution to Environmental Protection. J. Clean. Prod. 2010, 18, 881–888. [Google Scholar] [CrossRef]
  13. Mazur, M.; Janda, T.; Żukowski, W. Chemical and Thermal Methods for Removing Ammonia from Fly Ashes. Tech. Trans. 2017, 6, 31–50. [Google Scholar] [CrossRef]
  14. Brendel, G.F.; Bonetti, J.E.; Rathbone, R.F.; Frey, R.N.F., Jr. Investigation of Ammonia Adsorption on Fly Ash Due to the Installation of Selective Catalytic Reduction Systems; U.S. Department of Energy, Office of Scientific and Technical Informatio: Pittsburgh, PA, USA, 2000 1 November. [Google Scholar] [CrossRef]
  15. Lee, S.; Park, K.; Park, J.W.; Kim, B.H. Characteristics of Reducing NO Using Urea and Alkaline Additives. Combust. Flame 2005, 141, 200–203. [Google Scholar] [CrossRef]
  16. Abul Hossain, K.; Nazri Mohd Jaafar, M.; Mustafa, A.; Babu Appalanidu, K.; Nasir Ani, F. Application of Selective Non-Catalytic Reduction of NO x in Small-Scale Combustion Systems. Atmos. Environ. 2004, 38, 6823–6828. [Google Scholar] [CrossRef]
  17. Goo, J.H.; Irfan, M.F.; Kim, S.D.; Hong, S.C. Effects of NO2 and SO2 on Selective Catalytic Reduction of Nitrogen Oxides by Ammonia. Chemosphere 2007, 67, 718–723. [Google Scholar] [CrossRef] [PubMed]
  18. Xuan, X.; Yue, C.; Li, S.; Yao, Q. Selective Catalytic Reduction of NO by Ammonia with Fly Ash Catalyst. Fuel 2003, 82, 575–579. [Google Scholar] [CrossRef]
  19. Pedersen, K.H.; Jensen, A.D.; Berg, M.; Olsen, L.H.; Dam-Johansen, K. The Effect of Combustion Conditions in a Full-Scale Low-NOx Coal Fired Unit on Fly Ash Properties for Its Application in Concrete Mixtures. Fuel Process. Technol. 2009, 90, 180–185. [Google Scholar] [CrossRef]
  20. Ahmaruzzaman, M. A Review on the Utilization of Fly Ash. Prog. Energy Combust. Sci. 2010, 36, 327–363. [Google Scholar] [CrossRef]
  21. Vejmelková, E.; Pavlíková, M.; Keppert, M.; Keršner, Z.; Rovnaníková, P.; Ondráček, M.; Sedlmajer, M.; Černý, R. Fly Ash Influence on the Properties of High Performance Concrete. Cem. Lime Concr. 2009, 37, 189–204. [Google Scholar]
  22. Saarela, K.; Tirkkonen, T.; Björkroth, M.; Kukkonen, E.; Seppänen, O.; Tuomainen, M. M1, Emission Classification of Building Materials: Protocol for Chemical and Sensory Testing of Building Materials. The Building Information Foundation RTS: Helsinki, Finland, 2004. [Google Scholar]
  23. Bai, Z.; Dong, Y.; Wang, Z.; Zhu, T. Emission of Ammonia from Indoor Concrete Wall and Assessment of Human Exposure. Environ. Int. 2006, 32, 303–311. [Google Scholar] [CrossRef] [PubMed]
  24. O’Connor, D. Behavior of Ammoniated Fly Ash: Effects of Ammonia on Fly Ash Handling, Disposal, and End-Use; Technical Report no. 1003981; EPRI: Palo Alto, CA, USA, 2002. [Google Scholar]
  25. Beranová, D.; Opravil, T.; Ptáček, P.; Snop, R. Release of Ammonia from Conventional Power Plant Fly Ash after the Introduction of SNCR Process. IOP Conf. Ser. Mater. Sci. Eng. 2018, 379, 012031. [Google Scholar] [CrossRef]
  26. EN 196-1:2016. Methods of Testing Cement. Part 1: Determination of Strength; European Committee for Standardization: Brussels, Belgium, 2016. [Google Scholar]
  27. EN 450-1:2012. Fly Ash for Concrete. Part 1: Definition, Specifications and Conformity Criteria; European Committee for Standardization: Brussels, Belgium, 2012. [Google Scholar]
  28. EN 12457-4:2003. Characterisation of Waste—Leaching—Compliance Test for Leaching of Granular Waste Materials and Sludges—Part 1: One Stage Batch Test at a Liquid to Solid Ratio of 2 l/Kg for Materials with High Solid Content and with Particle Size B; European Committee for Standardization: Brussels, Belgium, 2003. [Google Scholar]
  29. EN 1015-3:1999. Methods of Test for Mortar for Masonry—Part 3: Determination of Consistence of Fresh Mortar (by Flow Table); European Committee for Standardization: Brussels, Belgium, 1999. [Google Scholar]
  30. EN 1015-7:1998. Methods of Test for Mortar for Masonry—Part 7: Determination of Air Content of Fresh Mortar; European Committee for Standardization: Brussels, Belgium, 1998. [Google Scholar]
  31. EN 1015-6:1998. Methods of Test for Mortar for Masonry—Part 6: Determination of Bulk Density of Fresh Mortar; European Committee for Standardization: Brussels, Belgium, 1998. [Google Scholar]
  32. EN 1015-11:1999. Methods of Test for Mortar for Masonary—Part 11: Determination of Flexural and Compressive Strength of Hardened Mortar; European Committee for Standardization: Brussels, Belgium, 1999. [Google Scholar]
  33. PN-B-04500: 1985. Building Mortars. Testing of Physical and Mechanical Properties; Polish Committee for Standardization: Warsaw, Poland, 1985. (In Polish) [Google Scholar]
Figure 1. Concentration of ammonia in fly ashes from flue gas denitrification ODA as a function of time.
Buildings 09 00225 g001
Figure 2. Concentration of ammonia in fly ash from flue gas denitrification as a function of time (short term studies).
Buildings 09 00225 g002
Figure 3. Grain size distribution in fly ashes by laser diffraction for 1 WZ and 1 ODA samples. (ODA—fly ash from denitrification, WZ—reference fly ash without denitrification)
Buildings 09 00225 g003
Figure 4. SEM pictures of the fly ashes: (a) WZ ash, magnification 1000×, (b) ODA ash, magnification 1000×, (c) WZ ash, magnification 400×, (d) ODA ash, magnification 400×.
Buildings 09 00225 g004
Figure 5. 1 WZ and 1 ODA ash diffractogram. Markings: M, mullite; Q, quartz; H, hercynite; Mt, magnetite; Ht, hematite; P, periclase.
Buildings 09 00225 g005
Figure 6. Thermograms of fly ash samples 1 WZ and 1 ODA.
Buildings 09 00225 g006
Figure 7. Diffractogram of cement slurries with 30% of 1 ODA and 1 WZ ashes. Markings: A, alite; B, belite; CA, tricalcium aluminate; Br, brownmillerite; P, portlandite; Ca, calcite, E, ettringite; M, mullite; Q, quartz.
Buildings 09 00225 g007
Figure 8. Thermogram of a cement slurry sample with the addition of 3 WZ ash after 28 days of curing.
Buildings 09 00225 g008
Figure 9. Thermogram of a cement slurry sample with the addition of 3 ODA ash after 28 days of curing.
Buildings 09 00225 g009
Figure 10. Photographs from scanning microscope for cement slurries with the addition of WZ ashes; (a) magnification 1000×, (b) magnification 2000×, (c) magnification 2000×, (d) magnification 6600×.
Buildings 09 00225 g010
Figure 11. Photographs from scanning microscope for cement slurry with ODA ash addition; (a) magnification 1000×, (b) magnification 7900×, (c) magnification 2000×, (d) magnification 7300×.
Buildings 09 00225 g011
Figure 12. Comparison of back scattered electrons (BSE) images of the slurries with ash, magnification 1000× (a) slurry with ODA ash and (b) slurry with WZ ash.
Buildings 09 00225 g012
Table 1. Results of analyses of ammonia content in fly ash at different intervals.
Sample *NH3 (t0) (g/kg)Time t1 (days)NH3 (t1) (mg/kg)Time (t2) (days)NH3 (t2) (mg/kg)
1 ODA61291679711
2 ODA26121773310
3 ODA75173966031
4 ODA63144959740
5 ODA58554052630
*—ODA—fly ash from denitrification.
Table 2. Chemical composition of fly ash.
Designation1 WZ1 ODA2 WZ2 ODA3 WZ3 ODA4 WZ4 ODA5 WZ5 ODA
SiO2 [%]49.8749.5251.5150.9749.8949.9051.5850.0150.1049.36
TiO2 [%]1.1621.1151.0861.0631.1061.0791.0841.1171.1161.124
A12O3 [%]27.0225.9325.7125.2326.3425.9624.9825.0527.8228.12
Fe2O3 [%]8.848.358.518.708.688.988.678.997.507.55
MnO [%]0.0690.0800.0960.0930.0820.0850.0880.0850.0830.082
MgO [%]2.392.452.532.432.482.322.362.252.502.42
CaO [%]3.503.513.823.783.943.734.344.573.563.44
Na2O [%]1.611.331.371.391.721.411.481.451.301.50
K2O [%}2.592.562.732.552.522.432.722.532.852.76
P2O5 [%]0.2960.2900.3120.2700.2960.2790.2680.2690.5200.457
(SO3) [%]0.500.290.480.390.550.490.460.630.290.22
(Cl) [%]0.0150.0160.0150.0170.0330.0210.0200.0220.0200.019
(F) [%]<0.01<0.01<0.01<0.01<0.01<0.01<0.01<0.01<0.01<0.01
LOI [%] 1)1.724.081.372.721.962.911.532.522.02.6
SUM [%]99.5899.5299.5499.6099.6099.5999.5899.4999.6699.65
1) Properties for which changes between ODA and WZ ash have been observed.
Table 3. Fly ash test results (according to PN-EN 450-1 [27]).
Feature1 WZ1 ODA2 WZ2 ODA3 WZ3 ODA4 WZ4 ODA
Loss on ignition [%]1)1.854.051.272.881.923.021.432.28
Chloride [%]0.010.010.010.0100.010.010.01
Sulphates (SO3) [%]1.070.870.720.660.690.670.640.77
Free calcium oxide CaO [%]0.10.100.10.10.10.10.1
Total calcium [%]3.603.644.324.234.574.164.145.02
Reactive calcium oxide CaO [%]6.446.517.016.887.196.646.837.48
Reactive silicon dioxide SiO2 [%]35.2534.373836.8837.3235.7635.5534.26
Sum of SiO2, Al2O3, Fe2O3 [%]81.6779.3280.2781.4982.6382.9981.2980.94
Total content of alkalis (as Na2Oeq) [%]3.973.853.543.443.443.263.473.32
Magnesium oxide MgO [%]2.502.552.832.702.172.572.532.53
Total phosphates (P2O5) [%]0.30.290.310.270.30.280.270.27
Fineness (sieved on 0,045 mm) [%] 1)31.438.234.537.032.037.636.430.5
Activity index [%] after 28 days 1)83.580.580.379.084.477.877.482.8
Activity index [%] after 90 days 1)99.085.698.597.396.786.593.3100.7
Soundness [mm]00001000
Particle density [g/cm3]2.152.152.292.242.202.172.202.23
Initial setting time [%]124103127130112115112136
Water requirement [%]1)9598959795979496
1) Properties for which changes between ODA and WZ ash have been observed.
Table 4. Results of tests of performance characteristics of fly ash mortars.
Feature1 WZ1 ODA2 WZ2 ODA3 WZ3 ODA4 WZ4 ODAUncertainty 2)
Consistency (flow table) [mm]223200213205223224216218± 10
Air content [%]3.03.02.53.03.03.03.02.5± 0.5
Fresh mortar volume density [kg/m3]21952180221522102195222022202210± 15
Shrinkage [%]3 days0.0090.0110.0120.0070.0060.0060.0080.008± 0.003
7 days0.0300.0280.0290.0240.0230.0230.0240.024
14 days0.0410.0410.0420.0370.0350.0350.0390.039
28 days0.0480.0470.0480.0450.0440.0440.0470.047
90 days0.0540.0540.0530.0530.0550.0550.0560.056
Water absorption [%]8.89.08.89.18.78.98.98.9± 0.2
Flexural strength [MPa]7 days5.45.45.45.35.74.96.66.0± 0.5
28 days7.27.37.47.98.17.58.08.6
90 days9.49.18.88.410.19.110.110.4
180 days10.810.49.09.510.610.110.310.1
Compressive strength [MPa]7 days30.529.729.529.830.530.040.140.0± 2.0
28 days44.042.742.943.646.242.150.352.8
90 days56.355.756.960.164.158.669.367.7
180 days67.966.867.967.370.367.574.876.3
2) The reported uncertainty of test method is based on a standard uncertainty multiplied by a coverage factor k = 2, providing a level of confidence of approximately 95%.

