Article

The Policy Shift from Energy to Carbon Dual-Control Targets in Building Energy Efficiency: A Textual Analysis of Tianjin’s Policies over Three Decades Through the Lens of Policy Instruments
College of Architecture and Art Design, Hebei University of Technology, Tianjin 300132, China
*
Author to whom correspondence should be addressed.
Buildings 2026, 16(9), 1831; https://doi.org/10.3390/buildings16091831
Submission received: 11 March 2026 / Revised: 29 April 2026 / Accepted: 30 April 2026 / Published: 4 May 2026
(This article belongs to the Section Building Energy, Physics, Environment, and Systems)

Abstract

Under the guidance of the “dual carbon” goals, building energy efficiency policies are currently in a critical phase of transitioning from “dual controls on energy consumption” to “dual controls on carbon emissions.” Based on the theory of policy instruments, this paper takes 26 building energy efficiency policy documents issued in Tianjin from 1991 to 2025 as samples. By comprehensively applying content analysis and social network analysis, it systematically examines the evolutionary trajectory, combination characteristics, and structural relationships of policy instruments over the past three decades. This study reveals that Tianjin’s building energy efficiency policy system demonstrates a phased transformation trend—shifting from singular control to diversified incentives and from energy consumption constraints to integrated carbon emission management. The structure of policy instrument combinations has been progressively optimized; however, there remains room for improvement in terms of policy synergy, continuity, and the role of market mechanisms. Consequently, this paper proposes recommendations for optimizing local building energy efficiency policies across dimensions such as instrument coordination, temporal allocation, and mechanism innovation. These suggestions aim to enhance policy implementation effectiveness, accelerate the transition towards energy conservation and carbon reduction in the building sector, and provide empirical references for similar cities seeking to optimize their “dual carbon” policy frameworks.

1. Introduction

The building sector plays a crucial role in the global low-carbon transition, with its operational phase accounting for approximately 30% of global final energy consumption and contributing around 26% of energy-related carbon dioxide emissions [1]. Therefore, effective management of building energy use and carbon emissions is essential for achieving climate mitigation targets. International studies indicate that traditional energy-centered policies often fail to simultaneously meet both emissions reduction and energy system transformation objectives [2]. In response, policy frameworks have increasingly emphasized carbon emission constraints, energy structure optimization, and integrated low-carbon development, reflecting a shift from resource-centered governance toward climate-oriented environmental governance [3,4,5].
In China, this transition is reflected in the policy shift from the “dual control of energy consumption” to the “dual control of carbon emissions” [6]. Existing studies indicate that building energy efficiency policies need to go beyond mere energy savings to effectively reduce carbon emissions, particularly in regions with high heating demand [7]. Tianjin serves as a representative case, as it implemented building energy efficiency policies relatively early and is located in a cold climate zone, where heating energy consumption constitutes a large proportion of total building energy use, thus facing significant pressure for energy conservation and carbon reduction.
This study is based on 26 building energy efficiency policy documents issued in Tianjin from 1991 to 2025 and analyzes the evolutionary mechanisms of policy instruments during the governance transition. By combining content analysis with social network analysis, this study examines the phased evolution of the policy instrument system, the dynamic adjustment of instrument combinations, and the structural relationships and interactions among policy instruments. The research aims to identify the evolutionary pathways and stage-specific characteristics of policy instrument combinations and, through dynamic network analysis, to reveal the synergistic effects among policy instruments. This approach not only quantifies the structure and evolution patterns of instrument combinations but also elucidates the interaction mechanisms of different policy measures in advancing the low-carbon transition, providing innovative empirical evidence for optimizing policy coordination and enhancing governance effectiveness.

2. Literature Review

2.1. Policy Instrument Theory and Overview of International Research Methods

Since the 1980s, the classification of policy instruments has become a central topic in international public policy research, providing a multidimensional framework for analyzing government intervention measures [8]. Hood’s “information–authority–financial–organizational” (IAFO) framework categorizes policy instruments into information, authority, financial, and organizational resources, highlighting their diverse functions in incentivizing, constraining, and guiding behavior, and has been widely applied in international research [9]. Building on this, Howlett proposed a classification method based on policy implementation intensity, further enriching the analytical dimensions of policy instruments [10]. In addition, the International Energy Agency (IEA) [11] has developed a systematic classification practice for energy conservation and emission reduction policies, integrating theoretical frameworks with specific policy domains to provide a methodological basis for analyzing interactions, complementarities, and effectiveness of policy instruments. Together, these theories and practices form the analytical foundation of international scholarship on policy instruments and provide reference points for subsequent empirical studies.
In international energy policy research, the application of different methods provides a multidimensional perspective for evaluating the effectiveness of policy instrument combinations. Quantitative studies primarily employ panel data analysis, input–output modeling, energy savings quantification, and regression analysis to assess the direct impacts of policy combinations on energy conservation and carbon reduction [12,13]. Qualitative research, on the other hand, relies on case studies, policy tracking, and semi-structured interviews to examine policy implementation mechanisms, local adaptability, and stakeholder responses [14,15]. Mixed-methods research combines quantitative and qualitative approaches to validate policy effects empirically while exploring the synergies among policy instruments and their institutional adaptability [16]. These complementary approaches not only quantify policy performance but also elucidate the policy implementation process, providing theoretical and practical guidance for the design of effective policy mixes.

2.2. Policy Instrument Combinations and Synergistic Effects

Empirical studies indicate that policy mixes involving multiple instruments are generally more effective than single measures in enhancing energy efficiency and achieving cost-effective carbon reduction [17,18,19]. The effectiveness of such policy combinations primarily arises from the synergies among different instruments, which can strengthen implementation, accelerate technology adoption, and increase stakeholder engagement.
In Europe and North America, combinations of financial incentives, mandatory standards, and information disclosure have been shown to significantly improve building energy performance, reduce emissions, and lower implementation costs [20,21]. In Japan and South Korea, the integration of local government initiatives with voluntary agreements by enterprises has enhanced social acceptance and policy flexibility, effectively promoting the achievement of policy goals [22,23]. Comparative studies in Sweden and Germany further demonstrate that carefully designed policy mixes can balance economic, environmental, and social equity objectives; for example, integrating regulatory instruments, fiscal incentives, and market-based mechanisms can improve energy efficiency while maintaining fiscal sustainability [24,25].
Overall, international experience suggests that the coordinated design of multiple instruments can substantially enhance the overall effectiveness and sustainability of policies, providing a theoretical basis for the optimization of policy mixes.

2.3. Chinese National and Local Case Studies

Drawing on international experience, China’s building energy efficiency policies have evolved from single-technology regulations to comprehensive policy systems, gradually shifting from mandatory restrictions to incentive-based strategies [26,27]. To date, most research has focused on the national level, with limited analysis of local government innovations, policy adaptability, and the integration of multiple instruments [28]. Although some studies have incorporated quantitative analyses, qualitative research still predominates, and systematic longitudinal studies remain scarce, making it difficult to capture the dynamic interactions, structural evolution, and synergies of policy instruments [29]. Therefore, the mechanisms through which local governments adjust institutional arrangements and optimize policy instrument mixes during the transition from “dual control of energy consumption” to “dual control of carbon emissions” are not yet fully understood.

2.4. Research Gaps

Despite progress in theoretical and empirical studies, several gaps remain. First, the applicability of international theoretical frameworks to China’s local policies has been limited, potentially overlooking context-specific constraints and interactions among policy instruments. Second, studies on the dynamics, longitudinal evolution, and phased development of policy instrument networks are still scarce. Third, systematic investigation of the formation mechanisms and evolution processes of policy instrument synergies is lacking. To address these gaps, this study applies content analysis and social network analysis to examine building energy efficiency policy instruments in Tianjin from 1991 to 2025, providing theoretical insights and empirical evidence to inform the optimization of local low-carbon policy frameworks.

3. Methodology

3.1. Theoretical Foundation and Analytical Framework

Through a systematic review and comparative analysis of existing classification frameworks, this study focuses on the involvement of multiple stakeholders and the synergistic effects of different policy instruments in building energy efficiency policies. Drawing on the classification methods of the IEA and Hollett, we classify the policy tools into four categories: regulatory, informational, economic incentive-based, and voluntary. Further analysis refines these categories, ultimately identifying 17 distinct policy tools (see Table 1). This framework not only preserves the core principles of policy tool theory but also aligns with the practical governance of building energy efficiency, providing a methodological foundation for systematically identifying policy configuration models and their operational pathways.

3.2. Case Selection

Tianjin, located in northern China, is a representative local case for observing the transformation of building energy efficiency policies. According to the Chinese standard GB 50176-2016, it falls within a cold climate zone, roughly corresponding to ASHRAE climate zone 6. The winter heating period lasts for over 120 days, and heating load dominates the total energy consumption [7]. This climatic feature means that the carbon emission pressure from buildings in Tianjin is much higher than that in southern China’s cities, which typically experience hot summers and mild winters or hot summers and cold winters [30]. This further underscores the necessity for Tianjin to implement effective strategies for improving building energy efficiency.
In terms of the policy environment, Tianjin has long been a pioneer in the innovation of building energy efficiency policies in China. Over the past three decades, Tianjin has made significant progress in advancing building energy efficiency, becoming a benchmark city for policy implementation and practice in China. This journey dates back to 1988, when, under the guidance of the Ministry of Construction (now the Ministry of Housing and Urban-Rural Development), Tianjin launched the “Chuanfu Xincun Energy Efficiency Demonstration Project [31],” China’s first residential energy efficiency demonstration project, marking the beginning of China’s building energy efficiency policy practice. Over time, Tianjin’s building energy efficiency policy system has become increasingly refined, with a growing number of policies and expanding involvement from various stakeholders, creating a unique and continuously evolving policy ecosystem.
Choosing Tianjin as a case study reflects the city’s long-standing efforts and policy evolution in addressing building energy consumption and carbon reduction pressures. It serves as a typical example of cities in northern China facing building energy efficiency and carbon reduction challenges, providing valuable practical experience for other cities across the country.

3.3. Research Subjects and Text Selection

To systematically analyze the structural characteristics and evolutionary trajectory of Tianjin’s building energy efficiency policies, this study conducted a comprehensive collection and screening of policy documents in this field since 1991, strictly adhering to three principles: timeliness, authority, and relevance [32]. The research focused on policies currently in effect since the 10th Five-Year Plan period, ensuring that sources were limited to normative documents issued by Tianjin’s People’s Congress, municipal government, and functional departments such as Housing and Urban–Rural Development and Development and Reform. The scope centered on building energy conservation and carbon reduction, encompassing directly relevant standards, regulatory policies, and coordinated technical guidelines and industrial policies. Following this process, 26 key policy documents were selected as research samples (see Table 2), upon which subsequent quantitative textual analysis was conducted.

3.4. Stage Division

Tianjin’s building energy efficiency policies have undergone four distinct development stages, demonstrating a gradual shift from extensive management to more refined regulation, and from a single objective to multidimensional coordination. This change reflects the challenges Tianjin has faced in managing increasingly complex building energy consumption and improving building energy efficiency. In the early stage of energy consumption control (early reform period to 2005), Tianjin initiated building energy efficiency efforts, but this area was not yet a policy priority and remained in an extensive development phase, with preliminary pilot projects and the establishment of a regulatory framework just beginning. During this period, energy management primarily focused on the industrial sector, with building energy consumption not yet subject to separate regulation, and energy-saving technologies applied only in sporadic pilot projects. Following the revision of the Energy Conservation Law and the promulgation of the “Tianjin Building Energy Efficiency Management Regulations,” the city entered the single-control phase (2006–2010). During this period, Tianjin began to establish a policy framework, with the release of the “Tianjin Building Energy Efficiency Management Regulations” in 2006, which established 12 management measures, including special reviews and technical document filing, enhancing regulatory oversight of building energy efficiency design reviews and formally implementing the three-step energy-saving mandatory standards. In the dual-control period (2011–2020), Tianjin’s building energy efficiency policies shifted from focusing solely on controlling energy consumption intensity to a dual-control approach that addresses both energy consumption intensity and total energy consumption, gradually integrating with new construction methods such as green buildings and prefabricated buildings. In 2012, Tianjin announced the gradual implementation of the four-step energy-saving standard for residential buildings. Currently, in the transition period of dual control (2021–2025), under the guidance of the 14th Five-Year Plan, Tianjin’s building energy efficiency policies have entered a new phase focused on carbon reduction, emphasizing quality improvement, efficiency enhancement, and multi-sector collaboration. The policies of this phase reflect a more comprehensive approach to improving energy efficiency and reducing carbon emissions, utilizing policy tools across different stages to reflect the evolving trends in building energy efficiency and carbon reduction in Tianjin.

3.5. Coding Process and Reliability Testing

The policy texts were precisely coded, and this study provides an example of the coding process. The 26 selected policy texts were systematically reviewed, with normatively significant provisions within the policy texts serving as the basic unit of analysis. Coding was conducted clause by clause following the rule of “policy number-clause sequence number.” For provisions that could be classified under multiple analytical dimensions, independent coding was performed sequentially according to their logical order [33]. Through systematic organization, a total of 409 valid content analysis units were obtained. A partial coding scheme is shown in Table 3. To enhance the objectivity and consistency of the coding results, two graduate students in related majors were invited to serve as coders and independently classify the content analysis units. A stratified sampling method was used to select 100 analysis units as the test sample, and IBM SPSS Statistics 23 was employed to calculate Fleiss’ Kappa coefficient to assess inter-coder consistency [34]. The results show that the Kappa value for the policy instrument dimension was 0.847, exceeding the acceptable threshold of 0.80, indicating good coding reliability.

3.6. Research Methodology

3.6.1. Content Analysis Method

Content analysis is one of the core analytical methods employed in this study [36]. Based on the coding results from Section 3.5 (totaling 409 analytical units), this study classifies and quantifies each analytical unit according to the policy instrument classification framework (Table 2), obtaining the frequency and proportion of policy instruments used in each phase, thereby revealing the evolutionary trends and combination characteristics of different types of policy instruments.

3.6.2. Social Network Analysis

To reveal the synergistic relationships and combination patterns among policy instruments, this study employs social network analysis to construct a policy instrument co-occurrence network. The specific construction process is as follows:
(1)
Definition of co-occurrence relationship: If two policy instruments appear anywhere within the same policy document (including the main text, clauses, and appendices), they are considered to have one co-occurrence. This study adopts “the same document” as the criterion for co-occurrence, rather than “the same paragraph,” to avoid artificial discontinuities caused by differences in text structure.
In the context of Chinese policy formulation, particularly in the field of building energy efficiency, policy documents are typically constructed as internally coherent policy packages rather than loose aggregations of independent measures. Therefore, the co-occurrence of policy instruments within a single document is interpreted as a coordinated deployment under a unified policy objective and governance framework, rather than a purely textual coincidence.
To mitigate the amplification of co-occurrence relationships caused by redundant expressions in long texts, this study uses policy clauses as the basic unit of analysis during the coding process. Based on a pre-constructed functional classification system of policy instruments, each clause is semantically categorized and assigned multiple labels, rather than relying on keyword matching to identify co-occurrence relationships. Furthermore, co-occurrence is defined as the joint appearance of different functional attribute labels within the same policy document, thereby transforming word-level textual co-occurrence into structured functional co-occurrence. This approach effectively reduces spurious associations caused by repetitive expressions or appendix structures and improves the interpretability of the co-occurrence network.
(2)
Matrix construction and network transformation: First, for each phase, a two-mode “policy document–policy instrument” matrix is constructed, where rows represent policy documents and columns represent the 17 specific policy instruments. The matrix elements indicate whether a given instrument is used in a given policy document (1 for used, 0 for not used). Subsequently, this two-mode matrix is converted into a one-mode “policy instrument–policy instrument” co-occurrence matrix using UCINET 6 software [37]. The elements of this matrix represent the number of times any two instruments co-occur within the same policy document.
(3)
Node size and connection strength: In the network graph, the size of a node is measured by its degree centrality. Degree centrality refers to the number of other nodes directly connected to a given node [38], and its calculation formula is:
C D n i = j x i j N 1
where x i j indicates whether node i and node j are connected, and N is the total number of nodes in the network. A higher degree centrality indicates that the instrument occupies a more core position in the network and has a higher degree of synergy with other instruments. The connection strength is determined by the co-occurrence frequency between two instruments, i.e., the value of the element in the co-occurrence matrix. The higher the frequency, the thicker the connecting line, reflecting that the two types of instruments tend to be used in combination in policy practice.
(4)
Network indicator calculation: This study also calculates the density and network centralization of the network. Density reflects the closeness of connections among nodes in the network; network centralization measures the extent to which the entire network is concentrated around core nodes. A higher value indicates a more centralized network structure [39].

3.6.3. The Definition Rules of Carbon Emission Reduction Policies

To identify policy provisions in the policy texts that “directly target carbon reduction,” this study establishes a clear set of classification rules. Specifically, a policy provision is determined to “directly target carbon reduction” if it meets one of the following criteria:
(1)
Explicit mention of carbon reduction goals: The provision explicitly includes keywords such as “carbon reduction,” “carbon dioxide emission reduction,” “carbon emission reduction,” or “carbon reduction,” and takes reducing carbon emissions as its direct objective.
(2)
Direct constraint on carbon emission sources: The provision directly imposes binding requirements on fossil energy consumption, industrial process emissions, or carbon emissions from building operations, such as “control carbon emission intensity during the building operation stage” or “restrict the use of high-carbon building materials.”
(3)
Incentivizing carbon reduction behaviors: The provision directly incentivizes market entities to implement carbon reduction behaviors through fiscal subsidies, tax incentives, carbon trading, and other mechanisms, such as “provide financial rewards for projects with notable carbon reduction performance” or “include in the carbon emission trading system.”
In contrast, provisions related to “traditional energy use” refer to those that focus solely on energy consumption, energy efficiency improvement, and the application of energy-saving technologies without explicitly linking to carbon emissions. For example, provisions such as “raise building energy efficiency design standards” or “promote high-efficiency energy-saving equipment,” although they may indirectly contribute to carbon reduction, are not counted in the statistics for “directly targeting carbon reduction” because they do not directly aim to reduce carbon emissions.

4. Results

The frequency distribution of policy instruments is presented in Table 4. It should be noted that during the early stage of single energy consumption control (prior to 2005), only one policy document was issued, resulting in a very limited number of policy instruments. Consequently, the proportional distribution of different types of instruments in this period is subject to considerable randomness and may not accurately reflect the characteristics of that stage. Therefore, subsequent analysis of the evolution of policy instruments will primarily focus on the three stages after 2006.

4.1. Distribution of Policy Instrument Types

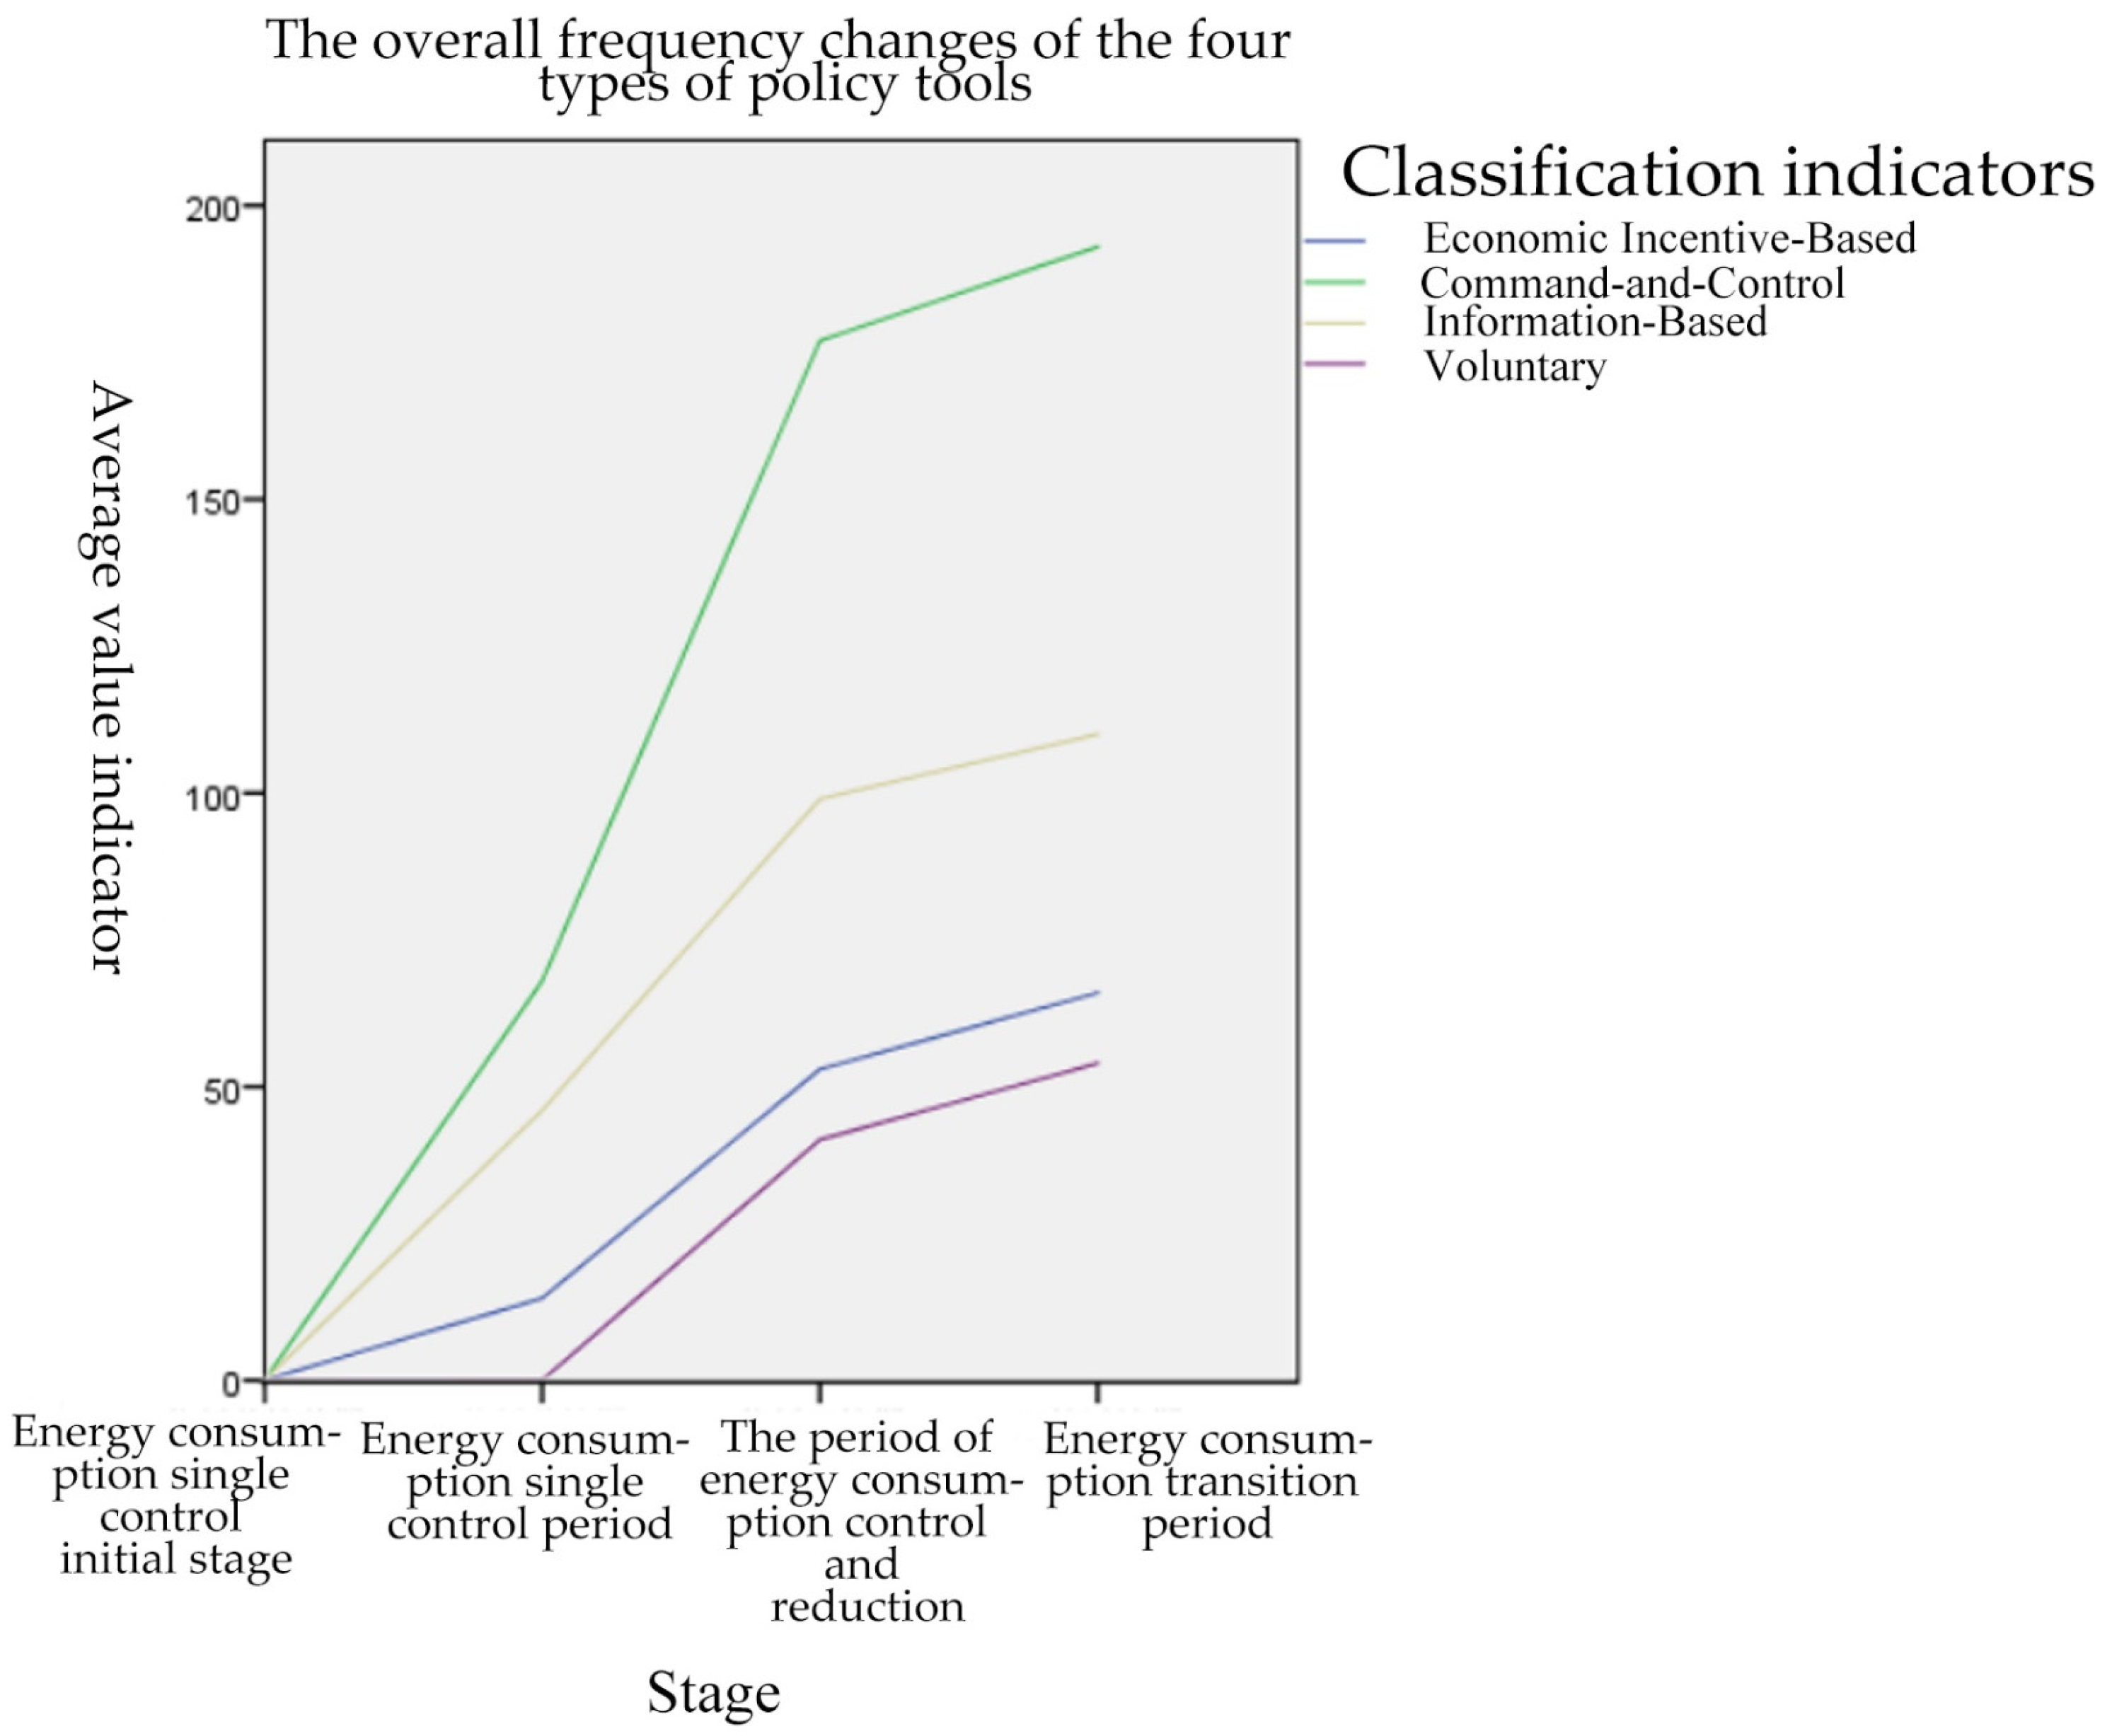
Based on the identification of policy instruments, this study quantifies the frequency of application of energy-saving and carbon reduction policies across different stages in Tianjin. Adopting a classification framework that categorizes policy instruments into regulatory, informational, incentive-based, and voluntary types, this study illustrates the overall evolution of the policy instrument system through changes in the frequency of 17 specific instruments (Figure 1).
During the evolution of building energy efficiency policies, the application frequency of four categories of policy instruments—regulatory, informational, economic incentive, and voluntary—has shown a continuous upward trend, with regulatory instruments exhibiting the most significant absolute increase. Specifically, the proportions of each type across different stages are as follows:
Regulatory instruments accounted for 49.58% during the single energy consumption control period, 51.50% during the dual-control period, and 36.21% during the transition period. Informational instruments accounted for 32.77%, 16.74%, and 17.24%, respectively. Economic incentive instruments accounted for 11.76%, 15.02%, and 22.41%, respectively. Voluntary instruments accounted for 5.88%, 16.74%, and 24.14%, respectively.
These data show a shift in the composition of policy instruments in Tianjin’s building energy efficiency policies, from a dominance of regulatory instruments toward a more balanced use of informational, economic incentive, and voluntary instruments.

4.2. Evolution of Policy Instruments Across Different Stages

The analysis reveals that Tianjin’s policy instrument system has undergone significant stage-based changes: during the energy consumption quota control period, policy instruments were predominantly mandatory and informational, with a relatively low proportion of economic incentive-based and voluntary instruments, resulting in a comparatively concentrated policy structure. During the energy consumption dual-control period, the proportion of mandatory instruments increased slightly to 51.50%, while that of informational instruments dropped sharply to 16.74%, Meanwhile, the shares of economic incentive-based and voluntary instruments rose markedly. During the dual-control transition period, the changes in the policy instrument mix became particularly pronounced, as the combined proportion of economic incentive-based and voluntary instruments exceeded that of mandatory instruments for the first time.

4.3. The Dynamic Changes in Economic Incentive and Voluntary Instruments

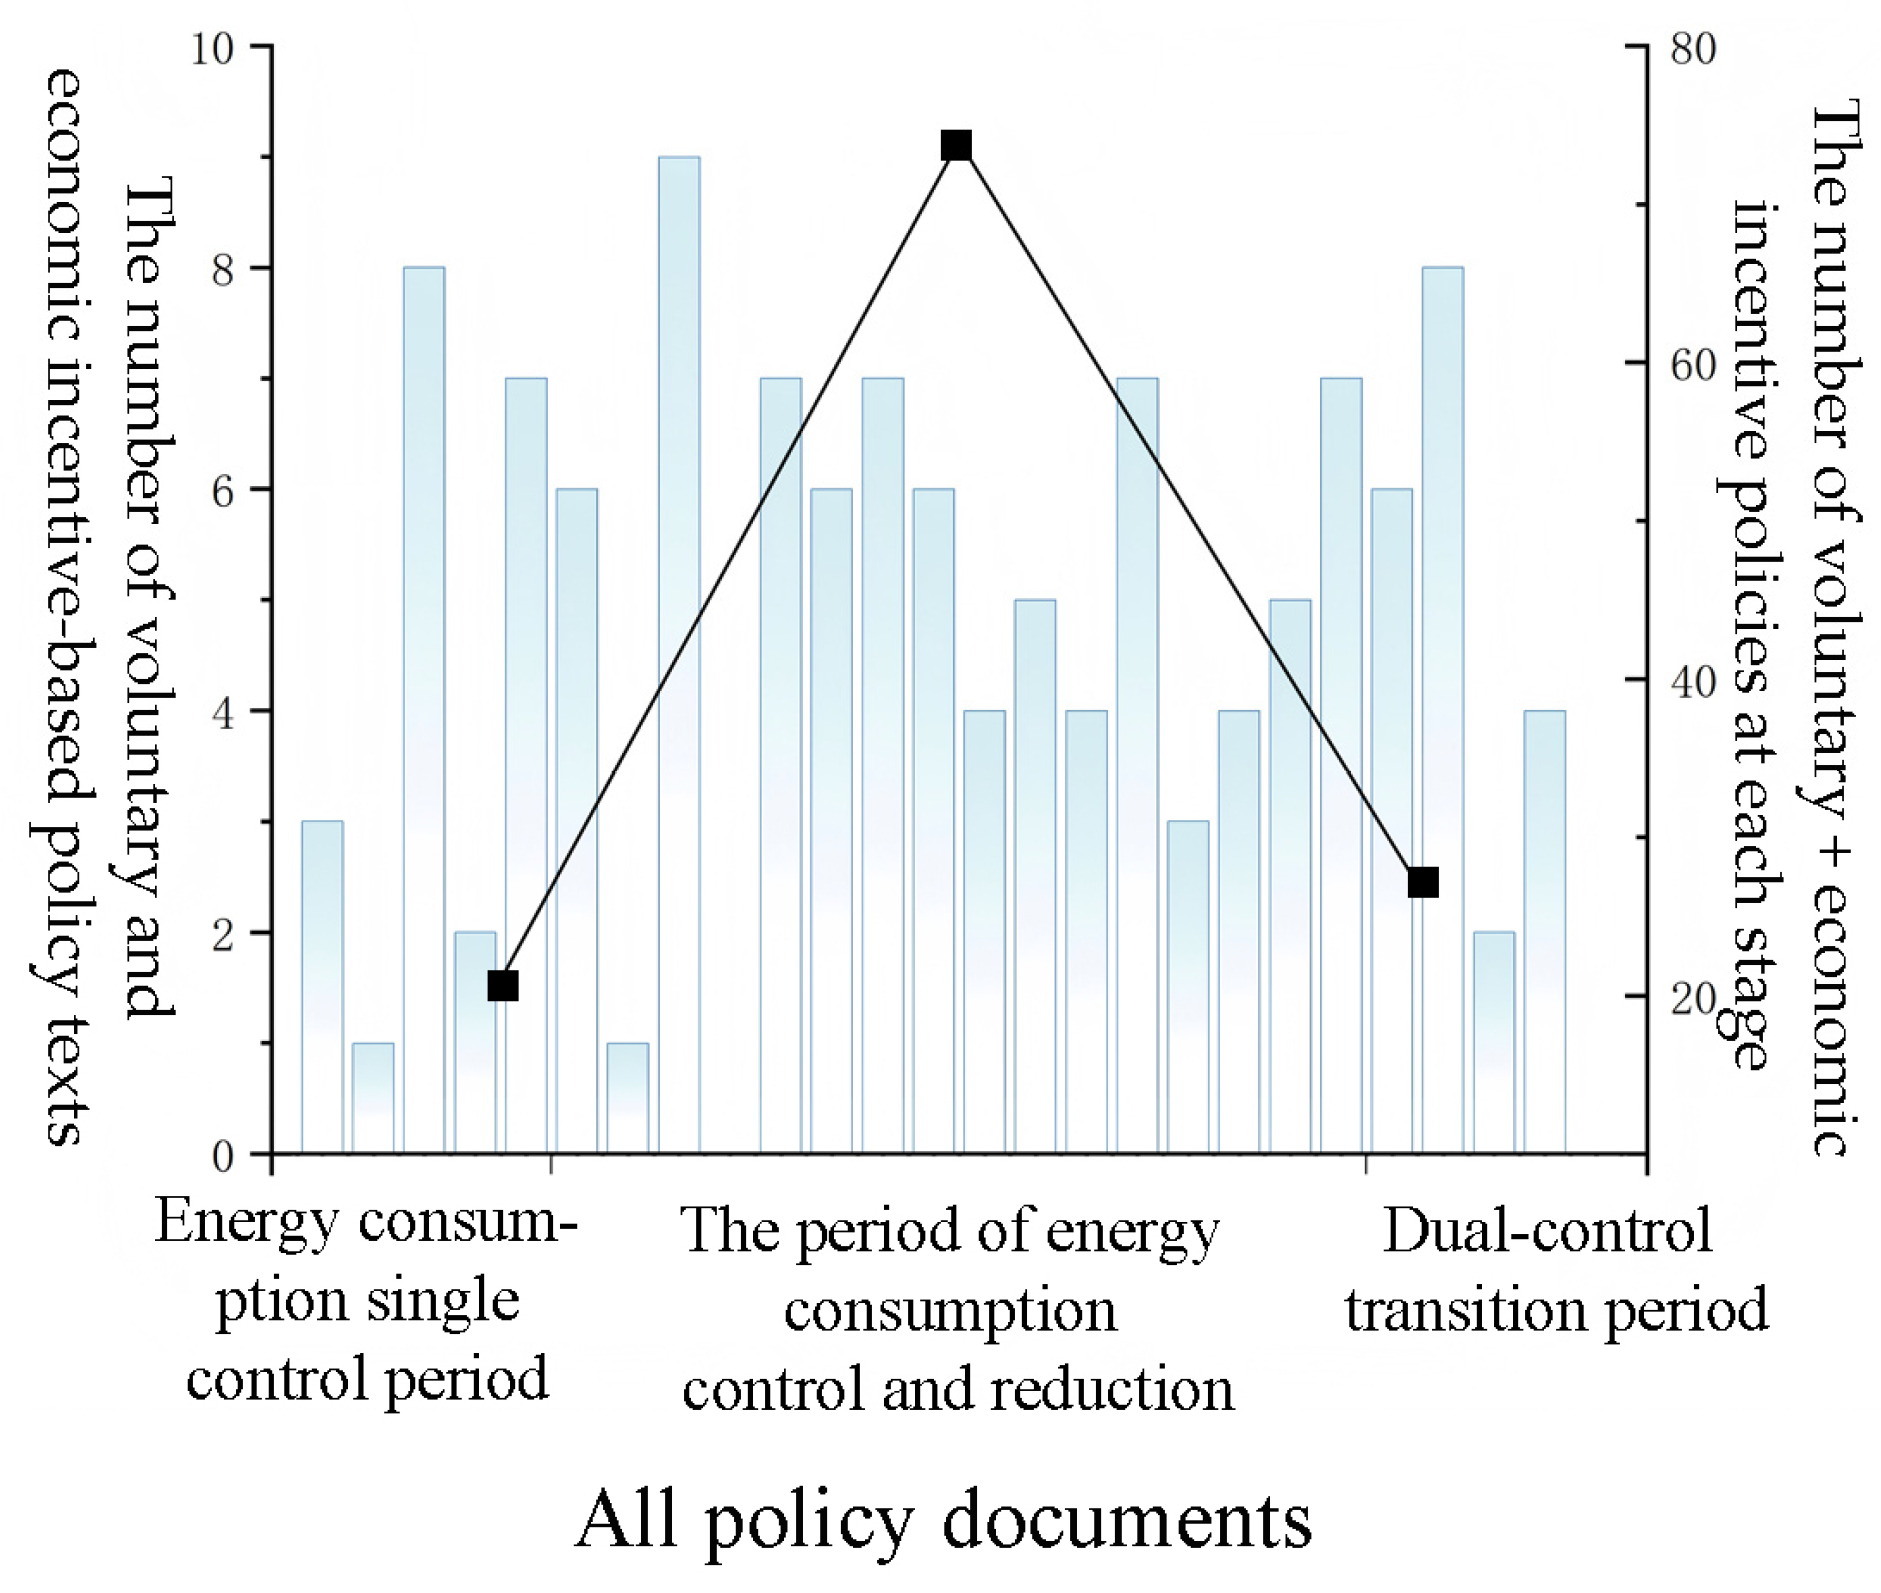
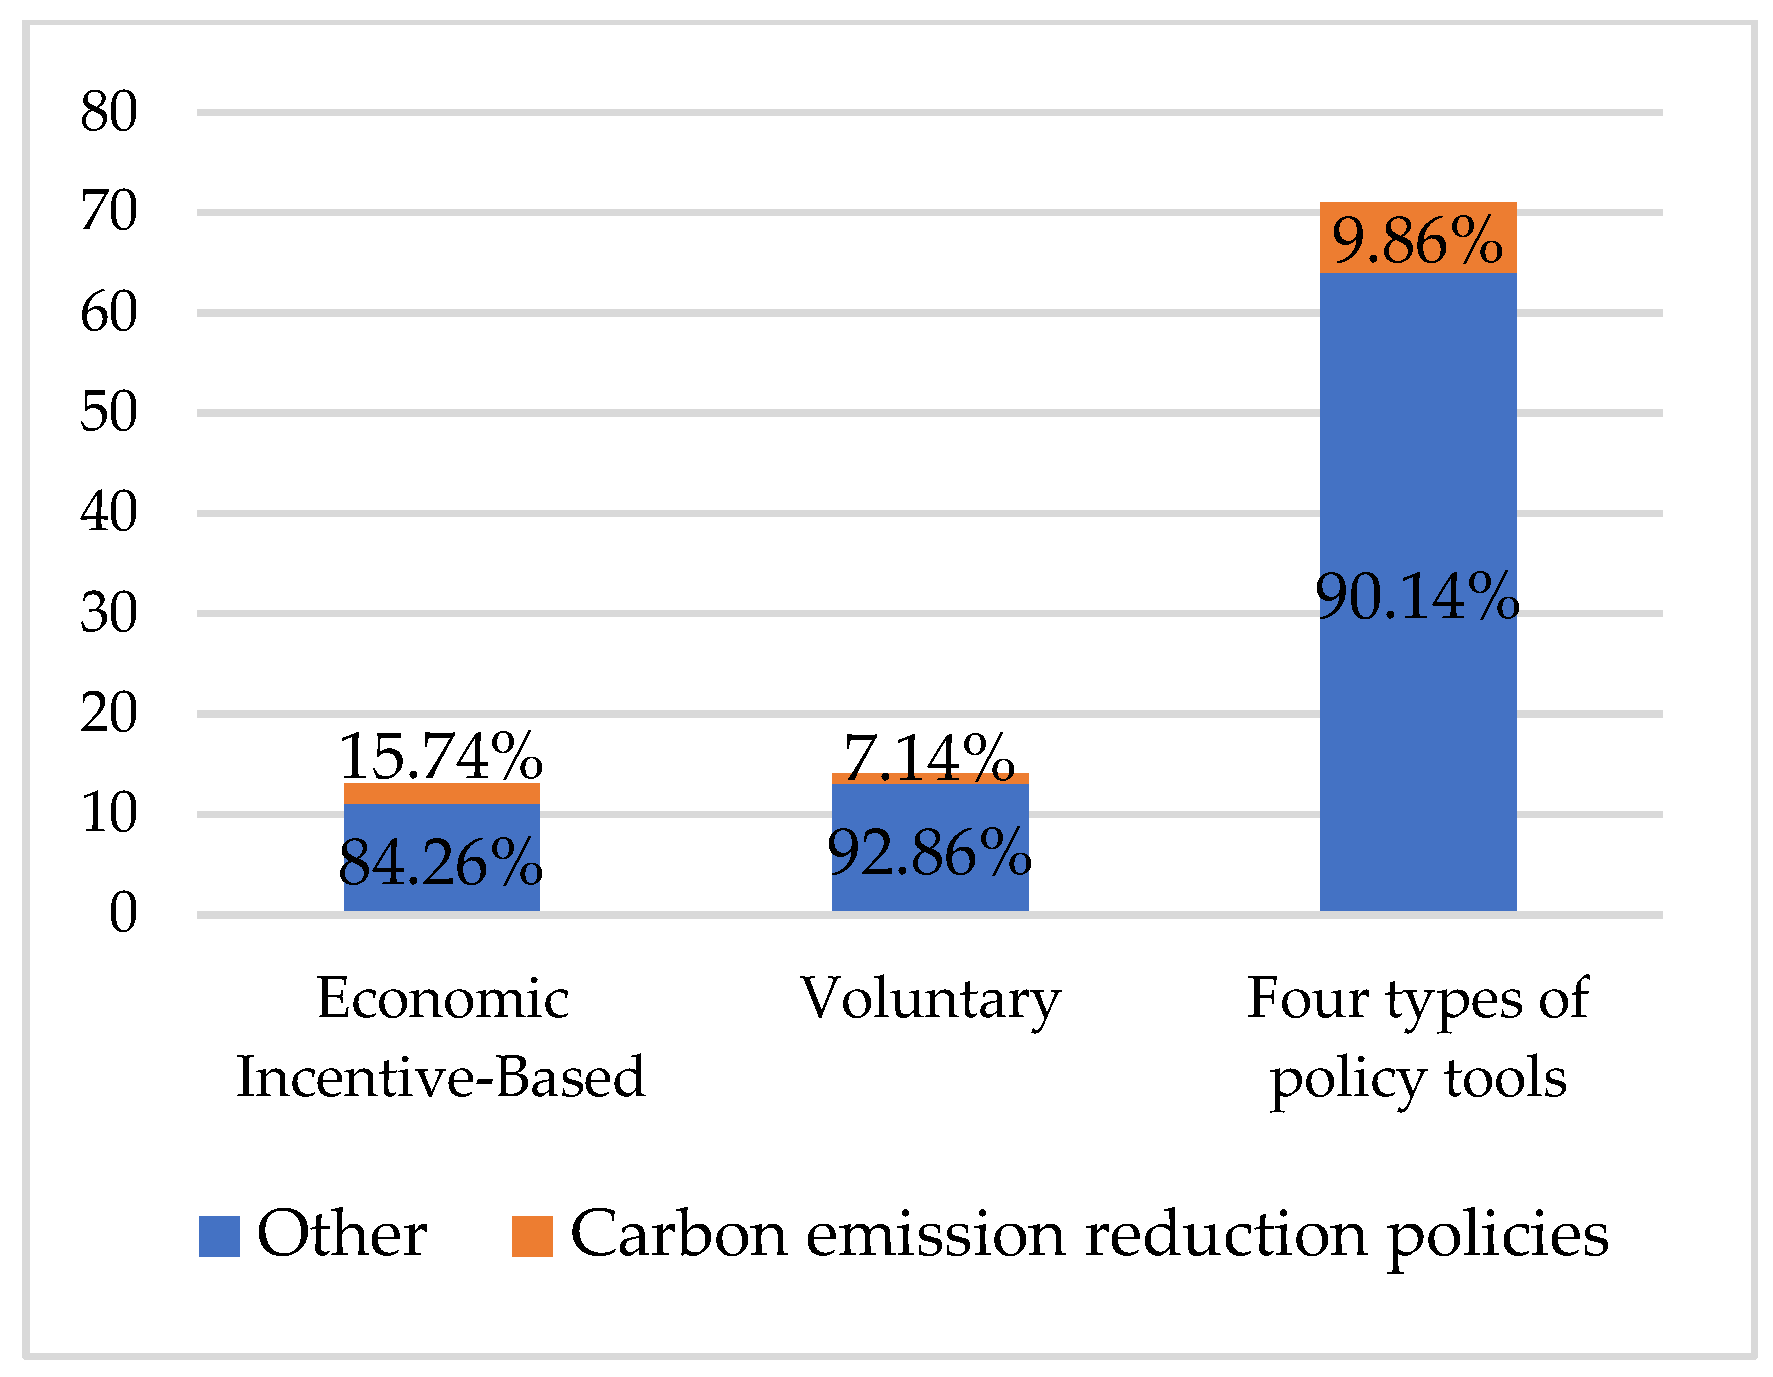
Based on Figure 2 and Figure 3, it can be observed that the number of economic incentive and voluntary policy instruments in Tianjin’s building energy efficiency policy exhibits temporal fluctuations. These instruments were relatively scarce during the single energy consumption control period. During the dual energy consumption control period, the number of economic incentive instruments increased significantly. In the transitional phase of the dual-control regime, the use of both economic incentive and voluntary instruments continued to grow. However, the proportion of instruments directly related to carbon reduction objectives remained relatively low. Specifically, only 15.74% of economic incentive instruments were directly targeted at carbon emission reduction, while this proportion was 7.14% for voluntary and informational instruments.

4.4. Overall Characteristics of the Policy Instrument Portfolio Network

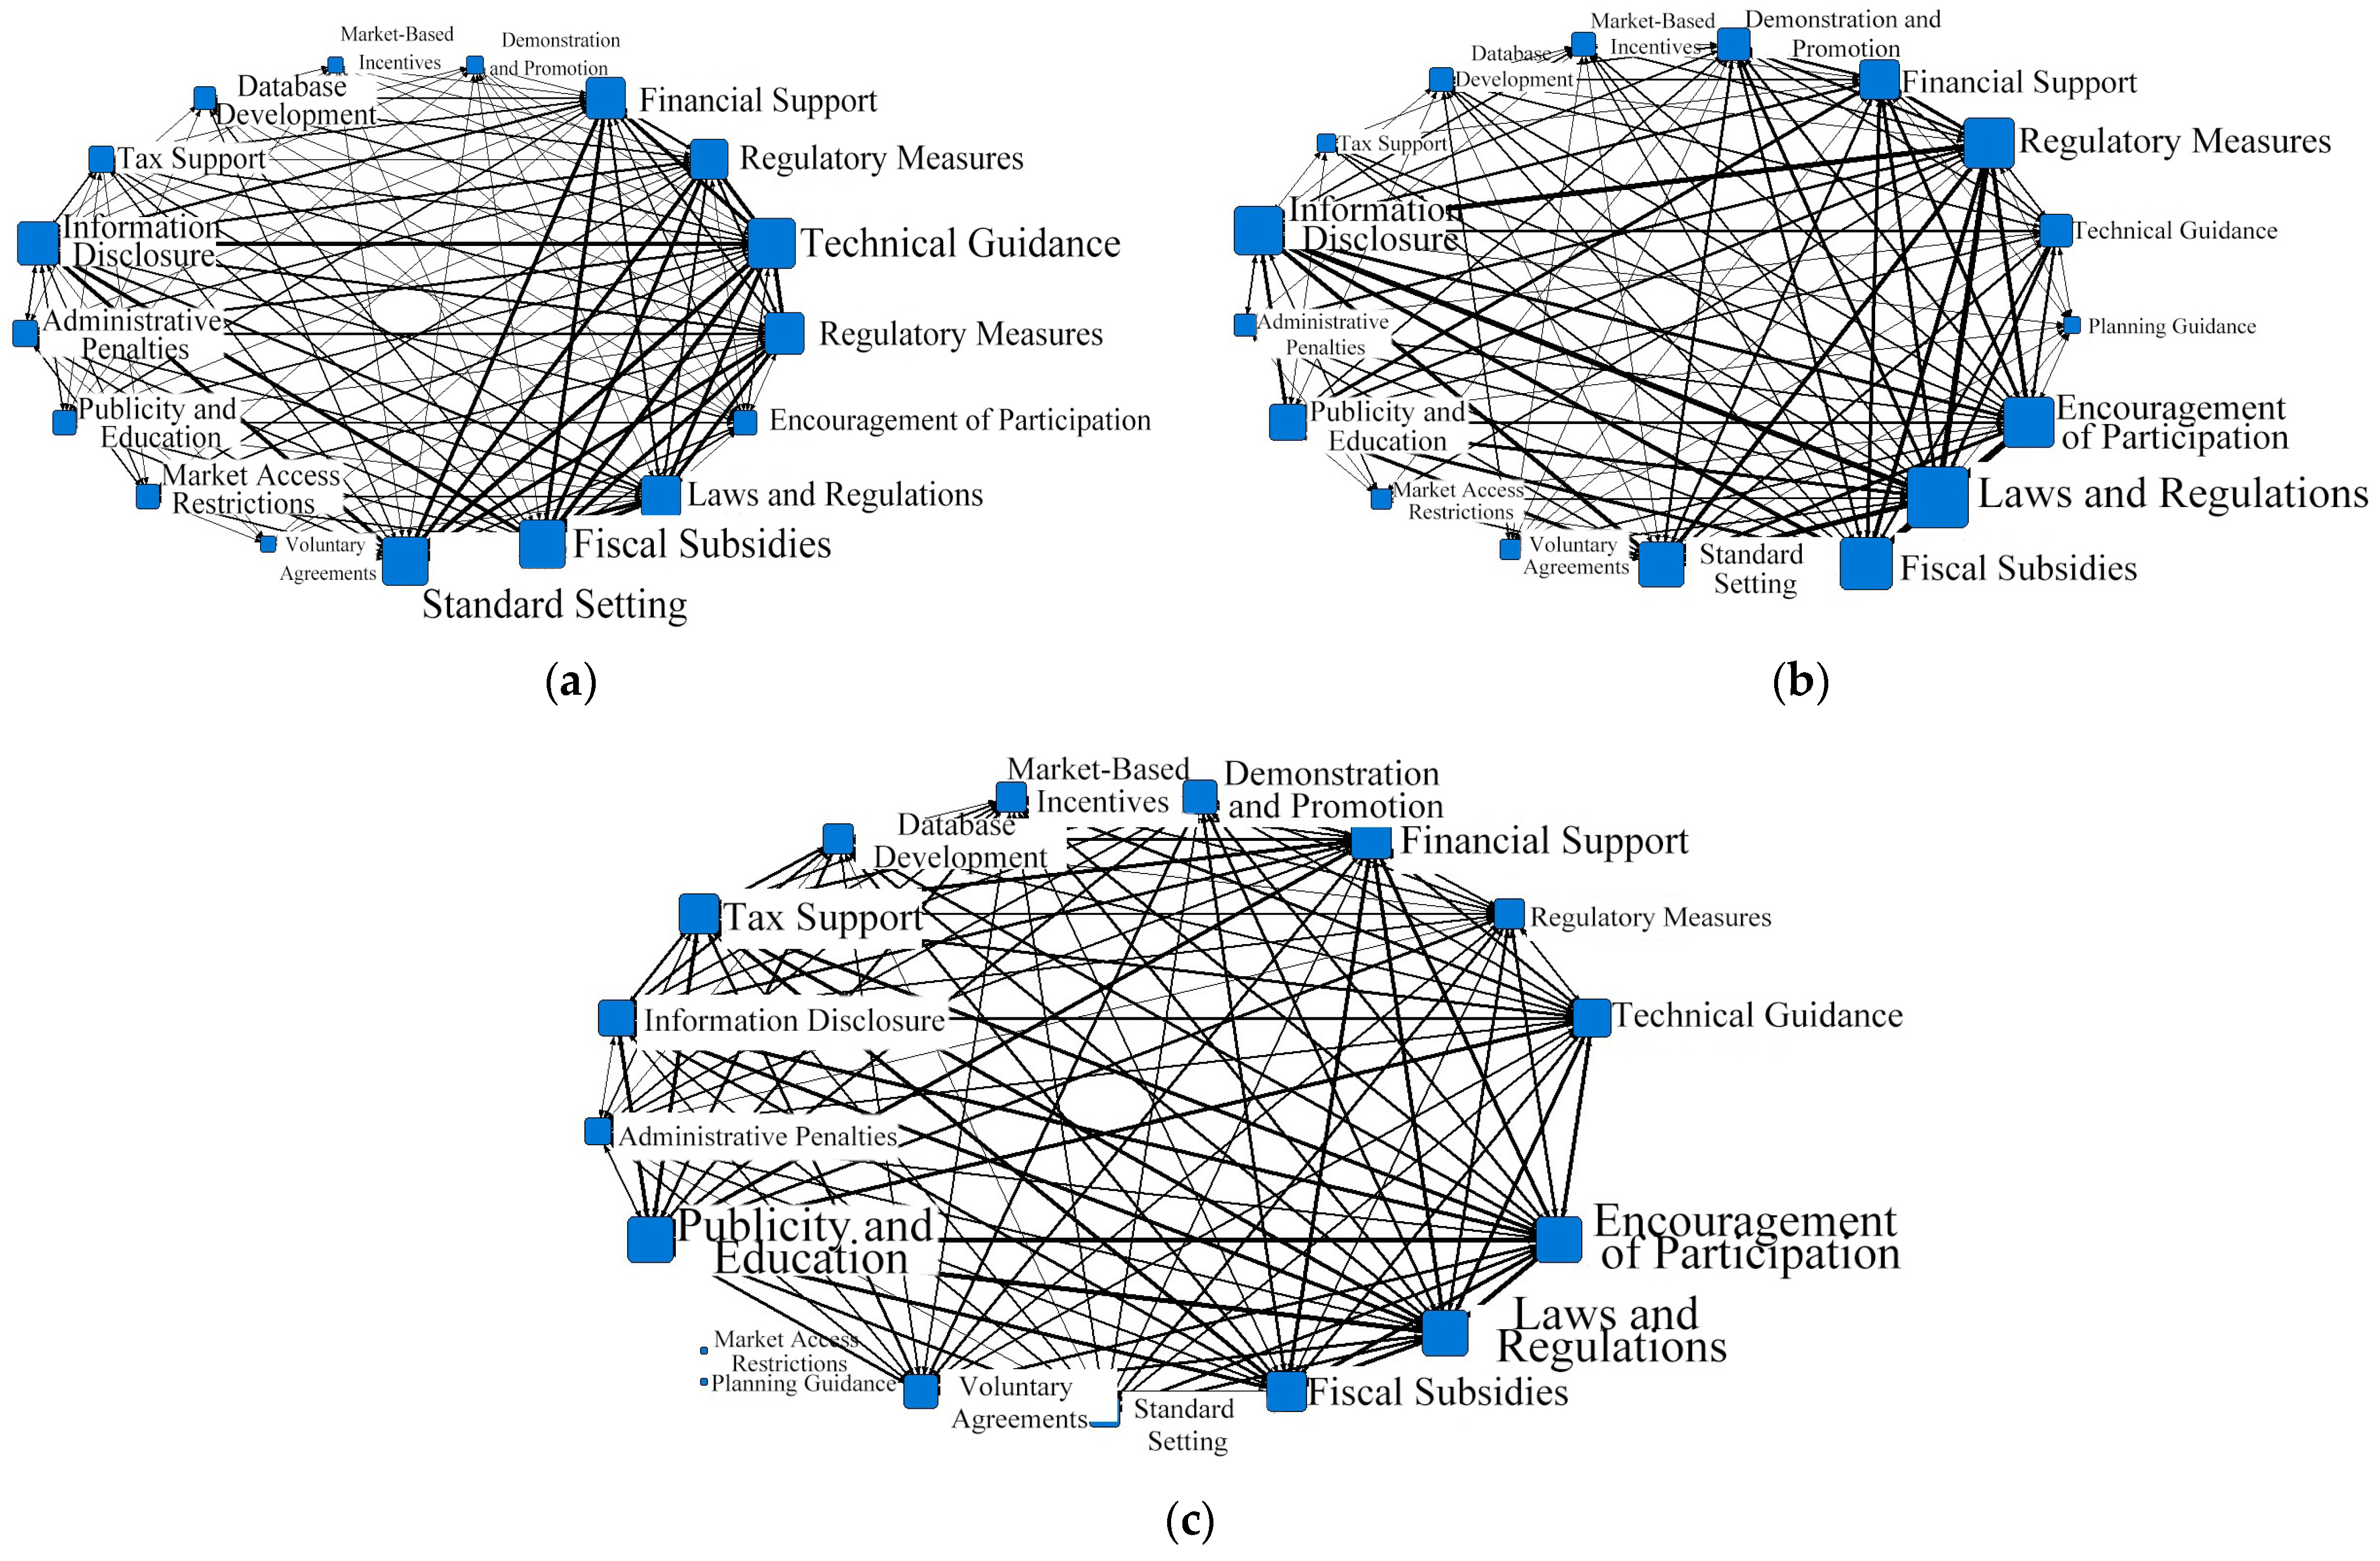
This study explores the specific implementation of policy tool combination relationships through the following approaches: (1) For each of the three stages, the usage of 17 policy instruments in the corresponding policies was compiled, and a two-mode “policy document–policy instrument” original matrix was constructed for each time period. (2) Using UCINET software, the two-mode “policy document–policy instrument” matrix for each stage was transformed into a one-mode “policy instrument–policy instrument” co-occurrence matrix (Figure 4 presents a partial example of the co-occurrence matrix for the single-control period). Figure 5 presents the one-mode network diagram of “policy instrument–policy instrument” generated based on this co-occurrence matrix. In this network, the weight (or tie strength) of the connections between nodes is represented by the frequency of co-occurrence, indicated by the thickness of the lines. Additionally, the degree centrality of each policy instrument node in the network was calculated (see Table 5).
By constructing and analyzing policy instrument portfolio networks across different stages, the following results are obtained (Figure 5 and Table 5). During the single energy consumption control period, the network centralization is 26.83%, and the average matrix density is 1.6140. Instruments such as technical guidance, standard setting, and fiscal subsidies occupy relatively high central positions within the network. During the dual energy consumption control period, network centralization increases to 33.04%, and the average density rises to 2.4743. At this stage, instruments such as legal regulations and fiscal subsidies exhibit significantly higher centrality. In the transitional phase of the dual-control regime, network centralization declines to 23.17%, while matrix density remains at a relatively high level (2.0956). During this period, instruments such as public awareness campaigns and participation incentives show a notable increase in centrality.
Although the degree centrality of most policy instruments increases or adjusts across different stages, several instruments consistently remain at the periphery of the network. Instruments such as database development, market-based incentives, and voluntary agreements exhibit degree centrality values below 0.054 across all stages, remaining at a relatively low level overall.

5. Discussion

5.1. Transformation of Governance at the Macro Level

The evolution of Tianjin’s building energy efficiency policy instrument system reflects a fundamental transformation in governance logic, shifting from a regulation-centered model toward a hybrid governance structure that integrates governmental regulation, market mechanisms, and social participation.
In the early stage, policy design was embedded within a highly centralized administrative framework, in which the government played a dominant role in agenda setting, policy formulation, and implementation. Accordingly, regulatory and informational instruments constituted the primary governance tools. This configuration reflects a governance context characterized by limited market involvement and relatively low levels of stakeholder participation.
With the gradual development of the policy system, economic incentive and voluntary instruments have become increasingly embedded within the policy mix. This indicates that governance authority is no longer fully concentrated within governmental institutions, but is progressively diffused across multiple actors, including enterprises and social organizations, thereby forming a more adaptive and collaborative governance structure.

5.2. Structural Evolution of Policy Instrument Networks

At the structural level, the policy instrument network exhibits an evolutionary pattern from a relatively sparse configuration to a highly connected structure, and finally toward a more balanced configuration across different policy stages. In the early stage, a limited number of instruments—primarily regulatory control, technical guidance, standard setting, and fiscal subsidies—occupied central positions in the network, indicating a concentrated structure dominated by a small set of core instruments.
During the energy consumption dual-control period, both network density and centralization reached relatively high levels, suggesting a more integrated policy configuration in which legal regulations, supervisory measures, and fiscal subsidies occupied central positions in the network. In the subsequent transitional phase of the dual-control system, network centralization declined while density remained relatively high, indicating that inter-instrument coordination persisted, but the network shifted from a single-core-dominated structure toward a more multi-nodal configuration, reflecting a relatively more decentralized network structure in which multiple instruments jointly influence policy outcomes.
This evolution carries important governance implications. First, coercive instruments consistently play a stabilizing and anchoring role across all stages, indicating the continued dominance of government-led governance in building energy efficiency policy. Second, the increasing centrality of informational, participatory, tax-based, and financial instruments suggests a growing prominence of market-oriented and socially oriented instruments within the policy mix, enhancing the flexibility and adaptability of the governance system.

5.3. Interaction Mechanisms of Policy Instruments

At the mechanism level, regulatory instruments have consistently served as institutional anchors across all policy stages, ensuring policy stability and implementation capacity. However, as the importance of other types of instruments has increased, the relative dominance of regulatory tools has gradually declined. Economic incentive-based instruments have increasingly operated through performance-based subsidies, green certification systems, and, more recently, carbon pricing mechanisms such as emissions trading schemes. By linking environmental performance to economic returns, these instruments reshape behavioral incentives and enhance the responsiveness of regulated entities. Voluntary and informational instruments, including public awareness campaigns, participation incentives, and information disclosure mechanisms, play a complementary role in facilitating behavioral adaptation and stakeholder engagement. Their growing importance reflects a broader shift toward participatory governance.
Nevertheless, certain instruments, particularly market-based mechanisms and data infrastructure systems, remain relatively weakly embedded in the overall network. This suggests that, although the policy instrument system has become more diversified, its underlying institutional and technical foundations are still evolving, which may constrain the full effectiveness of policy coordination.

5.4. Structural Challenges in Policy Transition

Despite the observed evolution of Tianjin’s building energy efficiency policy instrument system toward greater diversification and coordination—from a single-dimensional to a multi-instrument and from a fragmented to a more integrated structure—this study also identifies three key issues.
First, there remains a tension between policy objectives and institutional logics. The transition from “dual control of energy consumption” to “dual control of carbon emissions” involves not only a shift in quantitative targets but also a fundamental reconfiguration of governance objects and institutional logics. However, elements of the existing policy system, particularly implementation and evaluation mechanisms, remain deeply embedded in the traditional energy consumption control framework, resulting in the coexistence of new policy objectives and legacy institutional arrangements.
Second, the alignment between policy instruments and core carbon reduction objectives remains insufficient.
Although economic incentive-based and voluntary instruments have increased significantly in number, the proportion of provisions directly related to carbon reduction remains relatively limited. This suggests that the expansion of policy instruments does not necessarily translate into greater precision in policy targeting. Some instruments continue to primarily serve traditional energy efficiency objectives rather than being explicitly oriented toward carbon emission constraints.
Third, market mechanisms and data infrastructure support remain relatively weak. Network structure analysis and the distribution of specific instruments indicate that tools such as data systems, market-based incentives, and voluntary agreements have long occupied peripheral positions. This reflects that accounting systems, information-sharing capacity, and market-based regulatory mechanisms have not yet been fully integrated into the policy framework. Such limitations may constrain the further realization of synergistic effects among policy instruments under the dual-carbon control regime.
To address these challenges, it is necessary to explore the coordination of centralized policy instruments within the SNA network framework to enhance carbon reduction effectiveness under the dual-carbon goals. First, centralized tools, such as a unified carbon accounting system or cross-departmental monitoring platforms, can reconcile conflicts between legacy energy management logics and new carbon reduction objectives, while providing a unified framework for policy evaluation. Second, aligning market-based incentives with mandatory carbon reporting can improve policy targeting, ensuring that even voluntary or peripheral measures directly contribute to emission reduction. Third, strengthening the central role of market mechanisms and data infrastructure facilitates synergy among instruments, thereby enabling more effective implementation of the dual-carbon strategy. Consequently, coordinating centralized instruments within the SNA framework is crucial for bridging structural gaps and promoting Tianjin’s transition toward an integrated, carbon-oriented policy system.

6. Conclusions

This study examines the evolution of building energy efficiency policy instruments in Tianjin during the transition from “dual control of energy consumption” to “dual control of carbon emissions.” The findings indicate that this transition is not merely a substitution of policy objectives, but rather a systemic reconfiguration of governance logic, policy instrument structures, and their interaction mechanisms.
From a governance perspective, this transformation reflects a shift from a hierarchical, regulation-centered model toward a hybrid governance system characterized by the coordinated use of multiple policy instruments. The structure of policy instruments has evolved from a dominance of coercive tools to a more interdependent and synergistic configuration involving diverse instrument types.
Empirically, this study identifies three key dimensions of change.
First, the policy instrument system exhibits a clear structural reorganization, evolving from a centralized configuration toward a networked and coordinated structure. In the early stage, a limited number of regulatory and informational instruments occupied central positions, resulting in a relatively concentrated structure. Over time, the system developed into a multi-nodal network characterized by increased interaction among instruments. Despite this transformation, regulatory instruments continue to function as institutional anchors within the system.
Second, the functional roles of different policy instruments have undergone redistribution and rebalancing. While regulatory instruments continue to ensure institutional stability, their relative dominance has declined. Economic incentive and voluntary instruments have increasingly functioned as behavioral motivation mechanisms, whereas informational instruments have shifted toward coordination and participation facilitation. This indicates a broader transition from compliance-based governance to incentive- and participation-driven governance.
Third, this study identifies a persistent structural misalignment between the expansion of policy instruments and carbon reduction objectives. Although the diversity of instruments has increased, only a limited proportion of economic incentive and voluntary instruments directly targets carbon reduction goals, suggesting that the expansion of policy instruments has not fully translated into improved goal alignment.
Overall, the findings suggest that Tianjin’s policy transition is characterized by the coexistence and interaction of traditional institutional logics and emerging carbon governance paradigms, driving a gradual and adaptive reconfiguration of the governance system.

6.1. Research Implications

Building on the above findings, this study offers several research implications.
First, it highlights the importance of achieving institutional alignment between energy governance systems and carbon governance frameworks. The coexistence of these systems may generate structural tensions that undermine overall policy effectiveness.
Second, the results suggest that policy effectiveness depends not only on the diversification of policy instruments, but also on the degree of functional alignment between instruments and carbon reduction objectives. Future research should pay greater attention to how economic and voluntary instruments can be more directly linked to carbon performance.
Third, this study demonstrates that the effectiveness of policy systems increasingly relies on the coordination among instruments rather than the performance of individual tools. This underscores the need to conceptualize policy design as a systemic configuration of interacting instruments rather than as isolated interventions.
Fourth, the findings emphasize the critical role of data infrastructure and Monitoring, Reporting, and Verification (MRV) systems in enhancing transparency and enabling effective coordination among policy instruments.
Finally, although this study focuses on Tianjin as a single case, the analytical framework provides a useful reference for examining policy transitions in other cities undergoing similar shifts toward carbon-oriented governance.

6.2. Limitations

This study has several limitations that should be acknowledged. First, it is primarily based on policy text analysis and does not sufficiently incorporate empirical data from the policy implementation level. Second, the social network analysis (SNA) framework based on co-occurrence relationships relies on document-level association identification, which introduces a certain degree of abstraction. Given the complex structure and diverse content of policy texts, this approach may overestimate the intensity of interactions among policy instruments. Furthermore, this study does not provide an in-depth characterization of the dynamic causal relationships between policy instruments, and its focus on a single city limits the generalizability of the findings to some extent. Future research could integrate micro-level implementation data, sentence-level semantic analysis, and longitudinal or cross-regional comparative methods to further deepen the understanding of the interaction mechanisms of policy instruments and their external applicability. Despite these limitations, through systematic text analysis and network structure characterization, this study effectively reveals the evolutionary logic and structural features of the policy instrument system, thereby offering a theoretically significant analytical perspective for understanding policy mix mechanisms in governance transitions.

Author Contributions

Conceptualization, T.D. and C.W.; methodology, X.Z.; software, X.Z. and T.D.; validation, C.W., T.D. and X.Z.; investigation, X.Z., T.D. and C.W.; resources, X.Z. and C.W.; data curation, X.Z., T.D. and C.W.; writing—original draft preparation, X.Z., T.D. and C.W.; writing—review and editing, X.Z., C.W. and T.D.; visualization, C.W. and T.D.; supervision, X.Z. and C.W.; project administration, C.W. All authors have read and agreed to the published version of the manuscript.

Funding

This study received no external funding. The APC was funded by the authors.

Data Availability Statement

The policy documents analyzed in this study are publicly available from the official websites of the Tianjin Municipal Government and relevant departments. The coding data generated during this study (including the coding table, analytical units, and co-occurrence matrices) are not publicly archived but can be made available by the corresponding author upon reasonable request.

Conflicts of Interest

The authors declare no conflict of interest.

References

  1. United Nations Environment Programme. Global Status Report for Buildings and Construction 2025; United Nations Environment Programme: Nairobi, Kenya, 2025. [Google Scholar]
  2. Gillingham, K.; Rapson, D.; Wagner, G. The rebound effect and energy efficiency policy. Rev. Environ. Econ. Policy 2016, 10, 68–88. [Google Scholar] [CrossRef] [Scilit]
  3. Xie, D.; Gao, Y.; Lu, X.; Wang, Y.; Li, Z. Research on the implementation path of transition from dual control of energy consumption to dual control of carbon emissions. Compr. Smart Energy 2022, 7, 73–80. [Google Scholar]
  4. Yan, K.; Zhou, Q.; Gao, H.; Tian, J.; Chen, L. Pathways for Industrial Parks Transitioning from Dual Control of Energy Consumption to Dual Control of Carbon Emissions. Environ. Res. Environ. Sci. 2024, 37, 1204–1214. [Google Scholar]
  5. Mostafaei, H.; Ashoori Barmchi, M.; Bahmani, H. Seismic resilience and sustainability: A comparative analysis of steel and reinforced structures. Buildings 2025, 15, 1613. [Google Scholar] [CrossRef] [Scilit]
  6. Li, S.-L.; Guo, X.-Y. The theoretical logic and practical path of shifting from dual control of energy consumption to dual control of carbon emissions. J. Dongbei Univ. Financ. Econ. 2024, 1, 37–50. [Google Scholar]
  7. Zhu, L.; Bian, Y. Study on Energy Consumption Changes of Office Buildings in Tianjin Considering Climate Change. Build. Energy Effic. 2025, 53, 132–138. [Google Scholar]
  8. Huang, H.-H. The rise of policy instrument theory and its development in China. Soc. Sci. 2010, 4, 13–19+187. [Google Scholar]
  9. Li, Q. Research on the selection architecture and optimization strategies of policy instruments for promoting big data development in China. Libr. Inf. Serv. 2018, 62, 5–15. [Google Scholar]
  10. Howlett, M.; Ramesh, M. Studying Public Policy: Policy Cycles and Policy Subsystems; Oxford University Press: Oxford, UK, 2003. [Google Scholar]
  11. International Energy Agency (IEA). Policies for Energy Efficiency and Climate Change Mitigation; IEA Publications: Paris, France, 2025. [Google Scholar]
  12. Charfeddine, L.; Rahman, A. Impact of green and energy efficiency policies on environmental sustainability: Evidence from dynamic panel threshold model. Energy Policy 2025, 202, 114589. [Google Scholar] [CrossRef] [Scilit]
  13. Yu, S.; Tan, Q.; Evans, M.; Kyle, P.; Vu, L.; Patel, P.L. Improving building energy efficiency in India: State-level analysis of building energy efficiency policies. Energy Policy 2017, 110, 331–341. [Google Scholar] [CrossRef] [Scilit]
  14. Matos, A.M.; Delgado, J.M.P.Q.; Guimarães, A.S. Relating energy poverty and thermal building regulations and energy efficiency policies in Portugal. Energy 2022, 15, 329. [Google Scholar]
  15. Meadowcroft, J. Policy implications of sustainable development and energy transitions. Policy Sci. 2009, 42, 323–340. [Google Scholar] [CrossRef] [Scilit]
  16. Rogge, K.S.; Reichardt, K. Policy mixes for sustainability transitions: An extended concept and framework for analysis. Res. Policy 2016, 45, 1620–1635. [Google Scholar] [CrossRef] [Scilit]
  17. Rosenow, J.; Fawcett, T.; Eyre, N. Energy efficiency and the policy mix. Build. Res. Inf. 2016, 44, 562–574. [Google Scholar] [CrossRef] [Scilit]
  18. Jabbour, N. A comparative meta-analysis of residential green building policies and measures in the EU, and their impact on overall energy patterns. IOP Conf. Ser. Mater. Sci. Eng. 2020, 960, 042024. [Google Scholar] [CrossRef] [Scilit]
  19. Fotiou, T.; Capros, P.; Fragkos, P. Policy Modelling for Ambitious Energy Efficiency Investment in the EU Residential Buildings. Energies 2022, 15, 2233. [Google Scholar] [CrossRef] [Scilit]
  20. Gillingham, K.; Newell, R.; Palmer, K. Energy efficiency policies: A retrospective examination. Annu. Rev. Environ. Resour. 2006, 31, 161–192. [Google Scholar] [CrossRef] [Scilit]
  21. Palmer, K.; Walls, M. Using information to close the energy efficiency gap: A review of benchmarking and disclosure ordinances. Energy Effic. 2017, 10, 673–691. [Google Scholar] [CrossRef] [Scilit]
  22. Seok, J.-E.; Kim, J.; Park, H.S. Regulatory and social dynamics of voluntary agreement adoption: The case of voluntary energy efficiency and GHG reduction agreement in South Korea. Energy Policy 2021, 148, 111903. [Google Scholar] [CrossRef] [Scilit]
  23. Welch, E.W.; Hibiki, A. Japanese voluntary environmental agreements: Bargaining power and reciprocity as contributors to effectiveness. Policy Sci. 2002, 35, 401–424. [Google Scholar] [CrossRef] [Scilit]
  24. Schade, J.; Wallström, P.; Olofsson, T.; Lagerqvist, O. A comparative study of the design and construction process of energy efficient buildings in Germany and Sweden. Energy Policy 2013, 58, 28–37. [Google Scholar] [CrossRef] [Scilit]
  25. Braungardt, S.; Bürger, V.; Köhler, B. Carbon pricing and complementary policies—Consistency of the policy mix for decarbonizing buildings in Germany. Energies 2021, 14, 7143. [Google Scholar] [CrossRef] [Scilit]
  26. Wang, J.; Sun, P. Evolutionary law analysis of China’s building energy efficiency policy research. Gansu Soc. Sci. 2011, 6, 223–225. [Google Scholar]
  27. Wang, L.; Yang, J.; Sun, J. Research on economic incentive policies for energy efficiency in public buildings. Soc. Sci. Res. 2015, 3, 134–136. [Google Scholar]
  28. Huang, W.; Wu, M.X.; Wei, D.Q. Corporate Policy Responses under the Shift from “Dual Control of Energy Consumption” to “Dual Control of Carbon Emissions”: Evidence from Zhejiang Province. Ecol. Econ. 2024, 40, 153–160. [Google Scholar]
  29. Dombrowsky, I.; Iacobuta, G.I.; Daioglou, V.; Keppler, D.; Soergel, B.; Weindl, I.; Kriegler, E. Policy mixes for sustainable development pathways: Representation in integrated assessment models. Environ. Res. Lett. 2025, 20, 014030. [Google Scholar] [CrossRef] [Scilit]
  30. Liu, Y.; Zhou, Z.; Han, Y.; Wang, C.; Li, W.; Chen, Y.; Lian, Y.; Chen, H. Potential of carbon emissions from heating in hot summer and cold winter urban residential areas in China through 2050. Energy Build. 2025, 341, 115790. [Google Scholar] [CrossRef] [Scilit]
  31. Dong, N. A Study on Low-Carbon Renovation Strategies for Old Residential Areas in Tianjin Based on Carbon Emission Accounting. Master’s Thesis, Tianjin University, Tianjin, China, 2021. [Google Scholar]
  32. Mark, P.; Roberts, H. Systematic Reviews in the Social Sciences: A Practical Guide; Blackwell Publishing: Oxford, UK, 2006. [Google Scholar]
  33. Erlingsson, C.; Brysiewicz, P. A hands-on guide to doing content analysis. Afr. J. Emerg. Med. 2017, 7, 93–99. [Google Scholar] [CrossRef] [Scilit]
  34. Fleiss, J.L. Measuring nominal scale agreement among many raters. Psychol. Bull. 1971, 76, 378–382. [Google Scholar] [CrossRef] [Scilit]
  35. GB 55015-2021; General Code for Energy Efficiency and Renewable Energy Application in Buildings. China Architecture & Building Press: Beijing, China, 2021.
  36. Krippendorff, K. Content Analysis: An Introduction to Its Methodology; SAGE Publications: Thousand Oaks, CA, USA, 2004. [Google Scholar]
  37. Borgatti, S.P.; Everett, M.G.; Freeman, L.C. Ucinet for Windows: Software for Social Network Analysis; Analytic Technologies: Harvard, MA, USA, 2002. [Google Scholar]
  38. Freeman, L.C. Centrality in social networks conceptual clarification. Soc. Netw. 1979, 1, 215–239. [Google Scholar] [CrossRef] [Scilit]
  39. Wasserman, S.; Faust, K. Social Network Analysis: Methods and Applications; Cambridge University Press: Cambridge, UK, 1994. [Google Scholar]
Figure 1. Overall frequency changes of four types of policy instruments.
Buildings 16 01831 g001
Figure 2. Statistics of Economic Incentive and Voluntary Policies in Policy Texts.
Buildings 16 01831 g002
Figure 3. Proportion of Economic Incentive, Voluntary, and Carbon Reduction-Related Policies during the Dual-Control Transition Period.
Buildings 16 01831 g003
Figure 4. Energy consumption single-control period policy tools × Policy tools co-occurrence matrix.
Buildings 16 01831 g004
Figure 5. One-Mode Network of “Policy Instruments × Policy Instruments” across Different Stages. (a) Single-control period of energy consumption; (b) Period of dual control of energy consumption; (c) Double-control transition period.
Buildings 16 01831 g005
Table 1. Detailed Table of Building Energy Efficiency Policy Tools.
Tool TypeTool NameExplanatory Note
Compulsory typelegal normEstablish mandatory clauses and technical specifications for building energy conservation by legislation, providing clear legal basis and technical guidance for the industry
administrative penaltyPunish violations by imposing fines, suspending production for rectification, revoking qualifications, and other disciplinary measures to ensure effective implementation of energy-saving standards
standard settingEstablish mandatory standard system covering the whole process of design, construction and acceptance, and promote the standardized development of energy-saving technology
access restrictionsImplement market access mechanisms including project approval and material filing to prevent non-compliant products from entering the market at source
regulatory measuresImplement dynamic monitoring of energy consumption, itemized measurement, and full-process supervision to strengthen process control of energy-saving measures implementation
Informationaltechnological guidancePublish energy-saving technology guidelines and best practice cases to lower the threshold for new technology adoption and promote industrial transformation and upgrading
Information DisclosureData Disclosure, Energy Consumption Disclosure, Labeling and Certification, Mandatory Disclosure, Promoting Energy Conservation Improvement with the Help of Social Supervision
publicity and educationConduct professional training and public science education, and enhance industry skill levels and social awareness through demonstration projects
Planning GuidanceFormulate short-, medium- and long-term energy-saving target and implementation path, coordinate and promote the construction of ecological urban area and other benchmark projects
database constructionBuilding energy consumption monitoring big data platform and green building materials database to provide scientific basis for decision-making
Economic incentive typegrant-in-aidEstablish special subsidy funds and incentive mechanism to reduce the economic burden of energy-saving transformation for market entities
tax supportImplementing policies such as immediate VAT refunds and income tax reductions, with a focus on supporting the development of energy-saving sectors
financial supportThe government’s policy support for expanding corporate financing channels includes green credit, PPP financing, and energy performance contracting (EPC)
market incentiveWe will implement market-based incentives such as carbon emission trading and preferential procurement of energy efficiency labels
Economic incentive typegrant-in-aidEstablish special subsidy funds and incentive mechanism to reduce the economic burden of energy-saving transformation for market entities
tax supportImplementing policies such as immediate VAT refunds and income tax reductions, with a focus on supporting the development of energy-saving sectors
Table 2. Summary Table of Building Energy Efficiency Policies in Tianjin.
NumberPolicy Name
1Tianjin Regulations on Wall Material Innovation and Building Energy Conservation Management
2Tianjin Building Energy Conservation Management Regulations
3The 11th Five-Year Plan for the Development of Energy Conservation and Resource Conservation in Civil Buildings in Tianjin
4Tianjin Green Building Pilot Construction Project Management Measures
5Implementation Plan for the Construction of Energy Conservation Supervision System for Tianjin Municipal Government Offices and Large Public Buildings
6Tianjin’s 12th Five-Year Plan Outline
7Tianjin Green Building Construction Management Measures
8Tianjin Building Energy Conservation Regulations, 2012 Revision, 2018 Amendment
9Tianjin Green Building Action Plan
10Technical Guidelines for Evaluation of Green Building Equipment in Tianjin
11Technical Guidelines for Evaluation of Green Building Materials in Tianjin
12Tianjin’s 13th Five-Year Plan for Building Energy Efficiency and Green Building
13Tianjin Building Energy Conservation and Promotion of New Technology Award Measures
14Implementation Plan of Key Cities for Improving Energy Efficiency of Public Buildings in Tianjin
15Catalogue of Promotion, Restriction and Prohibition of Building Energy-saving Technologies, Techniques, Materials and Equipment in Tianjin
16Administrative Measures for the Record of Building Energy-saving Materials, Equipment and Technology in Tianjin
17Implementation Plan for the Development of Prefabricated Building
18Management Measures for Subsidy Funds for Improving Energy Efficiency of Public Buildings in Tianjin
19Tianjin Green Building Management Regulations
20Implementation Plan of Green Building Creation Action in Tianjin
21Tianjin Green Building 14th Five-Year Plan
22Implementation Plan of Tianjin’s 14th Five-Year Plan for Energy Conservation and Emission Reduction
23Implementation Plan for Carbon Peak in the Field of Urban and Rural Construction in Tianjin
24Implementation Plan for Carbon Peak in Public Institutions of Tianjin
25Implementation Plan for Carbon Peak in the Field of Urban and Rural Construction in Tianjin
26Tianjin Civil Building Energy Conservation Project Construction Quality Acceptance Regulations
Table 3. Content Analysis Unit Coding Table for Building Energy Efficiency Policies in Tianjin.
Policy IDPolicy NameContent Analysis UnitEncoding
1Tianjin Municipal Regulations on Wall Material Innovation and Building Energy Efficiency ManagementProhibition of new construction, expansion, or renovation of solid clay brick production lines; violators shall be fined1—1
…………
Defining New Wall Materials and Building Energy Efficiency1—14
2Tianjin Municipal Regulations on Building Energy Efficiency ManagementConstruction activities within the administrative region of this municipality shall comply with these regulations, and self-built rural housing shall be gradually incorporated into management2—1
…………
If the manager is negligent, the administrative or criminal responsibility shall be investigated2—30
3Tianjin Civil Building and Resource Conservation 11th Five-Year Development PlanStrictly restrict the construction of new super high-rise buildings exceeding 250 m in height, and prohibit the construction of new super high-rise buildings exceeding 500 m in height; the building density of new residential buildings shall be <30%, and the height shall be ≤80 m3—1
…………
Supporting R&D for carbon peaking technologies, fostering innovative enterprises, and enhancing industry-academia-research collaboration3—24
……………………
25Implementation Plan for Carbon Peak in the Urban and Rural Construction Sector of Tianjin CityAll new civil buildings must comply with the General Code for Building Energy Efficiency and Renewable Energy Utilization (GB 55015) [35]; New residential buildings shall have a floor area ratio below 30% and a height not exceeding 80 m, while 20% of new public buildings must achieve full electrification25—1
…………
Encourage farmers to participate in the energy-saving renovation of rural houses by self-raising funds and labor25—15
26Tianjin Civil Building Energy Conservation Project Construction Quality Acceptance RegulationsConstruction sites shall establish a quality management system and inspection system26—1
…………
The energy-saving construction of exterior wall needs on-site physical inspection and recording of image data26—9
Table 4. Frequency Statistics of Policy Instruments in Building Energy Efficiency Policy Texts.
Tool TypeTool NameSingle-Control Period of Energy ConsumptionProportionPeriod of Dual Control of Energy ConsumptionProportionDouble-Control Transition PeriodProportionAmount toTotal Weight
Enforceable instrumentlaws and regulations1949.58% (59)7051.50% (120)1236.21% (21)20048.90%
regulatory measures10264
administrative penalty1561
standard setting8114
access restrictions770
Information tooltechnological guidance1832.77% (39)1016.74% (39)217.24% (10)8821.52%
Information Disclosure5163
publicity and education283
Planning Guidance1010
database construction442
Incentive instrumentgrant-in-aid611.76% (14)2015.02% (35)322.41% (13)6215.16%
tax support233
financial support594
market incentive133
Voluntary instrumentEncourage participation35.88% (7)3116.74% (39)724.14% (14)5914.42%
Demonstration and Promotion365
voluntary compliance agreement122
Note: Frequencies are based on 409 coded analytical units (Section 3.5). The three columns correspond to the single energy consumption control period, dual energy consumption control period, and dual-control transition period (see Section 2.1, Stage division). “Proportion” denotes the share of each instrument type within the total counts of the same stage; values in parentheses are subtotals (n). “Amount to” is the total frequency across the three stages, and “Total weight” is the share of each instrument type in the overall total.
Table 5. Degree Centrality of Policy Instruments across Different Stages.
StagePolicy InstrumentDegree CentralityStagePolicy InstrumentDegree CentralityStagePolicy InstrumentDegree Centrality
Single-control period of energy consumptiontechnological guidance0.1Period of dual control of energy consumptionlaws and regulations0.108Double-control transition periodlaws and regulations0.087
standard setting0.098grant-in-aid0.102publicity and education0.087
grant-in-aid0.098regulatory measures0.098Encourage participation0.087
Information Disclosure0.083Encourage participation0.098grant-in-aid0.075
Planning Guidance0.08Information Disclosure0.093tax support0.075
financial support0.078standard setting0.085financial support0.075
laws and regulations0.078financial support0.07technological guidance0.068
regulatory measures0.076publicity and education0.064Information Disclosure0.066
administrative penalty0.046Demonstration and Promotion0.055Demonstration and Promotion0.061
tax support0.043technological guidance0.051voluntary compliance agreement0.061
access restrictions0.041database construction0.049database construction0.054
publicity and education0.041market incentive0.046market incentive0.054
Encourage participation0.041administrative penalty0.042regulatory measures0.052
database construction0.035access restrictions0.040standard setting0.052
Demonstration and Promotion0.022voluntary compliance agreement0.039administrative penalty0.042
market incentive0.02tax support0.037
voluntary compliance agreement0.02Planning Guidance0.035
Network centralization26.83%Network centralization33.04%Network centralization23.17%
Density (matrix average)1.6140Density (matrix average)2.4743Density (matrix average)2.0956
Note: The degree centrality in the table is a standardized value, which is the ratio of the number of connections a node has to the total number of connections in the network.
Disclaimer/Publisher’s Note: The statements, opinions and data contained in all publications are solely those of the individual author(s) and contributor(s) and not of MDPI and/or the editor(s). MDPI and/or the editor(s) disclaim responsibility for any injury to people or property resulting from any ideas, methods, instructions or products referred to in the content.