3.3.1. Uniaxial Compressive Strength
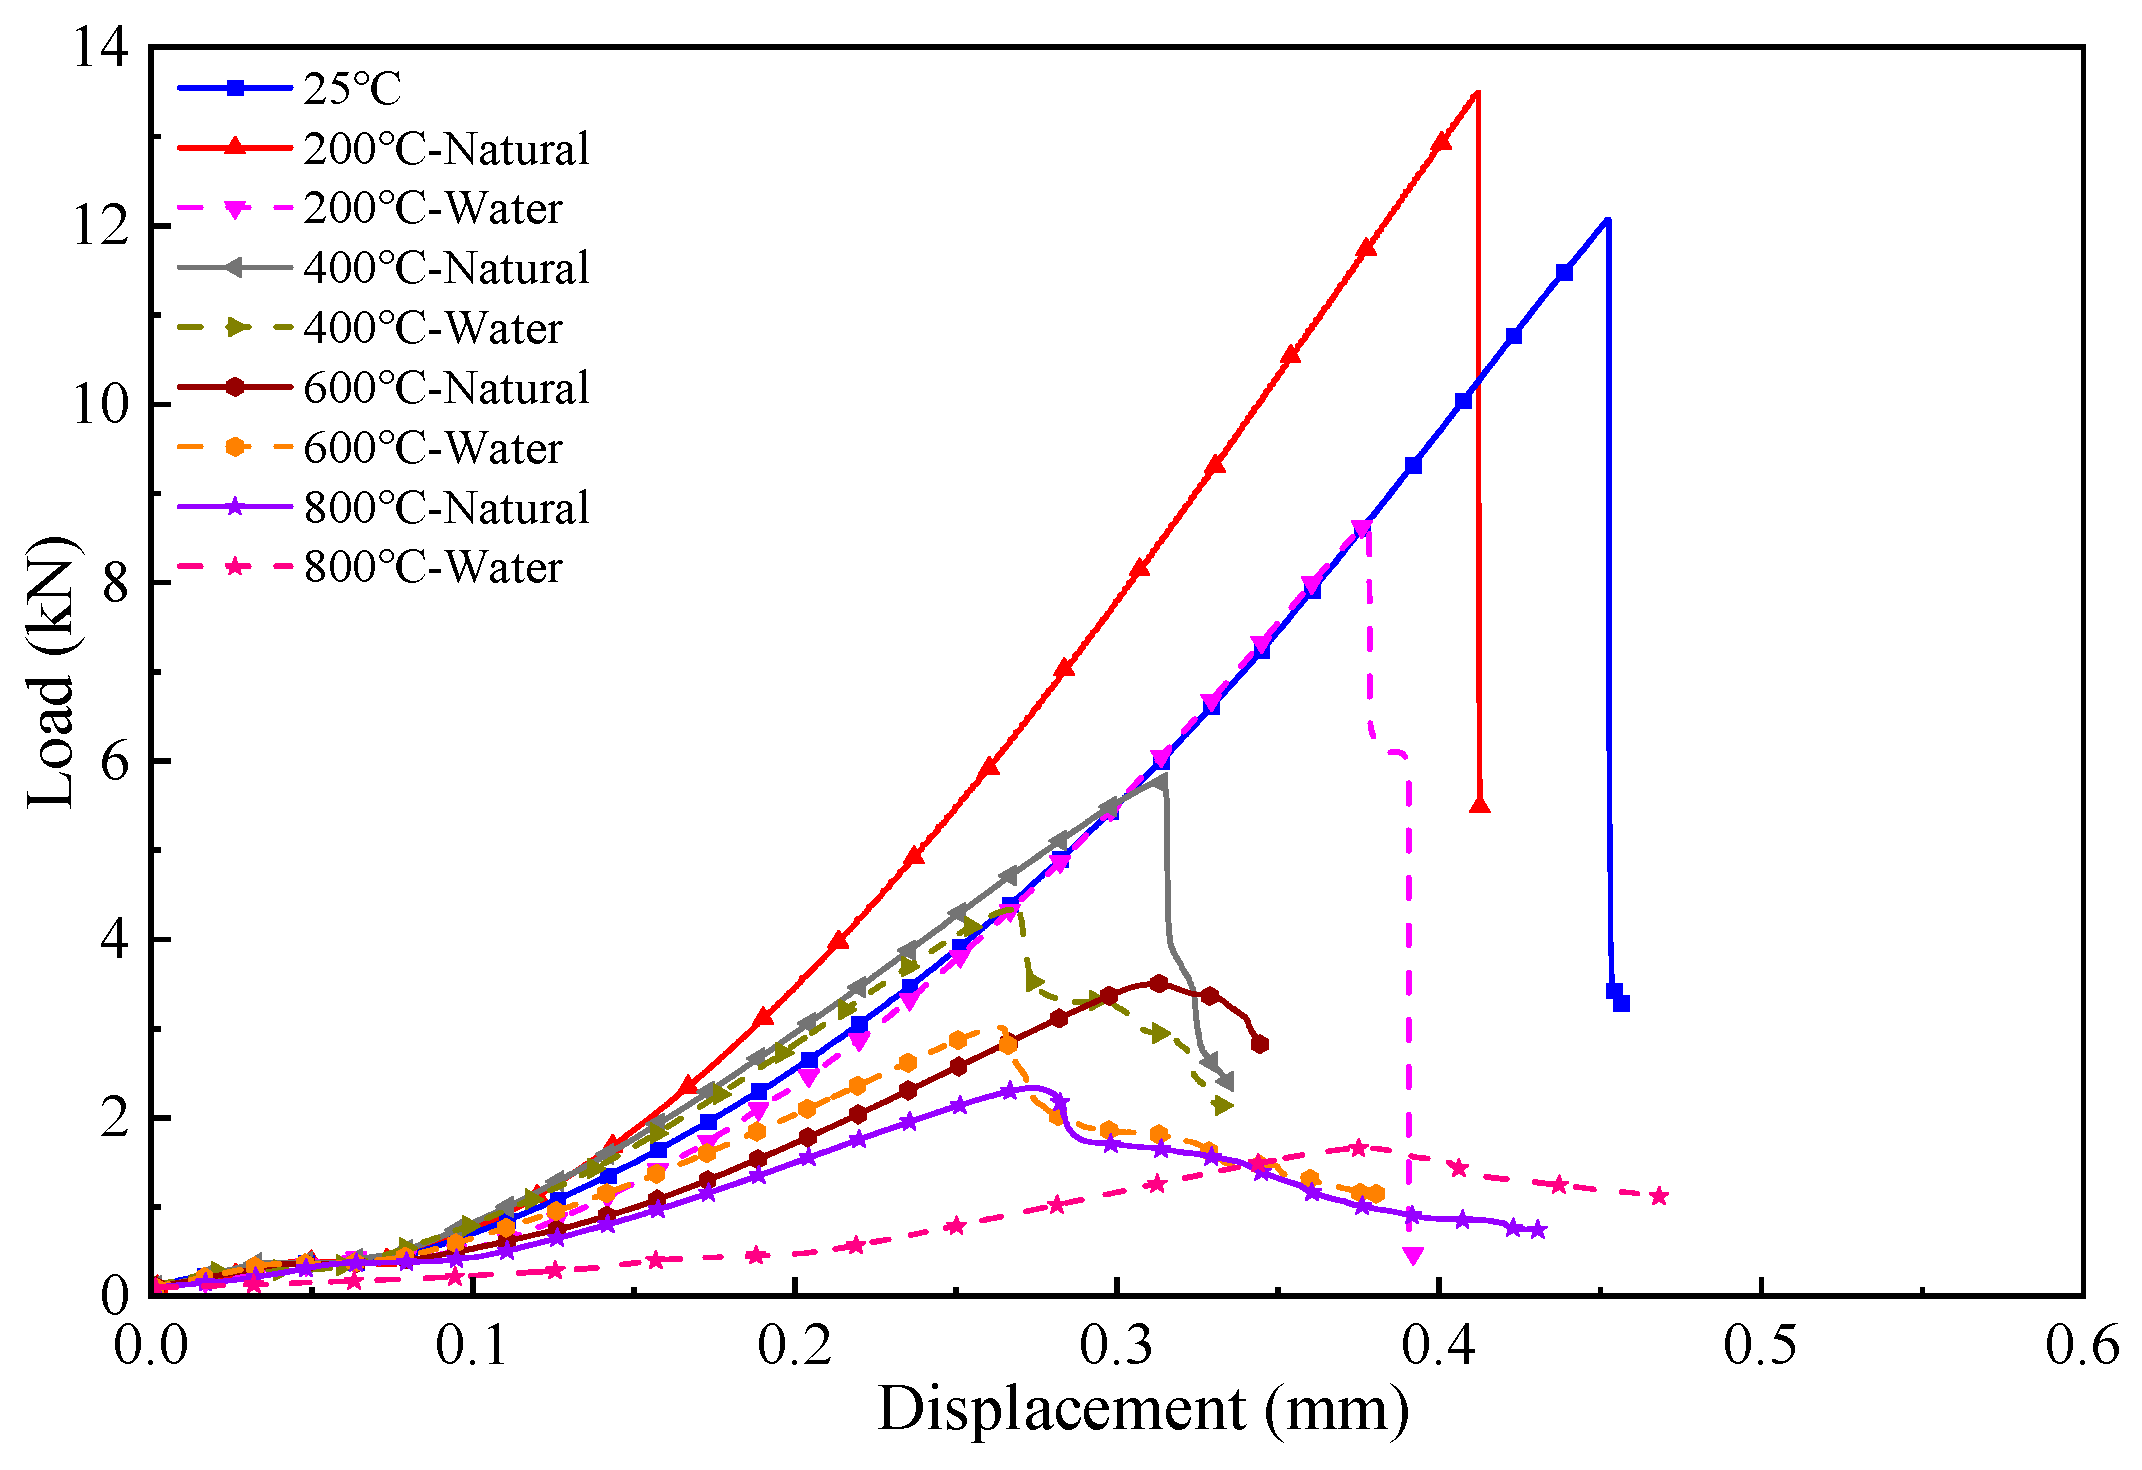
The average uniaxial compressive strength values of the specimens under various experimental conditions, obtained from the uniaxial compressive tests, are summarized in
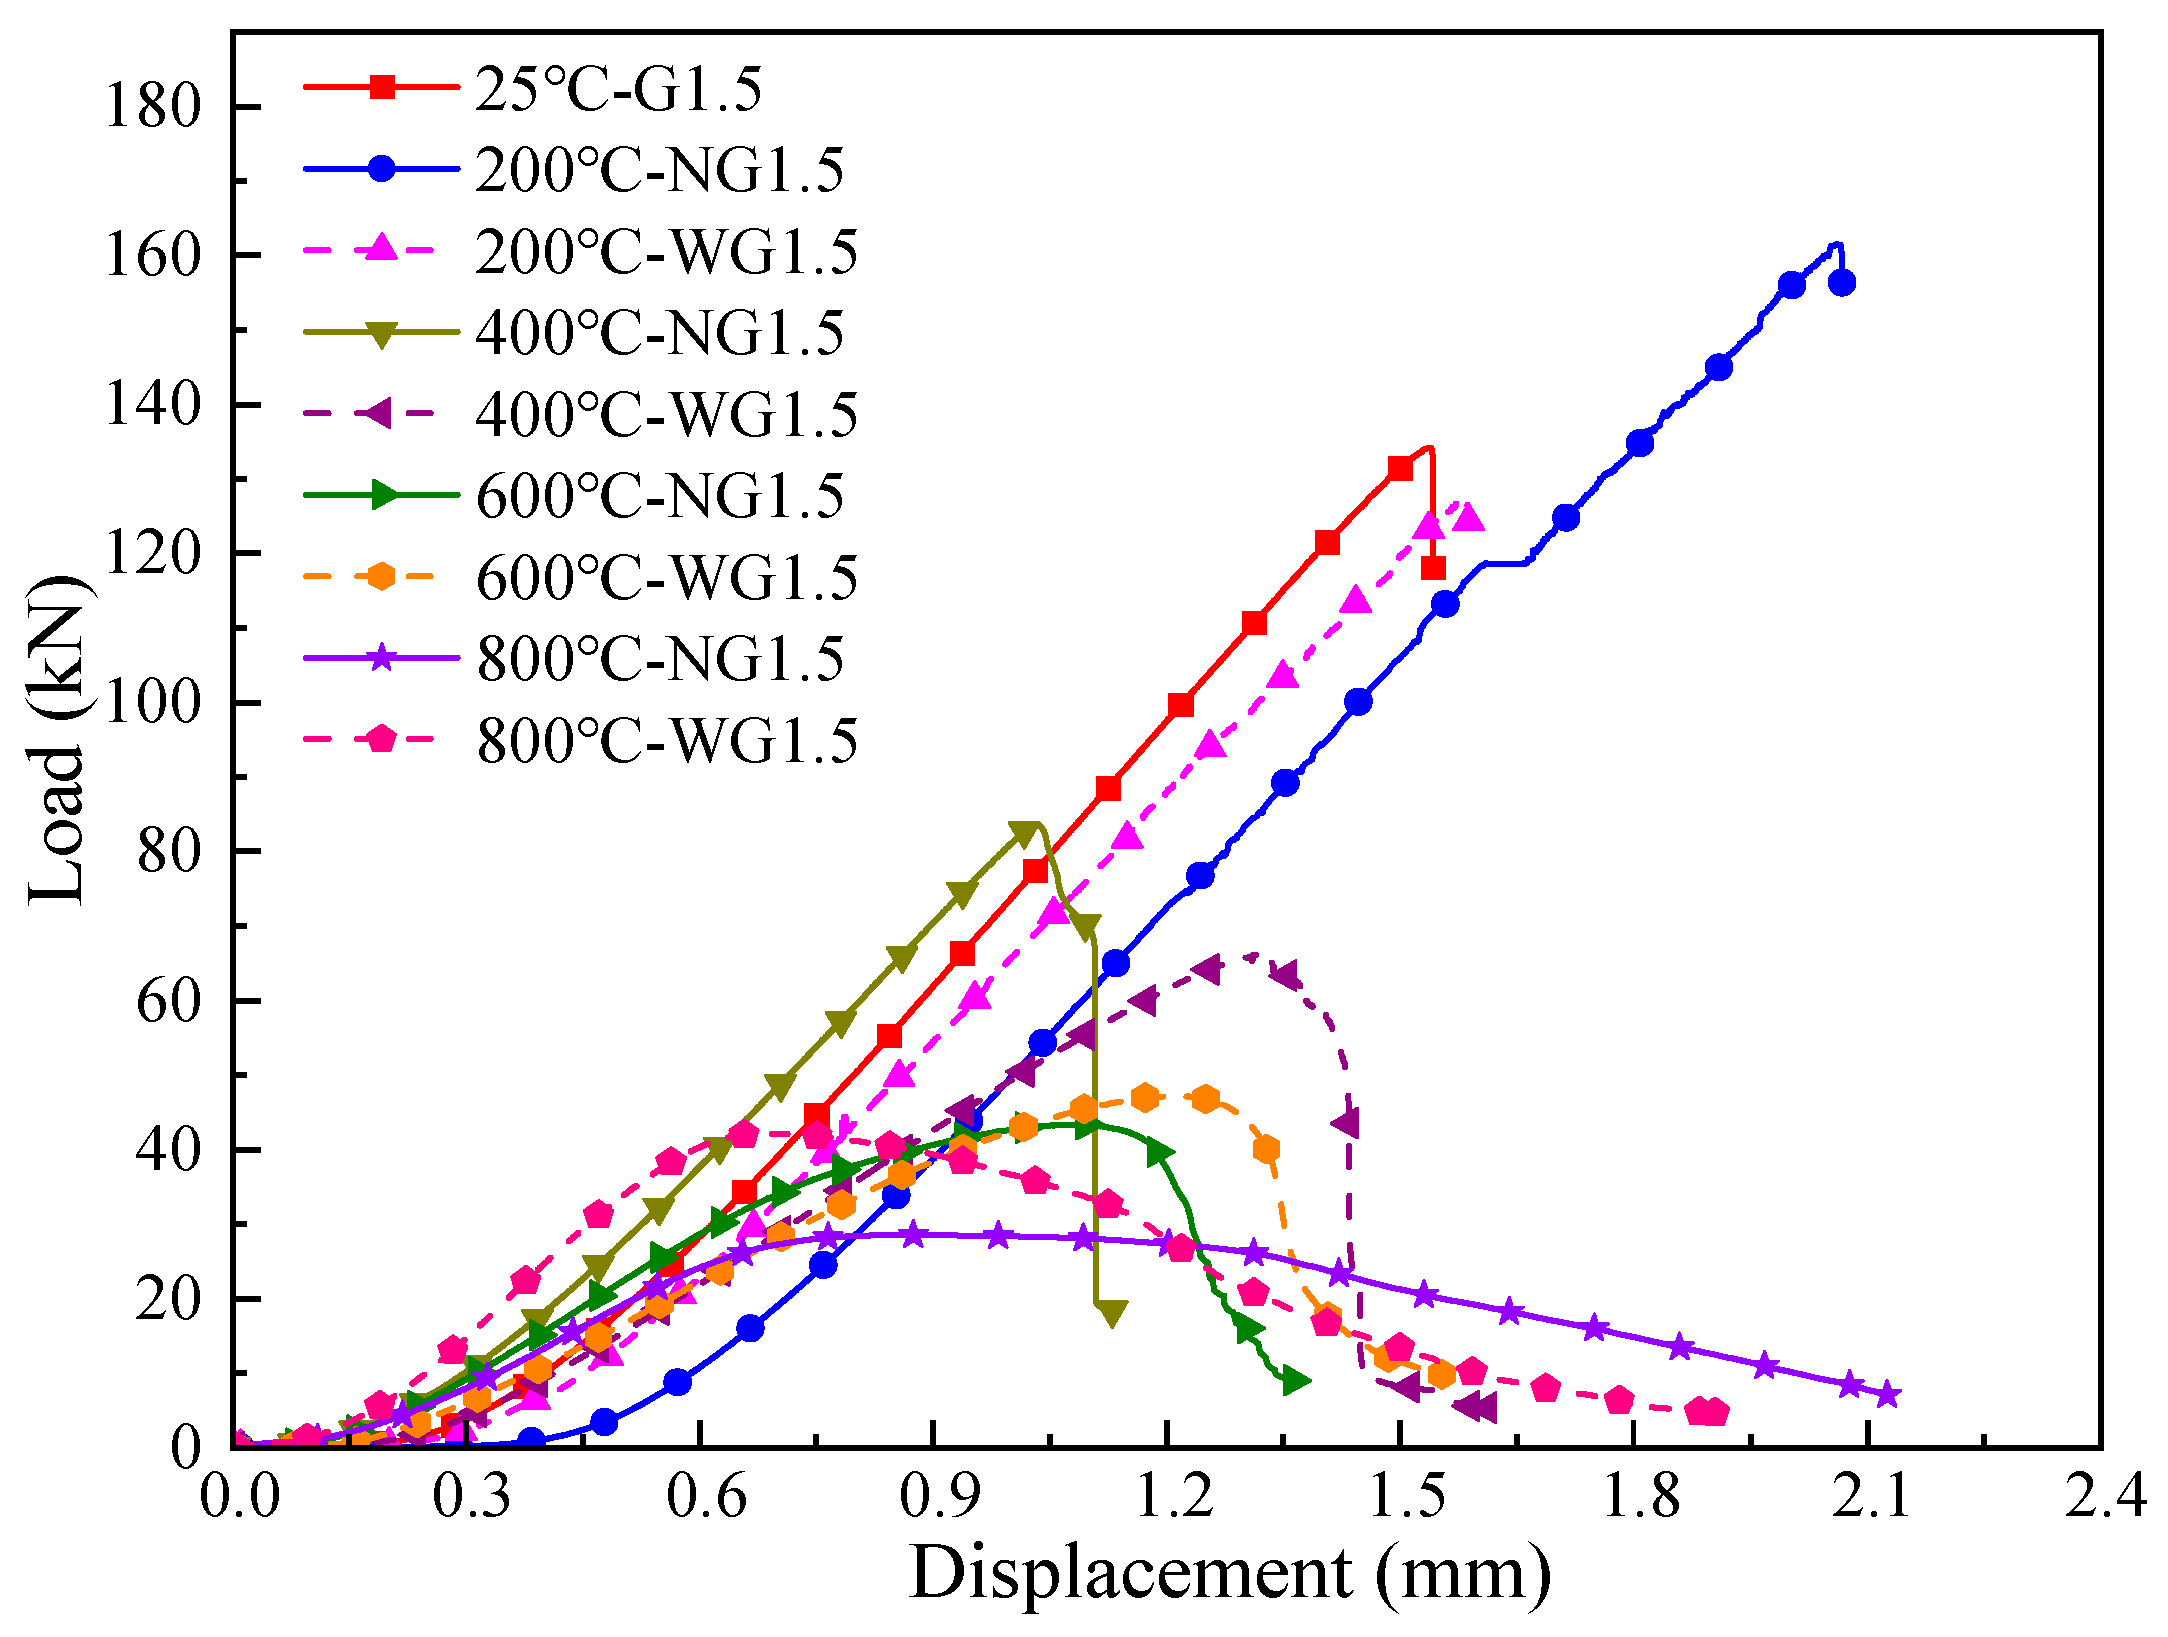
Table 4. Additionally, the corresponding load–displacement curves are plotted in
Figure 9.
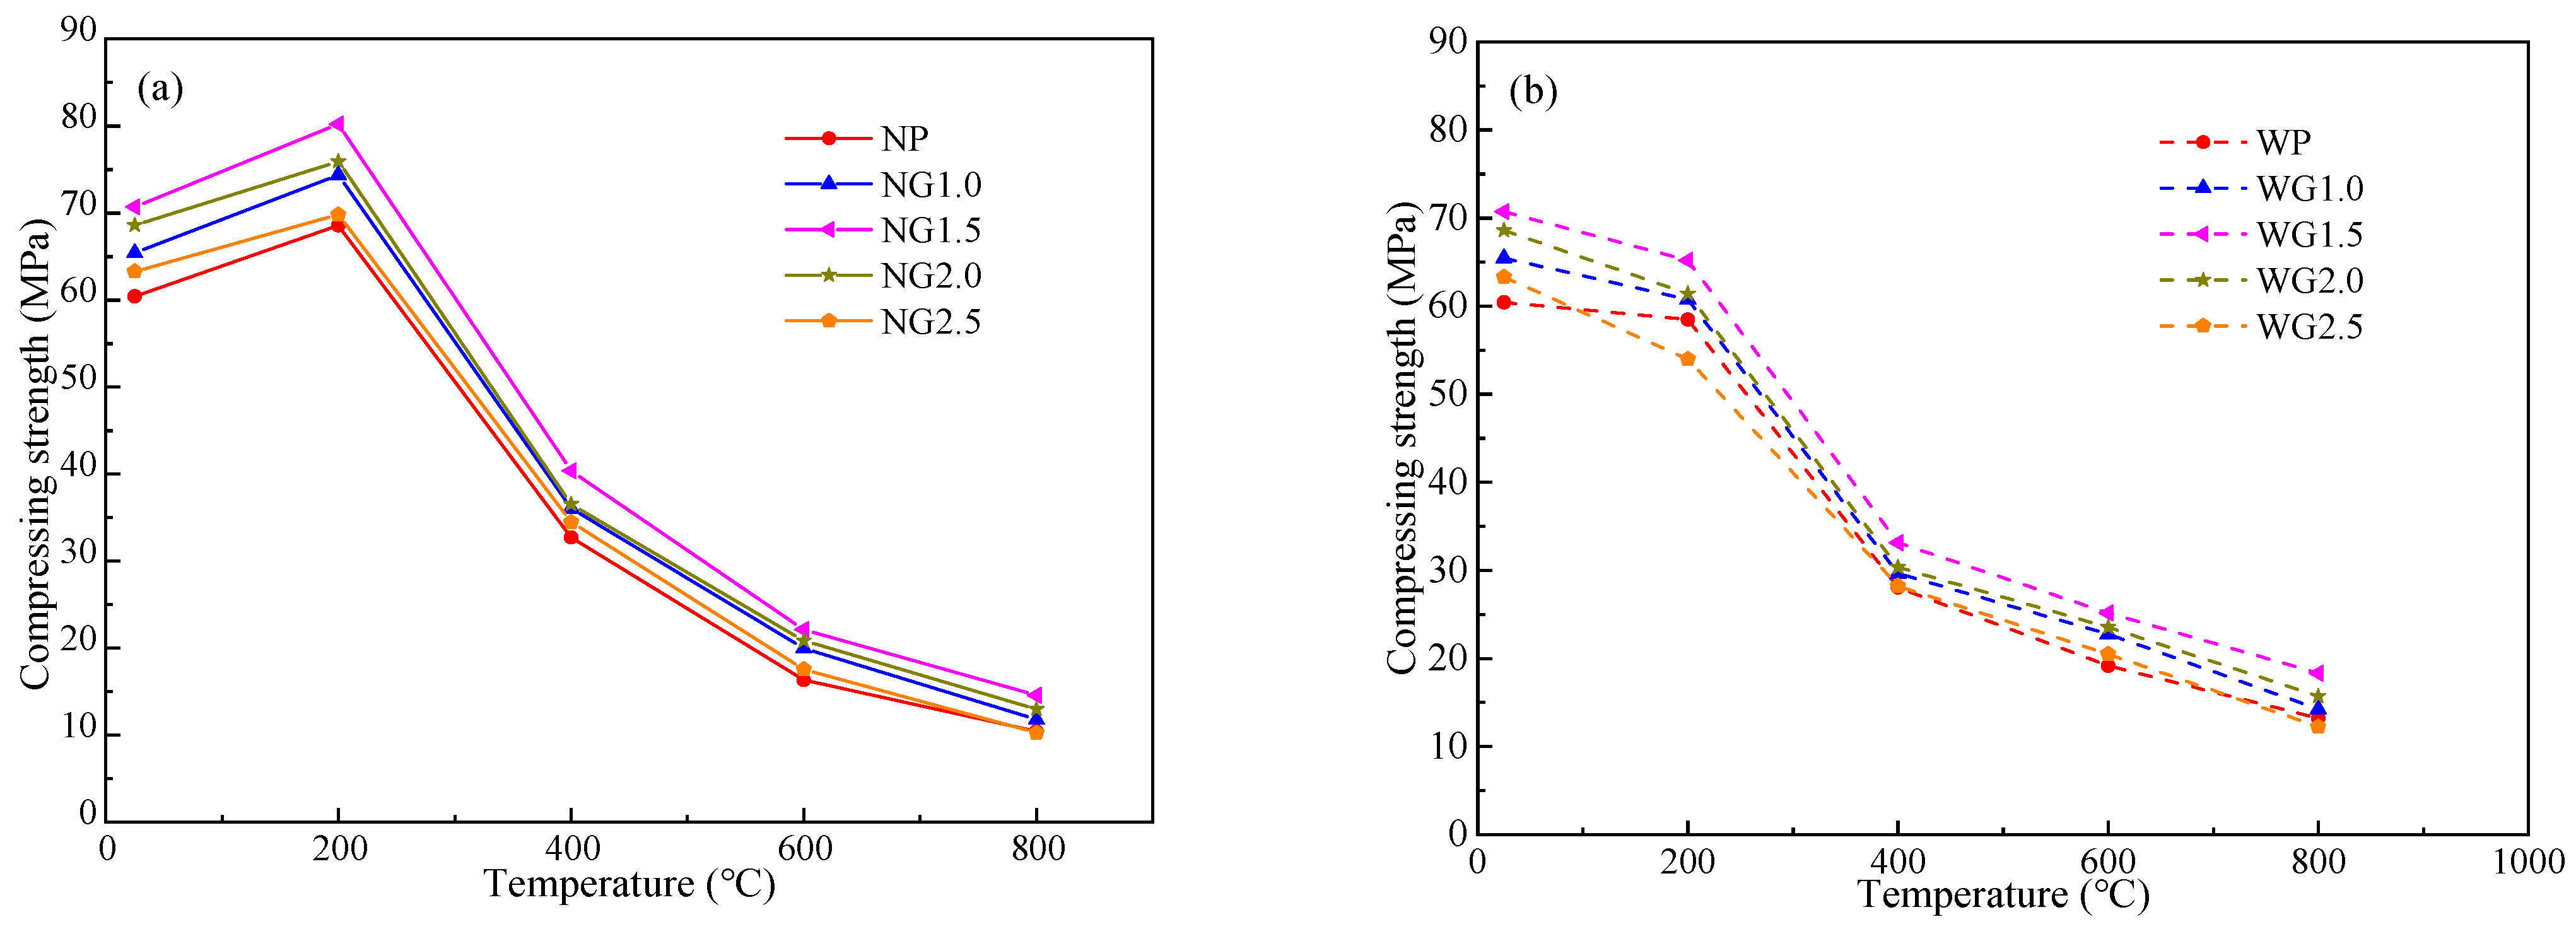
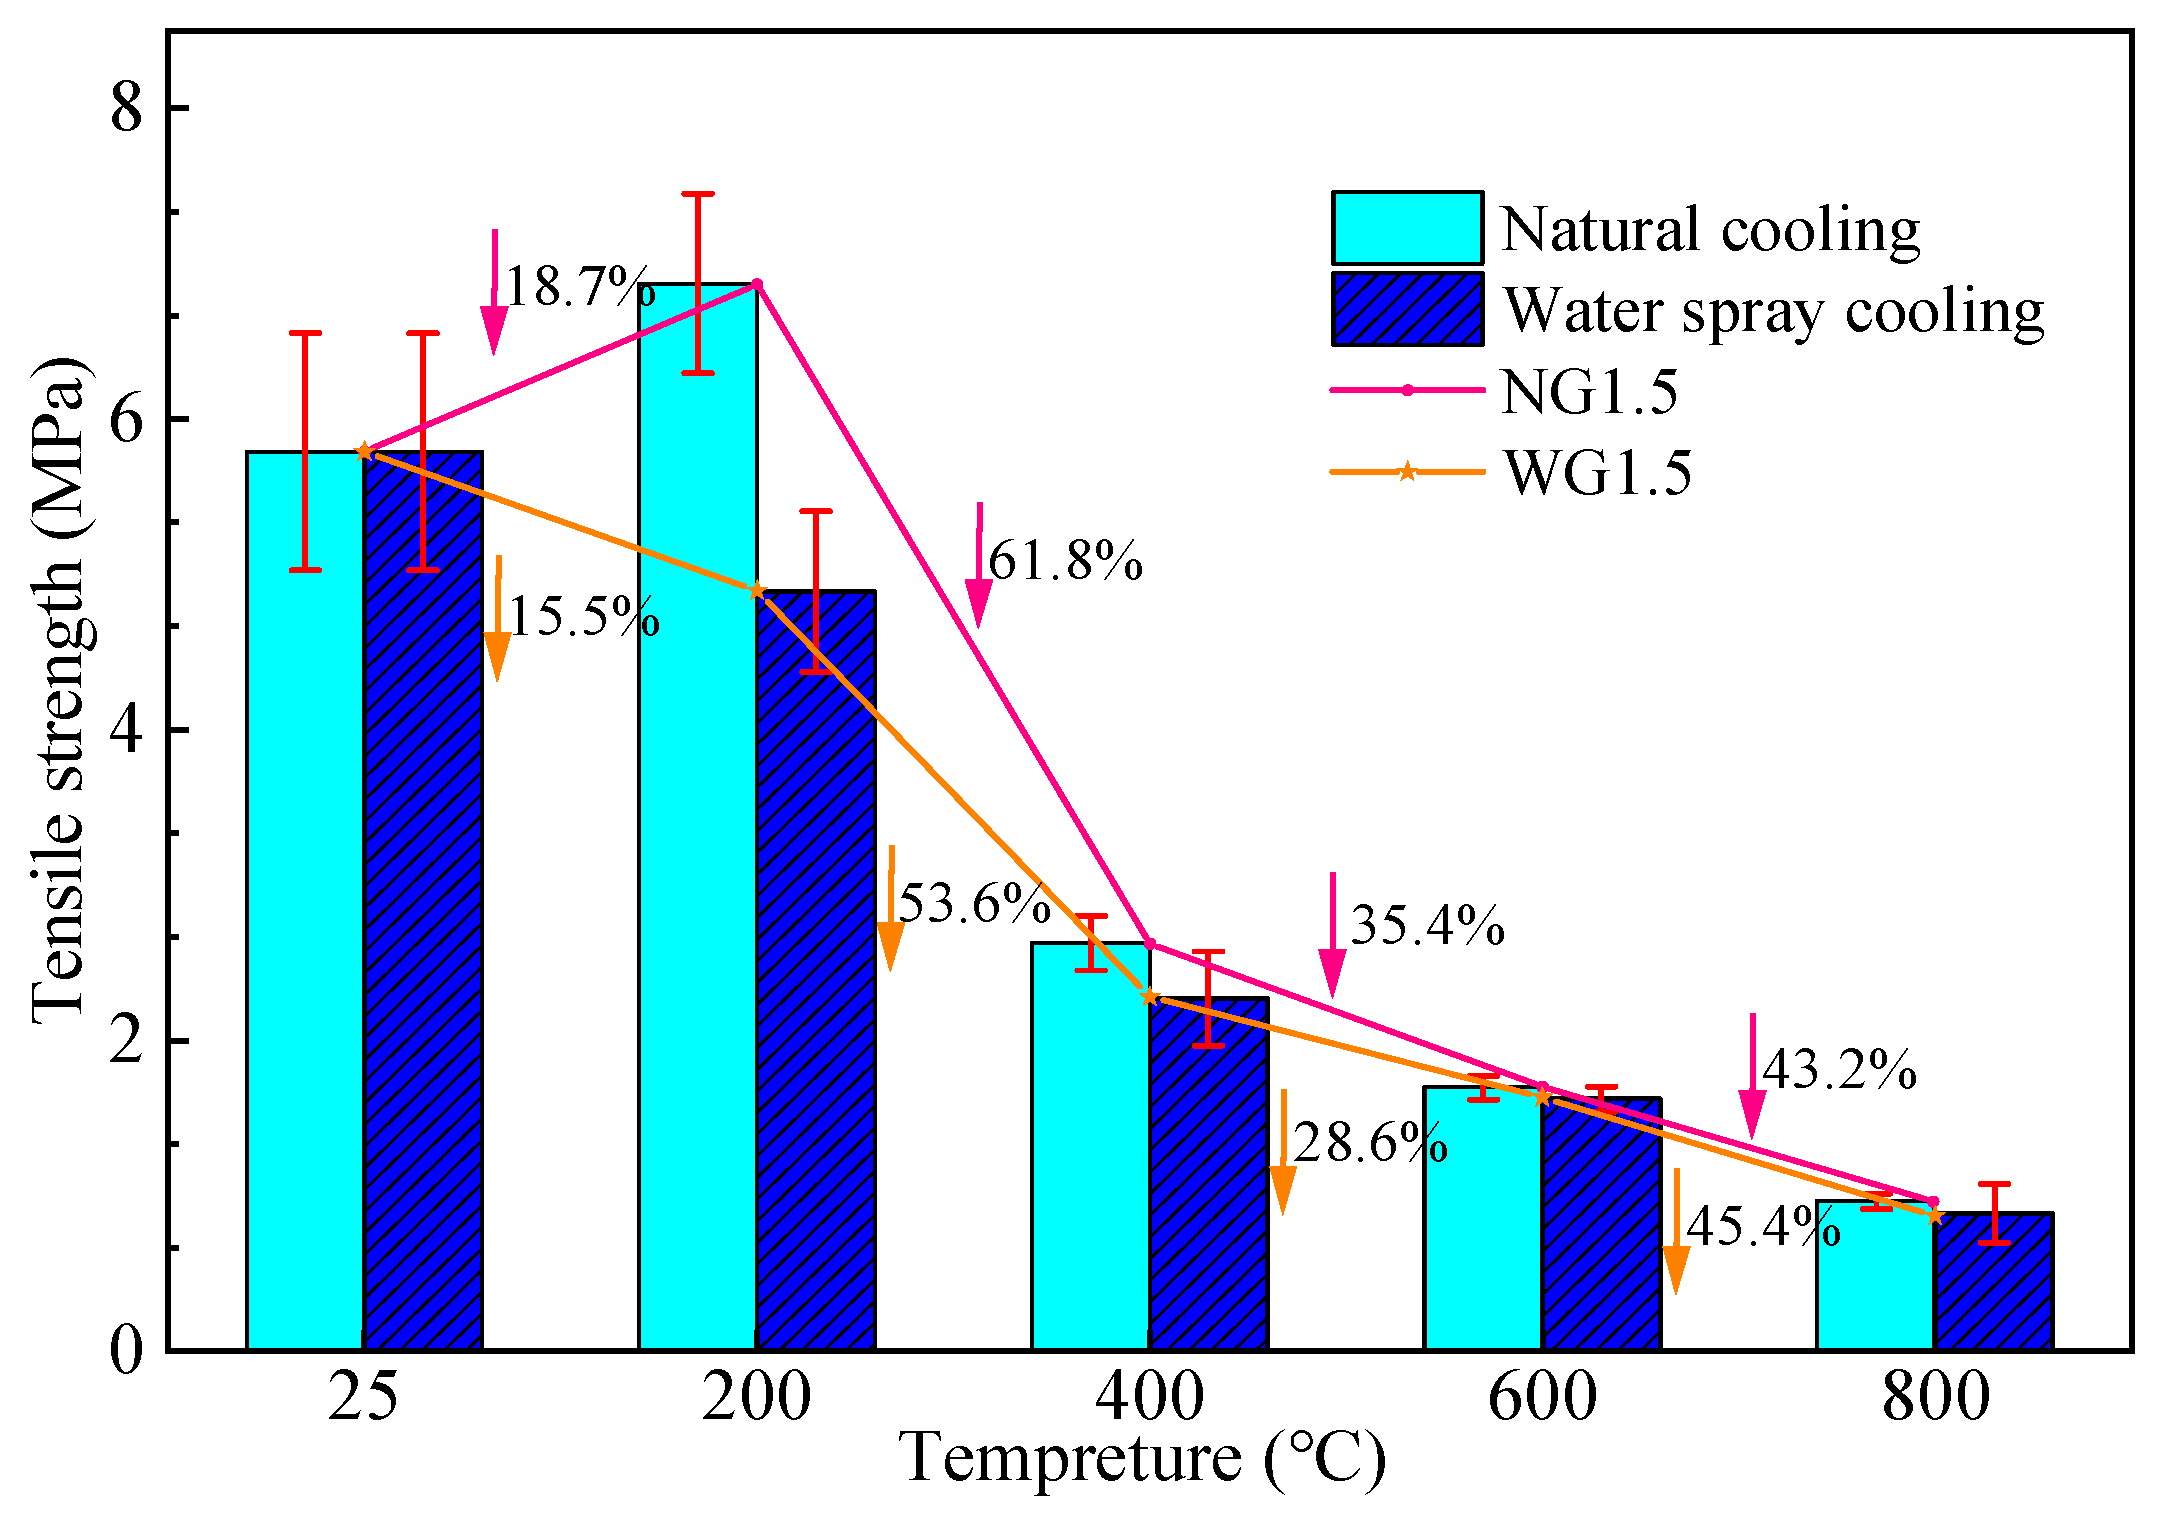
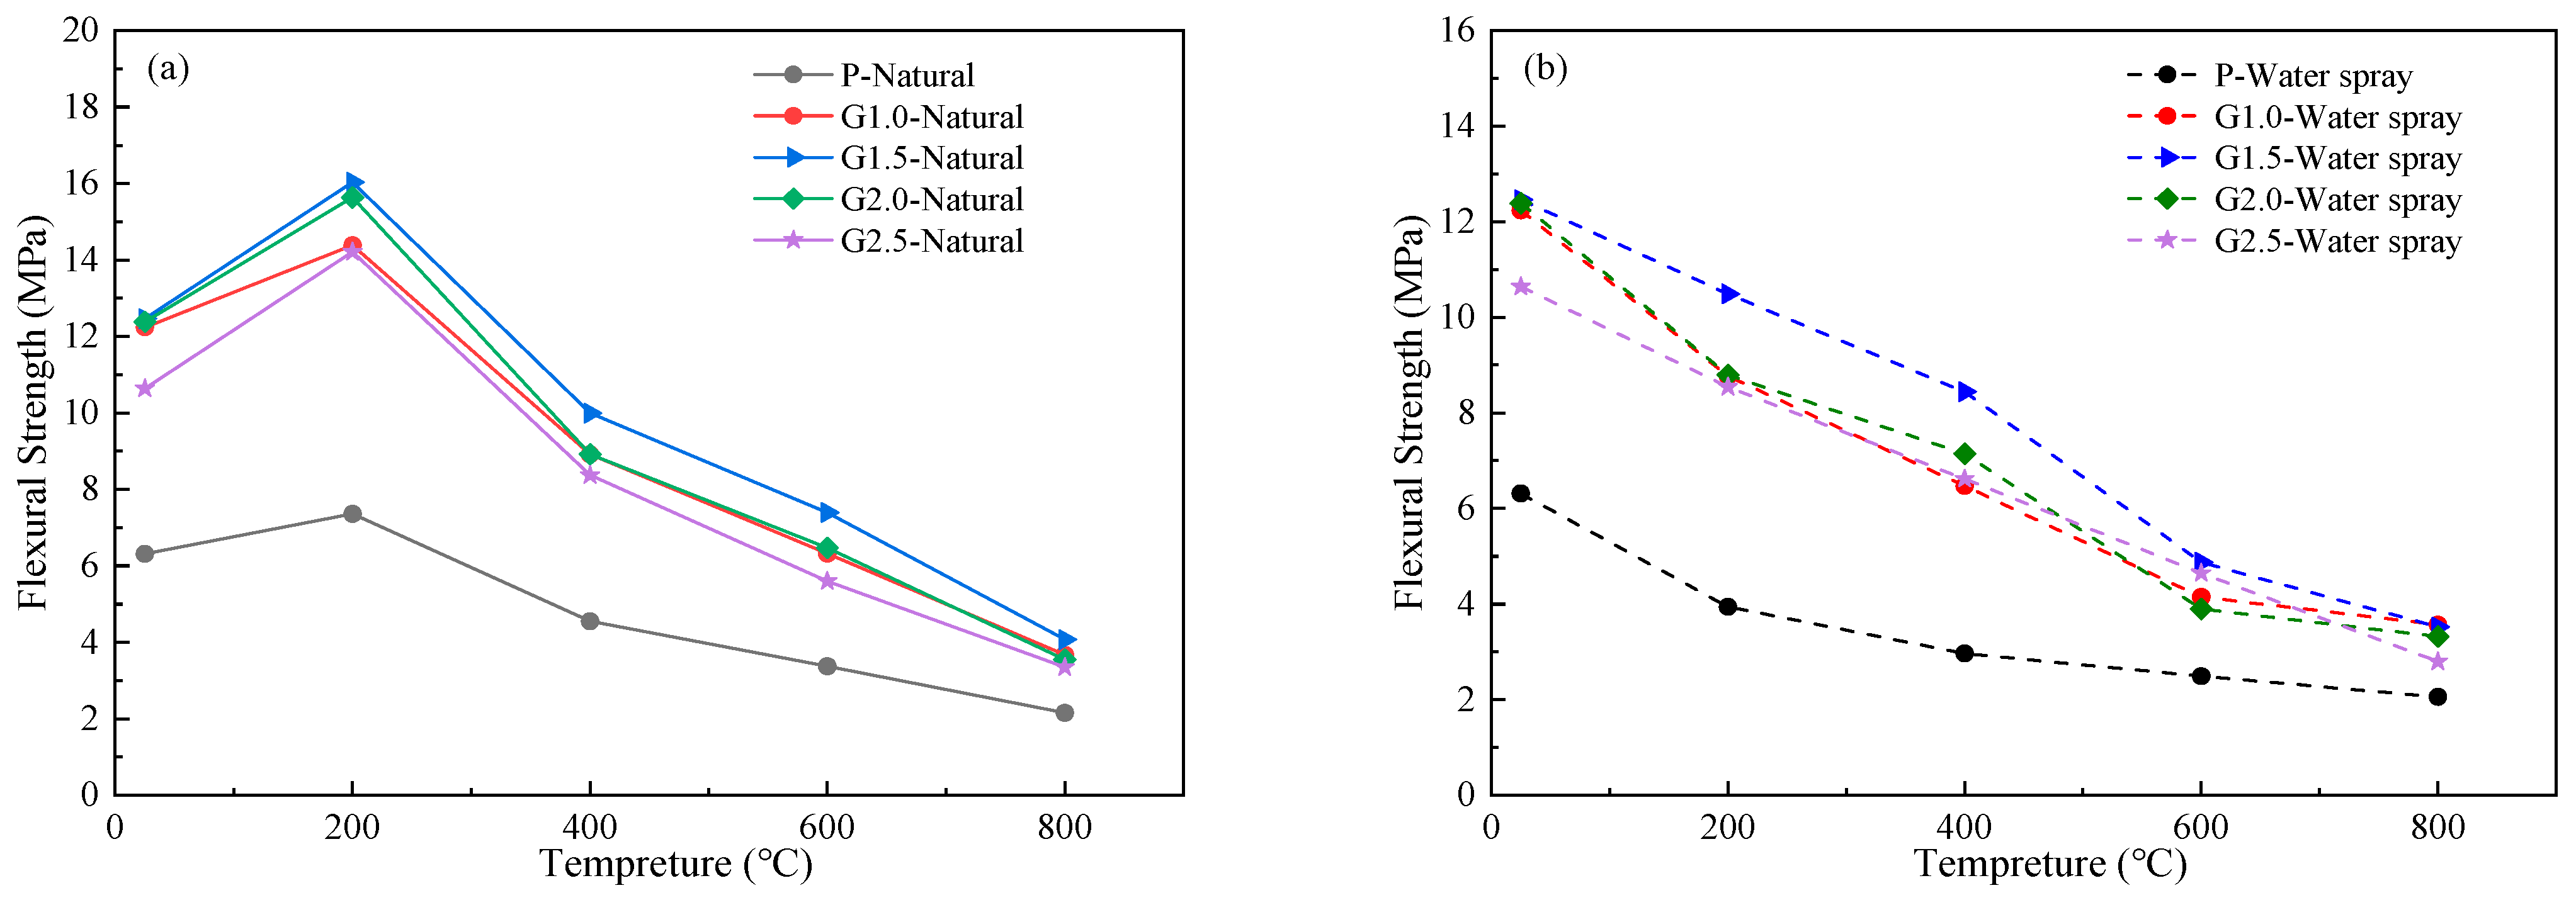
Figure 10 illustrates the evolutionary trend of the residual compressive strength of GHPC with respect to temperature under different cooling regimes. In conjunction with the analysis in
Table 4, it is evident that under natural cooling conditions, the strength of the GHPC specimens exhibited a non-monotonic evolutionary characteristic of an initial increase followed by a subsequent decrease, reaching a peak residual strength at 200 °C. Taking the NG1.5 group—which demonstrated the optimal compressive performance in the figure—as an example, its strength at 200 °C increased by 13.44% compared to the ambient temperature baseline. However, as the temperature further escalated to 400 °C, 600 °C, and 800 °C, the strength reduction rates reached 42.94%, 68.73%, and 79.40%, respectively. In stark contrast, the specimen strength under the water-spraying cooling regime exhibited a monotonically decreasing trend with rising temperature. For the corresponding WG1.5 group, the strength reduction rates at 200 °C, 400 °C, 600 °C, and 800 °C were 7.82%, 53.16%, 64.43%, and 74.08%, respectively.
Furthermore, a comparative analysis of the compressive strength values at identical temperatures reveals the existence of a significant strength inversion temperature threshold in the experiment. In the 25–400 °C regime, the residual strength of the naturally cooled specimens was generally superior to that of the water-spraying cooled group. Conversely, in the 600–800 °C regime, the water-spraying cooled group demonstrated a higher strength retention rate. Using the 1.5% volume fraction glass fiber-reinforced group as an example, at 200 °C and 400 °C, the strength of the water-spraying cooled group was only 81.26% and 82.09% of that of the naturally cooled group. Conversely, at 600 °C and 800 °C, the strength of the water-sprayed specimens surpassed that of their naturally cooled counterparts by 13.76% and 25.82%, respectively.
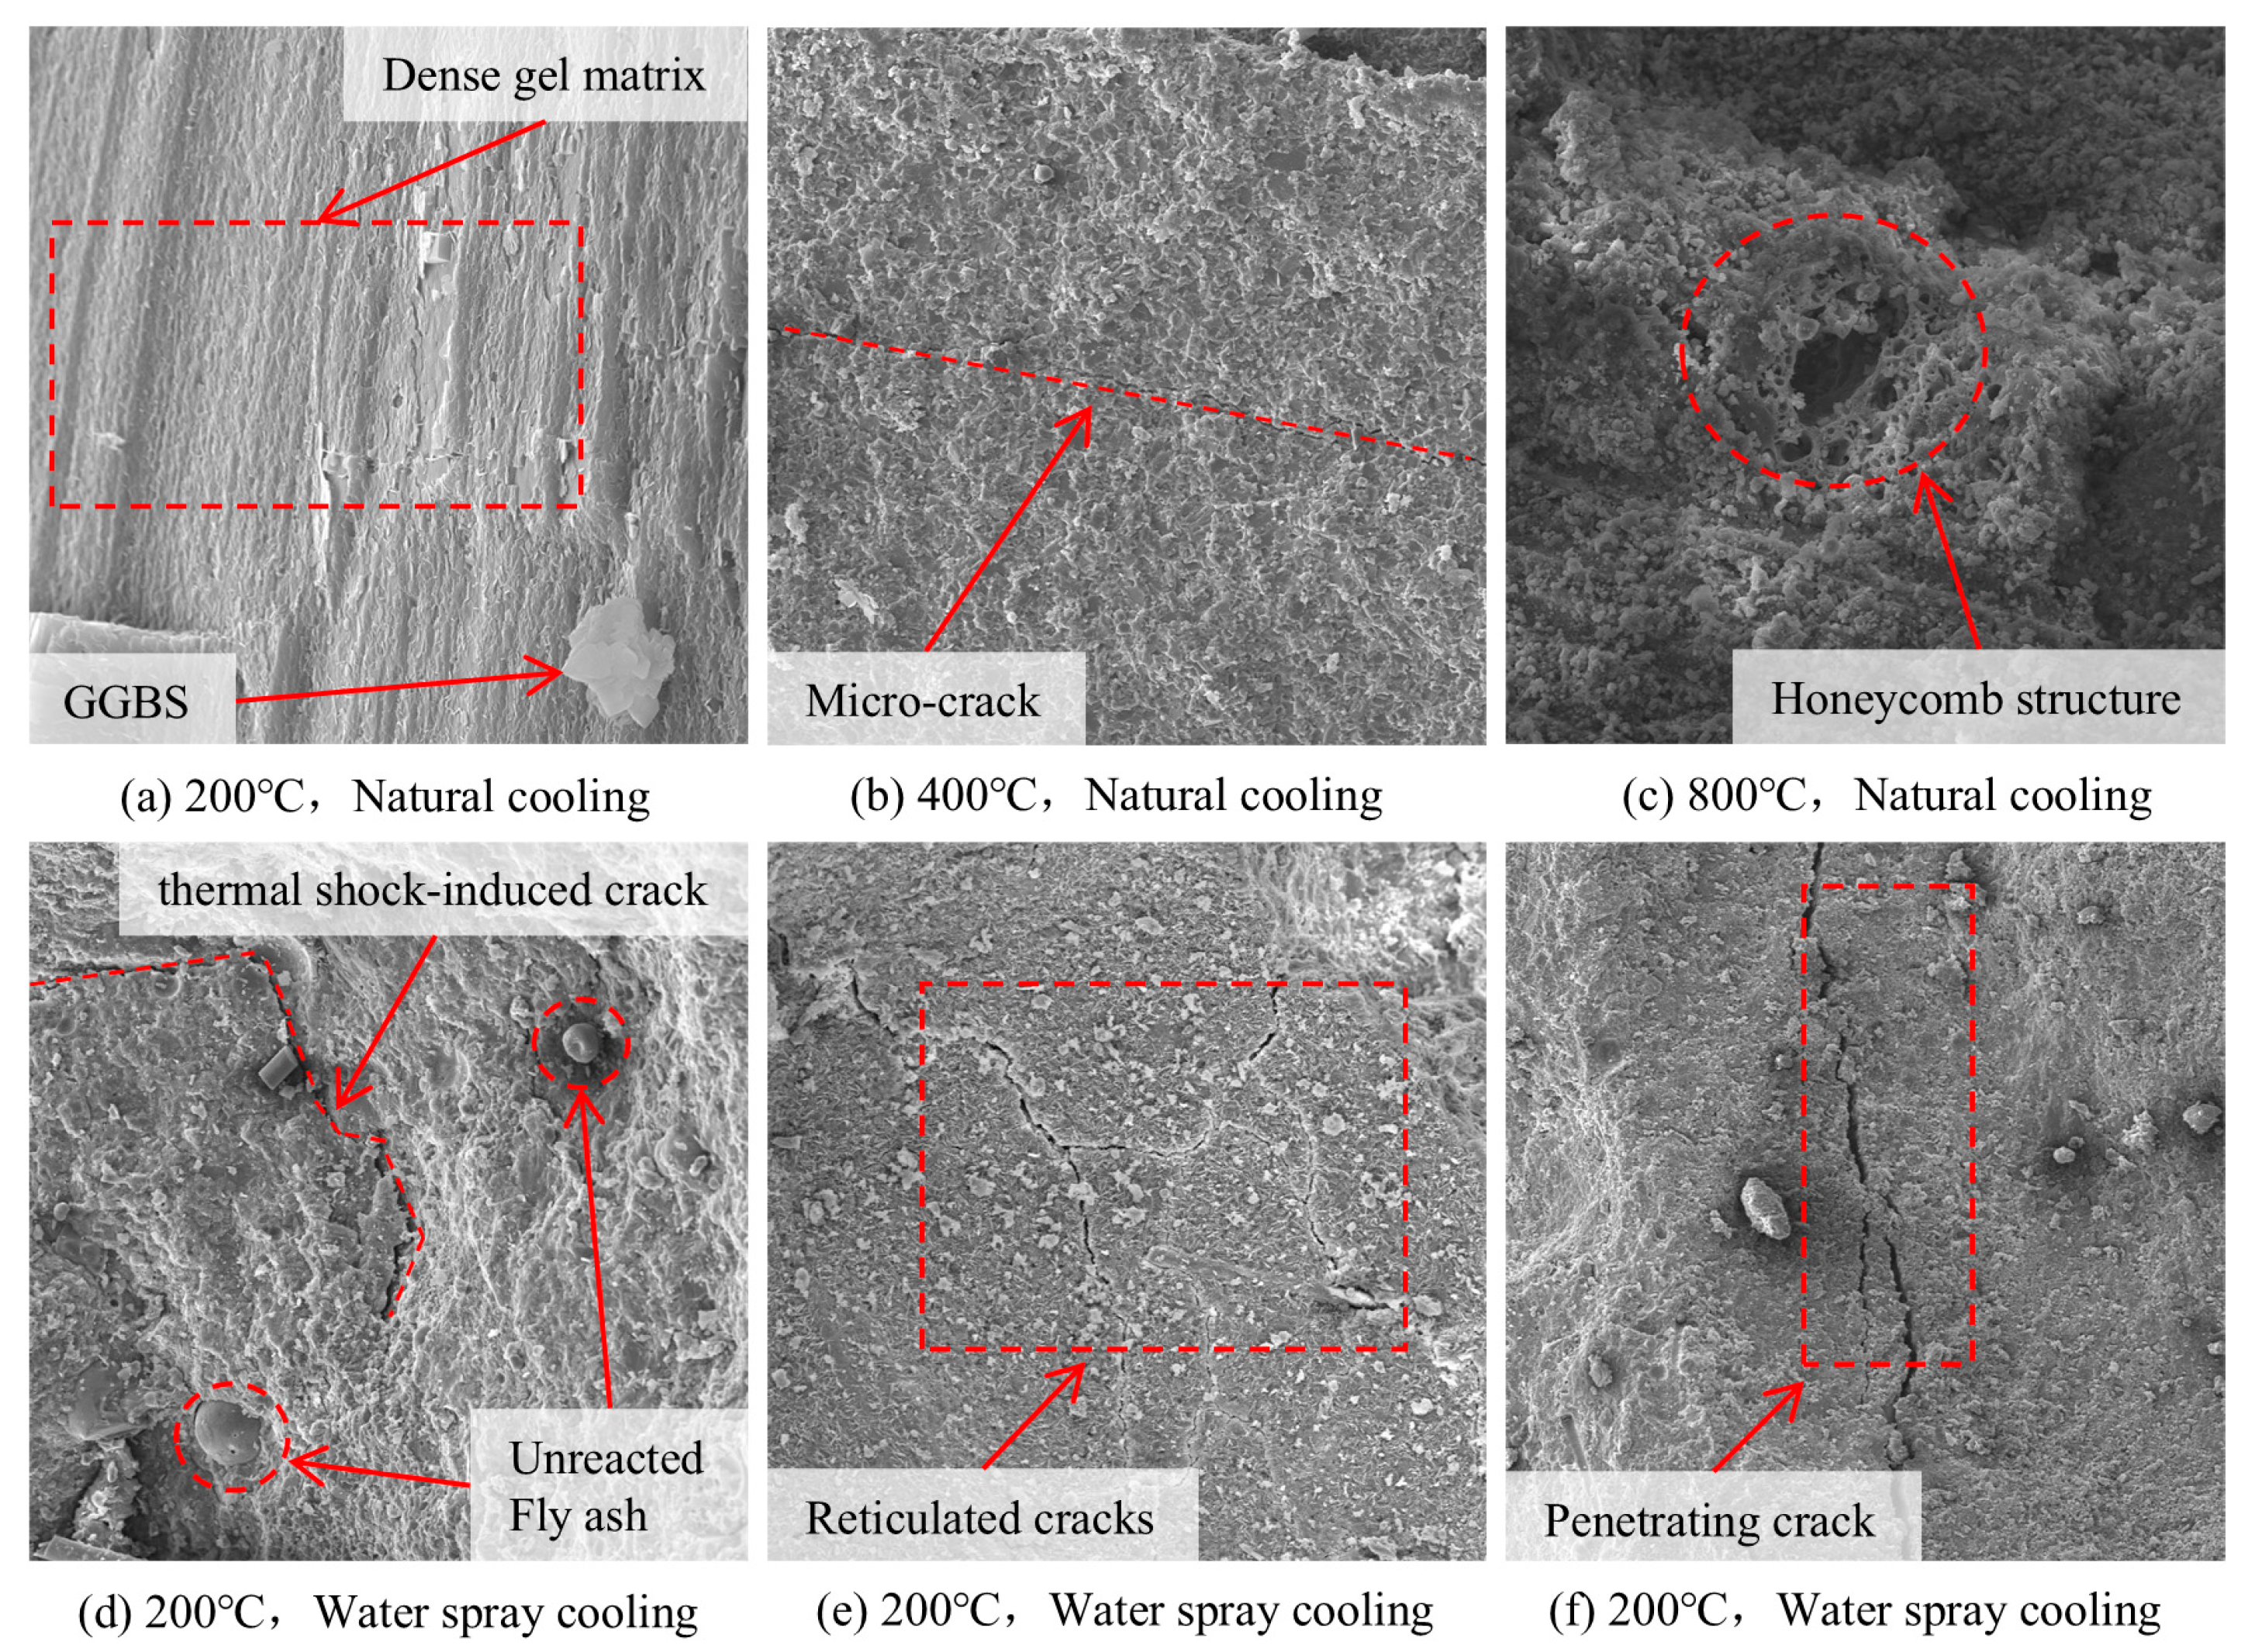
The underlying mechanisms for these phenomena can be analyzed as follows: At relatively low elevated temperatures (e.g., 200 °C), this moderate thermal condition provided activation energy for the abundant unreacted fly ash or GGBS particles from the ambient curing stage, prompting them to undergo secondary geopolymerization with the residual alkaline activator within the GHPC matrix. Simultaneously, the slow temperature decay of the natural cooling process allowed the internal stresses—induced by moisture evaporation and slight thermal expansion—to be fully released. The matrix densification gain brought by this thermal excitation outweighed the micro-pore defects caused by moisture loss; consequently, the residual compressive strength after natural cooling paradoxically exceeded that of the unheated room temperature (RT) specimens. Conversely, for the water-spraying cooled specimens, the sudden temperature drop from 200 °C to the ambient water temperature (approximately 20 °C) created a severe transient thermal gradient between the rapidly cooled surface layer and the high-temperature core. The resulting thermal stress was sufficient to exceed the tensile strength of the material in this temperature regime, tearing microcracks in the inner surface layer and the transition zone. This severe thermal shock effect overshadowed the strengthening effect of the secondary geopolymerization on the matrix, causing the strength to exhibit continuous deterioration from the low-temperature stage onwards.
However, under extreme high-temperature conditions (e.g., 600 °C and 800 °C), the naturally cooled specimens remained in the high-temperature zone for an extended period, subjecting the matrix to more prolonged dehydration shrinkage and thermal stress redistribution. Particularly around 573 °C, the phase transformation of quartz aggregates occurred, and the long-term accumulation of thermal mismatch strains led to irreversible and severe degradation of the microstructure in the interfacial transition zone (ITZ). Water-spraying cooling, by arresting the continuous accumulation of thermal damage, paradoxically preserved relatively superior structural integrity compared to slow natural cooling. Concurrently, at these extreme temperatures, a fraction of unreacted precursor particles (such as fly ash) still persisted. The influx of external moisture induced by water-spraying cooling facilitated the production of a minor amount of N-A-S-H gel, which filled the fine microcracks within the concrete. Nevertheless, this healing effect offered minimal mitigation against the massive penetrating cracks caused by the severe thermal damage at this stage. Therefore, the strength of the water-spraying cooled specimens only exhibited a modest inversion relative to the naturally cooled specimens, and compared to the previous temperature gradient, the magnitude of strength decline remained highly pronounced.
Generally, the coefficient of variation (COV)—calculated as the ratio of the standard deviation to the mean—can be employed to evaluate the dispersion of experimental data. As presented in
Table 4, the COV values for compressive strength are all below 10%, indicating a low level of dispersion and confirming the reliability of the experimental results. Furthermore, it is interesting to note that for GFGPC specimens with an identical glass fiber volume fraction, the COV of compressive strength generally exhibits an increasing trend with rising temperature.
The residual compressive strength (
fcu) of fiber-reinforced concrete following high-temperature exposure and cooling is the combined outcome of temperature-induced damage, fiber reinforcement effects, and the specific cooling regime. Based on the mechanics of composite materials and damage evolution theory, this study proposes that the residual strength can be characterized by the superposition of a matrix–fiber coupled strength term (
fcu(
T,
λf)) and a cooling method modification factor (
ξcool). Its generalized expression is formulated as follows:
To quantitatively evaluate the contribution of fiber geometric characteristics to the reinforcement effect, the fiber characteristic value (
λf) is introduced:
where
Vf represents the fiber volume fraction,
lf is the fiber length, and
df is the fiber diameter.
By integrating the architectural logic of the response surface methodology (RSM) with the physical evolution laws of material performance degradation, the following binary nonlinear prediction model is established to describe the coupled effects of elevated temperatures and fiber reinforcement on the strength of GHPC:
The physical connotations and mathematical constructs of each term in the model are detailed as follows: Temperature evolution term Φ(
T): Fitted using a modified Gaussian function, this term characterizes the non-monotonic evolutionary behavior of the matrix strength as a function of temperature. Fiber contribution term Ψ(
λf): Constructed as a quadratic polynomial, this term aims to reflect the nonlinear mapping relationship between the fiber dosage and the matrix strength [
45]. It effectively captures the strength reduction effect caused by fiber agglomeration at high dosages. Coupling correction term Ω(
T, λf): Utilized to represent the compensatory effect of fibers in arresting thermal crack propagation under high-temperature fields. This term reflects that a higher fiber content decreases the material’s sensitivity to high-temperature thermal damage; that is, the strength reduction rate decelerates with an increase in
λf.
where
Topt is the temperature corresponding to the maximum compressive strength, which is 200 °C in this experiment; and
a,
b,
c,
d,
e,
γ are empirical fitting parameters.
The modification factor ξcool is employed to quantify the additional damage or gain induced by different cooling rates. For the natural cooling regime, a standard reference value of ξcool = 1.0 is defined. For the water-spraying cooling regime, considering the initial damage caused by the transient thermal shock, the value of this modification factor typically ranges from 0.75 to 0.85.
Step compensation mechanism: Given the rehydration effect induced by water cooling at temperatures above 600 °C, a step compensation term Δ
η based on the mass gain rate is introduced into the model:
where
mab is the mass gain of the specimen after water spraying, and
min is the initial mass of the specimen.
Synthesizing the aforementioned components, the comprehensive fitting equation for the high-temperature compressive strength of GHPC under varying cooling regimes is obtained as follows:
Based on the experimentally measured data, a nonlinear regression analysis was performed on the above formula. The results demonstrate that the correlation coefficient (R2) for the fitted model of this fiber-reinforced GHPC exceeds 0.90, indicating a high degree of statistical reliability.
By substituting the parameters from
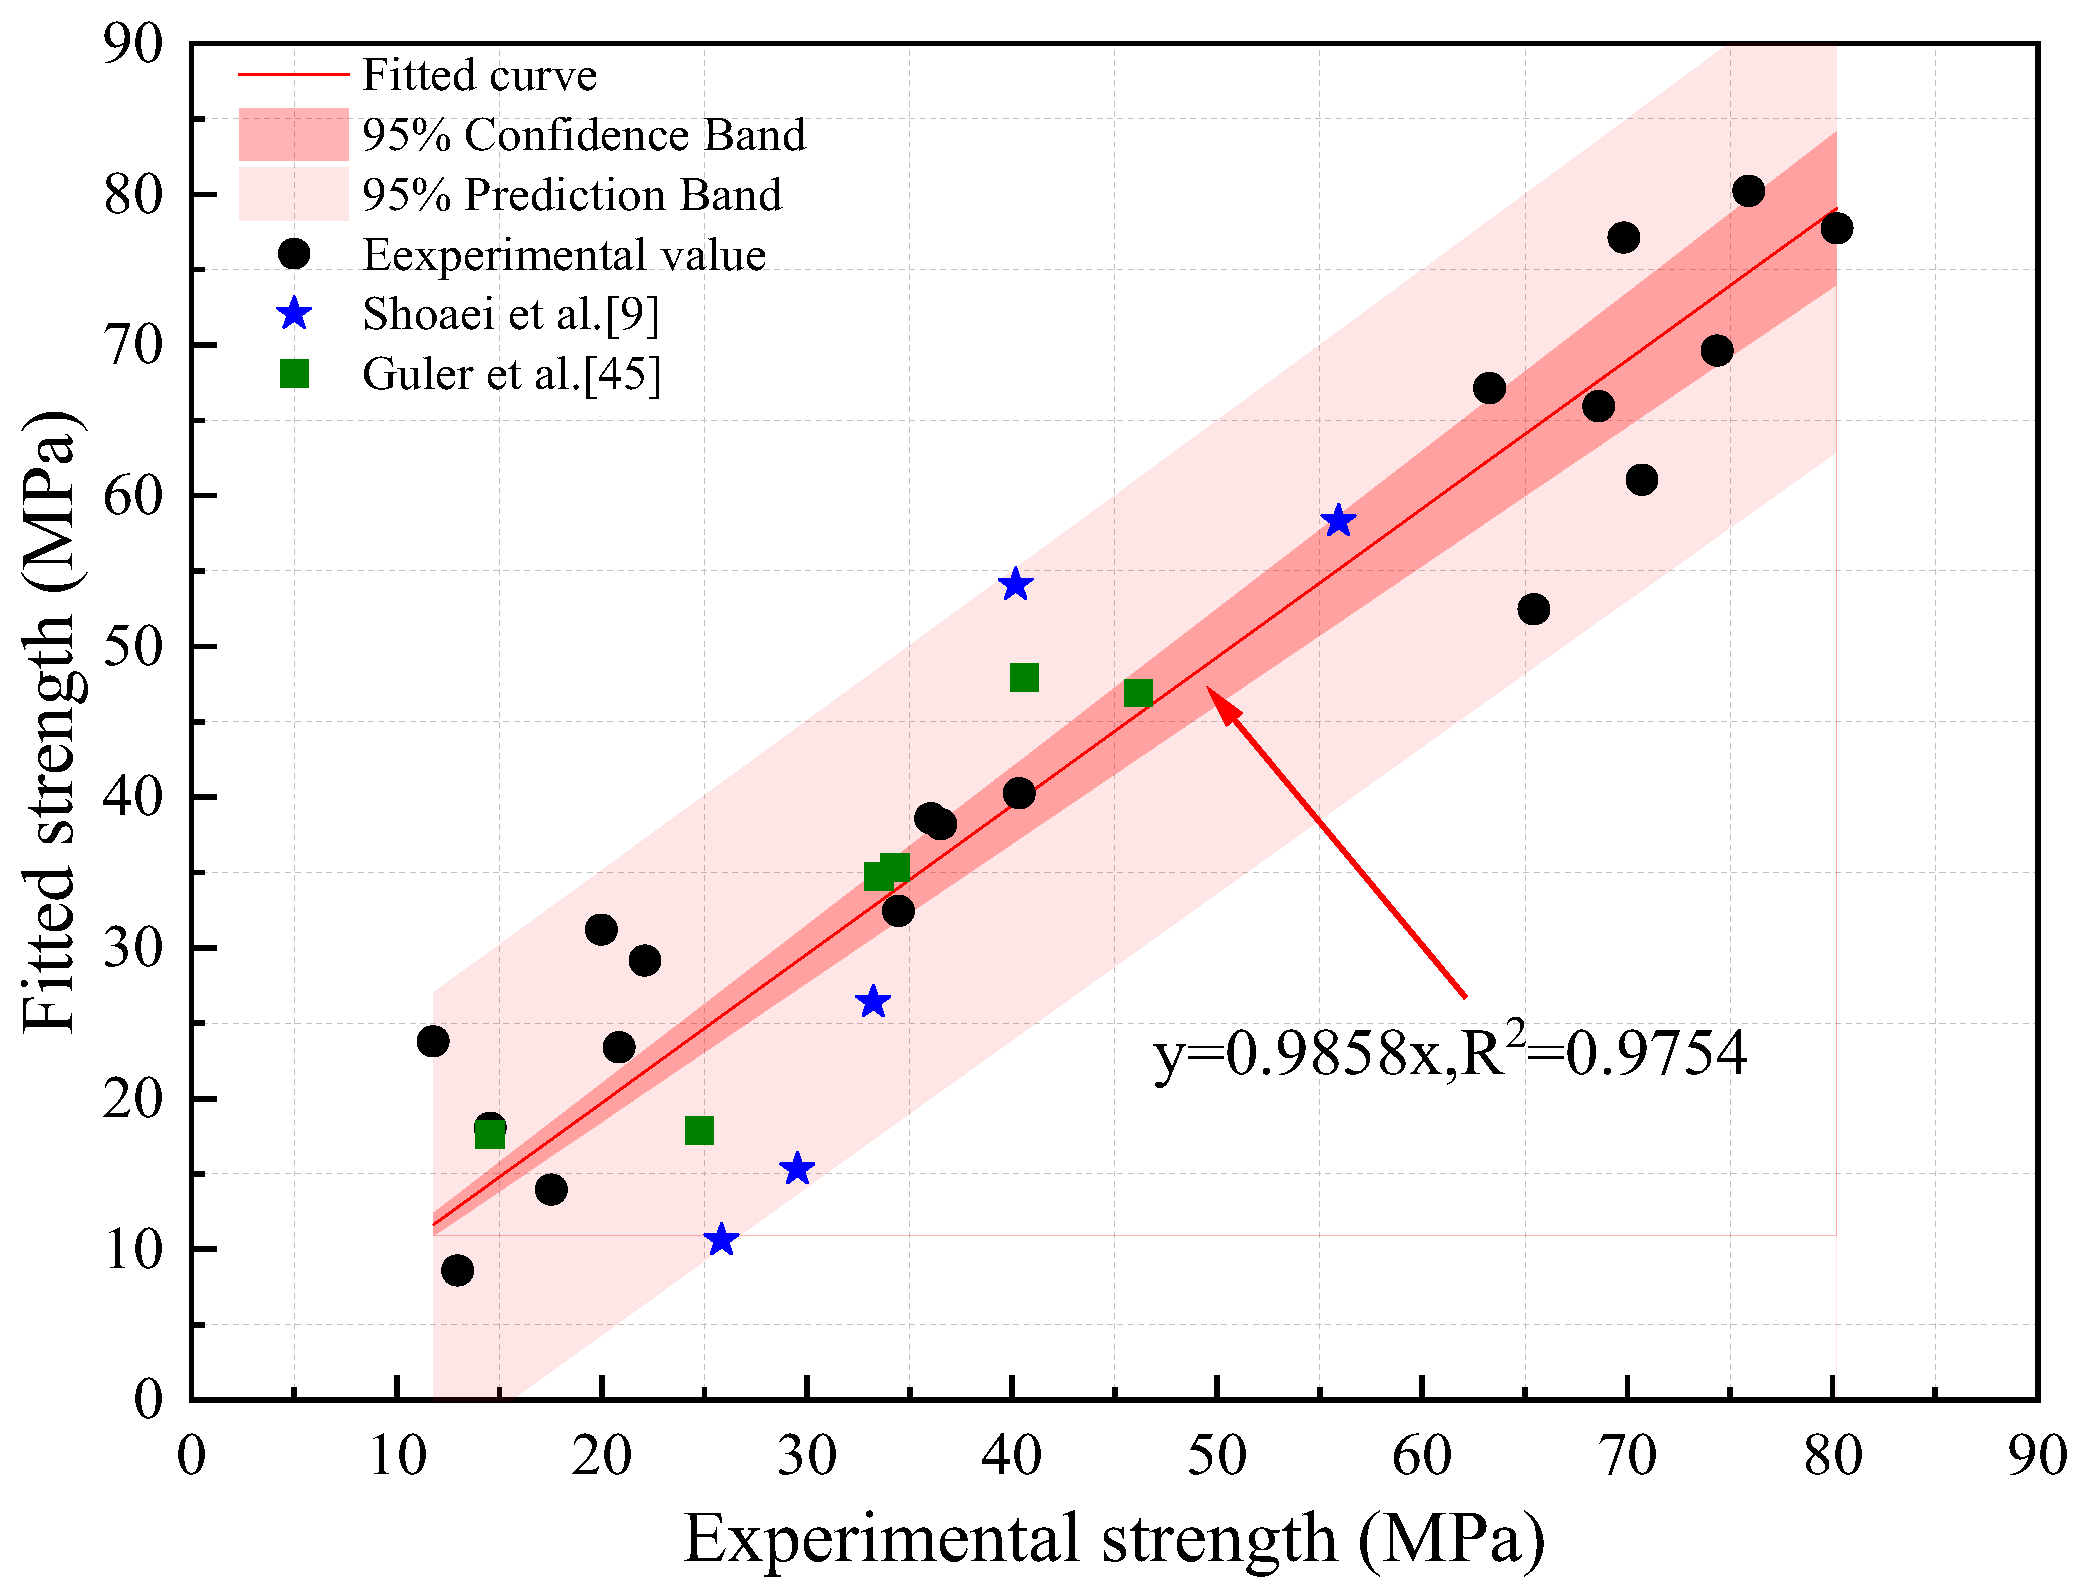
Table 5 into the proposed equations, the predicted compressive strength values of GHPC under various fiber characteristic values and elevated temperatures were calculated. Subsequently, by plotting the experimentally measured strength values on the
x-axis against the corresponding model-predicted strength values on the y-axis, and incorporating additional experimental data compiled from previous studies by other researchers [
9,
46], the correlation plot depicted in
Figure 11 was generated.
An analysis of the correlation plot between the predicted and experimental compressive strengths (
Figure 11) reveals that the data points are uniformly distributed along the line of equality (y = x). Furthermore, the correlation coefficient reaches 0.9754, robustly demonstrating that the proposed model can accurately predict the residual mechanical properties of GHPC across various fiber characteristic values and temperature gradients.
3.3.2. Compressive Energy Absorption
The energy absorbed during compressive failure is typically characterized by the integral area under the load–displacement curve. This metric inherently reflects the deformation capacity and the level of energy dissipation of the material prior to ultimate failure. Its value can be calculated using the following integral expression:
where
Wc is the energy absorbed up to peak failure (J);
P is the applied compressive load; and
δc is the corresponding displacement at peak failure.
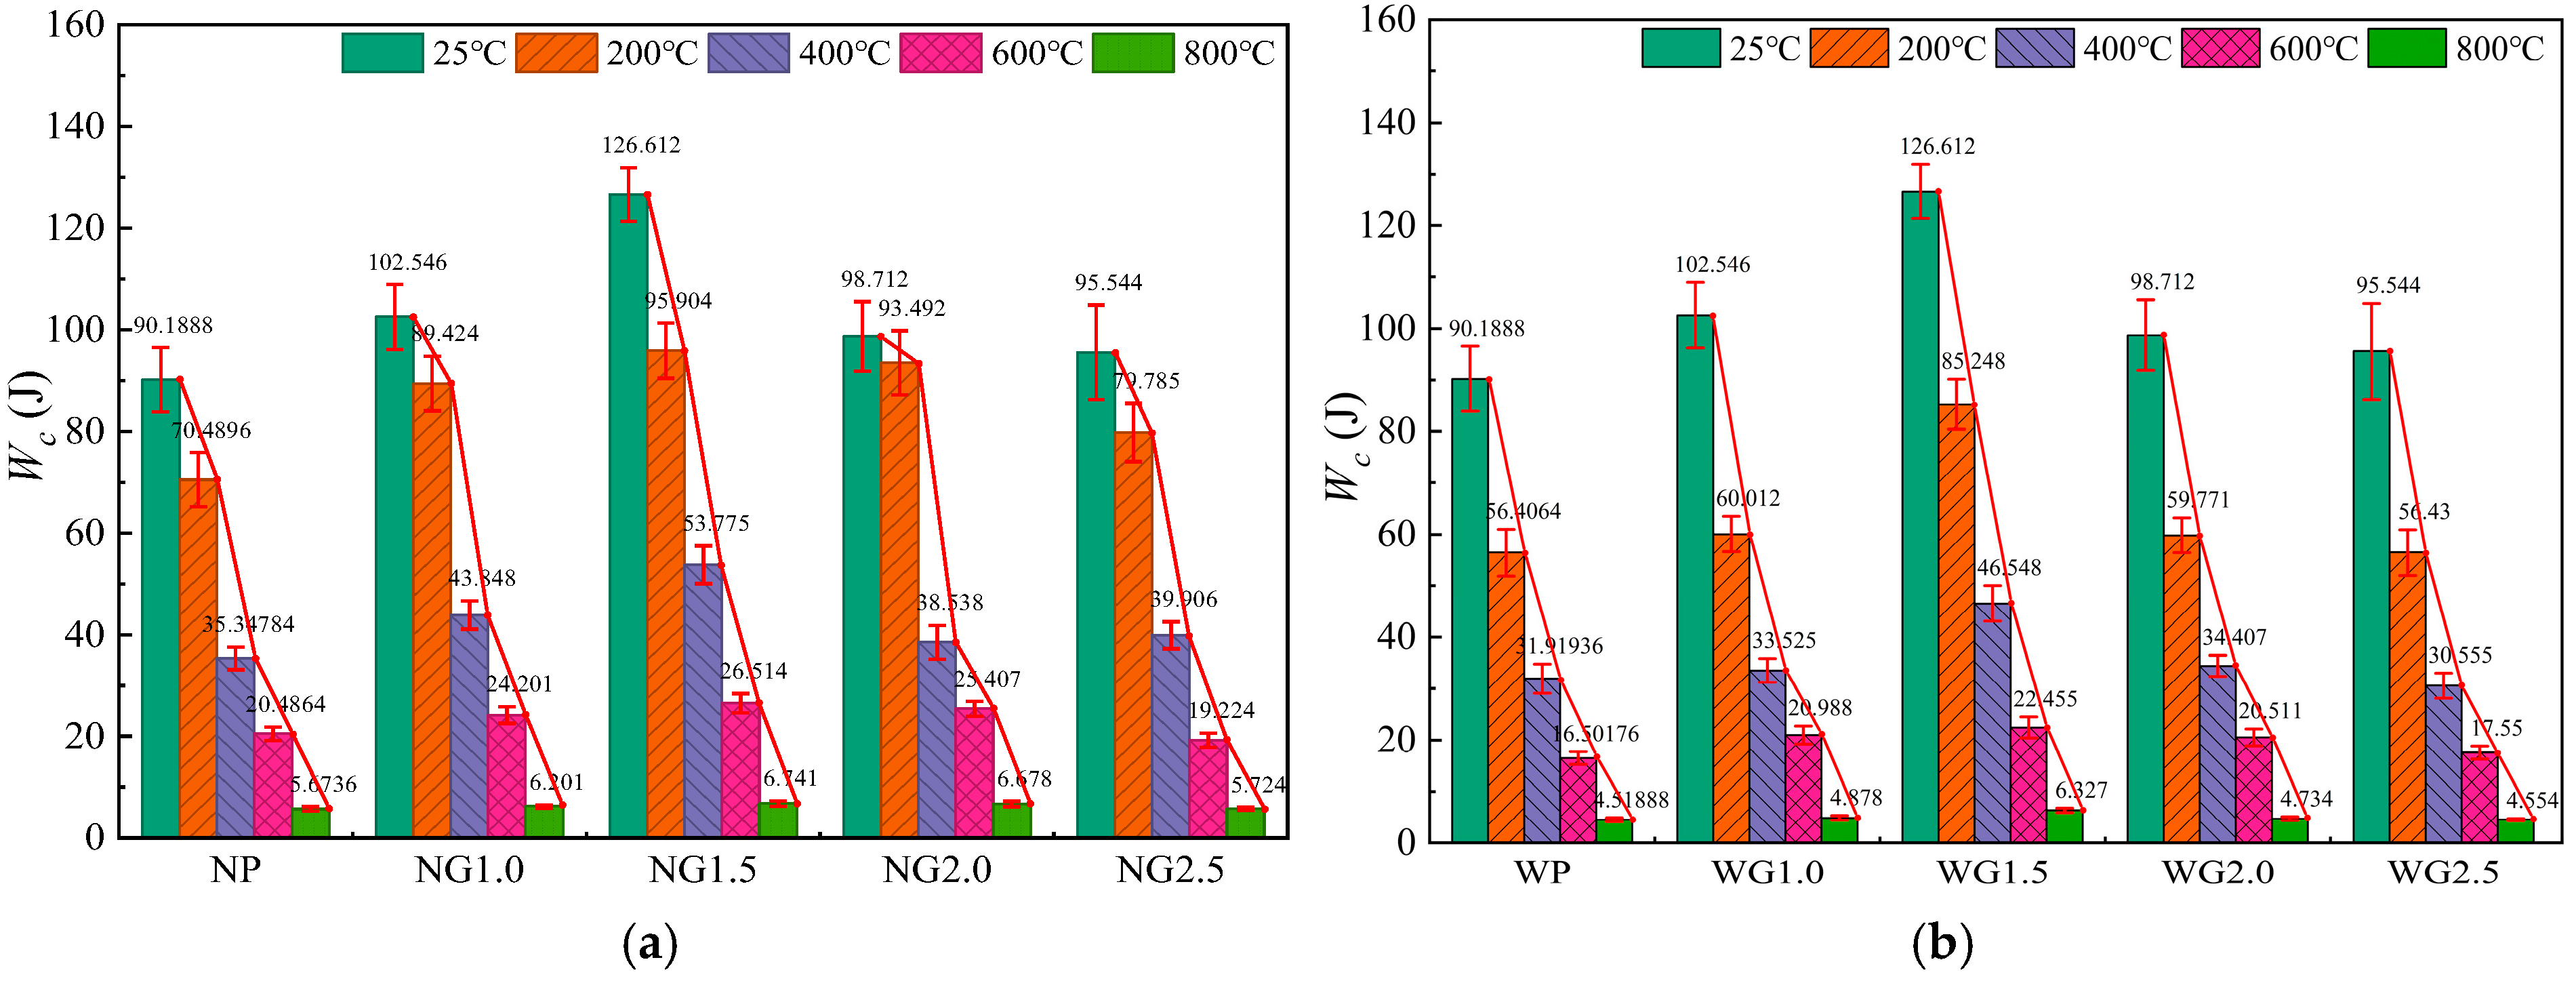
The specific calculated values of the compressive energy absorption for the specimens, along with the comparative analysis plot, are presented in
Table 6 and
Figure 12, respectively.
Figure 12 reveals the evolutionary laws of the energy dissipation capacity of GHPC during compressive failure under different cooling regimes. The experimental results indicate that, unlike the non-monotonic evolutionary characteristic of compressive strength, the energy absorbed (
Wc) by the specimens during the compressive failure process exhibits a monotonically decreasing trend with increasing exposure temperature, regardless of whether natural cooling or water-spraying cooling was applied. Taking the NG1.5 group as an example, its residual energy dissipation values after exposure to elevated temperatures of 200 °C, 400 °C, 600 °C, and 800 °C were only 75.75%, 42.47%, 20.94%, and 5.32% of the ambient temperature baseline, respectively. The corresponding water-spraying cooled group (WG2.0) exhibited a more pronounced attenuation, with corresponding proportions of 67.33%, 35.76%, 17.74%, and 5.00%, respectively.
Across the entire temperature range and all fiber volume fractions, the energy absorption level of the water-spraying cooled specimens remained consistently lower than that of the naturally cooled group. Particularly at 200 °C, the difference in energy dissipation between the two regimes was remarkably significant: the maximum discrepancy occurred in the G2.0 group, where the energy dissipation of the naturally cooled specimens was 61.83% higher than that of the water-spraying cooled counterparts. In conjunction with the load–displacement curves presented in
Figure 9, it is evident that the severe thermal shock effect induced by water-spraying cooling not only reduced the peak failure load of the concrete but also advanced its displacement at failure, thereby resulting in a substantial reduction in overall energy dissipation.