Article

Research on the Influencing Factors of Carbon Emissions in the Construction Industry of Hunan Province and Peak Prediction
1
School of Civil Engineering, Hunan University, Changsha 410082, China
2
Key Laboratory of Building Safety and Energy Efficiency of the Ministry of Education, Hunan University, Changsha 410082, China
*
Author to whom correspondence should be addressed.
Buildings 2026, 16(9), 1816; https://doi.org/10.3390/buildings16091816
Submission received: 4 April 2026 / Revised: 27 April 2026 / Accepted: 27 April 2026 / Published: 2 May 2026
(This article belongs to the Section Building Energy, Physics, Environment, and Systems)

Abstract

In accordance with the national strategy of “carbon peaking by 2030 and carbon neutrality by 2060” and Hunan Province’s target of achieving carbon peaking in the construction sector by 2030, this study uses carbon emission data from Hunan’s construction sector for the period 2005–2022 as a research sample to conduct research on carbon emission accounting, analysis of influencing factors, and peak prediction. The carbon emission coefficient method was employed to calculate industry-wide carbon emissions. Using the STIRPAT model combined with ridge regression, we identified and quantified the driving factors of carbon emissions. A CNN-LSTM-Attention hybrid deep learning model was constructed, and three development scenarios—high-carbon, baseline, and low-carbon—were established to simulate the evolution of carbon emissions in Hunan’s construction industry from 2023 to 2040. The results indicate that carbon emissions from Hunan’s construction industry showed an overall upward trend during the study period, with indirect emissions constituting the primary component. Through variable optimization, the core positive drivers and negative restraints of carbon emissions in the construction industry were identified. The constructed hybrid model demonstrated excellent fitting performance, with prediction accuracy significantly higher than that of traditional machine learning and single deep learning models. Carbon emission trends varied significantly across different development scenarios, with the low-carbon development scenario identified as the optimal path for achieving the industry’s carbon peak target. These findings provide a theoretical basis and data support for the low-carbon transition of Hunan Province’s construction sector, as well as for the formulation and optimization of carbon peaking implementation plans.

1. Introduction

According to the latest AR6 research report released by the Intergovernmental Panel on Climate Change (IPCC), the global surface temperature has increased by more than 1.1 °C compared with the pre-industrial revolution level [1]. Global warming caused by excessive emissions of greenhouse gases dominated by carbon dioxide has become a major non-traditional security threat to the sustainable development of human beings. Under the national strategic framework of “carbon peak by 2030 and carbon neutrality by 2060”, the construction industry, as one of the three key carbon emission sectors in China, its low-carbon transformation has become a core link to achieve the dual carbon goals [1]. As a major construction province in central China, Hunan Province saw its total construction output value account for 29% of the provincial GDP in 2022, with the industry’s carbon emissions accounting for 35% of the province’s industrial emissions, among them, carbon emissions from cement clinker production accounted for 70% of the total emissions of the building materials industry, and energy consumption is dominated by coal, forming an industrial characteristic of “high energy consumption and high emissions” [2,3]. The Implementation Plan for Carbon Peak in Urban and Rural Construction of Hunan Province issued in 2023 [4] clearly requires the construction industry to achieve carbon peak before 2030. This is not only an inevitable requirement for implementing the national strategy, but also an urgent task for promoting the “Three Highs and Four News” strategy and realizing the green industrial upgrading of Hunan Province.
In the field of research on carbon emissions in the construction industry, Tong et al. [5] (2022) selected 280 prefecture-level and above cities in China as research samples, divided them into two groups of growing cities and two groups of shrinking cities, and conducted an empirical test on the core influencing factors of carbon emissions in different types of cities with the aid of the extended STIRPAT model. Yu et al. [6] (2022) comprehensively adopted the structural decomposition model, input–output analysis method and energy consumption accounting method to conduct an in-depth study on the structural driving factors of carbon emissions from energy consumption in China’s service industry from 2007 to 2017, providing solid theoretical support and practical guidance for formulating more accurate and efficient emission reduction strategies for the service industry from the input–output perspective. Fan et al. [7] (2019) applied the input–output-based structural decomposition analysis (IO-SDA) method to decompose the changes in carbon dioxide emissions in the Beijing–Tianjin–Hebei region from 1997 to 2012 into five driving factors: population size, carbon emission efficiency, production structure, final use structure and regional per capita GDP. The results show that population size and regional per capita GDP exert positive driving effects on carbon emissions in all regions within the area, while the improvement of carbon emission efficiency is the core factor inhibiting the growth of carbon emissions. In 2008, Zagheni et al. [8] introduced stochastic process theory into the IPAT model framework for the first time, established a dynamic coupling model of population, economy and carbon emissions based on Brownian motion, and constructed a stochastic dynamic correlation system between national carbon emissions and driving factors with the United States as an example, laying a foundation for subsequent research on multi-factor influencing factors of carbon emissions.
Although research on carbon emissions in the construction industry is gradually improving, three key shortcomings remain. First, regarding the identification of influencing factors, existing studies largely rely on generic indicator systems and fail to fully account for the specific industrial characteristics and developmental stages of regional construction sectors, resulting in insufficiently targeted analyses of the underlying mechanisms; Second, regarding regional studies, existing research primarily focuses on the national level and developed provinces along the eastern coast, with a relative lack of differentiated studies on major construction provinces in central China. As a core province in the central region’s construction sector, Hunan Province is characterized by a large industrial scale, high-carbon emission intensity, and a tight timeline for reaching peak emissions. In 2022, the construction sector’s total output value accounted for 29% of the province’s GDP, and the sector’s carbon emissions accounted for 35% of the province’s industrial emissions. Furthermore, the province has explicitly mandated that the construction sector achieve carbon peaking by 2030. Consequently, the carbon emission drivers and peaking pathways for this sector cannot be directly extrapolated from existing research findings, making targeted, independent case studies urgently needed; Third, regarding forecasting methods, most studies still rely on traditional statistical regression models, which have weak error tolerance and limited capacity for nonlinear fitting. Even when some studies incorporate neural network algorithms, they primarily use single models, failing to simultaneously address feature extraction of multidimensional influencing factors and capture the long-term dependencies in time-series data. Given the small sample size, multivariate nature, and nonlinear characteristics of time-series data in the construction sector’s carbon emissions, there is a lack of more adaptable combined forecasting models.
Against this backdrop, this paper selects panel data on carbon emissions in the construction industry in Hunan Province from 2005 to 2022 as the research sample. First, the carbon emission coefficient method is employed to systematically calculate the total volume and structural characteristics of the industry’s carbon emissions, quantitatively describing their dynamic evolution; second, based on the IPAT model framework, we construct an indicator system of influencing factors across four dimensions—population, economy, technology, and industry—and combine the STIRPAT model with ridge regression to correct multicollinearity bias, thereby accurately identifying the core drivers and their influence strengths of carbon emissions in Hunan’s construction industry; Finally, based on the results of the driver analysis and incorporating Hunan Province’s local policies and industry development plans, we established differentiated development scenarios. We constructed a CNN-LSTM-Attention hybrid deep learning model to conduct multi-scenario simulations and peak emission forecasts for the period 2023–2040, thereby providing quantitative support and decision-making references for planning carbon peak pathways and formulating low-carbon transition policies for Hunan’s construction industry.
This paper focuses on three core research questions for systematic exploration:
First, how to construct an indicator system of influencing factors for carbon emissions tailored to the characteristics of Hunan’s construction industry, accurately identify its core drivers and mechanisms, and address the lack of specificity in existing regional studies?
Second, how to integrate the advantages of multi-module deep learning algorithms to build a hybrid predictive model suited to the small-sample, multivariate, and nonlinear time-series data characteristics of construction carbon emissions, thereby overcoming the accuracy limitations of existing single-model approaches?
Third, how can we establish scientifically sound differentiated development scenarios based on Hunan Province’s carbon peaking policy requirements, clarify the evolution trends, timing, and peak levels of carbon emissions under different scenarios, and propose an optimal path to carbon peaking that aligns with local development realities?
The academic contributions of this paper are primarily reflected in three aspects:
First, in terms of research perspective, the study focuses on Hunan Province—a major construction province in central China—to conduct a targeted case study. It clarifies the structural characteristics and core driving mechanisms of regional construction sector carbon emissions, filling a gap in existing research on differentiated studies of construction sector carbon emissions in central provinces and providing a paradigm reference for low-carbon transition research in similar regions.
Second, in terms of methodological innovation, a combined CNN-LSTM-Attention prediction model was constructed. The CNN module extracts nonlinear features from multidimensional influencing factors, while the LSTM module captures long-term dependencies in carbon emission time-series data; meanwhile, the Attention module adaptively focuses on the weight contributions of core driving factors. The synergy of these three components significantly improves the prediction accuracy of small-sample, multivariate time-series data, providing a more adaptable methodological framework for regional construction sector carbon emission forecasting.
Third, regarding practical application, three differentiated scenarios—high-carbon, baseline, and low-carbon—were established based on Hunan Province’s local policies and industry development plans. This study clarified the feasibility of reaching peak emissions, the timing of peak emissions, and peak levels under different scenarios, and quantitatively verified the emission reduction benefits of the low-carbon development scenario, thereby providing precise quantitative evidence and actionable guidance for the implementation of Hunan Province’s carbon peak plan for the construction industry.

2. Materials and Methods

2.1. Carbon Emission Accounting Method

The carbon emission factor method quantifies and converts greenhouse gases from energy use and material transformation using standardized emission parameters issued by authoritative authorities [9]. This method directly adopts the emission conversion coefficients approved by the IPCC or government agencies, avoiding complex modeling, and has the characteristics of simple operation and strong comparability of results [10]. It is suitable for rapid and batch assessment of total carbon emissions in regions or industries. In the accounting of building carbon emissions, the internationally accepted IPCC standard adopts an ideal model with 100% carbon oxidation rate [11], which is inconsistent with China’s actual energy use efficiency. Based on the national conditions difference, this study adopts the carbon oxidation rate parameters from the Guidelines for the Preparation of Provincial Greenhouse Gas Inventories to improve the calculation accuracy [12].
The total greenhouse gas emissions from the construction sector are the sum of direct emissions and indirect emissions. Classified accounting can fully reflect the life cycle environmental impact of buildings:
C total = C direct + C indirect = ( i = 1 9 EC i × ACV i × C i × COR i × 44 / 12 + E e + f h ) + ( i = 1 5 CBM j × CFB j × ( 1 α j ) )
where ECi: Consumption of the i-th energy source (10,000 tons); ACVi: Low calorific value of the i-th energy source; Ci: Carbon content of the i-th energy source; CORi: Carbon oxidation rate of the i-th energy source; 44/12: Conversion coefficient from elemental carbon to carbon dioxide; Ee/Eh: Consumption of electric power/heat; fe/fh: Carbon emission factor of electric power/heat; CBMj: Consumption of the j-th building material (10,000 tons); CFBj: Carbon emission factor of the j-th building material (kg/m3); and αj: Recovery coefficient of the j-th building material.
For basic energy data, the energy calorific value parameters refer to GB/T 2589-2020 General Rules for Calculation of Comprehensive Energy Consumption [13]. The energy consumption of Hunan’s construction industry is obtained from the energy balance table in China Energy Statistical Yearbook [14]. For building material consumption data, the consumption of main building materials (steel, wood, cement, glass, etc.) comes from China Construction Industry Statistical Yearbook [15]. For emission calculation parameters, the carbon oxidation rate adopts the Guidelines for the Preparation of Provincial Greenhouse Gas Inventories [16], and the standard carbon emission factors are based on GB/T 51366-2019 Standard for Building Carbon Emission Calculation [17,18].

2.2. Stirpat Model

Based on the IPAT model and combined with the characteristics of Hunan’s construction industry, this paper analyzes the influencing factors of construction carbon emissions from four dimensions: population, economy, technology and industry. The classic IPAT model is extended to the stochastic STIRPAT model as follows:
I = a P b A c T d e
where I: Carbon dioxide emission equivalent of the construction industry; P: Population factor; A: Economic indicator; T: Technical parameter; a: Model coefficient; b, c, d: Elastic coefficients, reflecting the marginal impact degree of the three types of factors respectively; and e: Random error term for model deviation correction. Logarithmic transformation is performed on both sides of the equation to eliminate heteroscedasticity, as shown in Equation (3):
l n I = l n a + b l n P + c l n A + d l n T + l n e
On the basis of previous academic research and combined with the development status of Hunan’s construction industry, this paper selects 10 influencing factors: total population, urbanization rate [19], number of employees in the construction industry [20], per capita GDP [10], gross output value of the construction industry [21], added value of the tertiary industry, energy intensity [22], technical equipment rate of construction enterprises [23], industrial scale of the construction industry [24], and labor input [25]. These factors are taken as independent variables, and the construction carbon emissions of Hunan Province are taken as the dependent variable, which are introduced into Equation (3) to construct the extended STIRPAT model:
ln C = ln a + b ln P 1 + c ln P 2 + d ln P 3 + e ln E 1 + f ln E 2 + g ln E 3 + h ln T 1 + i ln T 2 + j ln B 1 + k ln B 2 + ln e
where C: Carbon emissions from Hunan’s construction industry; P1: Total population; P2: Urbanization rate; P3: Number of employees in the construction industry; E1: Per capita GDP; E2: Gross output value of the construction industry; E3: Added value of the tertiary industry; T1: Energy intensity; T2: Technical equipment rate of construction enterprises; B1: Industrial scale of the construction industry; B2: Labor input; a: Constant term; b~k: Elastic coefficients, which quantify the fluctuation range of carbon emissions caused by a 1% change in each variable respectively; and lne: Error term. The descriptions of the various variables are shown in Table 1.

2.3. Cnn-Lstm-Attention Model

(1)
CNN Model
Convolutional Neural Network (CNN) is a deep learning model specially designed for processing grid-structured data [26]. By simulating the hierarchical processing mechanism of the human visual cortex for image features, it effectively reduces the number of model parameters and improves generalization ability.
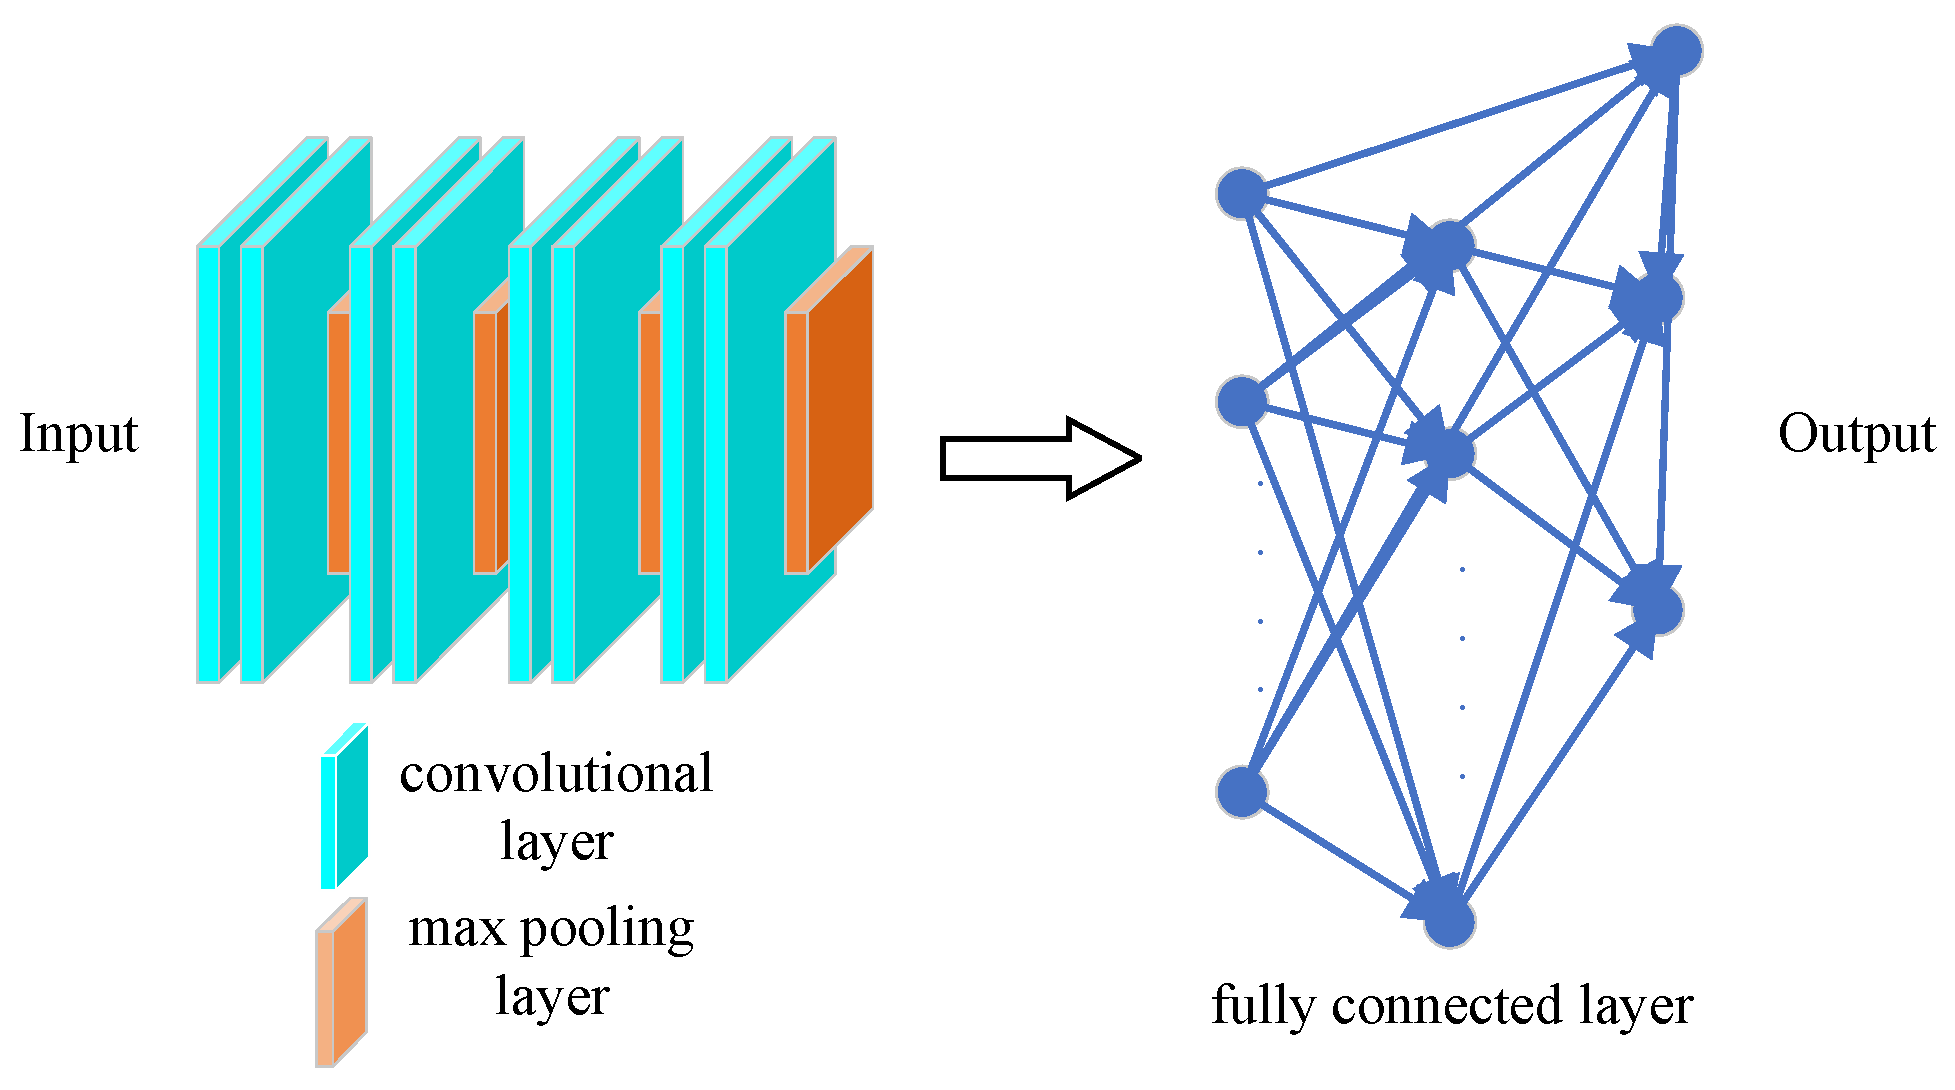
CNN consists of convolutional layers, pooling layers and fully connected layers. It extracts features through the sliding of convolution kernels on the data, compresses the data dimension through pooling operations, and finally performs classification or regression tasks through the fully connected layer. It can automatically learn the inherent features of the data, and its structure is shown in Figure 1.
(2)
LSTM Model
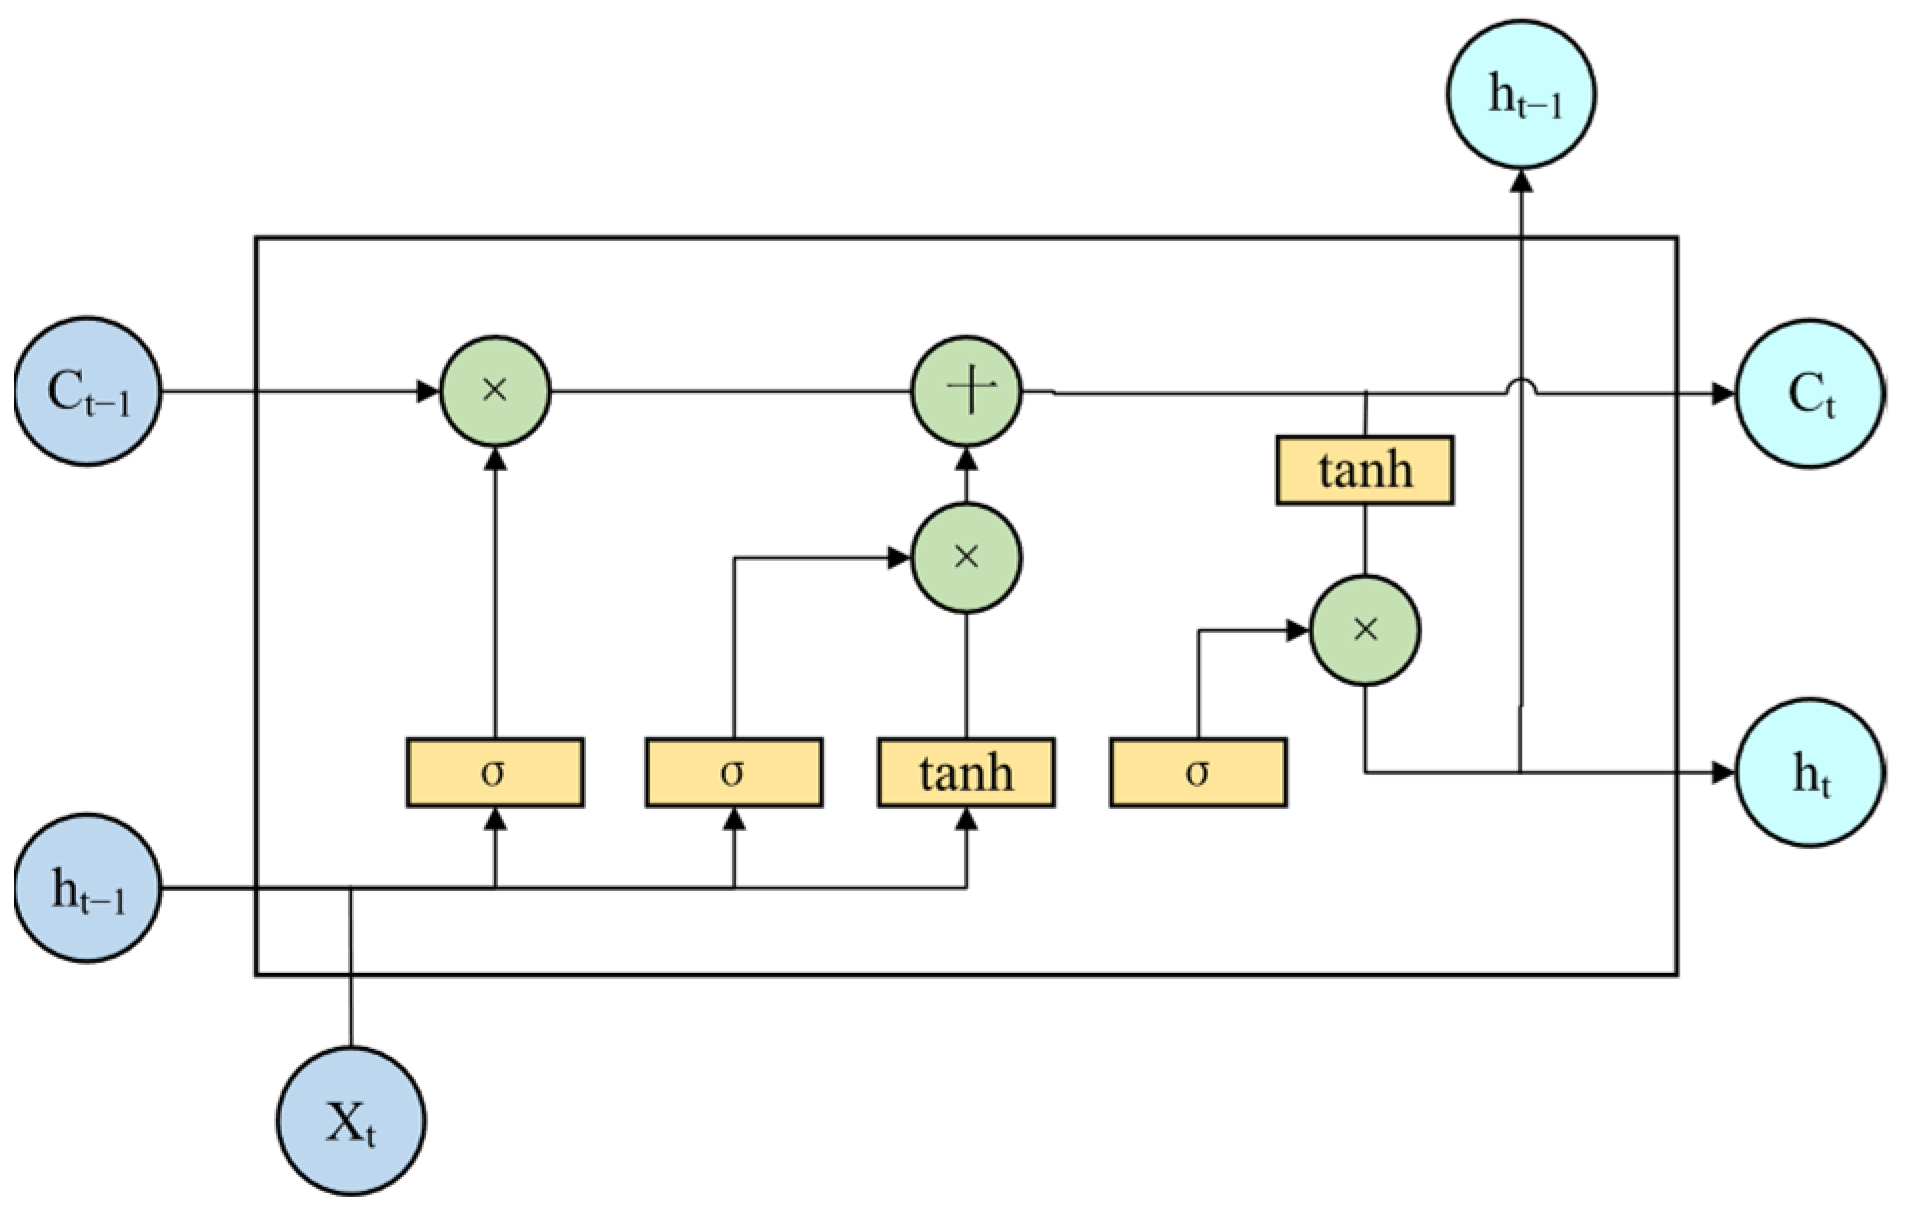
Long Short-Term Memory (LSTM) is a variant of Recurrent Neural Network (RNN) [27]. By introducing the cell state and three gating mechanisms (forget gate, input gate and output gate), it can effectively memorize the long-term dependent information in long sequences, and is widely used in natural language processing, speech recognition, time-series prediction and other fields. Its calculation logic is realized through the following formulas and the structure shown in Figure 2.
As the core transmission channel of LSTM, the cell state undertakes the key role of long-distance information transmission. At time t, the update of the cell state Ct is completed through the collaboration of the forget gate ft and the input gate:
f t = σ W f h t 1 ; x t + b f
i t = σ W i h t 1 ; x t + b i
C ~ t = t a n h W C h t 1 ; x t + b C
C t = f t C t 1 + i t C ~ t
where σ: Sigmoid activation function, which compresses the output to the interval (0,1) to control the proportion of information retained; tanh: Hyperbolic tangent function, which generates the candidate cell state C ~ t ; : Element-wise multiplication; ft: Forget gate, which determines the information discarded from the cell state Ct−1 at the previous moment; and it: Input gate, which controls the inflow of new information C ~ t at the current moment.
After updating the cell state, LSTM calculates the hidden state ht at the current moment through the output gate o t :
o t = σ W o h t 1 ; x t + b o
h t = o t t a n h C t
The output gate ot adjusts the output of information in the cell state Ct according to the current input and historical hidden state, and finally generates the hidden state ht for downstream tasks. This gating mechanism enables LSTM to adaptively capture the long-term dependence in sequence data, avoiding the interference of short-term information on long-term memory.
(3)
Attention Mechanism
Attention is a model component that simulates human attention allocation [28]. Its core is to enable the model to automatically learn the importance of information at different positions in sequence processing, assign corresponding weights, focus on key features and suppress secondary information.
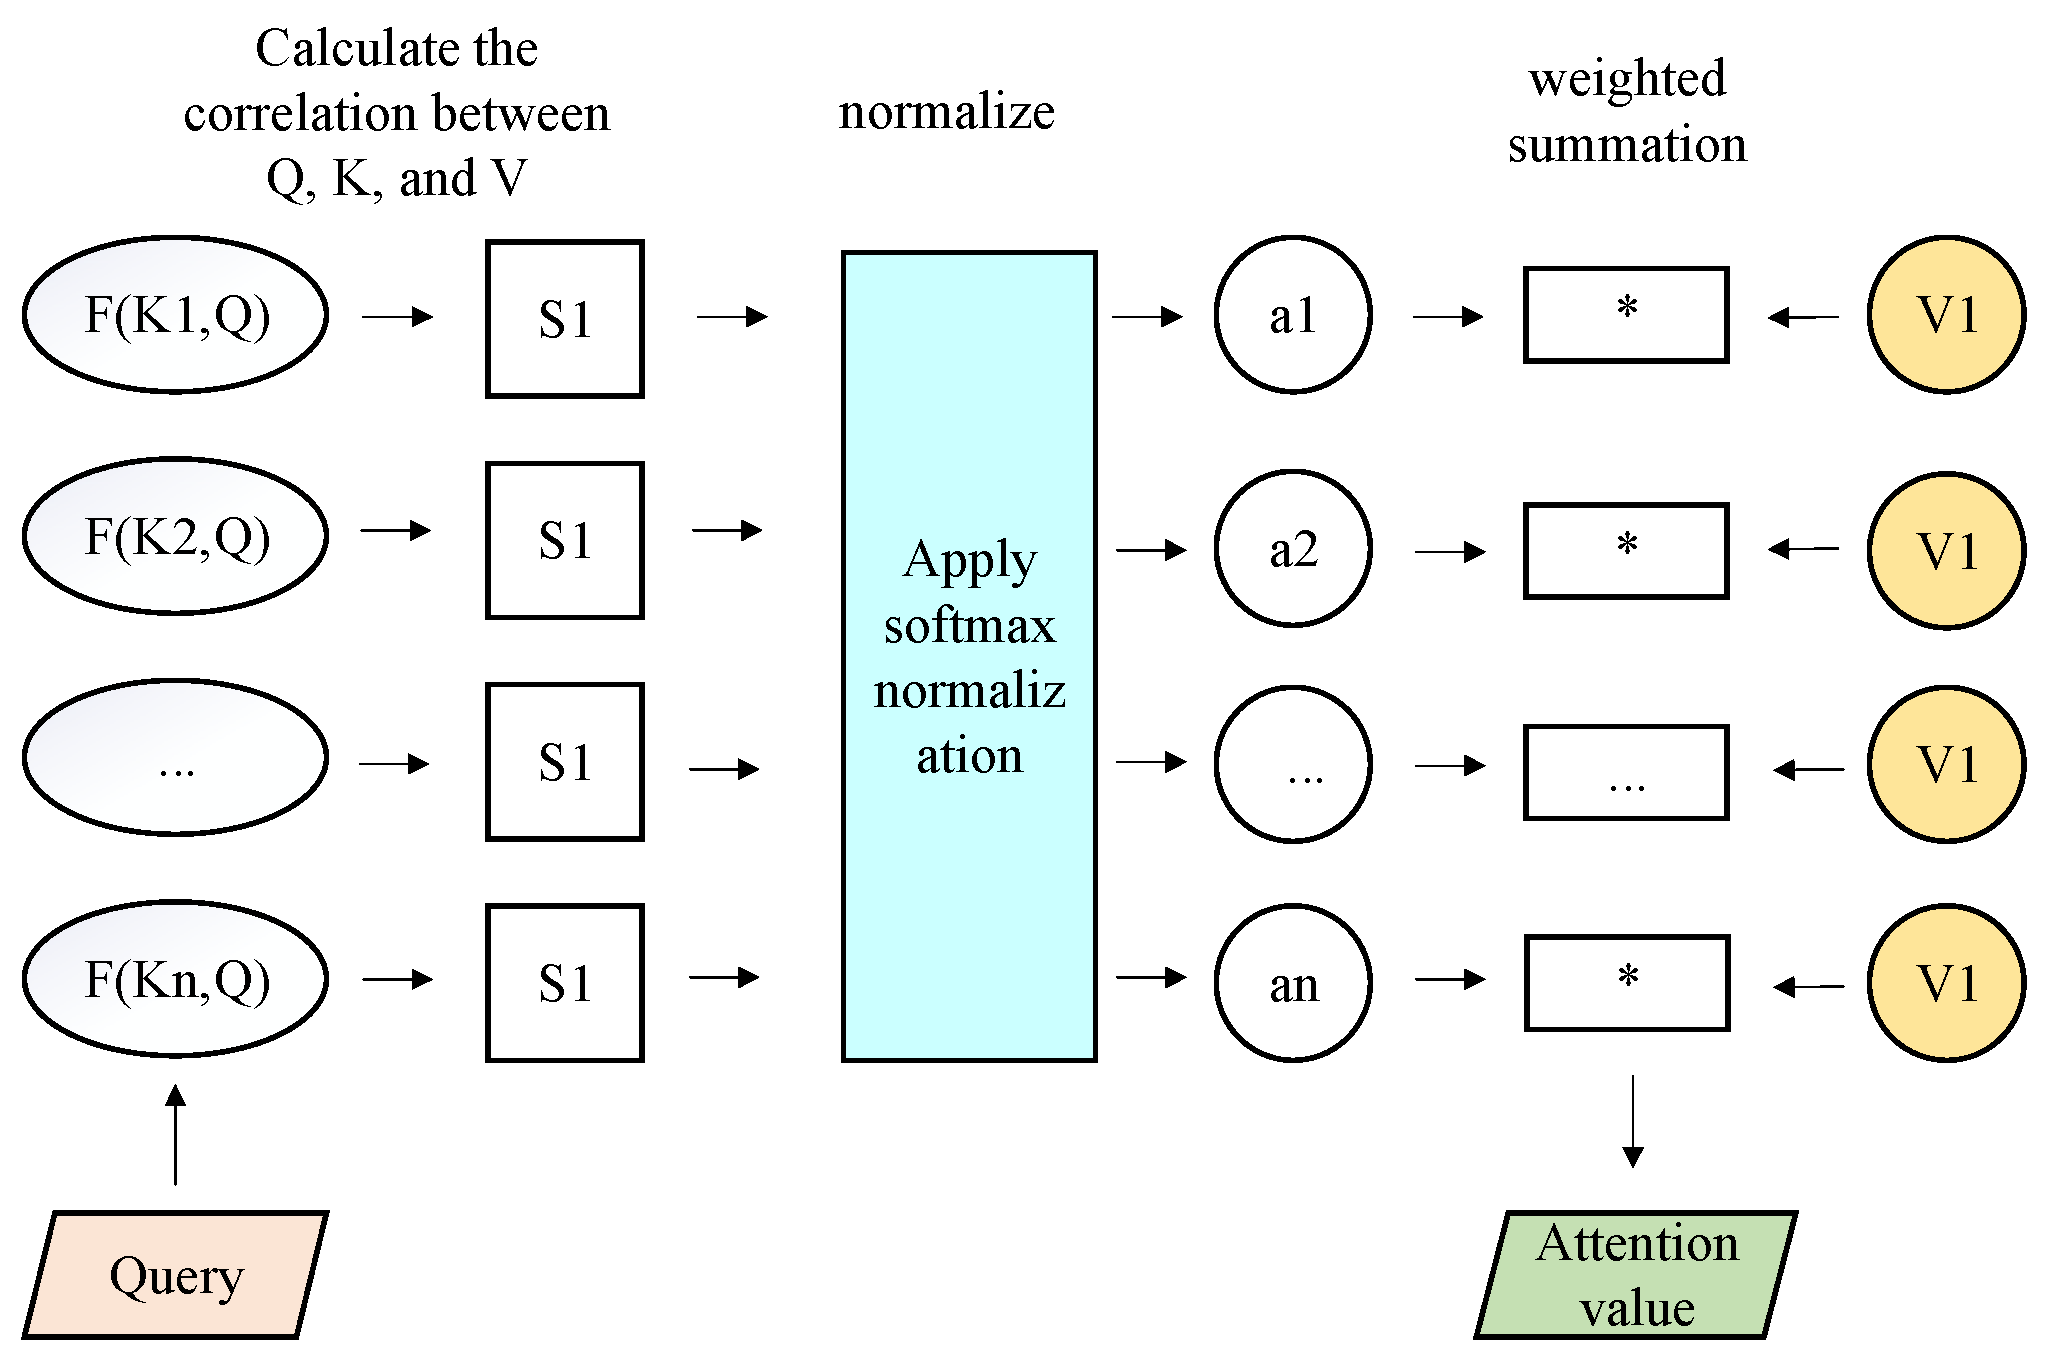
This mechanism acts on the output sequence of LSTM, calculates the weight of the hidden state at each time, screens out the key temporal features, and inputs them to the subsequent prediction layer, so as to improve the sensitivity and prediction accuracy of the model. Its core components include Query, Key and Value: by calculating the similarity between the Query and all Keys, a weight distribution is generated, and then the output is obtained by weighted summation of the Values. This mechanism enables the model to flexibly capture long-distance dependencies. In this schematic diagram, the symbol “*” represents element-wise multiplication (Hadamard product), which applies the normalized attention weights to the corresponding Value vectors to generate the final attention output. The schematic diagram of the attention mechanism is shown in Figure 3.

3. Results and Analysis

3.1. Calculation of Carbon Emissions from Hunan’s Construction Industry

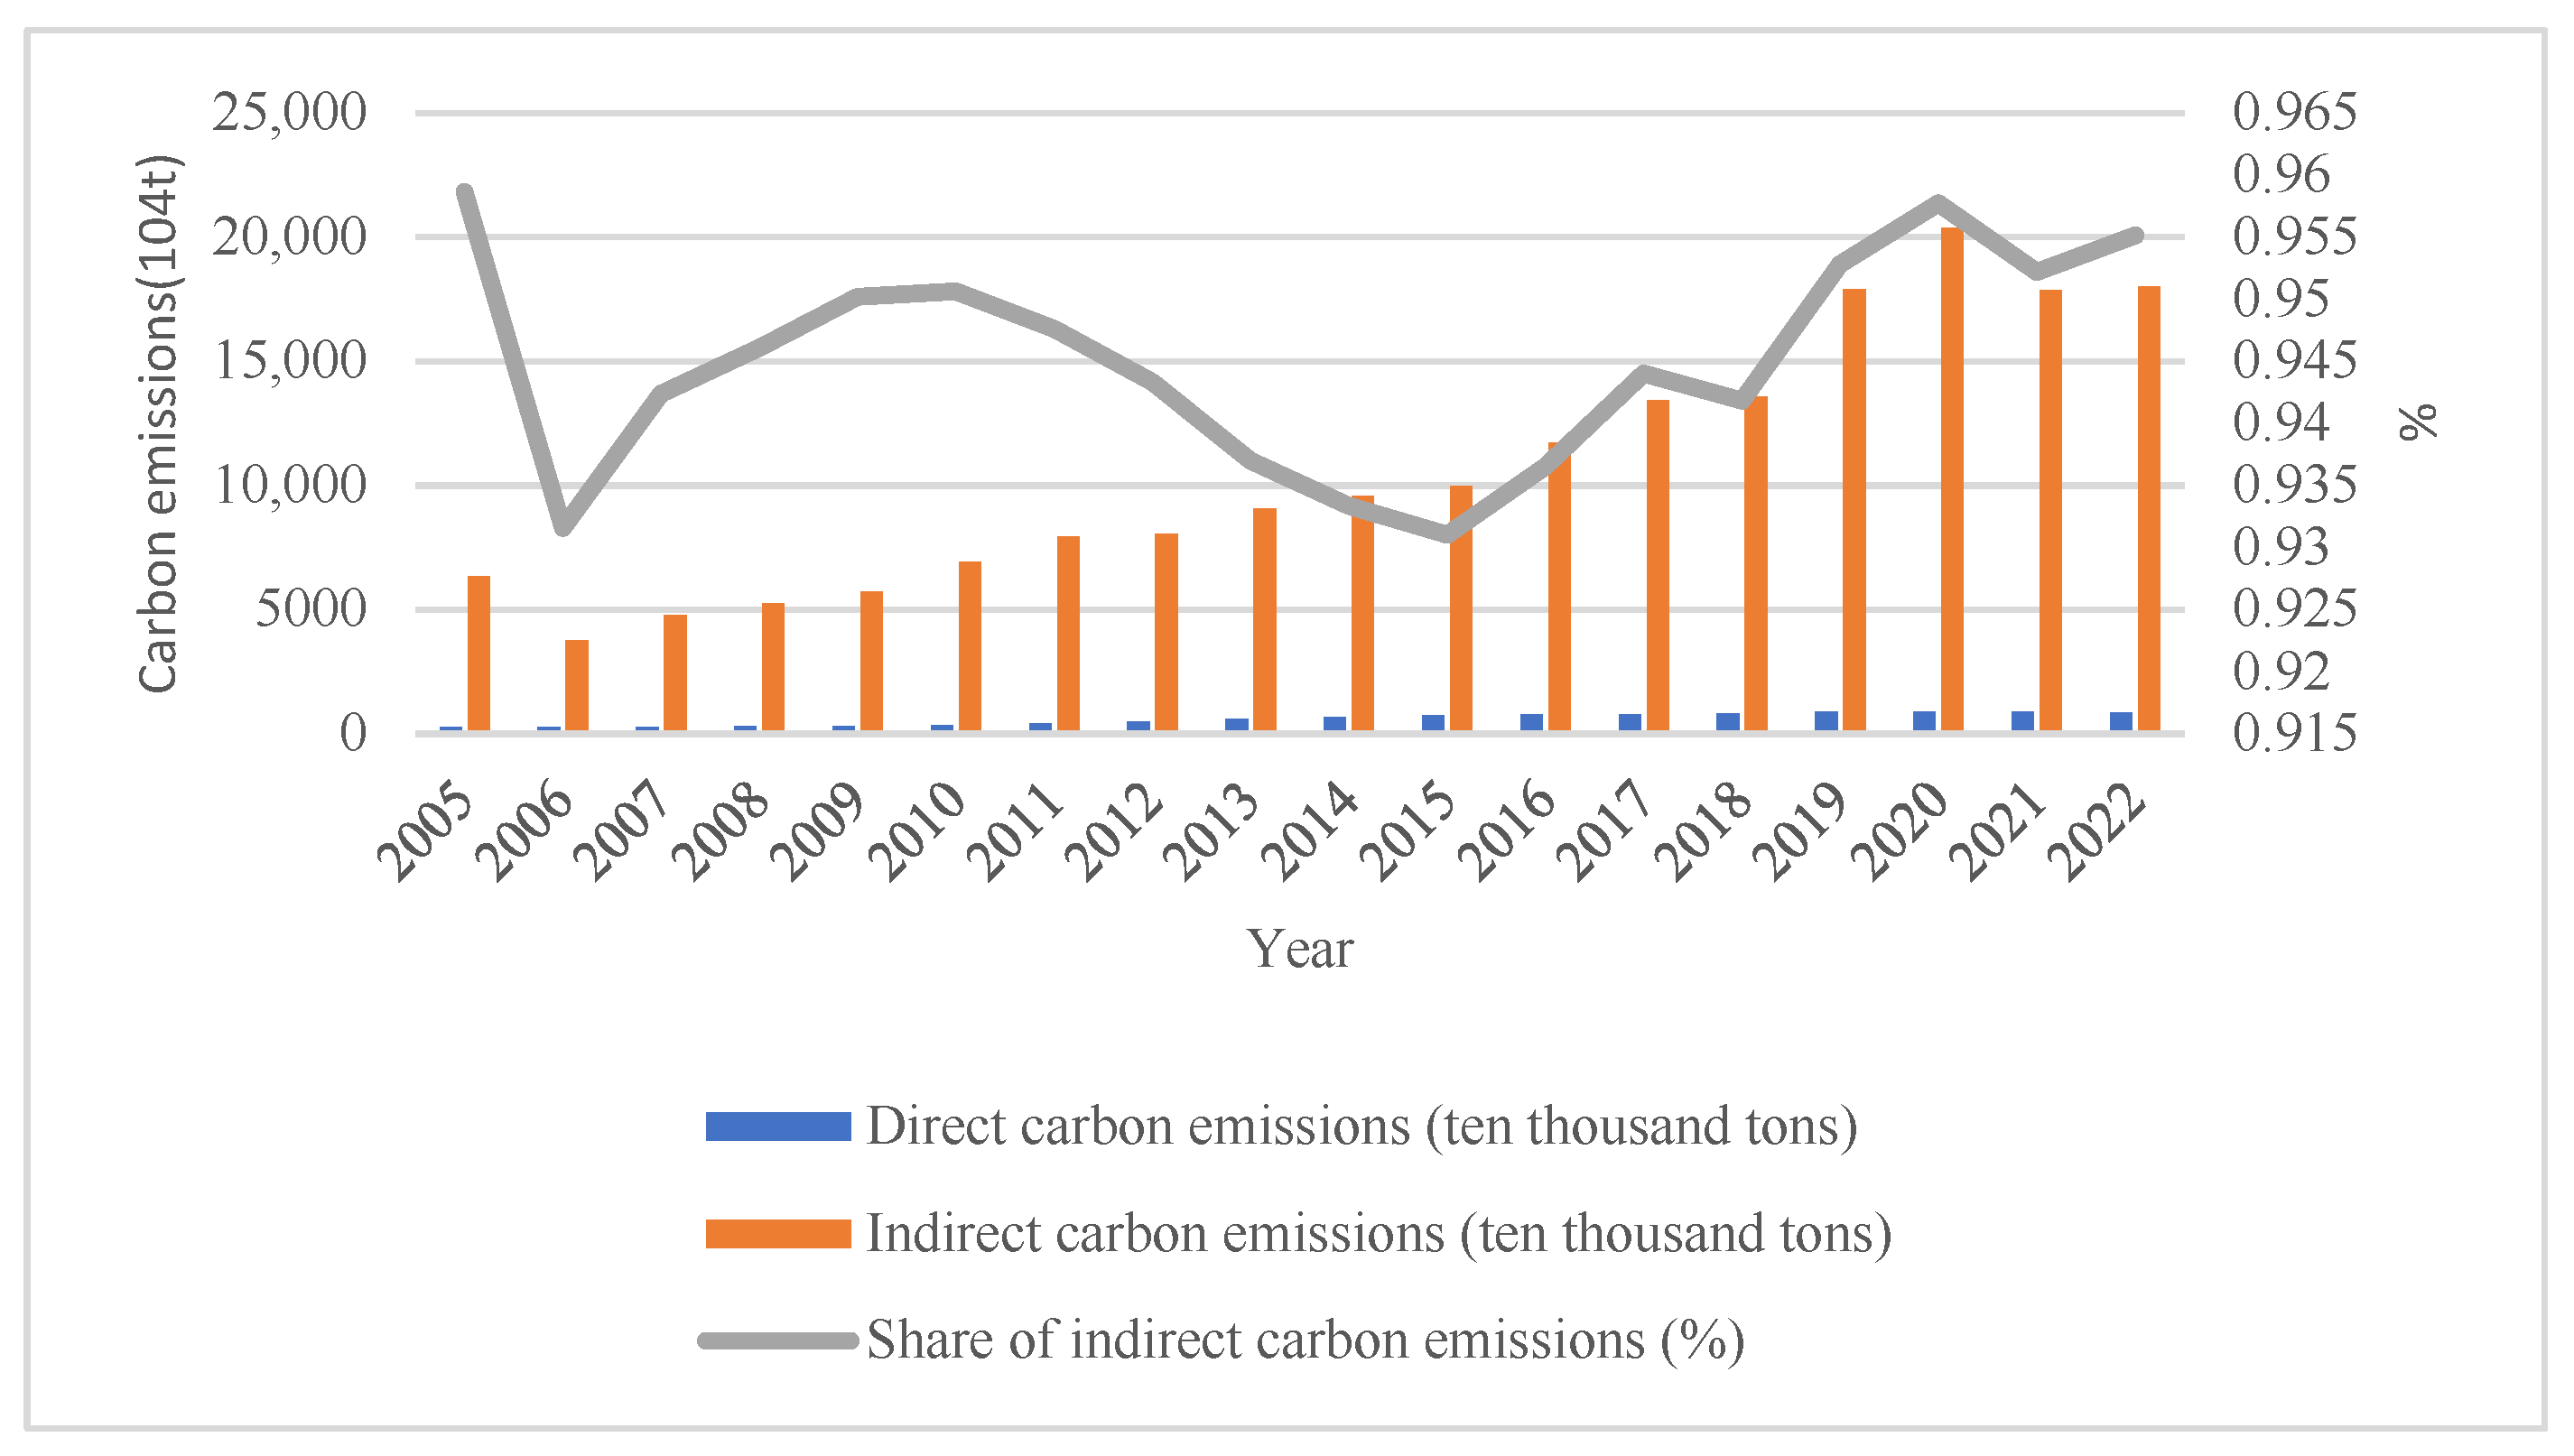
As shown in Figure 4, from 2005 to 2022, the carbon dioxide emissions of Hunan’s construction industry maintained an overall growth trend. There was a phased decline in emissions in 2021, which was mainly related to the reduction in the number of construction projects started during the COVID-19 pandemic from 2020 to 2021 [29], and the reduction in construction activities directly led to lower emissions. Indirect carbon emissions have always dominated the total annual emissions, with the proportion maintained at over 90% of the total emissions for a long time, which is significantly higher than direct emissions. The percentage of indirect carbon emissions is as follows:

3.2. Analysis of Influencing Factors

Taking lnC as the dependent variable and lnP1, lnP2, lnP3, lnE1, lnE2, lnE3, lnT1, lnT2, lnB1, lnB2 as independent variables, multiple linear regression analysis was carried out using SPSS 26 software. The analysis results are shown in Table 2. The R2 value of the model reaches 95.8%, which is close to 1, indicating that the regression model has an excellent fitting effect on the data and can highly accurately explain the change trend of the dependent variable.
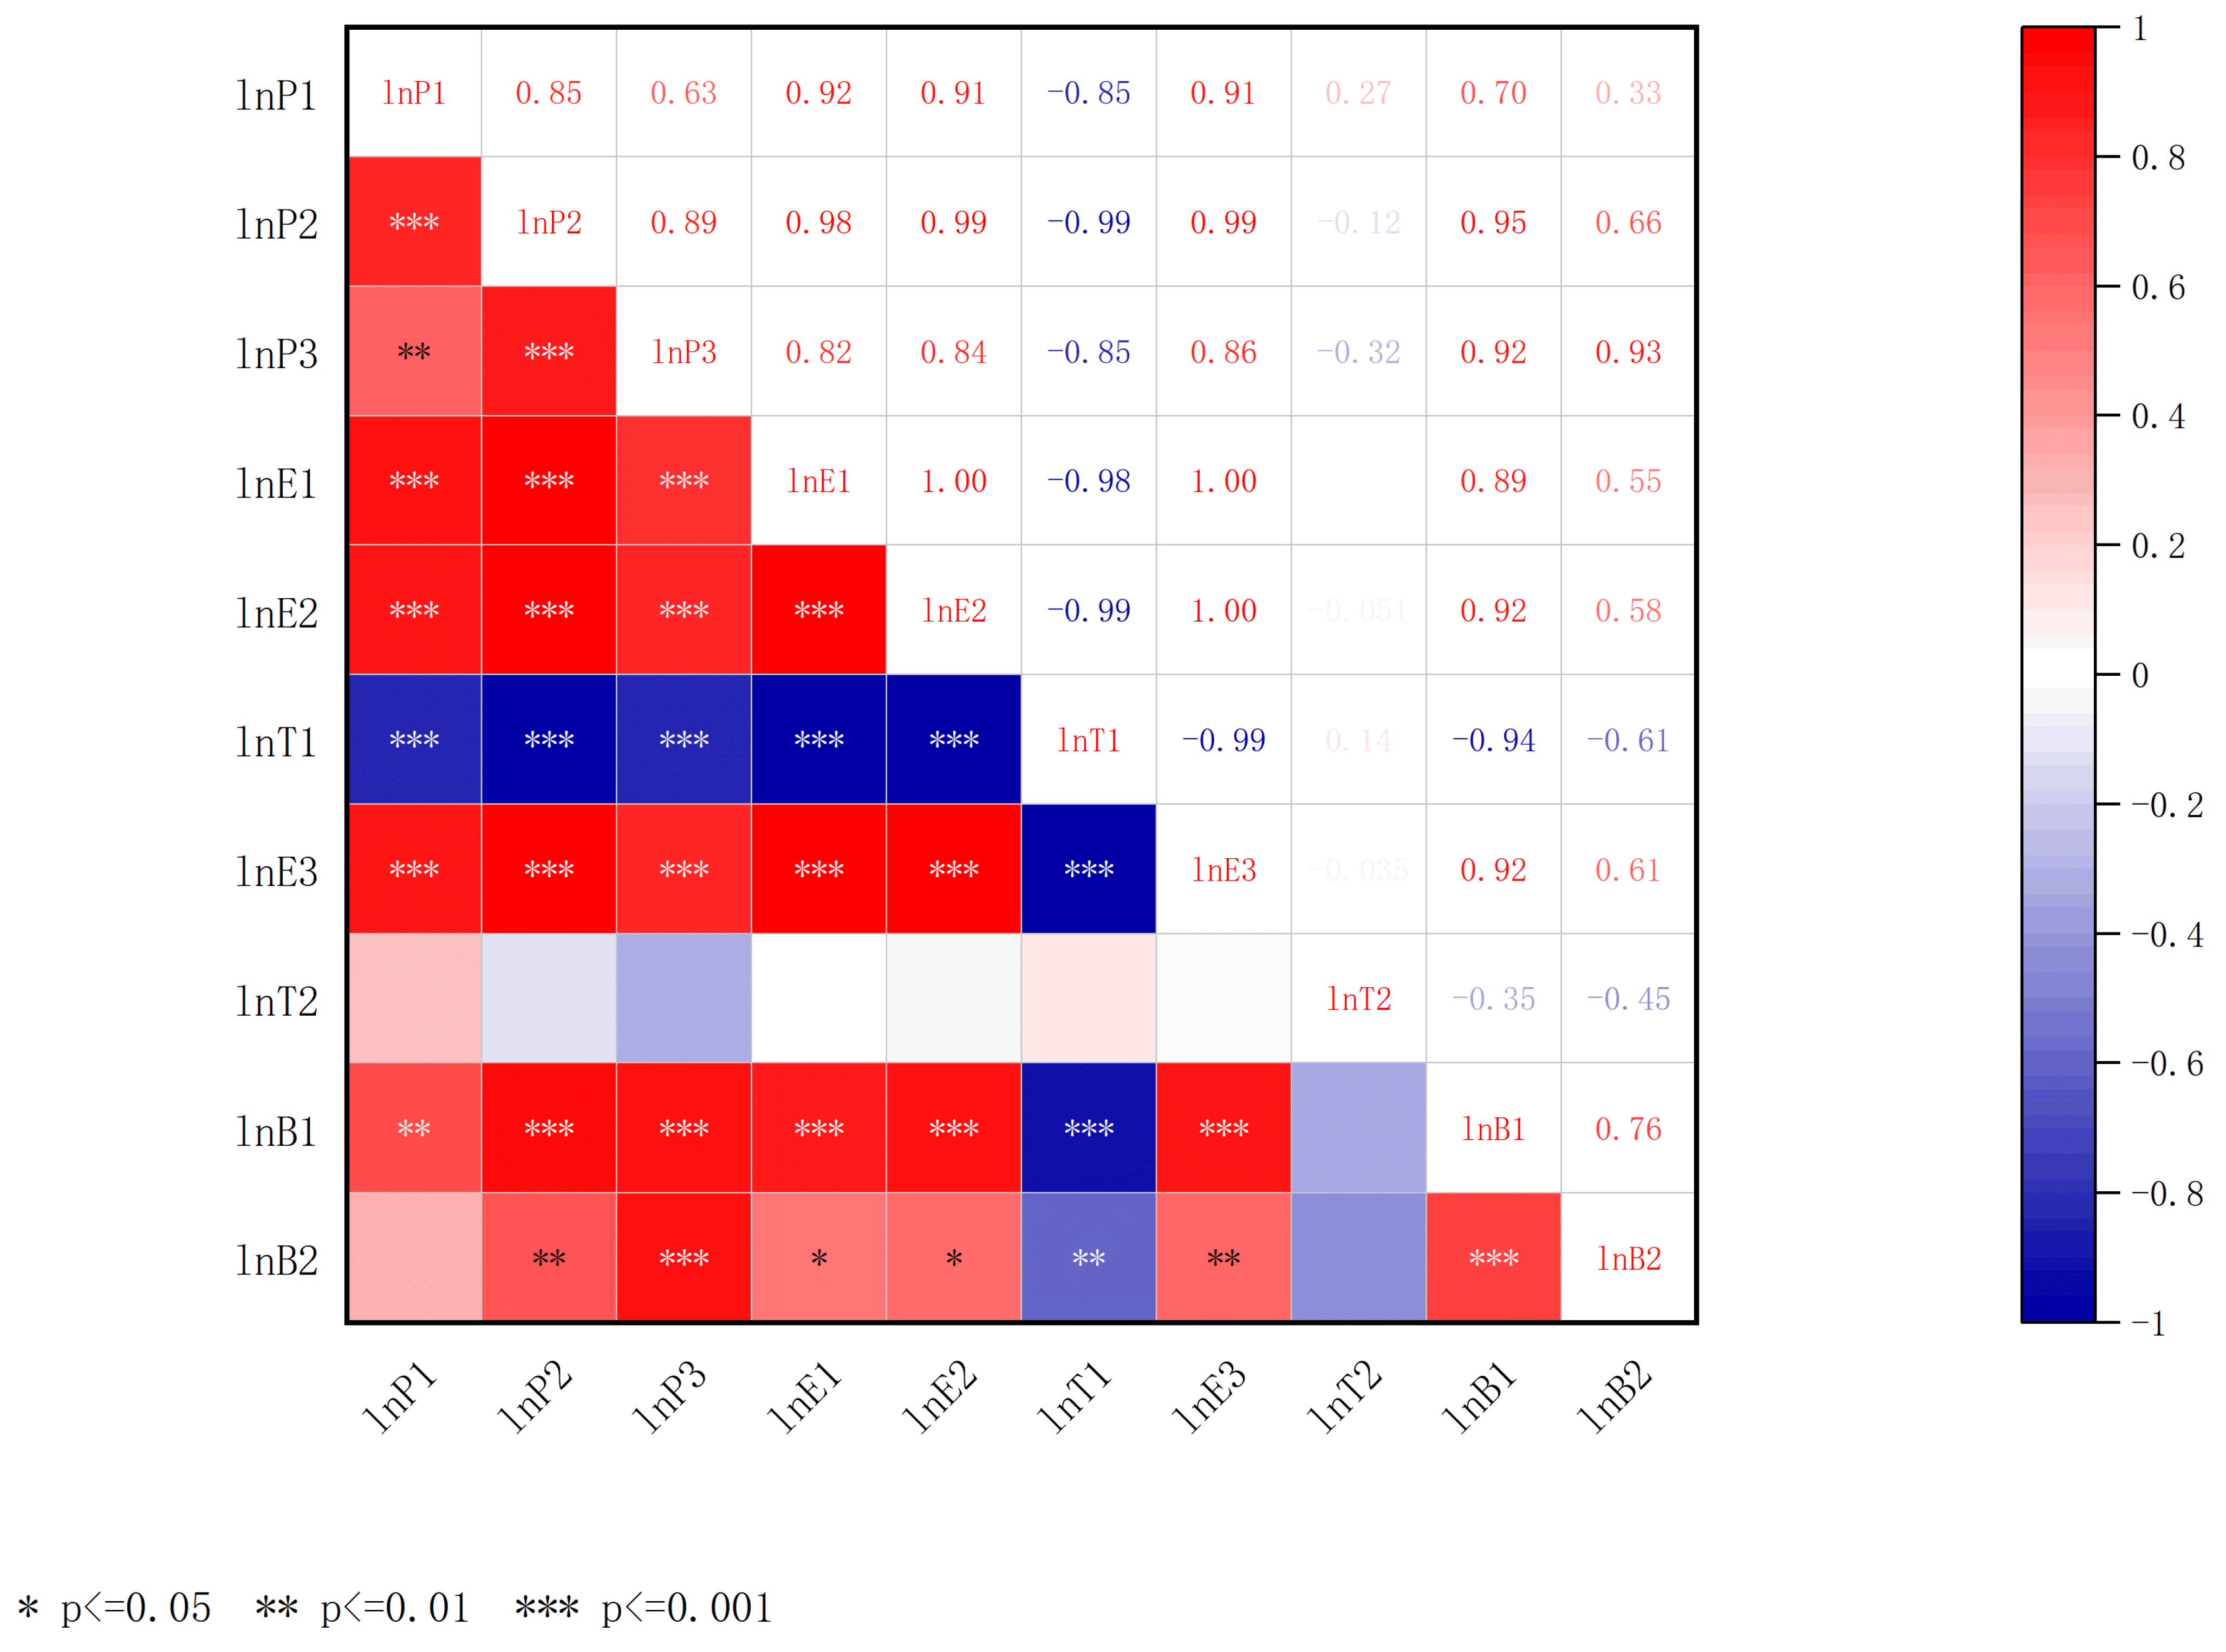
Further collinearity tests were carried out. As shown in Table 3, the VIF (Variance Inflation Factor) values of some variables are greater than 50. The correlation test in Figure 5 shows that the correlation coefficient between some influencing factors is as high as 0.9, indicating that there may be a strong multicollinearity problem, VIF values exceeding 10 indicate severe multicollinearity, justifying the use of ridge regression.
Ridge regression shrinks regression coefficients by introducing an L2 regularization term, effectively mitigating estimation bias caused by multicollinearity and ensuring the stability and validity of coefficient estimates [30]. Therefore, this study employs the ridge regression method for empirical analysis. The ridge parameter K is central to ridge regression, directly determining the strength of regularization [11]. In this study, the optimal value of K is determined comprehensively using a combination of the ridge plot method and the VIF criterion [31]. When K = 0.109, the regression coefficients of each variable stabilize, and the VIF values of all variables drop below 10, indicating that multicollinearity is effectively controlled. Using this parameter, an initial full-variable ridge regression model is constructed.
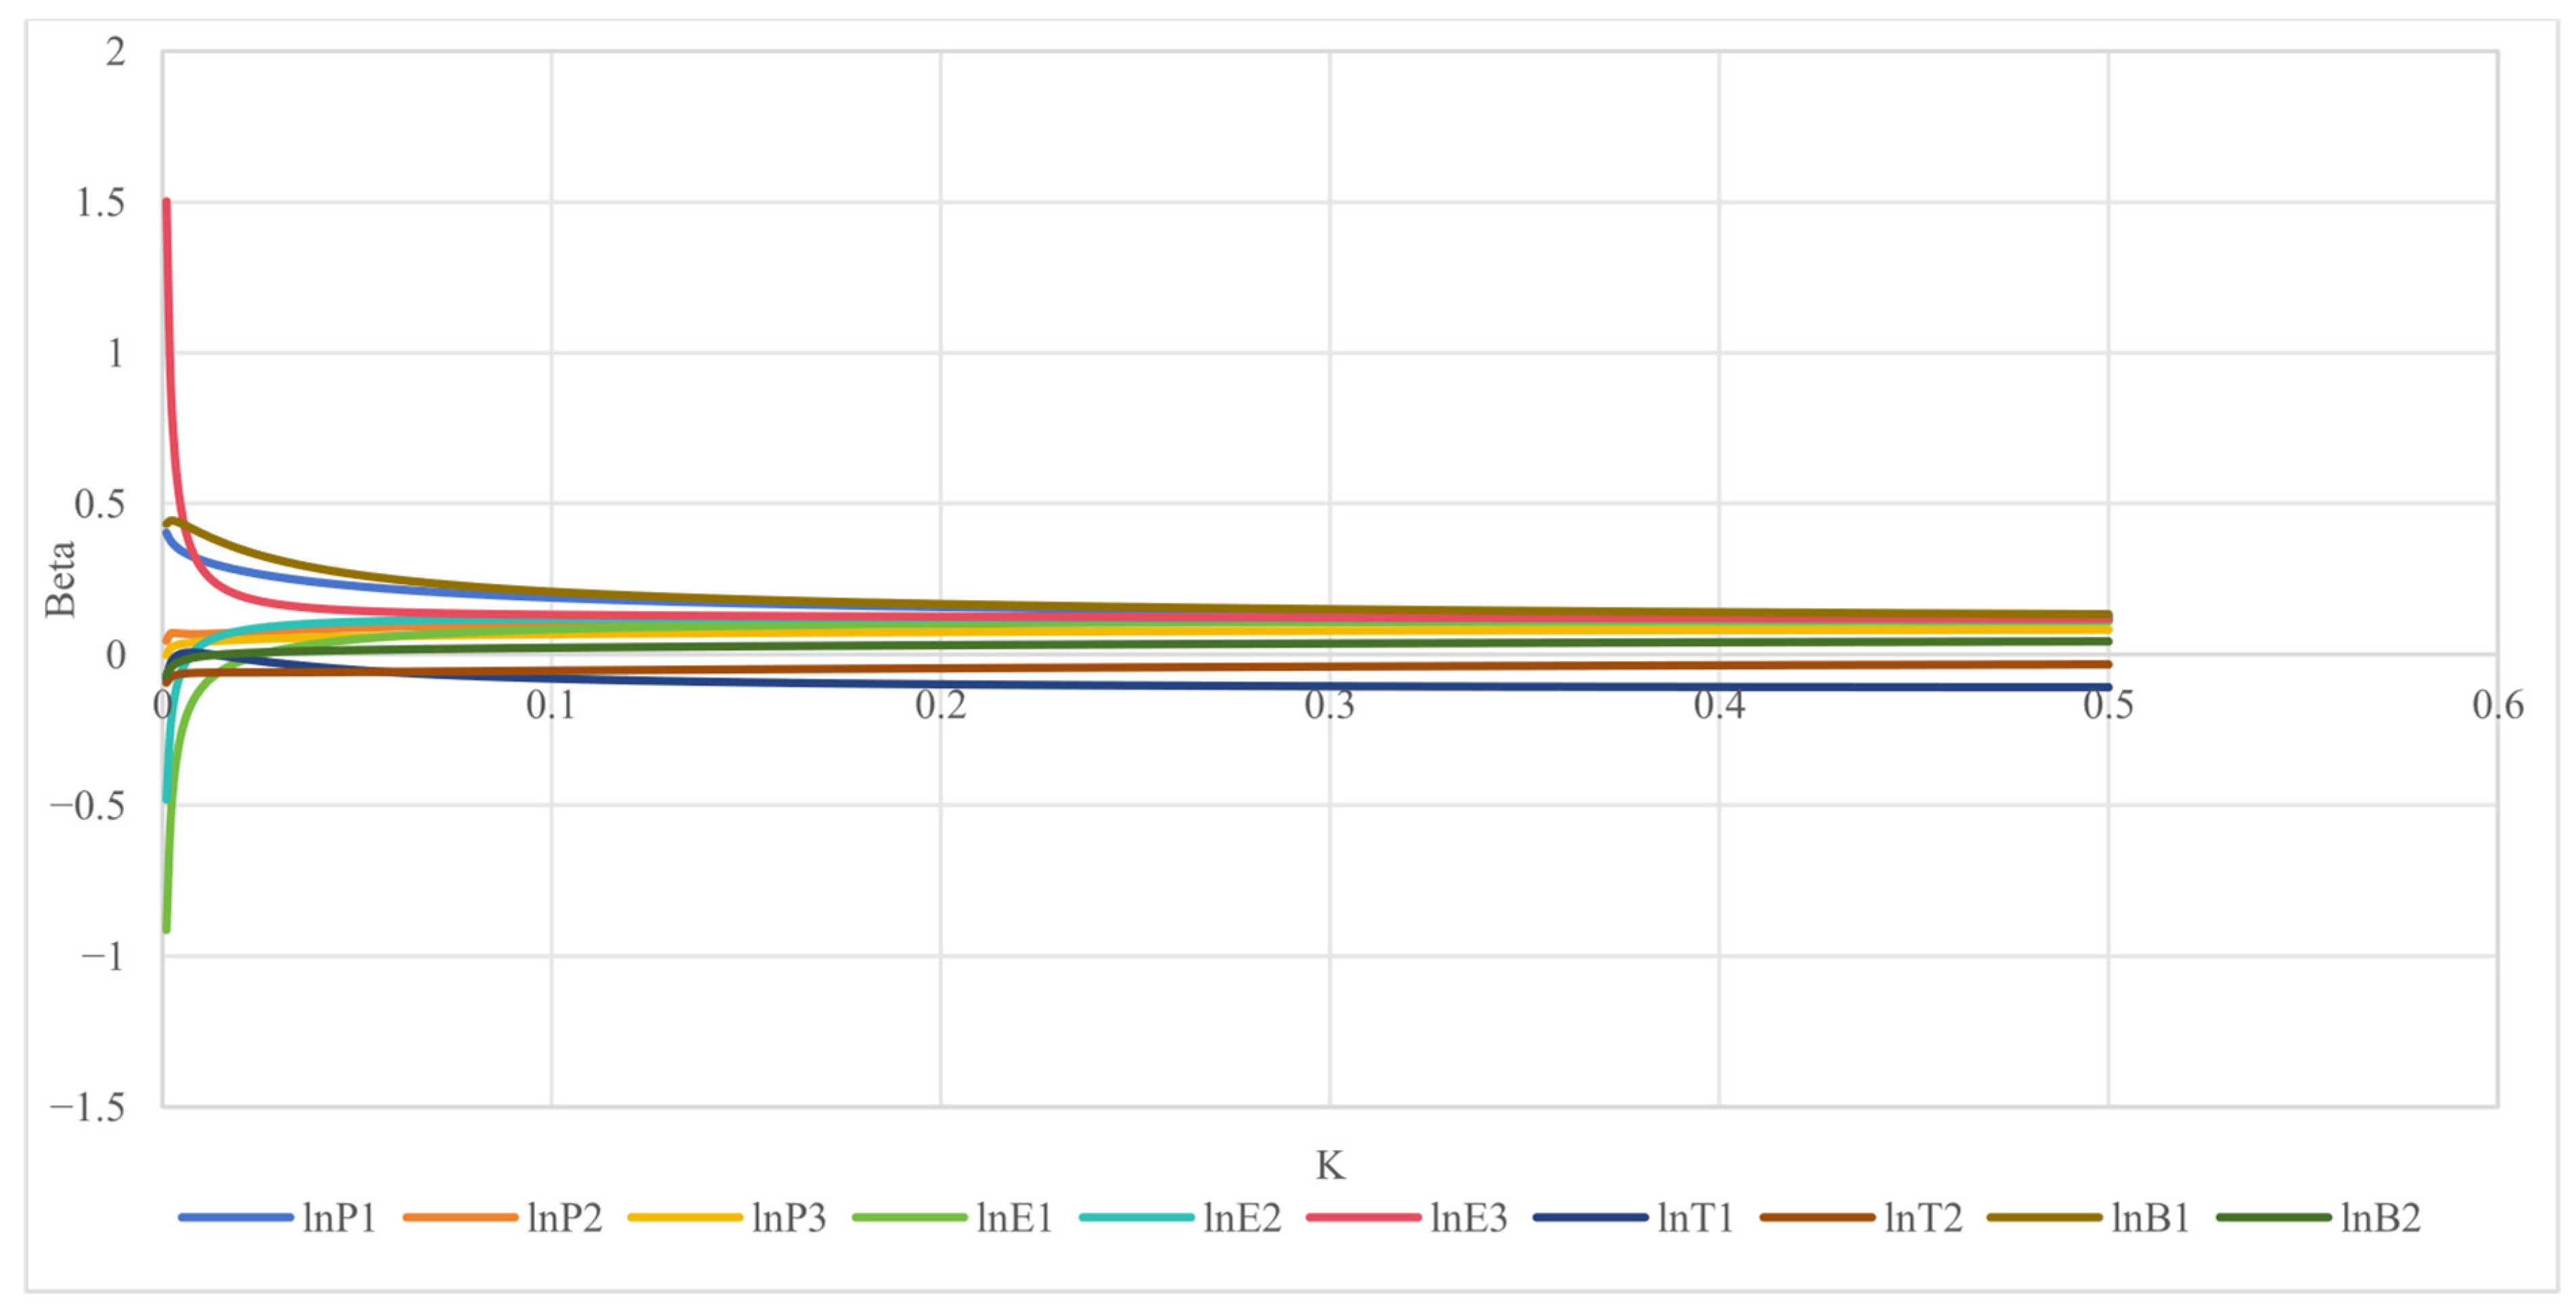
The results of the ridge regression are shown in Table 4, the resulting ridge map is shown in Figure 6; the initial model exhibits good overall fit, with R2 = 0.938 and an F-statistic of 10.681 (p = 0.002 ***). The model is highly significant at the 1% level, but it still has a notable shortcoming: the adjusted R2 is only 0.851, a significant gap compared to the unadjusted R2. The root cause lies in the fact that among the initial 10 independent variables, there are still redundant variables that lack stable explanatory power for carbon emissions in the construction industry; these not only dilute the mechanism of action of core driving factors but also lead to insufficient model degrees of freedom and weakened generalization ability, rendering them unable to provide reliable input variables for subsequent carbon emission peak predictions [32]. Therefore, based on the determination of optimal ridge parameters for all variables, this study further conducts variable screening using the individual characteristics of the ridge trace curve to identify the core factors that have a substantial impact on carbon emissions in Hunan’s construction industry [33].
Based on the characteristics of the ridge trace curves for each variable, and with reference to Figure 6 and Table 5, according to research by relevant scholars [34,35], this paper conducts a diagnostic analysis of the 10 initial independent variables one by one: the standardized coefficient of lnT2 continuously converges to 0 as k increases; after the ridge trace stabilizes, its absolute value consistently remains in the lowest range among all variables, indicating extremely weak marginal explanatory power for carbon emissions; lnB2 exhibits significant fluctuations in sign within the low k range, with the coefficient approaching 0 throughout the process; it is severely affected by multicollinearity, resulting in distorted estimation results [36]. Both of the above variables meet the criteria for exclusion and are therefore removed from the model. The ridge plots of the remaining 8 variables all rapidly stabilize as k increases; their signs remain stable and do not exhibit characteristics of continuous convergence to 0 [37]. They all possess stable marginal explanatory power for carbon emissions in Hunan’s construction industry, and their direction of influence aligns with the theoretical framework of the STIRPAT model and common industry knowledge; therefore, they are all retained [38].
After removing the two outliers, lnT2 and lnB2, and re-running the ridge regression analysis, the optimal K value was determined through a combination of the ridge trace plot method and the VIF criterion, yielding a value of 0.113. As shown in Table 6, the model’s overall performance and robustness were significantly improved: the model’s R2 remained stable at a high level of 0.937, and the adjusted R2 increased from 0.851 to 0.881, indicating an improvement in the model’s explanatory power. The F-statistic increased from 10.681 to 16.7, making the model fully significant at the 1‰ statistical level and completely eliminating the risk of spurious regression. At the same time, the model’s degrees of freedom increased from 7 to 9, effectively alleviating the overfitting issue in small samples and providing a more reliable model foundation for subsequent multi-scenario carbon emissions peak predictions [39].
Based on the coefficient estimates, after excluding outliers, the weightings of the core drivers were restored and validated: The signs of the coefficients for all retained variables are fully consistent with the trends identified in the ridge trace analysis and the theoretical expectations of the STIRPAT model, with no sign reversals or drastic fluctuations. This significantly enhances the robustness of the coefficient estimates and the clarity of their economic significance. This establishes a carbon emissions prediction model for the construction industry in Hunan Province:
lnC =   26.622   +   3.919   ×   lnP 1   +   0.338   ×   lnP 2   +   0.142   ×   lnP 3   +   0.063   ×   lnE 1 +   0.074   ×   lnE 2   +   0.084   ×   lnE 3     0.105   ×   lnT 1   +   0.759   ×   lnB 1
As can be seen from Equation (11), population size, urbanization rate, the number of people employed in the construction industry, per capita GDP, gross value added of the construction industry, value added of the tertiary sector, and the scale of the construction industry all have a significant positive impact on carbon emissions in Hunan Province’s construction sector. For each 1% increase in the aforementioned eight factors, carbon emissions change by 3.919%, 0.338%, 0.142%, 0.063%, 0.074%, 0.084%, and 0.759%, respectively. Energy intensity has a significant negative impact on carbon emissions in Hunan’s construction industry; a 1% increase in energy intensity reduces carbon emissions by 0.105%. Among these factors, population size has the greatest impact on carbon emissions in Hunan’s construction sector, followed by the scale of the construction industry, urbanization rate, number of construction industry employees, energy intensity, value added of the tertiary sector, gross output value of the construction industry, and Per capita GDP has the smallest impact.

4. Scenario-Based Carbon Emission Prediction and Analysis

4.1. Scenario Parameter Setting

Based on the historical carbon emission data of Hunan’s construction industry, social development status, relevant plans, policy documents such as the Implementation Plan for Carbon Peak in Hunan Province [40] and the 14th Five-Year Plan for National Economic and Social Development and the Long-Range Objectives Through the Year 2035 of Hunan Province [41], and referring to relevant research [10], Establishing Three Development Scenarios for Hunan Province’s Construction Industry for 2023–2040: high-carbon, baseline, and low-carbon. The high-carbon scenario continues the current development inertia, without strengthening carbon emission reduction policies, and economic development is dominated by traditional high energy-consuming industries [42]. The baseline scenario implements relevant plans, promotes the transformation of economic and energy structure. The low-carbon scenario strengthens emission reduction measures on the basis of the baseline mode and accelerates the achievement of the carbon neutrality goal through strict energy structure adjustment policies, improved energy efficiency standards, and promotion of clean technology applications.
(1)
Urbanization Rate
Based on the development goals set forth in the Hunan Province 14th Five-Year Plan for New-Type Urbanization [43], Hunan Province’s urbanization rate is projected to reach 72% by 2035. Using the 2022 urbanization rate of 60.3% as a baseline and taking into account the average annual growth rate of 1.8% between 2019 and 2022, the baseline scenario for 2023–2030 assumes an average annual growth rate of 0.7% for urbanization. In the high-carbon scenario, the annual growth rate is 1.0%, continuing the momentum of rapid urbanization; in the low-carbon scenario, the annual growth rate is 0.3%, reflecting a shift toward higher-quality, slower-paced urbanization. From 2031 to 2035 and from 2036 to 2040, the growth rate will gradually decrease as the urbanization rate approaches the target value, consistent with the S-curve pattern of urbanization development. Specific figures are shown in Table 7.
(2)
Population Size
Based on the population development targets set forth in the Hunan Provincial Territorial and Spatial Plan (2021–2035) [44], Hunan Province’s permanent resident population is projected to stabilize at approximately 68 million by 2035. Using the 2022 figure of 66.04 million permanent residents as a baseline and considering that the permanent resident population remained relatively stable between 2019 and 2022, and taking into account the long-term trend of population return to central provinces, the annual average growth rate is set at 0.2% under the baseline scenario for 2023–2030. Under the high-carbon scenario, which reflects an expansion in the scale of population return, the annual average growth rate is set at 0.3%; In the low-carbon scenario, as the population size tends to stabilize, the annual growth rate is set at 0.1%. After 2031, the growth rate gradually slows down; in the 2036–2040 period, the low-carbon scenario projects zero population growth, consistent with long-term demographic trends. In subsequent phases, as the total population stabilizes, the growth rate exhibits a decreasing trend. Specific figures are shown in Table 7.
(3)
Per Capita GDP
Hunan Province’s per capita GDP in 2022 was 73,598 yuan, with an average annual growth rate of 7.69% from 2019 to 2022. The Hunan Province Carbon Peaking Implementation Plan [45] proposes that, to implement the national requirement of “maintaining economic operations within a reasonable range” during the 14th Five-Year Plan period and in light of Hunan Province’s actual conditions, a target of an average annual growth rate exceeding 6% should be set. Under the baseline scenario, the economy will undergo a steady transition with a gradual adjustment in growth rates, experiencing a slight decline in the medium term and stabilizing in the later stages. The per capita GDP growth rate for the 2023–2030 baseline scenario is set at 6%. Under the high-carbon scenario, the momentum of high-speed growth will continue, with an average annual growth rate set at 6.5%; under the low-carbon scenario, economic growth slows as the economy transitions toward high-quality development, with an average annual growth rate set at 5.4%; thereafter, growth gradually decelerates from this baseline, with the growth rate reduced by 0.2–0.3 percentage points in each phase after 2031, in accordance with the objective laws governing the shift in economic growth.
(4)
Construction Industry Gross Output
From 2019 to 2022, the annual average growth rate of the construction industry’s gross output value in Hunan Province was 10.88%. The 14th Five-Year Plan for the Development of the Construction Industry in Hunan Province [46] proposes that “by 2025, the share of the construction industry’s value added in GDP will be stabilized at around 6.5%.” Currently, the construction industry’s value added accounts for approximately 6.2% of GDP. Under the 2023–2030 baseline scenario, the growth rate of total construction output value is set at 7.5%; under the high-carbon scenario, due to extensive expansion of the industry’s scale, the annual growth rate is set at 8.0%; In the low-carbon scenario, the pace of high-quality transformation and scale expansion slows, with the annual growth rate set at 7.0%. After 2031, the growth rate is reduced by 0.2–0.3 percentage points in each phase to align with the industry’s transition from scale expansion to quality improvement.
(5)
Tertiary Industry Value Added
The Hunan Province 14th Five-Year Plan for the Development of the Construction Industry [46] states that by 2025, the value added by core digital economy industries will account for over 11% of GDP. The 14th Five-Year Plan calls for the service sector to grow at an average annual rate higher than that of GDP. The “Hunan Province 14th Five-Year Plan for the Development of Modern Services” proposes that by 2030, the share of production-oriented services will exceed 60%. In 2022, the growth rate of value added in Hunan Province’s tertiary sector was 5.72%. Therefore, under the baseline scenario for 2023–2030, the growth rate of the construction sector’s tertiary industry value added is set at 6.0%. Under the high-carbon scenario, due to the expansion of traditional service industries, the annual growth rate is set at 6.5%; In the low-carbon scenario, with a strong push for the low-carbon transformation of production-oriented services, the annual growth rate is set at 5.5%. After 2031, the growth rate will be reduced by 0.2 percentage points in each phase to align with the pace of industrial structure optimization.
(6)
Construction Industry Scale
In accordance with the Hunan Province Carbon Peaking Implementation Plan and the 14th Five-Year Plan [40,41], the construction industry in Hunan is accelerating its transition toward green and eco-friendly practices and prefabricated construction, emphasizing the coordinated development of smart construction and ecological architecture, and setting a target for green buildings to account for 70% of new construction by 2025. From 2020 to 2022, the construction industry grew at an average annual rate of 2%. The Implementation Plan requires that prefabricated construction account for 30% of the total by 2025 and that the use of green building materials exceed 50% by 2030. A growth rate of 2% has been set to meet both planning requirements and the need for industrial structure optimization. Under the high-carbon scenario, due to the high proportion of traditional construction methods, the average annual growth rate is set at 2.5%; Under the low-carbon scenario, due to the large-scale application of prefabricated buildings and green building materials, the annual growth rate is set at 1.5%. After 2031, the growth rate will be reduced by 0.2 percentage points in each phase to align with the shift from traditional scale expansion toward green construction transformation.
(7)
Energy Intensity
In its Comprehensive Implementation Plan for Energy Conservation and Emission Reduction during the 14th Five-Year Plan Period [47], Hunan Province has established clear energy efficiency targets, aiming to reduce energy consumption per unit of GDP by 14% from the 2020 baseline by 2025. Based on this policy direction, this study assumes an average annual decrease in energy intensity of 3.5% between 2023 and 2030 under the baseline scenario. In the high-carbon scenario, due to a slowdown in energy efficiency improvements, the annual average reduction is 3.0%; in the low-carbon scenario, due to the enhanced application of energy-saving technologies, the annual average reduction is 4.0%. After 2031, the reduction rate increases by 0.2–0.5 percentage points in each phase; in the low-carbon scenario, the annual average reduction reaches 5.0% from 2036 to 2040, aligning with the requirements for deep decarbonization.
(8)
Number of Construction Industry Employees
From 2019 to 2022, the average annual growth rate of the construction workforce in Hunan Province was 2.0%. The Hunan Province 14th Five-Year Plan for the Development of the Construction Industry [46] sets forth the development goal of “promoting the transformation of the construction industry from scale expansion to quality and efficiency and achieving steady growth and structural optimization of the workforce.” Taking into account the pace of promotion of smart construction and prefabricated buildings in Hunan Province, the growth rate of the construction workforce is set at 1.8% under the 2023–2030 baseline scenario. Under the high-carbon scenario, due to the continuation of labor-intensive models, the annual growth rate is set at 2.2%; In the low-carbon scenario, as the promotion of smart construction reduces reliance on labor, the annual growth rate is set at 1.2%. After 2031, the growth rate will be reduced by 0.3 percentage points in each phase to align with changes in labor demand resulting from the industry’s intelligent transformation. Specific figures are shown in Table 7.

4.2. Construction of the Cnn-Lstm-Attention Model

To screen predictive models, we first conducted a comparative analysis of the training performance between a single traditional machine learning model and a deep learning model, evaluating the suitability of both models using multi-dimensional metrics. Using carbon emissions data from the construction industry in Hunan Province, we selected data from the first 13 years as the training set and data from the subsequent 5 years as the test set to perform model training and prediction. The analysis results are shown in Table 8.
Based on the performance of each evaluation metric, the LSTM model outperformed the other models in terms of R2, RMSE, and MAE, while the GRU model ranked second in all three metrics. The LSTM’s coefficient of determination (R2) was 0.932, which is 0.43% higher than the GRU’s 0.928, indicating that the LSTM model is more capable of explaining and predicting changes in the target variable using input features; Regarding the root mean square error (RMSE) metric, the LSTM model recorded 0.153, which is 3.54% lower than the GRU model’s 0.158. This indicates that the LSTM model’s overall prediction results deviate less from the actual values, demonstrating superior comprehensive predictive performance; Regarding the Mean Absolute Error (MAE), the LSTM model recorded 0.124, which is 4.19% lower than the GRU’s 0.129. This indicates that in traditional machine learning models and single deep learning models, the absolute deviation between the LSTM model’s predictions and the actual observed values have been significantly reduced, the model demonstrates superior absolute predictive accuracy [48,49].
Therefore, based on the above analysis, the single-layer deep prediction model LSTM outperforms other models across all metrics. While incorporating it into the prediction model, we acknowledge that the LSTM model is not well-suited for multi-factor extraction [50]. Consequently, we will build upon the selected LSTM by adding a multi-module fusion structure to determine the most suitable model for this study. The core logic of the hybrid model combines time-series decomposition, feature extraction, time-series modeling, attention mechanisms, and theoretical frameworks [51]. Given the multi-scenario influencing factors, univariate time-series decomposition is excluded [49]. Since the dataset consists of small-sample data, self-attention models are excluded to prevent overfitting [52]. As the data represents annual-level carbon emissions without distinct monthly or quarterly fluctuations, multi-scale convolutional kernels that generate redundant features were excluded [53]. Given multiple influencing factors, models limited to univariate time-series were excluded [54]. Since there are no clear network connections between the influencing factors, convolutional graph networks were excluded [55]. In summary, performance validation was conducted using two basic hybrid models: feature extraction + time-series modeling and time-series modeling + attention.
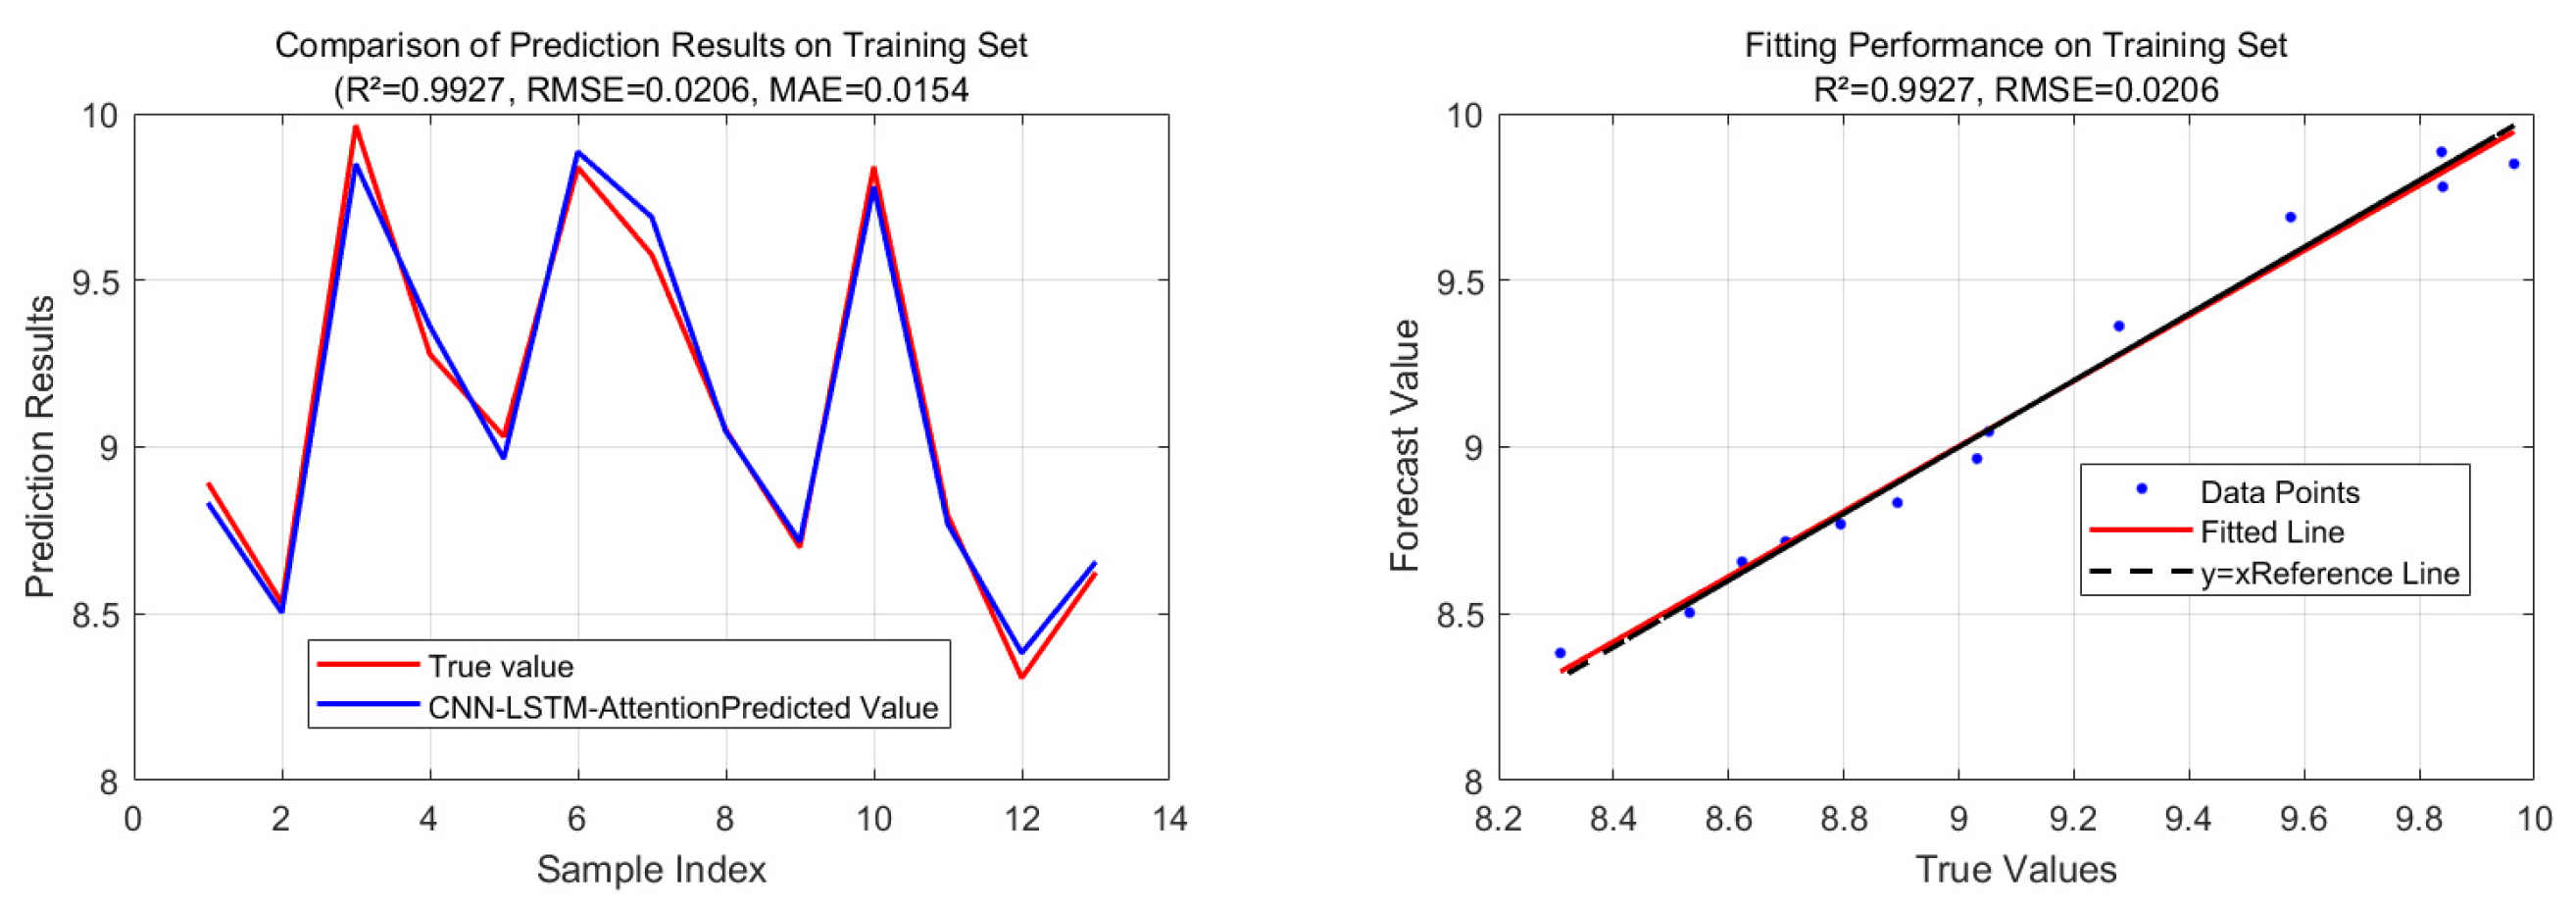
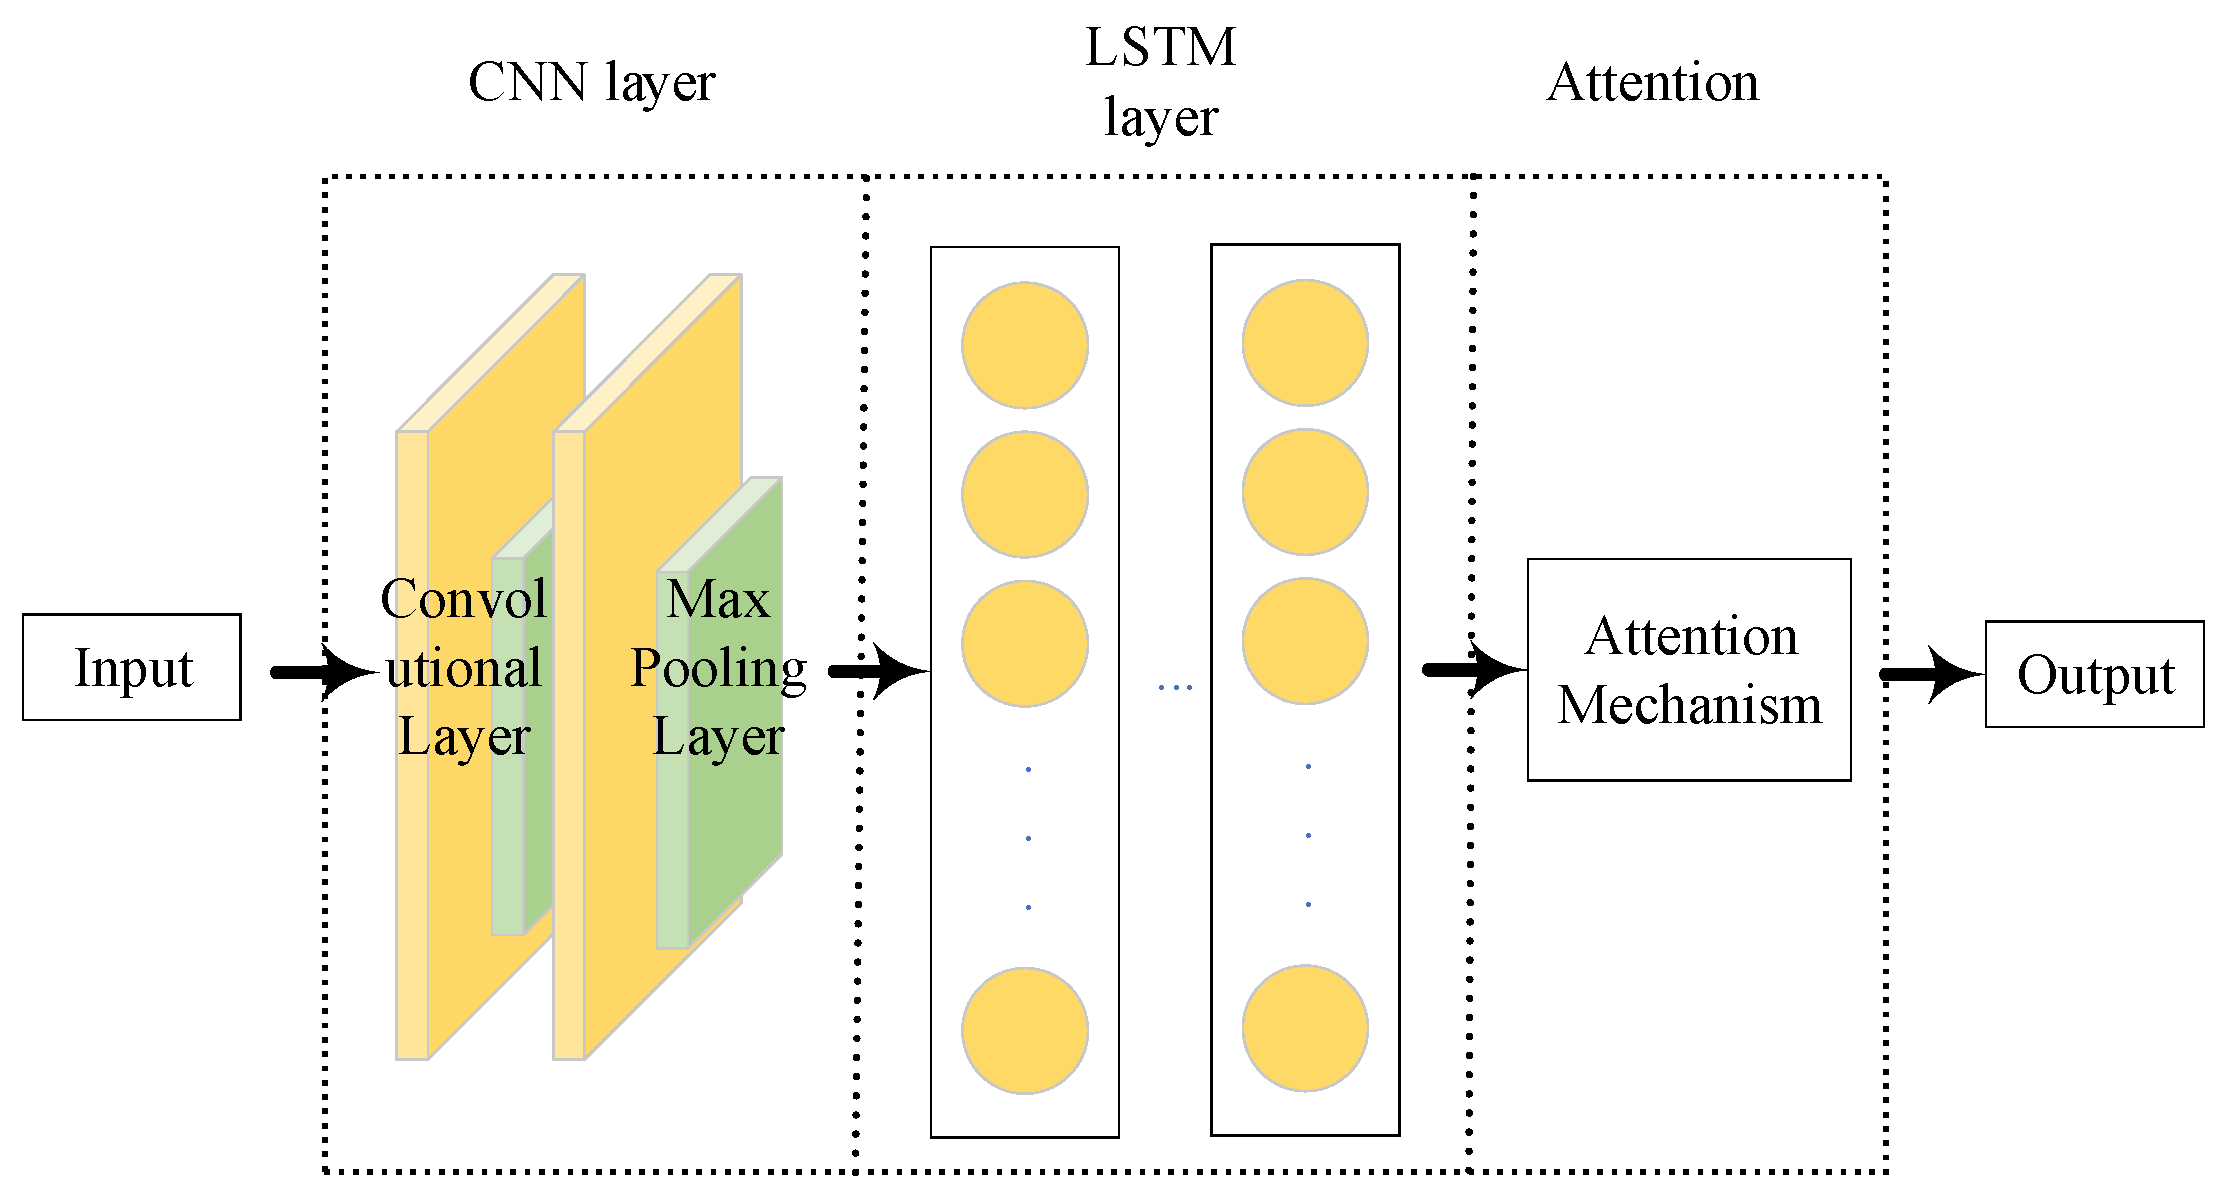
As shown in Table 8, examining the performance limits and shortcomings of the dual-module hybrid models: the standalone CNN-LSTM model achieved an R2 of 0.968 and an RMSE of 0.082, successfully combining feature extraction with time-series modeling. However, due to the absence of an attention mechanism, it could not focus on core influencing factors such as energy intensity and the scale of the construction industry, resulting in critical information being overwhelmed by redundant features [56]; The LSTM-Attention model achieved an R2 of 0.958 and an RMSE of 0.102. Although it could focus on key information in the temporal dimension through the attention mechanism, it lacked the multi-factor feature extraction stage provided by the CNN module, making it unable to uncover the nonlinear synergistic relationship between industrial scale and energy intensity [57]. Its performance was slightly lower than that of the CNN-LSTM model, revealing significant shortcomings. Based on the above analysis, the two-module model faces an insurmountable performance ceiling. Only through the synergy of the three-module CNN + LSTM + Attention architecture can the threefold shortcomings in feature extraction, temporal modeling, and key information focusing be simultaneously addressed. Furthermore, the model’s R2 reached 99.3%, indicating that it can capture 99.3% of the influencing factors and variation patterns of carbon emissions in Hunan Province’s construction industry, demonstrating excellent fitting performance. The schematic diagram of the CNN-LSTM-Attention model architecture is shown in Figure 7. At the same time, the training set prediction results for the CNN-LSTM-Attention model are shown in Figure 8.
Eight influencing factors are taken as input data, and the annual carbon emissions are taken as output data. In the model structure, the CNN module adopts 2 convolutional layers, with 32 convolution kernels in the first layer and 64 convolution kernels in the second layer, both using ReLU activation. The LSTM module adopts a Dropout layer with 30% probability to prevent overfitting. The Adam adaptive optimizer is used, with a learning rate of 0.0001, 120 iterations, and a batch size of 8. The Attention module implements the Squeeze-and-Excitation (SE) attention mechanism, which adaptively adjusts the feature weights through the dependencies between channels.

4.3. Analysis of Prediction Results

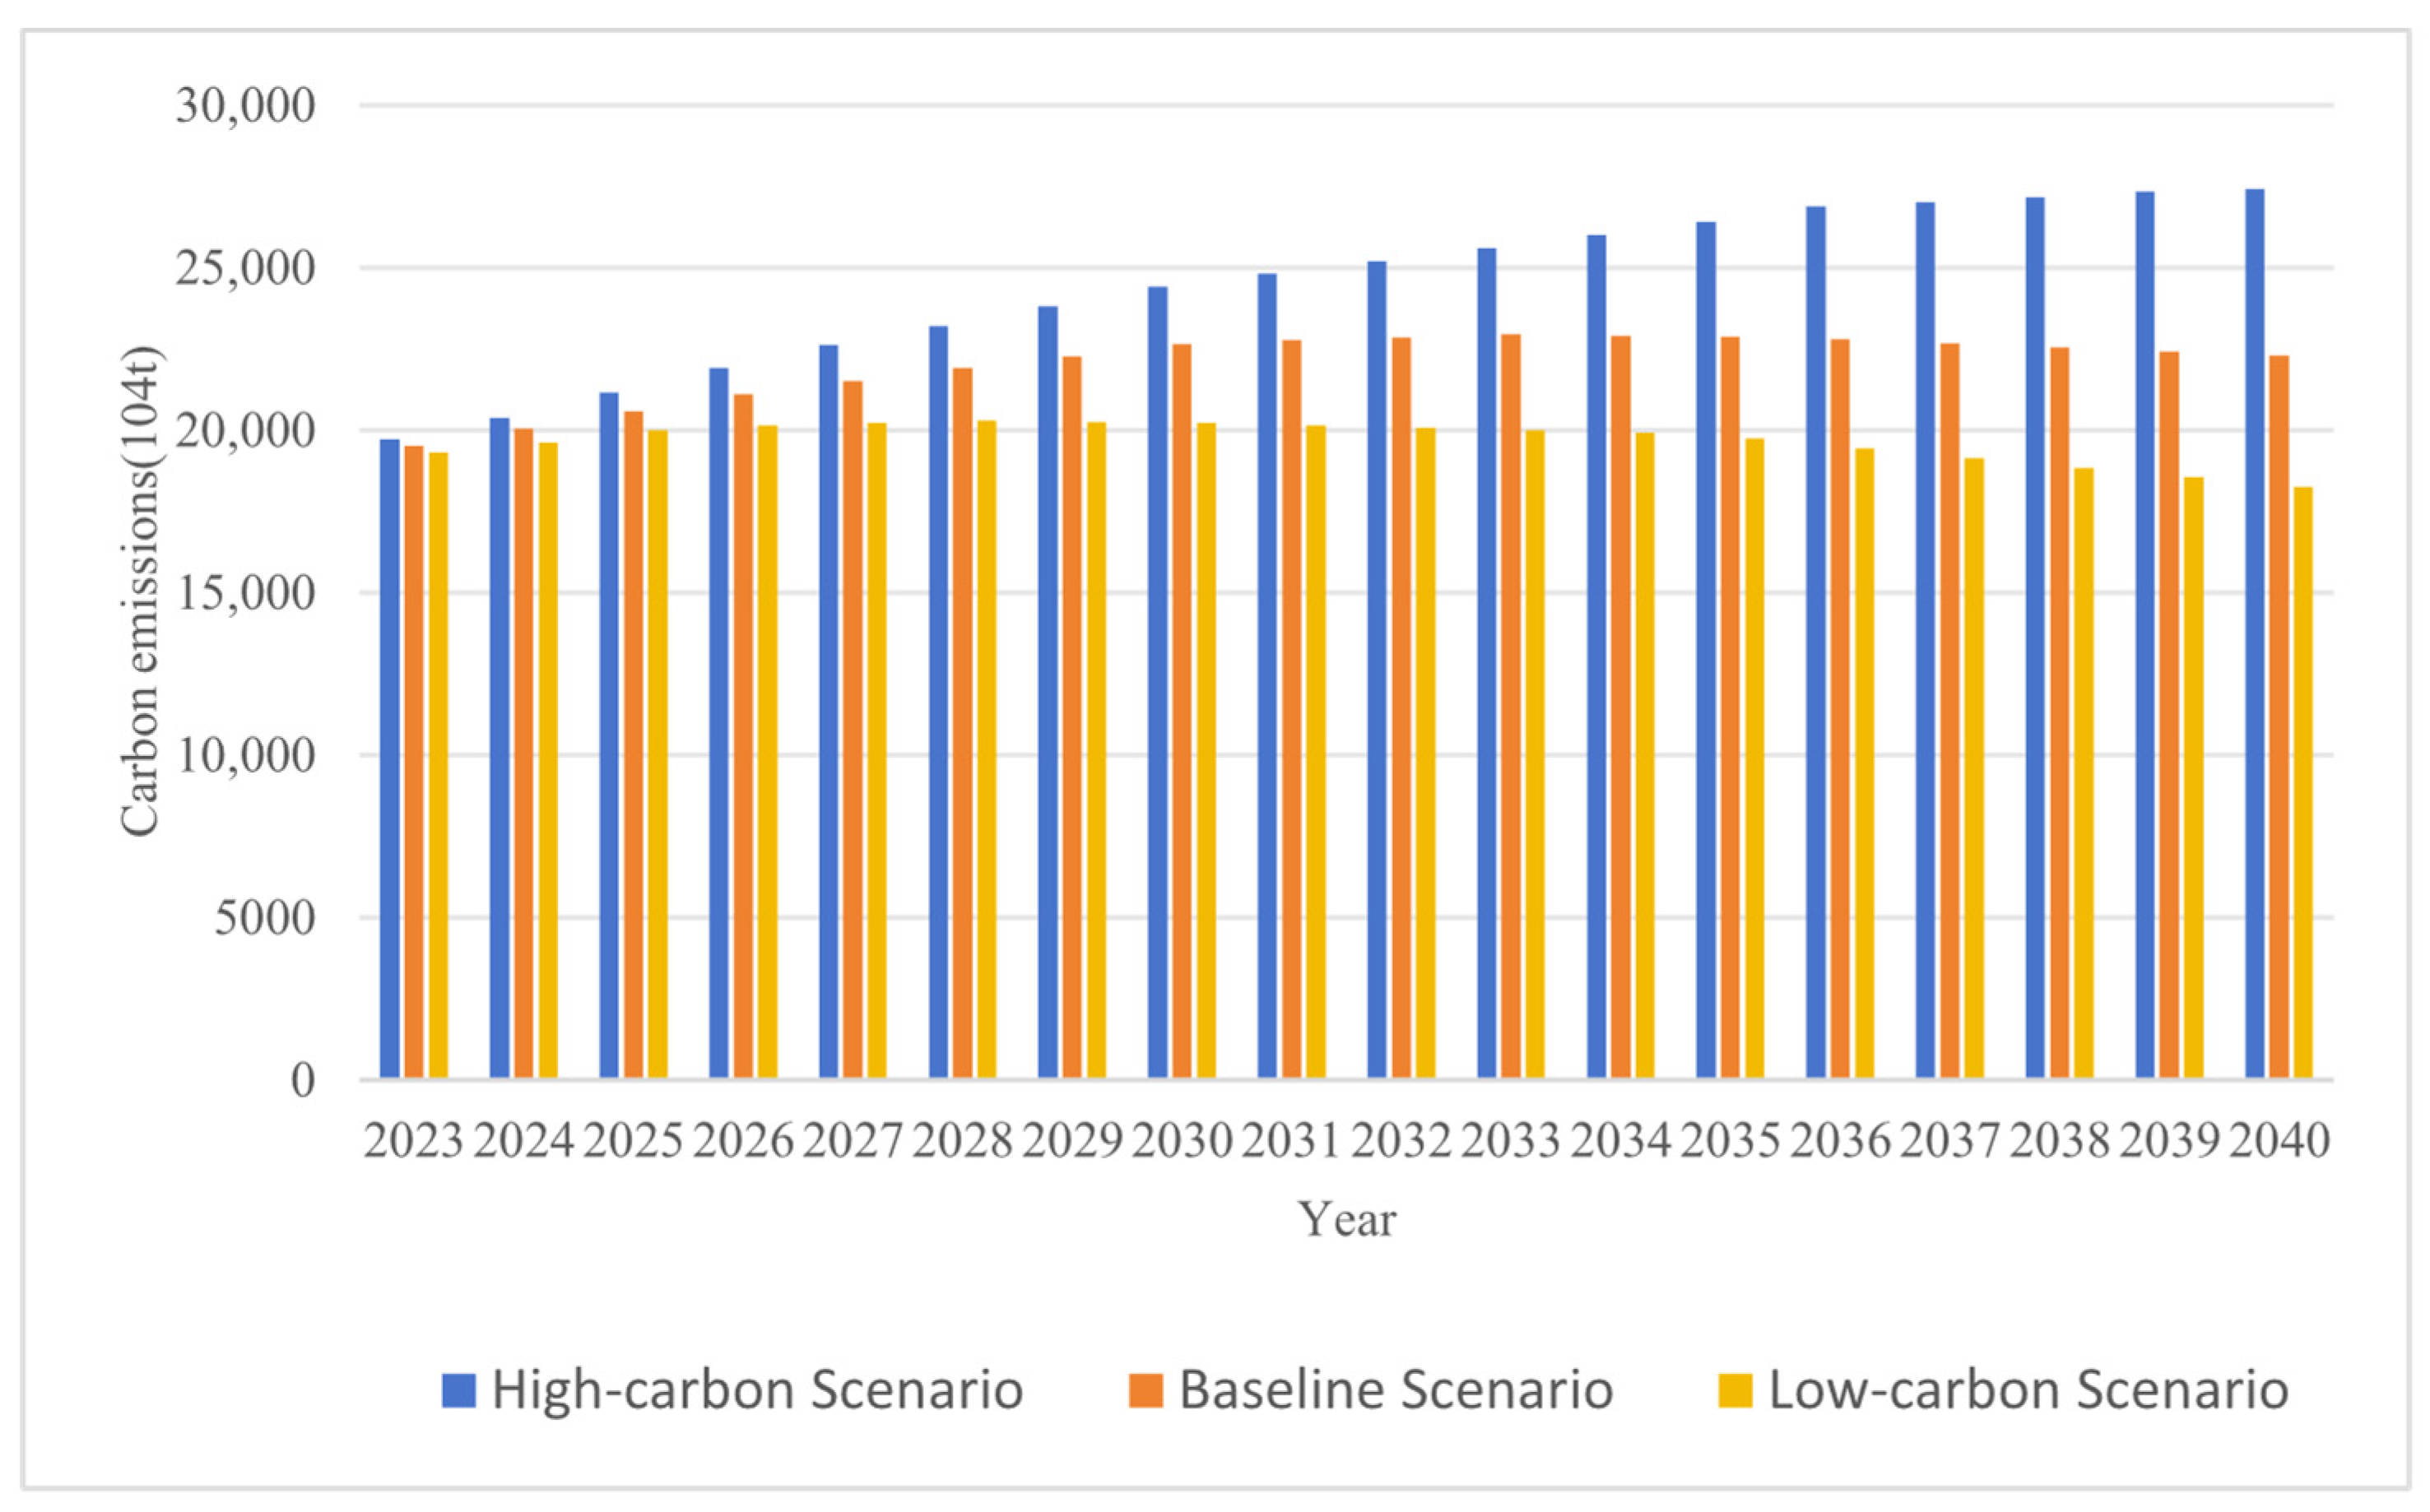
Figure 9 shows the projected carbon emissions for the construction sector in Hunan Province under different scenarios.
Under the High-carbon Scenario, carbon emissions from Hunan’s construction industry rise from 197.1024 Mt in 2023 to 274.2126 Mt in 2040, failing to achieve carbon peak. Although the growth rate slows in the later stage, total emissions remain at an elevated level. This is mainly attributed to the continuation of the traditional development model in this scenario: the absence of targeted carbon emission reduction policies, and no effective innovation in energy structure and technical systems. The scale expansion of the construction industry, coupled with its long-term reliance on high energy-consumption modes, creates enormous pressure for carbon emission control. This trend runs counter to the carbon peak target, and effective measures must be taken to reverse it.
Under the baseline scenario, the construction industry evolves naturally in line with existing policies, and carbon emissions follow a trajectory of initial growth followed by gradual stabilization. Specifically, carbon emissions maintain a continuous growth trend from 2022 to 2033, reaching a peak of 229.3977 Mt in 2033, and then decline slowly to 222.9602 Mt in 2040. While existing low-carbon policies have curbed the emission growth rate, the lack of mandatory restrictive policies and disruptive low-carbon technologies results in a 5-year delay in carbon peak timing, a 26.5369 Mt higher peak value compared with the low-carbon scenario, and insufficient endogenous momentum for emission reduction after the peak.
The low-carbon scenario is identified as the optimal pathway to achieve China’s Dual Carbon Goals. Under this scenario, carbon emissions grow slowly from 2022 to 2028, reaching a peak of 202.8608 Mt, and subsequently drop to 182.6471 Mt in 2040, representing a 9.96% reduction from the peak and a 3.01% decrease compared with the 2022 baseline level. This outstanding emission reduction performance is mainly attributed to the synergy between strengthened policy regulation and technological innovation. Through a series of initiatives including the popularization of prefabricated buildings and scaled-up energy-saving retrofitting of existing buildings, a cumulative emission reduction of 374.155 Mt is achieved from 2029 to 2040 relative to the baseline scenario. This result fully verifies that this pathway is the most practically valuable strategic choice for carbon governance in the regional construction sector.

5. Discussion

This section discusses the key findings, comparisons with existing literature, policy implications, research limitations, and future directions of this study.

5.1. Key Findings and Interpretation

This study identifies three key characteristics of carbon emissions in Hunan Province’s construction industry and analyzes their underlying drivers in light of the region’s industrial development stage, rather than merely providing a repetitive description of the results.
First, indirect carbon emissions have long accounted for over 90% of total emissions, making them the primary source of emissions in the industry. This characteristic stems from the fact that Hunan’s construction industry continues to rely primarily on expansion through new construction projects. Major projects such as the development of the Changsha-Zhuzhou-Xiangtan metropolitan area have generated massive, inelastic demand for building materials. However, the local building materials industry is centered on high-carbon production capacities such as cement and steel, and the large-scale application of green building materials remains insufficient [58]. Consequently, embodied carbon emissions from upstream building materials production have become the dominant source of emissions, clarifying that the core direction for industry emission reduction must extend to the upstream supply chain.
Second, the scale of the construction industry and population size are the most critical positive drivers of carbon emissions. This driving mechanism is rooted in the fact that Hunan Province’s urbanization rate of 60.3% remains in the mid-to-late stage of rapid quality improvement. Coupled with the concentrated implementation of infrastructure and housing projects under the “Three Highs and Four News” strategy, the industry’s growth relies heavily on scale expansion rather than technological upgrades and efficiency improvements. This is also a common characteristic of the urbanization development stage in central Chinese provinces [59].
Third, energy intensity is the only significant negative restraining factor. This reflects that Hunan’s construction industry remains in an early emission-reduction phase centered on energy efficiency improvements. The penetration rates of smart construction and green building technologies remain low, and the emission-reduction effects of technological innovation and structural optimization have not yet been fully realized. Only energy efficiency measures such as equipment upgrades and clean energy substitution can achieve direct and significant emission reductions. Furthermore, the positive driving effects of per capita GDP, total construction output value, and value added in the tertiary sector confirm that regional economic development will continue to be accompanied by a rigid increase in construction sector carbon emissions in the short term.

5.2. Comparison with Previous Studies

The findings of this study align with the prevailing consensus in the existing literature while also highlighting the regional distinctiveness of central provinces. Furthermore, they confirm the representativeness of the identified driving mechanisms for similar provinces in central China.
Regarding core conclusions, this study aligns with the findings of national-level studies by Tong et al. [5] and Fan et al. [7], confirming that population urbanization, economic development levels, and industrial scale are the core positive drivers of carbon emissions in the construction sector, while energy efficiency is the core mitigating factor. This validates the robustness of the STIRPAT model in analyzing these driving mechanisms.
At the regional research level, this study fills a gap in differentiated research on major construction provinces in Central China. In terms of representativeness, the identified driving mechanism—“scale expansion and urbanization as drivers, with energy efficiency improvement as the core emission reduction lever”—is universally applicable to Central Chinese provinces such as Hubei, Jiangxi, and Anhui, which are similarly in the middle to late stages of urbanization and primarily engaged in incremental construction [60]. This provides a paradigmatic reference for research on similar regions. In terms of specificity, the construction industry in Hunan Province contributes 29% to regional GDP, ranking among the highest in central China; consequently, the carbon emission driving effect of industrial scale is more pronounced. Simultaneously, due to ecological constraints imposed by the “Great Protection of the Yangtze River,” the emission reduction elasticity of energy intensity is higher than in resource-based provinces in central China, forming unique driving characteristics adapted to the local stage of development [61].
In terms of methodology and peak emission forecasting, the CNN-LSTM-Attention hybrid model constructed in this study achieves an R2 of 0.993, significantly outperforming traditional single-model approaches and addressing the accuracy bottleneck in forecasting small-sample, multivariate time-series data; It also clearly indicates that under a low-carbon scenario, Hunan’s construction sector can achieve carbon peaking by 2028, aligning with the policy requirement to peak before 2030. This fills a gap in research on carbon peaking pathways for the construction sector at the provincial level in Hunan and resonates with the overall 2025–2035 carbon peaking forecast range for China’s construction sector [42].

5.3. Policy and Practical Implications

This further supplements existing single-indicator approaches for carbon emission analysis and policy design in the construction industry. The findings of this study provide four key policy recommendations for the low-carbon transition of Hunan Province’s construction industry:
First, strictly control the industry’s extensive expansion and promote a shift from incremental growth to quality improvement and high-quality development of the existing building stock;
Second, focus on the primary sources of indirect emissions, accelerate the large-scale adoption of green building materials and prefabricated construction, and reduce the embodied carbon of buildings;
Third, strengthen energy efficiency improvements and the substitution of clean energy to fully leverage the core emission reduction effects of energy intensity;
Fourth, establish a regulatory system for accounting for carbon emissions across the entire building life cycle to support the implementation of carbon trading and green finance policies.

5.4. Research Limitations

This study has three limitations:
First, the data period covered by the study is 2005–2022. Due to the release cycle of official statistics, the latest data from 2023 and beyond were not included. Industry trends since 2023 may have a slight impact on the short-term forecast results: the post-pandemic economic recovery has driven a rebound in construction project commencement rates, which may lead to a temporary increase in carbon emissions; Conversely, the continued strengthening of policies related to green buildings and smart construction in Hunan Province, coupled with a decline in new construction floor area resulting from adjustments in the real estate market, will offset the growth in emissions and reinforce the emission reduction effects [42]. Since these trends were not incorporated into the model training or scenario design, there may be slight deviations between the short-term forecast values for 2023–2025 and actual values; however, this does not alter the long-term trends or core conclusions regarding carbon emission evolution across the three scenarios.
Second, the study focuses on the provincial level as a whole and does not examine spatial variations in carbon emissions at the municipal level within the province, thus failing to capture the distinct characteristics of different regions within the province.
Third, carbon emissions are calculated using the carbon emission factor method, which does not provide a more detailed breakdown of emissions across all stages of a building’s life cycle; therefore, there is room for improvement in the accuracy of the calculations.

5.5. Future Research Directions

Given the aforementioned limitations, future research could be expanded in four directions:
First, incorporate the latest data from 2023 and beyond, optimize the model and scenario settings in light of new industry trends, and conduct dynamic rolling forecasts;
Second, conduct spatiotemporal dynamic analysis at the municipal level to reveal regional heterogeneity in carbon emissions within Hunan Province’s construction sector;
Third, introduce Life Cycle Assessment (LCA) methods to achieve detailed accounting of carbon emissions across all stages of building construction;
Fourth, integrate policy simulation models such as system dynamics to design differentiated emission reduction pathways for different building types, and on this basis, carry out cross-regional comparative studies across the six central provinces of China to verify the regional applicability of the driving mechanisms identified in this study.

6. Conclusions

First, from 2005 to 2022, carbon emissions in Hunan Province’s construction industry showed an overall upward trend, with indirect carbon emissions accounting for over 90% of the total for an extended period, making them the primary source of carbon emissions in the sector; Analysis using the STIRPAT model and ridge regression confirmed that the scale of the construction industry is the most significant positive driver, while energy intensity is the sole key negative factor. Population size has the greatest impact on carbon emissions in Hunan’s construction sector, followed by the scale of the construction industry, urbanization rate, number of construction industry employees, energy intensity, value added of the tertiary sector, and gross output value of the construction industry. Per capita GDP has the least impact.
Second, the CNN-LSTM-Attention hybrid deep learning model constructed in this study achieved a goodness-of-fit R2 of 0.993. Its predictive accuracy significantly outperforms traditional machine learning, single-module, and dual-module deep learning models. It effectively adapts to the small-sample, multivariate, and nonlinear characteristics of construction sector carbon emission time-series data, overcoming the accuracy limitations of existing single-model approaches.
Third, the carbon emission peaking patterns of Hunan’s construction sector differ significantly across the three development scenarios: the high-carbon scenario fails to achieve carbon peaking; the baseline scenario peaks in 2033 but lags behind the 2030 policy requirement; and the low-carbon scenario can achieve carbon peaking as early as 2028, representing the optimal path for the industry’s low-carbon transition. This can be achieved by strictly controlling the industry’s extensive expansion, strengthening energy efficiency improvements, and promoting the synergistic efforts of policies and technologies to ensure the implementation of the carbon peaking target.

Author Contributions

Conceptualization, L.Z. and Y.H.; Methodology, Y.H.; Software, Y.H.; Validation, L.Z. and H.W.; Formal Analysis, Y.H.; Investigation, L.Z.; Resources, H.W.; Data Curation, Y.H.; Writing—Original Draft, Y.H.; Writing—Review and Editing, L.Z. and H.W.; Visualization, Y.H.; Supervision, H.W.; Project Administration, H.W.; Funding Acquisition, H.W. All authors have read and agreed to the published version of the manuscript.

Funding

This research received no external funding.

Data Availability Statement

All data used in this study are derived from publicly available statistical yearbooks (China Energy Statistical Yearbook, China Construction Industry Statistical Yearbook) and are fully presented in the manuscript and its figures/tables. No additional datasets are required for the reproduction of the results.

Conflicts of Interest

The authors declare no conflicts of interest.

References

  1. Li, Z.; Yan, T.; Du, Y. Scenario-based simulation of carbon storage in Chengdu using MCCA–InVEST: Land use change, spatial patterns, and driving mechanisms. Carbon Balance Manag. 2025, 20, 40. [Google Scholar] [CrossRef] [Scilit]
  2. Zhang, Y.; Chen, Y. Evolutionary game analysis of carbon emission reduction in transportation infrastructure construction under dual regulation. Heliyon 2024, 10, e38223. [Google Scholar] [CrossRef] [Scilit] [PubMed]
  3. Cai, Y.; Duan, H.; Luo, Z.; Duan, Z.; Wang, X. Dynamic driving mechanism of dual structural effects on the correlation between economic growth and CO2 emissions: Evidence from a typical transformation region. Int. J. Environ. Res. Public Health 2022, 19, 3970. [Google Scholar] [CrossRef] [Scilit]
  4. Hunan Provincial Department of Housing and Urban-Rural Development; Hunan Provincial Development and Reform Commission. The Implementation Plan for Carbon Peak in Urban and Rural Construction of Hunan Province; Hunan Provincial Department of Housing and Urban-Rural Development: Changsha, China, 2023.
  5. Tong, X.; Guo, S.; Duan, H.; Duan, Z.; Gao, C.; Chen, W. Carbon-emission characteristics and influencing factors in growing and shrinking cities: Evidence from 280 Chinese cities. Int. J. Environ. Res. Public Health 2022, 19, 2120. [Google Scholar] [CrossRef] [Scilit]
  6. Yu, J.; Yu, Y.; Jiang, T. Structural factors influencing energy carbon emissions in China’s service industry: An input-output perspective. Environ. Sci. Pollut. Res. 2022, 29, 49361–49372. [Google Scholar] [CrossRef] [Scilit]
  7. Fan, J.-L.; Cao, Z.; Zhang, X.; Wang, J.-D.; Zhang, M. Comparative study on the influence of final use structure on carbon emissions in the Beijing-Tianjin-Hebei region. Sci. Total Environ. 2019, 668, 271–282. [Google Scholar] [CrossRef] [Scilit] [PubMed]
  8. Zagheni, E.; Billari, F.C. A cost valuation model based on a stochastic representation of the IPAT equation. Popul. Environ. 2007, 29, 68–82. [Google Scholar] [CrossRef] [Scilit]
  9. Lu, M.; Li, H.; Yang, X. An Overview of the Carbon Emission Standard Management System in China: Weaknesses and a Way Forward. Sustainability 2025, 17, 1296. [Google Scholar] [CrossRef] [Scilit]
  10. Li, X.; Lin, C.; Lin, M.; Jim, C.Y. Drivers and spatial patterns of carbon emissions from residential buildings: An empirical analysis of Fuzhou city (China). Build. Environ. 2024, 257, 111534. [Google Scholar] [CrossRef] [Scilit]
  11. Li, F.; Sun, M.; Xian, Q.; Feng, X. MDL: Industrial carbon emission prediction method based on meta-learning and diff long short-term memory networks. PLoS ONE 2024, 19, e0307915. [Google Scholar] [CrossRef] [Scilit]
  12. Tang, Y.; Jiang, H. Analysis of the decoupling effect and driving factors of carbon emissions from the transportation sector in Guangdong Province. Sci. Rep. 2024, 13, 18744. [Google Scholar] [CrossRef] [Scilit]
  13. GB/T 2589-2020; General Rules for Calculation of the Comprehensive Energy Consumption. Standardization Administration of China (SAC): Beijing, China, 2020.
  14. National Bureau of Statistics of the People’s Republic of China. China Energy Statistical Yearbook (2022); China Statistics Press: Beijing, China, 2022.
  15. Ministry of Housing and Urban-Rural Development of the People’s Republic of China. China Construction Industry Statistical Yearbook; China Statistics Press: Beijing, China, 2022.
  16. National Development and Reform Commission of the People’s Republic of China. Guidelines for the Preparation of Provincial Greenhouse Gas Inventories (Trial); National Development and Reform Commission: Beijing, China, 2011.
  17. GB/T 51366-2019; Standard for Building Carbon Emission Calculation. Ministry of Housing and Urban-Rural Development of the People’s Republic of China: Beijing, China; China Architecture & Building Press: Beijing, China, 2019.
  18. Wang, M.Q.; Huang, B.; Yuan, H.; Tang, Y.; Mao, J.; Xiong, L. Development of a carbon emission calculation and evaluation grading framework for public building certification schemes: Integrating BIM and LCA. Smart Sustain. Built Environ. 2025, 1–30. [Google Scholar] [CrossRef] [Scilit]
  19. Chen, L.; Yang, H.-N.; Xiao, Y.; Tang, P.-Y.; Liu, S.-Y.; Chang, M.; Huang, H. Exploring spatial pattern optimization path of urban building carbon emission based on low-carbon cities analytical framework: A case study of Xi’an, China. Sustain. Cities Soc. 2024, 111, 105551. [Google Scholar] [CrossRef] [Scilit]
  20. Al-Ahmad, A.K.; Hajar, H.A.A.; Hatamleh, M.T. Multi-Dimensional sustainability assessment of the construction sector in Jordan. Results Eng. 2026, 29, 109874. [Google Scholar] [CrossRef] [Scilit]
  21. Li, M.; Chen, W.; Song, J.; Zhang, S. Research on economic and social impact of carbon emissions in the construction industry at a regional scale: A case of Shandong, China. Environ. Sci. Pollut. Res. 2023, 30, 86437–86453. [Google Scholar] [CrossRef] [Scilit]
  22. Han, B.; Clevenger, C.M. Augmented Reality and Mixed Reality Implementation Status Survey in the Architecture, Engineering, and Construction Industry: Benefits, Limitations, and Future Directions. J. Archit. Eng. 2025, 31, 04025017. [Google Scholar] [CrossRef] [Scilit]
  23. Elsaid, M.; Albasyouni, W. Assessing the impact of infection rate on the productivity of resources in the construction industry: Lessons from COVID-19 pandemic. Rev. Constr. 2025, 24, 491–504. [Google Scholar]
  24. Sun, X.; Zhang, X. Assessment and Driving Factors of Embodied Carbon Emissions in the Construction Sector: Evidence from 2005 to 2021 in Northeast China. Sustainability 2024, 16, 5681. [Google Scholar] [CrossRef] [Scilit]
  25. Shah, S.K.; Graham, P.; Burton, C.; Harrington, P. An Assessment of Long-Term Climate Change on Building Energy in Indonesia. Energies 2023, 16, 7231. [Google Scholar] [CrossRef] [Scilit]
  26. Assemlali, H.; Bouhsissin, S.; Sael, N. Deep learning-driven CNN model for detection and classification of dynamic obstacles. Green Energy Intell. Transp. 2026, 5, 100334. [Google Scholar] [CrossRef] [Scilit]
  27. Li, S.X.; Qin, H.G.; Xia, F.Y.; Xu, X.; Cai, Y. Application of LSTM coupled models in runoff simulation and prediction: A review. Appl. Water Sci. 2026, 16, 89. [Google Scholar] [CrossRef] [Scilit]
  28. Zhang, C.; Luo, H. Research on carbon emission peak prediction and path of China’s public buildings: Scenario analysis based on LEAP model. Energy Build. 2023, 289, 113053. [Google Scholar] [CrossRef] [Scilit]
  29. Zhang, L.Y.; Lin, X.; Hui, E.C.M.; Shen, J.F. Health resilience of green buildings in a Dense City: Evidence from COVID-19 infections in Hong Kong. Cities 2026, 173, 106975. [Google Scholar] [CrossRef] [Scilit]
  30. Zhang, P.; Luo, Y.; Yu, Q.; Zhou, Z. Air transportation carbon dioxide emission forecasting: An improved back propagation neural network. PLoS ONE 2025, 20, e0333226. [Google Scholar] [CrossRef] [Scilit] [PubMed]
  31. Zinilli, A.; Tuccari, G.G.; Poggi, F.; Nuzzolese, A.G.; Mongiovì, M.; Giammei, L.; Paolillo, R.; Longo, C.F.; Ceriani, M.; Zuppiroli, S. Anatomy of climate change research in Italian doctoral dissertations using a machine learning approach. Sci. Rep. 2025, 15, 38095. [Google Scholar] [CrossRef] [Scilit] [PubMed]
  32. Liu, H.; Guo, R.; Tian, J.; Sun, H.; Wang, Y.; Li, H.; Yao, L. Quantifying the Carbon Reduction Potential of Recycling Construction Waste Based on Life Cycle Assessment: A Case of Jiangsu Province. Int. J. Environ. Res. Public Health 2022, 19, 12628. [Google Scholar] [CrossRef] [Scilit]
  33. Ran, Q.; Bu, F.; Razzaq, A.; Ge, W.; Peng, J.; Yang, X.; Xu, Y. When will China’s industrial carbon emissions peak? Evidence from machine learning. Environ. Sci. Pollut. Res. Int. 2023, 30, 57960–57974. [Google Scholar] [CrossRef] [Scilit]
  34. Zhang, Z.; Xie, H.; Zhang, J.; Wang, X.; Wei, J.; Quan, X. Prediction and Trend Analysis of Regional Industrial Carbon Emission in China: A Study of Nanjing City. Int. J. Environ. Res. Public Health 2022, 19, 7165. [Google Scholar] [CrossRef] [Scilit]
  35. Wei, Z.; Wei, K.; Liu, J. Decoupling relationship between carbon emissions and economic development and prediction of carbon emissions in Henan Province: Based on Tapio method and STIRPAT model. Environ. Sci. Pollut. Res. 2023, 30, 52679–52691. [Google Scholar] [CrossRef] [Scilit]
  36. Zhang, Z.; Xiao, Y.; Zhang, K.; Tang, M.; Ma, T. The impact of China pilot carbon market policy on electricity carbon emissions. Sci. Rep. 2025, 15, 16415. [Google Scholar] [CrossRef] [Scilit]
  37. Junjia, Y.; Alias, A.H.; Haron, N.A.; Bakar, N.A. Identification and analysis of hoisting safety risk factors for IBS construction based on the AcciMap and cases study. Heliyon 2023, 10, e23587. [Google Scholar] [CrossRef] [Scilit]
  38. Li, C.; Zhang, Z.; Wang, L. Carbon peak forecast and low carbon policy choice of transportation industry in China: Scenario prediction based on STIRPAT model. Environ. Sci. Pollut. Res. 2023, 30, 63250–63271. [Google Scholar] [CrossRef] [Scilit]
  39. Cao, L.; Chong, P. Exploring the low-carbon development path of resource-based cities based on scenario simulation. Sci. Rep. 2025, 15, 5836. [Google Scholar] [CrossRef] [Scilit]
  40. People’s Government of Hunan Province. Plan for Carbon Peak in Hunan Province; People’s Government of Hunan Province: Changsha, China, 2022.
  41. People’s Government of Hunan Province. The 14th Five-Year Plan for National Economic and Social Development and the Long-Range Objectives Through the Year 2035 of Hunan Province; People’s Government of Hunan Province: Changsha, China, 2021.
  42. Xia, Y.; Yang, Z.; Jiang, X.; Wang, H. The road to carbon neutrality in China’s building sector. iScience 2024, 27, 110664. [Google Scholar] [CrossRef] [Scilit]
  43. People’s Government of Hunan Province. Hunan Province 14th Five-Year Plan for New-Type Urbanization; People’s Government of Hunan Province: Changsha, China, 2021.
  44. People’s Government of Hunan Province. Hunan Provincial Territorial and Spatial Plan (2021–2035); People’s Government of Hunan Province: Changsha, China, 2025.
  45. People’s Government of Hunan Province. Hunan Province Carbon Peaking Implementation Plan; People’s Government of Hunan Province: Changsha, China, 2022.
  46. Department of Housing and Urban-Rural Development of Hunan Province. The 14th Five-Year Plan for the Development of the Construction Industry in Hunan Province; Department of Housing and Urban-Rural Development of Hunan Province: Changsha, China, 2021.
  47. People’s Government of Hunan Province. Comprehensive Implementation Plan for Energy Conservation and Emission Reduction During the 14th Five-Year Plan Period; People’s Government of Hunan Province: Changsha, China, 2022.
  48. Tang, Y.; He, J.; Guo, X. Coupling and coordination mechanism and sustainable path of water resources-ecological environment-socio-economic system in Zhengzhou urban agglomeration. Sci. Rep. 2025, 15, 37811. [Google Scholar] [CrossRef] [Scilit] [PubMed]
  49. Li, J.; Guo, Y. A hybrid model for carbon price forecasting based on SSA-NSTransformer: Considering the role of multi-stage carbon reduction targets. J. Environ. Manag. 2025, 375, 124237. [Google Scholar] [CrossRef] [Scilit] [PubMed]
  50. Wang, X.; Zhao, J.; Li, Y.; Li, Z. Optimized design and performance evaluation of long-pressure-short-extraction ventilation and dust removal system based on the Coanda effect. Front. Artif. Intell. 2025, 8, 1565889. [Google Scholar] [CrossRef] [Scilit] [PubMed]
  51. Borré, A.; Seman, L.O.; Camponogara, E.; Stefenon, S.F.; Mariani, V.C.; Coelho, L.D.S. Machine Fault Detection Using a Hybrid CNN-LSTM Attention-Based Model. Sensors 2023, 23, 4512. [Google Scholar] [CrossRef] [Scilit]
  52. Salhi, A.; Algarni, F.; Alshamrani, R.; Althbiti, A.; Ismail, A.; Hassan, B.M. Leveraging artificial intelligence to enable sustainable urban development through the creation of smart and environmentally friendly carbon-free cities. Sci. Rep. 2025, 15, 35791. [Google Scholar] [CrossRef] [Scilit]
  53. Ma, L.; Ma, J.; Zelminbek, M.; Zhang, W. High-Resolution Reconstruction of Temperature Fields Based on Improved ResNet18. Sensors 2024, 24, 6564. [Google Scholar] [CrossRef] [Scilit]
  54. Du, Y.; Xie, Z.; Yang, Z.; Xiong, W.; Zhou, L.; Zhang, M.; Zeng, S.; Wang, M. Research on equity analysis and forecasting of nursing human resource allocation in Jiangxi Province, China. Int. J. Nurs. Sci. 2024, 12, 19–26. [Google Scholar] [CrossRef] [Scilit] [PubMed]
  55. Huang, N.; Bai, L.; Wang, H.; Du, Q.; Shao, L.; Li, J. Social Network Analysis of Factors Influencing Green Building Development in China. Int. J. Environ. Res. Public Health 2018, 15, 2684. [Google Scholar] [CrossRef] [Scilit]
  56. Wang, T.; Wu, T.; Yang, D.; Xu, Y.; Lv, D.; Jiang, T.; Wang, H.; Chen, Q.; Xu, S.; Yan, Y.; et al. 3D-MRI brain glioma intelligent segmentation based on improved 3D U-net network. PLoS ONE 2025, 20, e0325534. [Google Scholar] [CrossRef] [Scilit]
  57. Peng, Y.; Zhao, J.; Fan, Y.; Fan, C. Monitoring and deformation of deep excavation engineering based on DFOS technology and hybrid deep learning. Sci. Rep. 2025, 15, 16042. [Google Scholar] [CrossRef] [Scilit]
  58. Sun, W.; Liu, J.; Liu, X.; Wang, T. Multi-scenario simulation and prediction of carbon surplus and deficit under the background of carbon neutrality: A case study of Chang-Zhu-Tan metropolitan area in China. Carbon Balance Manag. 2025, 20, 23. [Google Scholar] [CrossRef] [Scilit]
  59. Liu, H.; Wang, W. The spatiotemporal evolution and driving factors of urban-rural integration over the past eight years in China: Evidence from 31 provinces. PLoS ONE 2025, 20, e0337317. [Google Scholar] [CrossRef] [Scilit]
  60. Wei, Y.; Ban, W. Spatiotemporal heterogeneity and driving forces of construction carbon emissions in transitional regions: Evidence from six provinces in Central China. Carbon Manag. 2026, 17, 2635163. [Google Scholar] [CrossRef] [Scilit]
  61. Niu, J.; Xin, B.; Xin, B.; Zhang, Y.; Wang, M. Research on the coordinated development of provincial urbanization and carbon emission efficiency of construction industry in China. Carbon Balance Manag. 2024, 19, 12. [Google Scholar] [CrossRef] [Scilit] [PubMed]
Figure 1. Structure of the CNN model.
Buildings 16 01816 g001
Figure 2. Schematic diagram of the LSTM unit structure.
Buildings 16 01816 g002
Figure 3. Schematic diagram of the attention structure.
Buildings 16 01816 g003
Figure 4. Carbon emissions from the construction industry in Hunan Province, 2005–2022.
Buildings 16 01816 g004
Figure 5. Pearson correlation coefficient test of variables.
Buildings 16 01816 g005
Figure 6. Ridge trace plot.
Buildings 16 01816 g006
Figure 7. Schematic diagram of the CNN-LSTM-Attention model structure.
Buildings 16 01816 g007
Figure 8. CNN-LSTM-Attention prediction on training set.
Buildings 16 01816 g008
Figure 9. Prediction of construction carbon emissions in Hunan Province under different scenarios.
Buildings 16 01816 g009
Table 1. Description of variables in the model.
DimensionVariableDescriptionUnitSymbol
carbon emissions Energy Consumption × CO2 Emission Factor104 tC
PopulationPopulation SizePermanent Resident Population of Hunan Province104 personsP1
Urbanization Rate Urban Population/Permanent Resident Population%P2
Number of Construction Industry EmployeesNumber of Construction Industry Employees in Hunan Province104 personsP3
EconomyPer Capita GDPPer Capita Regional Gross Domestic ProductCNY capita−1E1
Construction Industry Gross Output Hunan Province Construction Industry Gross Output100 million yuanE2
Tertiary Industry Value AddedHunan Province Tertiary Industry Value Added100 million yuanE3
TechnologyEnergy IntensityHunan Province Energy Consumption in Construction/Construction Industry Gross Output104 t/100 million yuanT1
Technical Equipment Rate of Construction Enterprises Net Value of Machinery and Equipment at the End of the Reporting Period/Number of Employees at the End of the Reporting PeriodCNY capita−1T2
IndustryConstruction Industry ScaleTotal Output Value of the Construction Industry/Total Output Value of the National Economy%B1
Labor Input Construction Industry Workforce/Total Population%B2
Table 2. Fitting performance of the multiple linear regression model.
Goodness of Fit
RR2Adjusted R2
0.9790.9580.921
Table 3. Multiple linear regression results.
ModelUnstandardized CoefficientStandardized CoefficientCollinearity Statistics
BStandard ErrorBetaToleranceVIF
(Constant)−81.474107.394
lnP110.73214.3490.390.01758.544
lnP2−0.9865.883−0.3060.001714.833
lnE1−2.7431.919−3.3750.0011198.822
lnE32.8111.7894.0150.0011403.267
lnT1−0.3320.995−0.3010.006174.99
lnT2−0.2630.233−0.1720.1995.019
lnB10.2271.4460.0720.02244.588
lnB2−0.4160.438−0.1830.1258.011
Note: The dependent variable is lnC.
Table 4. Extended results of the STIRPAT model using full-variable ridge regression.
VariableUnstandardized Coefficient BStandard ErrorStandardized Coefficient Betat-ValueModel Performance Metrics
Constant term−35.87628.038-−1.28R2 = 0.938
lnP15.0613.2410.1841.562Adjusted R2 = 0.851
lnP20.3270.1570.1012.077F = 10.681
lnP30.0960.0690.0681.385F-statistic significance: p = 0.002 ***
lnE10.070.0340.0872.094
lnE20.0770.0170.1194.453
lnE30.0920.0220.1314.239
lnT1−0.0910.085−0.083−1.073
lnT2−0.0810.148−0.053−0.544
lnB10.6420.3570.2021.798
lnB20.0530.190.0230.277
Note: *** p < 0.01, the dependent variable is lnC.
Table 5. Table of standardized beta coefficients for variables under different ridge regression parameters (k).
k0.010.020.050.10.150.20.30.50.8
lnP10.313 0.278 0.226 0.188 0.169 0.157 0.143 0.128 0.116
lnP20.0680.0730.0880.1000.1050.1080.1110.1110.109
lnP30.0420.0490.0590.0670.0720.0740.0780.0820.084
lnE1−0.111−0.0220.0510.0840.0960.1020.1070.1100.108
lnE20.0320.0780.1090.1190.1210.1220.1210.1190.114
lnE30.2860.1950.1450.1320.1280.1260.1230.1190.114
lnT10.004−0.013−0.052−0.080−0.092−0.099−0.105−0.109−0.108
lnT2−0.060−0.060−0.058−0.054−0.049−0.046−0.040−0.033−0.027
lnB10.4020.3490.2650.2080.1820.1670.1500.1330.121
lnB2−0.0060.0040.0150.0220.0270.0310.0360.0430.049
Table 6. Ridge regression results after variable selection in the ridge plot.
Variable Unstandardized Coefficient BStandard ErrorStandardized Coefficient Betat-ValueModel Performance Metrics
Constant term−26.62223.676-−1.124R2 = 0.937
lnP13.9192.680.1431.462Adjusted R2 = 0.881
lnP20.3380.1310.1052.57F = 16.7
lnP30.1420.150.1010.948F-statistic significance: p = 0.000 ***
lnE10.0630.0310.0772.001
lnE20.0740.0170.1164.275
lnE30.0840.0220.1213.785
lnT1−0.1050.08−0.095−1.303
lnB10.7590.3170.2392.391
Note: *** represent significance levels of 1%; the dependent variable is lnC.
Table 7. Multi-scenario parameter settings.
StageUrbanization RatePopulation SizePer Capita GDPConstruction Industry Gross OutputTertiary Industry Value AddedEnergy IntensityConstruction Industry ScaleNumber of Construction Industry Employees
High-Carbon Scenario2023
–2030
1.00%0.30%6.50%8.00%6.50%−3.00%2.50%2.20%
2031
–2035
0.80%0.25%5.50%7.60%6.30%−3.20%2.30%2.00%
2036
–2040
0.50%0.20%4.50%7.30%6.10%−3.40%2.10%1.80%
Baseline Scenario2023
–2030
0.7%0.20%6.00%7.50%6%−3.50%2%1.80%
2031
–2035
0.50%0.15%5.80%7.30%5.80%−3.70%1.80%1.50%
2036
–2040
0.30%0.10%5.60%7.10%5.60%−3.90%1.60%1.20%
Low-Carbon Scenario2023
–2030
0.30%0.10%5.40%7.00%5.50%−4.00%1.50%1.20%
2031
–2035
0.20%0.06%5.30%6.90%5.30%−4.50%1.30%1.00%
2036
–2040
0.10%0.02%5.20%6.80%5.00%−5.00%1.00%0.80%
Table 8. Comparison of performance metrics for carbon emission prediction models in the construction industry.
Model CategoriesSpecific ModelsR2RMSEMAE
Traditional Machine Learning ModelsBP Neural Network0.885 0.2000.173
Random Forest0.901 0.1830.156
XGBoost0.915 0.1670.142
Single Deep Learning ModelLSTM0.932 0.1530.124
CNN0.897 0.1890.151
GRU0.928 0.1580.129
Combined Deep Learning ModelsCNN-LSTM0.9680.0820.065
LSTM-Attention0.9580.1020.081
CNN-LSTM-Attention0.993 0.0210.015
Disclaimer/Publisher’s Note: The statements, opinions and data contained in all publications are solely those of the individual author(s) and contributor(s) and not of MDPI and/or the editor(s). MDPI and/or the editor(s) disclaim responsibility for any injury to people or property resulting from any ideas, methods, instructions or products referred to in the content.