Research on the Influencing Factors of Carbon Emissions in the Construction Industry of Hunan Province and Peak Prediction
Abstract
1. Introduction
2. Materials and Methods
2.1. Carbon Emission Accounting Method
2.2. Stirpat Model
2.3. Cnn-Lstm-Attention Model
- (1)
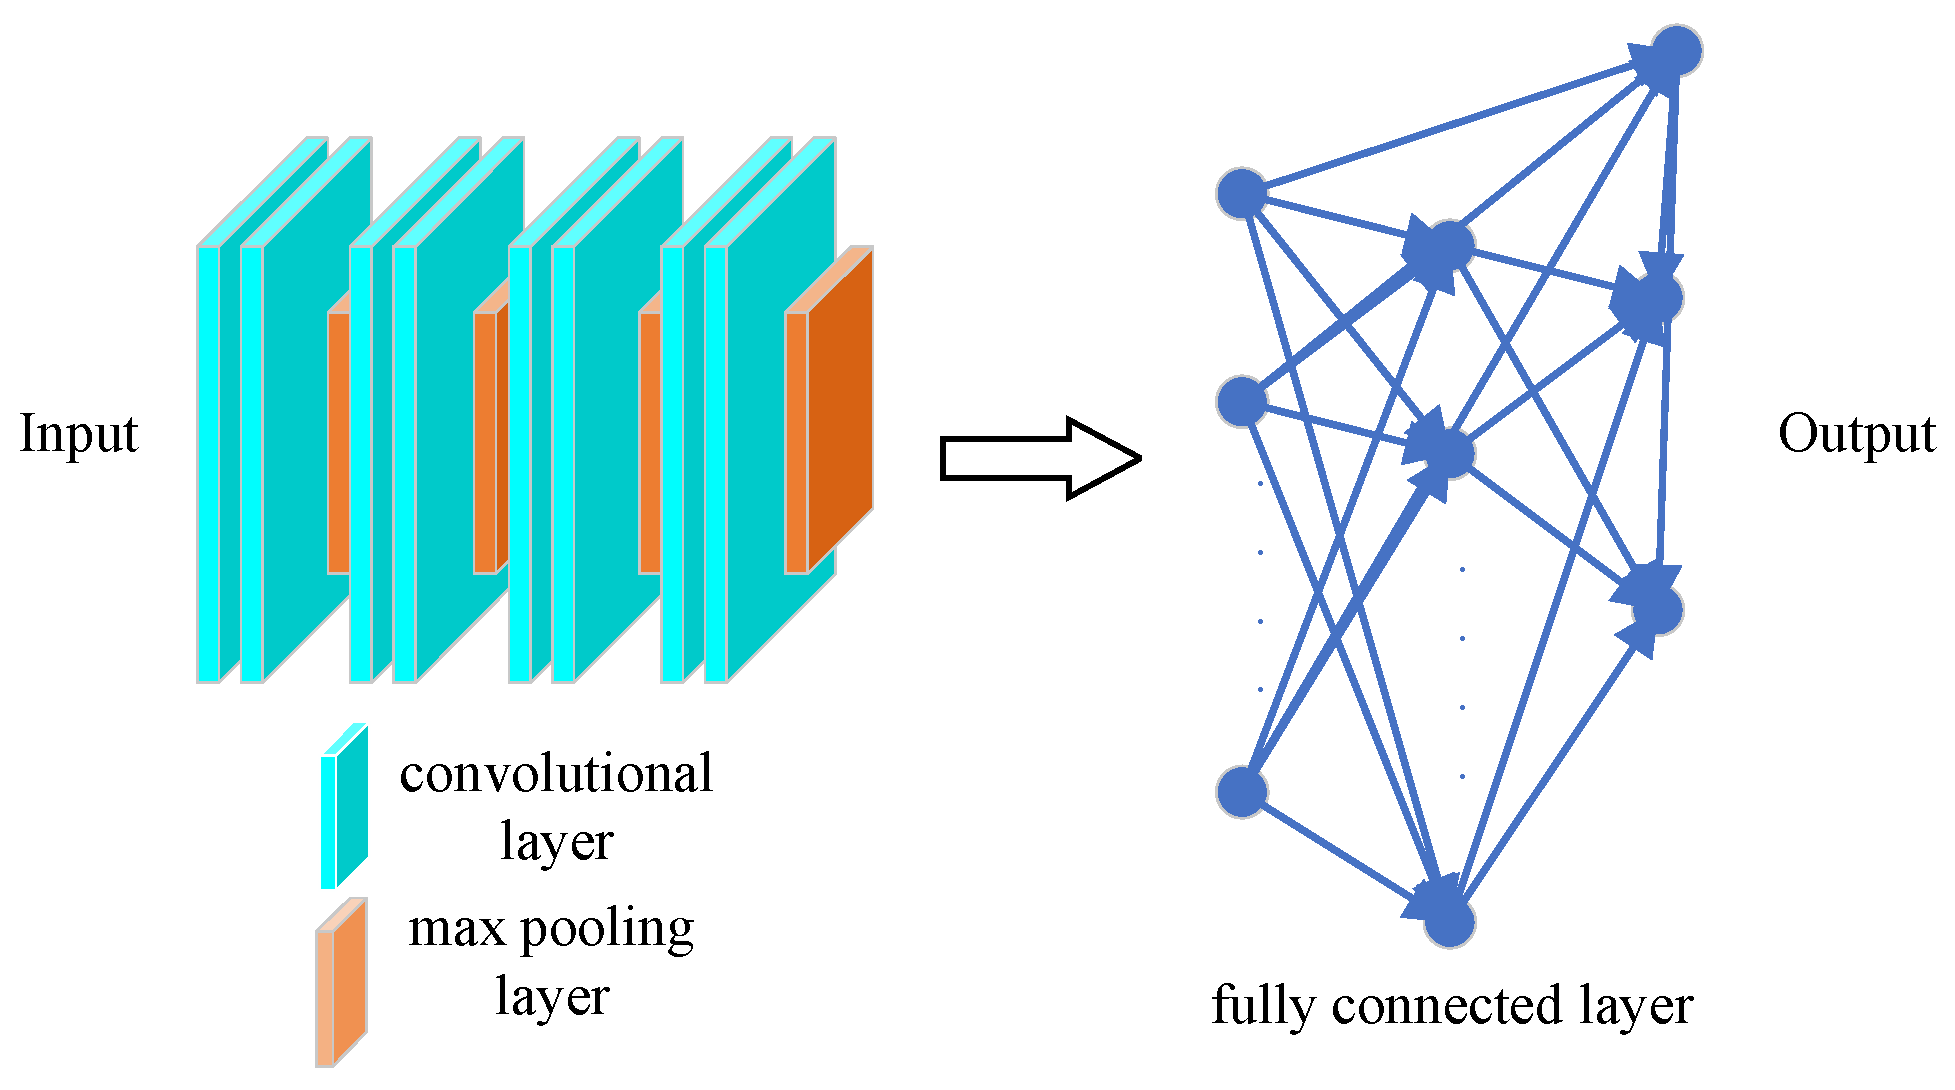
- CNN Model
- (2)
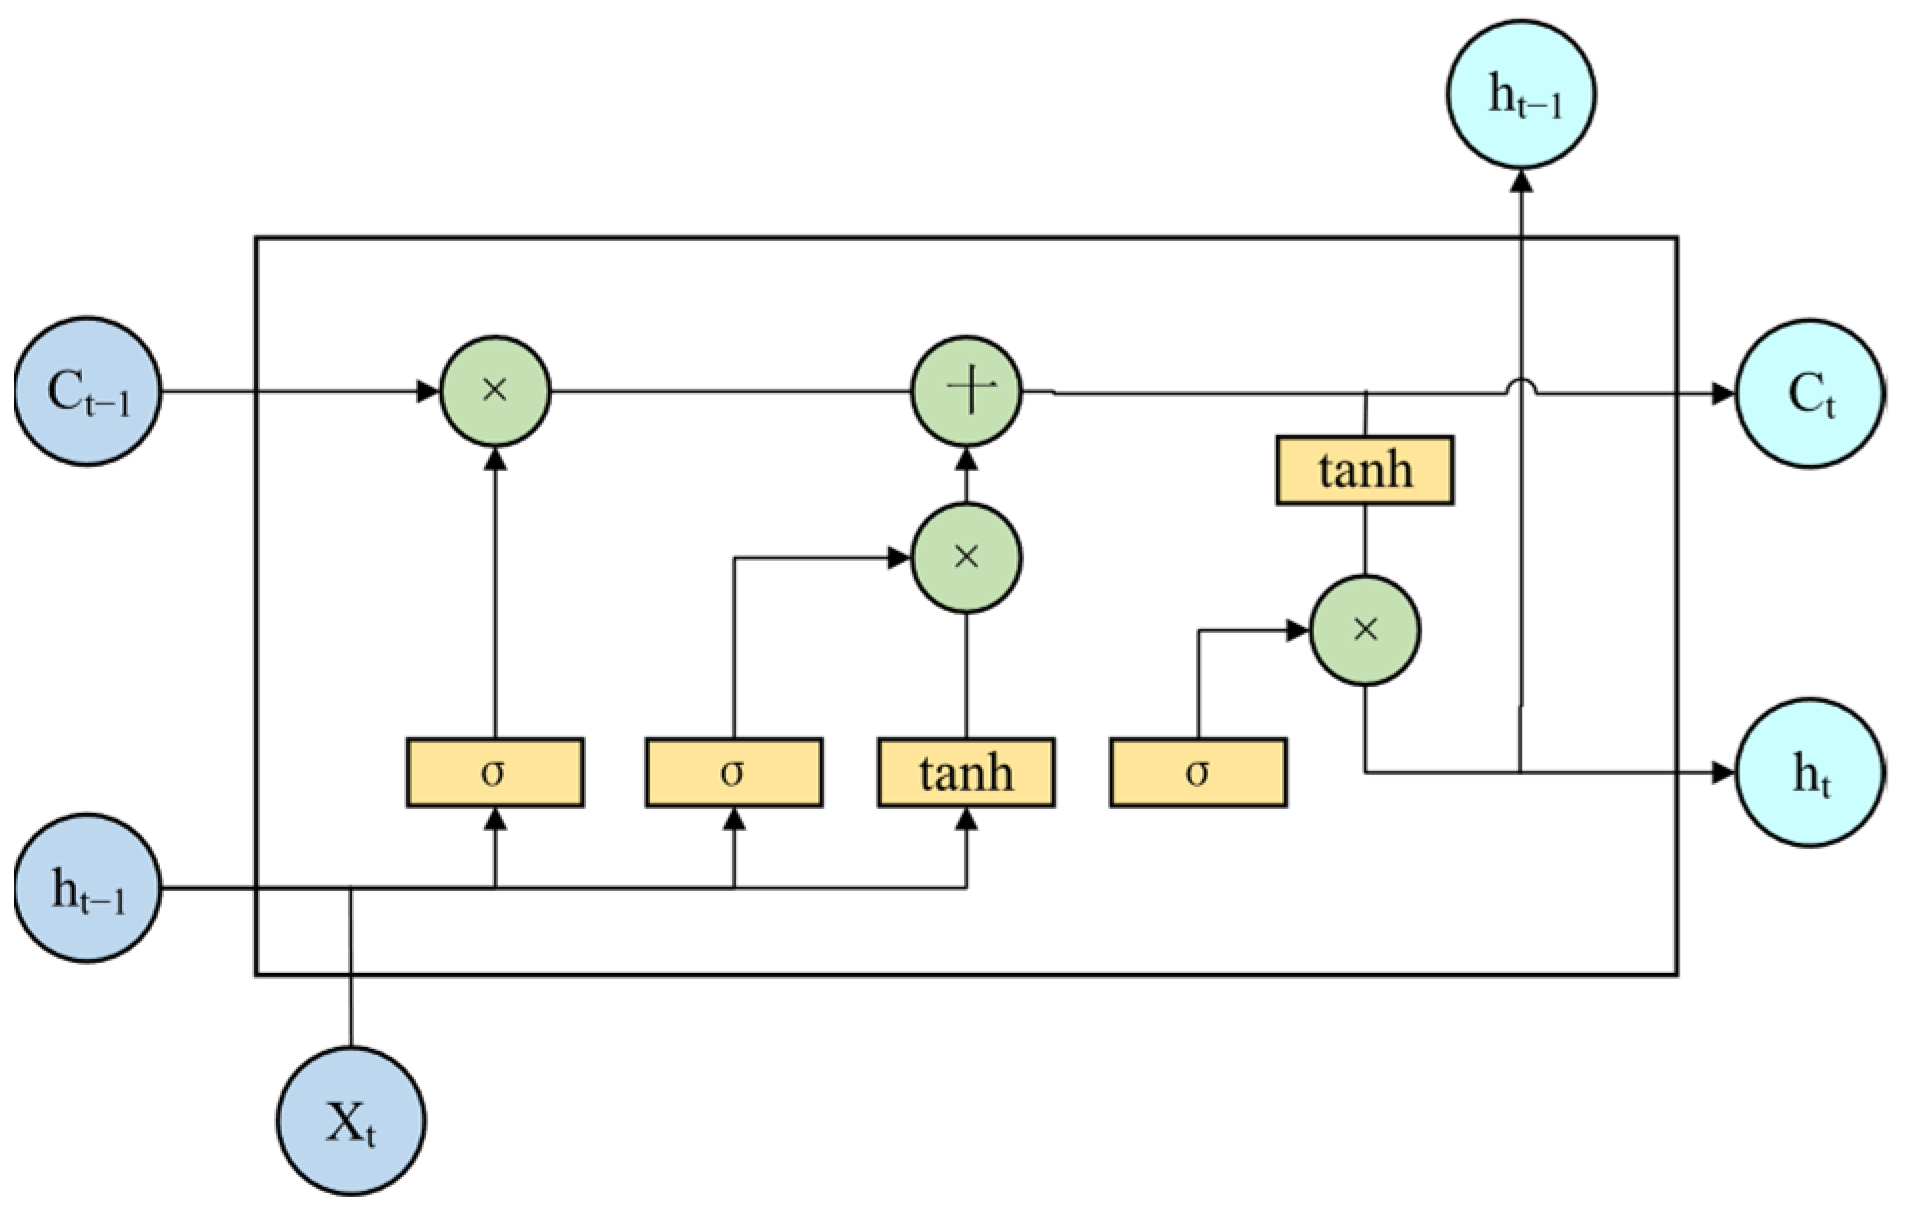
- LSTM Model
- (3)
- Attention Mechanism
3. Results and Analysis
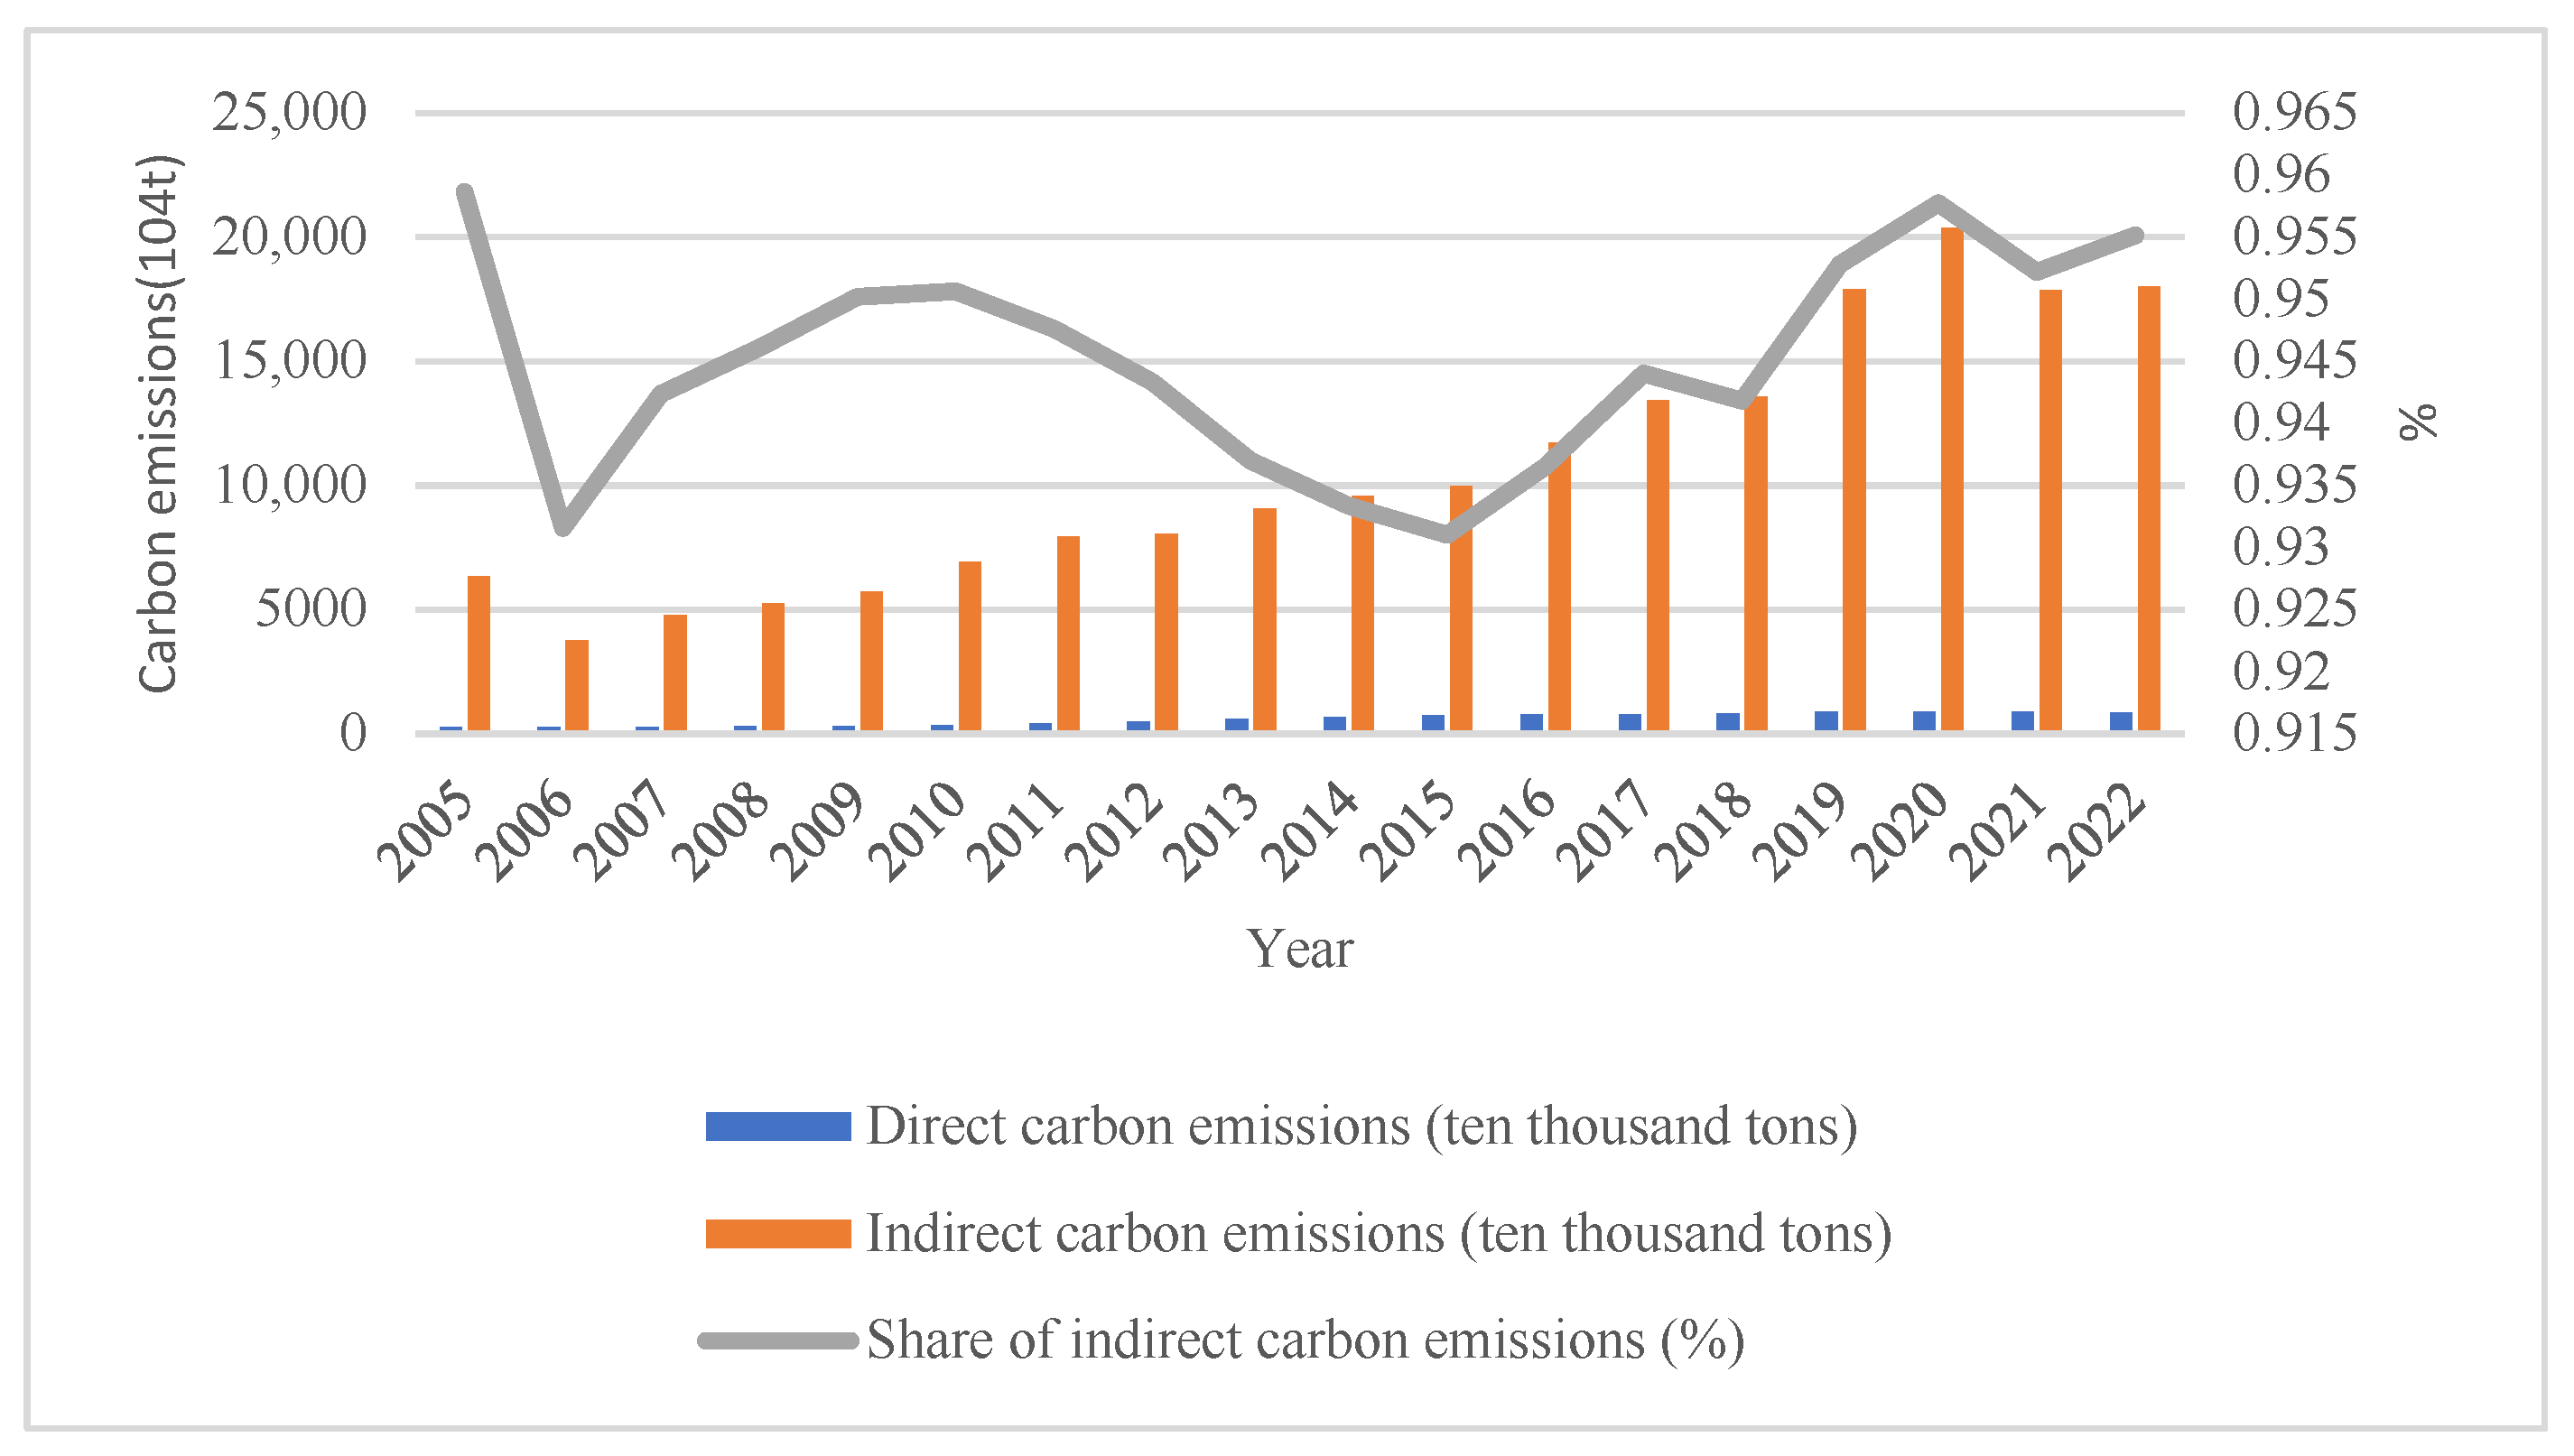
3.1. Calculation of Carbon Emissions from Hunan’s Construction Industry
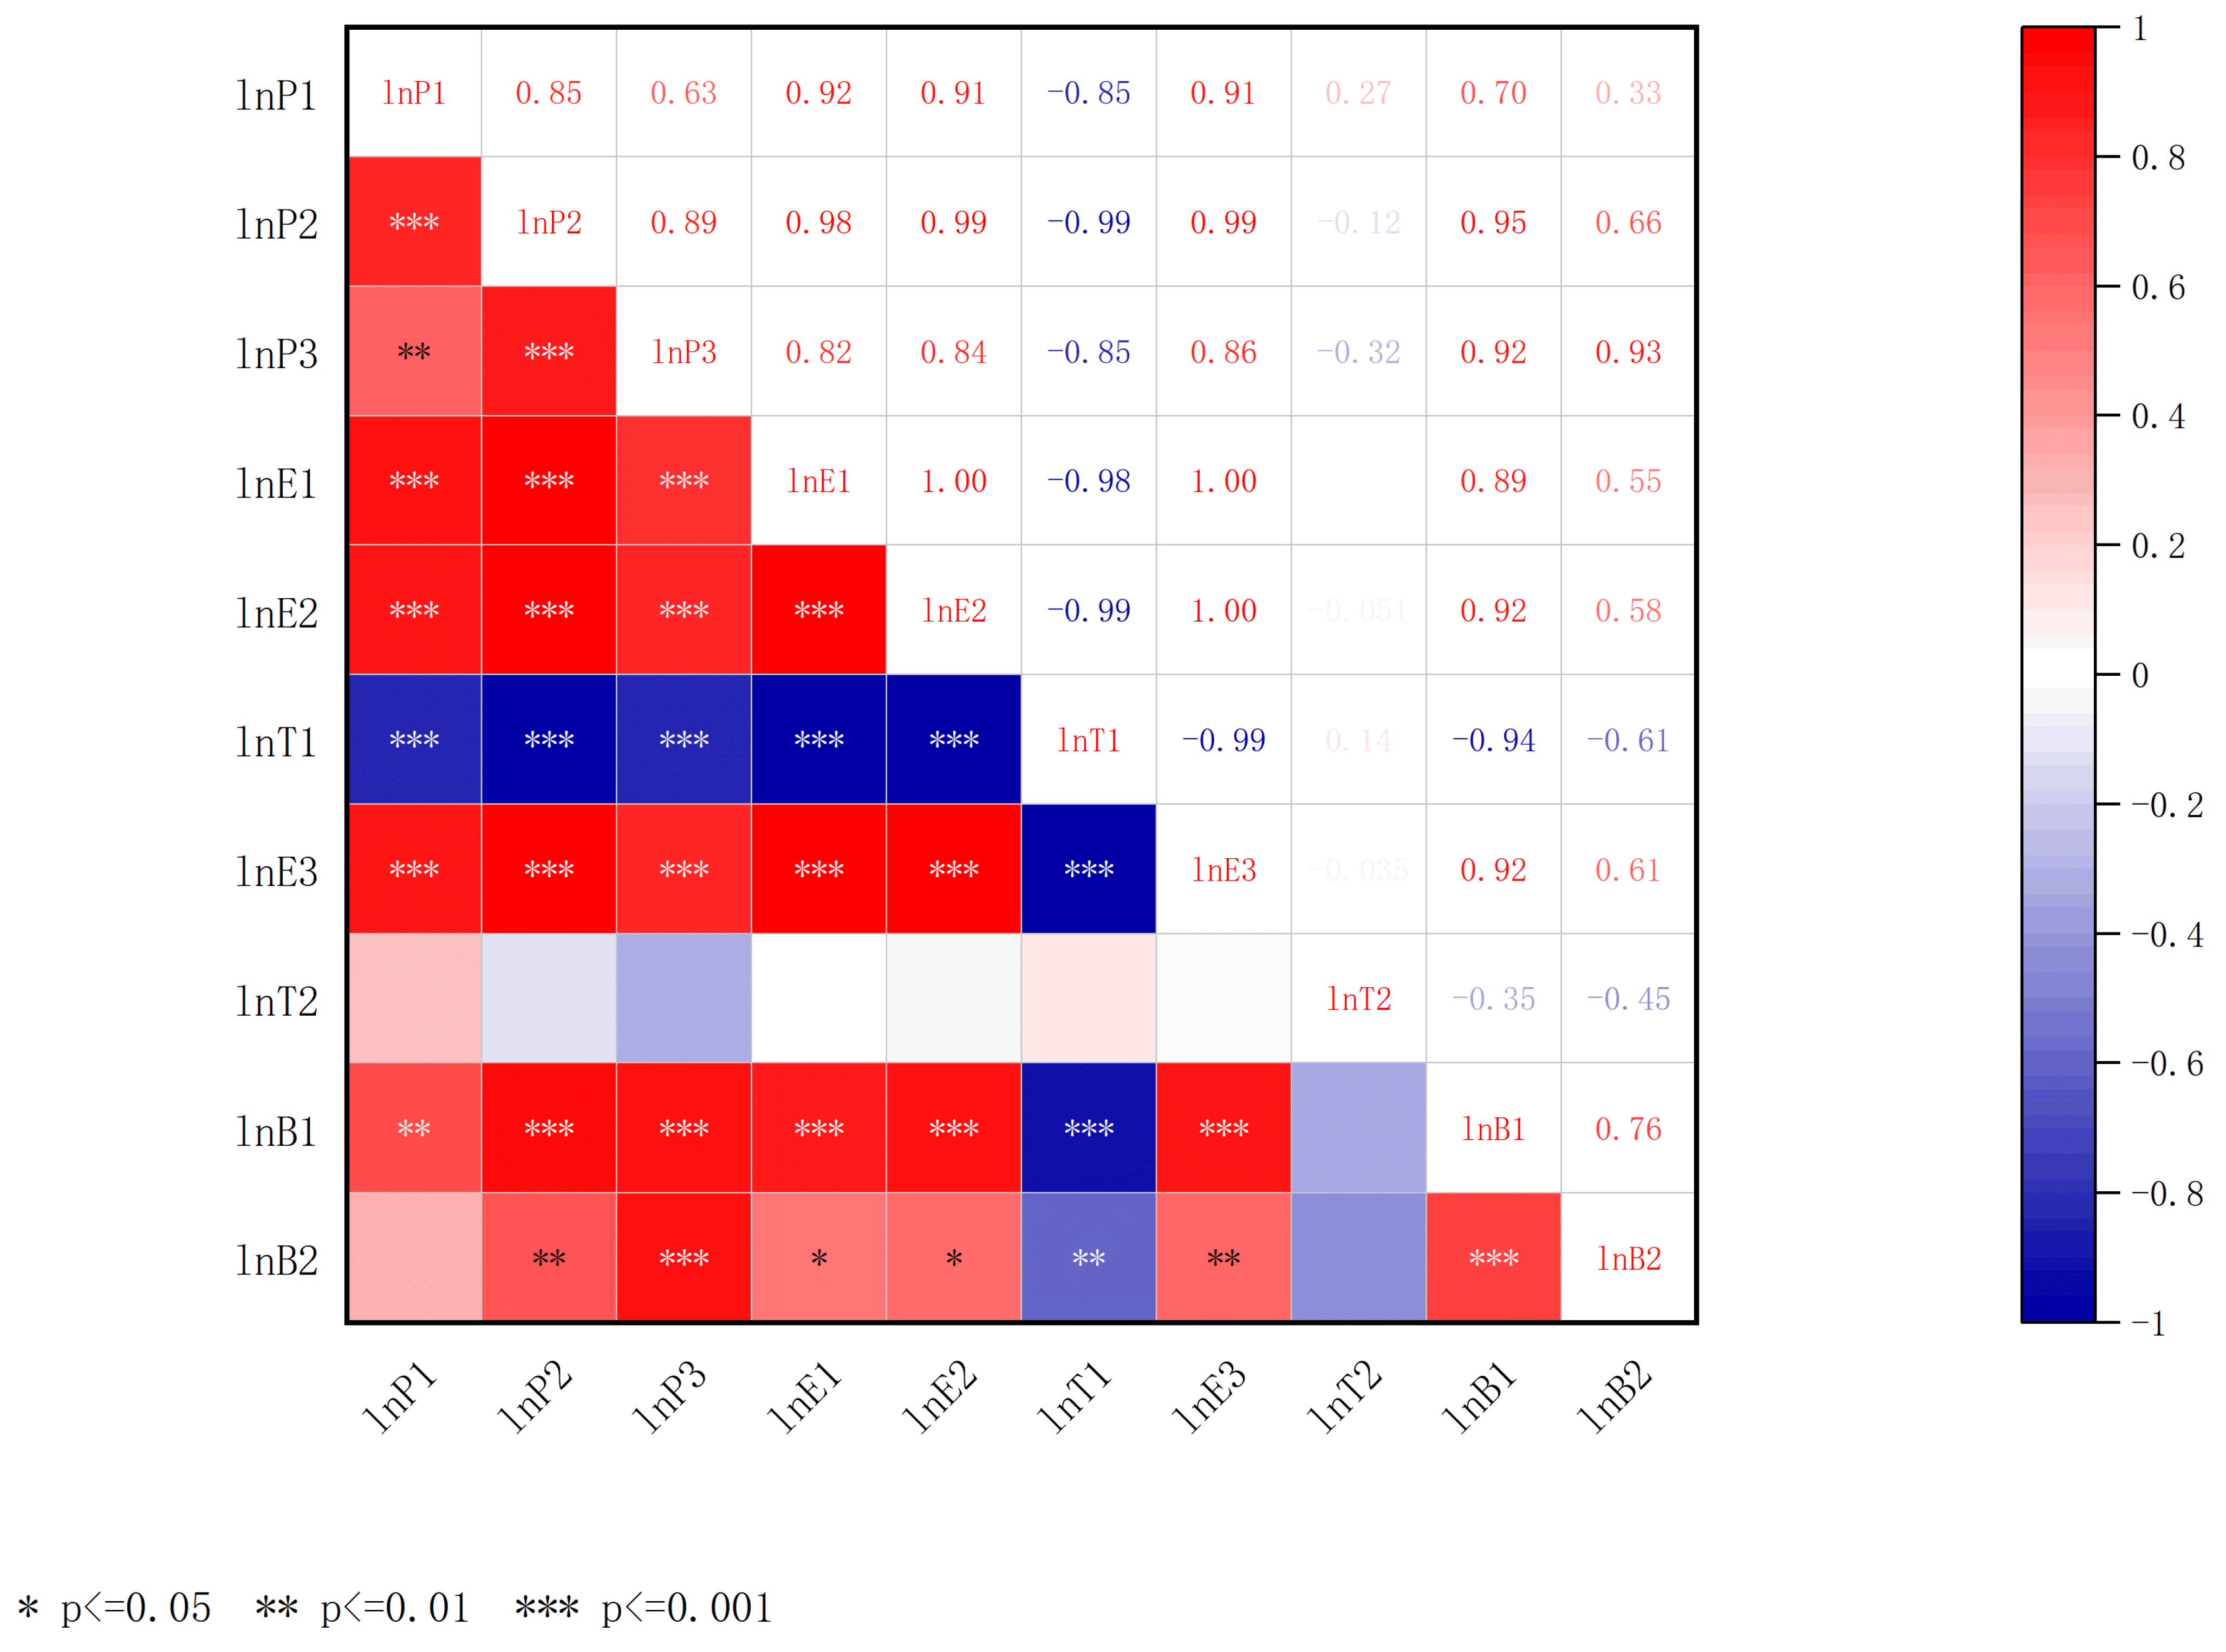
3.2. Analysis of Influencing Factors
4. Scenario-Based Carbon Emission Prediction and Analysis
4.1. Scenario Parameter Setting
- (1)
- Urbanization Rate
- (2)
- Population Size
- (3)
- Per Capita GDP
- (4)
- Construction Industry Gross Output
- (5)
- Tertiary Industry Value Added
- (6)
- Construction Industry Scale
- (7)
- Energy Intensity
- (8)
- Number of Construction Industry Employees
4.2. Construction of the Cnn-Lstm-Attention Model
4.3. Analysis of Prediction Results
5. Discussion
5.1. Key Findings and Interpretation
5.2. Comparison with Previous Studies
5.3. Policy and Practical Implications
5.4. Research Limitations
5.5. Future Research Directions
6. Conclusions
Author Contributions
Funding
Data Availability Statement
Conflicts of Interest
References
- Li, Z.; Yan, T.; Du, Y. Scenario-based simulation of carbon storage in Chengdu using MCCA–InVEST: Land use change, spatial patterns, and driving mechanisms. Carbon Balance Manag. 2025, 20, 40. [Google Scholar] [CrossRef] [Scilit]
- Zhang, Y.; Chen, Y. Evolutionary game analysis of carbon emission reduction in transportation infrastructure construction under dual regulation. Heliyon 2024, 10, e38223. [Google Scholar] [CrossRef] [Scilit] [PubMed]
- Cai, Y.; Duan, H.; Luo, Z.; Duan, Z.; Wang, X. Dynamic driving mechanism of dual structural effects on the correlation between economic growth and CO2 emissions: Evidence from a typical transformation region. Int. J. Environ. Res. Public Health 2022, 19, 3970. [Google Scholar] [CrossRef] [Scilit]
- Hunan Provincial Department of Housing and Urban-Rural Development; Hunan Provincial Development and Reform Commission. The Implementation Plan for Carbon Peak in Urban and Rural Construction of Hunan Province; Hunan Provincial Department of Housing and Urban-Rural Development: Changsha, China, 2023.
- Tong, X.; Guo, S.; Duan, H.; Duan, Z.; Gao, C.; Chen, W. Carbon-emission characteristics and influencing factors in growing and shrinking cities: Evidence from 280 Chinese cities. Int. J. Environ. Res. Public Health 2022, 19, 2120. [Google Scholar] [CrossRef] [Scilit]
- Yu, J.; Yu, Y.; Jiang, T. Structural factors influencing energy carbon emissions in China’s service industry: An input-output perspective. Environ. Sci. Pollut. Res. 2022, 29, 49361–49372. [Google Scholar] [CrossRef] [Scilit]
- Fan, J.-L.; Cao, Z.; Zhang, X.; Wang, J.-D.; Zhang, M. Comparative study on the influence of final use structure on carbon emissions in the Beijing-Tianjin-Hebei region. Sci. Total Environ. 2019, 668, 271–282. [Google Scholar] [CrossRef] [Scilit] [PubMed]
- Zagheni, E.; Billari, F.C. A cost valuation model based on a stochastic representation of the IPAT equation. Popul. Environ. 2007, 29, 68–82. [Google Scholar] [CrossRef] [Scilit]
- Lu, M.; Li, H.; Yang, X. An Overview of the Carbon Emission Standard Management System in China: Weaknesses and a Way Forward. Sustainability 2025, 17, 1296. [Google Scholar] [CrossRef] [Scilit]
- Li, X.; Lin, C.; Lin, M.; Jim, C.Y. Drivers and spatial patterns of carbon emissions from residential buildings: An empirical analysis of Fuzhou city (China). Build. Environ. 2024, 257, 111534. [Google Scholar] [CrossRef] [Scilit]
- Li, F.; Sun, M.; Xian, Q.; Feng, X. MDL: Industrial carbon emission prediction method based on meta-learning and diff long short-term memory networks. PLoS ONE 2024, 19, e0307915. [Google Scholar] [CrossRef] [Scilit]
- Tang, Y.; Jiang, H. Analysis of the decoupling effect and driving factors of carbon emissions from the transportation sector in Guangdong Province. Sci. Rep. 2024, 13, 18744. [Google Scholar] [CrossRef] [Scilit]
- GB/T 2589-2020; General Rules for Calculation of the Comprehensive Energy Consumption. Standardization Administration of China (SAC): Beijing, China, 2020.
- National Bureau of Statistics of the People’s Republic of China. China Energy Statistical Yearbook (2022); China Statistics Press: Beijing, China, 2022.
- Ministry of Housing and Urban-Rural Development of the People’s Republic of China. China Construction Industry Statistical Yearbook; China Statistics Press: Beijing, China, 2022.
- National Development and Reform Commission of the People’s Republic of China. Guidelines for the Preparation of Provincial Greenhouse Gas Inventories (Trial); National Development and Reform Commission: Beijing, China, 2011.
- GB/T 51366-2019; Standard for Building Carbon Emission Calculation. Ministry of Housing and Urban-Rural Development of the People’s Republic of China: Beijing, China; China Architecture & Building Press: Beijing, China, 2019.
- Wang, M.Q.; Huang, B.; Yuan, H.; Tang, Y.; Mao, J.; Xiong, L. Development of a carbon emission calculation and evaluation grading framework for public building certification schemes: Integrating BIM and LCA. Smart Sustain. Built Environ. 2025, 1–30. [Google Scholar] [CrossRef] [Scilit]
- Chen, L.; Yang, H.-N.; Xiao, Y.; Tang, P.-Y.; Liu, S.-Y.; Chang, M.; Huang, H. Exploring spatial pattern optimization path of urban building carbon emission based on low-carbon cities analytical framework: A case study of Xi’an, China. Sustain. Cities Soc. 2024, 111, 105551. [Google Scholar] [CrossRef] [Scilit]
- Al-Ahmad, A.K.; Hajar, H.A.A.; Hatamleh, M.T. Multi-Dimensional sustainability assessment of the construction sector in Jordan. Results Eng. 2026, 29, 109874. [Google Scholar] [CrossRef] [Scilit]
- Li, M.; Chen, W.; Song, J.; Zhang, S. Research on economic and social impact of carbon emissions in the construction industry at a regional scale: A case of Shandong, China. Environ. Sci. Pollut. Res. 2023, 30, 86437–86453. [Google Scholar] [CrossRef] [Scilit]
- Han, B.; Clevenger, C.M. Augmented Reality and Mixed Reality Implementation Status Survey in the Architecture, Engineering, and Construction Industry: Benefits, Limitations, and Future Directions. J. Archit. Eng. 2025, 31, 04025017. [Google Scholar] [CrossRef] [Scilit]
- Elsaid, M.; Albasyouni, W. Assessing the impact of infection rate on the productivity of resources in the construction industry: Lessons from COVID-19 pandemic. Rev. Constr. 2025, 24, 491–504. [Google Scholar]
- Sun, X.; Zhang, X. Assessment and Driving Factors of Embodied Carbon Emissions in the Construction Sector: Evidence from 2005 to 2021 in Northeast China. Sustainability 2024, 16, 5681. [Google Scholar] [CrossRef] [Scilit]
- Shah, S.K.; Graham, P.; Burton, C.; Harrington, P. An Assessment of Long-Term Climate Change on Building Energy in Indonesia. Energies 2023, 16, 7231. [Google Scholar] [CrossRef] [Scilit]
- Assemlali, H.; Bouhsissin, S.; Sael, N. Deep learning-driven CNN model for detection and classification of dynamic obstacles. Green Energy Intell. Transp. 2026, 5, 100334. [Google Scholar] [CrossRef] [Scilit]
- Li, S.X.; Qin, H.G.; Xia, F.Y.; Xu, X.; Cai, Y. Application of LSTM coupled models in runoff simulation and prediction: A review. Appl. Water Sci. 2026, 16, 89. [Google Scholar] [CrossRef] [Scilit]
- Zhang, C.; Luo, H. Research on carbon emission peak prediction and path of China’s public buildings: Scenario analysis based on LEAP model. Energy Build. 2023, 289, 113053. [Google Scholar] [CrossRef] [Scilit]
- Zhang, L.Y.; Lin, X.; Hui, E.C.M.; Shen, J.F. Health resilience of green buildings in a Dense City: Evidence from COVID-19 infections in Hong Kong. Cities 2026, 173, 106975. [Google Scholar] [CrossRef] [Scilit]
- Zhang, P.; Luo, Y.; Yu, Q.; Zhou, Z. Air transportation carbon dioxide emission forecasting: An improved back propagation neural network. PLoS ONE 2025, 20, e0333226. [Google Scholar] [CrossRef] [Scilit] [PubMed]
- Zinilli, A.; Tuccari, G.G.; Poggi, F.; Nuzzolese, A.G.; Mongiovì, M.; Giammei, L.; Paolillo, R.; Longo, C.F.; Ceriani, M.; Zuppiroli, S. Anatomy of climate change research in Italian doctoral dissertations using a machine learning approach. Sci. Rep. 2025, 15, 38095. [Google Scholar] [CrossRef] [Scilit] [PubMed]
- Liu, H.; Guo, R.; Tian, J.; Sun, H.; Wang, Y.; Li, H.; Yao, L. Quantifying the Carbon Reduction Potential of Recycling Construction Waste Based on Life Cycle Assessment: A Case of Jiangsu Province. Int. J. Environ. Res. Public Health 2022, 19, 12628. [Google Scholar] [CrossRef] [Scilit]
- Ran, Q.; Bu, F.; Razzaq, A.; Ge, W.; Peng, J.; Yang, X.; Xu, Y. When will China’s industrial carbon emissions peak? Evidence from machine learning. Environ. Sci. Pollut. Res. Int. 2023, 30, 57960–57974. [Google Scholar] [CrossRef] [Scilit]
- Zhang, Z.; Xie, H.; Zhang, J.; Wang, X.; Wei, J.; Quan, X. Prediction and Trend Analysis of Regional Industrial Carbon Emission in China: A Study of Nanjing City. Int. J. Environ. Res. Public Health 2022, 19, 7165. [Google Scholar] [CrossRef] [Scilit]
- Wei, Z.; Wei, K.; Liu, J. Decoupling relationship between carbon emissions and economic development and prediction of carbon emissions in Henan Province: Based on Tapio method and STIRPAT model. Environ. Sci. Pollut. Res. 2023, 30, 52679–52691. [Google Scholar] [CrossRef] [Scilit]
- Zhang, Z.; Xiao, Y.; Zhang, K.; Tang, M.; Ma, T. The impact of China pilot carbon market policy on electricity carbon emissions. Sci. Rep. 2025, 15, 16415. [Google Scholar] [CrossRef] [Scilit]
- Junjia, Y.; Alias, A.H.; Haron, N.A.; Bakar, N.A. Identification and analysis of hoisting safety risk factors for IBS construction based on the AcciMap and cases study. Heliyon 2023, 10, e23587. [Google Scholar] [CrossRef] [Scilit]
- Li, C.; Zhang, Z.; Wang, L. Carbon peak forecast and low carbon policy choice of transportation industry in China: Scenario prediction based on STIRPAT model. Environ. Sci. Pollut. Res. 2023, 30, 63250–63271. [Google Scholar] [CrossRef] [Scilit]
- Cao, L.; Chong, P. Exploring the low-carbon development path of resource-based cities based on scenario simulation. Sci. Rep. 2025, 15, 5836. [Google Scholar] [CrossRef] [Scilit]
- People’s Government of Hunan Province. Plan for Carbon Peak in Hunan Province; People’s Government of Hunan Province: Changsha, China, 2022.
- People’s Government of Hunan Province. The 14th Five-Year Plan for National Economic and Social Development and the Long-Range Objectives Through the Year 2035 of Hunan Province; People’s Government of Hunan Province: Changsha, China, 2021.
- Xia, Y.; Yang, Z.; Jiang, X.; Wang, H. The road to carbon neutrality in China’s building sector. iScience 2024, 27, 110664. [Google Scholar] [CrossRef] [Scilit]
- People’s Government of Hunan Province. Hunan Province 14th Five-Year Plan for New-Type Urbanization; People’s Government of Hunan Province: Changsha, China, 2021.
- People’s Government of Hunan Province. Hunan Provincial Territorial and Spatial Plan (2021–2035); People’s Government of Hunan Province: Changsha, China, 2025.
- People’s Government of Hunan Province. Hunan Province Carbon Peaking Implementation Plan; People’s Government of Hunan Province: Changsha, China, 2022.
- Department of Housing and Urban-Rural Development of Hunan Province. The 14th Five-Year Plan for the Development of the Construction Industry in Hunan Province; Department of Housing and Urban-Rural Development of Hunan Province: Changsha, China, 2021.
- People’s Government of Hunan Province. Comprehensive Implementation Plan for Energy Conservation and Emission Reduction During the 14th Five-Year Plan Period; People’s Government of Hunan Province: Changsha, China, 2022.
- Tang, Y.; He, J.; Guo, X. Coupling and coordination mechanism and sustainable path of water resources-ecological environment-socio-economic system in Zhengzhou urban agglomeration. Sci. Rep. 2025, 15, 37811. [Google Scholar] [CrossRef] [Scilit] [PubMed]
- Li, J.; Guo, Y. A hybrid model for carbon price forecasting based on SSA-NSTransformer: Considering the role of multi-stage carbon reduction targets. J. Environ. Manag. 2025, 375, 124237. [Google Scholar] [CrossRef] [Scilit] [PubMed]
- Wang, X.; Zhao, J.; Li, Y.; Li, Z. Optimized design and performance evaluation of long-pressure-short-extraction ventilation and dust removal system based on the Coanda effect. Front. Artif. Intell. 2025, 8, 1565889. [Google Scholar] [CrossRef] [Scilit] [PubMed]
- Borré, A.; Seman, L.O.; Camponogara, E.; Stefenon, S.F.; Mariani, V.C.; Coelho, L.D.S. Machine Fault Detection Using a Hybrid CNN-LSTM Attention-Based Model. Sensors 2023, 23, 4512. [Google Scholar] [CrossRef] [Scilit]
- Salhi, A.; Algarni, F.; Alshamrani, R.; Althbiti, A.; Ismail, A.; Hassan, B.M. Leveraging artificial intelligence to enable sustainable urban development through the creation of smart and environmentally friendly carbon-free cities. Sci. Rep. 2025, 15, 35791. [Google Scholar] [CrossRef] [Scilit]
- Ma, L.; Ma, J.; Zelminbek, M.; Zhang, W. High-Resolution Reconstruction of Temperature Fields Based on Improved ResNet18. Sensors 2024, 24, 6564. [Google Scholar] [CrossRef] [Scilit]
- Du, Y.; Xie, Z.; Yang, Z.; Xiong, W.; Zhou, L.; Zhang, M.; Zeng, S.; Wang, M. Research on equity analysis and forecasting of nursing human resource allocation in Jiangxi Province, China. Int. J. Nurs. Sci. 2024, 12, 19–26. [Google Scholar] [CrossRef] [Scilit] [PubMed]
- Huang, N.; Bai, L.; Wang, H.; Du, Q.; Shao, L.; Li, J. Social Network Analysis of Factors Influencing Green Building Development in China. Int. J. Environ. Res. Public Health 2018, 15, 2684. [Google Scholar] [CrossRef] [Scilit]
- Wang, T.; Wu, T.; Yang, D.; Xu, Y.; Lv, D.; Jiang, T.; Wang, H.; Chen, Q.; Xu, S.; Yan, Y.; et al. 3D-MRI brain glioma intelligent segmentation based on improved 3D U-net network. PLoS ONE 2025, 20, e0325534. [Google Scholar] [CrossRef] [Scilit]
- Peng, Y.; Zhao, J.; Fan, Y.; Fan, C. Monitoring and deformation of deep excavation engineering based on DFOS technology and hybrid deep learning. Sci. Rep. 2025, 15, 16042. [Google Scholar] [CrossRef] [Scilit]
- Sun, W.; Liu, J.; Liu, X.; Wang, T. Multi-scenario simulation and prediction of carbon surplus and deficit under the background of carbon neutrality: A case study of Chang-Zhu-Tan metropolitan area in China. Carbon Balance Manag. 2025, 20, 23. [Google Scholar] [CrossRef] [Scilit]
- Liu, H.; Wang, W. The spatiotemporal evolution and driving factors of urban-rural integration over the past eight years in China: Evidence from 31 provinces. PLoS ONE 2025, 20, e0337317. [Google Scholar] [CrossRef] [Scilit]
- Wei, Y.; Ban, W. Spatiotemporal heterogeneity and driving forces of construction carbon emissions in transitional regions: Evidence from six provinces in Central China. Carbon Manag. 2026, 17, 2635163. [Google Scholar] [CrossRef] [Scilit]
- Niu, J.; Xin, B.; Xin, B.; Zhang, Y.; Wang, M. Research on the coordinated development of provincial urbanization and carbon emission efficiency of construction industry in China. Carbon Balance Manag. 2024, 19, 12. [Google Scholar] [CrossRef] [Scilit] [PubMed]






| Dimension | Variable | Description | Unit | Symbol |
|---|---|---|---|---|
| carbon emissions | Energy Consumption × CO2 Emission Factor | 104 t | C | |
| Population | Population Size | Permanent Resident Population of Hunan Province | 104 persons | P1 |
| Urbanization Rate | Urban Population/Permanent Resident Population | % | P2 | |
| Number of Construction Industry Employees | Number of Construction Industry Employees in Hunan Province | 104 persons | P3 | |
| Economy | Per Capita GDP | Per Capita Regional Gross Domestic Product | CNY capita−1 | E1 |
| Construction Industry Gross Output | Hunan Province Construction Industry Gross Output | 100 million yuan | E2 | |
| Tertiary Industry Value Added | Hunan Province Tertiary Industry Value Added | 100 million yuan | E3 | |
| Technology | Energy Intensity | Hunan Province Energy Consumption in Construction/Construction Industry Gross Output | 104 t/100 million yuan | T1 |
| Technical Equipment Rate of Construction Enterprises | Net Value of Machinery and Equipment at the End of the Reporting Period/Number of Employees at the End of the Reporting Period | CNY capita−1 | T2 | |
| Industry | Construction Industry Scale | Total Output Value of the Construction Industry/Total Output Value of the National Economy | % | B1 |
| Labor Input | Construction Industry Workforce/Total Population | % | B2 |
| Goodness of Fit | ||
|---|---|---|
| R | R2 | Adjusted R2 |
| 0.979 | 0.958 | 0.921 |
| Model | Unstandardized Coefficient | Standardized Coefficient | Collinearity Statistics | ||
|---|---|---|---|---|---|
| B | Standard Error | Beta | Tolerance | VIF | |
| (Constant) | −81.474 | 107.394 | |||
| lnP1 | 10.732 | 14.349 | 0.39 | 0.017 | 58.544 |
| lnP2 | −0.986 | 5.883 | −0.306 | 0.001 | 714.833 |
| lnE1 | −2.743 | 1.919 | −3.375 | 0.001 | 1198.822 |
| lnE3 | 2.811 | 1.789 | 4.015 | 0.001 | 1403.267 |
| lnT1 | −0.332 | 0.995 | −0.301 | 0.006 | 174.99 |
| lnT2 | −0.263 | 0.233 | −0.172 | 0.199 | 5.019 |
| lnB1 | 0.227 | 1.446 | 0.072 | 0.022 | 44.588 |
| lnB2 | −0.416 | 0.438 | −0.183 | 0.125 | 8.011 |
| Variable | Unstandardized Coefficient B | Standard Error | Standardized Coefficient Beta | t-Value | Model Performance Metrics |
|---|---|---|---|---|---|
| Constant term | −35.876 | 28.038 | - | −1.28 | R2 = 0.938 |
| lnP1 | 5.061 | 3.241 | 0.184 | 1.562 | Adjusted R2 = 0.851 |
| lnP2 | 0.327 | 0.157 | 0.101 | 2.077 | F = 10.681 |
| lnP3 | 0.096 | 0.069 | 0.068 | 1.385 | F-statistic significance: p = 0.002 *** |
| lnE1 | 0.07 | 0.034 | 0.087 | 2.094 | |
| lnE2 | 0.077 | 0.017 | 0.119 | 4.453 | |
| lnE3 | 0.092 | 0.022 | 0.131 | 4.239 | |
| lnT1 | −0.091 | 0.085 | −0.083 | −1.073 | |
| lnT2 | −0.081 | 0.148 | −0.053 | −0.544 | |
| lnB1 | 0.642 | 0.357 | 0.202 | 1.798 | |
| lnB2 | 0.053 | 0.19 | 0.023 | 0.277 |
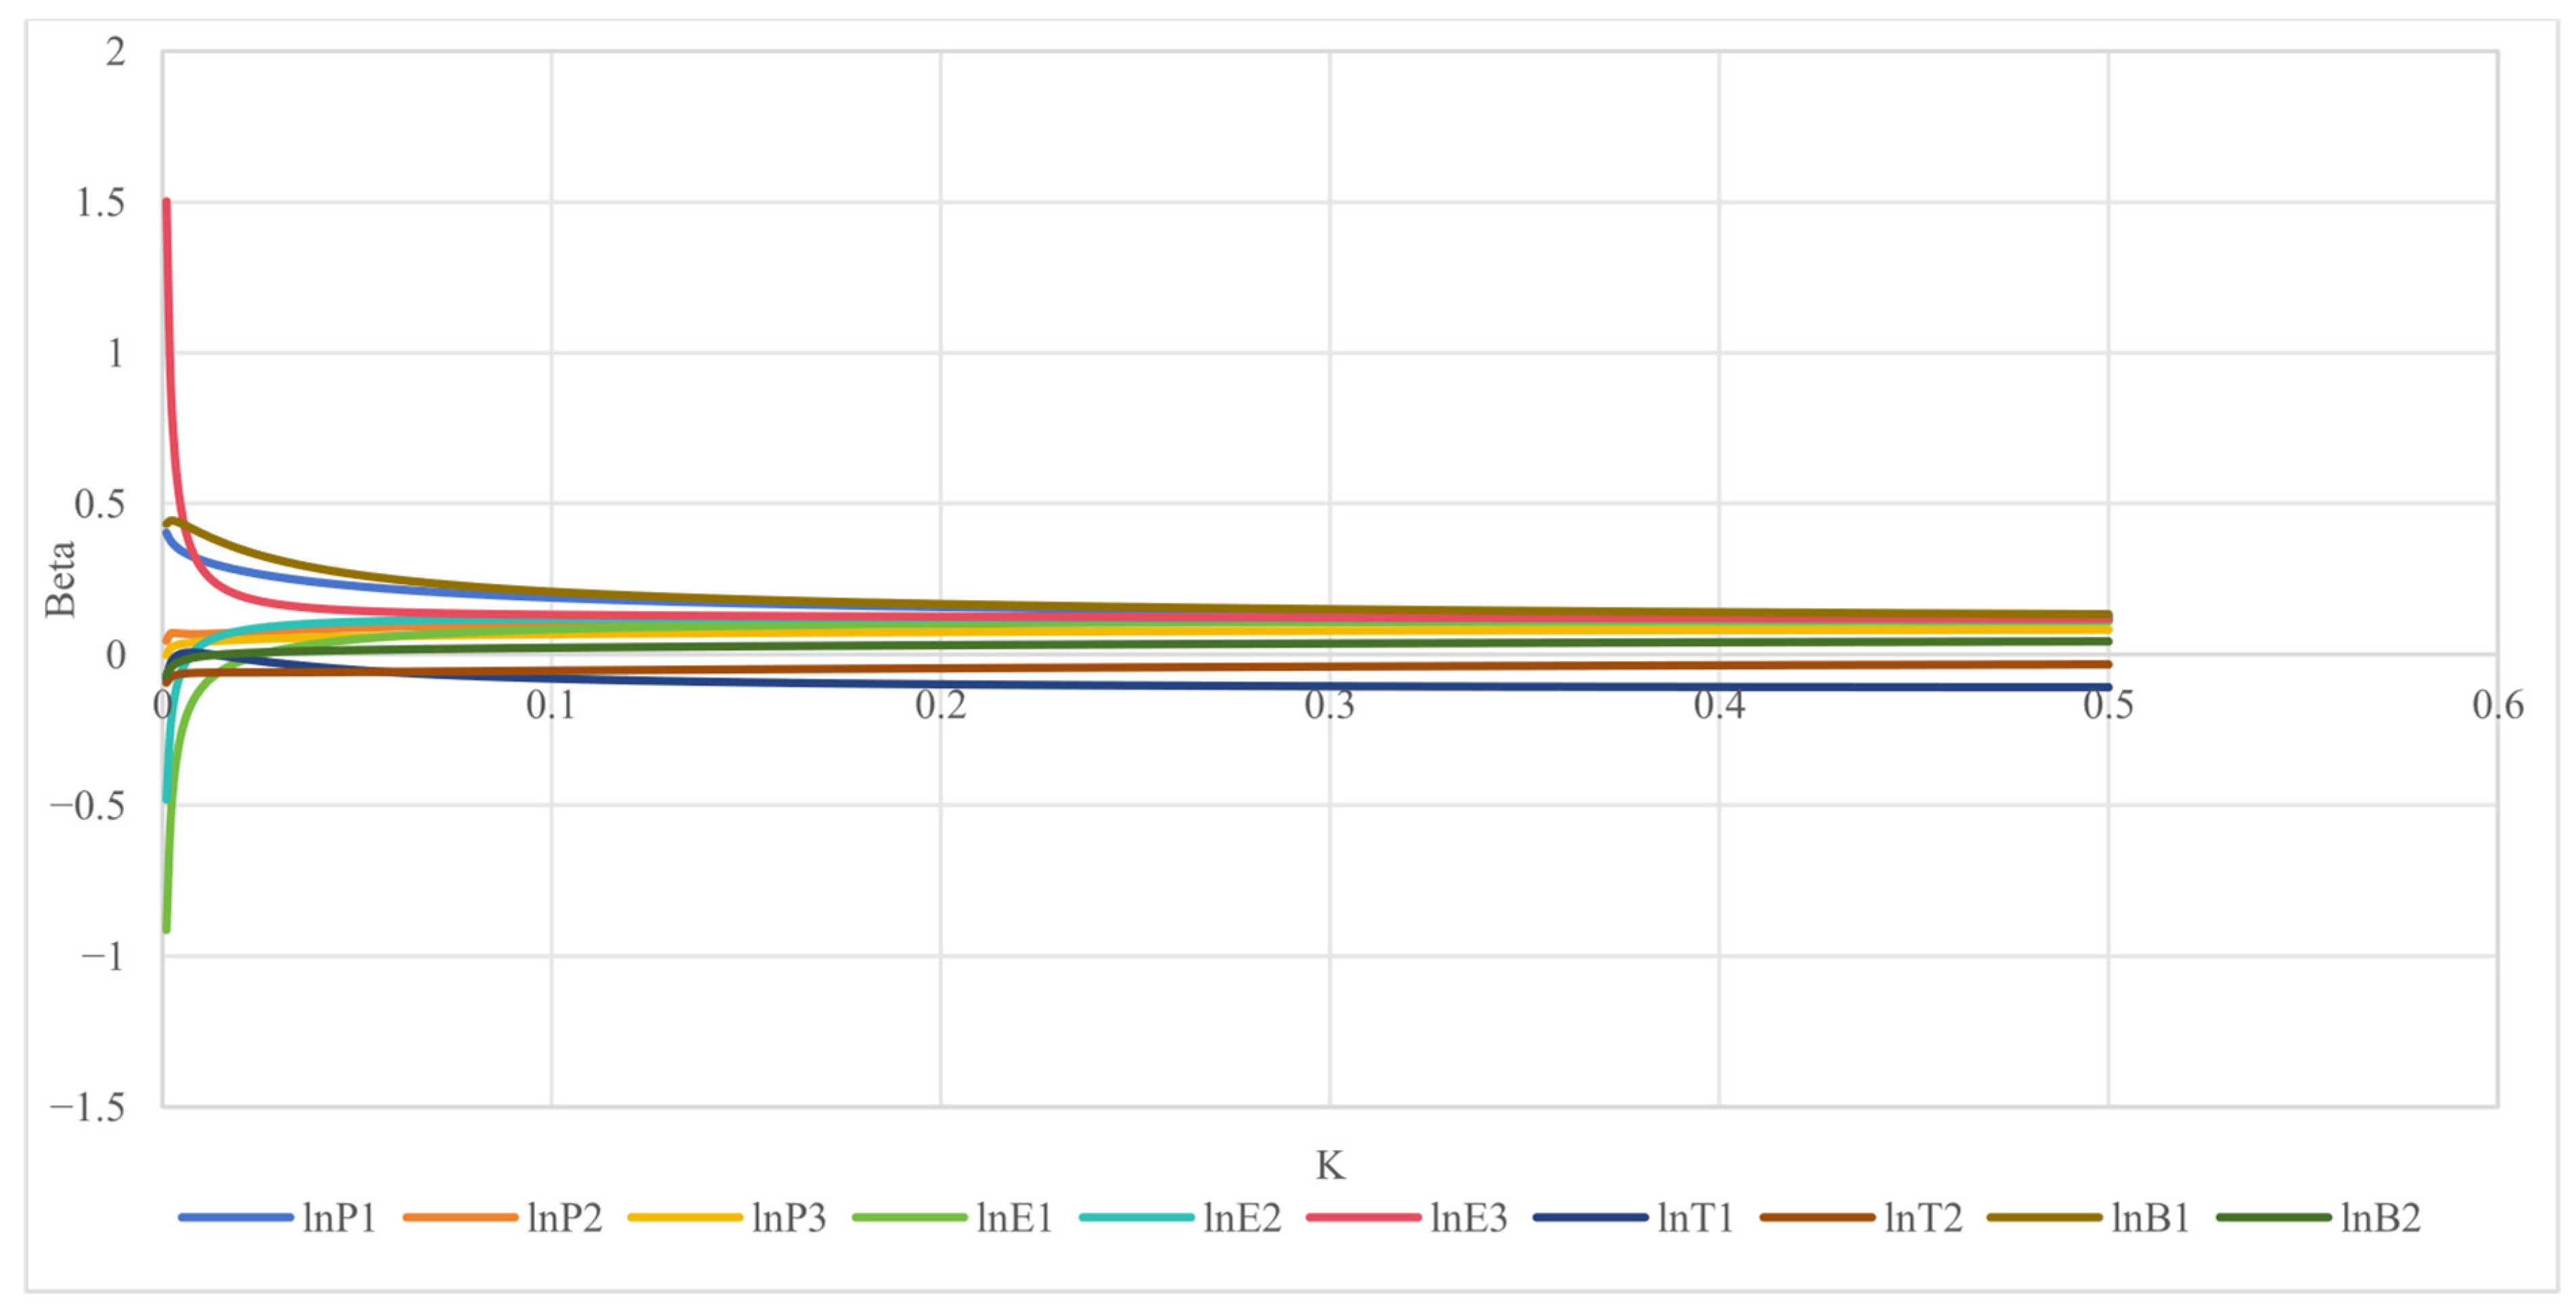
| k | 0.01 | 0.02 | 0.05 | 0.1 | 0.15 | 0.2 | 0.3 | 0.5 | 0.8 |
|---|---|---|---|---|---|---|---|---|---|
| lnP1 | 0.313 | 0.278 | 0.226 | 0.188 | 0.169 | 0.157 | 0.143 | 0.128 | 0.116 |
| lnP2 | 0.068 | 0.073 | 0.088 | 0.100 | 0.105 | 0.108 | 0.111 | 0.111 | 0.109 |
| lnP3 | 0.042 | 0.049 | 0.059 | 0.067 | 0.072 | 0.074 | 0.078 | 0.082 | 0.084 |
| lnE1 | −0.111 | −0.022 | 0.051 | 0.084 | 0.096 | 0.102 | 0.107 | 0.110 | 0.108 |
| lnE2 | 0.032 | 0.078 | 0.109 | 0.119 | 0.121 | 0.122 | 0.121 | 0.119 | 0.114 |
| lnE3 | 0.286 | 0.195 | 0.145 | 0.132 | 0.128 | 0.126 | 0.123 | 0.119 | 0.114 |
| lnT1 | 0.004 | −0.013 | −0.052 | −0.080 | −0.092 | −0.099 | −0.105 | −0.109 | −0.108 |
| lnT2 | −0.060 | −0.060 | −0.058 | −0.054 | −0.049 | −0.046 | −0.040 | −0.033 | −0.027 |
| lnB1 | 0.402 | 0.349 | 0.265 | 0.208 | 0.182 | 0.167 | 0.150 | 0.133 | 0.121 |
| lnB2 | −0.006 | 0.004 | 0.015 | 0.022 | 0.027 | 0.031 | 0.036 | 0.043 | 0.049 |
| Variable | Unstandardized Coefficient B | Standard Error | Standardized Coefficient Beta | t-Value | Model Performance Metrics |
|---|---|---|---|---|---|
| Constant term | −26.622 | 23.676 | - | −1.124 | R2 = 0.937 |
| lnP1 | 3.919 | 2.68 | 0.143 | 1.462 | Adjusted R2 = 0.881 |
| lnP2 | 0.338 | 0.131 | 0.105 | 2.57 | F = 16.7 |
| lnP3 | 0.142 | 0.15 | 0.101 | 0.948 | F-statistic significance: p = 0.000 *** |
| lnE1 | 0.063 | 0.031 | 0.077 | 2.001 | |
| lnE2 | 0.074 | 0.017 | 0.116 | 4.275 | |
| lnE3 | 0.084 | 0.022 | 0.121 | 3.785 | |
| lnT1 | −0.105 | 0.08 | −0.095 | −1.303 | |
| lnB1 | 0.759 | 0.317 | 0.239 | 2.391 |
| Stage | Urbanization Rate | Population Size | Per Capita GDP | Construction Industry Gross Output | Tertiary Industry Value Added | Energy Intensity | Construction Industry Scale | Number of Construction Industry Employees | |
|---|---|---|---|---|---|---|---|---|---|
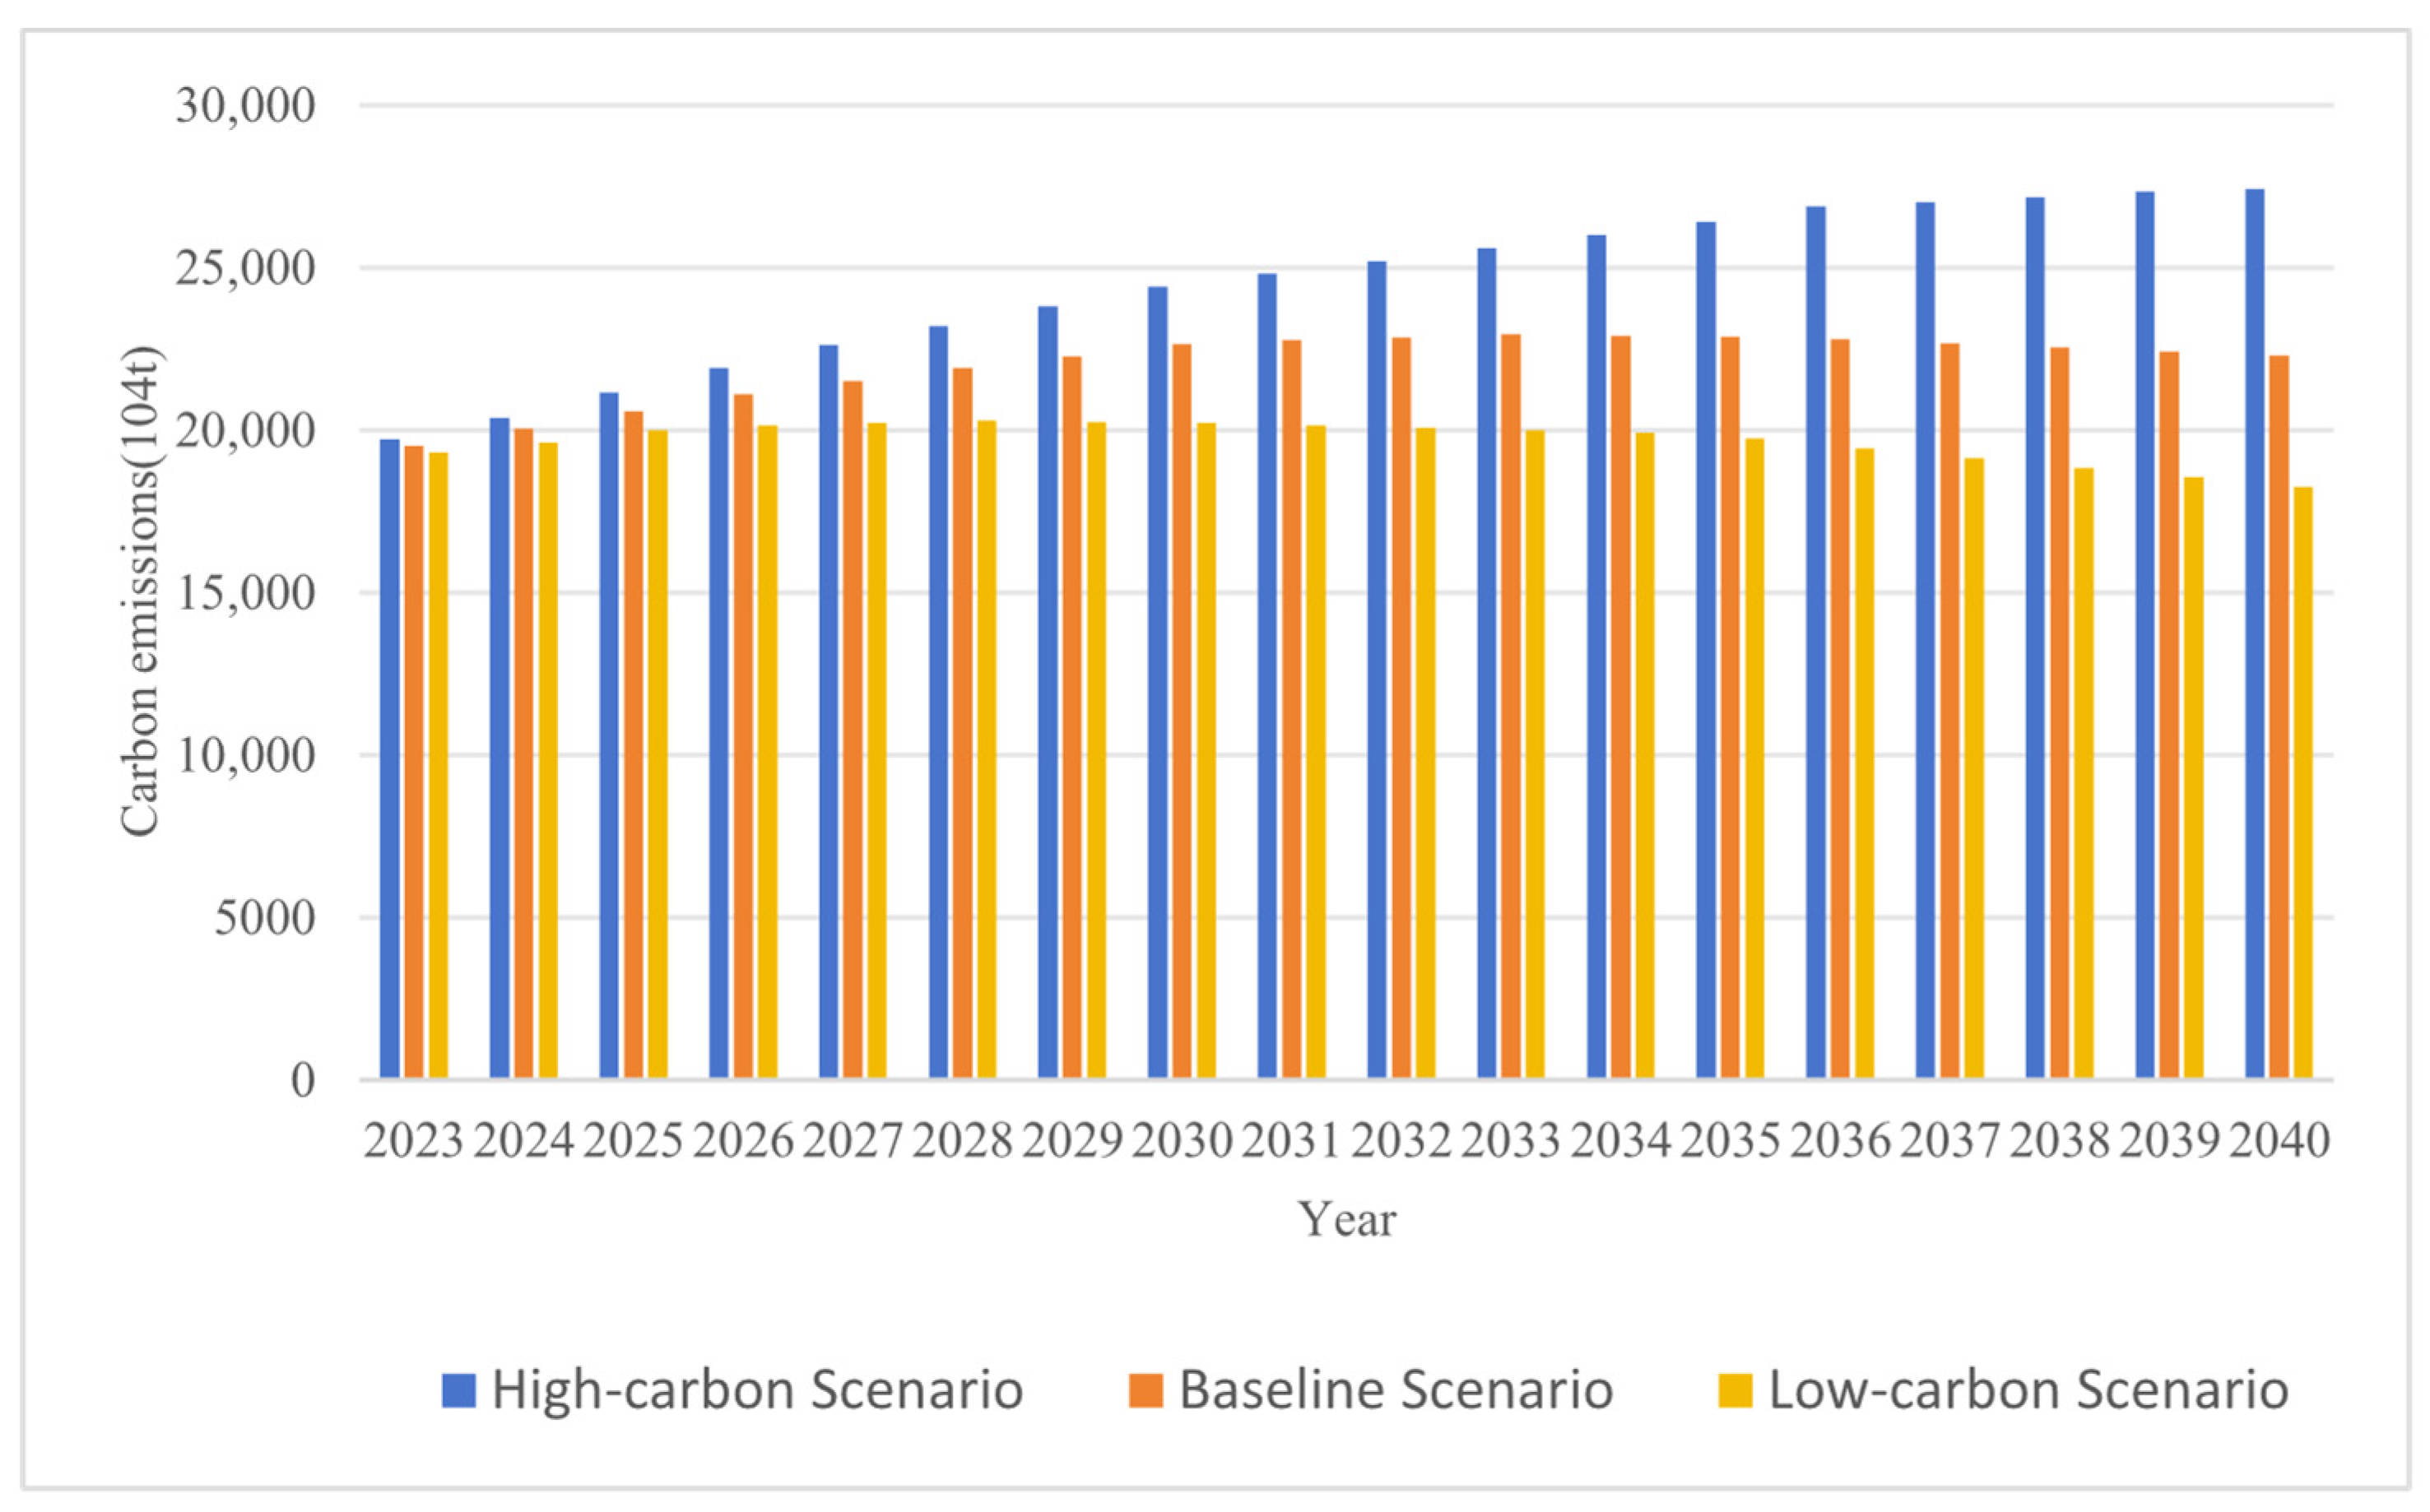
| High-Carbon Scenario | 2023 –2030 | 1.00% | 0.30% | 6.50% | 8.00% | 6.50% | −3.00% | 2.50% | 2.20% |
| 2031 –2035 | 0.80% | 0.25% | 5.50% | 7.60% | 6.30% | −3.20% | 2.30% | 2.00% | |
| 2036 –2040 | 0.50% | 0.20% | 4.50% | 7.30% | 6.10% | −3.40% | 2.10% | 1.80% | |
| Baseline Scenario | 2023 –2030 | 0.7% | 0.20% | 6.00% | 7.50% | 6% | −3.50% | 2% | 1.80% |
| 2031 –2035 | 0.50% | 0.15% | 5.80% | 7.30% | 5.80% | −3.70% | 1.80% | 1.50% | |
| 2036 –2040 | 0.30% | 0.10% | 5.60% | 7.10% | 5.60% | −3.90% | 1.60% | 1.20% | |
| Low-Carbon Scenario | 2023 –2030 | 0.30% | 0.10% | 5.40% | 7.00% | 5.50% | −4.00% | 1.50% | 1.20% |
| 2031 –2035 | 0.20% | 0.06% | 5.30% | 6.90% | 5.30% | −4.50% | 1.30% | 1.00% | |
| 2036 –2040 | 0.10% | 0.02% | 5.20% | 6.80% | 5.00% | −5.00% | 1.00% | 0.80% |
| Model Categories | Specific Models | R2 | RMSE | MAE |
|---|---|---|---|---|
| Traditional Machine Learning Models | BP Neural Network | 0.885 | 0.200 | 0.173 |
| Random Forest | 0.901 | 0.183 | 0.156 | |
| XGBoost | 0.915 | 0.167 | 0.142 | |
| Single Deep Learning Model | LSTM | 0.932 | 0.153 | 0.124 |
| CNN | 0.897 | 0.189 | 0.151 | |
| GRU | 0.928 | 0.158 | 0.129 | |
| Combined Deep Learning Models | CNN-LSTM | 0.968 | 0.082 | 0.065 |
| LSTM-Attention | 0.958 | 0.102 | 0.081 | |
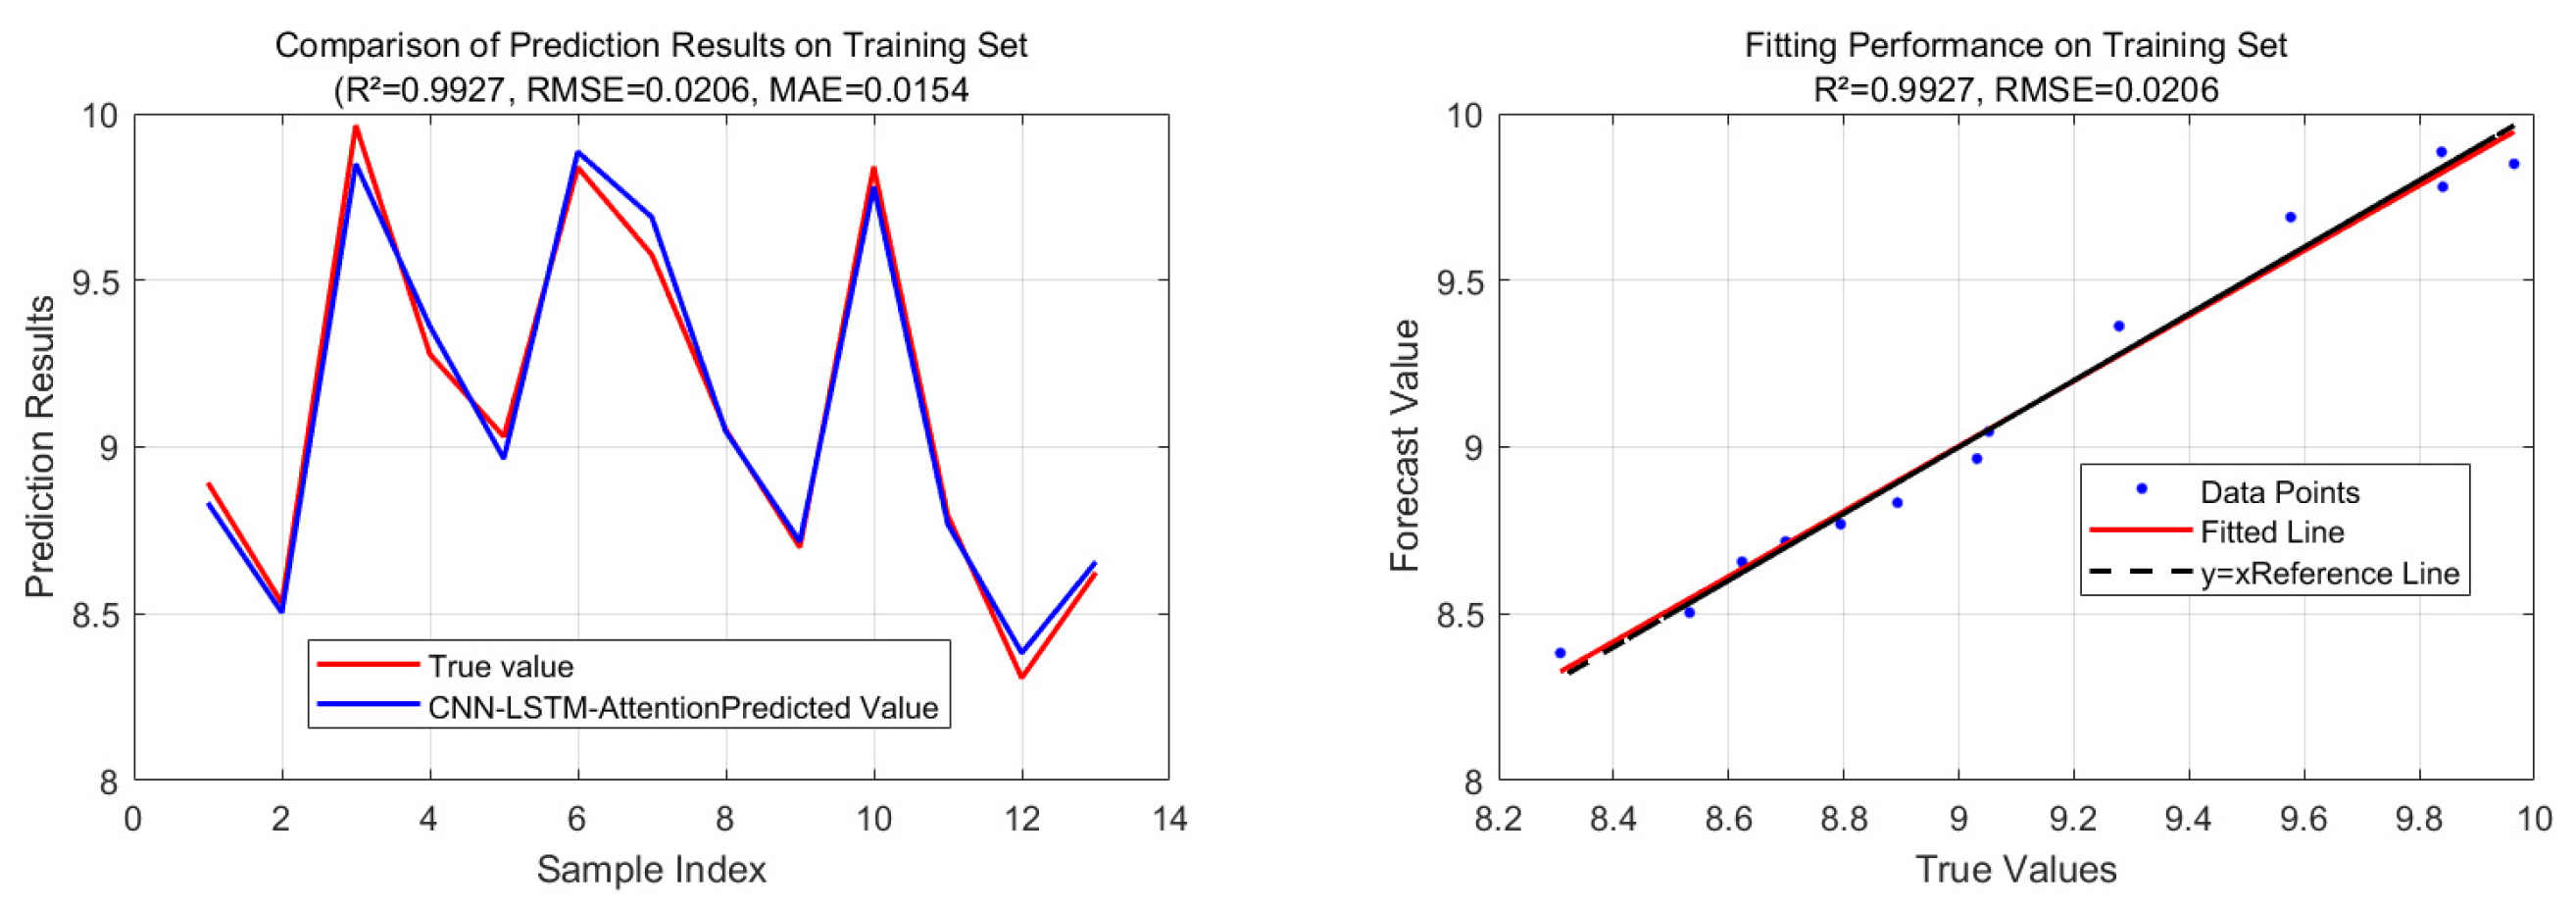
| CNN-LSTM-Attention | 0.993 | 0.021 | 0.015 |
Disclaimer/Publisher’s Note: The statements, opinions and data contained in all publications are solely those of the individual author(s) and contributor(s) and not of MDPI and/or the editor(s). MDPI and/or the editor(s) disclaim responsibility for any injury to people or property resulting from any ideas, methods, instructions or products referred to in the content. |
© 2026 by the authors. Licensee MDPI, Basel, Switzerland. This article is an open access article distributed under the terms and conditions of the Creative Commons Attribution (CC BY) license.
Share and Cite
Zeng, L.; He, Y.; Wang, H. Research on the Influencing Factors of Carbon Emissions in the Construction Industry of Hunan Province and Peak Prediction. Buildings 2026, 16, 1816. https://doi.org/10.3390/buildings16091816
Zeng L, He Y, Wang H. Research on the Influencing Factors of Carbon Emissions in the Construction Industry of Hunan Province and Peak Prediction. Buildings. 2026; 16(9):1816. https://doi.org/10.3390/buildings16091816
Chicago/Turabian StyleZeng, Linghong, Yuhang He, and Haidong Wang. 2026. "Research on the Influencing Factors of Carbon Emissions in the Construction Industry of Hunan Province and Peak Prediction" Buildings 16, no. 9: 1816. https://doi.org/10.3390/buildings16091816
APA StyleZeng, L., He, Y., & Wang, H. (2026). Research on the Influencing Factors of Carbon Emissions in the Construction Industry of Hunan Province and Peak Prediction. Buildings, 16(9), 1816. https://doi.org/10.3390/buildings16091816