Digital Empowerment and Risk Management: Dual-Path Mechanisms and Boundary Conditions for the Sustainable Transformation of the Construction Industry


Abstract
1. Introduction
2. Theoretical Foundations
2.1. Social-Technical Systems (STS) Theory
2.2. Technology–Organization–Environment (TOE) Framework
2.3. Resource-Based View (RBV)
2.4. Logical Integration of Theory and Research Focus
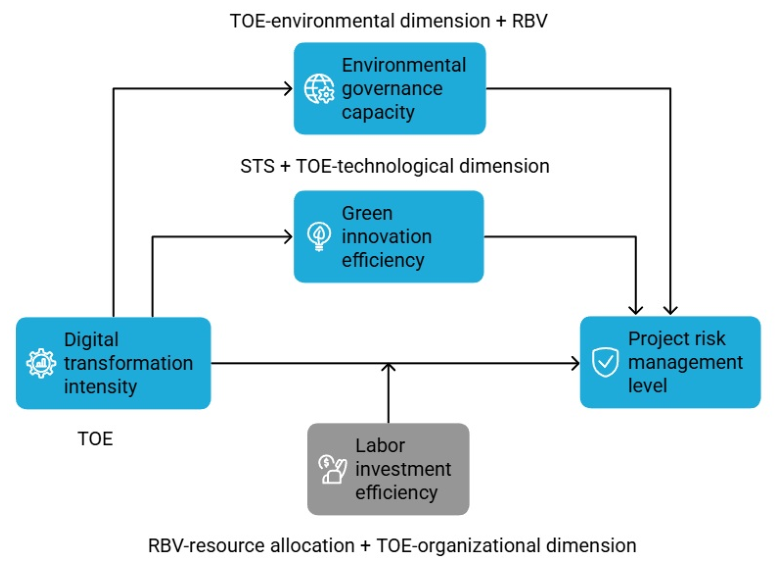
- The mediating role of environmental governance capability: Based on the TOE environmental dimension and RBV dynamic capabilities
- The mediating role of green innovation efficiency: Based on STS theory and the TOE technological dimension
- The moderating role of labor investment efficiency: Based on RBV resource heterogeneity and the TOE organizational dimension
3. Literature Review and Hypothesis Development
3.1. Digital Transformation in Construction and Project Risk Management Level
3.2. The Mediating Role of Environmental Governance Capacity
3.3. The Mediating Role of Green Innovation Efficiency
3.4. The Regulatory Role of Labor Investment Efficiency
4. Research Methodology
4.1. Sample Selection
4.2. Variable Measurement
4.2.1. Dependent Variable: Project Risk Management Level (PRML)
- Dictionary Development: We establish a specialized dictionary of risk management terminology relevant to the construction sector.
- Data Collection: Python 3.14 web-crawling technology is utilized to extract the relevant textual content from the annual reports and CSR disclosures of the sample firms.
- Text Processing: The collected texts are processed using the Jieba Chinese word segmentation library. This step identifies and aggregates the frequencies of keywords associated with four critical risk domains: operational management risks, technological innovation risks, occupational safety risks, and environmental risks.
- Quantification: The index is calculated as the natural logarithm of one plus the total frequency of risk-related terms. This logarithmic transformation mitigates the right-skewness commonly found in textual frequency distributions [32] while preserving the relative intensity of risk disclosure [33].
4.2.2. Independent Variable: Digital Transformation Intensity (DTI)
- Dictionary Development: We first establish a specialized dictionary of digital terminology relevant to construction enterprises.
- Data Collection: Python web-crawling technology is employed to collect the MD&A content from the sample firms’ annual financial reports.
- Text Processing: Utilizing the Jieba Chinese word segmentation library, the collected texts undergo segmentation and filtering. This process identifies occurrences of predefined keywords related to digital technology applications, including Big Data, Cloud Computing, the Internet of Things (IoT), Artificial Intelligence (AI), Building Information Modeling (BIM), and Digital Twin technologies.
- Quantification: The index is generated through frequency statistics of these keywords, followed by a logarithmic transformation to mitigate skewness.
4.2.3. Mechanism Variables
- Environmental governance capacity (EGC). EGC was operationalized leveraging China’s mandatory environmental disclosure regime, which requires listed firms to report environmental governance practices in annual financial reports, CSR statements, and sustainability disclosures. Following the methodological framework of Li et al. (2023) [2], we extracted eight standardized environmental disclosure items (X1–X8; operational definitions in Table 2) from these documents via the CSMAR database. A composite EGC score was generated through factor analysis. This metric holistically captures firms’ environmental stewardship from regulatory compliance and pollution control to proactive sustainability initiatives, offering a multidimensional, disclosure-based assessment that aligns with institutional expectations in China’s evolving green governance landscape.
- Green innovation efficiency (GIE). Owing to the absence of a universally standardized metric for green innovation, measurement approaches remain context-dependent across scholarly domains. To ensure construct validity and contextual relevance, this study defines GIE by manually identifying and verifying green invention patent grants using the official green patent classification scheme issued by the China National Intellectual Property Administration (CNIPA). Following established methodological precedents [37,38], we prioritized green invention patents over utility model patents, as the former undergo rigorous substantive examination and more credibly reflect firms’ capacity for high-quality, technologically substantive environmental innovation. The GIE index was computed as ln(green invention patent grants + 1) to capture the depth and quality of firms’ environmentally oriented innovation output within China’s institutional framework.
4.2.4. Control Variables
4.3. Empirical Models
5. Results
5.1. Factor Analysis Results of Environmental Governance Capacity (EGC)
- Reliability analysis: The scale exhibited strong internal consistency, with a Cronbach’s α coefficient of 0.773 (see Table 3), meeting established psychometric thresholds [48]. Removal of any single item did not elevate the α coefficient, confirming that all items stably and positively contribute to the scale’s structural reliability.
- Validity assessment: The KMO measure reached 0.831, and Bartlett’s test of sphericity was highly significant ( = 795.44, df = 28, p-value < 0.001; see Table 4), supporting data suitability for factor analysis.
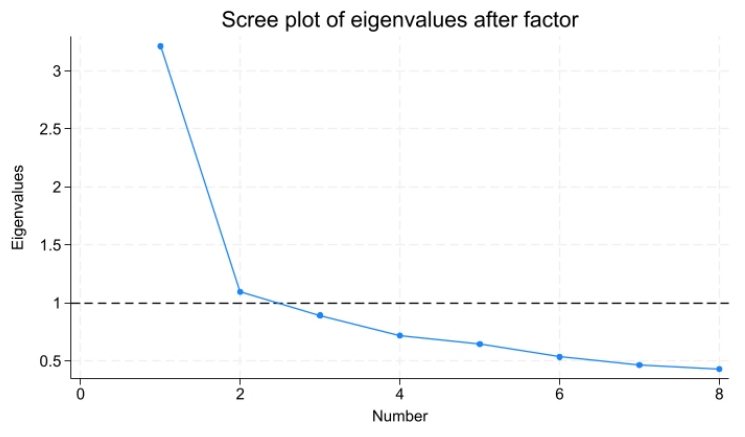
- Scree plot examination: The scree plot (Figure 2) displayed a clear inflection point after the second eigenvalue, corroborating the extraction of two factors in alignment with both empirical criteria and theoretical expectations.
- Variance explained after rotation: Following varimax rotation, the two-factor solution cumulatively accounted for 53.87% of total variance (see Table 5). By further combining Table 2 and Table 6, it can be observed that Factor 1 (F1) explained 35.23% of variance, reflecting institutional dimensions (X1–X5, and X7); and Factor 2 (F2) explained 18.64% of variance, capturing operational responsiveness (X6 and X8).
5.2. Descriptive Statistics
5.3. Model Selection Tests
5.4. Baseline Model and Mechanism Test Results
5.4.1. Baseline Model Test of DTI on PRML
5.4.2. Mediating Effect Tests
- Environmental governance capacity (EGC) pathway: The results in Column 2 demonstrate a significant positive impact of DTI on EGC ( = 0.044), indicating that digital transformation effectively strengthens corporate capabilities in environmental policy implementation, monitoring systems, and emergency response. This finding aligns with Li et al. (2023) [2], who corroborated that digital infrastructure and sensor networks facilitate real-time, refined environmental performance management. Crucially, Column 3 reveals that EGC also exerts a significant positive influence on PRML ( = 0.136). This result suggests that robust environmental governance capabilities enable the systematic identification of compliance, resource consumption, and pollution risks throughout the project lifecycle, thereby enhancing overall risk management, consistent with Chen et al. (2024) [4] and Oke et al. (2023) [15]. Furthermore, to ensure robustness, we employed the bootstrap method (1000 resample), and the results indicate that the indirect effect of DTI on PRML through EGC is 0.006, with a 95% bias-corrected confidence interval (CI) of [0.0001, 0.0003]. Since the interval excludes zero, this provides evidence supporting the mediating role of EGC (Hypothesis 2).
- Green innovation efficiency (GIE) pathway: Column 4 indicates that DTI has a significant positive effect on GIE ( = 0.178). This result supports the findings of Tian et al. (2022) [18], suggesting that technologies such as BIM, IoT, and AI accelerate green technology development through virtual prototyping, digital twin testing, and knowledge-sharing platforms. Concurrently, the analysis results in Column 5 show that GIE significantly positively impacts PRML ( = 0.030), which confirms that higher green innovation efficiency optimizes project risk management, as noted by Li et al. (2023) [2]. Digitalization-driven prefabrication and modular construction reduce material waste and carbon compliance risks while minimizing safety incidents and delays through process optimization. Similarly, the bootstrap results show a significant indirect effect through GIE (Effect = 0.0068, 95% CI [0.0021, 0.0157]). These findings suggest that GIE serves as a viable mechanism linking DTI to PRML, thus supporting Hypothesis 3.
5.4.3. Moderating Effect Test
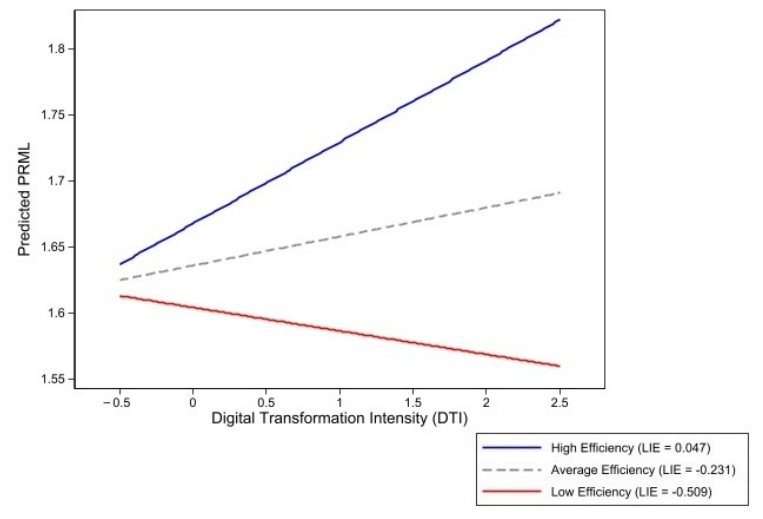
- Boundary condition of labor investment efficiency (LIE): Column 6 presents the moderating analysis. The interaction term DTI × LIE is significantly positive ( = 0.143), confirming that the positive effect of DTI on PRML is strengthened under higher labor investment efficiency (i.e., higher LIE values). Simple slope analysis (Figure 3) clarifies this boundary condition: under low-efficiency conditions ( = −0.509 = ), DTI exhibits a negative marginal effect on PRML ( = −0.018); under high-efficiency conditions ( = 0.047 = ), the effect turns positive ( = 0.062). A critical threshold is identified at LIE = −0.385 (): when LIE falls below this value, digital transformation fails to enhance risk management efficacy (marginal effect becomes negative); conversely, only when LIE exceeds this threshold does DTI significantly and positively influence PRML. This finding not only lends support to Hypothesis 4 but also underscores a pivotal practical insight: precise human resource allocation, not merely technological adoption depth, is a necessary precondition for unlocking the risk governance value of digital technologies. Human resource misallocation substantially diminishes technological efficacy, corroborating the sociotechnical systems theory tenet of “technology–organizational capability” co-evolution [7]. The quantifiable threshold further offers actionable guidance for construction enterprises implementing digital transformation initiatives.
5.5. Robustness Tests
5.5.1. Common-Source Bias Test
5.5.2. Key Variable Replacement Test
5.5.3. Heterogeneity Analysis by Nature of Property Rights
5.5.4. Quasi-Natural Experiment: Difference-in-Differences (DID) Analysis
6. Discussion
7. Conclusions and Prospects
7.1. Management Insights: Implications for China and Reference for Emerging Economics
7.2. Limitations and Prospects
Author Contributions
Funding
Data Availability Statement
Acknowledgments
Conflicts of Interest
References
- Li, L.; Luan, H.; Yin, X.; Dou, Y.; Yuan, M.; Li, Z. Understanding sustainability in off-site construction management: State of the art and future directions. J. Constr. Eng. Manag. 2022, 148, 03122008. [Google Scholar] [CrossRef]
- Li, L.; Yi, Z.; Jiang, F.; Zhang, S.; Zhou, J. Exploring the mechanism of digital transformation empowering green innovation in construction enterprises. Dev. Built Environ. 2023, 15, 100199. [Google Scholar] [CrossRef]
- Jegede, O.V.; Uzoma, C.N.; Oghenevavwarehro, R.A.; Shabi, M.O. Application of digital technologies for risk management in the Nigerian construction industry: A study of awareness and barriers. UNIABUJA J. Eng. Technol. (UJET) 2025, 2, 166–176. Available online: https://ujet.uniabuja.edu.ng/index.php/ujet/article/view/27 (accessed on 20 February 2026).
- Chen, Z.S.; Liang, C.Z.; Xu, Y.Q.; Pedrycz, W.; Skibniewski, M.J. Dynamic collective opinion generation framework for digital transformation barrier analysis in the construction industry. Inf. Fusion 2024, 103, 102096. [Google Scholar] [CrossRef]
- Zhang, J.; Chen, M.; Ballesteros-Pérez, P.; Ke, Y.; Gong, Z.; Ni, Q. A new framework to evaluate and optimize digital transformation policies in the construction industry: A China case study. J. Build. Eng. 2023, 70, 106388. [Google Scholar] [CrossRef]
- Leviäkangas, P.; Paik, S.M.; Moon, S. Keeping up with the pace of digitization: The case of the Australian construction industry. Technol. Soc. 2017, 50, 33–43. [Google Scholar] [CrossRef]
- Chen, Y.; Yin, Y.; Browne, G.J.; Li, D. Adoption of building information modeling in Chinese construction industry: The technology-organization-environment framework. Eng. Constr. Archit. Manag. 2019, 26, 1878–1898. [Google Scholar] [CrossRef]
- Bostrom, R.P.; Heinen, J.S. MIS Problems and failure: A socio -technical perspective, Part. II: The application of soci-technical theory. MIS Q. 1977, 1, 11–28. [Google Scholar] [CrossRef]
- Castro, G.D.R.; Fernandez, M.C.G.; Colsa, A.U. Unleashing the convergence amid digitalization and sustainability towards pursuing the Sustainable Development Goals (SDGs): A holistic review. J. Clean. Prod. 2021, 280, 122204. [Google Scholar] [CrossRef]
- Barney, J. Firm resources and sustained competitive advantage. J. Manag. 1991, 17, 99–120. [Google Scholar] [CrossRef]
- Teece, D.J. Explicating dynamic capabilities: The nature and microfoundations of (sustainable) enterprise performance. Strateg. Manag. J. 2007, 28, 1319–1350. [Google Scholar] [CrossRef]
- Najafi, M.R.; Zhang, Y.; Martyn, N. A flood risk assessment framework for interdependent infrastructure systems in coastal environments. Sustain. Cities Soc. 2020, 64, 102516. [Google Scholar] [CrossRef]
- Barkokebas, B.; Martinez, P.; Bouferguene, A.; Hamzeh, F.; Al-Hussein, M. Digitalization-based process improvement and decision-making in offsite construction. Autom. Constr. 2023, 155, 105052. [Google Scholar] [CrossRef]
- Musarat, M.A.; Hameed, N.; Altaf, M.; Alaloul, W.S.; Al Salaheen, M.; Alawag, A.M. Digital transformation of the construction industry: A review. In The 2021 International Conference on Decision Aid Sciences and Applications (DASA); IEEE: New York, NY, USA, 2021; pp. 897–902. [Google Scholar] [CrossRef]
- Oke, A.E.; Aliu, J.; Fadamiro, P.O.; Akanni, P.O.; Stephen, S.S. Attaining digital transformation in construction: An appraisal of the awareness and usage of automation techniques. J. Build. Eng. 2023, 67, 105968. [Google Scholar] [CrossRef]
- Olanipekun, A.O.; Sutrisna, M. Facilitating digital transformation in construction -a systematic review of the current state of the art. Front. Built Environ. 2021, 7, 660758. [Google Scholar] [CrossRef]
- Daniel, E.I.; Oshodi, O.S.; Nwankwo, N.I.; Emuze, F.A.; Chinyio, E. The use of digital technologies in construction safety: A systematic review. Buildings 2025, 15, 1386. [Google Scholar] [CrossRef]
- Tian, H.; Li, Y.; Zhang, Y. Digital and intelligent empowerment: Can big data capability drive green process innovation of manufacturing enterprises? J. Clean. Prod. 2022, 377, 134261. [Google Scholar] [CrossRef]
- Wang 2022, Y.; Shi, Y.; Yang, T.; Wang, W.; Sun, Z.; Zhang, Y. Structural performance warning based on computer intelligent monitoring and fractional-order multi-rate Kalman fusion method. Fractal Fract. 2026, 10, 186. [Google Scholar] [CrossRef]
- Kassem, M.; Ahmed, A.L. Digital transformation through building information modelling: Spanning the macro-micro divide. Technol. Forecast. Soc. Change 2022, 184, 122006. [Google Scholar] [CrossRef]
- Dallasega, P.; Rauch, E.; Linder, C. Industry 4.0 as an enabler of proximity for construction supply chains: A systematic literature review. Comput. Ind. 2018, 99, 205–225. [Google Scholar] [CrossRef]
- Luo, Q.; Sun, C.; Li, Y.; Qi, Z.; Zhang, G. Applications of digital twin technology in construction safety risk management: A literature review. Eng. Constr. Archit. Manag. 2025, 32, 3587–3607. [Google Scholar] [CrossRef]
- Van Tam, N. Mitigating digital transformation risks for circular construction in emerging economies: An empirical investigation in Vietnam. Int. J. Constr. Manag. 2025, 25, 1130–1140. [Google Scholar] [CrossRef]
- Zhai, H.; Yang, M.; Chan, K.C. Does digital transformation enhance a firm’s performance? Evidence from China. Technol. Soc. 2022, 68, 101841. [Google Scholar] [CrossRef]
- Saarikko, T.; Westergren, U.H.; Blomquist, T. Digital transformation: Five recommendations for the digitally conscious firm. Bus. Horiz. 2020, 63, 825–839. [Google Scholar] [CrossRef]
- Meng, F.; Wang, W. The impact of digitalization on enterprise value creation: An empirical analysis of Chinese manufacturing enterprises. J. Innov. Knowl. 2023, 8, 100385. [Google Scholar] [CrossRef]
- Johansen, K.W.; Schultz, C.; Teizer, J. Knowledge graph exploitation to enhance the usability of risk assessment in construction safety planning. Adv. Eng. Inform. 2025, 65, 103305. [Google Scholar] [CrossRef]
- Pantouvakis, A.; Vlachos, I. Talent and leadership effects on sustainable performance in the maritime industry. Transp. Res. Part D. Transp. Environ. 2020, 86, 102440. [Google Scholar] [CrossRef]
- Lu, Y.; Wu, Z.; Chang, R.; Li, Y. Building Information Modeling (BIM) for green buildings: A critical review and future directions. Autom. Constr. 2017, 83, 134–148. [Google Scholar] [CrossRef]
- Khedmati, M.; Sualihu, M.A.; Yawson, A. CEO-director ties and labor investment efficiency. J. Corp. Financ. 2020, 65, 101492. [Google Scholar] [CrossRef]
- Shojaei, R.S.; Burgess, G. Non-technical inhibitors: Exploring the adoption of digital innovation in the UK construction industry. Technol. Forecast. Soc. Change 2022, 185, 122036. [Google Scholar] [CrossRef]
- Loughran, T.; McDonald, B. Textual analysis in accounting and finance: A survey. J. Account. Res. 2016, 54, 1187–1230. [Google Scholar] [CrossRef]
- Campbell, J.L.; Chen, H.; Dhaliwal, D.S.; Lu, H.M.; Steele, L.B. The information content of mandatory risk factor disclosures in corporate filings. Rev. Account. Stud. 2014, 19, 396–455. [Google Scholar] [CrossRef]
- Podsakoff, P.M.; MacKenzie, S.B.; Lee, J.Y.; Podsakoff, N.P. Common method biases in behavioral research: A critical review of the literature and recommended remedies. J. Appl. Psychol. 2003, 88, 879. [Google Scholar] [CrossRef]
- Christmann, P.; Taylor, G. Globalization and the environment: Determinants of firm self-regulation in China. J. Int. Bus. Stud. 2001, 32, 439–458. [Google Scholar] [CrossRef]
- Anderson, S.B.; Mendoza, K.I.; Mongold, C. The effect of intangible asset classification on professional financial statement users’ assessments. J. Account. Res. 2025, 63, 1107–1143. [Google Scholar] [CrossRef]
- Lian, G.; Xu, A.; Zhu, Y. Substantive green innovation or symbolic green innovation? The impact of ER on enterprise green innovation based on the dual moderating effects. J. Innov. Knowl. 2022, 7, 100203. [Google Scholar] [CrossRef]
- Yang, C.; Zhu, C.; Albitar, K. ESG ratings and green innovation: AU-shaped journey towards sustainable development. Bus. Strategy Environ. 2024, 33, 4108–4129. [Google Scholar] [CrossRef]
- Jung, B.; Lee, W.J.; Weber, D.P. Financial reporting quality and labor investment efficiency. Contemp. Account. Res. 2014, 31, 1047–1076. [Google Scholar] [CrossRef]
- Ben-Nasr, H.; Alshwer, A.A. Does stock price informativeness affect labor investment efficiency? J. Corp. Financ. 2016, 38, 249–271. [Google Scholar] [CrossRef]
- Pinnuck, M.; Lillis, A.M. Profits versus losses: Does reporting an accounting loss act as a heuristic trigger to exercise the abandonment option and divest employees? Account. Rev. 2007, 82, 1031–1053. [Google Scholar] [CrossRef]
- Mändli, F.; Rönkkö, M. To omit or to include? Integrating the frugal and prolific perspectives on control variable use. Organ. Res. Methods 2025, 28, 114–137. [Google Scholar] [CrossRef]
- Bharath, S.T.; Shumway, T. Forecasting default with the Merton distance to default model. Rev. Financ. Stud. 2008, 21, 1339–1369. [Google Scholar] [CrossRef]
- Baron, R.M.; Kenny, D.A. The moderator–mediator variable distinction in social psychological research: Conceptual, strategic, and statistical considerations. J. Personal. Soc. Psychol. 1986, 51, 1173. Available online: https://psycnet.apa.org/doi/10.1037/0022-3514.51.6.1173 (accessed on 12 December 2025). [CrossRef] [PubMed]
- Wang, Q.; Zhang, F.; Li, R.; Sun, J. Does artificial intelligence promote energy transition and curb carbon emissions? The role of trade openness. J. Clean. Prod. 2024, 447, 141298. [Google Scholar] [CrossRef]
- Wang, Q.; Zhang, S.; Li, R. Artificial intelligence in the renewable energy transition: The critical role of financial development. Renew. Sustain. Energy Rev. 2026, 226, 116280. [Google Scholar] [CrossRef]
- Bullock, J.G.; Green, D.P.; Ha, S.E. Yes, but what’s the mechanism? (don’t expect an easy answer). J. Personal. Soc. Psychol. 2010, 98, 550. Available online: https://psycnet.apa.org/doi/10.1037/a0018933 (accessed on 28 November 2025). [CrossRef]
- Nunnally, J. Psychometric Theory; McGraw-Hill: New York, NY, USA, 1967. [Google Scholar]
- Faiz, F.; Le, V.; Masli, E.K. Determinants of digital technology adoption in innovative SMEs. J. Innov. Knowl. 2024, 9, 100610. [Google Scholar] [CrossRef]
- Liu, G.; Liu, J.; Gao, P.; Yu, J.; Pu, Z. Understanding mechanisms of digital transformation in state-owned enterprises in China: An institutional perspective. Technol. Forecast. Soc. Change 2024, 202, 123288. [Google Scholar] [CrossRef]
- Sacks, R.; Eastman, C.; Lee, G.; Teicholz, P. BIM Handbook: A Guide to Building Information Modeling for Owners, Designers, Engineers, Contractors, and Facility Managers; John Wiley: New York, NY, USA, 2018. [Google Scholar]
- Trist, E.L.; Bamforth, K.W. Some social and psychological consequences of the longwall method of coal-getting: An examination of the psychological situation and defences of a work group in relation to the social structure and technological content of the work system. Hum. Relat. 1951, 4, 3–38. [Google Scholar] [CrossRef]




| Variable | Description | |
| Panel A: Baseline model | ||
| Dependent variable | PRML | Project risk management level |
| Independent variable | DTI | Digital transformation intensity |
| Panel B: Mechanism tests | ||
| EGC | Environmental governance capacity | |
| GIE | Green innovation efficiency | |
| LIE | Labor investment efficiency | |
| Panel C: Control variables | ||
| DERI | Default risk | |
| ROA | Return on assets | |
| CAIN | Capital intensity = Fixed assets/total assets | |
| SIZE | Enterprise size, equal to the natural logarithm of total assets. | |
| DPI | Dual position integration means that one person holds both the chairperson and general manager positions. | |
| EBD | Equity balance degree refers to the ratio of the shareholding proportions of the second to fifth-largest shareholders to that of the largest shareholder. | |
| MSR | Managerial shareholding ratio | |
| Firm | Firm dummy | |
| Year | Year dummy | |
| Item | Description |
| X1 | Environmental protection concepts |
| X2 | Environmental protection goals |
| X3 | The environmental protection management system |
| X4 | Environmental protection education and training |
| X5 | Special environmental protection campaigns |
| X6 | Emergency response mechanisms for environmental incidents |
| X7 | Environmental protection honors or awards |
| X8 | “Three Simultaneities” system |
| Item | Obs | Sign | Item-Test Correlation | Item-Rest Correlation | Average Interitem Correlation | Cronbach’s |
| X1 | 434 | + | 0.645 | 0.502 | 0.293 | 0.743 |
| X2 | 434 | + | 0.720 | 0.599 | 0.275 | 0.726 |
| X3 | 434 | + | 0.730 | 0.612 | 0.272 | 0.724 |
| X4 | 434 | + | 0.708 | 0.583 | 0.278 | 0.729 |
| X5 | 434 | + | 0.683 | 0.550 | 0.284 | 0.735 |
| X6 | 434 | + | 0.516 | 0.345 | 0.323 | 0.770 |
| X7 | 434 | + | 0.560 | 0.397 | 0.313 | 0.761 |
| X8 | 434 | + | 0.408 | 0.220 | 0.349 | 0.789 |
| Test scale | 0.298 | 0.773 |
| Testing Indicators | Statistics |
| Bartlett test of sphericity | = 795.44, df = 28 p-value = 0.000 |
| KMO | 0.831 |
| Principle Factor | Eigenvalue | Percentage of Variance Contribution | Percentage of Cumulative Variance Contribution |
| F1 | 2.818 | 0.3523 | 0.3523 |
| F2 | 1.491 | 0.1864 | 0.5387 |
| Item | F1 | F2 |
| X1 | 0.246 | −0.037 |
| X2 | 0.156 | 0.203 |
| X3 | 0.163 | 0.197 |
| X4 | 0.250 | 0.007 |
| X5 | 0.324 | −0.163 |
| X6 | −0.070 | 0.487 |
| X7 | 0.323 | −0.270 |
| X8 | −0.189 | 0.619 |
| Variable | N | Median | Mean | SD | Min | Max |
| Panel A: Primary variables | ||||||
| PRML | 434 | 0.693 | 0.683 | 0.343 | 0 | 1.386 |
| DTI | 434 | 0.693 | 0.733 | 0.920 | 0 | 5.799 |
| Panel B: Mechanism variables | ||||||
| EGC | 434 | −0.079 | 0 | 0.399 | −0.412 | 0.920 |
| GIE | 434 | 1.099 | 1.705 | 1.758 | 0 | 6.615 |
| LIE | 434 | −0.174 | −0.231 | 0.278 | −2.84 | 0 |
| Panel C: Control variables | ||||||
| DERI | 434 | 0 | 0.102 | 0.302 | 0 | 1 |
| ROA | 434 | 0.022 | 0.026 | 0.033 | −0.156 | 0.121 |
| CAIN | 434 | 1.849 | 2.738 | 2.935 | 0.760 | 22.715 |
| SIZE | 434 | 23.852 | 24.225 | 2.275 | 19.585 | 28.697 |
| DPI | 434 | 0 | 0.150 | 0.358 | 0 | 1 |
| EBD | 434 | 0.459 | 0.590 | 0.558 | 0.008 | 3.208 |
| MSR | 434 | 0.011 | 5.045 | 11.802 | 0 | 53.598 |
| Statistic | Multivariate Mixed Model | Random Effects Panel Model | Fixed Effects Panel Model |
| B-P test (p-value) | = 433.27 (0.000) | ||
| Hausman test (p-value) | = 118.49 (0.000) | ||
| Variable | PRML | Mediating Effects | Moderating Effect | ||||
| EGC | PRML | GIE | PRML | PRML | |||
| DTI | 0.045 ** (0.023) | 0.044 ** (0.021) | 0.043 ** (0.018) | 0.178 ** (0.076) | 0.050 ** (0.023) | 0.055 ** (0.019) | |
| EGC | 0.136 ** (0.056) | ||||||
| GIE | 0.038 ** (0.015) | ||||||
| LIE | 0.114 ** (0.053) | ||||||
| DTI × LIE | 0.143 ** (0.065) | ||||||
| DERI | −0.140 *** (0.054) | −0.016 (0.051) | −0.128 ** (0.056) | −0.398 ** (0.188) | −0.117 ** (0.056) | −0.127 ** (0.057) | |
| ROA | −0.408 (0.479) | 0.306 (0.416) | −0.134 (0.465) | 0.197 (1.523) | −0.120 (0.465) | −0.308 (0.485) | |
| CAIN | −0.001 *** (0.009) | 0.003 (0.009) | 0.004 (0.009) | 0.003 (0.009) | |||
| SIZE | 0.139 *** (0.018) | −0.014 (0.021) | 0.811 *** (0.064) | −0.021 (0.023) | −0.042 (0.028) | ||
| DPI | 0.010 (0.044) | 0.031 (0.044) | 0.012 (0.045) | −0.006 (0.044) | |||
| EBD | −0.012 (0.040) | −0.064 (0.043) | −0.105 (0.145) | −0.065 (0.043) | −0.098 ** (0.044) | ||
| MSR | −0.004 (0.003) | 0.002 (0.004) | −0.032 ** (0.013) | 0.002 (0.004) | 0.005 (0.039) | ||
| Firm | Yes | Yes | Yes | Yes | Yes | Yes | |
| Year | Yes | Yes | Yes | Yes | Yes | Yes | |
| cons | 0.700 *** (0.067) | −3.390 *** (0.426) | 1.021 ** (0.499) | −17.537 *** (1.562) | 1.113 ** (0.535) | 1.662 ** (0.647) | |
| N | 434 | 434 | 434 | 434 | 434 | 434 | |
| 8.52% | 17.14% | 5.38% | 33.78% | 4.82% | 11.82% | ||
| F-value | 2.14 | 13.03 | 2.37 | 32.14 | 2.38 | 2.32 | |
| Bootstrap Sobel test | Direct-effect | 0.0429 ** (0.018) [0.0083, 0.0775] | 0.0496 ** (0.019) [0.0277, 0.0469] | ||||
| Indirect-effect | 0.0060 ** (0.004) [0.0001, 0.0003] | 0.0068 ** (0.005) [0.0021, 0.0157] | |||||
| Total effect | 0.0489 ** (0.018) | 0.0564 ** (0.019) | |||||
| Variable | (1) Common-Source Bias Test | (2) Replace Variables | (3) Heterogeneity Test | (4) DID Test | |
| PRML | PRML | State-Controlled | Non-State-Controlled | PRML | |
| DTI | 0.045 ** (0.023) | 0.046 (0.034) | 0.077 ** (0.038) | ||
| ADTI | 0.045 ** (0.023) | ||||
| Time | 0.034 (0.051) | ||||
| Treat | −0.171 (0.112) | ||||
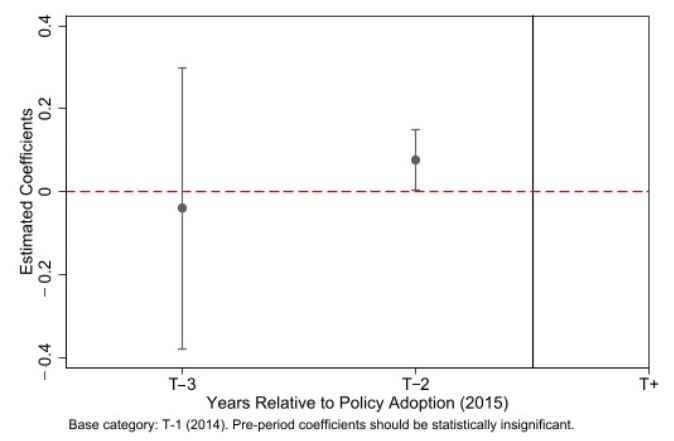
| Time × Treat | 0.255 ** (0.117) | ||||
| MD&A | −0.043 (0.047) | ||||
| DERI | −0.158 *** (0.054) | −0.140 *** (0.054) | −0.080 (0.113) | −0.164 ** (0.073) | −0.146 *** (0.055) |
| ROA | −0.480 (0.474) | −0.408 (0.479) | 0.603 (0.876) | −1.261 (0.666) | 0.412 (0.511) |
| CAIN | −0.001 (0.009) | −0.001 *** (0.009) | 0.008 (0.010) | −0.041 (0.022) | −0.093 ** (0.027) |
| SIZE | −0.010 (0.008) | ||||
| DPI | 0.012 (0.044) | 0.010 (0.044) | −0.007 (0.076) | 0.023 (0.063) | 0.008 ** (0.003) |
| Firm | Yes | Yes | Yes | Yes | Yes |
| Year | Yes | Yes | Yes | Yes | Yes |
| cons | 1.109 ** (0.442) | 0.637 *** (0.040) | 0.684 *** (0.072) | 0.756 *** (0.278) | |
| N | 434 | 434 | 434 | 434 | 434 |
| 9.29% | 8.52% | 8.67% | 15.48% | 8.51% | |
| F-value | 2.18 | 2.14 | 3.32 | 3.47 | 4.94 |
Disclaimer/Publisher’s Note: The statements, opinions and data contained in all publications are solely those of the individual author(s) and contributor(s) and not of MDPI and/or the editor(s). MDPI and/or the editor(s) disclaim responsibility for any injury to people or property resulting from any ideas, methods, instructions or products referred to in the content. |
© 2026 by the authors. Licensee MDPI, Basel, Switzerland. This article is an open access article distributed under the terms and conditions of the Creative Commons Attribution (CC BY) license.
Share and Cite
Sun, X.; Han, J.; Li, Z. Digital Empowerment and Risk Management: Dual-Path Mechanisms and Boundary Conditions for the Sustainable Transformation of the Construction Industry. Buildings 2026, 16, 1762. https://doi.org/10.3390/buildings16091762
Sun X, Han J, Li Z. Digital Empowerment and Risk Management: Dual-Path Mechanisms and Boundary Conditions for the Sustainable Transformation of the Construction Industry. Buildings. 2026; 16(9):1762. https://doi.org/10.3390/buildings16091762
Chicago/Turabian StyleSun, Xiaoyan, Jie Han, and Zhenjie Li. 2026. "Digital Empowerment and Risk Management: Dual-Path Mechanisms and Boundary Conditions for the Sustainable Transformation of the Construction Industry" Buildings 16, no. 9: 1762. https://doi.org/10.3390/buildings16091762
APA StyleSun, X., Han, J., & Li, Z. (2026). Digital Empowerment and Risk Management: Dual-Path Mechanisms and Boundary Conditions for the Sustainable Transformation of the Construction Industry. Buildings, 16(9), 1762. https://doi.org/10.3390/buildings16091762