1. Introduction
There is a complex network of subsurface utility services, broadly referred to as subsurface utility engineering (SUE), throughout the world, mainly in metropolitan areas. The most typical underground utilities include water and gas pipelines, communication and power wires, sewage pipelines, and stormwater drains. As the population grows, so does the need for these services, which are vital to a community’s everyday activities. They are made from a wide variety of materials, including metals, non-metals, and optical fibers. Subsurface utilities are complicated, and injuries, deaths, and property damage have been recorded globally due to a lack of information about their sizes, dimensions, altitudes, directions, and precise locations. Hand tools and mechanized excavation equipment are the greatest threats to underground utilities during excavation. As a result, effective subsurface infrastructure management necessitates a framework based on 4D Building Information Modeling (BIM).
The BIM process has emerged as a means to create, maintain, share, and manage dimensional and contextual data associated with a real-world facility over its lifetime. A BIM model depicts a real structure, such as a building or road, and its surroundings in a 3D virtual environment [
1]. Thus, BIM can be applied to utility infrastructure to enable the creation of 3D utility objects that are connected to their environment and can be shared, updated, and managed as a whole. Integrating 4D (Schedule) into a 3D BIM model facilitates coordination and teamwork for a range of civil infrastructure construction activities [
2]. In this way, 4D BIM enhances communication and cooperation between project stakeholders, as well as the planning, monitoring, and control of underground utility rehabilitation/installation/relocation operations. Hence, this research promotes the use of 3D models for underground utilities and combines them with schedule information (4D BIM) to accurately visualize and manage all types of utility-related work.
Construction projects often face delays due to many factors, the most significant of which is the relocation of the management of the utilities under the surface [
3,
4]. Relocation entails the shifting of underground utilities from one construction site to another. These include sewage and sewerage systems, electrical and communication cables, and gas pipes. Relocating utilities or making design changes due to complex underground utility lines is time-consuming and increases overall costs. Numerous problems can accompany relocation, but the most pressing issue, according to Quiroga et al. [
3], is the absence of subsurface utility data for areas proximate to the site. The combination of the ownership of utilities and the lack of collaboration between departments and organizations increases the complexity of obtaining information about the utilities. Many agencies and departments do not even keep records of their buried utility lines, which are often discovered during project excavations, while others keep only 2D drawings that are not very helpful. During the construction of small and large projects alike, the complexity of underground utilities often causes problems due to the relocation of utilities or deviations in the design of the project, resulting in delays and increased costs [
5]. Schedule and cost overruns could be prevented by identifying and mapping utilities and using BIM 4D in construction projects.
This issue is not limited to developing countries; several studies have pointed out that insufficient or inaccurate available underground data is a major issue faced during the relocation of underground utilities. To mitigate project delays and damage to underground utilities, developed countries have adopted many protocols, such as “call-before-you-dig” and “one-call utility” services, through which information about subsurface utilities can be obtained before excavation work has commenced [
6]. This necessitates modern technology that enables all information regarding multiple utilities to be stored, processed, and monitored.
Many issues arise during the placement of new utility lines or the expansion, relocation, or maintenance of existing facilities, resulting in damage to infrastructure, economic losses, and schedule delays for the parties involved. These issues also reduce a project’s efficiency. Undesired levels of project performance are primarily due to the lack of an integrated solution for project planning, sequencing, and control. The current approach is based on the use of several formats, in which the project timeline and project documentation are not connected. To overcome the current scattered system problems, this research sought to present a BIM-based framework in which each utility aspect is linked to its related data (e.g., construction time, materials, and cost), therefore creating an integrated system that makes the process smoother and easier for stakeholders to implement.
There is a lack of a proper system in which information about various underground utility lines could be stored—a solution consisting of more than 2D drawings, which usually get lost or damaged over time. Thus, this study proposes a framework for properly storing underground utility data for the long term. Specifically, this research aims to develop an effective 4D BIM framework for subsurface utility line management by creating sophisticated BIM models that accurately depict buried utilities. The research objectives are twofold: to develop a comprehensive 4D BIM management system and to create accurate BIM models for buried utilities using advanced BIM tools. The 4D BIM framework will integrate the latest technology to improve the planning, design, construction, and maintenance of subsurface utility lines. The accurate BIM models will help identify potential conflicts and issues during the planning and construction stages, thereby reducing the delays and costs associated with utility relocation. In doing so, this research provides a valuable contribution to the field of subsurface utility engineering and management by improving safety, efficiency, and cost-effectiveness.
The present study differs from previous studies that have proposed BIM-GIS-integrated frameworks for underground utility management [
7] in three key aspects. First, the proposed framework is explicitly based on a lifecycle approach, incorporating a dedicated data-updating stage that addresses post-construction asset management, a dimension largely absent from prior work. Second, unlike frameworks relying primarily on GIS-based spatial mapping, this study integrates multiple data acquisition methods, including UAV photogrammetry, GPR surveys, and departmental utility records, into a unified BIM environment. Third, the framework is validated through a real highway project with direct engagement and expert review from the client department, providing practical feedback on its applicability to large-scale infrastructure projects in developing countries.
The originality of the proposed framework lies in its lifecycle orientation and multi-source data integration approach. Unlike existing studies that focus on individual project phases or single data acquisition methods, this research presents a comprehensive five-stage framework that spans the period from initial data collection through long-term data updating, covering the entire operational life of underground utility assets. The framework integrates UAV photogrammetry, electromagnetic detection, and departmental records into a unified BIM environment, providing a centralized and updatable information system for utility management along highway corridors.
This research aims to develop a lifecycle BIM-based framework for subsurface utility management by creating detailed 3D/4D BIM models that accurately represent buried utilities along highway corridors. The objectives of this study are twofold: (1) to propose a structured five-stage framework covering data acquisition, processing, modeling, application, and updating for managing underground utilities throughout their project lifecycles; and (2) to validate this framework through a real-world highway case study using Autodesk Civil 3D, InfraWorks, and Navisworks. This work extends previous studies that have primarily focused on 3D visualization or GIS integration by including schedule-based (4D) simulation of utility relocation and a centralized data management approach for long-term asset maintenance.
Underground utility management will benefit greatly from this study, as the proposed method can be used to simulate a project’s workflow and deal with inefficiencies in the deployment of subsurface utilities. The data may also be used as a resource for managing assets and minimizing damage to subsurface services during excavation.
2. Literature Review
Insufficient information about how to properly install and maintain subsurface utilities can result in serious injuries or damage to other facilities, as the information is generally only available in the form of spreadsheets, PDFs, or 2D designs. Such concerns make it exceptionally difficult to determine the precise depths, directions, and connections of the underlying utility systems [
8]. Many of these issues are aggravated by the use of the traditional working approach. Every year, several major accidents, deaths, and incidents of damage to property are caused by excavations that have catastrophically impacted buried utility lines. Excavating equipment operators regularly hit utility lines due to a lack of depth details on the utility marks, unreliable position data, and insufficient visual assistance [
7].
Poor planning, design, and scheduling may lead to significant delays and disturbances on-site, which reduces productivity. Problems related to materials and equipment may also arise [
9]. The global construction industry needs new technologies to provide certainty, cost savings, and time efficiency. BIM is the most significant technology ready for full implementation at this time [
10]. There is the potential to develop digital management solutions to address issues in the construction industry as 4D BIM is developed [
11]. Together, 3D models and project activity simulations increase risk identification and information flow; this speeds up project completions and helps avoid rescheduling.
Having many subcontractors contributes to the complexity of a building project, which increases the likelihood of setbacks, as well as schedule and cost deviations. Implementing 4D BIM, rather than conventional 2D drawings and sequencing methodologies, is tremendously useful for practitioners, as it improves communication and allows them to make well-informed decisions [
12,
13]. Additionally, the use of 4D BIM shortens project timelines and makes it possible to easily compare projected progress to actual development [
14]. As an added benefit, 4D BIM can create extremely useful project status reports and allow for the early detection of hazards so that appropriate corrective steps can be taken.
According to Sloot et al. [
15] and Zanen et al. [
13], 3D and 4D models have become increasingly popular ways to aid the management of construction projects. However, managers still face difficulties in using BIM efficiently, and they presently implement it in only one area.
Many researchers have used 3D and 4D CAD-based models, along with other approaches, to visualize underground utilities and obtain better coordination during construction. However, utilities have been represented in 2D polyline shapes, and their third dimension has been represented as an elevated topological aspect [
16], which is almost the same as the traditional 2D drawings. Moreover, spatial features have been integrated with CAD systems using different approaches to manage utility information. CAD platforms and Oracle have been used to visualize and update pipe networks in 3D and to store the data, respectively [
17]. The simulation and integration of utility placement techniques used for 4D CAD with utility infrastructure have been conducted using 3D models and schedule data (time) [
18]. When utility management work was being conducted, 4D CAD helped identify utility boundaries and issues with the schedule. Nevertheless, those models are not parametric; therefore, information such as utility type, material, and ownership cannot be incorporated. Thus, the CAD models are suitable for updating, analyzing, managing, and sharing utility information throughout a project’s lifecycle. Therefore, it is necessary to utilize BIM concepts in order to effectively manage utility construction projects throughout their lifecycle.
2.1. Underground Utilities
One of the most challenging GPR applications in the construction industry is the mapping and positioning of underground utilities. This is because the irregular patterns of utility alignment, altitude, components, and earth strata in urban areas are frequently unusual in comparison to those of other facilities, such as concrete-based structures. GPR is frequently employed for mapping and positioning underground features such as pipes, cables, tanks, drums, and burials. The range of GPR surveys is adequate in urban areas for locating subsurface items of interest that are generally a few meters below the earth’s surface.
In response to the risks associated with unlocated utilities, and following several deadly incidents resulting from subsurface utility breakage during earthwork, various countries have created strong legislation for safe excavation. Several countries, including the United States and Canada, have implemented the “one-call system” or “call before you dig” legislation to receive utility tracking services through a specialized organization. This system is utilized by construction workers to reach the utility-owning authority in order to identify the positions of relevant objects and obtain placement information. It is also necessary to communicate with providers before digging. Alternatively, this may result in penalties from the officials. This procedure aids in reducing and minimizing utility strikes.
Additionally, various governments have produced standards for tracking underground utilities, stating the responsibilities of the construction parties [
19]. For example, the United States (CI/ASCE 38-02), Canada (CSA S250), the United Kingdom (PAS 128), and Australia (AS 5488-2013) have accessible utility tracking standards and recommendations that cover three fundamental concepts: acquisition of subsurface data, techniques for acquiring such data, and delivery of said data to the customers. However, many third-world nations lack utility management standards. As such, subsurface-detection technologies must be deployed to avoid utility strikes and safeguard workers, thus saving time, cost, and lives.
Developed countries have color codes in place to indicate facilities by marking them on the ground. For instance, the United States labels its utilities using the American Public Works Association (APWA) code. Red denotes an electric cable, yellow represents a gas line, and blue indicates a water pipe. The standard colors used by temporary surface markings make it easy to determine what type of facility is present. The marks are placed in a way that maintains some tolerance for the underground utility, providing an advantage when excavating with extreme caution.
It is crucial to ensure that underground utilities are made apparent during excavation operations. Among its numerous aspects, the term “accuracy” encompasses the location accuracy of underground utilities, a factor which is of utmost importance. Scholars have introduced different methodologies for quantifying inaccuracy. The buffer zone strategy was developed by Goodchild and Hunter [
20] to improve linear feature positional precision. Similarly, a confidence zone including a genuine feature line was proposed [
21]. Further, using a stochastic process theory, Shi and Liu (2000) [
21] created the “G-Band” model to include the error eclipse at random locations. Meanwhile, the “IDEAL visualization framework” proposed by Talmaki et al. [
22] illustrates utility location difficulties as a band or cylinder, also referred to as an “uncertainty buffer”. Finally, a 3D uncertainty band was proposed by Li et al. [
23] using a probabilistic approach.
2.2. Building Information Modeling
BIM is a computer-aided design and drafting technique that combines 3D modeling, BIM tools, and project information management. BIM allows architects, engineers, and contractors to use one common set of information over the lifespan of a building project, from pre-construction through the construction and occupancy stages. Throughout the lifecycles of building projects, BIM is used for communication among all participants (owners, architects, engineers, contractors, specialty consultants, subcontractors, and fabricators/manufacturers), as well as regulatory agencies such as zoning boards or fire marshals. BIM provides an integrated view of current and future conditions on-site, with immediate access provided to historical changes in geometry and changes to materials’ properties, quantities, and other relevant parameters over time.
Some practitioners have considered BIM as a process and a tool, while others believe it is more about people and processes than about technology. One of BIM’s key aspects is its deliverable models. Abdirad [
24] explained that the human BIM dimension refers to the person who professionally operates BIM tools.
BIM encompasses tools, methods, and technologies, aided by digitally readable documents regarding a facility’s performance, design, execution, and operation [
25]. 4D BIM adds a time constraint to a 3D model by relating attributes of a construction project (RIBA, 2012) [
26]. The goal of 4D BIM is to handle information and manage project timelines [
27], and its capacity to access all available resources aids decision-makers in compensating for schedule delays. Despite this technological advancement, practitioners do not take full advantage of this innovation with regard to the lessening of the duration of construction [
28].
BIM and its many tools are utilized in most parts of the world for projects of all sizes. The BIM software packages most commonly used in the construction industry include Revit, Navisworks, Vectorworks, AECOsim Building, Tekla Structure, Tekla BIMsight, ArchiCAD, IrisVR, Virtual Construction Konstru, BIM Object, Trimble Connect, and SketchUp Bentley. Since the BIM environment is very broad, each of these tools focuses on one aspect. Tekla Structure, for instance, focuses on structural design, while VectorWorks is primarily concerned with interior design and architectural work. Revit provides a broader scope and can address several aspects.
2.2.1. BIM Adoption and Timeline
BIM is adopted in three stages: object-based modeling, model-based collaboration, and network-based BIM. According to Ahuja et al. [
29], BIM levels 0, 1, 2, and 3 are defined by the UK BIM Association (UKBIMA) and are commonly used across developed countries, such as the UK, the US, Australia, and Singapore. However, developing countries are still struggling to adopt BIM and have a lower rate of implementation compared to developed countries. As an example, in Brazil, policymakers stress BIM’s adoption in small construction companies [
29,
30].
Adopting BIM enables practitioners to evaluate alternative design scenarios in the early project phases, potentially reducing energy consumption by approximately 15% [
31]. However, the adoption of BIM in the AEC industry still faces challenges, including insufficient training, resistance to workflow changes, and concerns about data transparency among stakeholders [
14,
32].
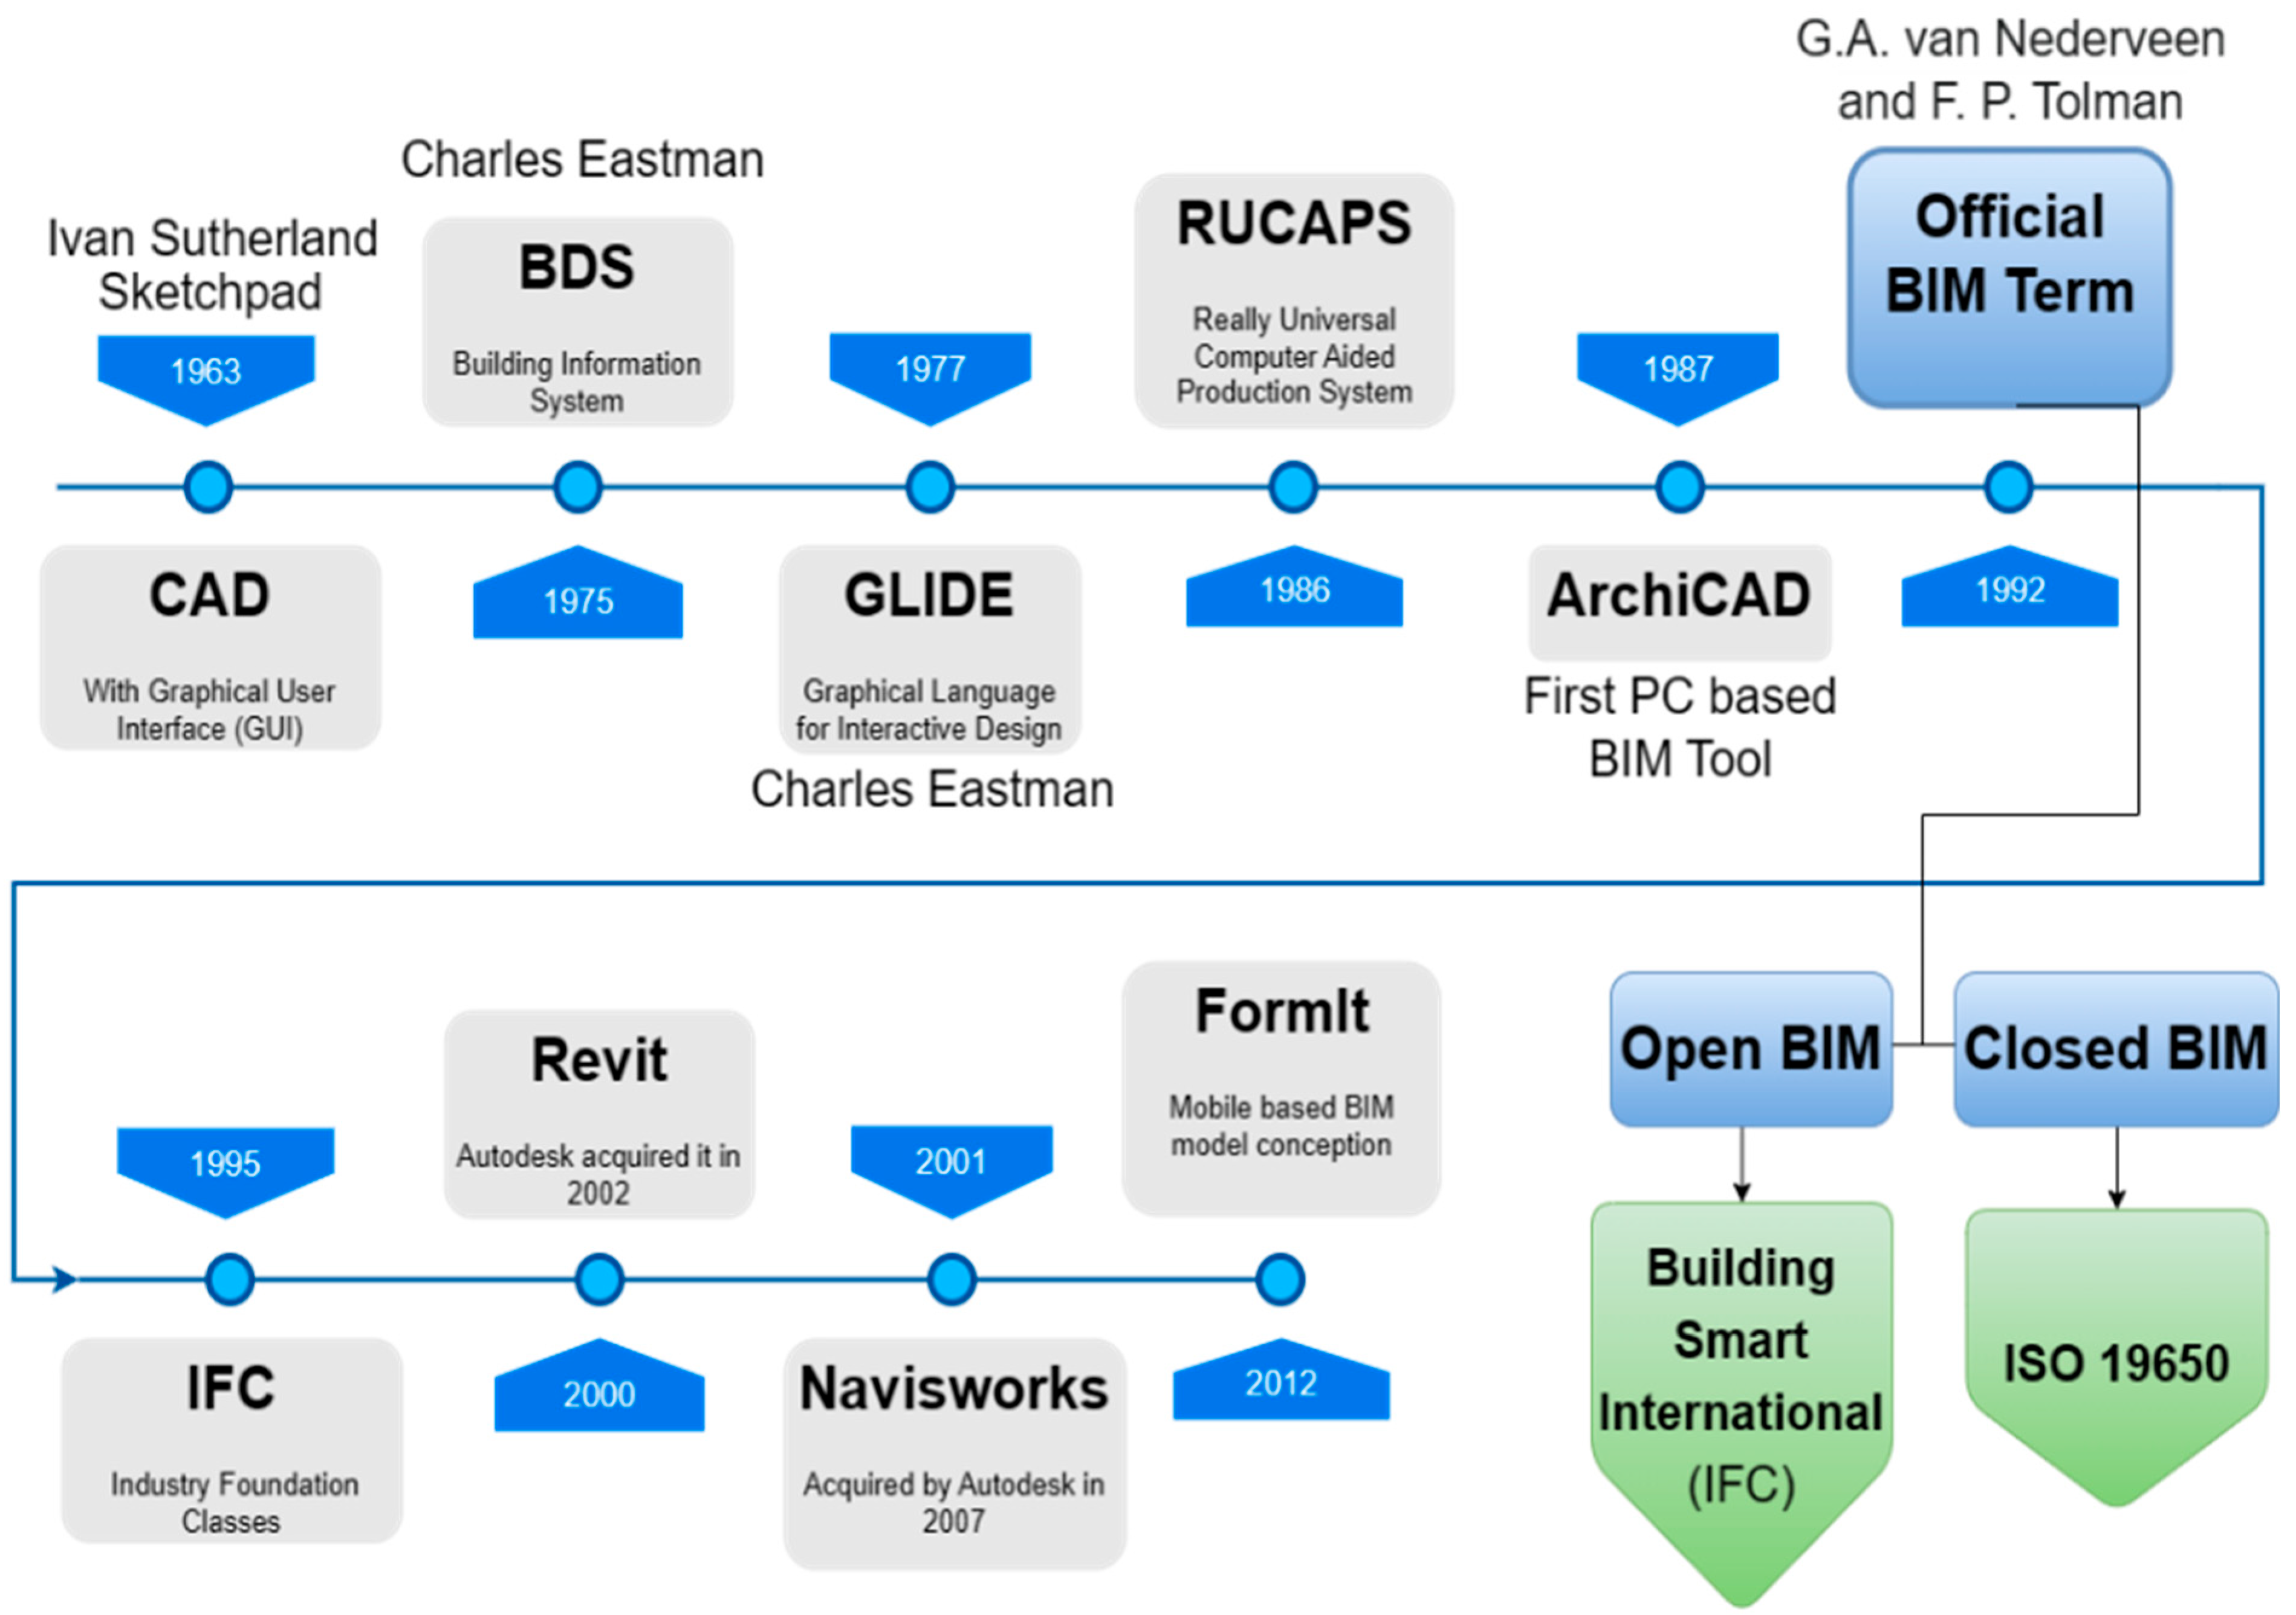
Figure 1 shows the complete chronological BIM timeline.
2.2.2. BIM Standards
The committee responsible for managing construction works is ISO/TC 59/SC13, and the dedicated ISO standard for BIM is 19650.
Table 1 presents the ISO 19650 series of standards for BIM information management.
2.2.3. BIM Dimensions
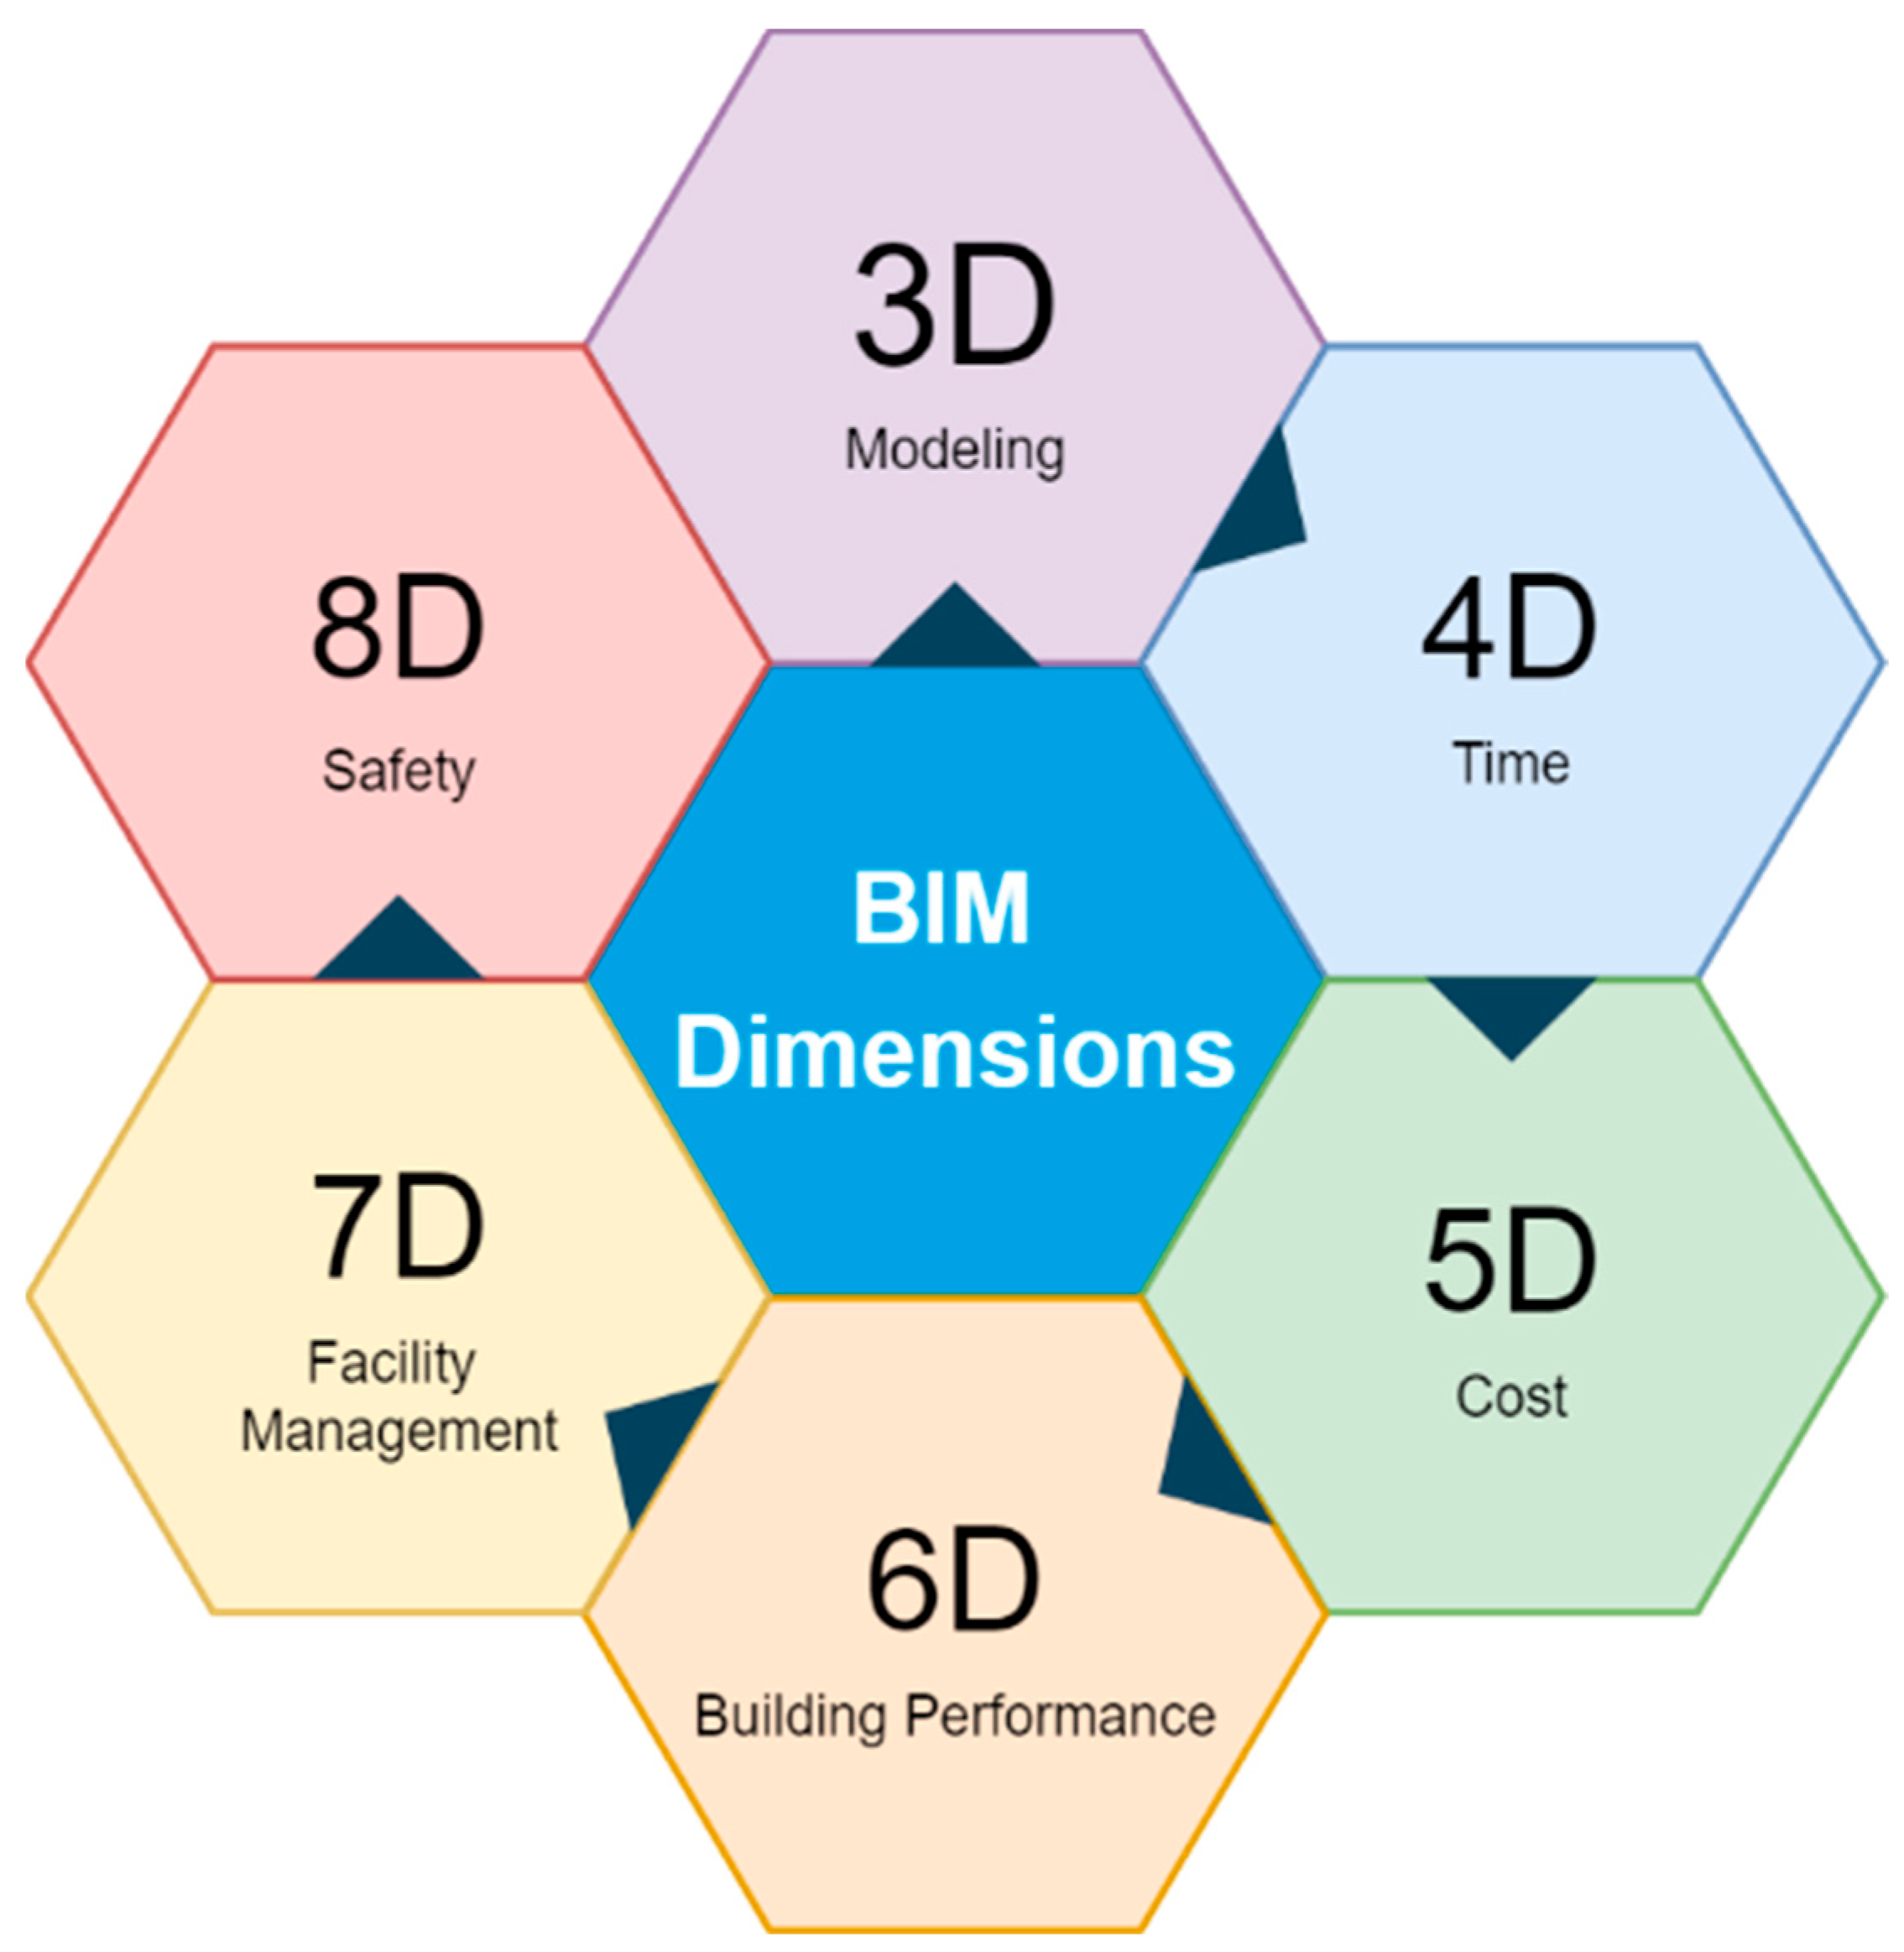
3D BIM allows users to visualize a project in a 3D space and solve structural problems throughout its life; 4D BIM adds the time dimension to the equation, allowing for better project planning and management. Beyond this, 5D BIM adds the cost dimension, 6D BIM focuses on asset performance, 7D involves facility management, and 8D BIM aids safety management. While implementing BIM can be challenging, it can also provide numerous benefits to construction and other industries.
Table 2 summarizes the BIM dimensions from 3D through 8D;
Figure 2 presents a visual description of the dimensions.
2.3. BIM for Underground Utilities
The basic application of BIM for underground infrastructure has been utilized for the 3D visualization of existing utilities, as well as to find clashes and manage information. Zhao et al. [
33] created a 3D water distribution pipeline by integrating BIM and GIS, while Chong et al. [
6] used 3D modeling to locate underground utilities and potential conflicts. BIM is an information system that aids in collecting, modifying, sharing, and managing project information over the lifespan of a project [
2]. It has been used to manage underground pipeline information through road information modeling (RIM) in a 3D environment. As a database, 3D RIM makes it possible to find existing utility information, illustrate it, and share its exact size, shape, and form, which aids the maintenance of utilities and roads [
34].
Despite BIM’s richness in data, it cannot manage geospatial data. However, the integrated use of BIM and GIS technology allows both spatial and geometric information to be managed [
35]. Liu and Issa [
36] created 2D maps in GIS in order to generate 3D integrated models during the planning and execution phases of BIM. These models were then used to illustrate and locate the placement and positions of subsurface utility lines for future maintenance works. Similarly to researchers who applied BIM to manage and evaluate inspection data, McGuire et al. [
37] and Wang et al. [
38] augmented 3D BIM models with GIS to manage conditional data such as the condition rating, maintenance, and inspection of specific underground utilities.
Chong et al. [
6] and Zhao et al. [
33] stated that studies on BIM for underground utilities management have only addressed 3D modeling. A few studies have examined the use of BIM to maintain and manage underground utility data [
34]; these studies were confined to 3D modeling. Chang and Lin [
34] and Liu and Issa [
36] found that 4D BIM models are used to coordinate and manage bridge and road infrastructure projects.
However, it has yet to be investigated how 4D BIM can be applied to underground utility management processes, such as installation, relocation, rehabilitation, and extension. To fill this gap, this study developed 4D BIM models of subsurface utilities to support planning, visualization, communication, and 4D simulation.
2.4. Ground Penetrating Radar (GPR)
It is inadvisable to dig before knowing what is buried beneath the surface. Unfortunately, this occurs frequently with costly infrastructure like bridges, roads, and underground utilities. It also happens in the residential context, which could be even riskier [
39]. Many individuals involved in infrastructure are unaware of modern scanning options and do not incorporate imaging into their investigations.
Ground penetrating radar (GPR) is among the most popular technologies used for photographing infrastructure near the earth’s surface. GPR is an ultra-wideband (UBW) radio wave instrument with a broad frequency range, from 10 to 5000 MHz. It transmits radio waves into a structure and differentiates between material properties based on echoes identified within the structure. The GPR receiver detects the scattered reflected signals using progressive wave processing and image reconstruction systems. These signals are then converted into a 3D representation of the underground area, enabling the “visibility of invisible things.”
GPR’s operational mechanism is based on electromagnetic wave propagation through subsurface materials. GPR systems typically operate in two frequency ranges (10–10,000 and 10–5000 MHz). The antenna that produces and detects signals must have dimensions that are compatible with the appropriate wavelength [
40].
Table 3 lists the recommended GPR frequency ranges for different targets of investigation.
A GPR generates electromagnetic radiation that infiltrates the investigated material. An electromagnetic wave comprises two vector fields—an electric and a magnetic field—propagating as a wave through a material. The rate of transmission, loss, polarization changes, and signal diversion are affected by changes in the material’s electric and magnetic characteristics. Construction materials such as rocks, soil, and concrete are commonly believed to be lossy dielectrics composed of several types of constituents. A certain soil’s constituents could be, for example, mineral grains, air, and water.
2.5. Visualization of Data
Traditionally, underground utilities are visualized using “as-built” 2D paper drawings that show where utilities were placed in the field. One-call field marking employees utilize this type of visualization to tag utilities by flagging them or spraying paint on them. These marks direct workers and excavator operators. With the increased usage of computers, paper drawings have been replaced by digital CAD drawings and GIS data presented in a two-dimensional manner.
Bruce [
39] utilized GIS on portable field monitors with a combination of subsurface detectors for utilities and cable to visualize underground pipelines. Representing the ambiguity linked to a dataset is critical for enabling users to make educated judgments in the field. The visualization by Beck et al. [
41] illustrates the precision of a certain utility location by using varying degrees of blurring and diverse colors. They displayed 2D utility data from diverse sources, utilizing a demonstration and deployment via a web-based service. In recent years, 3D GIS has been useful in urban development, roadway construction, and geospatial analysis [
17]. With the utilization of depth information, utility lines may be shown perpendicularly from their point of reference in a virtual environment using 3D models (such as cylinders) in order to provide depth information. Huang and Cheng [
42], for example, developed the Ajax3D and X3D frameworks in a user browser and a server-side browser, respectively, to create a web-based interactive representation of three-dimensional pipelines and the transfer of data.
Owing to rapid developments in the computational capacity of mobile phones and other portable devices, these devices can run relatively heavy graphical programs that were formerly available exclusively on desktop workstations. As a result, field excavation crews and utility inspectors may benefit from 3D visualization of subsurface utility networks by making better judgments on-site, which in turn leads to increased productivity and safety during excavation.
2.6. Summary and Research Gap
The literature review reveals that BIM has been increasingly applied to underground utility management, primarily for 3D visualization, clash detection, and GIS-based spatial data integration [
6,
33,
38]. GPR and electromagnetic detection technologies effectively locate buried utilities, while UAV photogrammetry enables users to efficiently acquire surface data. However, several research gaps remain. First, existing BIM-based utility management studies have largely been confined to 3D modeling, with limited integration of schedule (4D) information for construction sequencing and utility relocation planning. Second, there is a lack of lifecycle-oriented frameworks that address the design and construction phases as well as long-term data maintenance and updating. Third, the application and validation of such frameworks in developing countries, in which utility records are often incomplete or absent, remains underexplored. This study addresses these gaps by proposing a five-stage lifecycle BIM framework and validating it through a real-world highway project.
3. Methodology
This study adopts a framework-based research methodology combining desktop analysis, field data collection, BIM, and expert validation. The research procedure comprises four phases: (1) data acquisition from multiple sources, including government authorities, utility-owning departments, field surveys, and satellite imagery; (2) data processing to convert raw field data into georeferenced 3D datasets; (3) integrated BIM using Autodesk Civil 3D (2024) for detailed design, InfraWorks (2024) for terrain modeling and visualization, and Navisworks Manage (2024) for 4D schedule simulation and quantity analysis; and (4) expert review with the client department to evaluate the framework’s practical applicability. This procedure was applied to a case study involving the Swat Motorway Phase II project to validate the proposed framework.
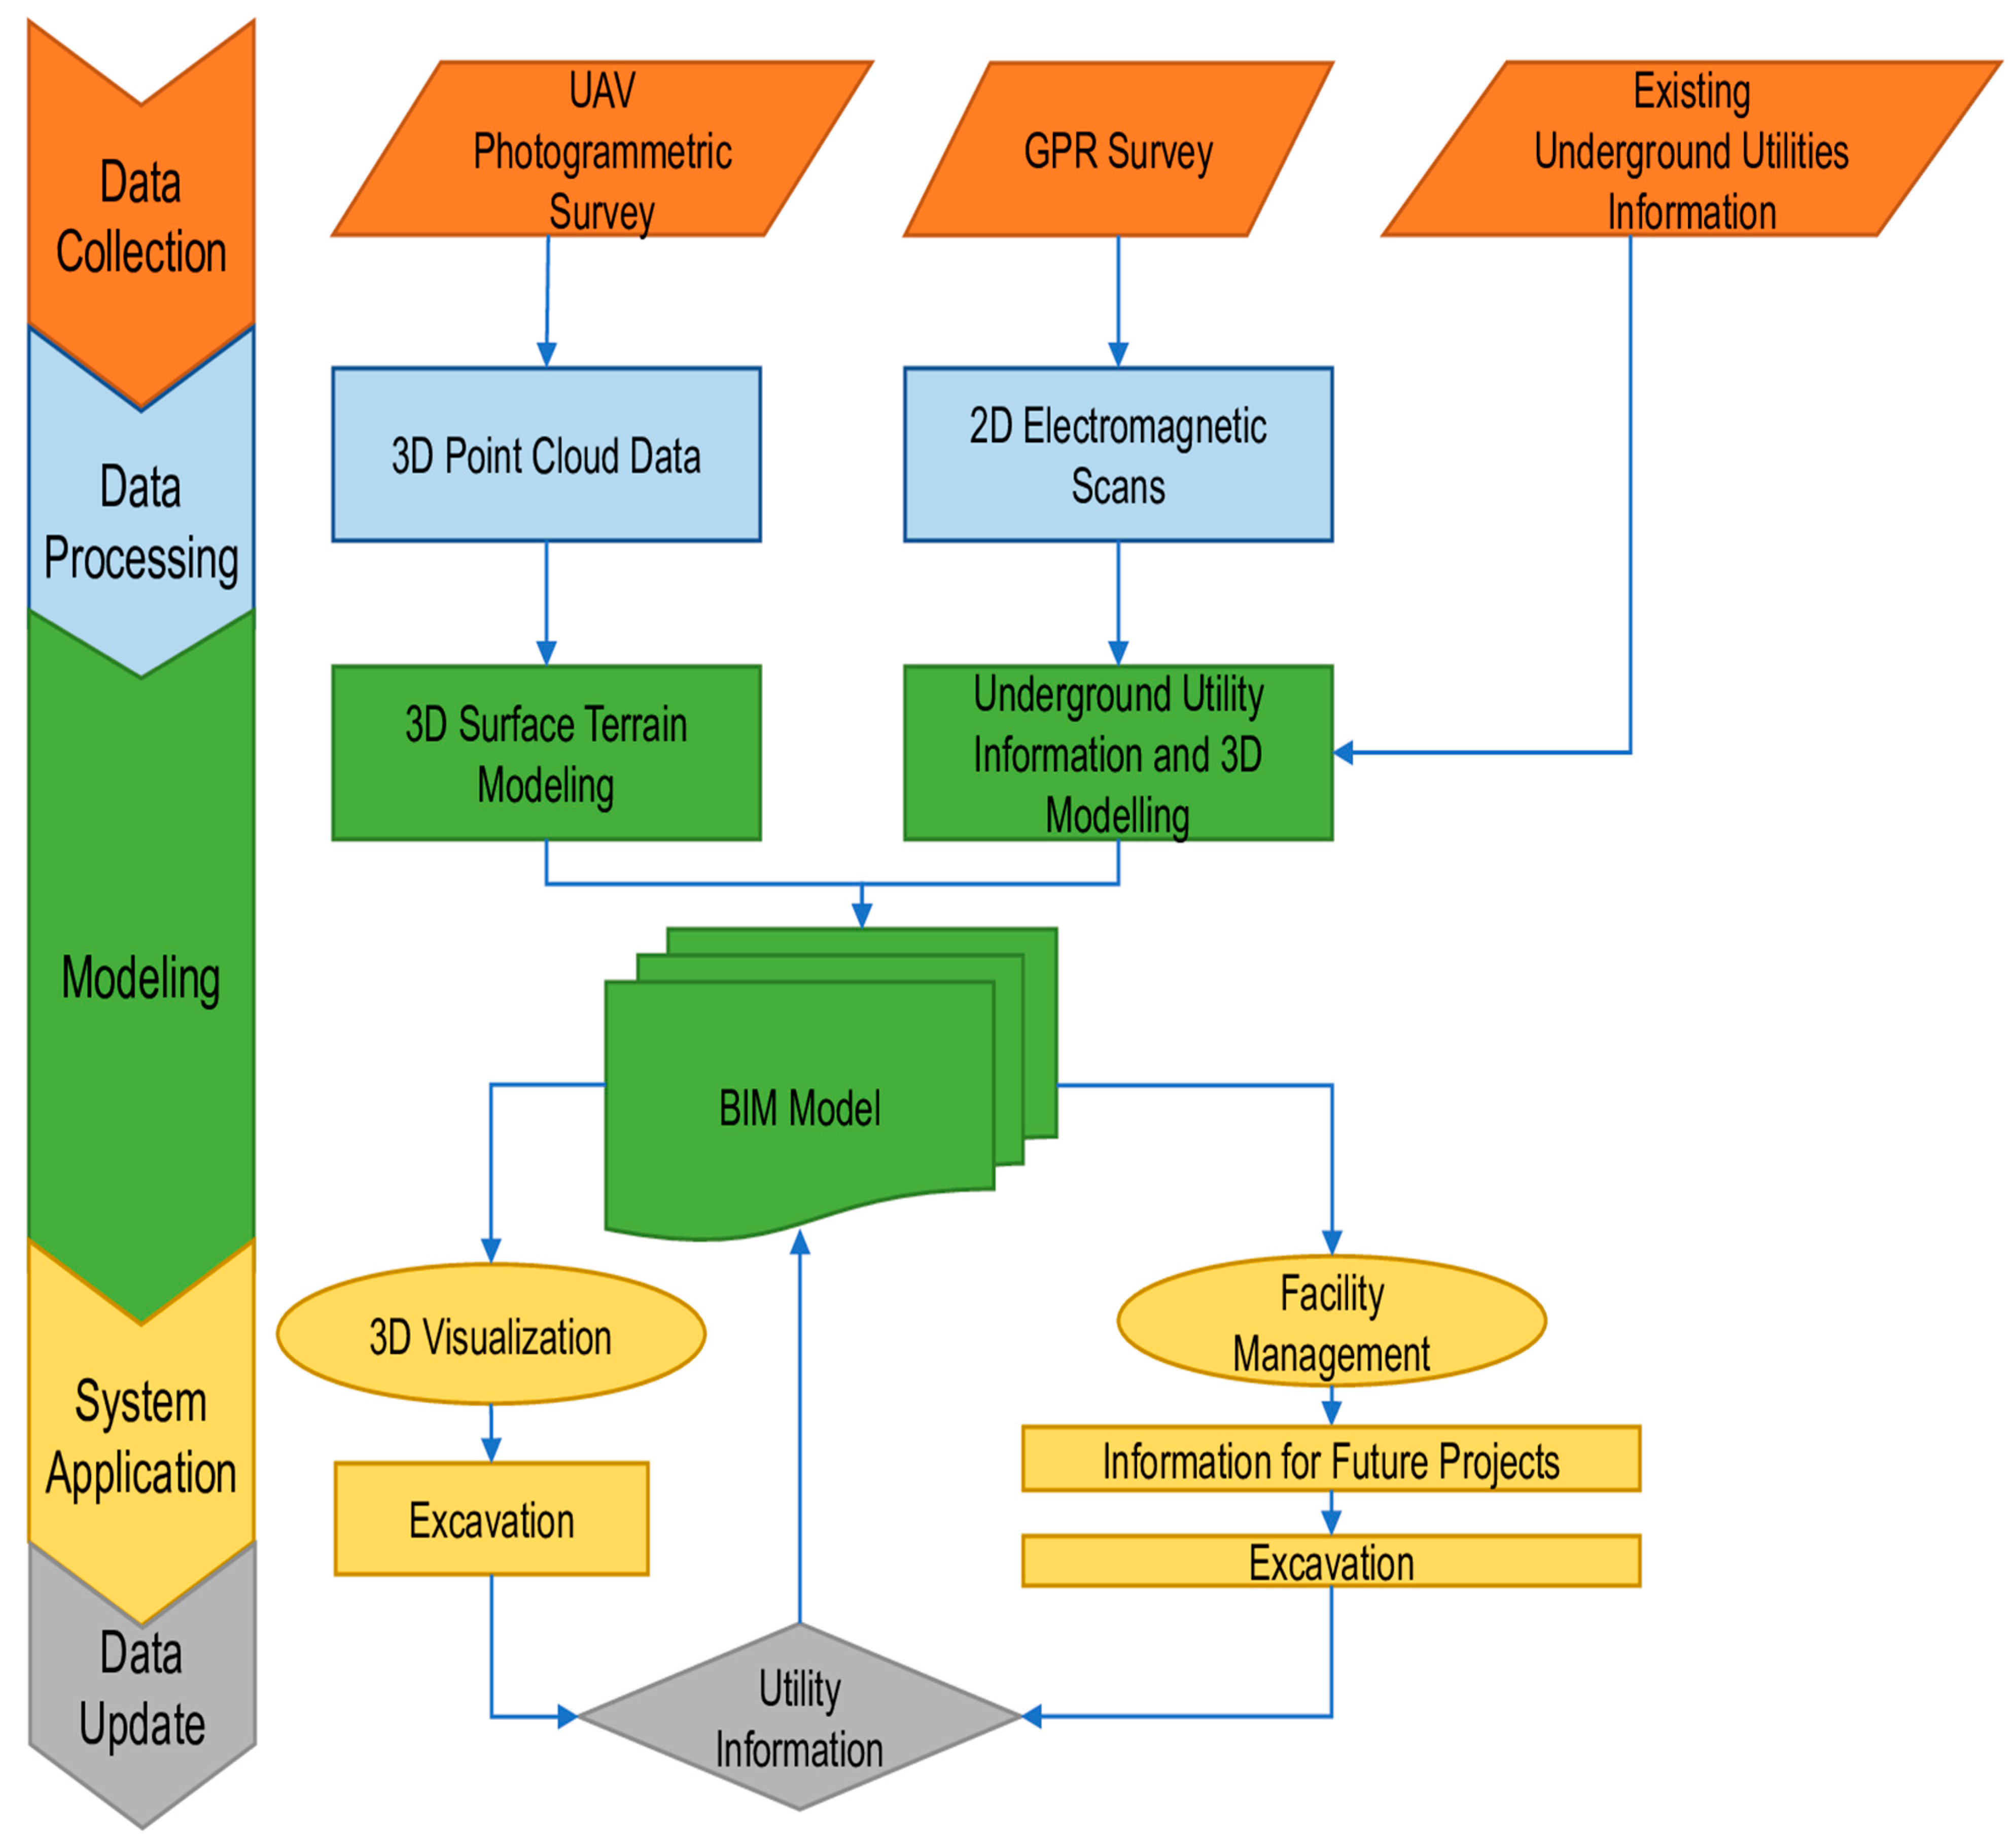
The study focused on 3D modeling and the visual presentation of highway and surrounding subsurface utilities, as well as the integration of other data, such as its timelines, expenditures, and so on. The methods described below were used to gather road data and simulate subterranean utilities in a BIM environment. The overall methodology adopted in this study is presented in
Figure 3.
3.1. Data Collection
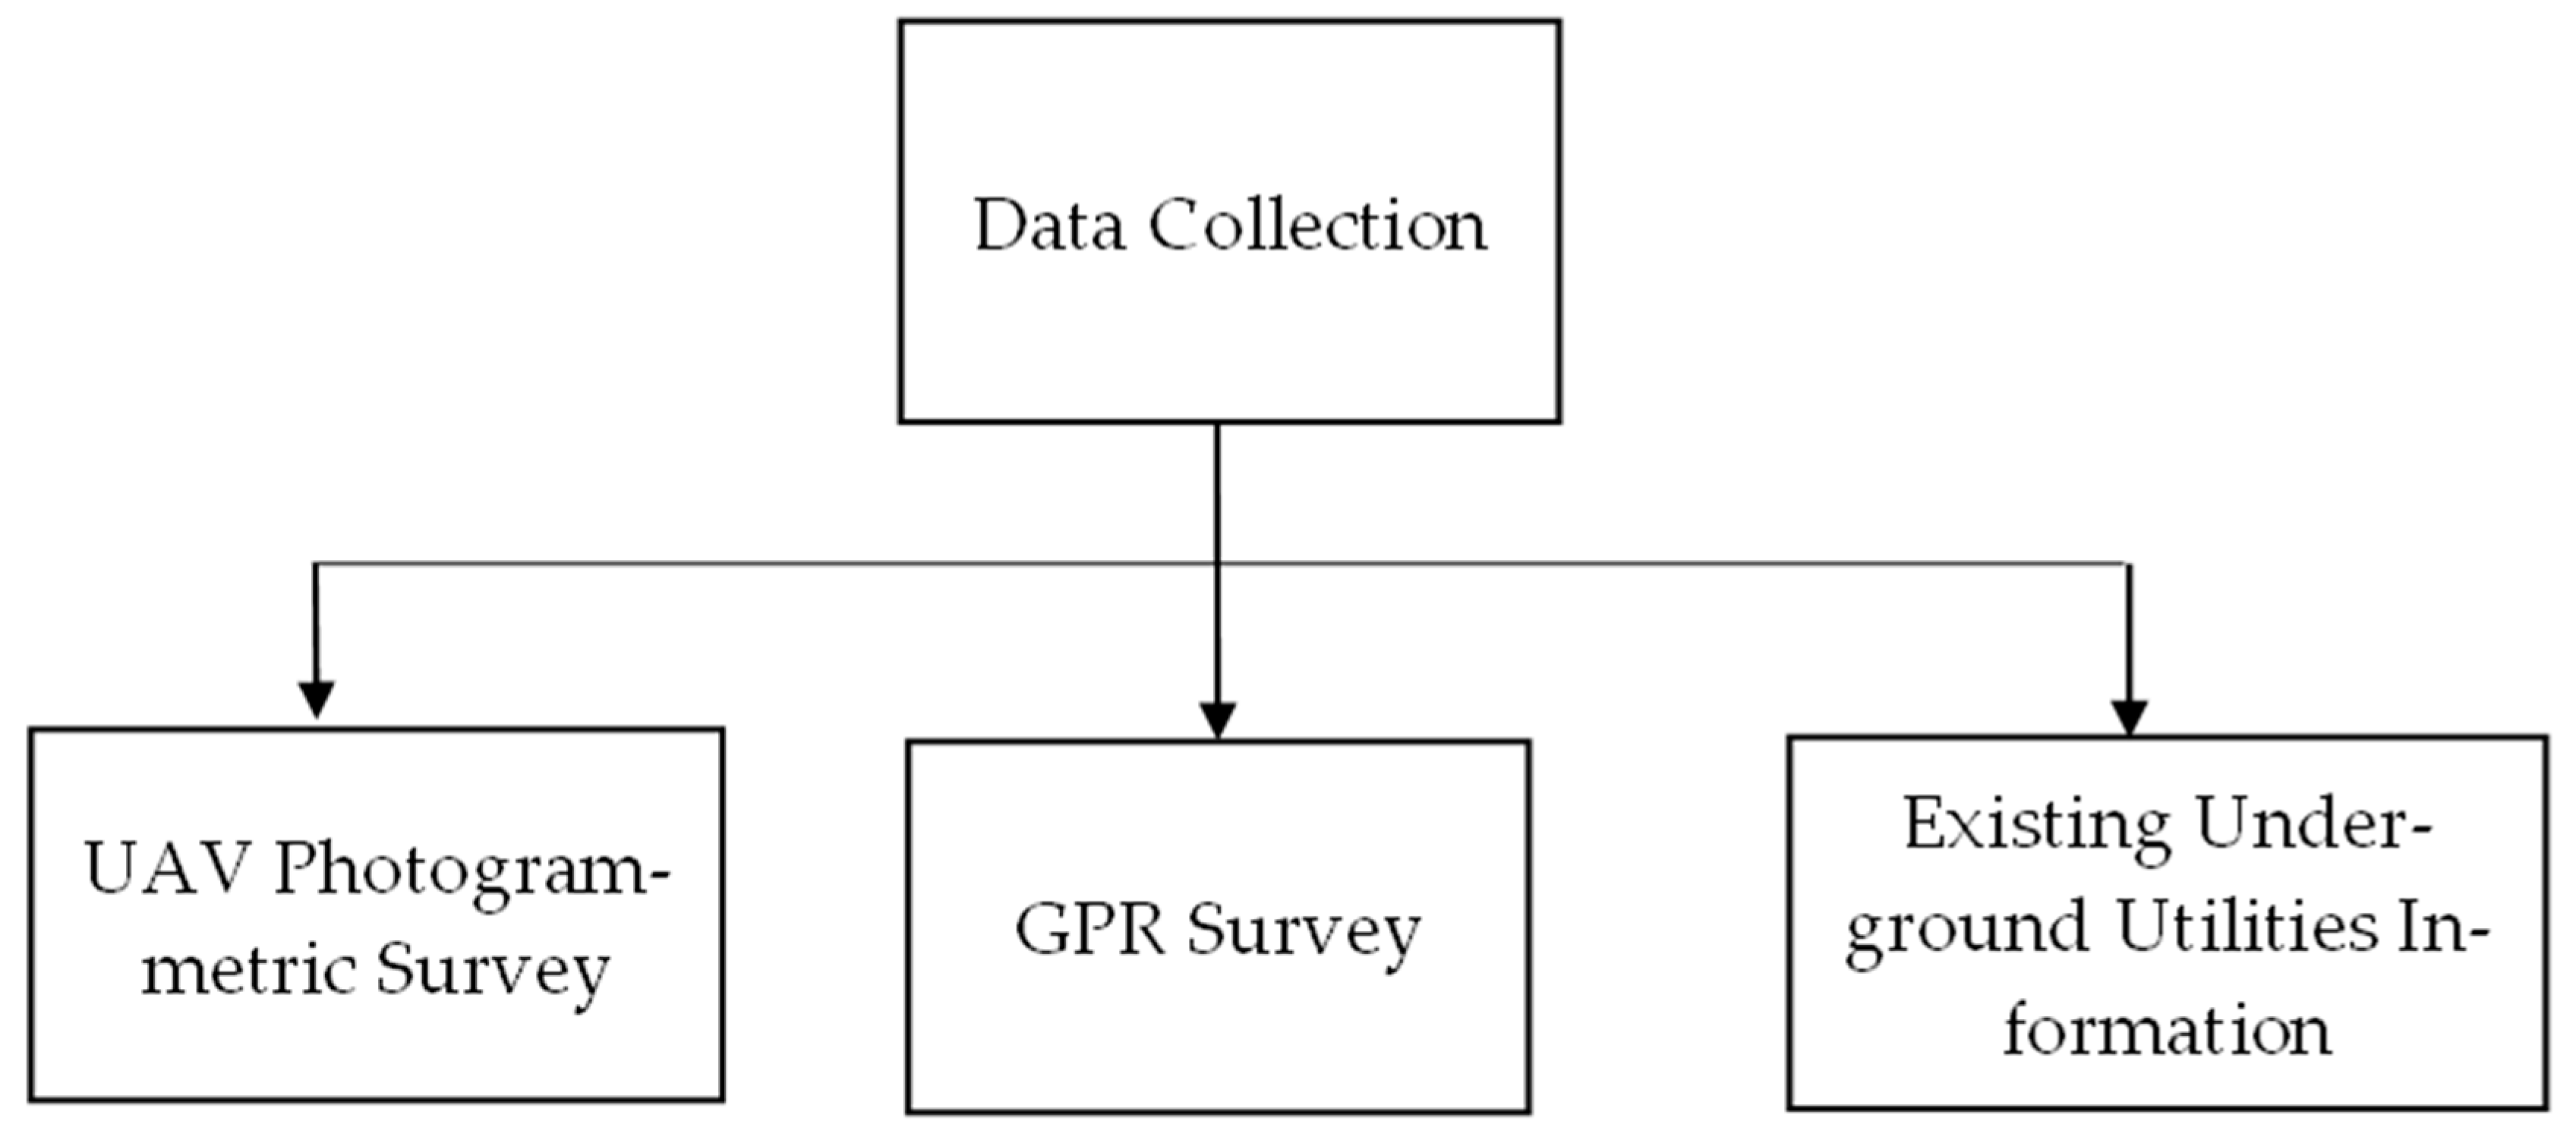
The following three sources were used for the data collection for this study.
Figure 4.
Data Collection Process.
Figure 4.
Data Collection Process.
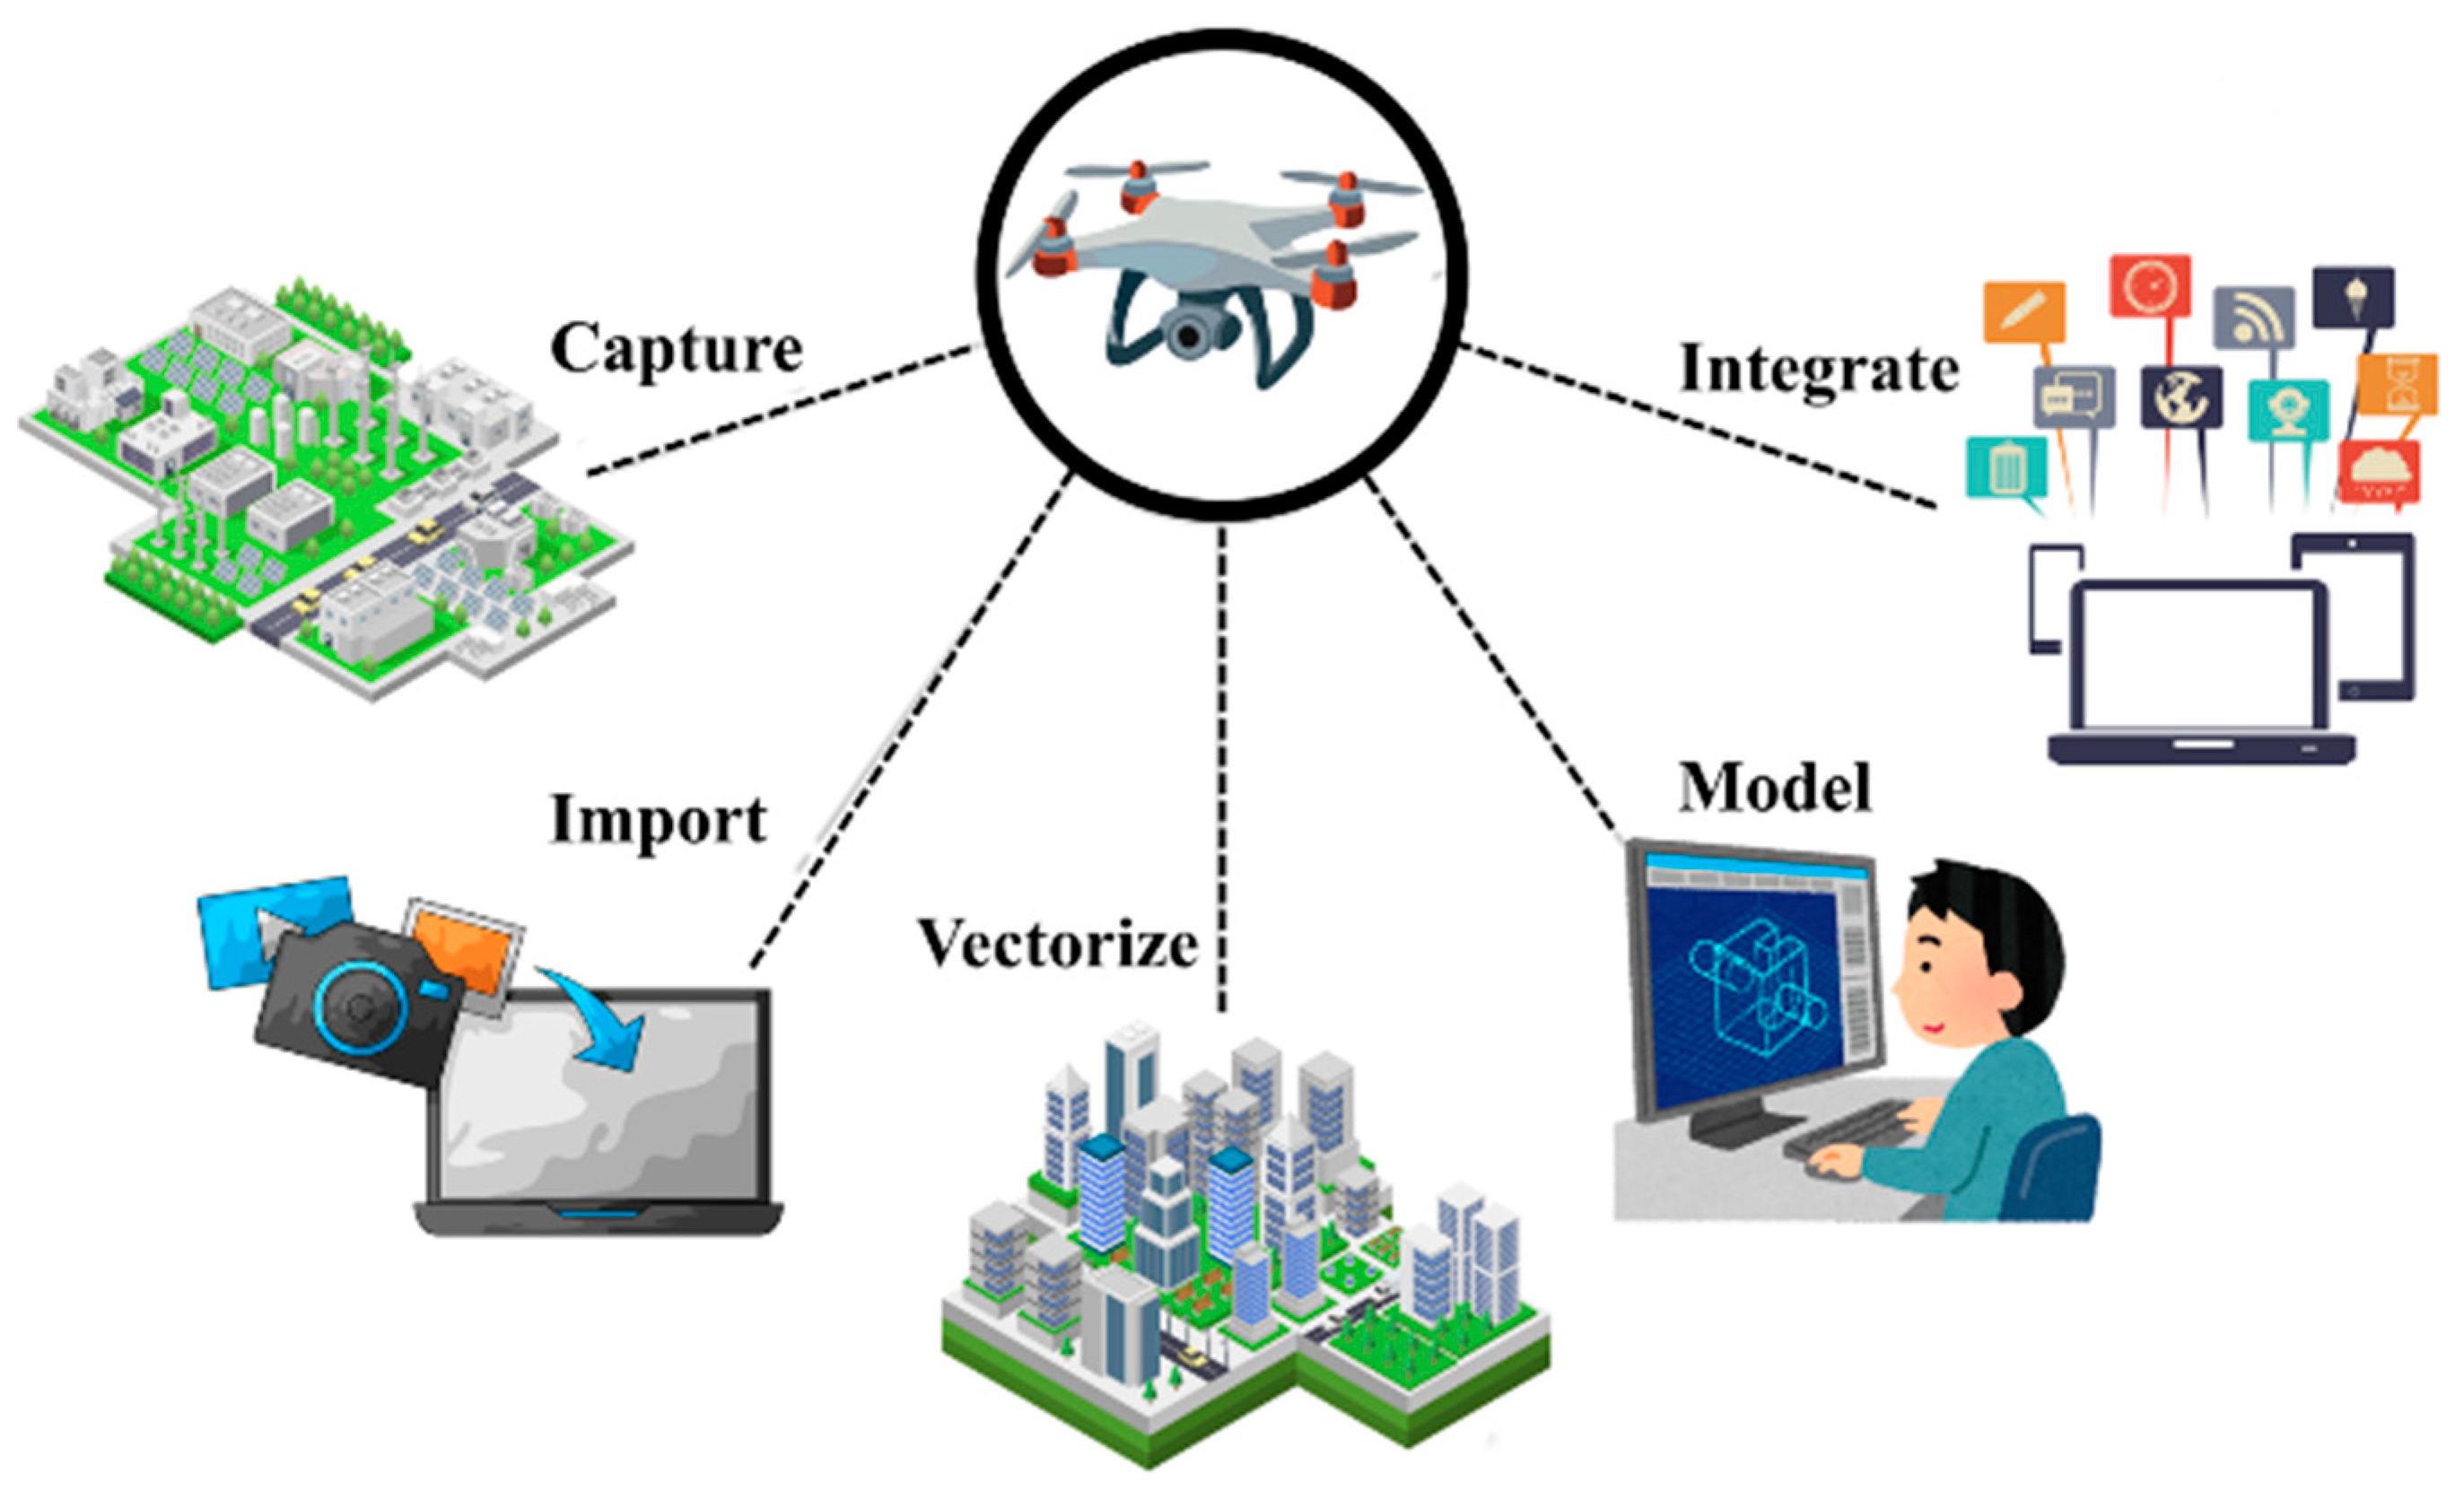
Aerial photogrammetry has massive potential in the construction industry. Among the various types of aerial photogrammetry techniques, the most common involves using a drone. Topographic surveys can be performed with higher precision, efficiency, and speed when a drone is used, which significantly reduces the incurred time and cost, compared to traditional surveying methods. The UAV survey process is presented in
Figure 5.
Review local rules and regulations and check for favorable weather conditions to avoid any delays or restrictions from local authorities. Ensure your drone’s battery and linked gadgets are fully charged and that the memory card in your drone camera has sufficient space to store all the images.
Use the drone’s flight planning software to prepare a survey flight plan on a tablet. Consider tall objects and altitude changes in your flying plan, and adjust the flight parameters such as ground sampling distance (GSD), flying direction, and image overlap as appropriate.
Unpack and assemble the drone, and ensure that it is ready to fly in safe conditions. Verify each parameter using the interactive checklist (e.g., calibrate the airspeed sensor and ensure the camera cover is removed).
After the operator presses the take-off key, the drone will take off independently, take photographs, and return to its starting point. During this stage, the operator should ensure that no one gets too close to the drone during takeoff and landing. They should also make sure the weather conditions remain favorable for the survey operation.
Import the photos from one or more flights into the software and geo-tag them to store information about their geographical location.
Use various tools to process the collected data to obtain the desired outputs. Some commonly used applications are Pix4D, Autodesk ReCap Pro, DroneDeploy, RealityCapture, 3Dsurvey, Agisoft, and RDOAI. The deliverables may include 3D point clouds, 3D surface mesh, orthomosaic maps, contour lines, and digital surface and terrain models, among others.
Table 4 summarizes the key advantages and disadvantages of using drones for surveying, compared to traditional methods. While drones acquire data faster, improve safety in hazardous terrain, and allow comprehensive site coverage, they may be limited by regulatory restrictions, weather conditions, and their limited battery life.
GPR is a geophysical locating technology that employs electromagnetic radio waves to acquire underground data in a non-invasive manner. It is a valuable tool, since it can locate underlying utilities without excavation. Its detection accuracy is ±0.10 m.
GPR emits electromagnetic radiation waves with frequencies of 1–1000 MHz. This technology necessitates the use of an emitter and a receiving antenna. The transmitter emits electromagnetic radiation into the ground and into other materials. When GPR is employed, a pulse is sent into the ground, and the system checks for echoes from objects under the surface. GPR imaging tools can also detect changes in the composition of the subsurface material.
A wide range of items can be located using the waves emitted and processed by GPR. This equipment is most effective when the electromagnetic characteristics of the target and the surrounding material are vastly different. Metal, concrete, PVC, plastic, and natural materials are typically traced with GPR.
GPR has nearly limitless possibilities. It is commonly used to detect buried utility cables and pipelines, ground strata changes, geological features, air pockets, areas excavated and refilled, the groundwater table, and bedrock.
Many utilities—including gas lines, water pipelines, telecommunication lines, and power cables—lie under the earth’s surface almost anywhere where people reside, with gas and water pipelines being the most common. When concerns arise, such as when there is a need for maintenance or shifting, the available data is usually limited, unreliable, or scattered. Usually, underground utility information is not stored, or sometimes just 2D drawings, milestones, and GPS coordinates are used to store the data, which is usually lost with time or becomes unreliable. Some utility-tracking technologies are available, with GPR being the most sophisticated, but the process is time- and labor-intensive.
To counter the issues related to underground utilities, this research suggests a framework based on BIM 4D by which all the obtained information (location, dimension, and depth) can be digitalized, saved in a BIM model, and retrieved at any time.
Underground utility data was provided by Sui Northern Gas Pipelines Limited (SNGPL), and aboveground utility data (pylons) was provided by Peshawar Electric Supply Company (PESCO), Swat.
3.2. Data Processing
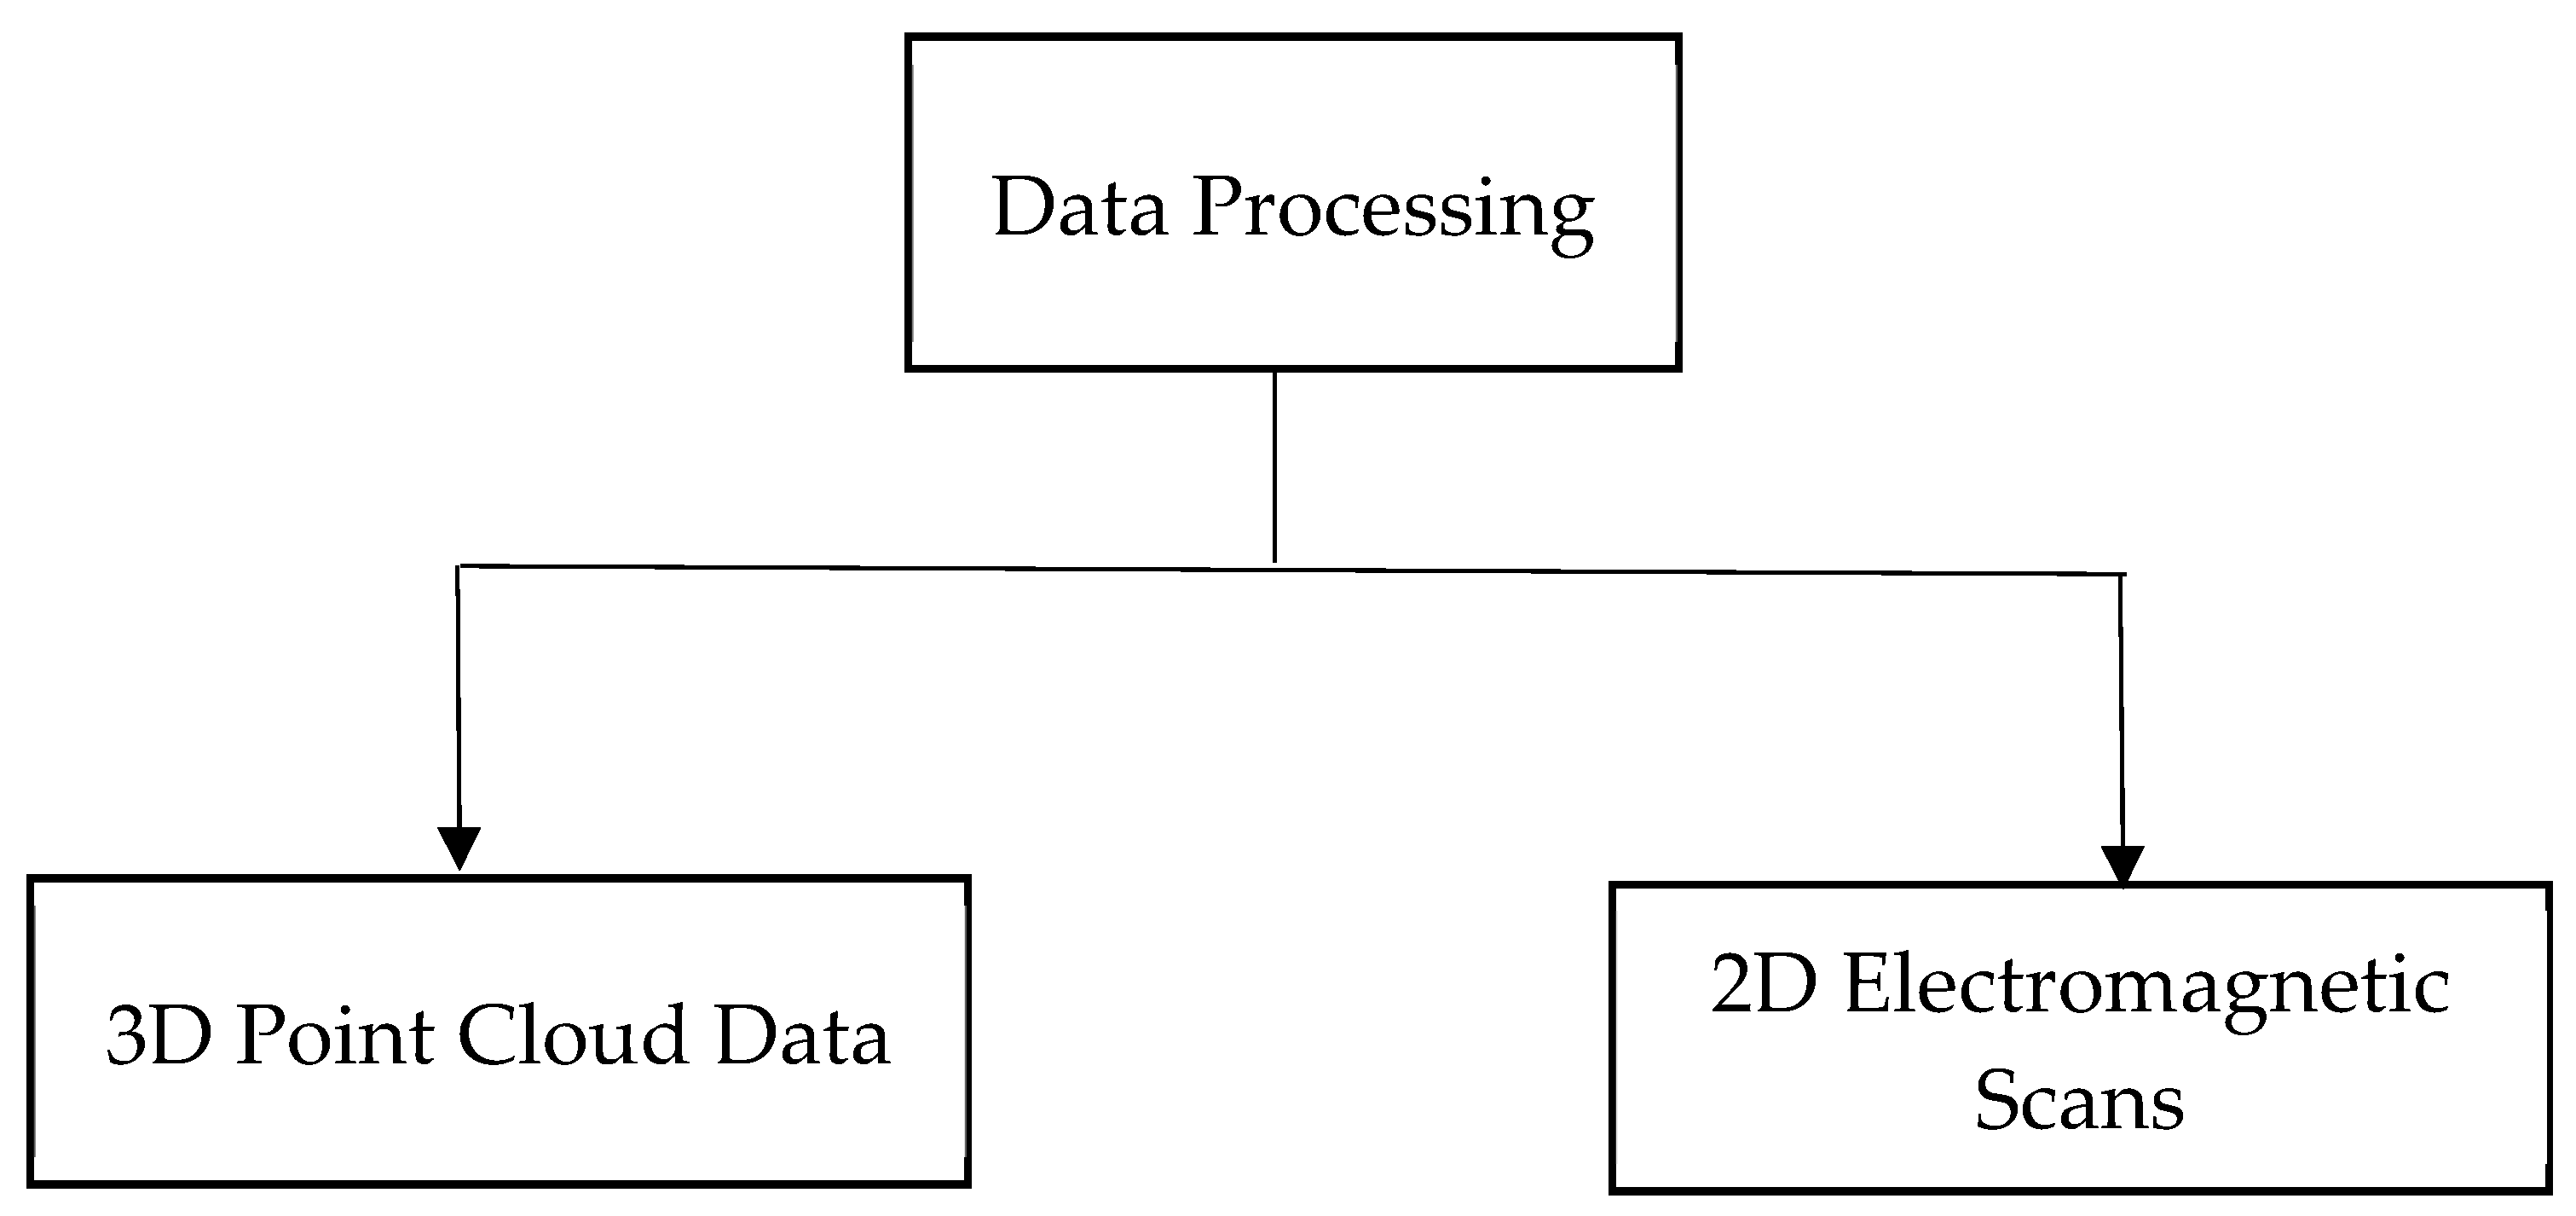
The processed data were obtained from various sources and consist of surface data, digital surface model (DSM) data, digital terrain model (DTM) data, digital elevation model (DEM) data, underground utility data (in this case, the data were collected from the SNGPL department), and GPR survey data.
Figure 6 provides an overview of the data processing procedure.
A point cloud is a collection of points or dots, each with its own set of coordinates and other attributes—such as intensity, RGB (red, green, and blue) color, and GPS time—that describe the 3D shape and its surroundings. A massive number of geospatial points are combined into a single set with a shared coordinate frame to capture the geometry of the 3D object. Photogrammetry is a remote-sensing methodology that uses several digital photographs captured from various angles to identify the geometry of an item. It produces colored and completely textured point clouds in less time and with less cost consumption compared to other methods.
3D point clouds can only be generated from drone-captured photos and laser scanning if photogrammetric data is processed. Exchangeable image format (Exif) data is generated from each acquired aerial picture to produce 3D point cloud data. There are several approaches for producing geo-tagged 3D point cloud data, utilizing various mathematical and computational methodologies. Moreover, several commercial software solutions are available for converting geo-referenced photographs into 3D point cloud data. The accuracy of the output is increased when there is enough overlap of consecutive pictures with the same characteristics and when ground control points (GCPs) are inserted exactly. Image processing involves four major phases: photograph alignment, geometry creation, texture building, and exporting.
The computational processing of data collected from the GPR survey’s 2D electromagnetic scans is required to precisely detect the position, depth, size, and kind of item or utility. Several novel data-processing techniques, including deconvolution, attribute analysis, and noise reduction, have been developed throughout the years. The primary goals of processing the data are to improve the flow of signals, minimize noise, remove system-recorded data inconsistencies, and repair geometrical error abnormalities.
Accuracy control is critical during data processing, for both surface and subsurface datasets. For UAV-based photogrammetry, positional accuracy depends on several factors, including image overlap (typically 70–80% frontal and 60–70% lateral), ground sampling distance (GSD), and the number and distribution of GCPs. Insufficient overlap or poorly distributed GCPs can introduce errors in the 3D point cloud, which directly affects terrain model accuracy. For GPR surveys, the detection accuracy is approximately ±0.10 m, as reported for electromagnetic detection methods. However, accuracy is influenced by soil moisture content, the dielectric contrast between the utility material and surrounding soil, and signal attenuation in clayey or highly conductive soils. To mitigate these error sources, a specialized team from SNGPL conducted the GPR survey in this study using calibrated equipment, and the results were cross-referenced with available pipeline records to verify positioning.
For projects utilizing GPR surveys, collected radargrams should be processed using dedicated GPR signal processing software. Tools commonly used for this purpose include RADAN (Geophysical Survey Systems, Inc., Nashua, NH, USA), GPR-SLICE, and REFLEXW, which offer functionalities for deconvolution, migration, gain adjustment, and noise filtering to extract accurate subsurface utility positions from the raw scan data.
3.3. Modeling
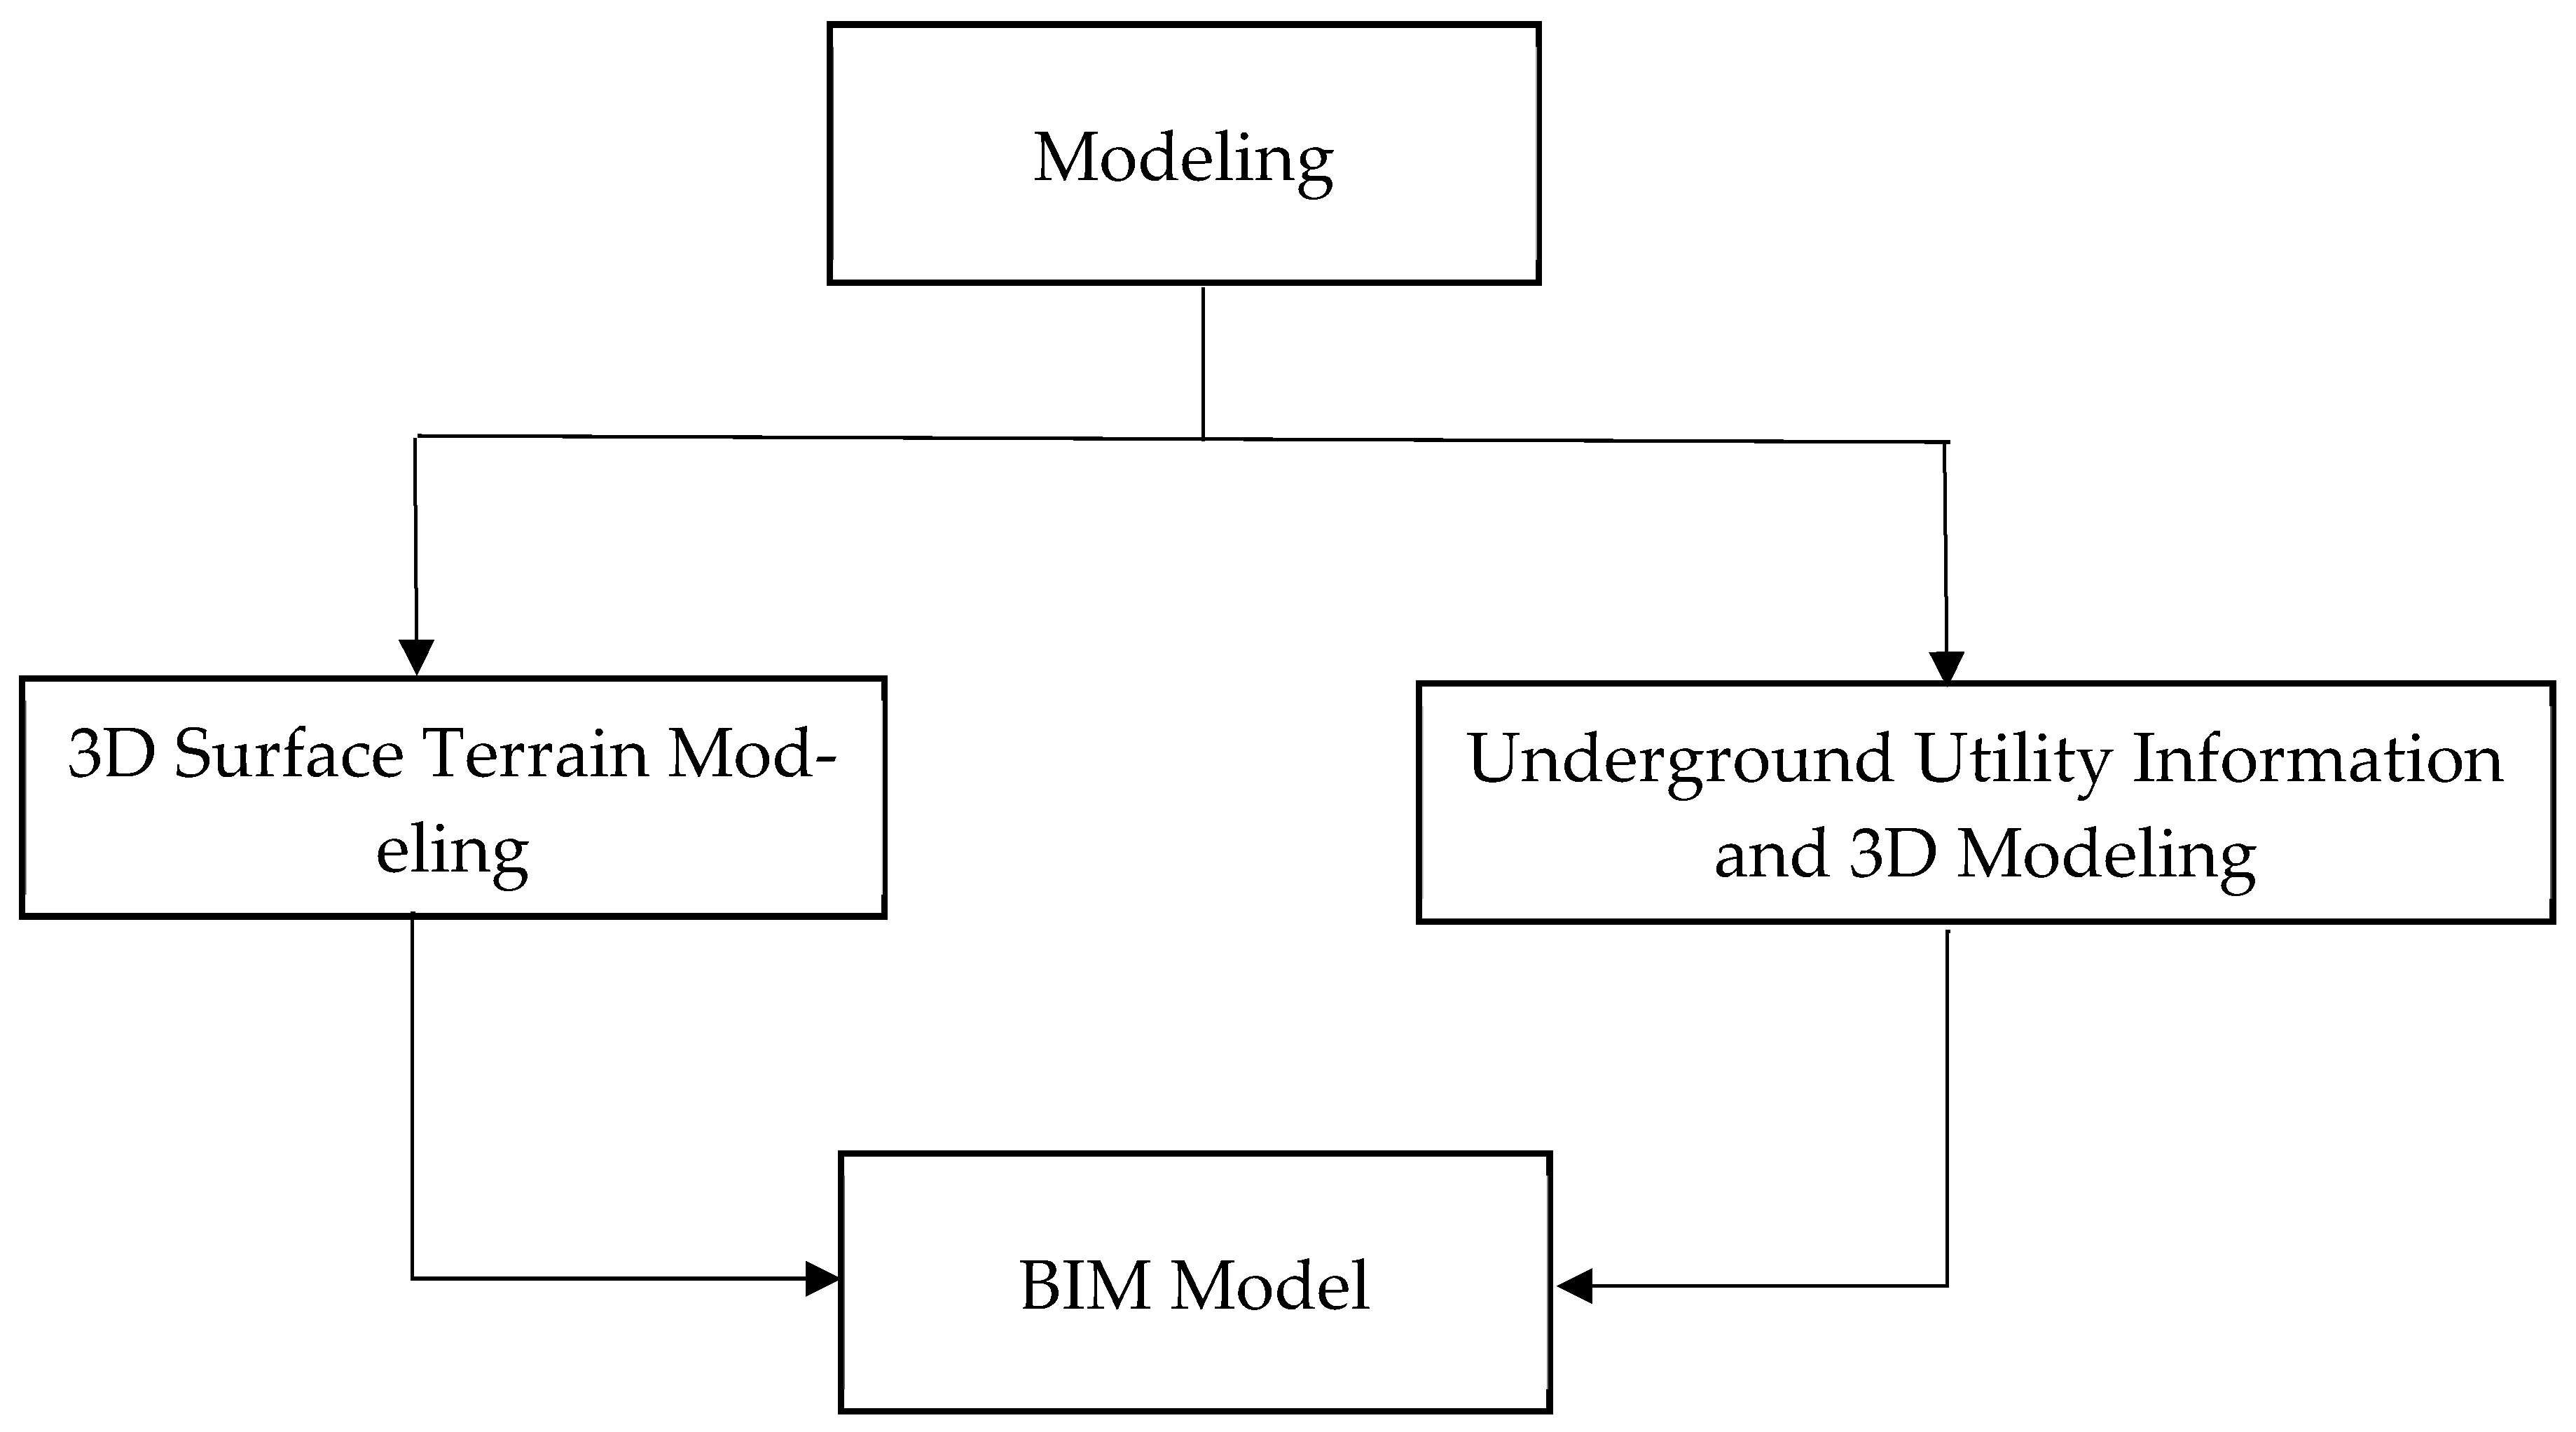
The 3D surface of the required area can be created based on a UAV survey, laser scanning, or it can be developed using the “Model Builder” of Autodesk InfraWorks to capture the exact features of the desired location. It is recommended that country-specific media content and libraries be installed first. The surface and subsurface data of utilities, road alignments and design, and the 3D terrain model make it possible to perform complete 3D modeling in Autodesk Civil 3D with exact road assemblies and detailing, and accurate utility information, utilizing the identical coordinates of the physical location. Once a sophisticated 3D model has been created, detailed scheduling can also be performed in Civil 3D or Navisworks. Navisworks can also be utilized to perform cost analysis for a project. In our project, the existing utilities needed to be relocated and were modeled according to the construction schedule. The simplified modeling process is presented in
Figure 7.
3.4. System Application
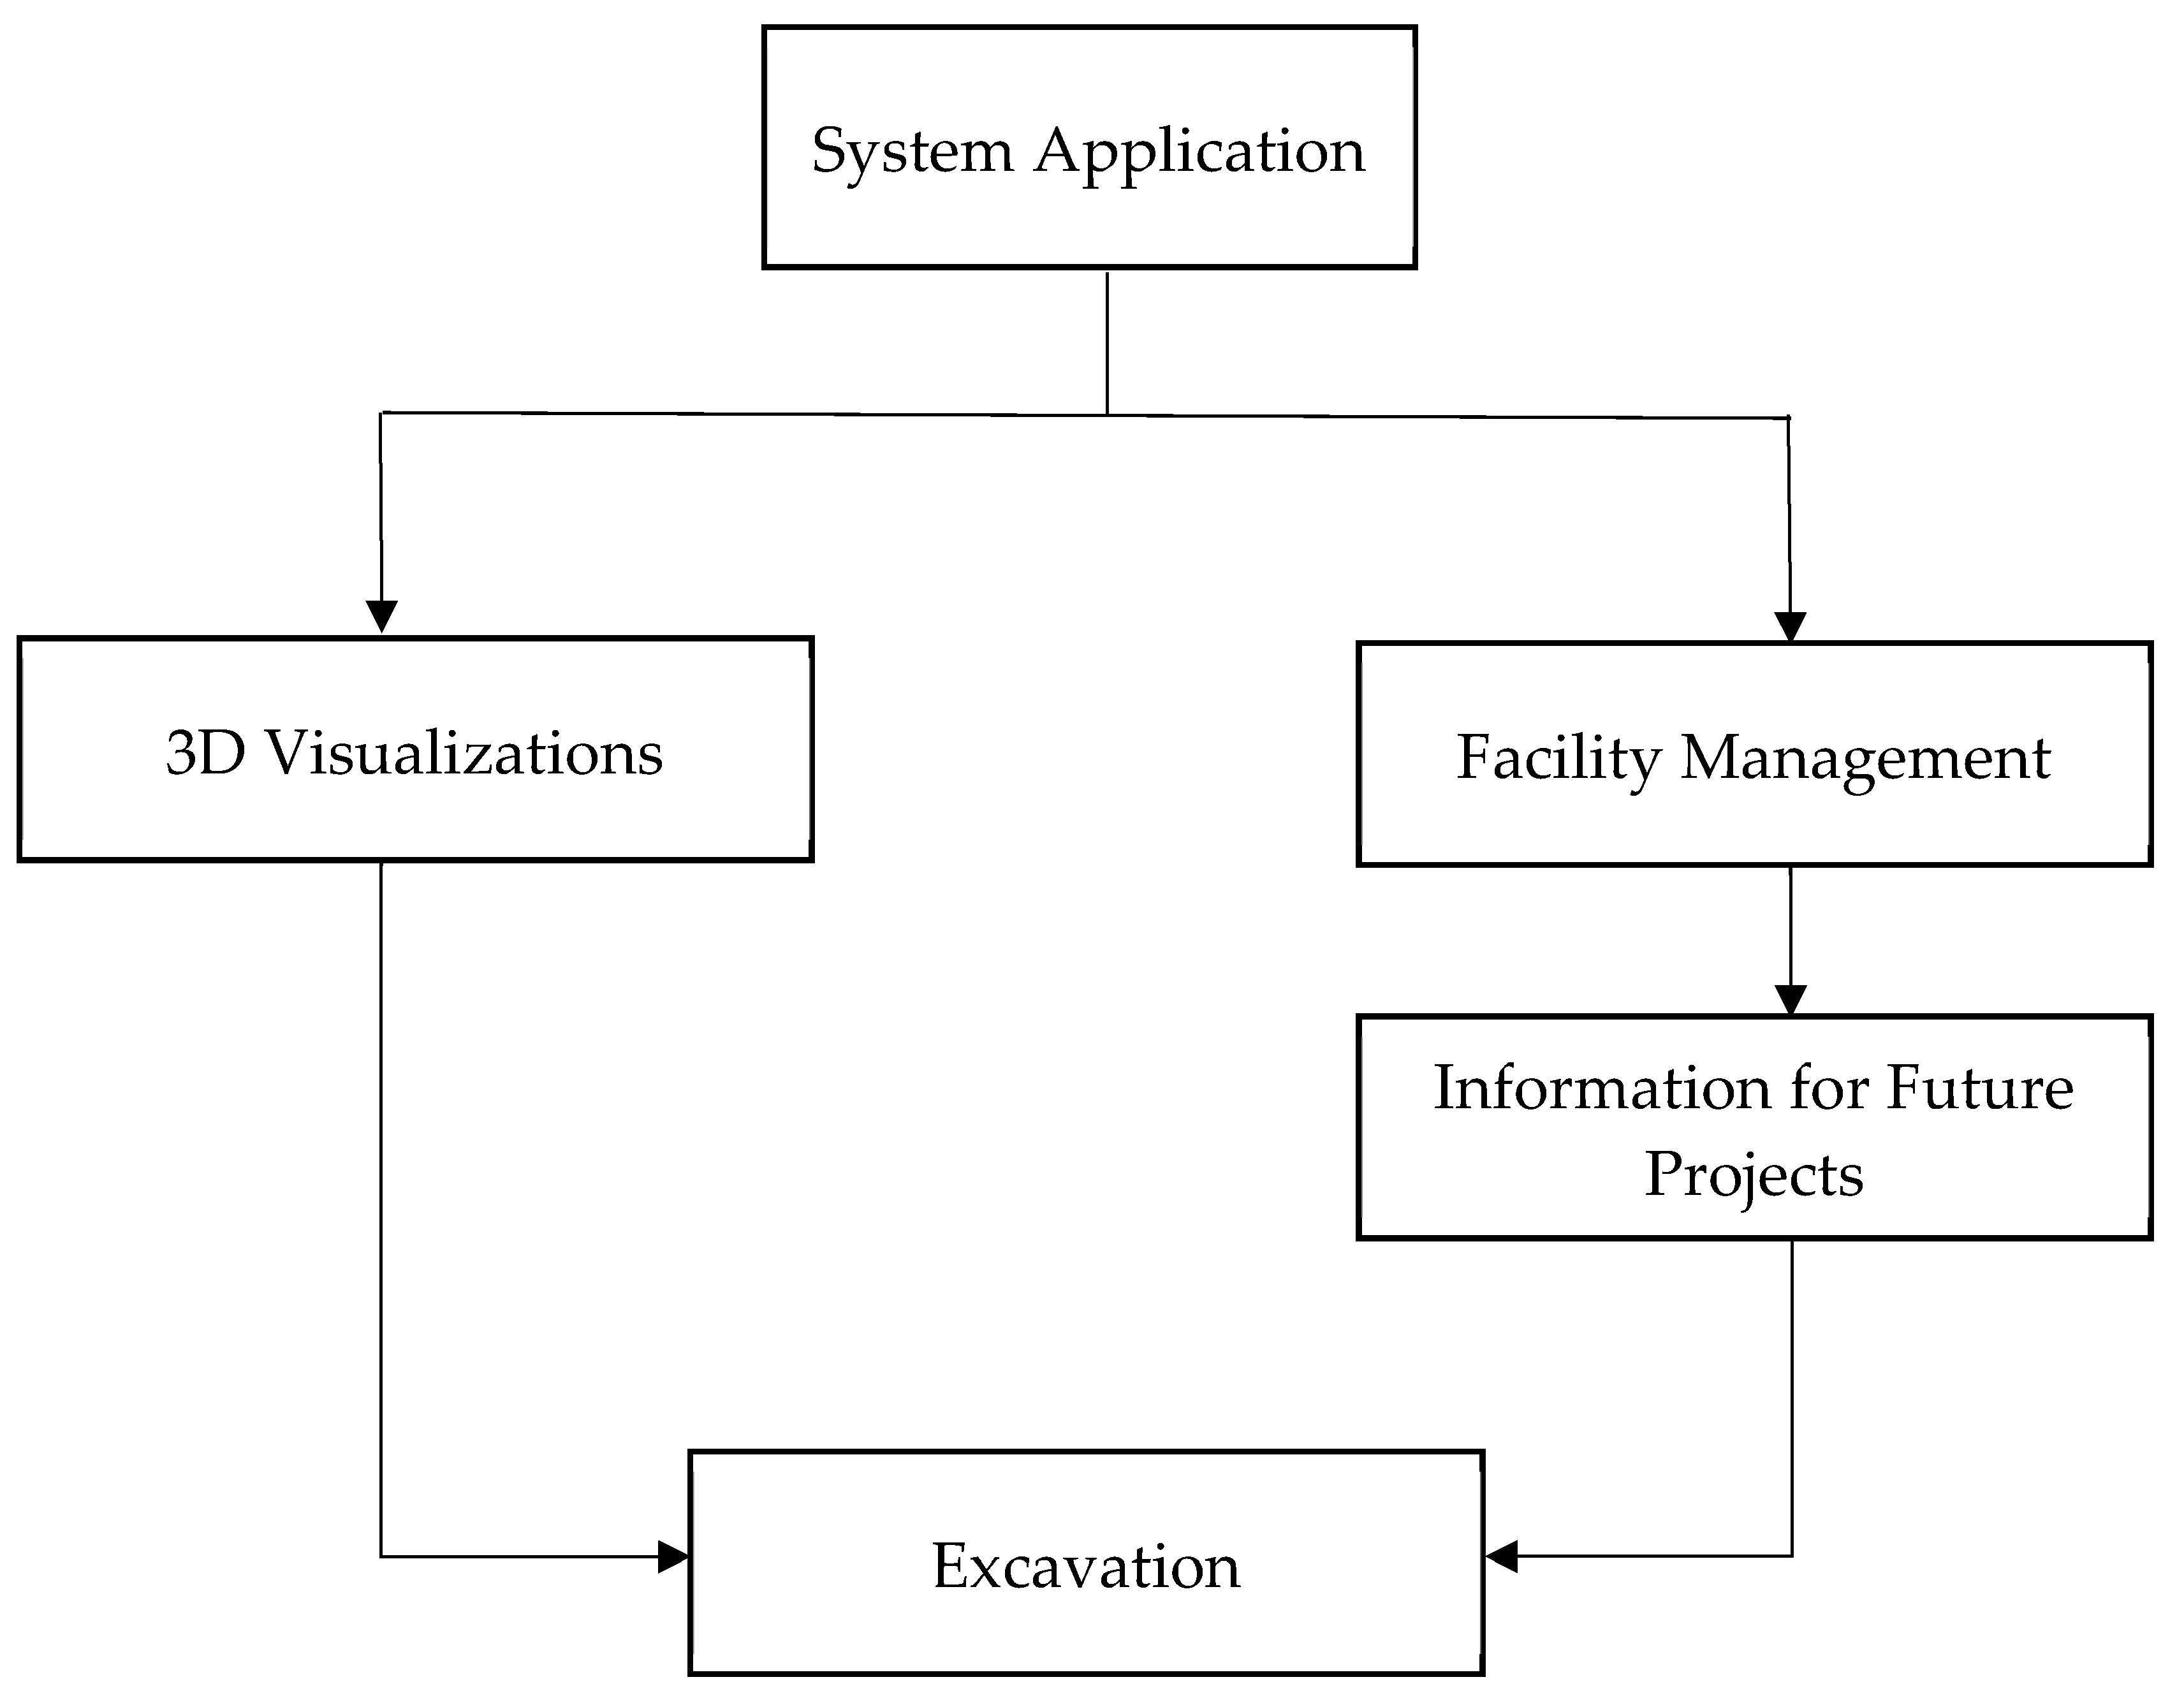
Once the road and its features were modeled, underground and aboveground utilities were placed using various BIM software. The final BIM model provides geometric visualization in three dimensions, along with semantic information. The project’s stakeholders can benefit from the clear and otherwise improved visualization of the project design during construction planning and execution. The term “semantic information” refers to data or indication associated with a word or data element that help to better understand it. For example, the word “New York” can mean multiple things, such as New York City, the state of New York, or a ship. In a BIM environment, the word “semantic” refers to intelligence and automation. The process is presented in
Figure 8.
Proactive maintenance work is necessary on a normal periodic basis or when there is a utility system breakdown. However, information regarding the utility is not easily available when needed for inspection or maintenance; this makes the system inefficient and causes time and schedule overruns. The BIM 4D integrated model based on the recommended framework delivers easily accessible 3D information on subsurface utilities that monitoring and repair teams can utilize to highlight the placement, type, and composition of each pipeline. In addition, every pipe is associated with the positional information required for inspection. Utility-related information that could be useful for future construction projects can be kept safe in the BIM environment for the project’s lifecycle.
3.5. Updating the Data
The long-term value of the proposed framework depends on systematic updates to the BIM model whenever changes occur in the field. The data-updating stage operates on three triggers: (1) planned maintenance or repair activities on existing utilities, (2) the installation of new utility lines within the project corridor, and (3) the relocation of utilities due to new construction or road expansion.
The asset-owning department (e.g., SNGPL for gas pipelines, PESCO for electrical infrastructure), in coordination with the highway authority, should be responsible for updating the model. Each update should record the type of change, date, updated coordinates, and material specifications of the modified utility segment.
In terms of data format compatibility, the framework recommends using industry foundation classes (IFCs) as an open standard to ensure interoperability across different BIM platforms. The native Autodesk formats used in this study (.dwg for Civil 3D and .nwd for Navisworks) can be exported to IFCs to be shared with external stakeholders who may use different BIM tools. This approach ensures that the utility data remains accessible and up to date throughout the operational lifecycle of the infrastructure.
4. Case Study
The Swat Motorway Phase II was selected as the case study based on three criteria. First, the project involves a greenfield highway alignment passing through areas with existing underground and aboveground utilities. Second, the project authority (PKHA) and utility-owning departments (SNGPL, PESCO) were willing to share data and participate in a framework evaluation. Third, the 80 km alignment provided a sufficiently complex environment for testing the framework. A 12 km starting section was initially modeled, and a 5 km segment (from the seventh km to the 11th km) was selected for detailed analysis because it contained the highest density of intersecting utility lines, based on a preliminary data review.
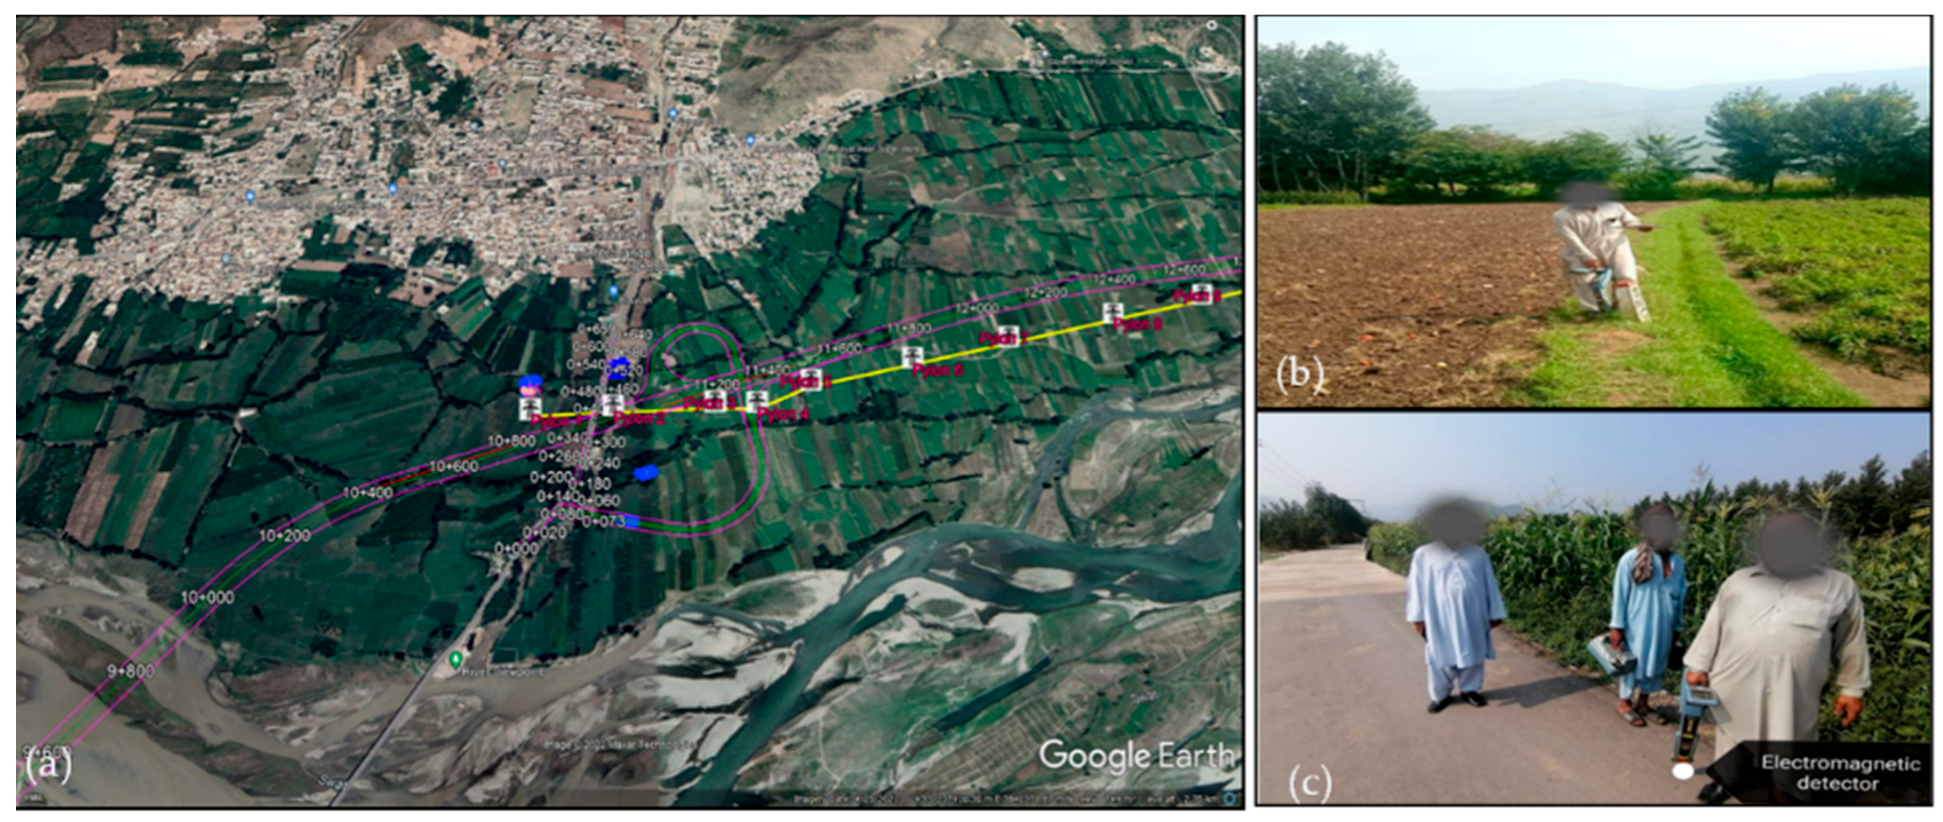
The project alignment data was acquired from the Pakhtunkhwa Highway Authority (PKHA). The alignment passes through the Malakand valleys, crossing the river Swat at various points. The alignment map of the project was plotted on Google Earth, as shown in
Figure 9. A detailed survey of the project was also conducted to gather the exact elevations and coordinates of the alignment line.
Various utility service owners were contacted and asked to share their utility locations, if any, in the project corridor region. Specifically, Sui Northern Gas Pipeline (SNGPL), Public Health Engineering Department (PHED), and WAPDA were contacted to provide the exact locations of utilities in the project corridor.
Following the framework defined in the previous section, SNGPL conducted the utility-detection survey using an electromagnetic detector. This was done to determine the accurate position of gas pipelines, for which a team of experts joined the task (
Figure 9). After the survey, the 3D location of the underground gas pipeline was obtained and subsequently modeled using Civil 3D. Similarly, the coordinates and location of the water pipeline and electric pylons were obtained from the concerned departments and modeled.
In this case study, a specialized team from SNGPL detected subsurface gas pipelines using electromagnetic detection equipment calibrated for metallic pipelines. While the proposed framework includes GPR as a recommended technique for locating non-metallic and unrecorded utilities, the Swat Motorway project involved metallic gas pipelines, for which electromagnetic detection provided sufficient accuracy (approximately ±0.10 m). The detection results were verified against SNGPL’s existing pipeline records to confirm positional accuracy before the data was incorporated into the BIM model. Future applications of the framework involving non-metallic utilities or unknown buried objects should employ GPR surveys, and the resulting radargrams should be processed using specialized software (e.g., RADAN or GPR-SLICE) to extract depth and positional data.
The data was then imported into Civil 3D with exact coordinates, and a model was generated. The area of interest was only 5 km (from the seventh km to the 11th km). The redundant area was removed, and the 5 km model described above was kept. A 3D model output was generated. The exported model was input into Autodesk Infraworks for further detailing and better visualization. 3D terrain was created using the “Model Builder” in Infraworks, the road structure—including the bridge, right of way, fencing, guard rails, and barrier—was placed, and both the underground and aboveground utility models were created. The model was exported as an .obj 3D file. The Infraworks model was exported to Civil 3D for the detailed design of road assembly and gas pipeline detailing.
Finally, the model was imported into Autodesk Navisworks, where scheduling was performed, and construction activities—including the relocation of underground utilities and aboveground pylons—were simulated. After the BIM 4D simulation, a quantity analysis of the whole selected area of the project was performed.
The 4D simulation in Navisworks was implemented by linking construction schedule tasks to corresponding 3D model elements. The process involved three steps. First, a construction schedule was prepared in Microsoft Project, defining key activities such as earthwork, road pavement, gas pipeline relocation, and pylon dismantling/reinstallation, along with their respective start and finish dates. Second, the schedule file was imported into Navisworks TimeLiner, where each task was mapped to the relevant geometric objects in the federated model. Third, a step-by-step simulation was generated that visually displayed the construction sequence over time. This allowed the project team to observe the planned relocation of underground gas pipelines before road construction commenced in each segment, identify scheduling overlaps between utility relocation and earthwork activities, and verify that no construction activity was planned in proximity to live utilities without prior relocation. The simulation output confirmed that the proposed construction sequence avoided temporal conflicts between road construction and utility relocation operations within the modeled 5 km corridor.
A comparison of the BIM-based approach with the conventional 2D method revealed that the 3D BIM model identified five utility-road conflict points within the 5 km corridor, including three subsurface gas pipeline intersections and two aboveground pylon encroachments within the right-of-way. Of these, only the two pylon locations had been previously identified through conventional 2D drawings. This demonstrates the value of the integrated BIM approach in detecting previously unrecorded utility conflicts.
Expert Review
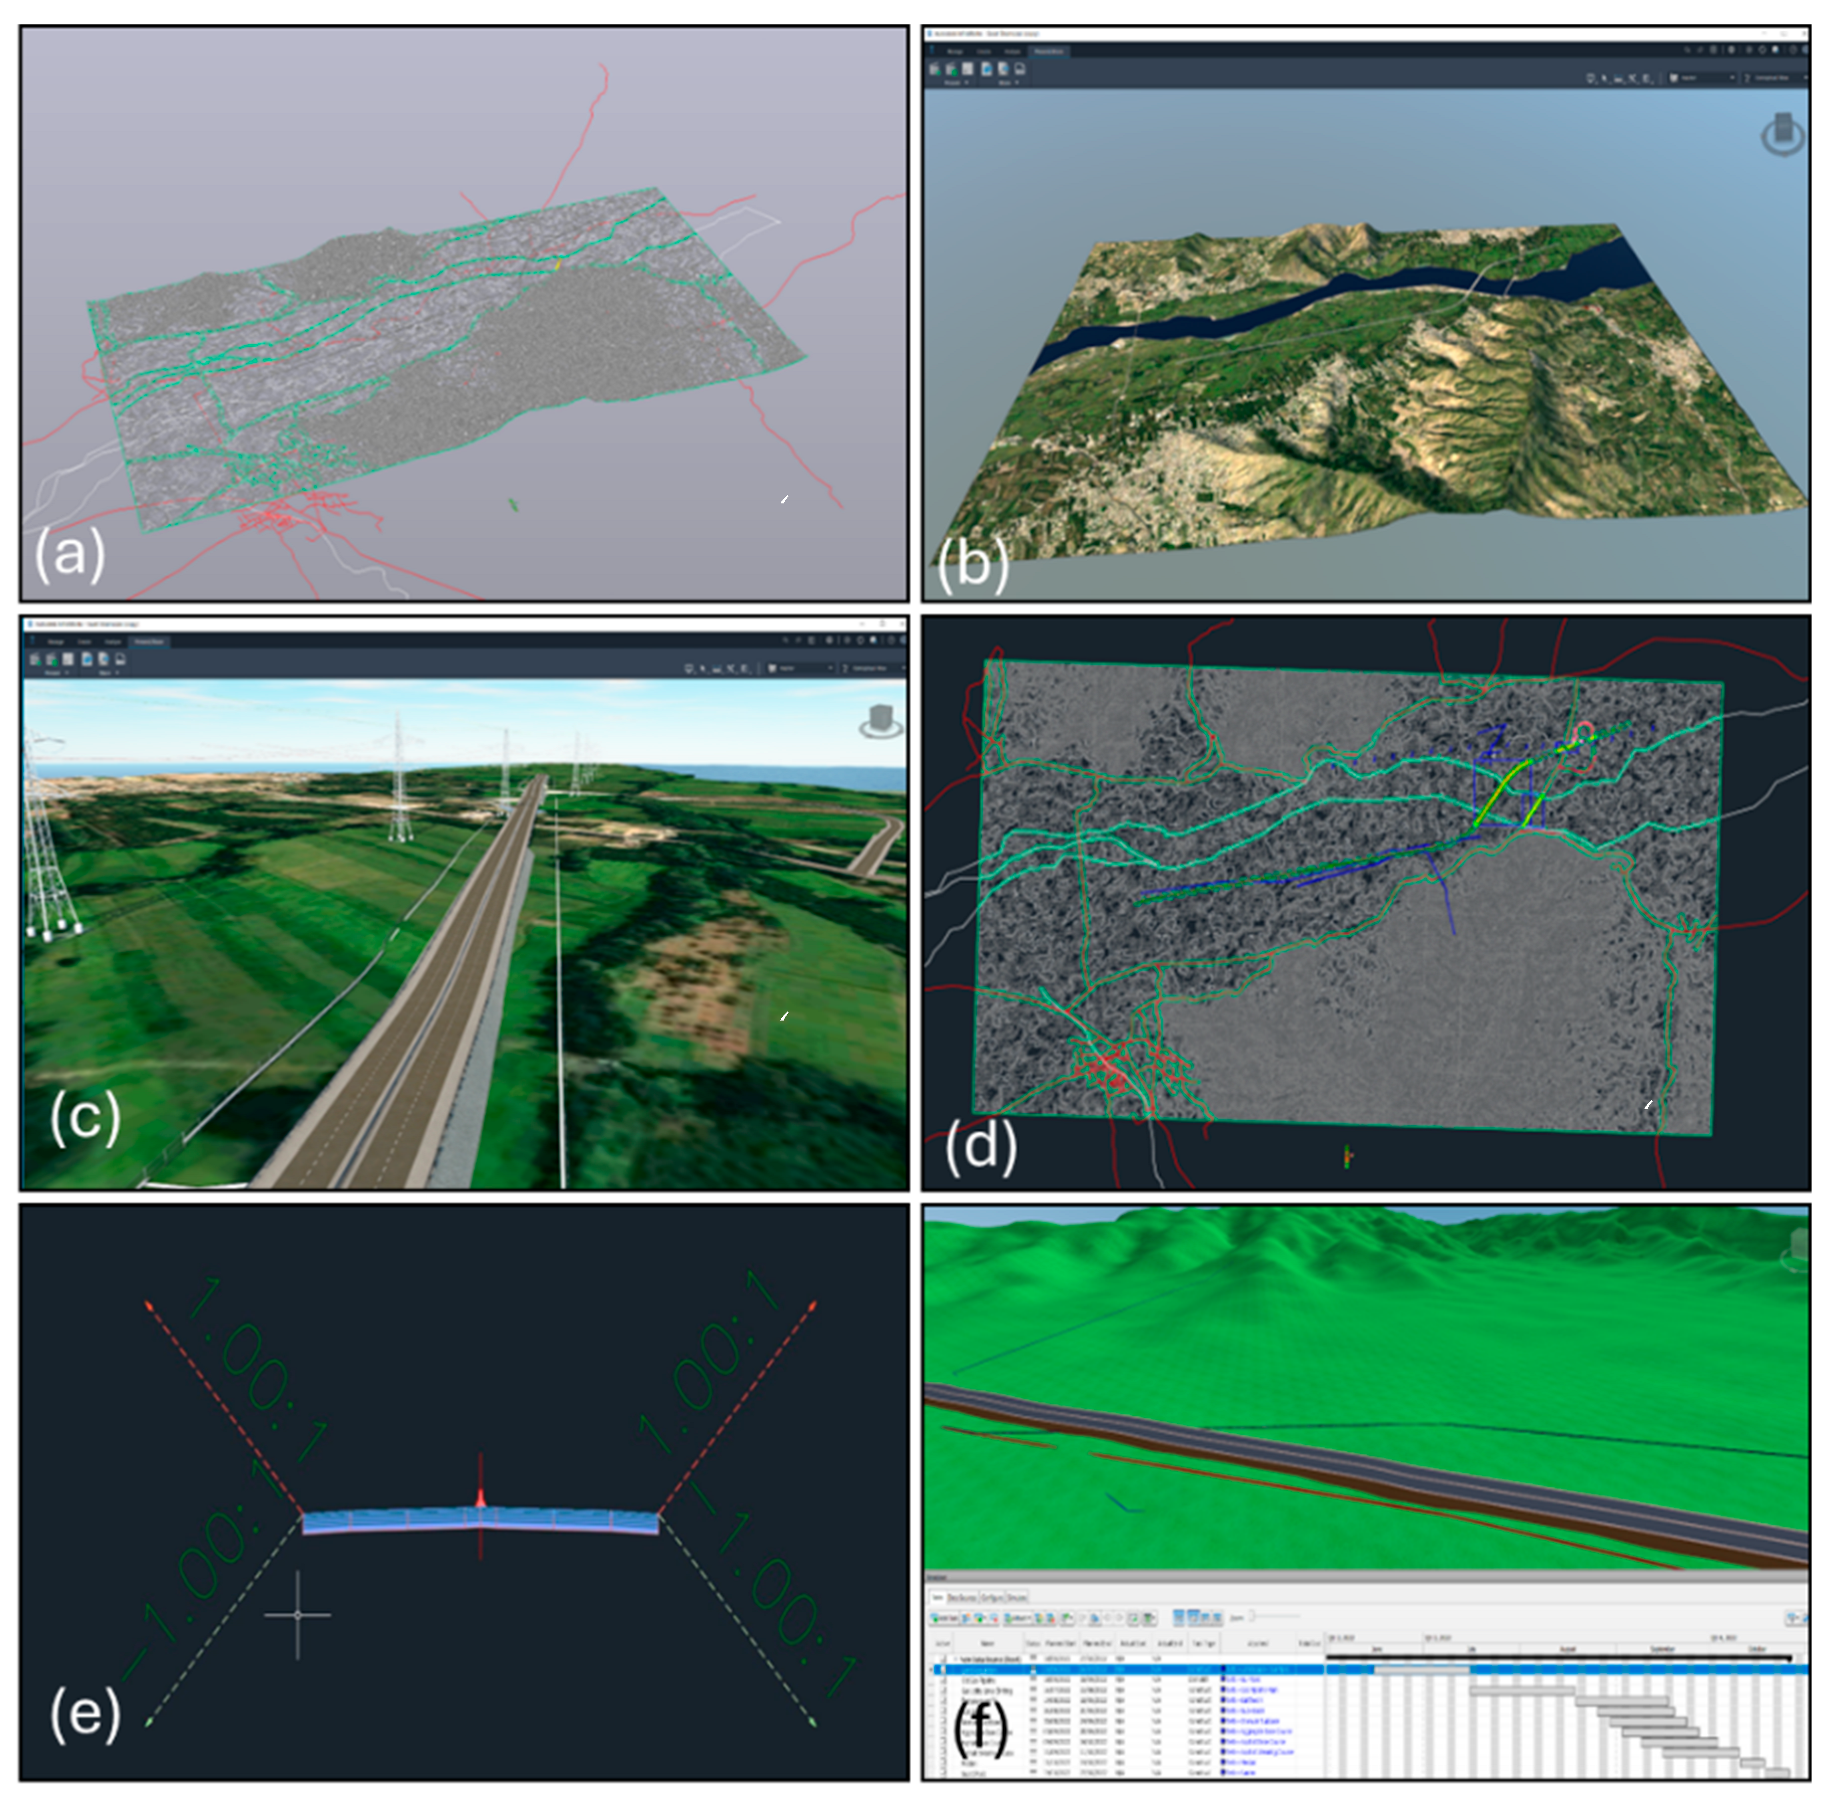
Once the BIM and 4D simulation described in the preceding sections were completed, the integrated framework and its outputs were presented to the client department for expert evaluation. The Swat Motorway Project falls under the Project Directorate of Provincial Expressways, PKHA KPK, Pakistan. The research team maintained direct coordination with the department throughout the study. The client department was presented with the 3D/4D models, the utility relocation simulation, and the proposed lifecycle management framework. The details of the model are presented in
Figure 10.
The client department’s feedback focused on three key aspects: the effectiveness of the 3D visualization for construction planning, the utility of the framework for managing utility relocation within the right-of-way, and the potential for long-term data management during maintenance phases. They appreciated the new concept of using the BIM framework to manage utilities in the ROW of Swat Motorway Phase II, which will aid the visualization of and research on the possible solutions to protect and/or relocate the utilities, ensuring the safety of road users and the general public. The visualization part of the BIM framework provides the opportunity in construction projects to visualize the potential issues before construction starts. This would significantly aid decision-makers and project stakeholders in making informed decisions. They also recognized the importance of innovative technologies like BIM and suggested focusing on the true benefit of BIM by populating the models with dense data that would be useful during the construction and later maintenance phases.
The 3D BIM model of the 5 km corridor revealed three locations where the underground gas pipeline alignment intersected or ran within a critical proximity to the proposed road formation level, indicating potential conflicts during earthwork operations. These conflict zones were not identifiable from the 2D drawings previously available to the project team. Additionally, two aboveground pylons were located within the proposed right-of-way, requiring planned relocation before road construction could proceed. The early identification of these five conflict points through the BIM model is expected to reduce unplanned work stoppages and emergency utility relocations, which typically incur delays of two to four weeks per incident, according to the client department’s report. While a full cost–benefit analysis was beyond the scope of this study, the client department confirmed that the BIM-based visualization eliminated the need for repeated field visits to verify utility locations, thus reducing survey coordination time during the planning phase.
5. Results
The framework proposed in this Swat Motorway case study produced several key results. For example, the integrated BIM model, developed using Civil 3D and InfraWorks, combined the highway corridor geometry, underground gas pipeline alignment (data from SNGPL), and aboveground pylon locations (data from PESCO) into a unified 3D environment with accurate georeferencing.
The model identified five utility-road conflict zones within the 5 km segment (from the seventh km to the 11th km). In three locations, the underground gas pipeline alignment crossed or ran within 1.5 m of the proposed road formation level, and in two locations, existing electric pylons fell within the proposed right-of-way. These conflicts were visualized in the 3D model and confirmed through cross-referencing with field survey data.
The 4D simulation in Navisworks demonstrated the construction sequencing for the corridor, showing the planned phasing of utility relocation before road construction activities in each segment. The TimeLiner output confirmed that the proposed schedule avoided temporal overlaps between live utility operations and earthwork activities. Finally, the quantity analysis performed in Navisworks provided material estimates for the corridor section, supporting the cost planning process for the project.
5.1. 3D BIM Model Development
The integrated BIM model, developed using Autodesk Civil 3D and InfraWorks, combined the highway corridor geometry, underground gas pipeline alignment (data from SNGPL), and aboveground pylon locations (data from PESCO) into a unified 3D environment with accurate georeferencing. The model covered a total corridor length of 5 km with a right-of-way width of 30 m, representing a modeled area of approximately 150,000 sq. m. A total of 2.8 km of underground gas pipeline alignment was modeled based on electromagnetic survey data provided by SNGPL, and seven aboveground electric pylons were georeferenced and incorporated into the 3D model using coordinate data from PESCO. The terrain surface was generated using the Model Builder in InfraWorks to capture the natural topography of the Malakand valley terrain. The road corridor design, including the bridge, fencing, guard rails, and barriers, was modeled in Civil 3D with accurate cross-sectional assemblies. The final federated model was exported as an .obj 3D file and re-imported into Civil 3D for detailed road assembly and gas pipeline detailing before integration in Navisworks.
5.2. Utility-Road Conflict Identification
The 3D BIM model identified five utility-road conflict zones within the examined 5 km segment that posed potential risks during earthwork operations. Three of these were subsurface gas pipeline conflicts, located at approximate chainages of km 8 + 200, km 9 + 450, and km 10 + 100, where the pipeline depth was within 1.0 to 1.5 m of the proposed road formation level. At these locations, standard earthwork operations, such as cut-and-fill and sub-grade preparation, would endanger the buried gas pipeline, without prior relocation. The remaining two conflicts involved aboveground electric pylons located at km 7 + 800 and km 10 + 600. Both of these were within 5 m of the proposed road centerline and inside the right-of-way boundary. Of these five conflict points, only the two pylon locations had been previously identified through conventional 2D drawings available to the project team, demonstrating the superiority of the proposed approach over traditional methods.
Table 5 summarizes the identified conflict zones.
5.3. 4D Simulation and Construction Sequencing
The 4D simulation in Navisworks was performed by linking the construction schedule to the corresponding 3D model elements through the TimeLiner module. The simulation comprised six sequenced construction activities spanning a total planned duration of 26 weeks for the 5 km segment. Utility relocation activities (gas pipeline and pylon) were scheduled to be completed within the nine weeks before earthwork commenced in any given segment. The TimeLiner output demonstrated the construction sequence over time, confirming that the proposed phasing avoided temporal overlaps between live utility operations and earthwork activities. The simulation also enabled the project team to visually verify that no road construction activity was scheduled in proximity to any unrelocated utilities at any point during the planned timeline.
5.4. Quantity Analysis
The quantity analysis performed in Navisworks provided volumetric and material estimates for the 5 km section of the corridor. Earthwork volumes, including cut and fill quantities, were computed directly from the 3D terrain model and the proposed road formation levels. The gas pipeline relocation quantities, including the estimated pipe length requiring removal and reinstallation, were derived from the modeled pipeline segments at the three conflict locations. These outputs supported the preliminary cost planning process for the project and provided a basis for preparing material procurement schedules.
6. Discussion
6.1. Interpretation of Results
The results of this study demonstrate that an integrated BIM-based framework can improve the identification and management of underground utilities along highway corridors. The detection of five utility-road conflict points, three of which were previously unrecorded in any available 2D documentation, confirms that 3D BIM models significantly enhance situational awareness during excavation planning. This finding is consistent with the determinations of Tanoli et al. (2019) [
8], who reported that the lack of reliable spatial data on buried utilities is a primary cause of excavation-related damage. The fact that all three subsurface conflicts were only identifiable after spatially integrating SNGPL’s pipeline data with the highway design model in a common 3D environment underscores the importance of multi-source data integration, a core component of the proposed framework.
The 4D simulation results further demonstrate that schedule-based visualization can support coordination between road construction and utility relocation activities. The sequencing confirmed through Navisworks TimeLiner aligns with the findings of Crowther and Ajayi (2021) [
14], who reported that 4D BIM implementation improves schedule adherence by enabling stakeholders to identify and resolve temporal conflicts before construction begins.
6.2. Comparison with Existing Frameworks
The proposed framework shares common objectives with the BIM-GIS integrated system developed by Sharafat et al. (2021) [
7] and the BIM-GIS decision support system presented by Wang et al. (2019) [
38], both of which aimed to improve underground utility information management. However, the present study differs in its lifecycle orientation by incorporating a dedicated data-updating stage that addresses post-construction asset management, a dimension that was not covered in either of those studies. Additionally, unlike the GIS-based approach of Wang et al. (2019) [
38], which incorporated automated spatial queries for utility conflict detection, the present study relied on visual inspection of the 3D model to identify conflicts. The integration of automated rule-based clash detection algorithms, as explored by Sharafat et al. (2021) [
7], would enhance the objectivity and repeatability of the conflict identification process and represents a clear area for improvement.
It is also important to critically acknowledge that while the framework successfully identified conflicts for utilities for which data was available, utilities belonging to departments that did not participate in the data-sharing process (e.g., telecommunications, water supply) could not be modeled. This represents a coverage gap consistent with the findings of Quiroga et al. (2011) [
3], who identified fragmented utility ownership and poor inter-departmental coordination as primary barriers to comprehensive subsurface data availability.
6.3. Practical Implications
The findings carry several practical implications for infrastructure projects involving underground utilities. In terms of cost reduction, the early identification of three previously unrecorded subsurface pipeline conflicts through the BIM model in this instance helped to avoid emergency utility relocations during construction. According to Ignacio and El-Rayes (2018) [
4], unplanned utility relocations on highway projects can increase project costs by 10 to 20 percent due to change orders, equipment standby, and contractor claims. By detecting these conflicts at the planning stage, the proposed framework enables proactive scheduling of relocations at a significantly lower cost, compared to reactive field responses.
Regarding work safety, the 3D visualization of buried utility positions relative to proposed earthwork levels provides excavation crews with a spatial awareness that is not achievable through conventional 2D drawings. Sharafat et al. (2021) [
7] reported that a major cause of excavation-related accidents is the lack of reliable depth information about buried utilities, a gap that the proposed framework directly addresses by attaching depth, material, and positional attributes to each utility element in the BIM model. The visual identification of zones in which pipeline depth is within 1.0 to 1.5 m of the formation level enables the designation of restricted excavation zones and the deployment of manual digging protocols near these locations, both of which are recognized best practices for preventing utility strikes.
In terms of schedule efficiency, the 4D simulation demonstrated that sequencing utility relocation before earthwork within the same corridor segment eliminates the scheduling overlaps that commonly cause work stoppages. Crowther and Ajayi (2021) [
14] found that 4D BIM implementation can reduce project schedule deviations by enabling better coordination among multiple stakeholders, which is consistent with the feedback received from the PKHA client department. The client specifically noted that the 4D visualization would have helped coordinate the parallel involvement of SNGPL and PESCO relocation teams, avoiding the sequential delays that typically occur when utility departments are engaged reactively during construction. These practical benefits are particularly relevant within developing countries such as Pakistan, where underground utility records are often incomplete and the absence of standardized utility management practices leads to repeated excavation-related incidents and delays [
43].
6.4. Limitations
Several limitations should be acknowledged. First, the framework was validated through a single case study involving one highway corridor with two utility types (gas and electricity). Its scalability to projects involving more diverse utility networks (e.g., fiber optic, water, sewage) in dense urban environments requires further investigation. Second, the validation relied on qualitative expert feedback from the client department rather than a controlled quantitative experiment with measurable performance indicators. Third, the data-updating stage was described as a protocol, but was not tested through a full post-construction maintenance cycle, so its practical effectiveness remains to be demonstrated. Fourth, the conflict identification was performed through visual inspection of the 3D model rather than automated clash detection, which introduces subjectivity and may miss conflicts in complex multi-utility environments. Fifth, the study did not incorporate real-time sensor data or IoT-based monitoring, approaches which could extend the framework toward a digital twin approach for continuous utility condition assessment.
6.5. Future Research Directions
Future research should focus on integrating GIS-based geospatial analysis with the BIM model for automated spatial queries and broader coverage of utility networks [
44]. Digital twin approaches, as explored by Sharafat et al. (2025) [
45] for underground cavern stability monitoring and Sharafat et al. (2026) [
46] for TBM cutterhead design optimization, offer promising potential to extend the proposed framework from static BIM models toward real-time monitoring and predictive maintenance of underground utility assets. The multi-model BIM framework proposed by Tanoli et al. (2025) [
43] for underground cavern construction provides a methodological reference for integrating multiple interlinked data models that could be adapted for complex multi-utility corridor management. Additionally, testing the framework across multiple infrastructure projects in different geographical and institutional contexts would help assess its generalizability and identify context-specific adaptation requirements.
7. Conclusions
This study developed and validated a lifecycle BIM-based framework for underground utility management, structured into five interconnected stages: data acquisition, data processing, modeling, system application, and data updating. The framework was applied to a 5 km segment (km 7 to km 11) of the Swat Motorway Phase II project in KPK, Pakistan.
The case study demonstrated several key outcomes. First, the integration of Autodesk Civil 3D, InfraWorks, and Navisworks enabled the creation of a unified 3D model incorporating the highway corridor, underground gas pipelines (data provided by SNGPL), and overground electric pylons (data provided by PESCO). Second, the 4D simulation in Navisworks allowed step-by-step visualization of construction sequencing, including the planned relocation of utilities within the right-of-way. Third, the expert review conducted with PKHA confirmed that the framework improves visualization of potential utility conflicts and supports informed decision-making during pre-construction planning.
However, this study has certain limitations. The framework validation was limited to a single case study and relied on qualitative expert feedback rather than a full quantitative cost–benefit analysis. Additionally, the data-updating stage was demonstrated conceptually but not tested through a complete maintenance cycle. Future research should focus on integrating real-time sensor data with the BIM model for continuous monitoring, developing automated clash detection protocols for underground utilities, and testing the framework across diverse infrastructure projects to evaluate its scalability and generalizability.