1. Introduction
Rework in construction projects remains a persistent challenge, as repeated tasks arise from design errors, omissions, coordination failures, change orders, and miscommunication. Distinct from general inefficiencies, rework refers specifically to the removal, correction, or repetition of previously completed tasks, which makes it a particularly disruptive and costly project deviation. This distinction is crucial, as rework directly contributes to schedule delays, cost escalation, and quality degradation [
1]. Both global and regional studies consistently report that rework accounts for 5–20% of total project costs, resulting in significant disruptions across all project phases [
2]. More recent industry evidence shows the problem remains urgent: the Construction Industry Institute [
3] notes that rework-related inefficiencies now account for an estimated USD 15 billion in annual losses globally, while Middle Eastern projects report rework rates as high as 12–17% due to complex coordination structures and the pressures of accelerated project delivery. According to Gul et al. (2025) [
4], poorly managed complexity, fragmented communication, and weak coordination can increase rework by up to 18%, affecting budgets, timelines, and stakeholder satisfaction.
There is extensive research identifying common rework drivers—such as design deficiencies, client-induced changes, inadequate supervision, and workforce skill gaps [
5,
6]. There is a need to capture the systemic and interconnected nature of rework causes. For example, design changes may trigger owner-related delays, which then exacerbate contractor execution problems. Yet such upstream–downstream causal chains remain largely unexplored in the literature. As a result, practitioners often know which factors are important but lack insight into how these factors interact and reinforce each other during project execution.
Recent studies have used fuzzy logic to handle uncertainty in expert judgement, offering improved qualitative interpretation of rework-related risks. However, fuzzy systems primarily classify and rank risks and do not test hypotheses, validate latent constructs, estimate indirect pathways, or evaluate model fit [
7]. Consequently, they offer limited explanatory power for understanding how rework causes interact across project stages. Given that rework frequently arises from interactions among design, owner, contractor, and workforce decisions, understanding these latent interdependencies is essential for effective intervention.
This gap highlights the need for a theory-driven, multivariate approach capable of modelling both direct and indirect effects among different rework causation domains. Structural equation modelling (SEM) provides such a framework, integrating measurement validation with structural path analysis while accounting for latent variables and interdependencies [
8,
9]. SEM has been increasingly applied in construction research, but its application to rework causation remains limited. Existing studies using SEM have typically focused on isolated factors and have not explored cross-domain interactions, indirect pathways, or the combined influence of contractor, owner, design, and workforce elements within a unified causal structure. As a result, important questions remain about how rework originates, propagates, and intensifies across different project actors and decision points.
To address these shortcomings, the present study applies structural equation modelling (SEM) to data collected from 200 construction professionals involved in projects executed in Qatar across residential, commercial/industrial, and infrastructure sectors. Forty-three factors were evaluated across four domains: contractor-related, owner-related, design-related, and resource/workforce-related. This study aims to develop a validated structural model that explains not only the direct effects of these domains on rework occurrence but also the indirect pathways through which upstream decisions (e.g., design coordination lapses or owner indecision) generate downstream contractor or workforce errors. In doing so, the study generates non-obvious and actionable insights—for example, identifying which early-stage interventions produce the greatest reductions in rework by interrupting causal chains rather than addressing isolated symptoms. This provides practitioners with new diagnostic and predictive capabilities that were not possible using ranking-based or fuzzy approaches.
Accordingly, this study seeks to answer the following research questions:
What are the underlying latent constructs representing rework causation in construction projects?
How do contractor, owner, design, and workforce-related factors influence the likelihood of rework when modelled structurally?
Which causation domains have the strongest direct or indirect effects on rework occurrence?
How can the identification of structural pathways improve intervention design compared to traditional ranking approaches, and what new capabilities does the resulting model offer practitioners?
1.1. Literature Review
1.1.1. Rework in Construction Projects
Rework is widely acknowledged as one of the most detrimental inefficiencies in the construction industry, often resulting in significant time and cost overruns. Previous studies have shown that rework contributes to productivity losses, budget escalation, and schedule delays in construction projects [
2,
7]. Rework is commonly defined as the unnecessary repetition of tasks caused by errors, omissions, or changes at any stage of the project lifecycle [
10]. Studies have also reported that rework can account for approximately 5–20% of the total project cost, highlighting its significant economic impact on construction projects [
1,
11]. Rework differs from general productivity losses because it requires the removal, correction, or repetition of completed work; this makes its consequences more severe in terms of disruption, waste generation, and downstream impacts. It is important to note that some conceptual overlap may exist between contractor-related and resource/workforce-related constructs. Contractor management practices, such as supervision quality and planning efficiency, directly influence workforce performance and productivity. As a result, certain indicators associated with labour skills, productivity, and site coordination may demonstrate statistical correlations with contractor management variables. Similar overlaps have been reported in previous construction management studies where closely related operational factors influence project performance simultaneously. During CFA refinement, indicators with standardized factor loadings below the recommended threshold were removed to maintain construct validity and minimize redundancy among constructs [
10].
Far from being a purely technical issue, rework is widely recognized as a systemic problem embedded across planning, design, procurement, and execution stages. Empirical investigations also show that rework frequently emerges from organizational and communication breakdowns rather than isolated technical mistakes [
12]. Scholars have grouped rework drivers into four dominant domains design-related, client/owner-related, contractor-related, and workforce/resource-related factors a classification echoed in numerous empirical studies [
13,
14,
15]. Within these domains, key drivers include poor design coordination, unclear specifications, scope changes, weak supervision, fragmented communication, and skill deficiencies. Studies focusing on building projects have consistently identified design documentation errors and incomplete drawings as dominant triggers of rework during construction stages. Such deficiencies often lead to misinterpretation of project requirements by contractors, resulting in corrective work, delays, and additional costs during execution. External influences such as regulatory delays and complex stakeholder demand further amplify rework complexity [
5,
11].
Recent literature highlights that rework is increasingly influenced by inter-organizational coordination gaps, supply chain disruptions, and rapid design changes, especially in fast-track or infrastructure projects [
16]. This shift suggests that rework results not simply from isolated mistakes but from interconnected managerial and technical failures that propagate across project teams.
However, most rework studies examine causal factors independently, limiting the understanding of how these factors interact. For example, design errors may precipitate owner-driven change orders, which contribute to contractor-related failures a cascading effect that traditional analyses overlook. Thus, researchers call for analytical frameworks that can capture interdependencies and systemic pathways rather than isolated factors.
1.1.2. Existing Methods of Rework Analysis
Various methods have been used to analyze rework, including descriptive statistics, frequency analysis, and ranking approaches such as the Relative Importance Index (RII). While these techniques help prioritize perceived causes, they are limited in their ability to reveal latent constructs, cross-domain influences, or indirect mechanisms [
17].
To address subjectivity and linguistic uncertainty, various analytical approaches such as fuzzy inference systems (FIS) have been employed, particularly for translating qualitative judgments into structured rules and supporting assessments related to risk, safety, and productivity [
18,
19]. Complementary to these approaches, model-based techniques such as structural equation modelling enable the examination of latent constructs, indirect relationships, and the overall fit of complex theoretical frameworks [
7]. SEM offers a robust framework capable of validating measurement structures, capturing cross-domain interactions, and analyzing rework as a multivariate, interdependent system. These enablers have motivated a shift toward structural equation modelling (SEM), which integrates factor analysis with path modelling. SEM enables researchers to:
Validate latent constructs underlying rework drivers
Test direct and indirect causal relationships
Assess overall model fit using indices such as RMSEA, CFI, and TLI
SEM has been used to study project success, safety, sustainability, and rework-related issues [
9,
20,
21,
22,
23].
Advanced applications such as PLS-SEM allow hypothesis testing in small samples or exploratory contexts [
24]. However, most SEM-based rework studies focus on limited domains (e.g., management practices, infrastructure quality) and do not examine the full structural interplay among design, owner, contractor, and workforce factors.
1.1.3. Use of Structural Equation Modelling (SEM) in Construction Research
SEM is widely recognized as a robust multivariate tool for examining structural relationships between latent constructs and observed indicators [
8,
25]. In developing regions, SEM has illuminated complex causal patterns influencing performance, risk, and quality [
21]. Its advantages include:
Measurement of unobservable constructs
Simultaneous hypothesis testing
Modelling indirect and mediating relationships
Validation of theoretical models
1.1.4. Empirical Applications of SEM in Rework Causation Studies
A growing body of research has demonstrated the utility of SEM in analyzing the multifaceted causes of rework in construction projects. SEM enables exploration of both direct and indirect pathways among latent constructs, providing valuable insights for project management and quality control.
Earlier research has demonstrated that improvements in workforce education and training enhance competence and adherence to standards, thereby helping to reduce rework. Evidence from labour productivity research further indicates that skilled workers and structured training programmes significantly reduce construction errors and improve overall project quality [
26]. Similarly, evidence from construction quality studies shows that frequent inspections and experienced supervisory personnel play a significant role in minimizing rework, highlighting the importance of strong supervision and quality assurance practices [
22,
23,
26,
27].
From a design perspective, prior research shows that early-stage design audits and collaborative planning can significantly reduce design-related rework, particularly in fast-track projects with evolving requirements. More recent methodological advancements have combined SEM with machine-learning approaches to improve the prediction of rework, capturing both linear and non-linear relationships and enhancing the accuracy of decision-making [
28,
29].
Regional investigations using SEM have shown that frequent design changes directly contribute to rework, while experienced project teams can help mitigate these effects [
16]. Other studies highlight the influence of planning delays, managerial inefficiencies, and change-order practices, reinforcing scope changes as systemic drivers of rework in construction projects [
24,
30]. Research focusing on risk and project management also emphasizes that inadequate planning and poor coordination can increase project uncertainties and operational inefficiencies [
19]. In addition, workforce-related analyses indicate that factors such as labour productivity and site management practices significantly affect construction quality and schedule performance [
26]. From a methodological perspective, structural equation modelling has been widely applied to examine the relationships between these complex variables in construction management research [
25,
31,
32].
Several studies have examined related domains that intersect with rework causation. Research on construction productivity has identified workforce-related issues as significant contributors to inefficiencies that may ultimately lead to rework during project execution [
33]. Other analyses show that planning failures and coordination gaps act as indirect sources of inefficiency, often escalating into rework during construction activities [
34]. Studies focusing on cost overruns highlight that design inefficiencies and scope changes can trigger cascading project risks, patterns that are consistent with commonly reported rework drivers [
35]. Investigations into strategic and project-related risks further reveal that the roles of project participants and the effectiveness of safety and risk management practices influence project outcomes and may serve as precursors to rework [
36].
Research using PLS-SEM in the context of construction disputes has shown that issues such as poor design documentation, communication gaps, and stakeholder misalignment are major drivers of disputes and also contribute to rework. These applications further illustrate the suitability of PLS-SEM for studies with smaller samples or exploratory objectives [
24].
Collectively, these studies affirm SEM as a powerful methodology for diagnosing systemic, multi-level rework causation. By capturing interdependencies across managerial practices, workforce factors, and technical processes, SEM enables a shift from linear causality to holistic system-level analysis.
1.1.5. Identified Research Gap and Contribution to Knowledge
While numerous studies have identified individual rework factors, few have modelled the structural interrelationships among the four major domains of rework: design, owner, contractor, and workforce/resource-related factors. Prior research lacks:
Latent construct validation
Integrated multivariate causal modelling
Examination of indirect pathways
SEM-based rework analysis
This study addresses these gaps by developing and validating an SEM framework that models 43 rework causation factors synthesized from prior empirical studies and classified according to established rework taxonomies. The model captures how the four domains interact structurally, revealing both direct and indirect effects on rework occurrence. This approach advances methodological rigour and provides non-obvious insights for practitioners for instance, identifying how early-stage design interventions reduce downstream contractor and workforce errors.
Although several studies in construction management have applied Structural Equation Modelling (SEM) to examine issues such as project delays, productivity, and risk management, the application of SEM specifically to investigate the structural relationships among rework causation factors remains relatively limited. Most previous studies on construction rework have primarily relied on descriptive statistical approaches such as frequency analysis, severity indices, or factor ranking techniques to identify dominant causes. These approaches provide useful insights into the prevalence of individual factors. There is a need to capture the complex interrelationships among different stakeholder domains that contribute to rework in construction projects.
While prior studies have applied advanced quantitative approaches to construction management problems, their analytical focus and structural scope differ from the framework developed in this study. For instance, the study in [
24] adopts a DEMATEL-based approach to analyze construction disputes by identifying categories of disputes and examining their interrelationships. Similarly, the study in [
29] utilizes a hybrid SEM–ANN approach to evaluate the impact of rework factors on project cost, primarily focusing on predictive accuracy and the identification of non-linear relationships among variables. In addition, existing SEM-based studies such as [
22] examine construction-related issues using latent variable modelling.
The present study develops a comprehensive SEM-based framework that explicitly models rework causation through the simultaneous integration of contractor-related, owner-related, design-related, and workforce/resource-related factors within a unified structural system. A key contribution of this study lies in its ability to represent cross-domain interdependencies, where upstream factors such as design deficiencies and owner-related decisions influence downstream contractor and workforce processes, thereby capturing both direct and indirect pathways of rework generation. Furthermore, beyond construct-level analysis, this study incorporates indicator-level global weight estimation to identify the most influential operational variables within each construct. This dual-level analytical approach, combining structural modelling with indicator-level prioritization, provides a more interpretable and practically actionable framework that primarily emphasize factor interaction or predictive performance. This distinction is explicitly reflected in the structural design and analytical depth of the proposed SEM model.
This study presents a cross-domain structural framework that concurrently captures interdependencies among design, owner, contractor, and workforce elements, in contrast to previous SEM studies that mostly concentrate on isolated domains or direct relationships. Specifically, the model explicitly depicts mediated routes that allow upstream influences (such as owner decisions and design flaws) to spread to downstream execution phases. Additionally, the Construction Risk Index (CRI), which combines construct-level SEM with indicator-level global weighting, offers a dual-layer analytical contribution that goes beyond traditional SEM uses in construction research.
1.1.6. Scope of the Study
The study focuses on construction projects covering residential, commercial/industrial, and infrastructure sectors. The scope includes projects executed primarily in urban metropolitan regions, where rework incidence is notably high due to complex stakeholder environments. This study aims to identify and evaluate the structural relationships among key rework causation factors in construction projects using SEM. The research is based on a dataset collected from 200 construction professionals across multiple roles, including project managers, site engineers, and consultants. Forty-three causation factors are analyzed and grouped into four main latent constructs: contractor-related, owner-related, design-related, and resource/workforce-related factors. The scope of the study includes:
Quantitative validation of rework causation constructs using confirmatory factor analysis (CFA).
Development and testing of a structural model to estimate the impact of each construct on rework likelihood.
Offering a theoretical contribution to rework literature and practical recommendations for construction stakeholders aiming to manage and mitigate rework.
Although the literature review draws on studies conducted in different regions of the world to provide a comprehensive understanding of rework causation, the empirical data used in this research were collected exclusively from construction professionals involved in projects executed in Qatar. Therefore, the survey responses primarily reflect the characteristics and practices of the construction industry in Qatar. While the structural relationships identified in this study may provide useful insights for other contexts, the findings should be interpreted with consideration of the regional scope of the data.
2. Materials and Methods
2.1. Research Design
This study adopts a quantitative, cross-sectional research design to investigate the structural relationships among rework causation factors in construction projects. A structured questionnaire comprising 43 indicators was developed through a systematic process that included:
- (i)
An extensive literature review
- (ii)
Expert consultation with senior project managers and design consultants, and
- (iii)
A pilot test with professionals to ensure clarity, relevance, and content validity.
The questionnaire was reviewed by a panel of industry experts and academic researchers to ensure clarity, relevance, and completeness of the variables. Their feedback was incorporated to refine the wording and structure of the questionnaire before distribution. This process was conducted as an expert validation exercise rather than a formal Delphi survey.
Based on feedback from the pilot study, minor wording and formatting adjustments were made before full deployment. Based on the literature on construction rework, the identified variables were categorized into four major latent constructs: contractor-related factors, owner-related factors, design-related factors, and workforce/resource-related factors. Previous studies have consistently grouped rework causes within these domains, highlighting their critical influence on project performance. Contractor-related issues such as poor supervision and inadequate planning, owner-related issues such as frequent design changes, and design-related deficiencies including incomplete drawings have been widely reported as primary sources of rework. Similarly, workforce-related aspects such as lack of skills and inadequate training have also been identified as significant contributors. Therefore, these four categories were adopted to structure the measurement model and capture the major dimensions influencing rework in construction projects [
12,
37].
Table 1 shows the defined factor groups (G01–G04) along with their corresponding observed indicators.
The 43 factors were categorized into four latent constructs: contractor-related, owner-related, design-related, and workforce/resource-related factors. These constructs were validated through Confirmatory Factor Analysis (CFA) prior to structural modelling. Factor analysis is commonly used to identify underlying latent constructs that explain the correlations among observed variables. Two major schools of thought exist in factor analysis: exploratory factor analysis (EFA), which is used to explore potential factor structures, and confirmatory factor analysis (CFA), which is used to test hypothesized relationships between observed indicators and latent constructs. Since the factor structure in this study was derived from established literature, CFA was adopted to validate the proposed measurement model. Confirmatory Factor Analysis (CFA) was employed rather than Exploratory Factor Analysis (EFA) because the factor structure used in this study was derived from established theoretical frameworks and prior empirical studies. The rework causation variables were grouped into four predefined constructs representing contractor, owner, design, and resource-related factors. CFA is particularly appropriate when researchers seek to test whether observed variables adequately represent hypothesized latent constructs. In contrast, EFA is generally used in exploratory studies where the factor structure is unknown. Therefore, CFA was selected to validate the measurement structure prior to structural model estimation.
Structural Equation Modelling (SEM) was selected because it allows simultaneous assessment of the measurement model (accuracy of latent constructs) and the structural model (causal relationships among constructs). This makes SEM particularly suitable for examining complex, interrelated rework causes that cannot be captured through descriptive ranking or regression alone. All analyses were conducted using IBM SPSS 27 and AMOS 26, following the two-step SEM approach [
38].
In addition, SEM assumptions were explicitly tested:
Multivariate normality (via Mardia’s coefficient);
Linearity between constructs;
Absence of multicollinearity (checked using VIF and correlation matrix thresholds);
Adequate sample size relative to model complexity.
2.2. Population and Sampling
The target population comprised professionals actively involved in construction project execution, including project managers, site engineers, consultants, planning engineers, and quality/safety engineers, each with firsthand experience managing or responding to rework incidents. A purposive sampling method was employed to ensure that only respondents with relevant expertise contributed to the dataset.
Communalities indicate the proportion of variance in each observed variable explained by the corresponding latent construct. All values exceed the recommended threshold of 0.50, with the majority above 0.60, confirming adequate shared variance among indicators.
Data were collected through an online survey disseminated via SurveyMonkey and professional mailing lists. After screening for incomplete responses and statistical outliers, 200 valid responses were retained. This sample meets SEM requirements, which recommend a minimum of 5–10 responses per indicator [
38]. Although the recommended sample size for SEM models with 43 indicators may range between 215 and 430 observations, several methodological studies indicate that smaller samples may still yield stable parameter estimates when indicators exhibit relatively high communalities and strong factor loadings [
8,
25]. In the present study, the majority of indicators demonstrated communalities exceeding 0.60, indicating that a substantial proportion of variance is explained by their corresponding latent constructs. Previous research has shown that high communalities can compensate for moderate sample sizes by improving the stability of parameter estimation in SEM models [
8].
Furthermore, the final measurement model retained indicators with satisfactory standardized factor loadings and reliability measures, which further supports the adequacy of the dataset for structural analysis. Therefore, while acknowledging that the sample size is slightly below the recommended range, the statistical diagnostics suggest that the sample provides sufficient empirical support for the SEM analysis conducted in this study.
To ensure representativeness and reduce sampling bias, respondents were drawn from residential, commercial/industrial, and infrastructure project sectors and represented contractors, consultants, and client organizations. All participants had a minimum of three years of professional experience. The demographic profile of the participants is summarized in
Table 2.
To ensure diversity and minimize response bias, the participants represented a range of construction sectors (e.g., residential, commercial, infrastructure) and organization types (contractors, consultants, developers). The inclusion criteria required a minimum of three years of professional experience in construction project execution or management.
2.3. Data Collection
Primary data were obtained using a structured, self-administered questionnaire measuring the perceived impact of rework causation factors on a five-point Likert scale (1 = very low influence, 5 = very high influence). The instrument was developed by integrating factors identified in previous empirical studies and refining them through expert validation, following established survey development practices in construction management research [
38,
39]
A pilot study with 20 professionals evaluated the questionnaire’s reliability, interpretability, and construct coverage. The pilot test confirmed internal consistency (Cronbach’s alpha > 0.80 for all constructs), after which minor modifications were made [
40].
The survey was distributed electronically to ensure broad participant reach and efficient data collection. Participation was voluntary, with respondents informed of anonymity and confidentiality protections.
2.4. Validity and Reliability Procedures
To ensure the methodological robustness required for SEM, several verification steps were undertaken:
CFA was conducted to validate the latent constructs. Items with standardized factor loadings below 0.50 were removed to improve model fit and enhance construct validity. The removal of these indicators was guided by standardized factor loading thresholds and modification diagnostics obtained during the CFA. Indicators with loadings below the recommended threshold were considered weak representations of their respective latent constructs and were therefore removed to improve construct validity and model fit. This procedure is consistent with established SEM practices, where poorly performing indicators are eliminated to enhance measurement reliability and validity [
8,
25].
Importantly, the elimination of these indicators did not alter the conceptual integrity of the constructs, as the remaining indicators continued to adequately represent the theoretical dimensions of contractor-related, owner-related, design-related, and workforce/resource-related factors. Previous studies in construction management research have similarly refined measurement models through the removal of weak indicators in order to achieve more robust structural models [
33,
34].
The communalities of all 43 observed variables are presented in
Table 2. The values range from 0.62 to 0.79, with the majority of indicators exceeding 0.60. This demonstrates that the observed variables share sufficient variance with their respective latent constructs, thereby supporting the adequacy of the dataset for factor analysis and SEM.
Model adequacy was assessed using commonly recommended goodness-of-fit indices including the Comparative Fit Index (CFI), Tucker–Lewis Index (TLI), Root Mean Square Error of Approximation (RMSEA), and Standardized Root Mean Square Residual (SRMR). Acceptable model fit was determined using the thresholds CFI and TLI > 0.90 and RMSEA and SRMR < 0.08 [
39].
- II.
Internal Consistency Reliability: Reliability was assessed using Cronbach’s alpha, Composite Reliability (CR). All constructs achieved values above 0.70, indicating strong internal consistency.
- III.
Convergent Validity is assessed through:
- (a)
Standardized factor loadings (>0.50)
- (b)
Composite Reliability (>0.70)
- (c)
- IV.
Discriminant Validity: Tested using the Fornell–Larcker criterion, confirming that con-structs were empirically distinct.
- V.
Cross-Group Consistency: Reliability scores were also examined separately across contractors, consultants, and clients. Cronbach’s alpha values remained above 0.80 across all groups, confirming that respondents interpreted the constructs consistently addressing the reviewer’s concern regarding inter-group consistency.
The research framework shown in
Figure 1 follows standard SEM-based approaches [
6,
9,
38].
2.5. Ethical Considerations
This study followed standard ethical guidelines for research involving human participants. Participation in the survey was entirely voluntary, and respondents were informed about the objectives of the study prior to completing the questionnaire. Informed consent was obtained through the online survey platform before data collection began. To protect participant privacy, no personally identifiable information, such as names, organizational affiliations, or contact details, was collected. All responses were recorded anonymously and stored securely for research purposes only. The collected data were analyzed in aggregated form to ensure that individual respondents could not be identified. These procedures were implemented in accordance with widely accepted ethical standards for social science research [
41,
42].
3. Data Analysis
This section presents the results of the confirmatory factor analysis (CFA) and structural equation modelling (SEM) carried out to examine the relationships among rework causation factors and the Construction Risk Index (CRI). A two-step SEM approach was adopted, in which the measurement model was first validated, followed by testing of the structural model. In this study, the term latent construct refers to an unobservable variable that represents a group of related causes of rework. Each construct is measured through several observed variables (indicators) derived from the survey responses. For clarity, the terms factors and constructs are used interchangeably to denote latent variables, while indicators represent the measurable items used to capture these constructs.
3.1. Measurement Model (Confirmatory Factor Analysis)
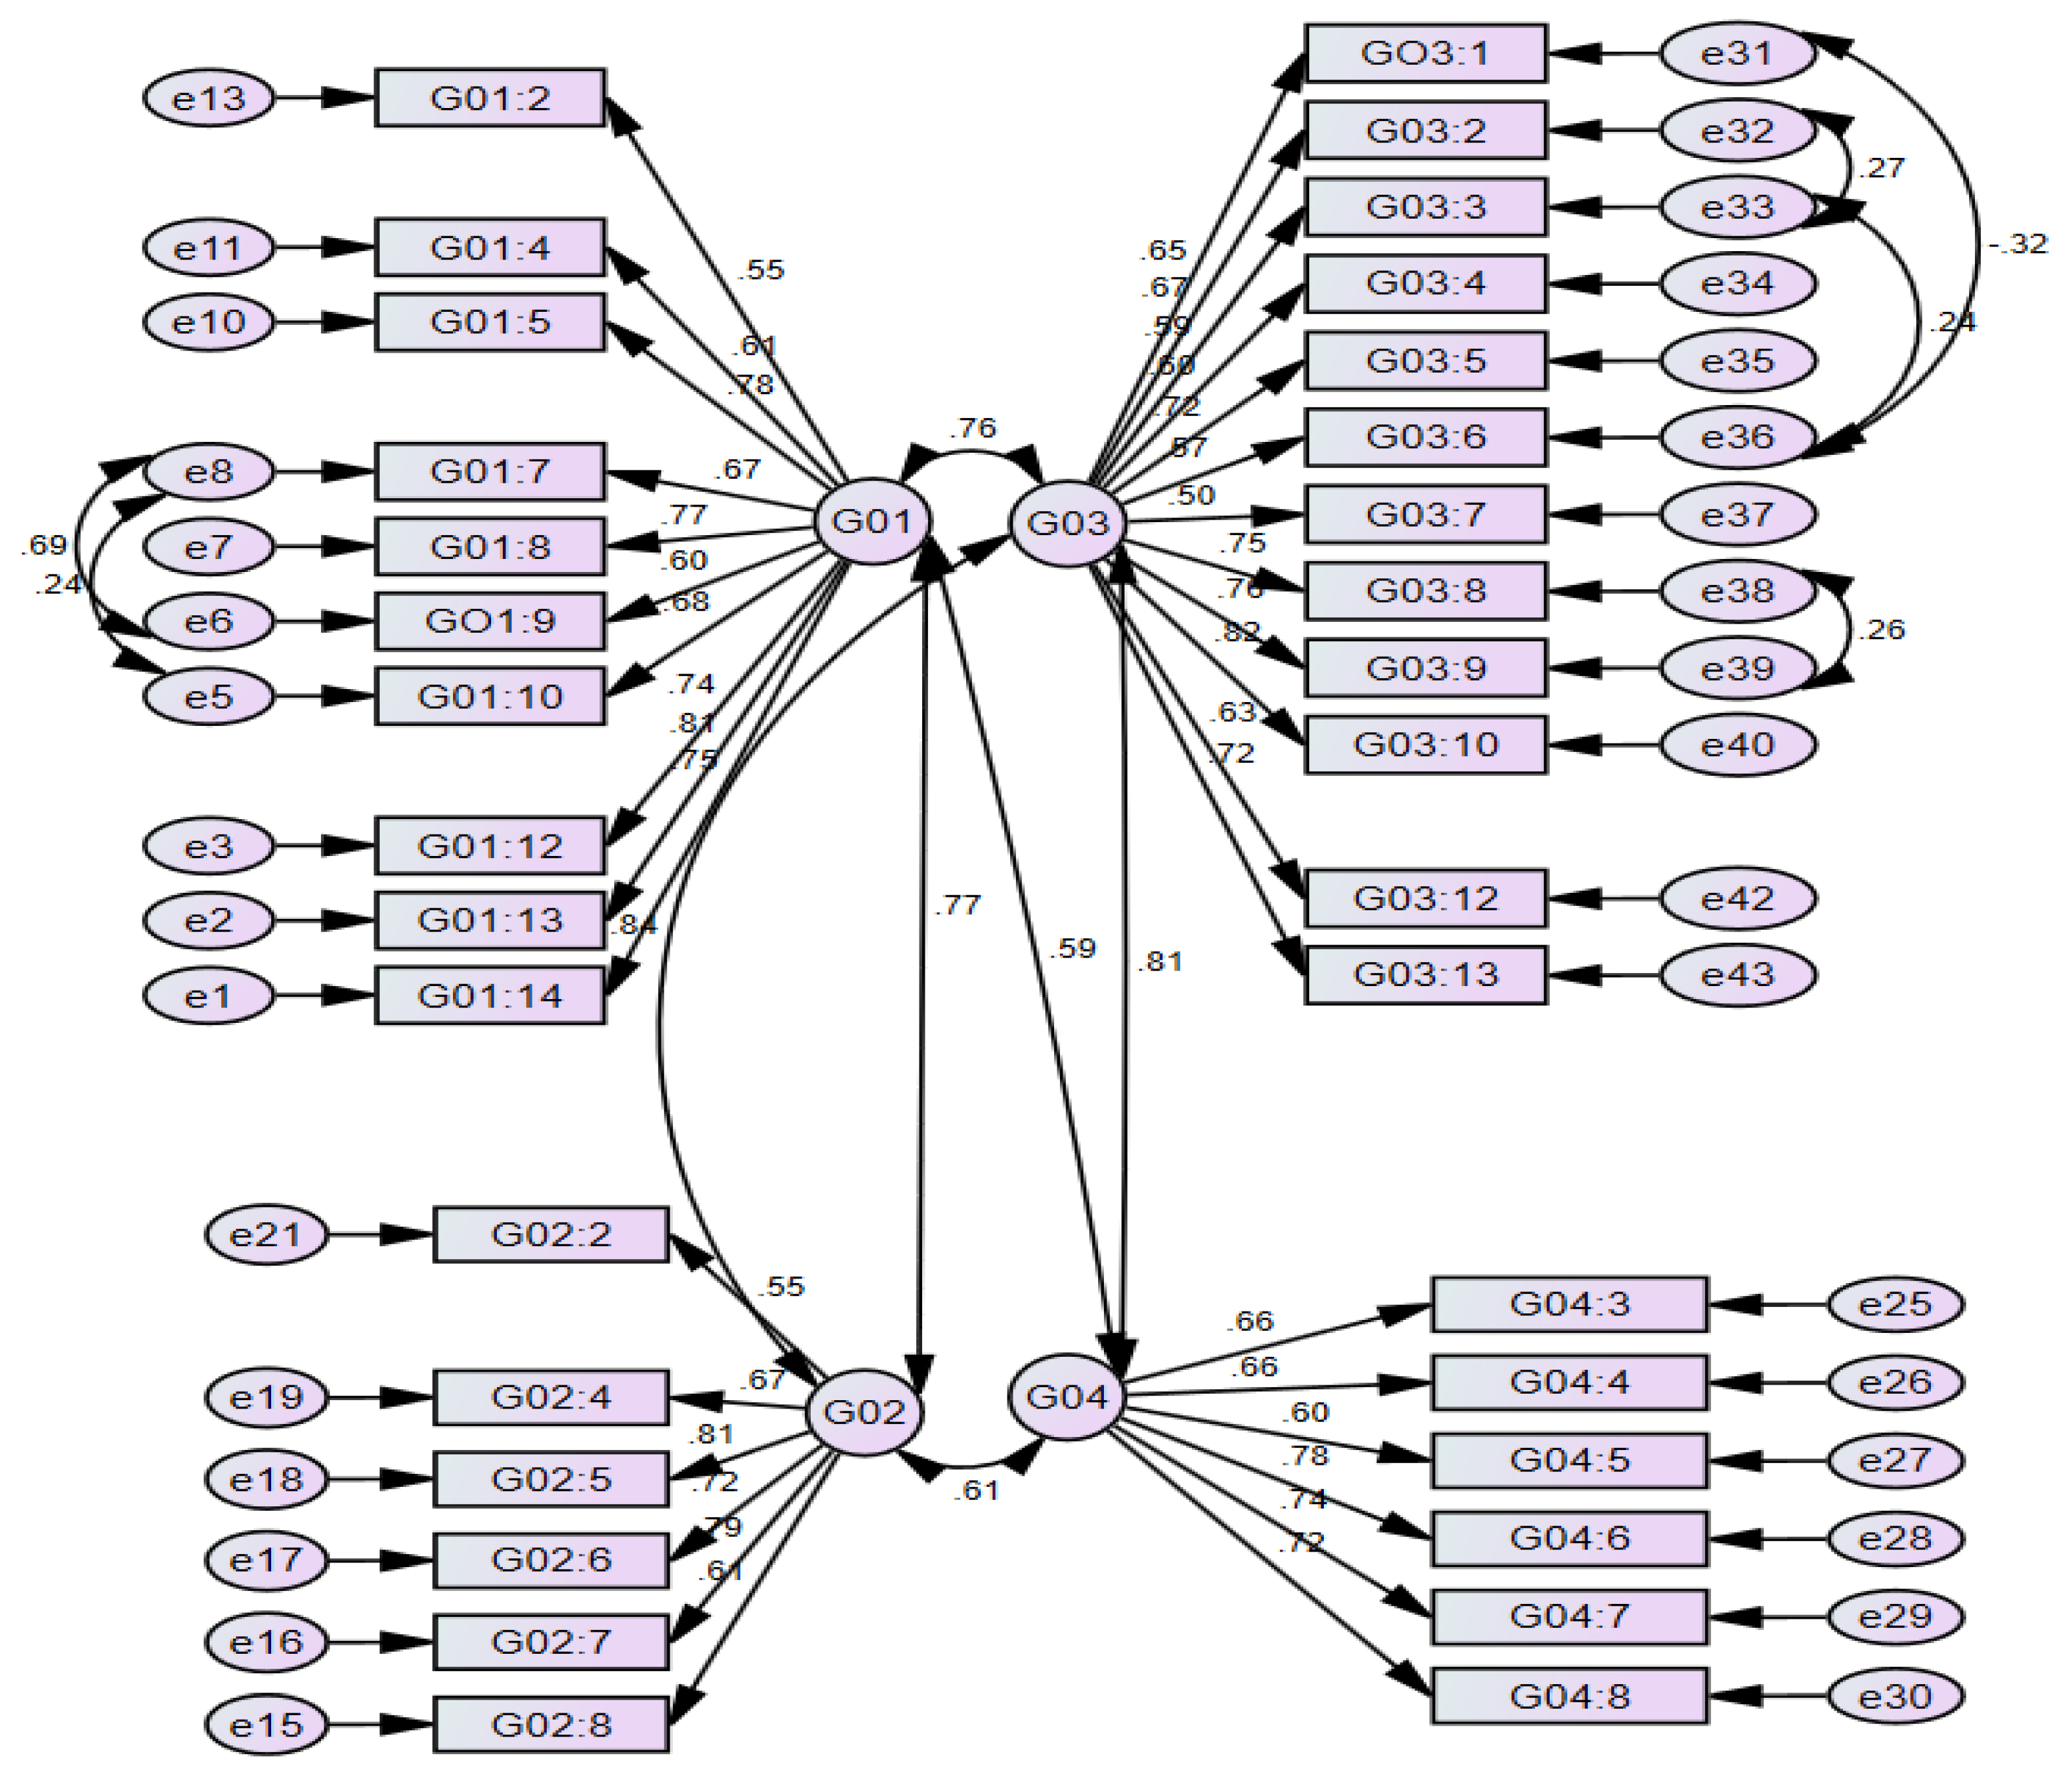
The measurement model was developed using confirmatory factor analysis to validate the underlying construct structure of rework causation factors. Four latent constructs were specified based on the literature review and expert validation: contractor-related factors (G01), owner-related factors (G02), design-related factors (G03), and resource/workforce-related factors (G04). Initially, these constructs were measured using a total of 43 observed indicators. CFA was performed using IBM AMOS with maximum likelihood estimation to assess the adequacy of indicator loadings, construct correlations, and overall model structure. The CFA results are presented in
Figure 2 following established SEM techniques [
6,
37,
38].
The correlations among the four latent constructs indicate strong and meaningful interrelationships. Contractor-related factors exhibit strong correlations with owner-related factors (r = 0.76) and design-related factors (r = 0.74), and a moderate correlation with resource/workforce-related factors (r = 0.61). Owner-related factors show strong associations with design-related factors (r = 0.82) and a moderate relationship with resource/workforce-related factors (r = 0.66). Design-related factors also demonstrate a strong correlation with resource/workforce-related factors (r = 0.82). These correlations confirm that the constructs are interdependent and collectively influence construction risk.
The results presented in
Table 3 provide the initial goodness-of-fit statistics for the CFA-based measurement model.
3.2. Goodness-of-Fit of the Modified Measurement Model
The goodness-of-fit of the measurement model was evaluated using multiple fit indices to assess how well the proposed model represents the observed data. The relative chi-square value (χ2/df) falls within the recommended range of 1 to 3, indicating an acceptable fit between the model and the data. Incremental fit indices, including the Comparative Fit Index (CFI) and Tucker–Lewis Index (TLI), exceed the recommended threshold of 0.90, demonstrating a strong comparative fit. Absolute fit indices further support model adequacy, with the Root Mean Square Error of Approximation (RMSEA) below 0.08 and the Root Mean Square Residual (RMR) below 0.07.
Although the chi-square statistic is statistically significant (p < 0.001), this outcome is expected in complex SEM models with a relatively large number of observed variables and a moderate sample size. Therefore, greater emphasis was placed on alternative goodness-of-fit indices that are less sensitive to sample size effects. Collectively, the fit indices confirm that the modified measurement model provides an acceptable and robust representation of the underlying construct structure.
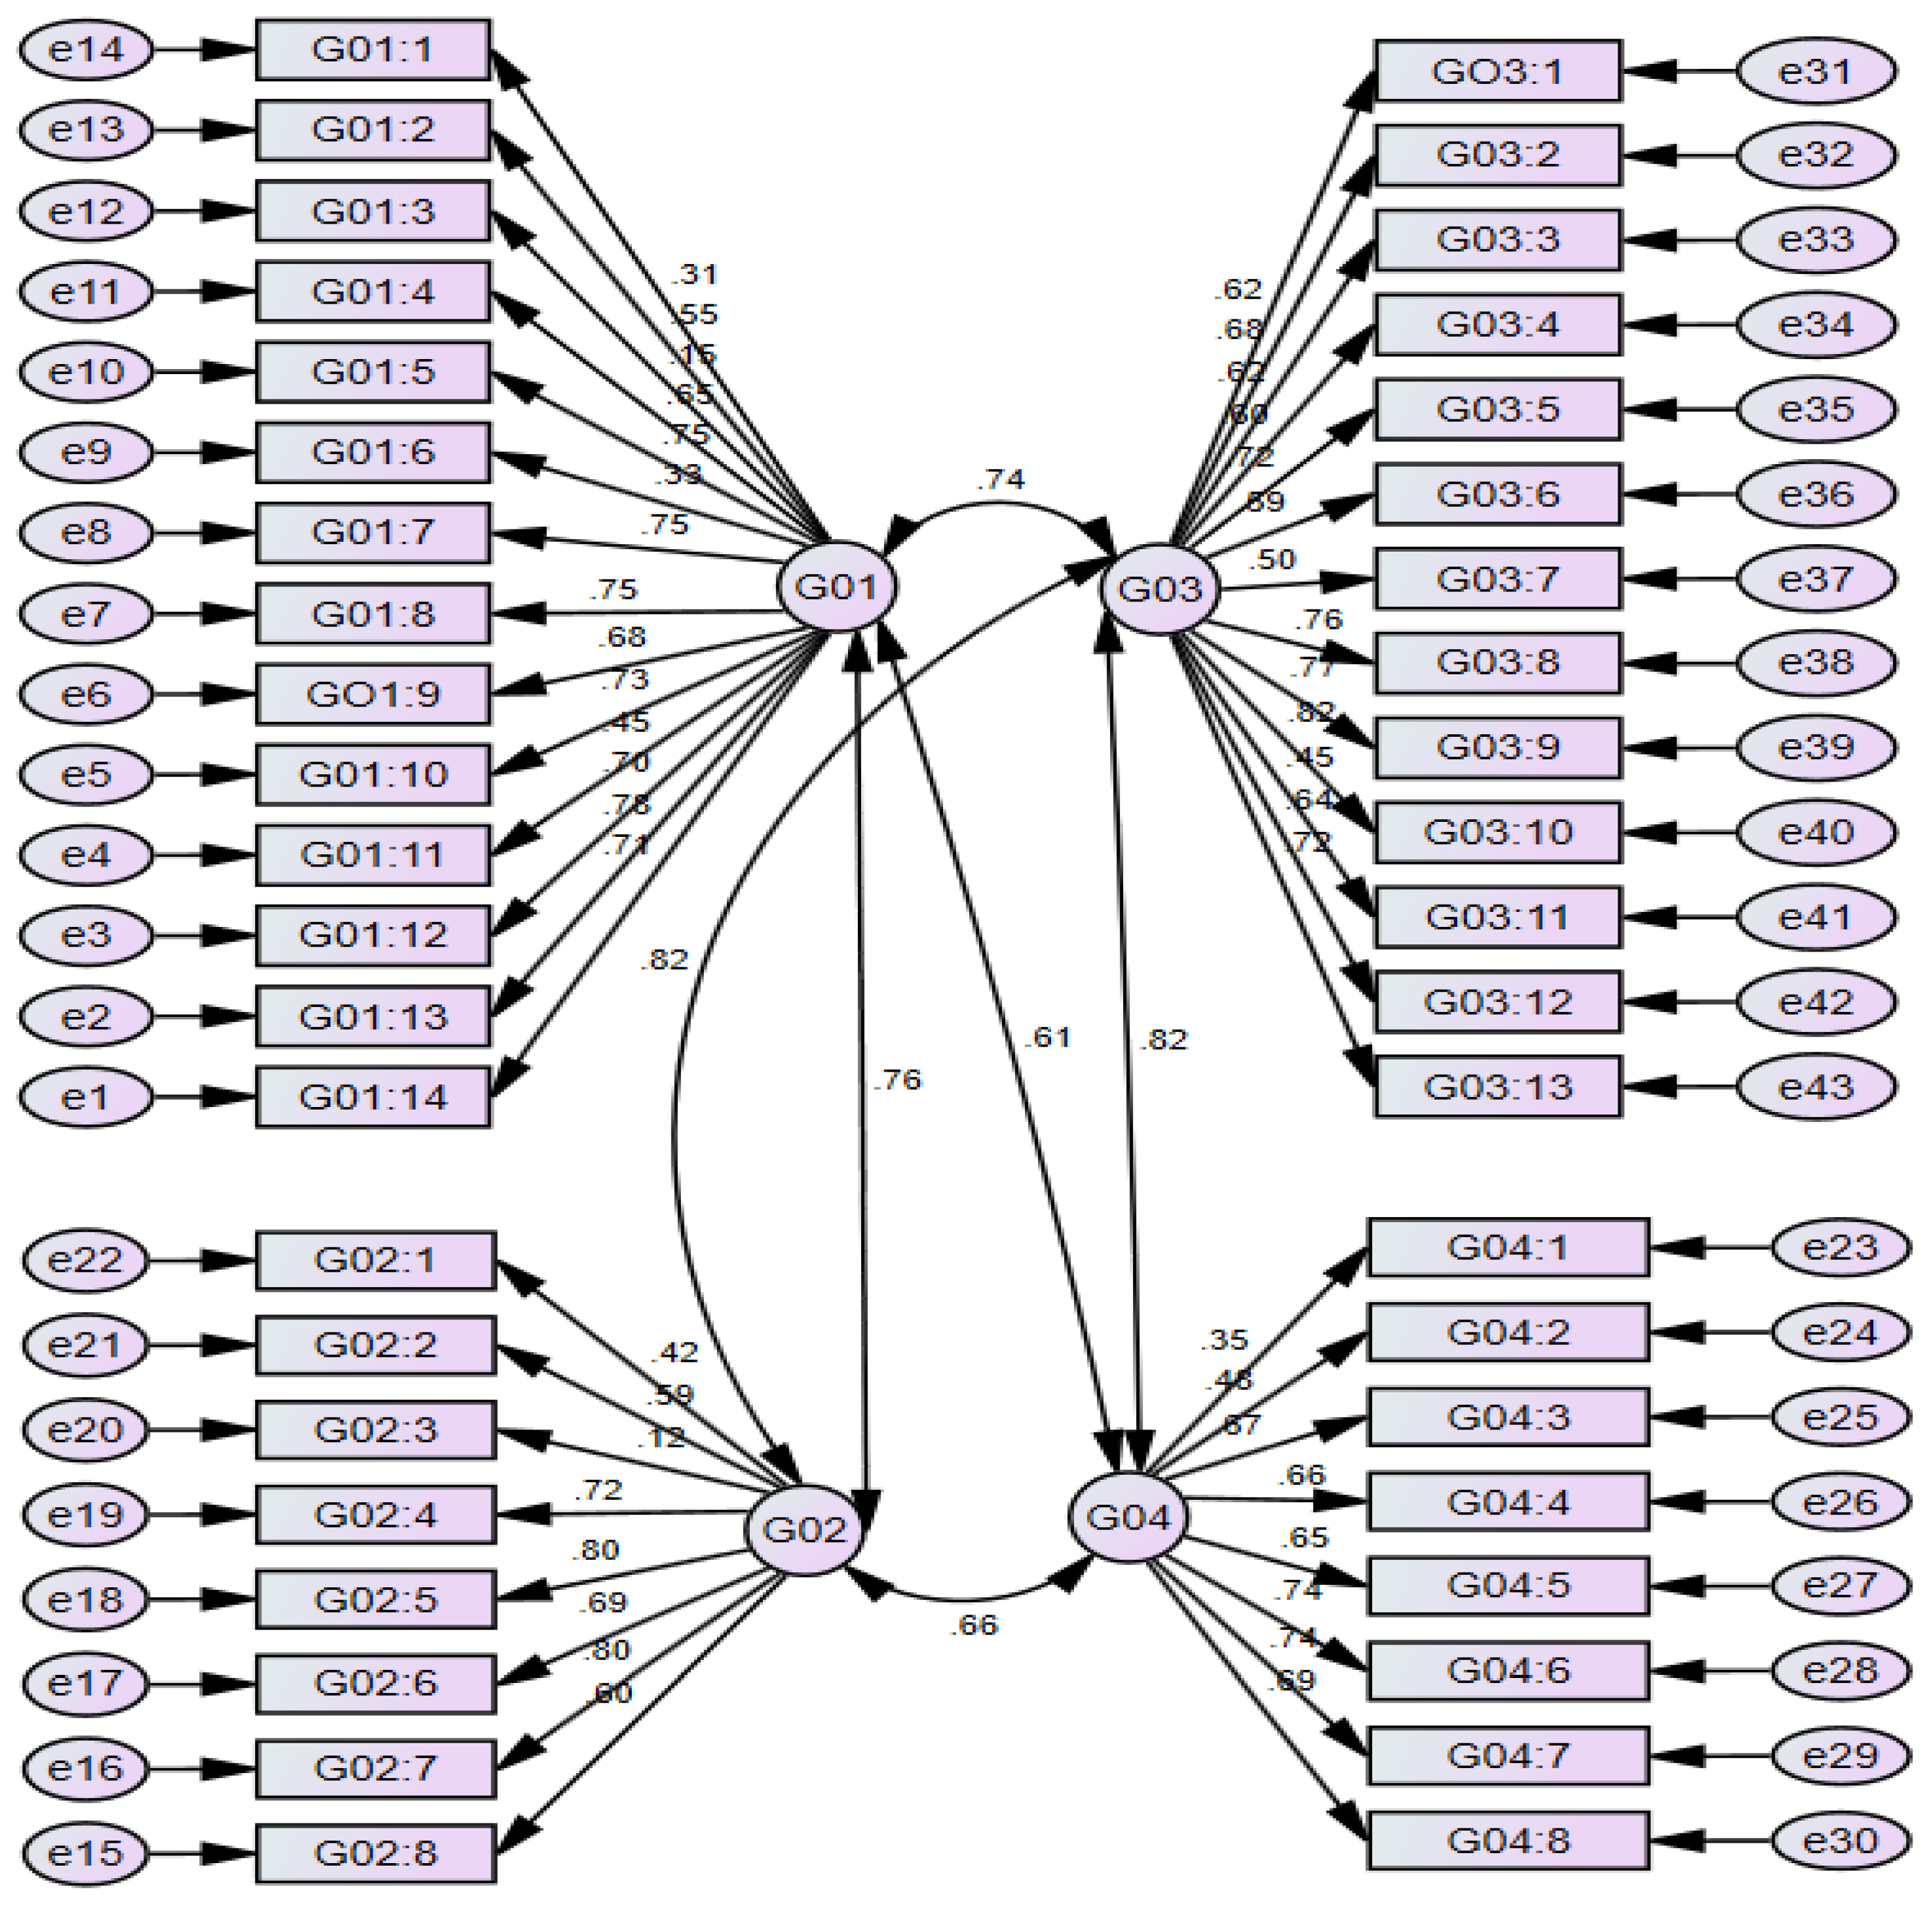
In accordance with standard CFA practices, indicators with standardized factor loadings below the recommended threshold of 0.50 were removed to improve model fit and ensure construct validity. As a result, nine indicators were excluded from the model: four contractor-related items (G01:1, G01:3, G01:6, G01:11), two owner-related items (G02:1, G02:3), one design-related item (G03:11), and two resource/workforce-related items (G04:1, G04:2). Although indicator removal was guided by statistical criteria (factor loadings < 0.50), theoretical consistency was carefully evaluated to preserve construct validity. Each removed indicator was examined against the conceptual definition of its respective construct. The eliminated items primarily represented peripheral or overlapping aspects rather than core dimensions of the constructs. For example, contractor-related indicators such as G01:1 and G01:3 were conceptually related to broader management inefficiencies already captured by retained indicators such as G01:8 and G01:10. Similarly, removed owner-related indicators (G02:1 and G02:3) overlapped with retained variables capturing scope changes and documentation clarity.
The retained indicators continue to comprehensively represent the theoretical domains of contractor, owner, design, and workforce-related factors, ensuring that content validity is not compromised. This approach is consistent with established SEM practices, where removal of weak or redundant indicators enhances construct reliability without altering conceptual meaning [
38]. Therefore, the refinement process improved measurement precision while maintaining theoretical integrity.
Figure 3 below illustrates the revised measurement model after removing low-loading indicators. The revised structure demonstrates improved construct validity and overall model stability.
The overall goodness-of-fit statistics for the modified CFA model is presented in
Table 4.
3.3. Reliability and Validity of the Measurement Model
The reliability and validity of the measurement model were assessed using standardized factor loadings, Cronbach’s alpha, composite reliability (CR), and convergent validity criteria. All standardized factor loadings exceed the minimum recommended value of 0.50 and are positive, confirming unidimensionality of the constructs.
Internal consistency reliability was evaluated using Cronbach’s alpha and composite reliability. Cronbach’s alpha values range from 0.832 to 0.904, while CR values range from 0.848 to 0.904, all exceeding the recommended threshold of 0.70. These results indicate strong internal consistency across all constructs. The reliability and composite reliability values are reported in
Table 5.
Composite reliability was calculated using standardized factor loadings obtained from the CFA according to the following expression:
where
λ—standardized factor loadings and
θi denotes measurement error variance.
To examine consistency across respondent groups, cross-group reliability analysis was conducted for major stakeholder categories, including contractors, consultants/PMCs, owners/clients, and designers/others. As shown in
Table 6, Cronbach’s alpha values for all constructs remain above 0.80 across groups, indicating that the measurement items were interpreted consistently by respondents from different professional backgrounds.
These reliability results confirm that the measurement model performs consistently across different stakeholder groups
Convergent validity was assessed following the criteria proposed by [
37], which require standardized factor loadings greater than 0.50 and composite reliability exceeding 0.70. All constructs satisfy these conditions, confirming adequate convergent validity. Discriminant validity was assessed by examining inter-construct correlations, all of which were below the critical threshold of 0.85, indicating adequate discriminant validity among the latent constructs.
3.4. Data Normality and Assumption Testing
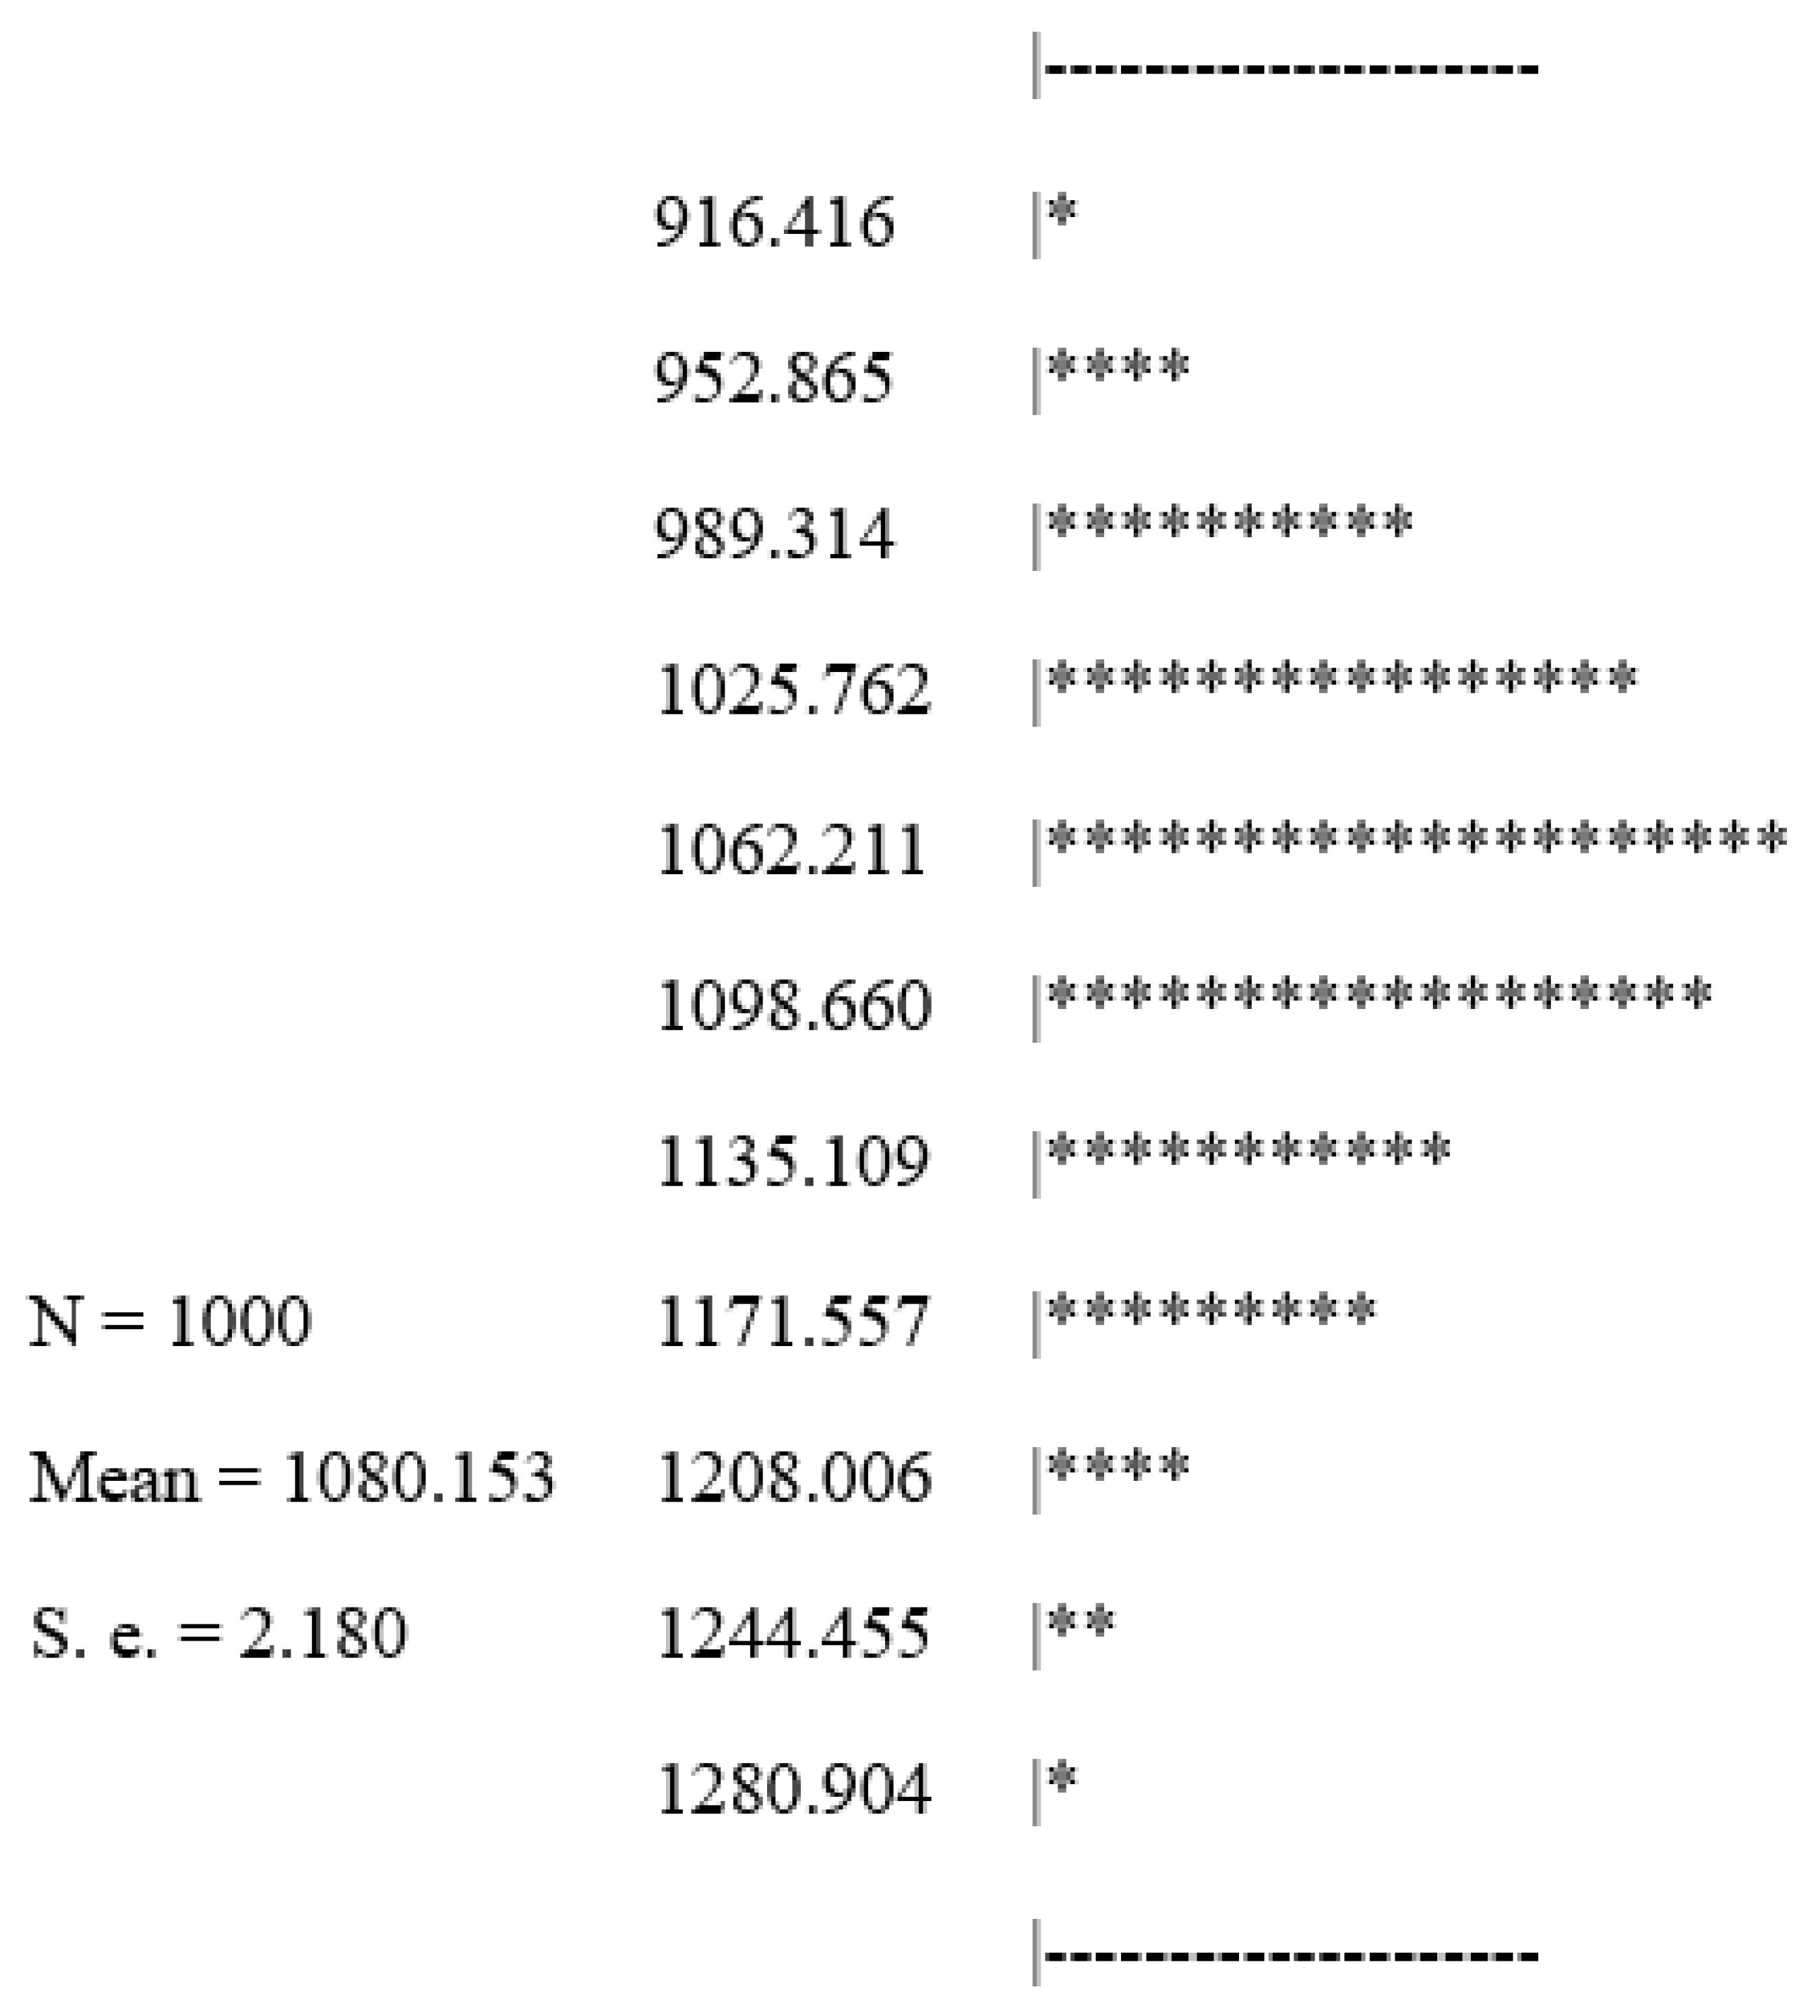
Given that the data satisfied univariate and multivariate normality assumptions, maximum likelihood estimation was deemed appropriate for both CFA and SEM analysis. Prior to SEM estimation, the assumption of normal data distribution was examined to ensure the suitability of maximum likelihood estimation. Univariate normality was assessed using skewness and kurtosis statistics, while multivariate normality was evaluated using Mardia’s multivariate kurtosis coefficient. All skewness values fall within the acceptable range of −3 to +3, and kurtosis values remain within −7 to +7, indicating no substantial departure from normality.
Potential multivariate outliers were identified using Mahalanobis distance squared values. Outlying observations and incomplete responses were removed to improve data quality and model stability. Following these adjustments, the dataset satisfied both univariate and multivariate normality assumptions, supporting the reliability of subsequent SEM parameter estimation.
Figure 4 shows the normal data distribution after the data were bootstrapped.
3.5. Structural Equation Modelling Framework and Hypothesis Testing
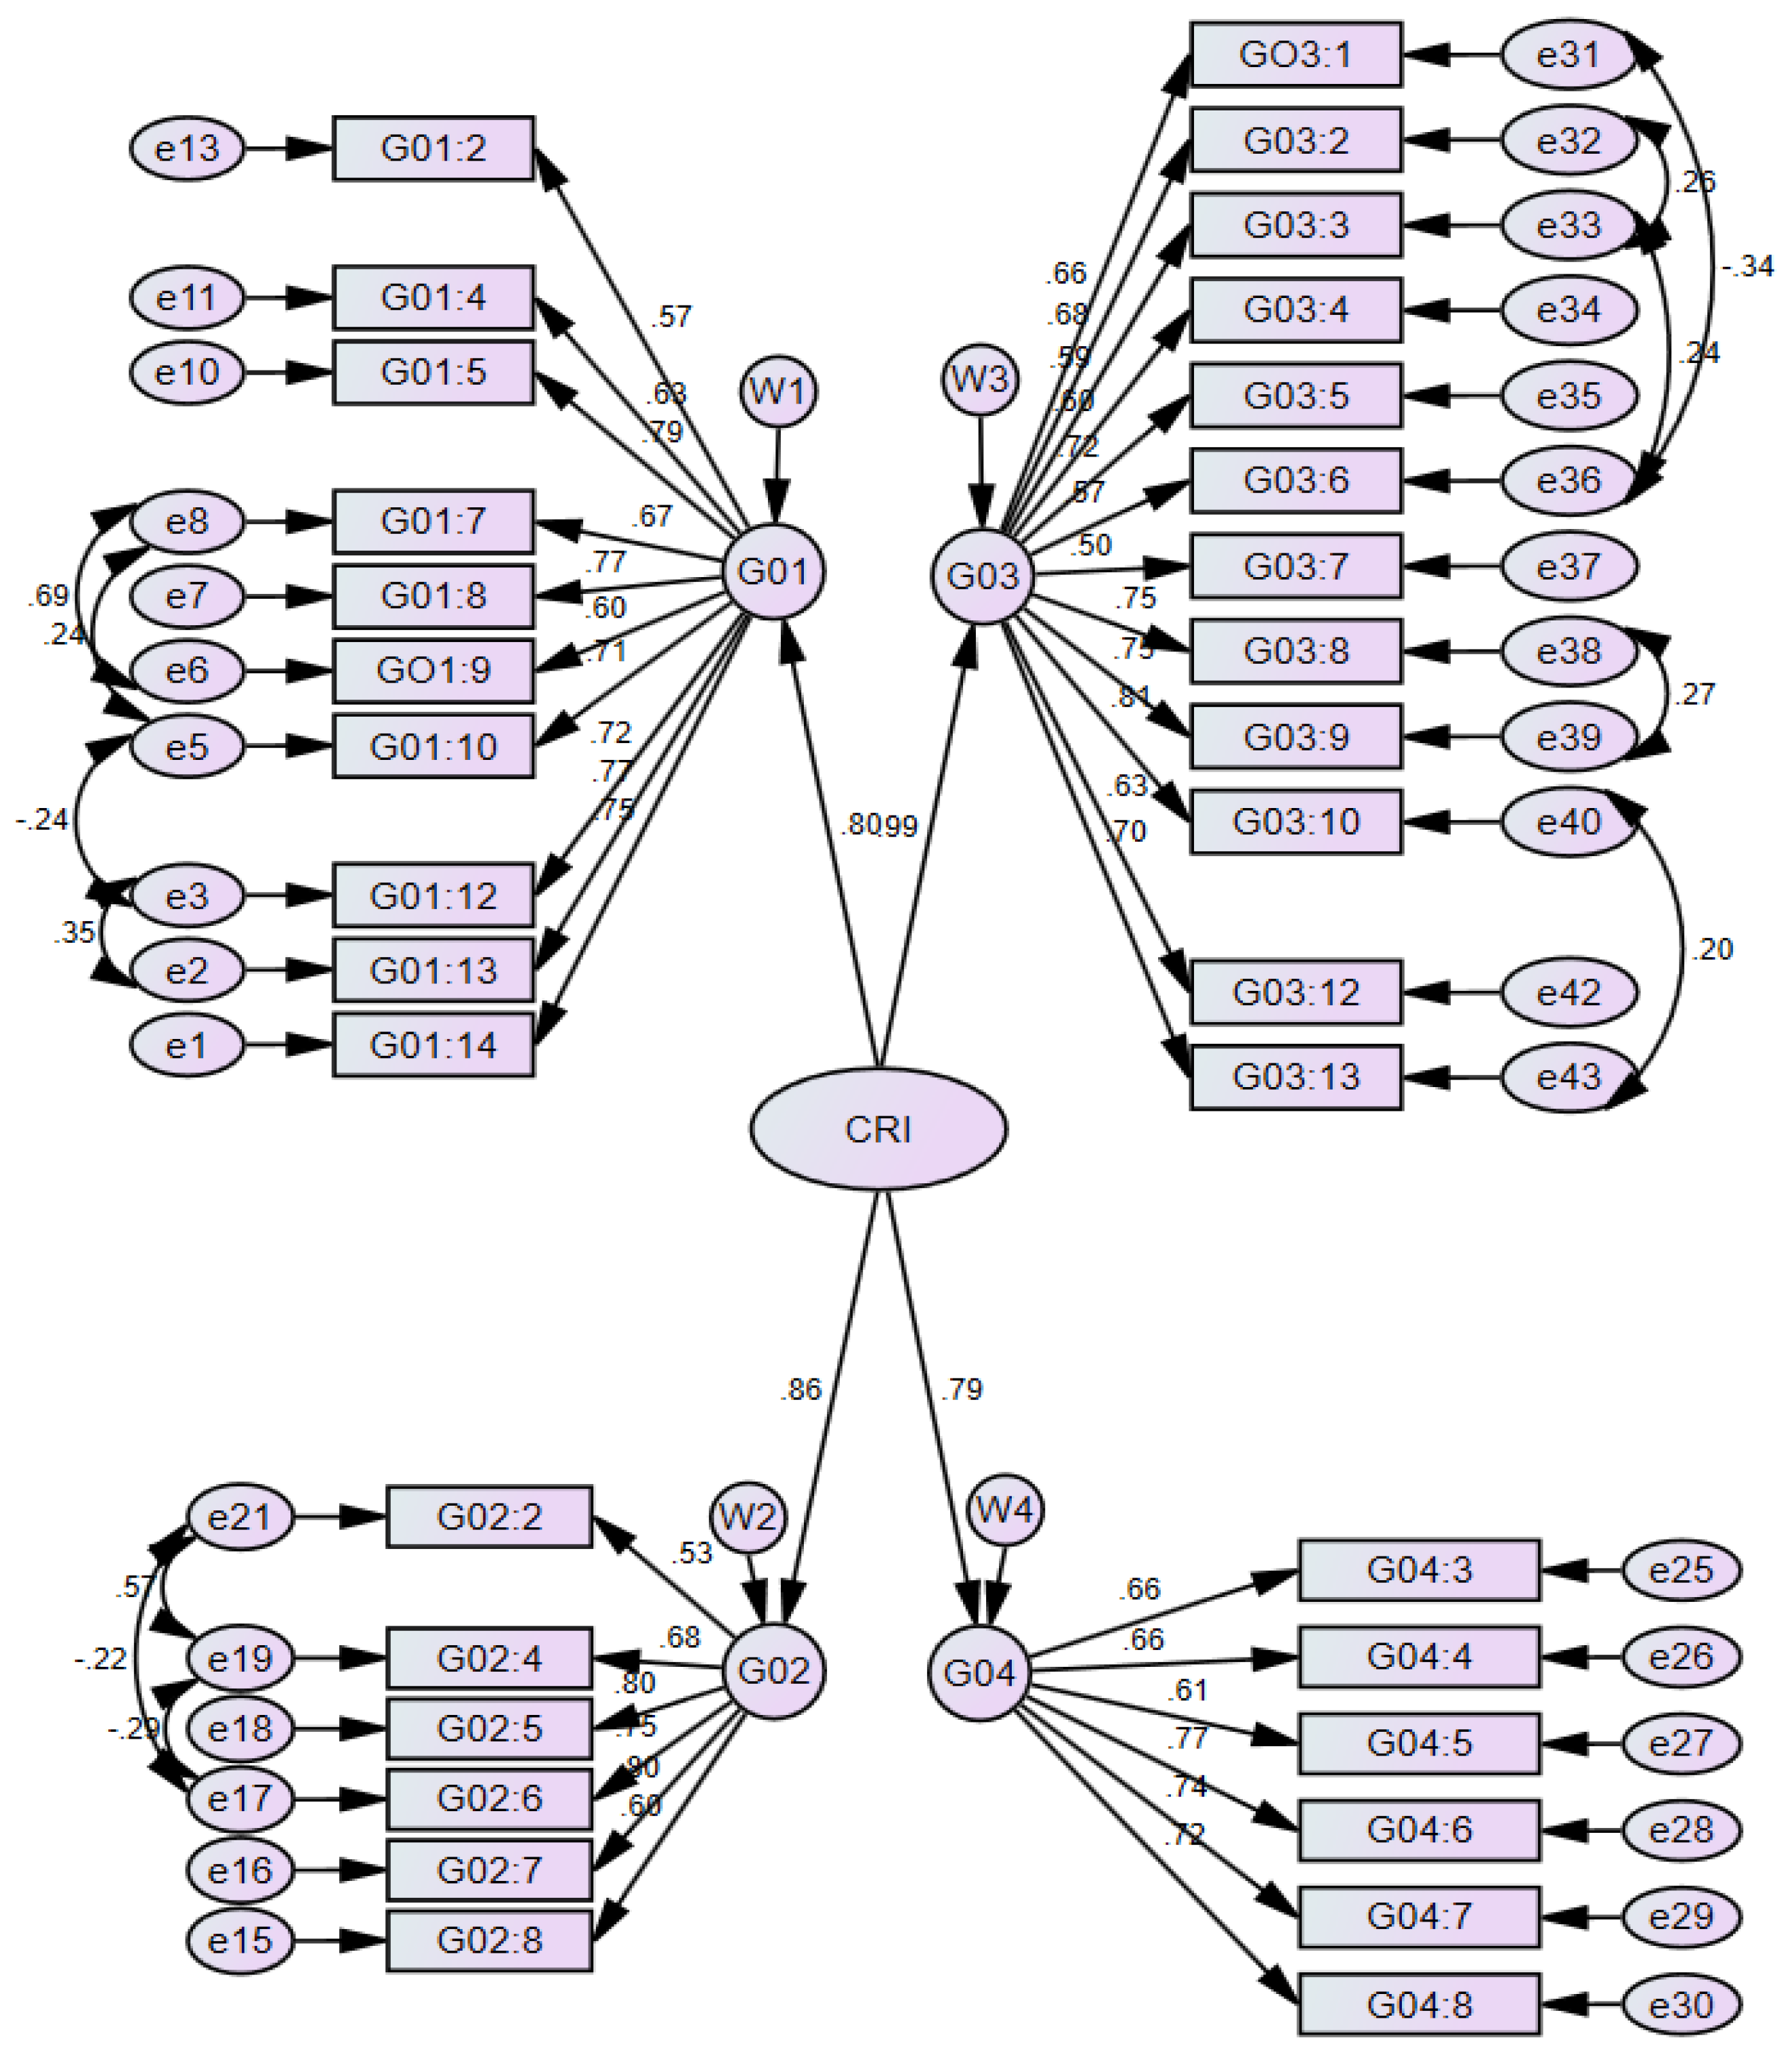
Following validation of the measurement model, structural equation modelling was conducted to test the proposed hypotheses related to construction risk. The structural model examines the influence of contractor-related (G01), owner-related (G02), design-related (G03), and resource/workforce-related (G04) factors on the Construction Risk Index (CRI). Two hypotheses were tested: H1 proposes that each category of rework causation factors has a significant positive effect on the CRI, while H2 posits that the CRI represents the combined effect of these four factor categories on overall construction project risk. The structural model is illustrated in
Figure 5.
3.6. Goodness-of-Fit of the Structural Model
The goodness-of-fit of the structural model was evaluated using the same set of fit indices applied to the measurement model. The relative chi-square value (χ
2/df = 2.209) indicates an excellent fit. Incremental fit indices, including CFI (0.909) and TLI (0.993), exceed the recommended threshold of 0.90. Absolute fit indices also fall within acceptable limits, with RMSEA equal to 0.078 and RMR equal to 0.066. Although the chi-square statistic is significant (
p < 0.001), this is common in complex SEM models. Overall, the structural model demonstrates a strong and acceptable fit to the observed data. The goodness-of-fit statistics for the SEM are reported in
Table 7.
3.7. Structural Path Results and Construct-Level Influence
All structural paths in the model are statistically significant (
p < 0.05), confirming the robustness of the hypothesized relationships. The structural model indicates that contractor-related, owner-related, design-related, and workforce/resource-related factors collectively explain a substantial proportion of the variance in the Construction Rework Index (CRI). The R
2 value obtained for CRI demonstrates that these latent constructs significantly contribute to variations in rework occurrence in construction projects. These findings are consistent with previous research highlighting that design deficiencies, client-related issues, and construction management practices are major contributors to rework in construction projects [
5,
13,
17].
Normalized factor weights were calculated to assess the relative contribution of each construct to the CRI. As shown in
Table 8, design-related factors exhibit the highest influence on construction risk, followed by owner-related factors, contractor-related factors, and resource/workforce-related factors. These results highlight the dominant role of design-related deficiencies in driving construction risk at the construct level.
where
—Normalized weight of construct i
—Standardized path coefficient of construct i
—Number of latent constructs
3.8. Indicator-Level Ranking and Global Weights
To further examine the contribution of individual indicators, global weights and rankings were calculated using normalized construct weights and standardized factor loadings.
Table 9 presents the indicator-level rankings, showing that several owner-related indicators (G02:7, G02:5, and G02:6) emerge as the most influential individual contributors to the CRI. While owner-related variables dominate at the indicator level, the construct-level analysis confirms that design-related factors exert the greatest overall influence on construction risk.
These findings demonstrate that although specific owner-related decisions act as high-impact risk triggers, systemic construction risk is primarily driven by design-related deficiencies. Overall, the SEM results confirm that all four categories of rework causation factors significantly influence the CRI, with design- and owner-related factors requiring particular attention to mitigate construction risks and reduce rework. The prioritization of factors based on effective weights is shown in
Table 10, following established weighting and SEM-based evaluation approaches [
37,
38].
The variable-level ranking in
Table 8 indicates that several owner-related variables emerge as the most influential individual contributors to the Construction Risk Index (CRI), with G02:7, G02:5, and G02:6 occupying the highest ranks. However, this dominance is observed at the indicator level. At the construct level, as shown in
Table 7, design-related factors exhibit the highest overall influence on the CRI. This distinction highlights that while specific owner-related decisions act as high-impact risk triggers, systemic construction risk is primarily driven by design-related deficiencies.
= global weight of variable
= normalized weight of construct
j (from
Table 7)
= standardized factor loading of variable i
= number of indicators in construct j
Analysis of the factor groups reveals that design-related factors (G03) have the greatest influence on the CRI, with a standardized factor loading of 0.99. This indicates that design-related issues are the most significant contributors to construction risks and rework. Owner-related factors (G02) also exert a strong influence with a loading of 0.86, suggesting that these factors play a key role in influencing the CRI.
On the other hand, contractor-related factors (G01) exhibit a moderate influence with a loading of 0.80, indicating their importance, albeit at a slightly lower level compared to the owner- and design-related factors. Resource/workforce-related factors (G04) have the lowest loading (0.79) but still contribute significantly to the overall construction risk.
Furthermore, the regression weights for each indicator in predicting their respective constructs are found to be statistically significant at the 0.001 level, confirming the robustness and reliability of the model in explaining the relationships between the constructs and the CRI.
The SEM analysis confirms that the proposed model demonstrates a strong fit and is statistically sound. The results validate the significant impact of all four factor categories (contractor-related, owner-related, design-related, and resource/workforce-related) on the CRI. Among these, design-related factors emerge as the most influential, followed closely by owner-related factors. While substantial effects were also found for contractor-related and resource/workforce-related factors, their contributions are comparatively moderate. These findings highlight the critical need to address design and owner-related issues proactively to mitigate construction risks and reduce rework, thereby enhancing overall project performance. The results also provide a helpful reference for improving coordination and planning in construction projects.
4. Discussion
4.1. Overview of Analytical Strategy
This study provides empirical evidence that rework in construction projects arises from multiple interconnected factors rather than isolated operational failures. The SEM framework enabled the identification of structural relationships among the four major domains influencing construction risk. The initial measurement model showed a relatively high RMSEA value (0.092), indicating that the first specification of the model did not adequately represent the covariance relationships among the observed variables. This outcome may be associated with the complex nature of rework causation factors and the possible overlap between some indicators belonging to different constructs. Such situations are not uncommon in the early stages of SEM analysis, particularly when the constructs are developed from several closely related variables. To address this issue, the model was gradually refined by removing weaker indicators and introducing correlations that were theoretically justified. These adjustments improved the overall model performance. In the first step, confirmatory factor analysis (CFA) was conducted to validate the measurement model by assessing construct reliability, convergent validity, and discriminant validity. In the second step, the validated constructs were incorporated into a structural model to evaluate the hypothesized relationships between contractor-related, owner-related, design-related, and workforce/resource-related factors and the Construction Risk Index (CRI). This integrated analytical framework moves beyond descriptive or ranking-based methods and enables a systemic understanding of rework by establishing statistically supported relationships among multiple causation domains. This systemic interpretation is consistent with previous studies that highlight rework as a multifaceted phenomenon influenced by interacting organizational and technical factors rather than isolated operational failures [
5,
11].
4.2. Measurement Model Validation (CFA)
The CFA results confirmed that all four latent constructs were both theoretically coherent and empirically robust. All standardized factor loadings exceeded the recommended threshold of 0.50, indicating satisfactory indicator reliability. Composite reliability and average variance extracted (AVE) values met established benchmarks, demonstrating adequate internal consistency and convergent validity. Discriminant validity was also confirmed, indicating that the constructs represent conceptually distinct domains. These findings reinforce the conceptualization of rework as a multidimensional phenomenon arising from interrelated yet non-overlapping processes operating across different stages of construction projects.
4.3. Structural Model Performance and Construct-Level Effects
The structural equation model demonstrated an acceptable to good overall fit to the observed data. The relative chi-square value (χ
2/df = 2.21) falls within the recommended range of 1–3, indicating an appropriate balance between model complexity and explanatory power. Additional fit indices, including the Comparative Fit Index (CFI = 0.91), Tucker–Lewis Index (TLI = 0.99), Root Mean Square Error of Approximation (RMSEA = 0.078), and Root Mean Squared Residual (RMR = 0.066), further confirm that the proposed model adequately represents the underlying data structure. Although the chi-square statistic was statistically significant (
p < 0.001), this outcome is common in complex SEM models with moderate to large sample sizes and does not undermine the overall model adequacy [
43]. The use of structural equation modelling to examine complex causal relationships in construction management research has been widely supported in previous studies, which demonstrate its capability to capture interdependencies among project risk factors and performance outcomes [
9,
16].
4.4. Hypotheses Testing and Interpretation
H1: Design-related factors → CRI
Design-related factors emerged as the most influential construct in the structural model, with a standardized path coefficient of 0.99. Design issues often lead to rework because construction activities depend heavily on accurate drawings and specifications. When design information is incomplete or inconsistent, contractors may proceed based on assumptions, which later require corrections once the correct information becomes available. This result underscores the central role of design errors, omissions, coordination failures, and late-stage design modifications in driving construction risk and rework. Similar findings have been reported in earlier research where design errors and deficiencies in contract documentation were identified as major sources of construction defects and rework across building projects [
5,
13]. The strength of this relationship confirms that deficiencies originating during the design phase tend to propagate across subsequent project stages, amplifying their impact during construction execution. This finding reinforces existing evidence that robust design coordination and early-stage validation are critical to minimizing rework [
28,
44].
H2: Owner-related factors → CRI
Owner-related factors exhibited a strong and statistically significant association with the CRI (standardized loading = 0.86). This highlights the critical role of client-driven issues such as frequent scope changes, delayed or inconsistent decision-making, unclear project requirements, and approval bottlenecks. These factors act as high-impact risk triggers that introduce uncertainty into the project environment, thereby increasing the likelihood of design revisions and execution-stage rework. Previous investigations have similarly highlighted that client decisions, scope modifications, and approval delays frequently act as primary triggers for project changes that ultimately lead to rework during construction execution [
12,
17].
H3: Contractor-related factors → CRI
The relationship between contractor-related factors and the CRI was positive and statistically significant, with a standardized path coefficient of 0.80. This indicates that issues such as inadequate site supervision, coordination deficiencies, and subcontractor management problems contribute meaningfully to construction risk. However, the magnitude of this effect is comparatively weaker than that of upstream factors, suggesting that contractor-related issues often reflect the downstream manifestation of earlier planning and design deficiencies. This observation aligns with earlier empirical studies indicating that contractor performance issues such as coordination gaps and supervision deficiencies often emerge as secondary manifestations of earlier planning or design shortcomings [
15,
45].
H4: Workforce/resource-related factors → CRI
Workforce and resource-related factors were also found to be statistically significant predictors of the CRI, with a standardized loading of 0.79. Factors such as inadequate skill levels, labour shortages, equipment inefficiencies, and material availability constraints contribute to execution-stage disruptions and rework. Similar workforce-related challenges affecting productivity and construction performance have also been identified in previous research, particularly in relation to labour capability, supervision quality, and resource availability [
26,
27]. Although their influence is comparatively lower than that of design- and owner-related factors, these issues remain important contributors to overall project risk, particularly when upstream deficiencies have already constrained project flexibility [
22].
4.5. SEM-Based Weighting and Applicability of CRI
To further assess the relative contribution of each construct, normalized weights were derived from the squared standardized path coefficients. The results indicate that design-related factors account for approximately 32.9% of the total influence on the CRI, followed by owner-related factors (24.8%), contractor-related factors (21.5%), and workforce/resource-related factors (20.9%). This hierarchy clearly demonstrates that upstream project decisions—particularly those related to design development and client inputs exert greater systemic influence on construction risk than downstream execution-related issues [
6,
39]. This pattern is consistent with earlier research demonstrating that early-stage project decisions—particularly those related to design development and client inputs—tend to exert a disproportionate influence on later project performance and the occurrence of rework [
10,
22]. Since design activities occur early in the project lifecycle, any mistakes or incomplete information at this stage can affect many later activities. As construction progresses, correcting these errors becomes more difficult and often leads to additional work, increased costs, and project delays.
At the indicator level, the Overall Effective Weight (OEW) analysis provides additional insight into the relative importance of individual variables. OEW combines the standardized factor loading of each indicator with the normalized weight of its corresponding construct, thereby representing the global importance of each variable rather than its direct causal strength. The variable-level rankings show that several owner- and design-related indicators occupy the highest positions, indicating that specific client decisions and design deficiencies act as critical risk triggers. However, these high-impact indicators operate within a broader structural context in which design-related factors remain the dominant systemic drivers of rework.
The dominant influence of design-related factors can be explained by the critical role that design documentation plays in guiding construction activities. Previous studies have shown that errors, omissions, and changes in contract documentation are among the primary causes of rework in construction projects. For instance, when inconsistencies or missing information occur in design drawings, contractors may proceed with construction based on incorrect or incomplete details. Once these discrepancies are identified during project execution, previously completed work may need to be modified or reconstructed, resulting in additional labour, material wastage, and schedule disruptions. Such design-related issues can therefore trigger a sequence of corrective actions throughout the project lifecycle, which explains why design factors demonstrate the strongest influence on rework occurrence in the present study [
37].
4.6. Theoretical Insights and Systemic Interpretation
This study contributes to construction management theory in several important ways. First, it empirically validates rework as a latent, multidimensional construct shaped by interconnected technical, managerial, and organizational processes rather than isolated operational failures. Second, by establishing a quantifiable hierarchy among causation domains, the study advances a systems-based understanding of how upstream deficiencies cascade into downstream rework. Third, the application of SEM provides a more rigorous analytical foundation than traditional ranking-based or heuristic approaches by enabling confirmatory validation and structured interpretation of causal pathways within statistically defensible limits. Unlike many previous studies that mainly rank rework factors based on their importance, this study uses a structural modelling approach to understand how different factors are connected to each other. By examining these relationships together, the study shows that rework is not caused by isolated mistakes but results from the interaction of several factors within the construction process. These findings also support previous modelling studies that emphasize the value of structural equation modelling for analyzing causal relationships among construction risk variables and project performance outcomes [
33,
34]. These contributions strengthen the theoretical grounding of rework research and provide a platform for future extensions, including multi-group and longitudinal SEM analyses.
This study’s primary methodological innovation is its departure from traditional SEM applications that concentrate on direct effects or single-domain research. In addition to connecting SEM outputs with an operational CRI formulation based on normalized concept and indicator weights, the suggested framework captures cross-domain causation and mediated structural pathways. Compared to earlier SEM-based rework studies, our integrated structural–operational integration offers a more practical and analytically rigorous methodology.
4.7. Practical Implications
The findings of this study offer several important implications for construction professionals and project stakeholders. The dominant influence of design-related factors highlights the need to prioritize design completeness, interdisciplinary coordination, and rigorous design audits during early project stages. The strong role of owner-related factors underscores the importance of clear scope definition, structured decision-making processes, and effective communication mechanisms between clients and project teams. Workforce and resource-related vulnerabilities point to the necessity of targeted training programmes, skill development initiatives, and proactive resource planning. Contractor-related contributions suggest that improvements in supervision, coordination, and subcontractor management can further reduce the likelihood of rework.
The indicator-level results derived from the SEM analysis provide a robust foundation for developing targeted and operationally meaningful rework mitigation strategies. In particular, the highest-ranked variables (G02:7, G02:5, and G02:6) reveal that critical deficiencies originate primarily during the early stages of project planning and client decision-making processes. The prominence of G02:7, which reflects unclear or poorly defined contract documentation, indicates the need for a structured and formalized contract validation process prior to construction commencement. This process should involve comprehensive multidisciplinary reviews engaging clients, consultants, and contractors to ensure alignment on scope definitions, technical specifications, and constructability requirements. The integration of digital tools such as Building Information Modelling (BIM) can further enhance this process by enabling coordinated design verification and early detection of inconsistencies across drawings and contract documents, which has been widely recognized as an effective approach for reducing design-related errors and rework [
8,
13]. In addition, the implementation of standardized documentation protocols supported by checklist-based approval systems can ensure completeness, clarity, and consistency of contract information before execution begins, thereby minimizing ambiguity-driven rework.
The significance of G02:5 highlights the limitations of inadequate feasibility studies and underscores the necessity of strengthening front-end project evaluation practices. This requires the adoption of comprehensive feasibility assessment frameworks that incorporate technical analysis, financial evaluation, and risk identification, supported by structured stakeholder consultations to validate project assumptions and constraints prior to approval, as emphasized in previous construction management studies [
17]. Likewise, the importance of G02:6 reflects the impact of insufficient allocation of resources for consultation activities, emphasizing the need to prioritize investment in design development and expert review processes. Establishing formal design review mechanisms, including independent technical audits and iterative validation checkpoints, can significantly improve the quality and completeness of design outputs and reduce downstream rework [
10,
14]. Collectively, these findings demonstrate that effective rework mitigation is contingent upon strengthening early-stage project processes, particularly those related to documentation clarity, feasibility assessment, and design validation. By explicitly linking indicator-level insights from the SEM model to specific and implementable process improvements, the study advances beyond generic recommendations and provides a structured basis for reducing rework and enhancing construction project performance.
From a construction execution perspective, factors such as the use of damaged materials and defective equipment highlight the need for stricter quality control procedures and improved equipment management systems at construction sites. Owner-related issues such as inaccurate information provided to contractors and delays in payment processes further underline the importance of effective communication and financial management in project delivery. Similar observations have been reported in earlier studies investigating the causes of construction rework and project performance deficiencies [
13,
17,
22]. By prioritizing interventions targeting these high-impact indicators identified through the SEM framework, project managers can implement more focused strategies to reduce rework and improve overall project performance.
Overall, the results suggest that rework in construction projects is largely influenced by factors that originate during the early stages of project planning and design. When these issues are not addressed effectively, they tend to create a chain reaction of problems during the construction phase. Therefore, improving design accuracy, communication, and project management practices can play a critical role in minimizing rework. Importantly, the validated SEM framework and the derived CRI can function as both diagnostic and predictive tools for identifying rework-prone areas across the project lifecycle. By integrating construct-level weights and indicator-level importance measures into project management systems, practitioners can anticipate potential risk hotspots and implement preventive strategies proactively, thereby improving cost, schedule, and quality performance.
5. Conclusions
This study applied structural equation modelling (SEM) to examine the multifaceted nature of rework in construction projects, providing a statistically validated framework that captures the complex interdependencies among rework causation domains. Based on data collected from 200 experienced professionals and 43 observed indicators grouped into four latent constructs—contractor-related, owner-related, design-related, and workforce/resource-related.
The findings of this study highlight that rework is rarely caused by a single issue but rather by the combined influence of several factors related to design, management, and project coordination. Among these, design-related issues are the most influential contributors to rework, highlighting the critical importance of design coordination, accurate documentation, and early stakeholder collaboration. Owner-related factors also exert substantial influence, particularly through late design changes and decision delays. Contractor- and workforce/resource-related factors, while statistically significant, exhibit comparatively lower influence and are often linked to deficiencies originating in upstream planning, design, and decision-making processes. By employing SEM, this study advances a more nuanced and causally informed understanding of rework dynamics, strengthening both theoretical rigour and practical relevance.
The results also emphasize the importance of effective communication and coordination among project participants. When project requirements are clearly defined and design information is accurately communicated, the likelihood of rework can be significantly reduced. While workforce and contractor-related factors are statistically significant contributors to rework, their effects are largely conditioned by upstream design- and client-related decisions that shape project information quality and execution constraints. Strengthening front-end design management through rigorous quality control, multidisciplinary collaboration, and the adoption of digital tools such as Building Information Modelling (BIM) is essential. Clear protocols for client decision-making, streamlined approval hierarchies, and effective communication mechanisms can improve change management and reduce uncertainty. At the execution stage, improved contractor coordination, effective supervision, and proactive planning are necessary to minimize disruptions, while workforce competence should be enhanced through targeted training, skill development, and performance-based incentives.
Organizations are encouraged to integrate SEM-based diagnostic tools into construction risk management systems for continuous monitoring and early detection of rework-prone areas. Future research should extend the proposed model by accounting for project type, contract form, and regional context. Longitudinal and cross-country studies would further enhance understanding of how rework dynamics evolve over time and across settings, supporting a shift from reactive correction to proactive, data-driven prevention.
6. Limitations of the Study
While this study offers valuable insights, it also has certain limitations.
Cross-sectional design: Data were collected at a single point in time, which limits the ability to observe the evolution of rework factors over different project phases or lifecycle stages. A longitudinal study could provide deeper insights into the causal dynamics over time.
Regional scope: The empirical data used in this study were collected from construction professionals involved in projects executed in Qatar. Although the structural relationships identified in the SEM model provide useful insights into rework causation, construction practices, regulatory environments, and project delivery systems may vary across regions. Therefore, caution should be exercised when generalizing the findings to other geographical contexts. Future studies could apply the proposed model in different countries to validate its broader applicability.
Construct simplification: Although SEM allows the modelling of latent variables, the grouping of 43 factors into four broad constructs may overlook more nuanced sub-categories or context-specific interactions.
Model complexity constraints: To ensure acceptable model fit indices and convergence, some indicators with low factor loadings may have been excluded or modified, which could affect the theoretical comprehensiveness of the constructs.
Author Contributions
Conceptualization, M.G. and K.K.N.; methodology, M.G. and K.K.N.; software, M.S.D. and M.G.; validation, M.G., K.K.N. and M.S.D.; formal analysis, M.S.D.; investigation, M.S.D.; resources, M.G. and K.K.N.; data curation, M.G., K.K.N. and M.S.D.; writing—original draft preparation, M.S.D.; writing—review and editing, M.G. and K.K.N.; visualization, M.S.D.; supervision, M.G. and K.K.N.; project administration, M.G. and K.K.N. All authors have read and agreed to the published version of the manuscript.
Funding
This research received no external funding.
Institutional Review Board Statement
Not applicable, since the survey collected general industry feedback, not any of the respondents.
Informed Consent Statement
Informed consent for participation was obtained from all subjects involved in the study.
Data Availability Statement
The raw data supporting the conclusions of this article will be made available by the authors on request.
Acknowledgments
We especially want to express our gratitude to the construction industry professionals who took the time and effort to reply to our survey and provide us with their insightful opinions.
Conflicts of Interest
The authors declare no conflicts of interest.
Abbreviations
The following abbreviations are used in this manuscript:
| SEM | Structural Equation Modelling |
| CFA | Confirmatory Factor Analysis |
| RII | Relative Importance Index |
| RMSEA | Root mean square error of approximation |
| CFI | Comparative fit index |
| TLI | Tucker–Lewis index |
| PLS-SEM | Partial Least Squares Structural Equation Modelling |
| SEM ANN | SEM with artificial neural networks |
| FIS | Fuzzy inference systems |
| AVE | Average Variance Extracted |
| CR | Composite Reliability |
| SFL | Standardized factor loadings |
| IBM-AMOS | IBM Analysis of Moment Structures |
| IBM SPSS | IBM Statistical Package for the Social Sciences |
| RMR | Root mean squared residual |
| CRI | Construction risk index |
References
- Yap, J.B.H.; Tan, S.M. Investigating Rework: Insights from the Malaysian Construction Industry. ASM Sci. J. 2021, 14, 1–9. [Google Scholar] [CrossRef]
- Bajjou, M.S.; Chafi, A. Empirical study of schedule delay in Moroccan construction projects. Int. J. Constr. Manag. 2020, 20, 783–800. [Google Scholar] [CrossRef]
- Construction Industry Institute. The Field Rework Index: Early Warning for Field Rework and Cost Growth (RS153-1); Construction Industry Institute: Austin, TX, USA, 2001; Available online: https://www.construction-institute.org/the-field-rework-index-early-warning-for-field-rework-and-cost-growth (accessed on 15 January 2026).
- Gul, W.; Mahmood, M.T.; Naqvi, M.H.; Tahir, H. Agile Methodologies as Catalysts for Team Performance in Pakistan’s Large-Scale Construction Projects: Moderating Effects of Project Complexity, Communication Efficacy, and Delivery Time. Rev. J. Soc. Psychol. Soc. Work. 2025, 3, 1367–1383. Available online: https://socialworksreview.com/index.php/Journal/article/view/288 (accessed on 15 January 2026).
- Josephson, P.E.; Hammarlund, Y. The causes and costs of defects in construction: A study of seven building projects. Autom. Constr. 1999, 8, 681–687. [Google Scholar] [CrossRef]
- Weston, R.; Gore, P.A. A brief guide to structural equation modeling. Couns. Psychol. 2006, 34, 719–751. [Google Scholar] [CrossRef]
- Chan, A.P.C.; Chan, D.W.M.; Yeung, J.F.Y. Overview of the application of “Fuzzy Techniques” in construction management research. J. Constr. Eng. Manag. 2009, 135, 1241–1252. [Google Scholar] [CrossRef]
- Love, P.E.D.; Edwards, D.J.; Han, S.; Goh, Y.M. Design error reduction: Toward the effective utilization of building information modeling. Res. Eng. Des. 2011, 22, 173–187. [Google Scholar] [CrossRef]
- Xiong, B.; Skitmore, M.; Xia, B. A critical review of structural equation modeling applications in construction research. Autom. Constr. 2015, 49, 59–70. [Google Scholar] [CrossRef]
- Love, P.E.D.; Mandal, P.; Smith, J.; Li, H. Modelling the dynamics of design error induced rework in construction. Constr. Manag. Econ. 2000, 18, 567–574. [Google Scholar] [CrossRef]
- Ayalp, G.G.; Arslan, F. Modeling critical rework factors in the construction industry: Insights and solutions. Buildings 2025, 15, 606. [Google Scholar] [CrossRef]
- Hwang, B.G.; Zhao, X.; Goh, K.J. Investigating the client-related rework in building projects: The case of Singapore. Int. J. Proj. Manag. 2014, 32, 698–708. [Google Scholar] [CrossRef]
- Lopez, R.; Love, P.E.D.; Edwards, D.J.; Davis, P. Design error classification, causation, and prevention in construction engineering. J. Perform. Constr. Facil. 2010, 24, 399–408. [Google Scholar] [CrossRef]
- Wuni, I.Y.; Abankwa, D.A. Understanding the key risks in circular construction projects: From systematic review to conceptual framework. Constr. Innov. 2025, 25, 1085–1107. [Google Scholar] [CrossRef]
- Hassan, A.M.; Renuka, S.M.; Monika, T. Analysis of factors causing rework and their mitigation strategies in construction projects. Mater. Today Proc. 2023, in press. [Google Scholar] [CrossRef]
- Olanrewaju, A. Application of structural equation modelling (SEM) to evaluate reworks in sustainable buildings. Front. Eng. Built Environ. 2025, 5, 86–108. [Google Scholar] [CrossRef]
- Doloi, H. Cost overruns and failure in project management: Understanding the roles of key stakeholders in construction projects. J. Constr. Eng. Manag. 2013, 139, 267–279. [Google Scholar] [CrossRef]
- Zadeh, L. The concept of a linguistic variable and its application to approximate reasoning—I. Inf. Sci. 1975, 8, 199–249. [Google Scholar] [CrossRef]
- Ghosh, S.; Jintanapakanont, J. Identifying and assessing the critical risk factors in an underground rail project in Thailand: A factor analysis approach. Int. J. Proj. Manag. 2004, 22, 633–643. [Google Scholar] [CrossRef]
- Gadisa, B.; Zhou, H. Exploring influential factors leading to the poor performance of public construction project in Ethiopia using structural equation modelling. Eng. Constr. Archit. Manag. 2021, 28, 1683–1712. [Google Scholar] [CrossRef]
- Mohammed, M.; Shafiq, N.; Elmansoury, A.; Al-Mekhlafi, A.A.; Rached, E.F.; Zawawi, N.A.; Haruna, A.; Rafindadi, A.D.; Ibrahim, M.B. Modeling of 3R (Reduce, Reuse and Recycle) for sustainable construction waste reduction: A Partial Least squares Structural Equation Modeling (PLS-SEM). Sustainability 2021, 13, 10660. [Google Scholar] [CrossRef]
- Garg, S.; Misra, S. Causal model for rework in building construction for developing countries. J. Build. Eng. 2021, 43, 103180. [Google Scholar] [CrossRef]
- Hussain, S.; Fangwei, Z.; Siddiqi, A.F.; Ali, Z.; Shabbir, M.S. Structural equation model for evaluating factors affecting quality of social infrastructure projects. Sustainability 2018, 10, 1415. [Google Scholar] [CrossRef]
- Rahnamayiezekavat, P.; Sorooshnia, E.; Rashidi, M.; Faraji, A.; Mostafa, S.; Moon, S. Forensic analysis of the disputes typology of the NSW construction industry using PLS-SEM and prospective trend analysis. Buildings 2022, 12, 1571. [Google Scholar] [CrossRef]
- Hoyle, R.H. (Ed.) The Structural Equation Modeling Approach: Basic Concepts and Fundamental Issues. In Structural Equation Modeling: Concepts, Issues, and Applications; Sage Publications: Thousand Oaks, CA, USA, 1995. [Google Scholar]
- Jarkas, A.M.; Bitar, C.G. Factors affecting construction labor productivity in Kuwait. J. Constr. Eng. Manag. 2012, 138, 811–820. [Google Scholar] [CrossRef]
- Thomas, H.R. Benchmarking construction labor productivity. Pract. Period. Struct. Des. Constr. 2015, 20, 04014048. [Google Scholar] [CrossRef]
- Ajayi, S.O.; Oyedele, L.O. Critical design factors for minimising waste in construction projects: A structural equation modelling approach. Resour. Conserv. Recycl. 2018, 137, 302–313. [Google Scholar] [CrossRef]
- Elseufy, S.M.; Hussein, A.; Badawy, M. A hybrid SEM-ANN model for predicting overall rework impact on the performance of bridge construction projects. Structures 2022, 46, 713–724. [Google Scholar] [CrossRef]
- Rahman, I.A.; Ameri, A.E.S.A.; Memon, A.H.; Al-Emad, N.; Alhammadi, A.S.A.M. Structural relationship of causes and effects of construction changes: Case of UAE construction. Sustainability 2022, 14, 596. [Google Scholar] [CrossRef]
- Bajjou, M.S.; Chafi, A. Developing and validating a new conceptual model for successful implementation of lean construction: SEM analysis. Eng. Constr. Archit. Manag. 2025, 32, 1581–1620. [Google Scholar] [CrossRef]
- Cherkos, F.D.; Asfaw, F.A. Exploring the Interplay between Risk Management and Construction Risks: Implications for Project Performance through Structural Equation Modeling. J. Leg. Aff. Disput. Resolut. Eng. Constr. 2025, 17, 04525012. [Google Scholar] [CrossRef]
- Durdyev, S.; Ismail, S.; Kandymov, N. Structural equation model of the factors affecting construction labor productivity. J. Constr. Eng. Manag. 2018, 144, 04018007. [Google Scholar] [CrossRef]
- Yang, J.B.; Ou, S.F. Using structural equation modeling to analyze relationships among key causes of delay in construction. Can. J. Civ. Eng. 2008, 35, 321–332. [Google Scholar] [CrossRef]
- Dong, S.; Ahmed, M.; Chatpattananan, V. Analysis of Key Factors of Cost Overrun in Construction Projects Based on Structural Equation Modeling. Sustainability 2025, 17, 2119. [Google Scholar] [CrossRef]
- Gouda Mohamed, A.; Helmy Ammar, M.; Nabawy, M. Risks assessment using structural equation modeling: Mega housing projects construction in Egypt. Int. J. Constr. Manag. 2023, 23, 2717–2728. [Google Scholar] [CrossRef]
- Hair, J.F., Jr.; Anderson, R.E.; Tatham, R.L.; Black, W.C. Multivariate Data Analysis, 5th ed.; Prentice Hall: Hoboken, NJ, USA, 1998. [Google Scholar]
- Kline, R.B. Principles and Practice of Structural Equation Modeling, 4th ed.; Guilford Press: New York, NY, USA, 2016. [Google Scholar]
- Nunnally, J.C.; Bernstein, I.H. Psychometric Theory, 3rd ed.; McGraw-Hill: Columbus, OH, USA, 1994. [Google Scholar]
- Fornell, C.; Larcker, D.F. Evaluating structural equation models with unobservable variables and measurement error. J. Mark. Res. 1981, 18, 39–50. [Google Scholar] [CrossRef]
- Resnik, D.B. The Ethics of Research with Human Subjects; Springer: Berlin/Heidelberg, Germany, 2018. [Google Scholar] [CrossRef]
- Hu, L.T.; Bentler, P.M. Cutoff criteria for fit indexes in covariance structure analysis: Conventional criteria versus new alternatives. Struct. Equ. Model. Multidiscip. J. 1999, 6, 1–55. [Google Scholar] [CrossRef]
- Love, P.E.D.; Edwards, D.J.; Irani, Z. Moving beyond optimism bias and strategic misrepresentation: An explanation for social infrastructure project cost overruns. IEEE Trans. Eng. Manag. 2012, 59, 560–571. [Google Scholar] [CrossRef]
- Love, P.E.D.; Mandal, P.; Li, H. Determining the causal structure of rework influences in construction. Constr. Manag. Econ. 1999, 17, 505–517. [Google Scholar] [CrossRef]
- Love, P.E.D.; Li, H. Quantifying the causes and costs of rework in construction. Constr. Manag. Econ. 2000, 18, 479–490. [Google Scholar] [CrossRef]
| Disclaimer/Publisher’s Note: The statements, opinions and data contained in all publications are solely those of the individual author(s) and contributor(s) and not of MDPI and/or the editor(s). MDPI and/or the editor(s) disclaim responsibility for any injury to people or property resulting from any ideas, methods, instructions or products referred to in the content. |