Article

Damage Evolution and Acoustic Emission Characteristics of Continuously Graded Cemented Gangue Filling Bodies

1
School of Civil Engineering, Zhengzhou University of Technology, Zhengzhou 450044, China
2
School of Civil Engineering, Henan Polytechnic University, Jiaozuo 454003, China
*
Authors to whom correspondence should be addressed.
Buildings 2026, 16(8), 1572; https://doi.org/10.3390/buildings16081572
Submission received: 17 March 2026 / Revised: 8 April 2026 / Accepted: 14 April 2026 / Published: 16 April 2026

Abstract

The particle size of aggregate is a key factor affecting the mechanical properties and deformation capacity of cemented gangue filling body. In this study, coal gangue with a particle size range of (0.05, 20) mm was sieved into six groups of aggregate particles. Based on the Talbot gradation theory, cubic specimens with gradation indices n = 0.3, 0.4, 0.5, 0.6, and 0.7 were prepared for acoustic emission (AE) monitoring tests. The microstructure of the filling body was analyzed, and the failure characteristics and damage evolution laws of the cemented gangue filling body with different gradation indices were explored. The results show that the compressive strength reaches its maximum when n = 0.5. As the gradation index increases, the compressive strength of the specimens first increases and then decreases, and the specimens shift from primarily experiencing cleavage failure to shear failure. The curve of cumulative AE ringing count shows a bimodal distribution pattern, with both surge points and fracture points coexisting. The surge points can be regarded as precursor signals of backfill failure. The spatiotemporal evolution of AE events exhibits complex phased changes. An excessively small gradation index tends to form micropores and striped microcracks, reducing the compactness of the microstructure. An excessively large gradation index can lead to the formation of penetrative weak channels. A reasonable gradation index enables the mutual interlocking of aggregate particles, constructing a stable three-dimensional spatial skeleton structure. The dynamic trend of damage in the filling body can be captured based on AE analysis, and reverse guidance can be provided for parameter optimization of Talbot gradation, achieving a dynamic closed loop of “gradation design-AE monitoring-damage assessment-parameter optimization”. This not only enriches the application scenarios of acoustic emission analysis in graded materials, but also provides a new research approach and technical method for gradation design and safety assessment in scenarios where particle sizes are missing in practical engineering.

1. Introduction

Coal boasts advantages such as abundant reserves, stable supply, and controllable costs [1]. Whether in energy supply for large-scale infrastructure construction or energy security during industrial system transformation and upgrading, coal plays an irreplaceable role, laying a solid energy foundation for the steady advancement of rapid global industrialization [2]. Traditional coal mining methods create goaf areas that are highly prone to regional geological hazards like surface subsidence and landslides, causing irreversible damage to surface vegetation, farmland, and groundwater systems [3,4]. Furthermore, with the increasing depletion of shallow coal resources, deep mining has become an inevitable trend in the coal industry, leading to safety risks such as intense mine pressure, and instability and deformation of surrounding rock, which seriously threaten miners’ lives and production efficiency [5]. For deep mining, the fillingmining method can mitigate the surrounding rock deformation caused by high deep stress, extend the mining depth of mines, and form stable artificial pillars. These pillars work in synergy with surrounding rock to reduce the occurrence probability of disasters like rock burst, providing a safe and reliable working environment for deep mining [6,7,8].
As a major producer and consumer of coal, China has accumulated over 6 billion tons of coal gangue in coal mining and washing processes, with an annual increase of approximately 300 million tons [9,10]. This gangue not only occupies nearly 1.2 × 10⁸ m2 of land resources, but also causes persistent ecological damage through groundwater contamination via leaching, atmospheric pollution from dust, and toxic gas emissions from spontaneous combustion [11,12]. Utilizing gangue as a backfill material can both address the issue of solid waste storage and reduce land occupation and environmental pollution while achieving resource recycling. The cemented gangue filling technology transforms coal gangue into a stable underground backfill material through scientific formulation, enabling large-scale industrial solid waste disposal. According to statistics, a backfill system with an annual capacity of 1 million tons can dispose of 800,000 to 900,000 tons of coal gangue annually, equivalent to reducing land occupation by approximately 1.33 × 10⁵ m2 while lowering gangue treatment costs by over 1 million dollars. This “waste-to-waste” resource utilization approach not only resolves ecological challenges posed by solid waste storage, but also replaces traditional backfill materials like sand and gravel, alleviating the conflict between resource extraction and supply. It provides a crucial practical model for the circular economy [13].
To date, scholars have conducted intensive research on the recycling and utilization of coal gangue: Feng et al. [14] prepared filling materials using coal gangue as the raw material and employed response surface analysis to determine the optimal proportion of coal gangue; Zhao et al. [15] investigated the failure characteristics of cemented backfill with different sand-to-slurry ratios under uniaxial compression conditions; Ran et al. [16] analyzed the peak strength and composite failure modes of gangue cemented backfill under varying loading rates; Guo et al. [17] prepared five types of gangue cemented backfill specimens with different dimensions for uniaxial compression tests and used scanning electron microscopy to analyze their micro-morphology. Scholars have primarily studied the influence of specimen size, sand-to-slurry ratios, and loading rates, without considering particle size as a major influencing factor. Research on the mechanical properties and energy evolution characteristics of cemented gangue filling bodies (CGFB) during changes in particle size is limited. Particle size can significantly influence the meso-mechanical properties of CGFB by altering the mass of the interfacial transition zone and stress transmission efficiency with appropriate gradation markedly improving the mechanical performance of the backfill. Based on this, this study prepared CGFB specimens using on-site crushed coal gangue as the aggregate, determined the particle size composition of continuous gradation for coal gangue based on the Talbot gradation theory, and conducted acoustic emission monitoring tests under uniaxial compression for continuously graded CGFB. The mechanical properties and acoustic emission characteristic parameters of backfill with different gradations were analyzed to establish a correlation system between gradation design and damage response to provide a new technical path for the preparation and design of engineering materials.

2. Particle Gradation Analysis and Design

2.1. Physical and Chemical Properties of Raw Materials

The coal gangue used in this experiment was taken from the waste disposal site of Daliuta Coal Mine in Ordos City, Inner Mongolia Autonomous Region. The appearance of coal gangue is gray andblack, with a small amount of irregular pores in some areas and no obvious agglomeration phenomenon. The particle shape distribution is relatively uniform, and its apparent density is measured to be 2.38 g·cm−3, with a bulk density of 1.18 g·cm−3. The chemical composition of the raw materials was determined using an FX-480 (Suzhou Yingfeisi Scientific Instrument Co., Ltd., Suzhou, China) X-ray fluorescence spectrometer (XRF), and the results are shown in Table 1. According to the data in Table 1, the chemical composition of coal gangue does not contain harmful elements. The mass fraction of SiO2 and Al2O3 is greater than 75%, and the content of Fe2O3 and CaO is relatively low, which indicates that is belongs to clay solid waste. This chemical composition endows it with good inertness and stability, enabling it to undergo a synergistic reaction with cementitious materials to enhance the cementitious activity and structural strength of solid waste. It is highly suitable for the preparation of backfill aggregate, achieving the resource utilization of coal gangue solid waste while meeting the core requirements of backfill aggregate for strength and stability.
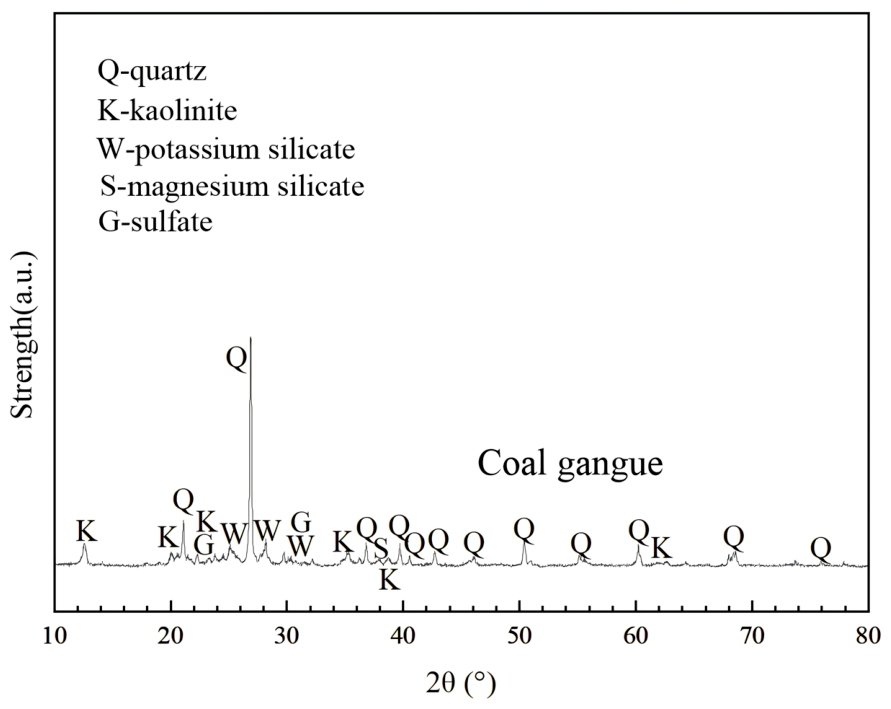
The mineral composition of coal gangue was analyzed using the Shimadzu XRD-7000 (Shimadzu International Trade (Shanghai) Co., Ltd., Shanghai, China) X-ray analyzer (XRD), as shown in Figure 1. From the X-ray diffraction pattern of coal gangue shown in Figure 1, it can be seen that the mineral composition of coal gangue is mainly quartz. The characteristic diffraction peaks corresponding to quartz in the diffraction pattern exhibit high intensity, sharp peak shape, and extremely narrow peak width, indicating a high content of quartz in coal gangue and good crystallinity. Secondly, kaolinite is the secondary mineral component of coal gangue, with its characteristic diffraction peak intensity being the second highest. In addition, a small number of weak characteristic diffraction peaks appeared in the spectrum, corresponding to a small amount of potassium silicate, magnesium silicate, and sulfate minerals. These minerals have a low content and have little impact on the overall mineral characteristics of coal gangue. Quartz has strong weather resistance and good wear resistance. Using it as the main mineral component of the filling material aggregate is beneficial for improving the overall mechanical strength and stability of the filling material.

2.2. Talbol Grading Analysis

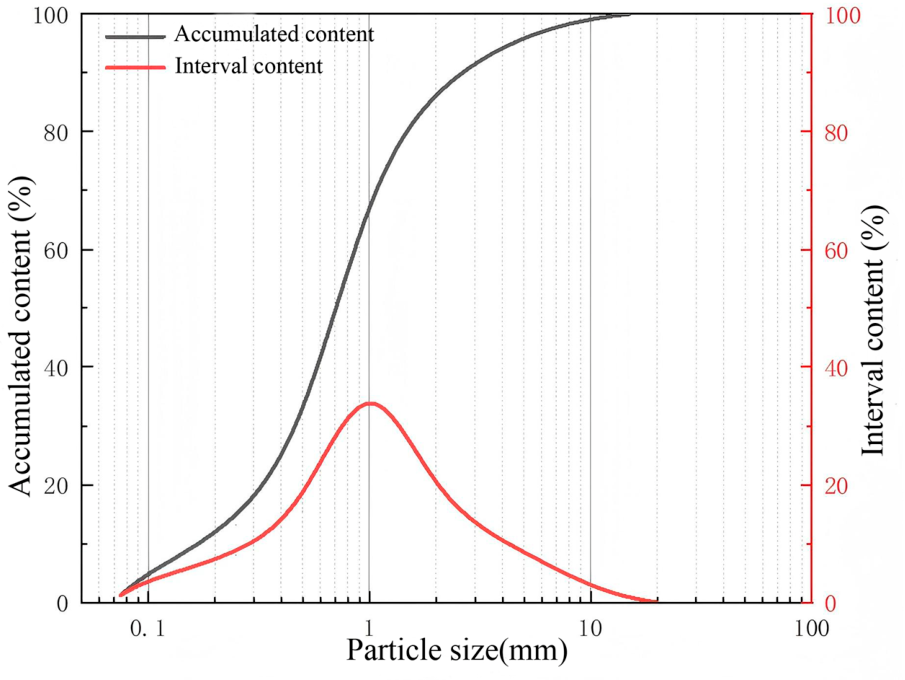
In order to meet the design requirements of particle size distribution for filling aggregates, a jaw crusher was used for coarse crushing of coal gangue. During the crushing process, the feeding speed and discharge gap were strictly controlled to ensure that the particle shape of coal gangue was uniform after crushing, without excessive crushing or oversized particles. After coarse crushing, the particle size of coal gangue was measured using a BT-9300H laser particle size analyzer (Dandong Baite Instrument Co., Ltd., Dandong, China), and the particle size of the aggregate was approximately normally distributed, with a particle size range of [0.05, 20) mm. The particle size distribution curve was smooth and continuous, without obvious abnormal peaks, indicating that the particle size distribution of the aggregate was reasonable. The distribution curve is shown in Figure 2.
In the preparation process of the filling system, the rationality of particle size distribution directly affects the density of the internal structure of the material. By adopting an appropriate particle ratio, coal gangue particles of different sizes can be filled and tightly interlocked, effectively reducing the number and size of pores inside the filling body, reducing the porosity inside the material, and significantly improving the compactness of the filling body, enhancing its mechanical strength and overall stability. Therefore, in order to achieve precise control of the particle size distribution of coal gangue aggregates and ensure the scientific and rational design of the ratio, this experiment quantitatively calculated and optimized the proportion relationship of particles with different sizes based on Talbot gradation theory through a power function formula. The expression for Talbot grading theory particle sieve residue rate is:
R i = ( d i D m a x ) n × 100
In the formula, Ri is the cumulative sieve residue rate (%) of particle size di, which is the percentage of the remaining particles after sieving through a sieve with size di, Dmax is the maximum particle size of the graded particles (mm), and n is the grading index. According to the Equation (1), the calculation formula for the mass fraction Mi of particle size within the range of [di, di+1] is:
M i = ( d i + 1 D m a x ) n ( d i D m a x ) n
The interval for calculating the Talbot gradation is the complete range of particle sizes, whereas the particle size range of the coal gangue raw material used in this experiment is 0.05~20 mm, with a natural absence of particles in the 0~0.05 mm range. If the Talbot gradation theory is directly applied for calculation, discrepancies in the particle size range will lead to deviations in the calculation results, making it impossible to design a reasonable backfill proportion. Therefore, the following improvements were made when calculating the Talbot gradation proportion: First, the ideal full gradation particle size content was calculated based on the Talbot formula. Then, after eliminating the missing fine particle portion, the content of each grade was redistributed, and the remaining particle size proportion was normalized and corrected to ensure that the total proportion of coal gangue was 100%. This approach retains the Talbot power function distribution characteristics while strictly eliminating missing particle sizes, resulting in a continuous gradation curve without breakpoints. The normalization correction calculation formula is as follows:
Δ M i = ( M 1 1 M 1 ) × M i
M i = Δ M i + M i
In the formula, M1 represents the mass fraction within the particle size range of 0~0.05 mm, Mi represents the mass fraction of the i-th particle size range, ΔMi represents the normalized correction parameter, and Mi represents the mass fraction after normalization correction.
The fine particles of the filling material can effectively fill the residual pores between coarse particles, reduce porosity, and enhance overall stability. Their absence will lead to a decrease in packing density, ineffective closure of inter-particle voids, and a significant increase in porosity. Therefore, this study constructed a modified Talbot gradation curve based on the existing particle size range and compensated for the loss of compactness and strength caused by the absence of fine particles through the addition of micro-powder, ensuring that the gradation still meets the self-similar filling characteristics.

2.3. Continuous Gradation Design

The minimum particle size of coal gangue aggregate was 0.05 mm, and the maximum particle size was 20 mm. To fully leverage the gradation advantage of coal gangue aggregate, the coal gangue samples were sieved through a vibrating screen to obtain small-sized particles in the ranges of [0.05, 1.18) mm, [1.18, 2.36) mm, and [2.36, 5) mm, as well as large-sized particles in the ranges of [5, 10) mm, [10, 15) mm, and [15, 20) mm, for a total of six particle size ranges. The large-sized particles formed the skeleton, while the small-sized particles gradually filled the voids, resulting in a gradation design with a coarse skeleton and fine filling.
As a key regulatory parameter for particle gradation, the value of the Talbot gradation index n directly determines the uniformity and proportion of coarse and fine particles in the aggregate, significantly affecting the internal structure and mechanical properties of the filling body. In this study, fine particles ranging from 0 to 0.05 mm have been removed, resulting in a gradation with certain discontinuities. If n < 0.3, the particle size distribution is too uniform, leading to an insufficient proportion of medium and coarse particles. This weakens the skeleton structure formed by coarse particles, making it difficult to provide adequate structural support. During the mixing and molding processes, phenomena such as bleeding and segregation are prone to occur, which is not conducive to improving the performance of the filling body. If n > 0.7, the distribution of medium and coarse particles is too concentrated, making it difficult to form an effective interlocking structure. This can easily lead to the formation of connected voids within the material, resulting in particle agglomeration, decreased fluidity, low compactness, and poor stability. Based on comprehensive theoretical analysis and existing research results, it is evident that when the gradation index n is within the range of [0.3, 0.7], the aggregate particle gradation exhibits good continuity, and the proportion of coarse and fine particles is relatively coordinated. This allows for a balance between skeleton support and void filling effects, enabling the adjustment of the n value to balance packing compactness and fluidity.
To further determine the optimal grading scheme applicable to the coal gangue aggregates in this experiment, this study conducted comparative analysis using five typical grading indices, namely n = 0.3, 0.4, 0.5, 0.6, and 0.7. Based on the Talbot grading calculation method shown in Equations (2)–(4), the particle mass ratios for six particle size ranges under different grading indices were solved. The calculation results for each particle size range are presented in Table 2.

3. Experimental Methods

3.1. Specimen Preparation

Based on the gradation scheme determined by the Talbot gradation theory, the proportion of coal gangue aggregate was calculated according to different gradation indices n, and samples of continuously graded CGFB were prepared respectively.
To promote the cementation and molding of the filling material and enhance its mechanical properties, cement was selected as the binding agent, and an appropriate amount of fly ash and silica fume were added as modifying admixtures. According to the Chinese standard GB175-2023, the cement was P·O 42.5 ordinary Portland cement, and its chemical composition is shown in Table 1. The fly ash is of Class F, Grade I, used to fill the pores of the powder and enhance the packing density, complying with the Chinese standard GB/T 1596-2017, and its chemical composition is also shown in Table 1. Referring to the Chinese standard GB/T 27690-2011, silica fume has an extremely high specific surface area and cementitious activity, which can fill the tiny pores of the cement hydration products, strengthen the cementation effect, and significantly enhance the packing density and mechanical strength of the residue. It is a key compensating material for making up for the lack of fine particles ranging from 0 to 0.05 mm. The CGFB was prepared by mixing coal gangue, cement, fly ash, and silica fume in proportion by mass, and the mixing ratio of the filling material is shown in Table 3.
When fabricating the specimens with different gradation indices, only the mass of coal gangue with different particle sizes was changed, while the mass of other filling materials remained consistent. The purpose was to eliminate the interference of other factors on the test results and ensure the scientific comparison of CGFB performance under different gradations. Through preliminary experimental exploration, a water–cement ratio of 0.28 was found to ensure both the full hydration of the cementitious material, forming sufficient bonding strength to support the performance requirements of the filling body, and avoiding excessive water leading to bleeding of the filling body, or insufficient water leading to inadequate hydration and insufficient fluidity. Therefore, by measuring the mass of the water and cementitious material, the water–cement ratio for each set of experiments was ensured to be 0.28 ± 0.02, increasing the reliability of the experimental data.
Different graded coal gangues were weighed and mixed with other raw materials, then a JJ-20 cement mortar mixer was used for mixing. The materials were mixed at a low speed for 30 s. Water was added to the mixing bowl in two stages: first 70% of the water was added, then the remaining water and 1% of the powder content of water reducer were added. The mixing speed was slow to ensure that the water and water reducer were evenly mixed with the materials. Then, the mixing speed was accelerated until the mixture reached a colloidal state. After the mixing was complete, the slurry was poured into a 100 mm × 100 mm × 300 mm triple test mold for molding, and vibrated for more than 3 min. The surface of the test mold was covered with plastic wrap; after 24 h the mold was removed, and then it was placed in a constant temperature curing box for 28 days of curing, maintaining a relative humidity of over 95% and a temperature of 20 ± 2 °C. Three test specimens for each index were prepared to conduct uniaxial compression–acoustic emission monitoring tests after curing was complete.

3.2. Testing Procedures

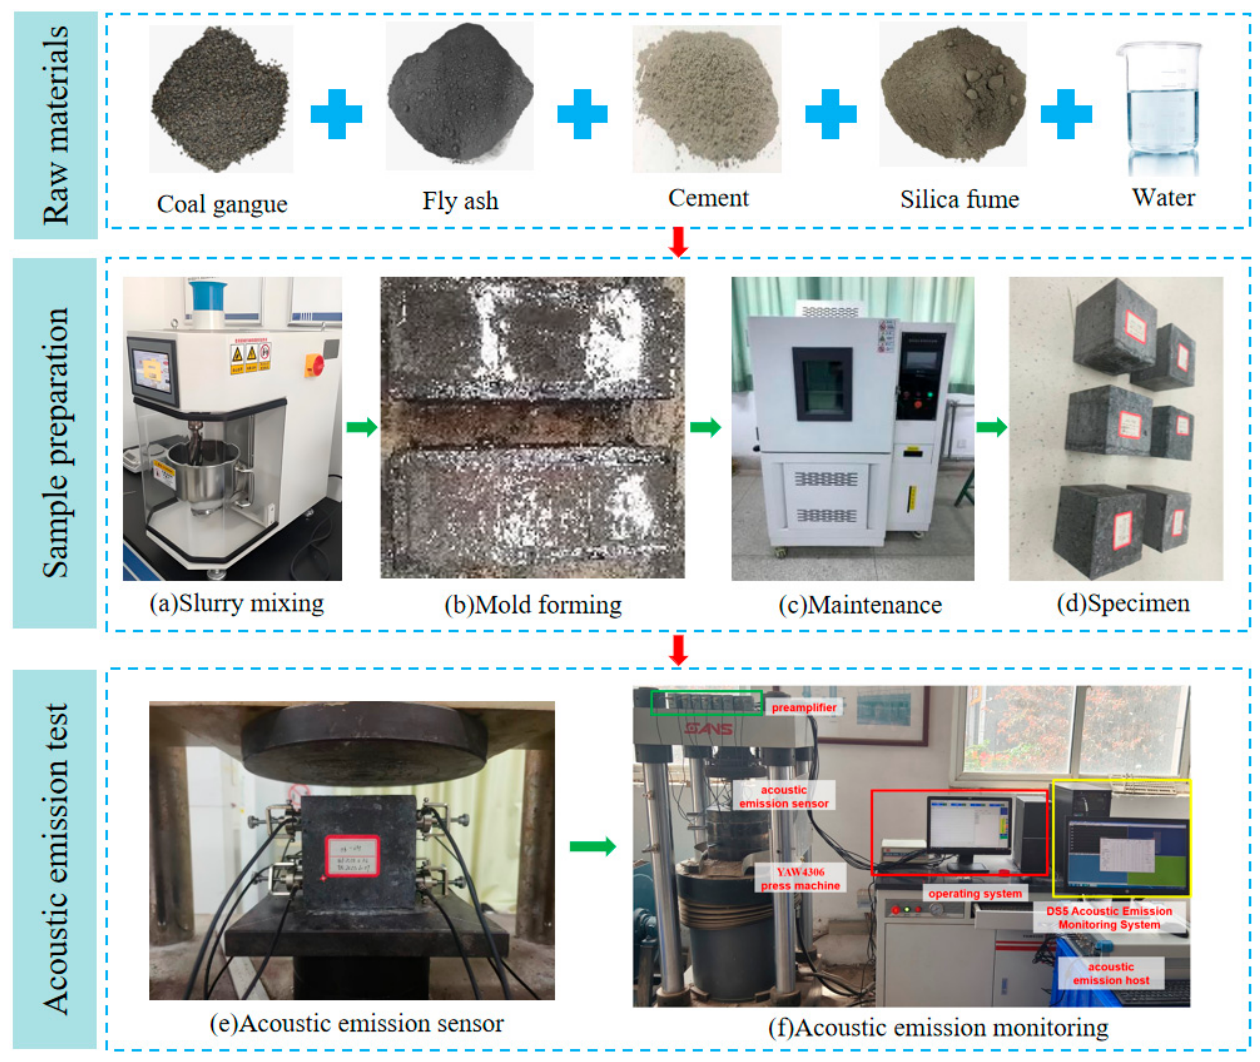
In this experiment, a YAW4306 hydraulic servo press was employed for uniaxial compression loading testing. Simultaneously, a DS5 full-information acoustic emission (AE) signal analyzer was used to conduct real-time monitoring of the damage and cracking signals during the compression process of the test specimens, thereby establishing a mechanical–AE monitoring system. The AE sensor adopted an 8-channel configuration, with the southwest point as the origin. The x-axis was positive from west to east along the horizontal direction, the y-axis was positive from south to north along the horizontal direction, and the z-axis was positive vertically upward. The coordinates of the AE sensor were (0, 20, 20), (0, 20, 80), (0, 80, 80), (0, 80, 20), (100, 20, 20), (100, 20, 80), (100, 80, 80), and (100, 80, 20). To enhance the coupling effect of the contact surface and eliminate the end effects, an appropriate amount of Vaseline was applied to the connecting surface between the metal housing and the AE sensor. After securing the sensor, hot melt adhesive was used to connect the test specimen to the housing. During the uniaxial compression test, the elastic wave signals triggered by the initiation, propagation, and coalescence of microcracks within the test specimen were captured by the AE sensor. These signals were amplified by a preamplifier and transmitted to the AE host computer, which analyzed the signals and displayed the results on the data processing software interface. The sampling frequency was set to the default value of 3 MHz, the AE threshold was set to 40 dB, and the signal amplifier was adjusted to 40 dB. This way, we could effectively avoid interference from environmental noise while fully capturing the AE signals generated during different damage stages such as pore compression, particle slippage, and skeleton fracture within the filling body, ensuring the effectiveness and accuracy of the signals. The loading rate of the pressure machine was 1.2 KN/s, ensuring real-time tracking of the changes in AE signals throughout the entire process of the filling body from elastic deformation, plastic deformation to failure, accurately reflecting the damage evolution law of the filling body under different gradations. The AE monitoring software (DS5-8A/B series acoustic emission signal analysis software) was simultaneously activated during the operation of the loading system for data collection. The experimental process is illustrated in Figure 3.

4. Results and Discussion

4.1. Compressive Strength

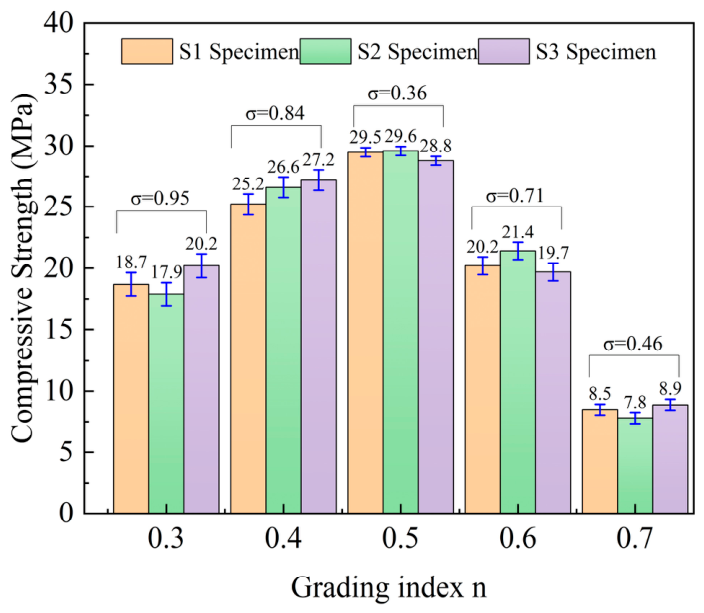
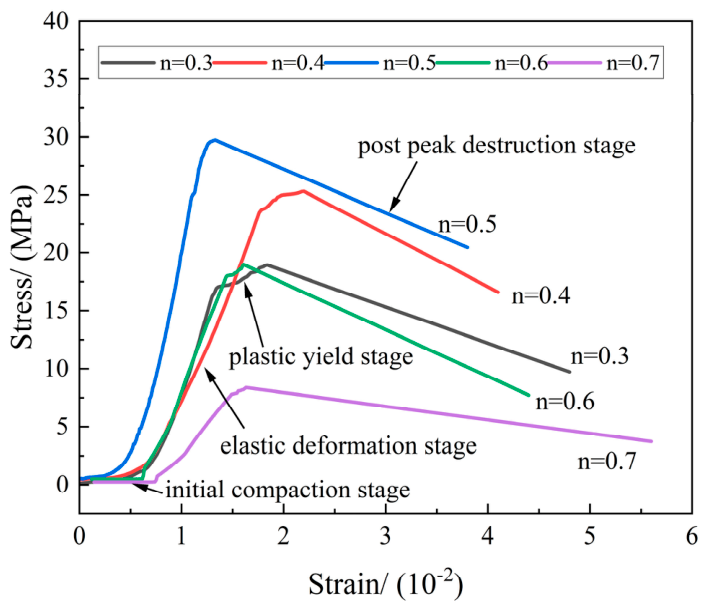
As one of the core influencing factors on the microstructure and macroscopic mechanical properties of CGFB, the gradation characteristics of aggregate size significantly alter the packing state of particles, interfacial bonding effects, and stress transfer paths within the backfills, thereby exerting a decisive influence on the overall strength of the backfills. Therefore, this experiment selected compressive strength as the core indicator for evaluating the mechanical properties of CGFB [18,19,20,21]. According to the gradation design method outlined in Table 3, five gradation indices were employed, with three specimens for each gradation index. Uniaxial compression tests were conducted on these five groups of specimens, and the variation pattern of the compressive strength of CGFB specimens when n ranges from 0.3 to 0.7 is shown in Figure 4. From Figure 4, it is evident that the compressive strength of CGFB specimens exhibits a trend of initial increase followed by decrease as the gradation index n increases. When n = 0.3, the compressive strength ranges from 17.9 to 20.2 MPa, with an average strength of 18.9 MPa; when n = 0.4, the compressive strength ranges from 25.2 to 27.2 MPa, with an average strength of 26.3 MPa; when n = 0.5, the compressive strength ranges from 28.8 to 29.6 MPa, with an average strength of 29.3 MPa; when n = 0.6, the compressive strength ranges from 19.7 to 21.4 MPa, with an average strength of 20.4 MPa; and when n = 0.7, the compressive strength ranges from 7.8 to 8.9 MPa, with an average strength of 8.4 MPa. The compressive strength is highest when n = 0.5, the compressive strengths for other gradation indices are reduced by 35.9%, 10.8%, 30.8%, and 71.5%, respectively. According to the research conclusion of Andreasen–Andersen continuous dense gradation theory, the ideal dense gradation index n ≈ 0.40–0.55 is the optimal range for complementary filling of coarse and fine particles. Fine particles can fully fill the gaps between coarse particle skeletons, achieving the smallest pores and the densest packing. The optimal value of n = 0.5 in this study falls precisely at the center of the theoretically optimal dense pile interval given by the Andreasen-Andersen model, which is consistent with the classical dense pile theory.
There are significant differences in the standard deviation of compressive strength corresponding to different gradation indices. When n = 0.3, the standard deviation is 0.95, indicating an insufficient proportion of medium and coarse particles, loose microstructure, and a tendency for damage to concentrate and erupt locally, resulting in violent fluctuations in AE energy release and the highest standard deviation. When n = 0.4, the standard deviation decreases to 0.84, indicating that as the gradation index increases, the particle size distribution becomes more reasonable, and the fluctuations in energy release are alleviated, but it still at a relatively high level. When n = 0.5, the standard deviation is 0.36, indicating that under this gradation, damage concentration is the weakest, particle gradation is the most reasonable, and the microstructure is the densest. Damage evolves gradually from elastic deformation to fracture failure, and the standard deviation reaches its minimum value. When n = 0.6 and n = 0.7, the standard deviation increases to 0.71 and 0.46, respectively, indicating that as the gradation index further increases, the proportion of large-sized particles increases, and damage tends to concentrate around large pores, with some fluctuations in energy release.

4.2. Characteristics of Stress–Strain Curve

The typical stress–strain curves of CGFB specimens with different gradation indices during loading were compared, and the results are shown in Figure 5. From Figure 5, it can be observed that the curve trends of specimens with different gradation indices during uniaxial compression are similar, which can be divided into the initial compaction stage, elastic deformation stage, plastic yield stage, and post-peak failure stage [22,23,24,25]. The distribution characteristics of each stage are as follows:
(1)
Initial compaction stage: The primary pores formed during the pouring of CGFB are compressed and densified after being subjected to pressure. The curve characteristic of this stage is a nonlinear upward concave curve, where only a minimal amount of stress is applied to produce a significant strain. When n = 0.7, due to an excessive number of large-sized particles, there are a large number of primary pores inside the backfill specimen, resulting in the maximum strain; when n = 0.5, particles of different sizes are evenly distributed, and the internal primary pores are extremely small in shape, thus resulting in the minimum strain.
(2)
Elastic deformation stage: In this stage, the curves for different gradation indices exhibit a linear growth relationship, with elastic strain energy continuously stored within the specimen. The five straight line segments are approximately parallel, with an elastic modulus ranging from 0.5 to 1.9 GPa. When n = 0.7, the yield strength is the smallest, and the duration of the elastic deformation stage is the shortest. When n = 0.6, the yield strength is the second smallest, and the duration is the second shortest. When n = 0.5, the yield strength is the largest, and the duration is the longest.
(3)
Plastic yield stage: The stress growth in CGFB essentially stagnates, while the strain begins to continuously increase, and microcracks gradually form into through fractures. When n = 0.7, the yield point is reached first, and the specimen can still continue to bear load during the yield stage. When n = 0.5, the yield point is reached last, and the deformation during the yield stage is minimal, indicating that the expansion of microcracks within the specimen is relatively small.
(4)
Post-peak failure stage: After reaching the peak stress, the specimen deforms rapidly as the loading progresses. Microcracks coalesce over a large area, forming a continuous fracture surface, which ultimately leads to failure and overall slippage of the fracture surface. The bearing capacity of the filling body experiences a sharp decline, with a decrease of up to 40% to 60% of the peak stress.
Figure 5. Stress–strain curve diagram.
Buildings 16 01572 g005
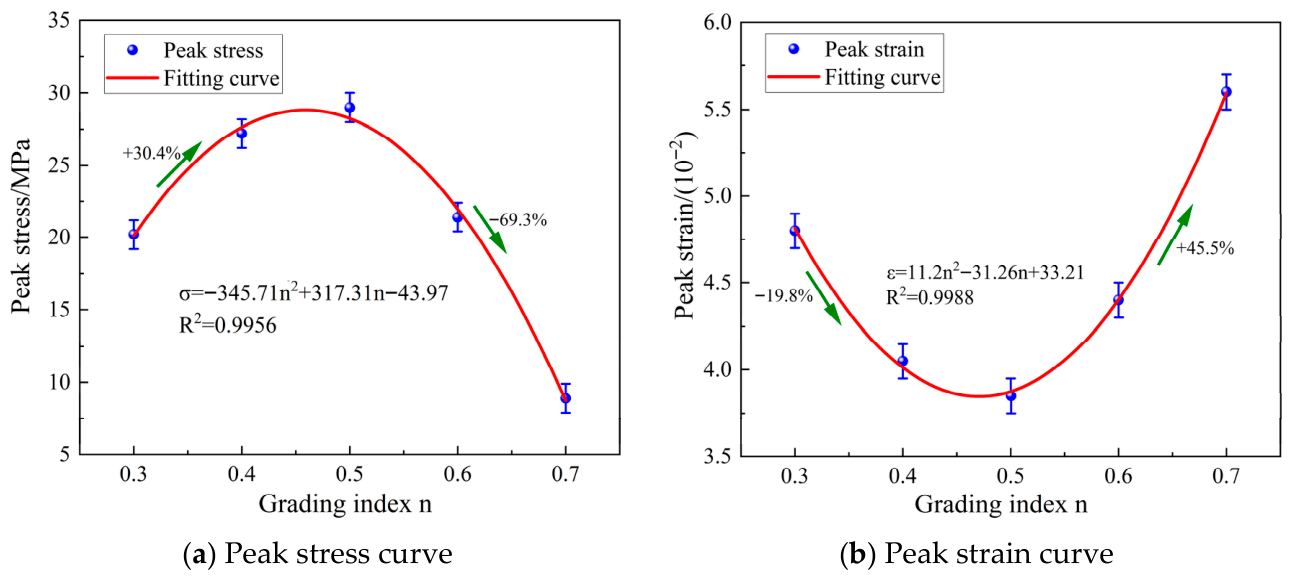
Further analysis of the stress–strain curves for different gradation indices reveals that when the gradation indices were 0.3, 0.4, 0.5, 0.6, and 0.7, the peak stresses of the specimens were 20.2 MPa, 27.2 MPa, 29.6 MPa, 21.4 MPa, and 8.9 MPa, respectively, with peak strains of 0.048, 0.041, 0.038, 0.044, and 0.056. The peak stress first increased and then decreased, while the peak strain first decreased and then increased. Regression analysis of the trends in both parameters was conducted [26,27,28], and the function expression of the regression model was determined based on nonlinear fitting as follows:
y = A x 2 + B x + C
By fitting the peak stress and peak strain data according to Equation (5), the calculation formulas for both are obtained as follows:
σ = 345.71 n 2 + 317.31 n 43.97
ε = 11.2 n 2 31.26 n + 33.21
In Equations (6) and (7), σ represents peak stress, ε represents peak strain, and the gradation index and correlation coefficient R2 are 0.9956 and 0.9988, respectively. Based on the theory of continuum damage mechanics and combined with the peak mechanical characteristics of CGFB, a two-dimensional damage variable D is defined to quantify the degree of damage of the filling body under load. The definition formula is as follows:
D = 1 σ σ 0
In the formula: σ is the residual compressive strength at any loading stage (MPa); σ0 is the peak stress when n = 0.5 (MPa). The range of values for the damage variable is 0 ≤ D ≤ 1. When D = 0, the specimen is undamaged; When D = 1, the specimen is completely destroyed, and this definition can accurately quantify the degree of damage to the filling material under different loading stages and gradations.
The variation curves of peak stress and peak strain for different gradation indices are shown in Figure 6. As can be seen from Figure 6, within the gradation index range of this experiment (n = 0.3~0.7), the peak stress exhibits an empirical trend of slowly increasing with the increase in gradation index, reaching its maximum at n = 0.5, and then rapidly decreasing after exceeding 0.5 (Figure 6a); the peak strain shows a characteristic of being slow in the early stage and fast in the later stage within this testing range (Figure 6b) [29,30]. Based on the analysis of material properties under the conditions of this experiment, it can be concluded that the CGFB belongs to an artificially prepared heterogeneous composite material, which is prone to forming a large number of initial defects such as primary pores and microcracks during the mixing, molding, and other manufacturing processes; under the same cross-sectional size, the increase in gradation index within the testing range will correspondingly increase the proportion of large-sized particles in the coarse aggregate, thereby significantly increasing the probability of generating macroscopic and mesoscopic defects inside the backfill. These internal defects are prone to become stress concentration areas under load, inducing local damage and progressive failure, ultimately leading to an increased attenuation rate of peak stress after n > 0.5. Therefore, the variation trends of peak stress and peak strain indicate that n = 0.5 is the optimal gradation index within this testing range, at which the mechanical properties of the backfill are optimal.

4.3. Failure Characteristics

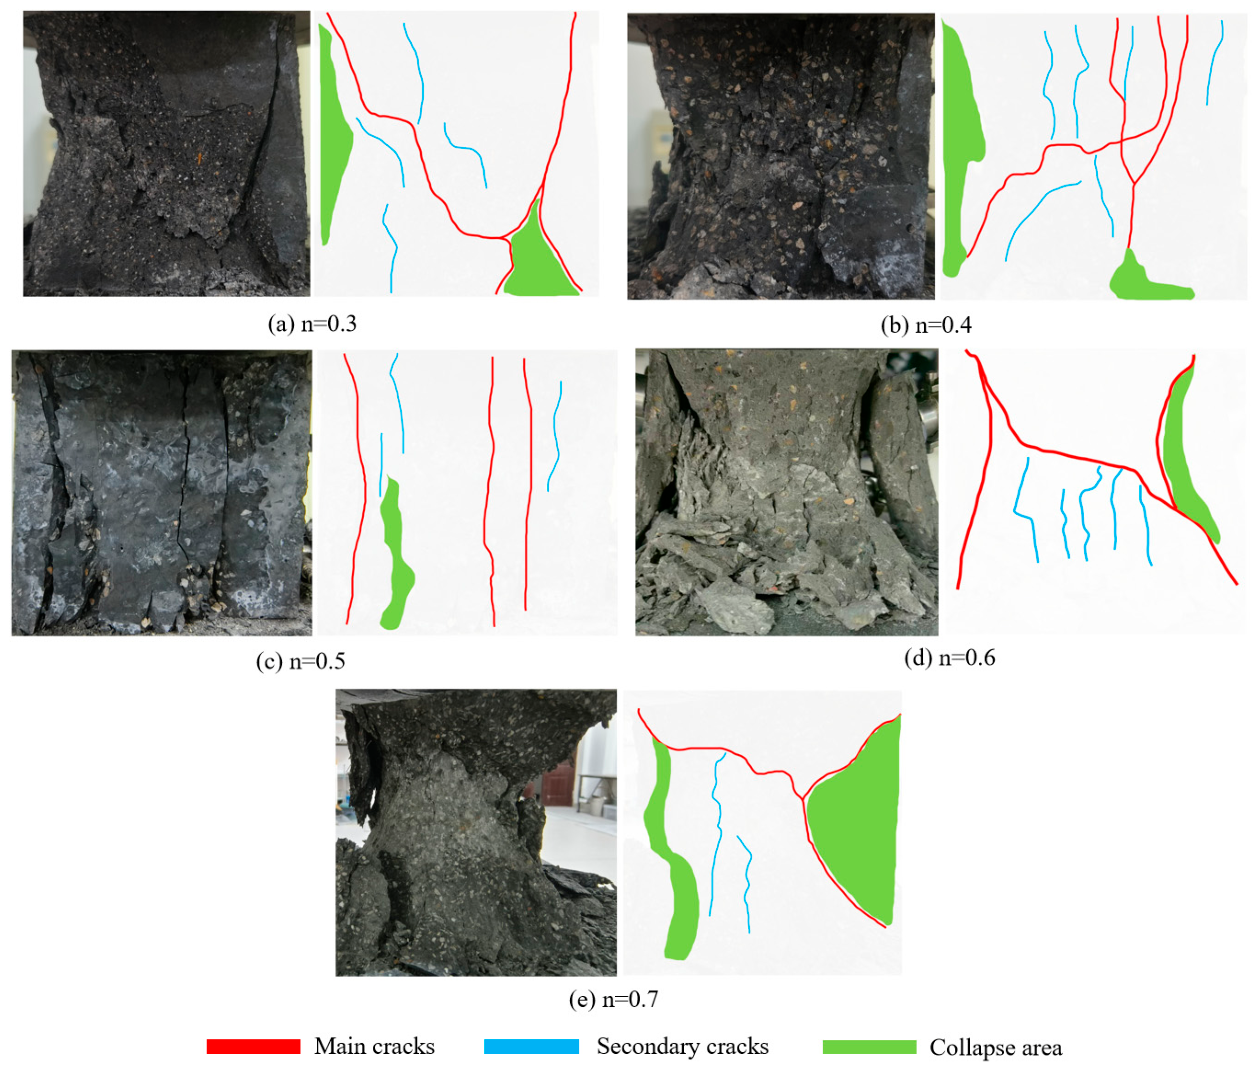
There are significant differences in the failure modes and evolution mechanisms of CGFB with different aggregate sizes during uniaxial compression. The typical failure characteristics of each group of specimens are shown in Figure 7. As can be seen from Figure 7, when n = 0.3 and 0.4, the specimen failure is relatively mild, with only small-scale aggregate spalling occurring on the sides and bottom of the specimen. The failure surface simultaneously develops vertical through-cracks parallel to the loading direction, as well as X-shaped conjugate shear cracks at an angle of about 45° to the specimen bottom surface, accompanied by a certain amount of secondary cracks, which are primarily composed of dispersed microcracks with an angle of 30~45°. The overall performance is a mixed failure mode characterized by the combined effects of cleavage failure and shear failure. When n = 0.5, the specimen failure surface mainly consists of three to four vertical through-cracks, accompanied by local secondary cracks and small-area fragmented regions. The cracks extend axially, without the formation of significant large-scale shear zones. The failure mode is dominated by axial cleavage failure. When n = 0.6 and 0.7, the specimen failure characteristics are more severe, with two main cracks, multiple secondary cracks, and a large-area collapse and spalling region on the failure surface. Several distinct X-shaped shear fracture surfaces are observed within the collapse zone, exhibiting overall failure characteristics centered around shear failure.
From the perspective of failure mechanism, when the internal structure of the filling body is relatively dense and the interface between the aggregate and the cementitious material is well bonded, the overall integrity of the specimen is high. Under axial loading, the transverse tensile stress can be fully accumulated and transmitted, ultimately forming a penetrating splitting crack along the direction of the principal stress, exhibiting a splitting failure controlled by tensile stress. However, as the gradation of aggregate particles changes, the internal primary micropores and weak interfaces of the specimen increase accordingly, the uniformity of the internal structure decreases, and before the transverse tensile stress is fully developed and diffused, stress concentration and a penetrating fracture surface are first formed inside the specimen, thereby promoting the transition of the failure mode from splitting failure to shear failure [31,32]. It can be seen that the particle size of aggregate regulates the crack propagation path and ultimate failure mode under compression by changing the internal compactness and pore structure of the filling body.

4.4. Acoustic Emission Ringing Count

During the loading process of CGFB, the internal structure undergoes deformation and fracture due to continuous compression and friction, releasing strain energy in the form of elastic waves. By using acoustic emission monitoring to collect elastic wave signals through sensors, the process of internal damage evolution in concrete can be described [33,34,35,36].
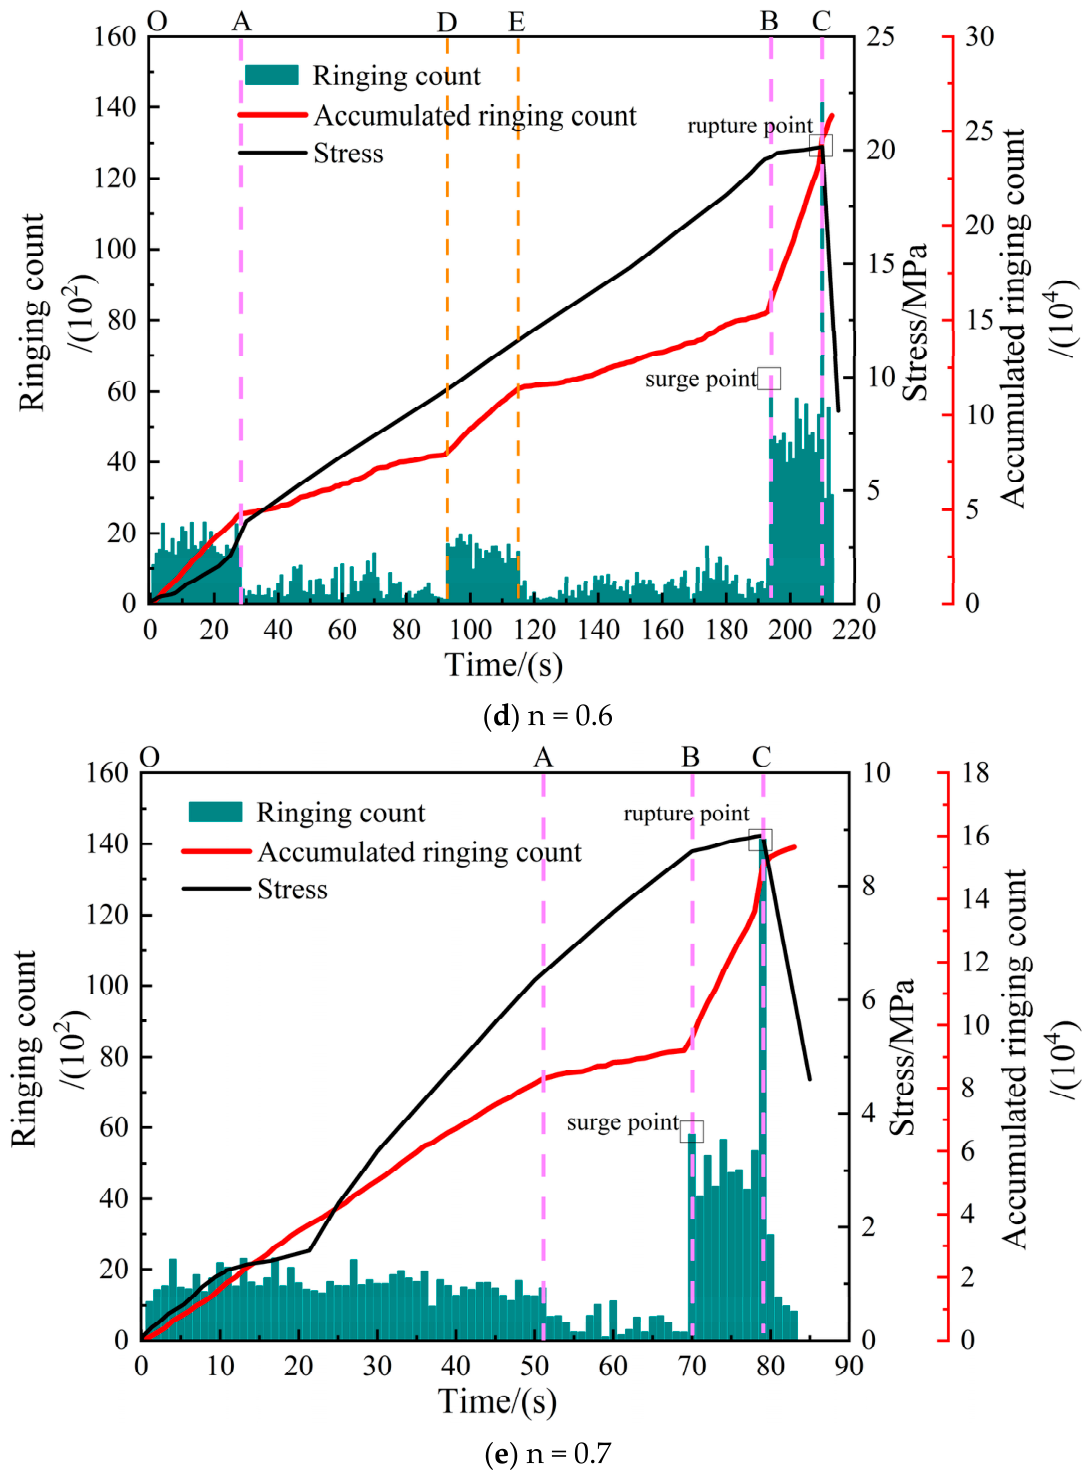
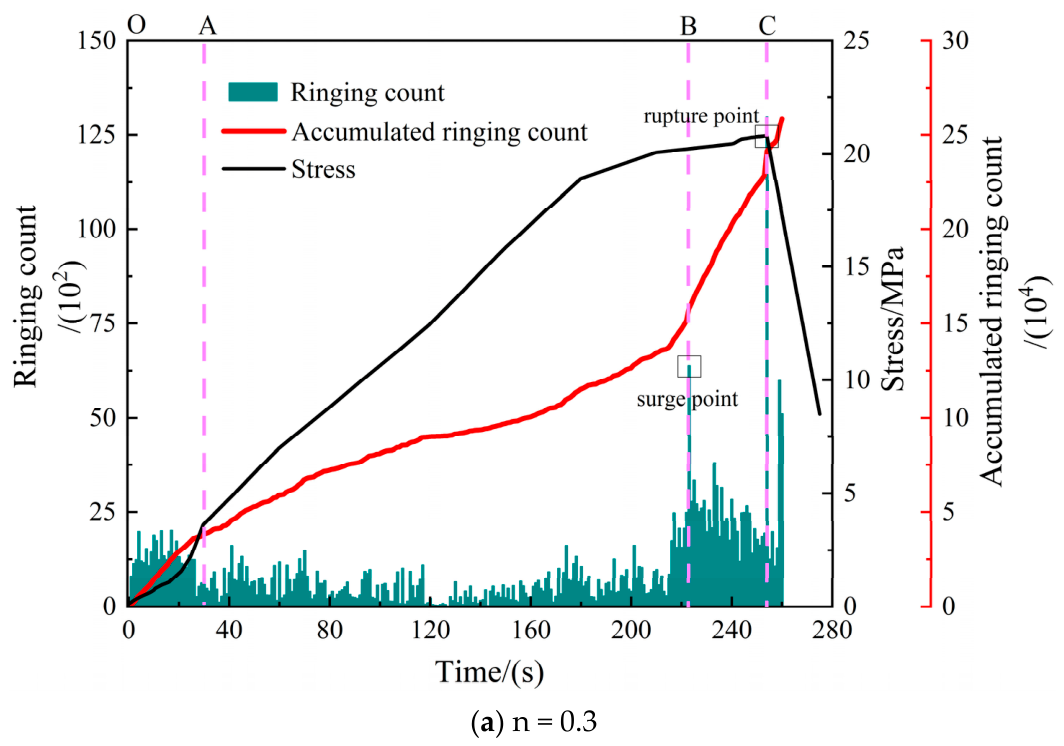
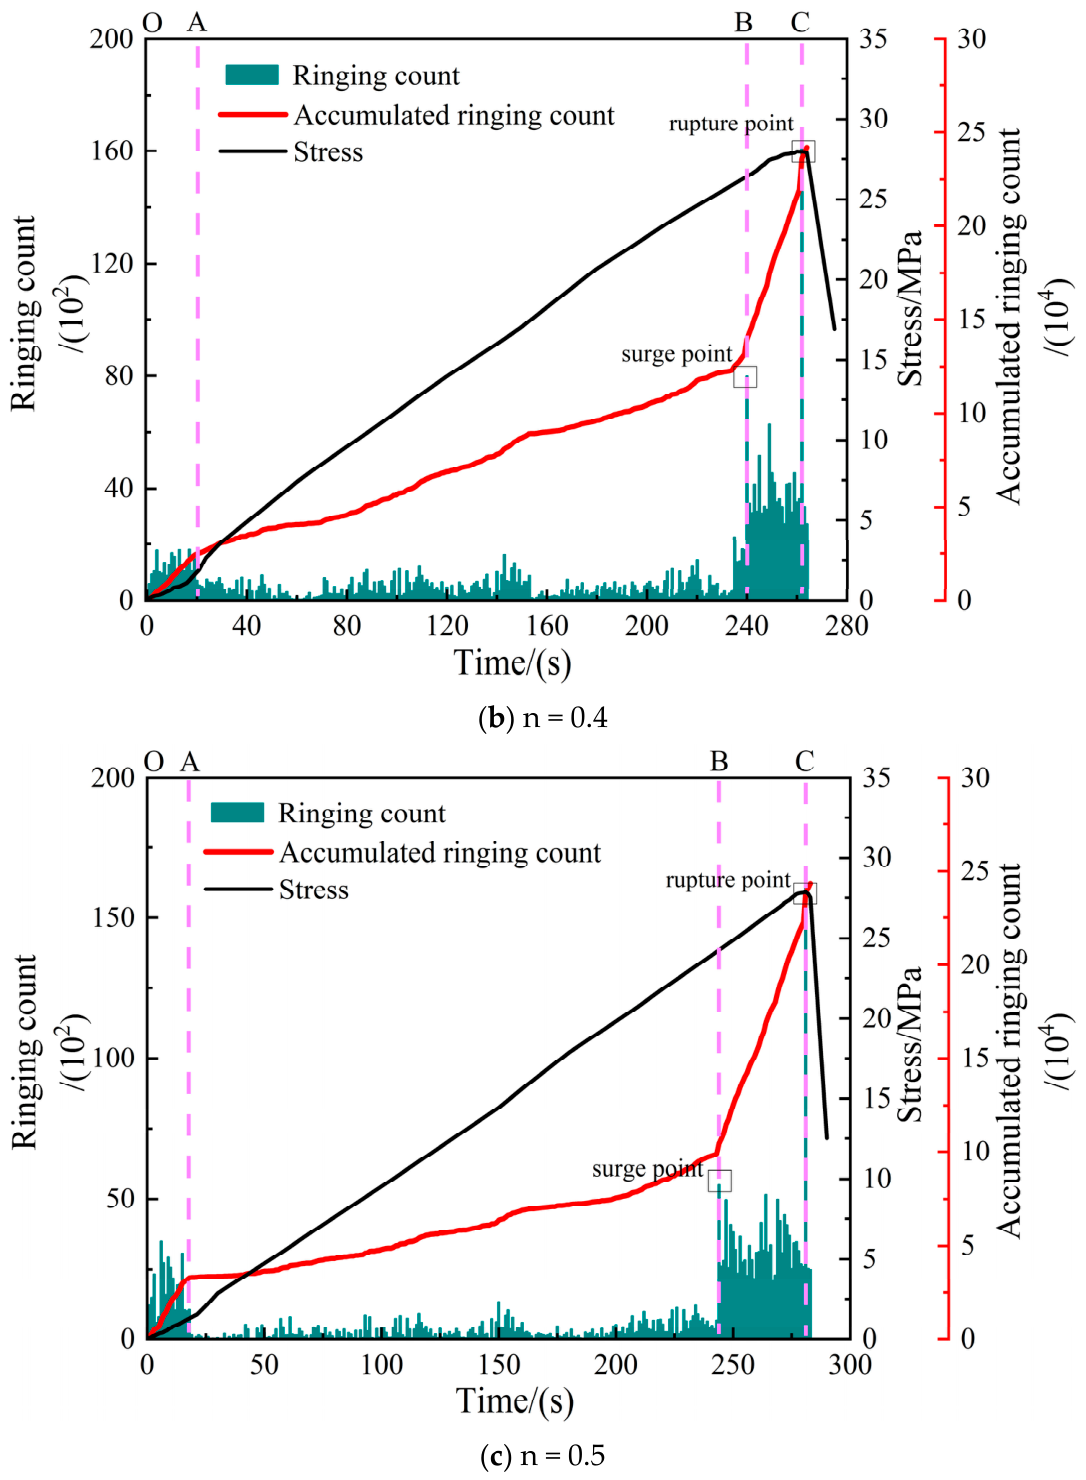
Ringing count is an important indicator for acoustic emission parameter analysis, which can effectively reflect the damage evolution characteristics of the CGFB during the entire loading process. Acoustic emission monitoring methods were used to analyze the ringing count of CGFB specimens with n = 0.3~0.7, exploring the typical stress distribution, ringing count, and cumulative count variation relationship from the initial compression stage to complete failure of the specimens, as shown in Figure 8. From Figure 8, it can be observed that the acoustic emission ringing count of CGFB specimens with different gradation indices exhibits a phased variation trend over time, which can be approximately divided into a ringing increase period, a ringing stable period, and a ringing burst period in chronological order. The evolutionary characteristics of each period are as follows:
(1)
Rising phase (OA segment): During the period from the start of loading to the completion of the initial compaction stage, the specimen is subjected to load, causing the internal primary micropores to be compressed and densified, leading to active acoustic emission activity during the initial compaction stage. During the rising phase, ringing counts are continuously detected, and the load borne by the specimen is approximately 12% to 25% of the peak stress. When n ≤ 0.5, the active time of ringing counts during the rising phase is relatively short; when n > 0.5, the active time of ringing counts during the rising phase increases significantly. The ringing count value fluctuates within the range of 1000 to 3000, and the tangent slope of the accumulative ringing count curve is large, indicating a clear upward trend. At this stage, the damage variable D ≤ 0.1, the damage evolution rate is slow, there is no obvious crack formation, and the damage mainly originates from slight deformation of the primary pores.
(2)
Stable period (AB segment): From the elastic deformation stage to the early stage of the plastic yield stage, the acoustic emission activity is in a stable period, and the load borne by the specimen is approximately 80.6~92.5% of the peak stress. After entering the elastic stage, a dense structure has formed inside the specimen. As the compressive stress increases, cracks gradually initiate and propagate inside. The energy generated by crack initiation dissipates slowly to the outside. At this time, the overall acoustic emission activity is relatively stable and remains calm. However, due to the different particle sizes of the specimen’s aggregates, there are significant temporal and spatial differences in the formation and propagation speed of internal cracks. During the stable period, the overall acoustic emission ringing count remains in the low range, generally below 1000, with a maximum of no more than 2000, and the accumulative ringing count curve trends gently, with only a slight increase as the loading time progresses. At this stage, the damage variable is 0.1 < D ≤ 0.7, and the damage evolution rate accelerates, mainly due to the initiation and expansion of microscopic defects.
(3)
Burst period (BC segment): The burst period corresponds to the late stage of the plastic yield phase to the post-peak failure phase. As the compressive stress continues to increase, the ringing count of the specimen increases rapidly, ushering in an explosive growth. The ringing count during the burst period surges to 3 to 5 times that during the stable period. The time point when the ringing count sharply increases can be defined as the surge point, which is the boundary point from the plateau period to the burst period. With the emergence of surge points, the ringing count exceeds 6000, at which point the specimen reaches the yield limit, internal cracks develop into macroscopic cracks, and the overall structure fractures and collapses, releasing strain energy instantaneously. The maximum ringing count reaches 12,000 or more at the time of specimen fracture. The accumulative ringing count climbs sharply, approaching a linear increase. At this stage, the damage accumulates rapidly and tends to stabilize, with a damage variable of 0.7 < D ≤ 1. The damage evolution rate gradually slows down to approach zero, microcracks gradually penetrate, the main crack forms, and the skeleton begins to fracture. The damage ultimately leads to complete failure of the specimen.
Figure 8. Trend of acoustic emission ringing count when n = 0.3~0.7.
Buildings 16 01572 g008aBuildings 16 01572 g008bBuildings 16 01572 g008c
By comparing the trend of ringing count changes in specimens of CGFB with different gradation indices, it can be observed that there are significant differences in the duration of each stage. When n = 0.3~0.6, the duration of the rising phase of the ringing count is relatively short, accounting for less than 20% of the overall loading time. The stable phase lasts for more than 60% of the entire loading process, while the burst phase lasts for 15%~25% of the overall loading time. The end times of the stable phase for n = 0.3~0.7 are 221 s, 240 s, 247 s, 194 s, and 70 s, respectively. When n = 0.7, the burst phase is reached first, indicating the lowest compressive strength. Throughout the entire loading process, the ringing count remains continuously active, with only a brief stable phase. When n = 0.5, the stable phase lasts the longest, indicating that an appropriate gradation ratio of particle sizes can effectively fill the primary pores within the CGFB, significantly improving the compactness of the internal structure, and thus achieving the highest compressive strength. For specimens with n = 0.6, during the stable phase from 93 to 118 s, as shown in the DE interval in Figure 8d, the ringing count becomes active again, indicating friction between the aggregate and mortar. During the stable phase, microcracks gradually expand and connect, resulting in a lower overall compressive strength for this specimen.
By analyzing the damage evolution law of CGFB specimens with different gradation indices under compression, the diversity and uniformity of acoustic emission parameters can be observed [37,38,39,40]. The diversity is primarily attributed to the internal structural differences caused by varying proportions of particle sizes in continuous gradation, leading to distinct trends in the accumulative ringing count during the ascending and stable phases. The uniformity manifests in stages where the ringing count and accumulative ringing count are similar, as well as a bimodal distribution pattern where the surge point and fracture point coexist. The emergence of the surge point signifies that the specimen has entered an explosive phase of ringing count, and its occurrence can be regarded as a precursor signal for the failure of the CGFB. At this time, the monitoring value of the ringing count exceeds 6000, which is more than three times higher than that in the stable period.

4.5. Spatiotemporal Evolution of Acoustic Emission Energy

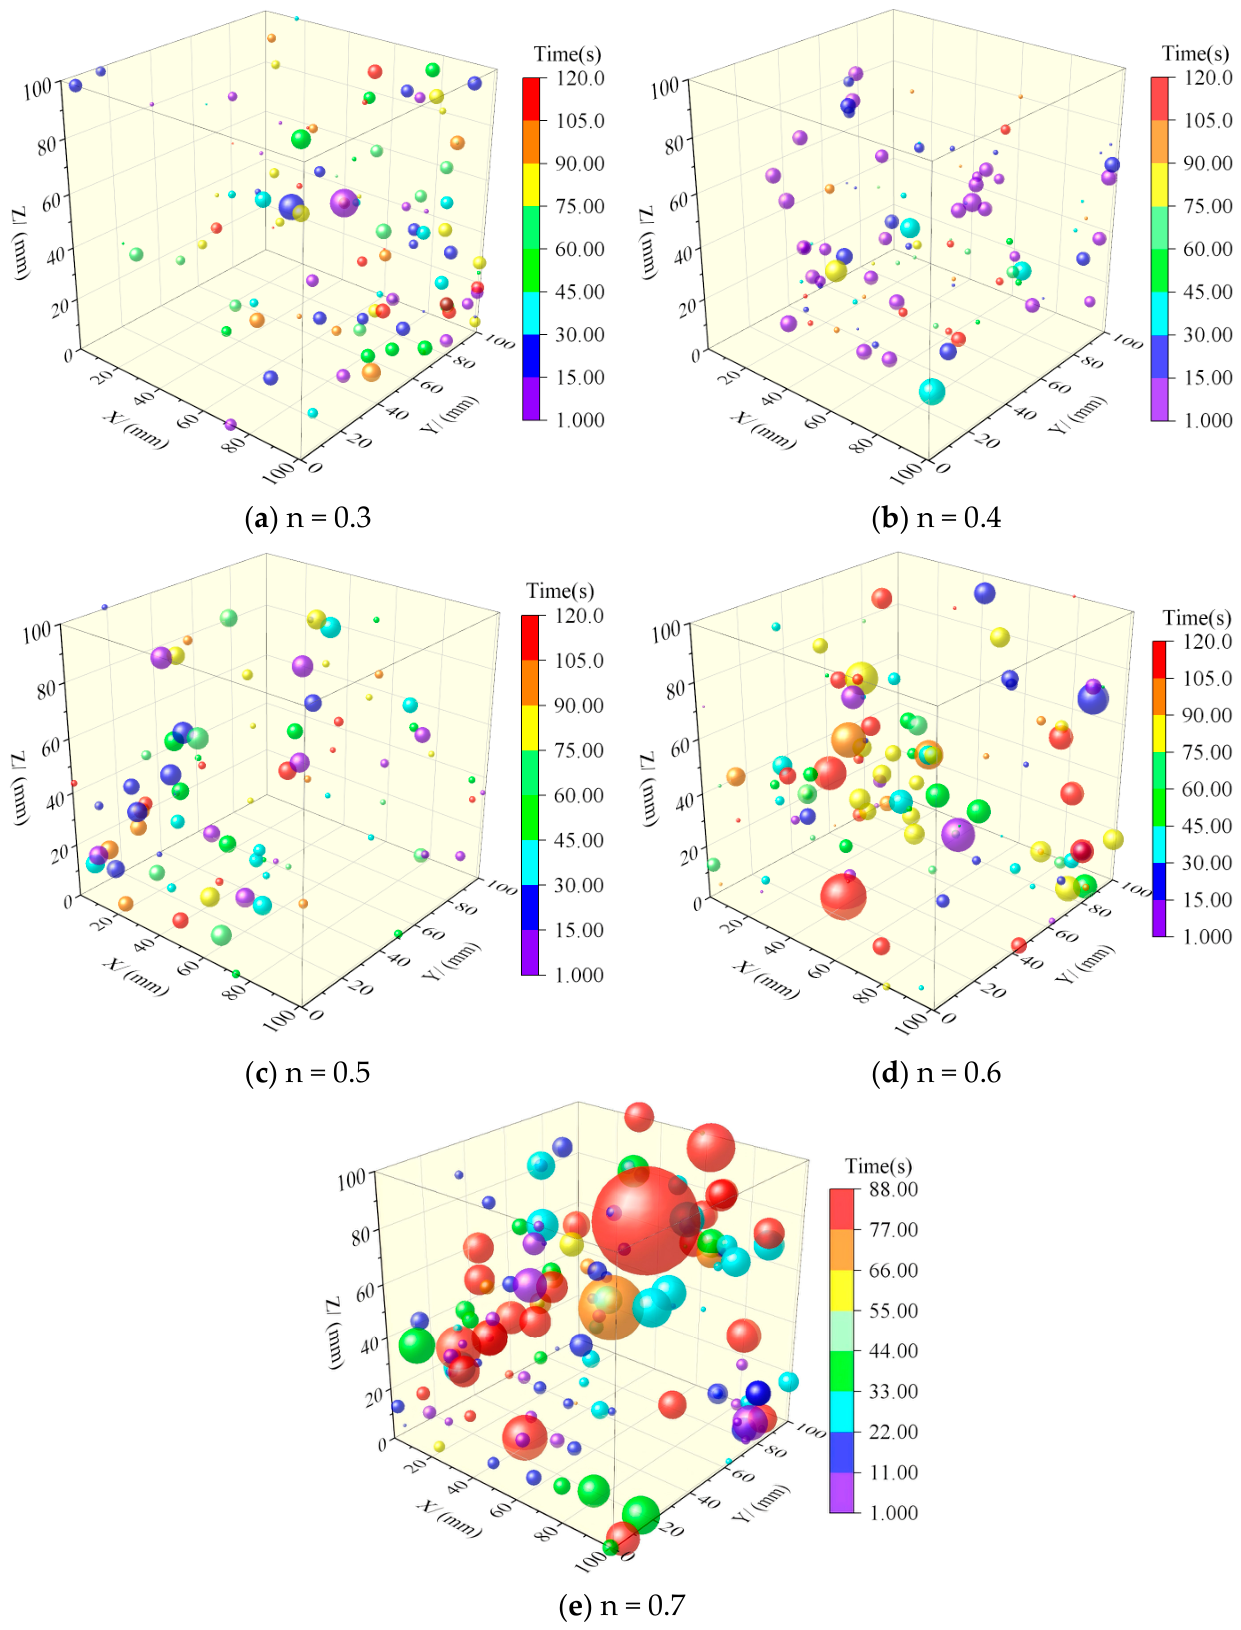
Acoustic emission monitoring captures the temporal and spatial coordinates and energy dissipation values of acoustic emission events, reflecting the spatiotemporal evolution of these events and accurately describing the internal damage process of CGFB. The spatiotemporal evolution process is divided into two stages: the first stage is from 0 to 120 s, and the second stage is from 120 s to the specimen’s fracture. Figure 9 shows the spatiotemporal evolution process of acoustic emission events within 0 to 120 s for different gradation indices. The spheres in the figure represent acoustic emission events, with the size of the spheres indicating the energy level of the events and the color of the spheres corresponding to the formation time of the events. By comparing the spatiotemporal evolution process diagrams of acoustic emission for different gradation indices, it can be concluded that: (1) when n = 0.3 and n = 0.4, the spatiotemporal evolution process diagram mainly consists of purple and blue spheres, with sporadic distribution of green and red spheres. The smaller diameter of the spheres indicates that the energy dissipation phenomenon is evident during the initial loading stage, and the subsequent energy dissipation amplitude is smaller, indicating that there are more primary micropores in the specimen during the early stage; (2) when n = 0.5, the total number of spheres in the spatiotemporal evolution process diagram is the least, mainly consisting of purple and blue spheres, with very few spheres of other colors, indicating that the specimen has good compactness; (3) when n = 0.6 and n = 0.7, the diameter of the spheres increases, and the number of green, yellow, and red spheres increases, indicating that there is a significant energy dissipation phenomenon throughout the entire loading process of the specimen. When n = 0.7, failure occurs at 80 s, and the energy dissipation value doubles. As the specimen approaches failure, the number of orange spheres decreases, indicating that the internal cracks of the specimen have not expanded extensively, and the specimen has already failed. Therefore, the loading time is short and the compressive strength is low.
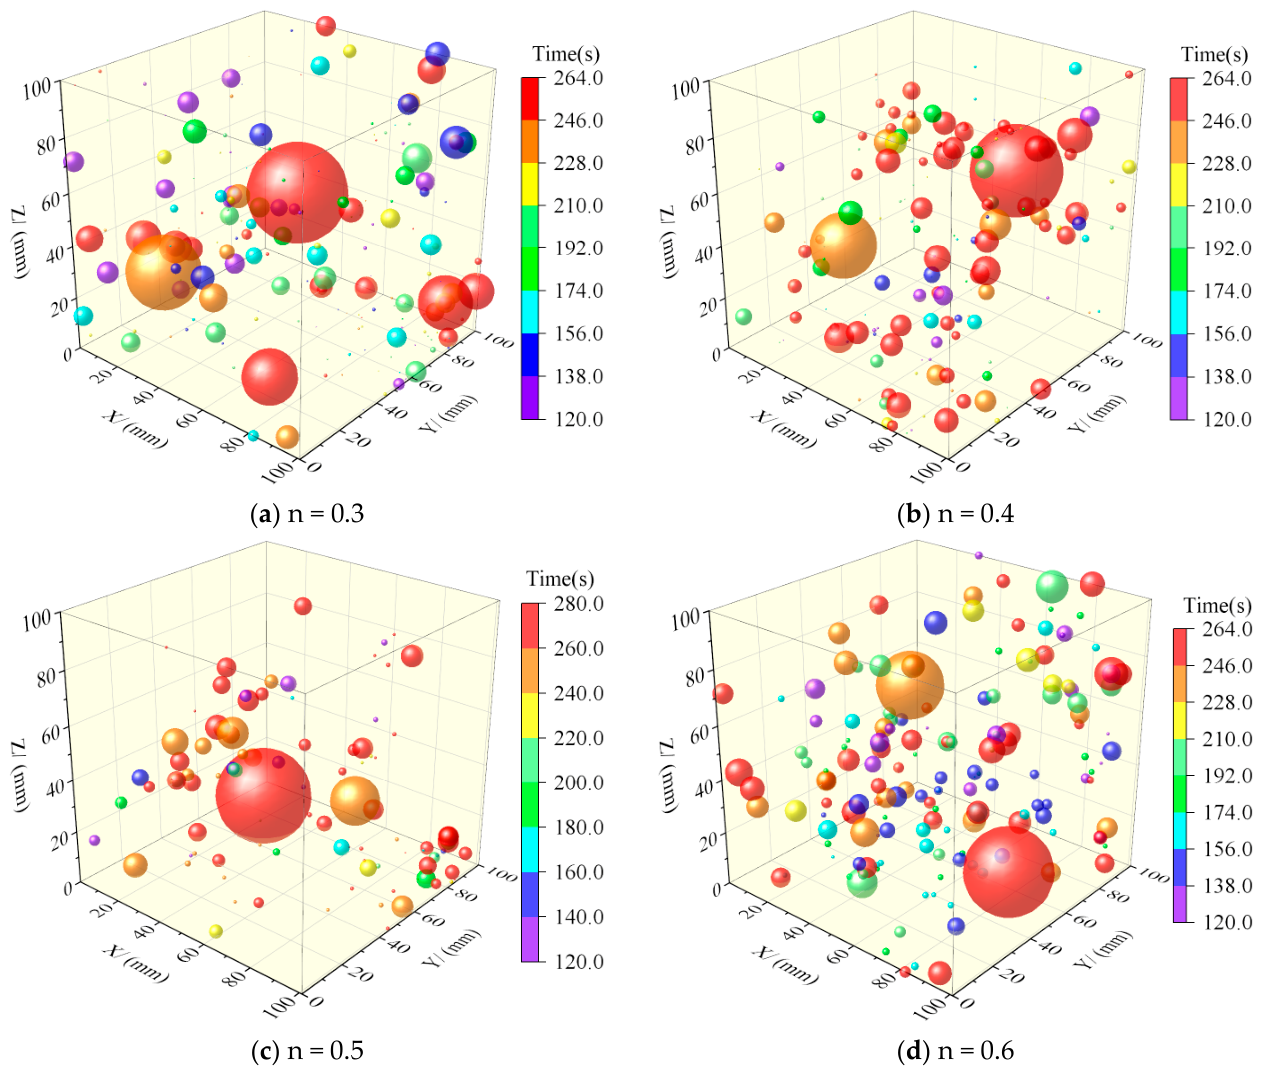
Figure 10 illustrates the spatiotemporal evolution process of acoustic emission events after 120 s for different gradation indices. During this stage, the overall proportion of purple and blue spheres is relatively low, indicating that the specimen is in a stable low-energy dissipation range. As the specimen approaches failure, the number of orange and red spheres increases and their diameters become larger, indicating that the internal cracks of the specimen are rapidly expanding under compressive stress before overall failure, ultimately forming macroscopic cracks and causing overall failure. Therefore, a long-term high-energy dissipation zone is formed between the surge point and the fracture point. When n = 0.6, there are more purple and blue spheres, indicating that crack propagation occurs inside the specimen. When n = 0.5, the overall number of spheres is relatively small, and high-energy dissipation only occurs at the surge point and the fracture point, indicating that the specimen has good compactness after the elimination of primary pores. Therefore, the loading time is long and the compressive strength is high.
An in-depth analysis of the spatiotemporal evolution of acoustic emission events in CGFB with different gradation indices reveals the following: The first stage of energy dissipation shows a downward trend, with energy dissipation values not exceeding 500 mV·ms. The second stage exhibits an upward trend followed by a sharp increase, with energy dissipation values exceeding 2500 mV·ms and peak values reaching over 4000 mV·ms. Overall, energy dissipation demonstrates a phased variation pattern of initial increase followed by decrease and then a steep increase leading to stability. However, an increase in the proportion of small particles leads to a widespread phenomenon of low energy dissipation, while an increase in the proportion of large particles results in prolonged high energy dissipation during the stable period. Appropriate gradation of particle sizes can enhance the compactness of the specimen and reduce the energy distribution differences among particles. This difference indicates that structural heterogeneity caused by particle gradation is a key factor affecting the internal energy dissipation pattern during the compression process of the backfill. Different gradations of particle sizes directly lead to differentiated energy dissipation by altering the contact state of particles, pore distribution, and stress transfer paths within the backfill.

5. Microscopic Morphology Analysis

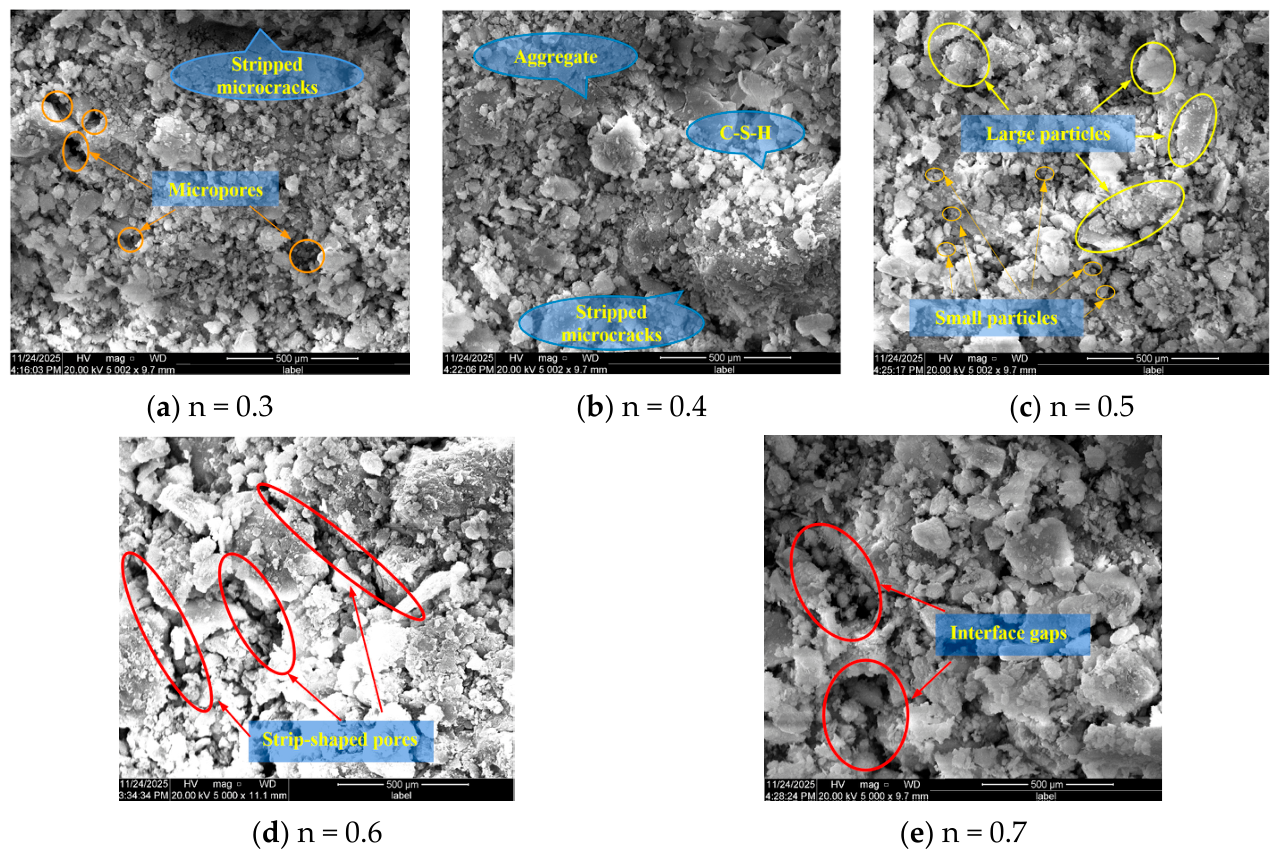
To explore the microscopic correlation mechanism between the gradation index and the internal structure and mechanical properties of CGFB, scanning electron microscopy (SEM) was employed to observe and analyze the microscopic morphology and internal structural characteristics of CGFB specimens with different gradation indices, as shown in Figure 11.
From Figure 11, it can be observed that the microstructures of different gradation indices exhibit significant differences:
(1)
When n = 0.3 and 0.4, the filling body contains a large number of micropores with a diameter of approximately 100 μm and highly connected capillary channels, which disrupt the integrity of the microstructure, leading to a decrease in structural compactness. Moreover, strip-shaped microcracks with a length exceeding 200 μm are formed at the cementation interface between the aggregate and the mortar, lacking sufficient bonding strength, making them a weak link in the microstructure. During the loading process of the specimen, the original pores are easily compressed, and the interfacial microcracks are prone to expansion, ultimately resulting in a decrease in the macroscopic strength of the specimen and the occurrence of compressive–shear conjugate failure.
(2)
When n = 0.5, the internal filling body achieves a reasonable combination and tight packing of coarse and fine particle sizes, with a more uniform pore distribution and significantly reduced pore size. This effectively eliminates stress weak points in the microstructure. Furthermore, a tight and continuous bonding interface is formed between the gangue aggregate and the cement mortar, with the aggregate particles interlocking to construct a stable three-dimensional spatial skeleton structure. This structure can inhibit the initiation and expansion of microcracks, laying a good micro-foundation for the improvement of macro-compressive strength.
(3)
When n = 0.6 and n = 0.7, the internal filling body contains more coarse particles and fewer fine particles, resulting in an imbalance in particle gradation. There are obvious cracks and voids between particle interfaces, with lengths up to 500 μm, and these microscopic defects have strong connectivity, forming penetrating weak channels. These microscopic defects are prone to becoming weak points under stress during loading, where microcracks preferentially initiate and rapidly propagate, leading to early failure of the specimen. This restricts the improvement of the overall compressive strength of the filling body, resulting in poor macroscopic mechanical performance.
(4)
When n = 0.3 and n = 0.4, the porosity ranges from 18.6 to 21.2%; when n = 0.5, the porosity drops to 12.8%, reaching its minimum value; when n = 0.6 and n = 0.7, the porosity rises from 22.9 to 26.5%. This pattern is consistent with the trend of macroscopic peak stress changes, confirming the variation rule that “the lower the porosity, the denser the microstructure, and the higher the macroscopic strength”. It also explains the mesoscopic mechanism behind the optimal peak stress at n = 0.5, where the particle gradation is most reasonable, and the hydration products of cementitious materials can fully fill the pores, forming a dense microstructure.
(5)
Using a pore size classification and statistical method, pores are divided into three categories: micropores (less than 50 μm), mesopores (50 μm to 100 μm), and macropores (greater than 100 μm). The pore size distribution characteristics under different gradations are quantified: when n = 0.3 to 0.5, the combined proportion of micropores and mesopores reaches over 80%, while the proportion of macropores is less than 20%. The pore size distribution is uniform, with a predominance of small-sized pores. This distribution characteristic ensures uniform stress distribution in the microstructure, making it less prone to stress concentration. When n = 0.6 to 0.7, the proportion of macropores increases from 35 to 42%, while the proportion of micropores decreases to below 30%. The pore size distribution is uneven, and the presence of macropores can act as microscopic defects, which are prone to initiating and propagating cracks under load. This is consistent with the rapid decrease in peak stress observed in macroscopic mechanical tests when n > 0.5.
(6)
Under different gradation indices n, there are significant differences in the correlation characteristics between SEM microstructure and AE signals: when n = 0.3~0.5, SEM observations show a high proportion of micropores and mesopores, uniform microstructure, and dispersed microcrack initiation, corresponding to AE signals with a slow increase in energy, late occurrence of surge points, long warning time, and a consistently high proportion of low-frequency signals, indicating a slow and dispersed damage evolution. When n = 0.6~0.7, SEM observations show a high proportion of macropores, with many defects in the microstructure, and main cracks are prone to penetrate, corresponding to AE signals with rapid energy increase, surge points occurring close to the mechanical peak, short warning time, and concentrated bursts of high-frequency signals, indicating severe and sudden damage evolution. This synergistic response further verifies the regulatory effect of gradation optimization on microstructure, macroscopic mechanical properties, and AE damage evolution, achieving comprehensive linkage analysis of meso-macro-AE signals.
In summary, the regulation of the gradation index is a key factor in optimizing the microstructure of CGFB and improving its macroscopic mechanical properties. A reasonable gradation index can fully leverage the synergistic effect of “coarse particles for support, medium particles for filling, and fine particles for optimization”, achieving tight packing of particles, reducing microscopic pores and structural defects, strengthening the interfacial bond between aggregates and mortar, and constructing a stable and dense microstructure. This research provides a theoretical basis for the gradation optimization design and mechanical property improvement of CGFB.

6. Conclusions

Based on the improved Talbot gradation theory, this paper prepared five types of CGFB specimens with different gradation indices for mechanical property testing. Acoustic emission monitoring technology was employed to analyze the trend of ringing count changes and the spatiotemporal evolution of acoustic emission events. The main conclusions are as follows:
(1)
The compressive strength of CGFB with different gradation indices first increases and then decreases as the gradation index increases. The gradation index of n = 0.5 performs the best, with an average compressive strength of nearly 30 MPa. An unreasonable gradation index can lead to varying degrees of reduction in compressive strength.
(2)
The variation trend of acoustic emission ringing count during the loading process of CGFB exhibits three stages: An ascending phase, a stable phase, and an explosive phase. Due to the high proportion of large particle sizes, poor internal structural compactness, and a large number of primary pores, the compressive strength is relatively low. The stable phase is the shortest, and an appropriate proportion of particle size gradation can fill the primary pores inside the CGFB, effectively enhancing the compressive strength.
(3)
The spatiotemporal evolution law of acoustic emission events in CGFB with different gradation indices exhibits a phased change characterized by an initial increase followed by a decrease and a subsequent steady and sharp increase. The aggregate size gradation ratio is an important indicator that affects the internal energy dissipation rate of the specimen, and it is a key factor in optimizing the microstructure of CGFB and improving its macroscopic mechanical properties. A reasonable gradation index can fully leverage the synergistic effect of continuously graded particles and effectively enhance the mechanical properties of CGFB.
(4)
This study aims to explore the influence of particle size on the strength of the filling body. All experiments were conducted on a laboratory scale, focusing on a specific combination of coal gangue and cementitious materials. The universality of the conclusions needs further verification. In the next step, the scope of raw material adaptability can be expanded to study the influence of particle size of different types of coal gangue on the performance of CGFB, providing a reference for the gradation design of CGFB and further enhancing the utilization efficiency of coal gangue.

Author Contributions

Conceptualization, W.Z., J.G. and H.J.; methodology, W.Z.; software, L.Y. and Y.L.; validation, W.Z. and J.G.; formal analysis, J.G. and H.J.; investigation, W.Z. and J.G.; resources, W.Z. and J.G.; data curation, W.Z.; writing—original draft, W.Z.; writing—review and editing, J.G.; visualization, L.Y. and Y.L.; supervision, J.G. and H.J.; project administration, W.Z., J.G., H.J., L.Y. and Y.L.; funding acquisition, J.G. All authors have read and agreed to the published version of the manuscript.

Funding

This work is supported by the National Natural Science Foundation of China (52574142), Key R&D and Promotion Projects of Henan Province (262102241009), National Key Research and Development Program of China (2023YFC2907202), New Round of Construction Project of Key Academic Discipline in Henan Province ([2023]414), and Key Scientific Research Projects of Henan Colleges and Universities (24A440012).

Data Availability Statement

The original contributions presented in this study are included in the article. Further inquiries can be directed to the corresponding authors.

Conflicts of Interest

The authors declare no conflicts of interest.

References

  1. Xiong, Y.; Kong, D.; Song, G. Research hotspots and development trends of green coal mining: Exploring the path to sustainable development of coal mines. Resour. Policy 2024, 92, 105039. [Google Scholar] [CrossRef] [Scilit]
  2. Sun, J.; Liu, S.; Ma, Z.; Qian, H.; Wang, Y.; Al-Azzani, H.; Wang, X. Mechanical properties prediction of lightweight coal gangue shotcrete. J. Build. Eng. 2023, 80, 108088. [Google Scholar] [CrossRef] [Scilit]
  3. Tan, Y.; Cheng, H.; Guo, W.B.; Bai, E.H.; Zhang, S.P.; Wang, Y.; Li, Z.H. Mechanical properties and damage characteristics of solidified body-coal combination in continuous driving and gangue backfilling. Int. J. Min. Sci. Technol. 2023, 33, 1217–1228. [Google Scholar] [CrossRef] [Scilit]
  4. Song, X.; Hao, Y.; Wang, S.; Zhang, L.; Liu, W.; Li, J. Mechanical properties, crack evolution and damage characteristics of prefabricated fractured cemented paste backfill under uniaxial compression. Constr. Build. Mater. 2022, 330, 127251. [Google Scholar] [CrossRef] [Scilit]
  5. Zhao, K.; Zhou, Y.; Huang, Q.; Yin, S.H.; Yan, Y.; Wu, J.; Shen, L.; Zeng, X. Early properties and modeling of cemented superfine tailings backfill containing sodium dodecyl sulfate: Microstructure, mechanics, and acoustics. Mech. Mater. 2023, 179, 104567. [Google Scholar] [CrossRef] [Scilit]
  6. Guo, Z.; Qiu, J.; Jiang, H.; Zhang, S.; Ding, H. Improving the performance of superfine-tailings cemented paste backfill with a new blended binder. Powder Technol. 2021, 394, 149–160. [Google Scholar] [CrossRef] [Scilit]
  7. Xu, W.; Li, Q.; Liu, B. Coupled effect of curing temperature and age on compressive behavior, microstructure and ultrasonic properties of cemented tailings backfill. Constr. Build. Mater. 2020, 237, 117738. [Google Scholar] [CrossRef] [Scilit]
  8. Yilmaz, E.; Belem, T.; Benzaazoua, M. Effects of curing and stress conditions on hydromechanical, geotechnical and geochemical properties of cemented paste backfill. Eng. Geol. 2014, 168, 23–37. [Google Scholar] [CrossRef] [Scilit]
  9. Zhou, Y.; Zhang, T.; Duan, L.; Li, J. A review of research on comprehensive treatment of mined-out areas in China. Saf. Environ. Eng. 2022, 29, 220–230. [Google Scholar]
  10. Yang, K.; Zhao, X.; Wei, Z. Development Overview of Paste Backfill Technology in China’s Coal Mines: A Review. Environ. Sci. Pollut. Res. 2021, 28, 67957–67969. [Google Scholar] [CrossRef] [Scilit]
  11. Wang, Y.; Wu, J.; Ma, D.; Yang, S.; Yin, Q.; Feng, Y. Effect of aggregate size distribution and confining pressure on mechanical property and microstructure of cemented gangue backfill materials. Adv. Powder Technol. 2022, 33, 103686. [Google Scholar] [CrossRef] [Scilit]
  12. Liu, J.; Liu, K.; He, B.; Liu, K.; Lu, J.; Zhou, Z.; Xu, B.; Yu, S.; Qin, G.; Wang, L.; et al. Mechanical properties and solidification mechanism of coal gangue-granulated blast furnace slag geopolymer stabilized engineering slurry. Case Stud. Constr. Mater. 2024, 21, e03660. [Google Scholar] [CrossRef] [Scilit]
  13. Pan, Y.; Yuan, H.; Zhai, S.; Geng, Z.; Huo, F. Study on Slump and Compressive Strength of Gangue Based on Aggregate Size Gradation. Appl. Sci. 2024, 14, 4214. [Google Scholar] [CrossRef] [Scilit]
  14. Feng, G.R.; Wang, Z.H.; Qi, T.Y. Effect of velocity on flow properties and electrical resistivity of cemented coal gangue-fly ash backfill (CGFB) slurry in the pipeline. Powder Technol. 2022, 396, 191−209. [Google Scholar] [CrossRef] [Scilit]
  15. Zhao, K.; Lai, Y.M.; He, Z.W. Study on energy dissipation and acoustic emission characteristics of fiber tailings cemented backfill with different ash-sand ratios. Process Saf. Environ. Prot. 2023, 174, 983−996. [Google Scholar] [CrossRef] [Scilit]
  16. Ran, H.Y.; Guo, Y.X.; Feng, G.R. Failure properties and stability monitoring of strip and column cemented gangue backfill bodies under uniaxial compression in constructional backfill mining. Environ. Sci. Pollut. Res. Int. 2022, 29, 51411−51426. [Google Scholar] [CrossRef] [Scilit]
  17. Guo, Y.X.; Zhao, Y.H.; Feng, G.R. Creep and strength characteristics of cemented gangue backfill under coupling effect of load and acid corrosion. Environ. Sci. Pollut. Res. Int. 2023, 30, 97281−97297. [Google Scholar] [CrossRef] [Scilit] [PubMed]
  18. Jiang, H.; Qi, Z.; Yilmaz, E.; Han, J.; Qiu, J.; Dong, C. Effectiveness of alkali-activated slag as alternative binder on workability and early age compressive strength of cemented paste backfills. Constr. Build. Mater. 2019, 218, 689–700. [Google Scholar] [CrossRef] [Scilit]
  19. Yin, S.H.; Hou, Y.Q.; Chen, X. Mechanical behavior, failure pattern and damage evolution of fiber-reinforced cemented sulfur tailings backfill under uniaxial loading. Constr. Build. Mater. 2022, 332, 127248. [Google Scholar] [CrossRef] [Scilit]
  20. Li, J.; Yilmaz, E.; Cao, S. Influence of industrial solid waste as filling material on mechanical and microstructural characteristics of cementitious backfills. Constr. Build. Mater. 2021, 299, 124288. [Google Scholar] [CrossRef] [Scilit]
  21. Zhang, C.; Fu, J.; Song, W. Mechanical model and strength development evolution of high content fly ash–cement grouting material. Constr. Build. Mater. 2023, 398, 132492. [Google Scholar] [CrossRef] [Scilit]
  22. Cheng, H.Y.; Wu, S.C.; Zhang, X.Q.; Wu, A.X. Effect of Particle Gradation Characteristics on Yield Stress of Cemented Paste Backfill. Int. J. Miner. Metall. Mater. 2020, 27, 10–17. [Google Scholar] [CrossRef] [Scilit]
  23. Xu, W.; Zhang, Y.; Liu, B. Influence of silica fume and low curing temperature on mechanical property of cemented paste backfill. Constr. Build. Mater. 2020, 254, 119305. [Google Scholar] [CrossRef] [Scilit]
  24. Behera, S.K.; Mishra, D.P.; Singh, P.; Mishra, K.; Mandal, S.K.; Ghosh, C.; Kumar, R.; Mandal, P.K. Utilization of mill tailings, fly ash and slag as mine paste backfill material: Review and future perspective. Constr. Build. Mater. 2021, 309, 125120. [Google Scholar] [CrossRef] [Scilit]
  25. Behera, S.K.; Ghosh, C.N.; Mishra, D.P.; Singh, P.; Mishra, K.; Buragohain, J.; Mandal, P.K. Strength development and microstructural investigation of lead-zinc mill tailings based paste backfill with fly ash as alternative binder. Cem. Concr. Compos. 2020, 109, 103553. [Google Scholar] [CrossRef] [Scilit]
  26. Yu, W.; Zhang, W.; Wu, P.; Pi, Y.; Zhang, Y. Study on preparation and strengthening mechanism of new surface treatment agent of concrete at multi-scale. Constr. Build. Mater. 2022, 346, 128404. [Google Scholar] [CrossRef] [Scilit]
  27. Zhang, J.; He, X.; Yang, K.; Wei, Z.; Zhao, X.-Y.; Fang, J.-J. Diffusion law of coal gangue slurry and the application of fluidized filling technology of gangue in caving area. Sci. Rep. 2023, 13, 13226. [Google Scholar] [CrossRef] [Scilit]
  28. Wang, C.; Liu, J.; Chen, L.; Liu, J.; Wang, L.; Liao, Y. Creep constitutive model considering nonlinear creep degradation of fractured rock. Int. J. Min. Sci. Technol. 2024, 34, 105–116. [Google Scholar] [CrossRef] [Scilit]
  29. Zhao, Y.H.; Guo, Y.X.; Feng, G.R. Long-term strength and deformation size effect of gangue cemented backfill in acid mine water. Structures 2023, 57, 105114. [Google Scholar] [CrossRef] [Scilit]
  30. Xu, T.; Fu, M.; Yang, S.; Heap, M.J.; Zhou, G. A numerical meso-scale elasto-plastic damage model for modeling the deformation and fracturing of sandstone under cyclic loading. Rock Mech. Rock Eng. 2021, 54, 4569–4591. [Google Scholar] [CrossRef] [Scilit]
  31. Wang, J.; Yu, Q.J.; Xiang, Z.Z.; Fu, J.X.; Wang, L.M.; Song, W.D. Influence of basalt fiber on pore structure, mechanical performance and damage evolution of cemented tailings backfill. J. Mater. Res. Technol. 2023, 27, 5227–5242. [Google Scholar] [CrossRef] [Scilit]
  32. Che, C.Y.; Cao, S.G.; Du, S.Y. Mechanical behavior of waste tire steel fiber-modified mine cemented backfilling materials: Early strength, toughness, and failure mode. J. Mater. Civ. Eng. 2024, 36, 04024183. [Google Scholar] [CrossRef] [Scilit]
  33. Ran, H.Y.; Guo, Y.X.; Feng, G.R. Creep properties and resistivity–ultrasonic–AE responses of cemented gangue backfill column under high-stress area. Int. J. Min. Sci. Technol. 2021, 31, 401–412. [Google Scholar] [CrossRef] [Scilit]
  34. Ouyang, S.Y.; Huang, Y.L.; Zhou, N. Experiment on acoustic emission response and damage evolution characteristics of polymer-modified cemented paste backfill under uniaxial compression. Int. J. Miner. Metall. Mater. 2023, 30, 1502–1514. [Google Scholar] [CrossRef] [Scilit]
  35. Shan, C.H.; Yao, Q.L.; Cao, S.G. Measurement of fracture development evolution of coal samples under acid–alkaline conditions by three-dimensional reconstruction and AE time–frequency characteristic analysis. Measurement 2023, 217, 112944. [Google Scholar] [CrossRef] [Scilit]
  36. Yu, A.P.; Chen, Z.H.; Zhang, L. Study on AE characteristics of concrete with different w/c ratio under uniaxial compression. Structures 2023, 58, 105443. [Google Scholar] [CrossRef] [Scilit]
  37. Yu, X.Y.; Montrésor, S.; Bentahar, M. Cluster analysis of acoustic emission signals for the damage pattern recognition of polymer concrete. Appl. Acoust. 2023, 211, 109533. [Google Scholar] [CrossRef] [Scilit]
  38. Yang, J.; Zhao, K.; Yu, X. Fracture evolution of fiber-reinforced backfill based on acoustic emission fractal dimension and b-value. Cem. Concr. Compos. 2022, 134, 104739. [Google Scholar] [CrossRef] [Scilit]
  39. Liang, D.; Zhang, N.; Xie, L.; Zhao, G.; Qian, D. Damage and fractal evolution trends of sandstones under constant-amplitude and tiered cyclic loading and unloading based on acoustic emission. Int. J. Distrib. Sens. Netw. 2019, 15, 1–16. [Google Scholar] [CrossRef] [Scilit]
  40. Xia, Z.; Yao, Q.L.; Li, X.H. Acoustic emission characteristics and energy mechanism of CFRP jacketed coal specimens under uniaxial compression. Constr. Build. Mater. 2022, 342, 127936. [Google Scholar] [CrossRef] [Scilit]
Figure 1. Mineral composition analysis diagram of coal gangue.
Buildings 16 01572 g001
Figure 2. Particle size distribution range of coal gangue aggregate.
Buildings 16 01572 g002
Figure 3. Acoustic emission monitoring test.
Buildings 16 01572 g003
Figure 4. Results of compressive strength test.
Buildings 16 01572 g004
Figure 6. Variation curve of peak stress and peak strain with grading index.
Buildings 16 01572 g006
Figure 7. Typical failure modes of CGFB.
Buildings 16 01572 g007
Figure 9. The spatiotemporal evolution process of acoustic emission events in 0~120 s.
Buildings 16 01572 g009
Figure 10. The spatiotemporal evolution process of acoustic emission events after 120 s.
Buildings 16 01572 g010
Figure 11. Microscopic morphology of coal gangue filling body.
Buildings 16 01572 g011
Table 1. Chemical composition of raw materials.
Raw MaterialLossSiO2Fe2O3Al2O3CaOMgOSO3TiO2K2ONa2O
Coal gangue9.7858.755.2416.472.201.330.700.811.421.23
Cement2.3424.644.844.862.813.020.32-0.220.31
Fly ash2.951.213.56.421.31.261.80.641.621.28
Table 2. Quality fraction in Talbot gradation design.
nCoal Gangue Particle Size (mm) and Dosage (%)
0.05~1.181.18~2.362.36~55~1010~1515~20
0.331.4211.8515.9418.2812.69.91
0.425.4611.3316.3820.1914.6811.96
0.520.3110.5916.4721.816.7214.11
0.615.999.7116.2423.0818.6716.31
0.712.488.7415.7324.0320.518.52
Table 3. Mix proportion of CGFB.
nCoal Gangue Particle Size (mm) and Mass (g)Cement (g)Fly Ash (g)Silica Fume
(g)
Coal Gangue (g)Water–Cement Ratio
0.05~1.181.18~2.362.36~55~1010~1515~20
0.3377142.2191.3219.4151.2118.940015015012000.28
0.4305.5136196.5242.3176.2143.5
0.5243.7127.1197.6261.6200.7169.3
0.6191.9116.6194.9276.9224195.7
0.7149.7104.9188.8288.4246222.2
Disclaimer/Publisher’s Note: The statements, opinions and data contained in all publications are solely those of the individual author(s) and contributor(s) and not of MDPI and/or the editor(s). MDPI and/or the editor(s) disclaim responsibility for any injury to people or property resulting from any ideas, methods, instructions or products referred to in the content.