Article

Machine Learning Prediction of Shear Strength in Cold-Formed Steel Modular Construction-Optimised (MCO) Beam


by
Drew Thomas Gray
1,
Lenganji Simwanda
2,
Mohamed Sifan
3,*,
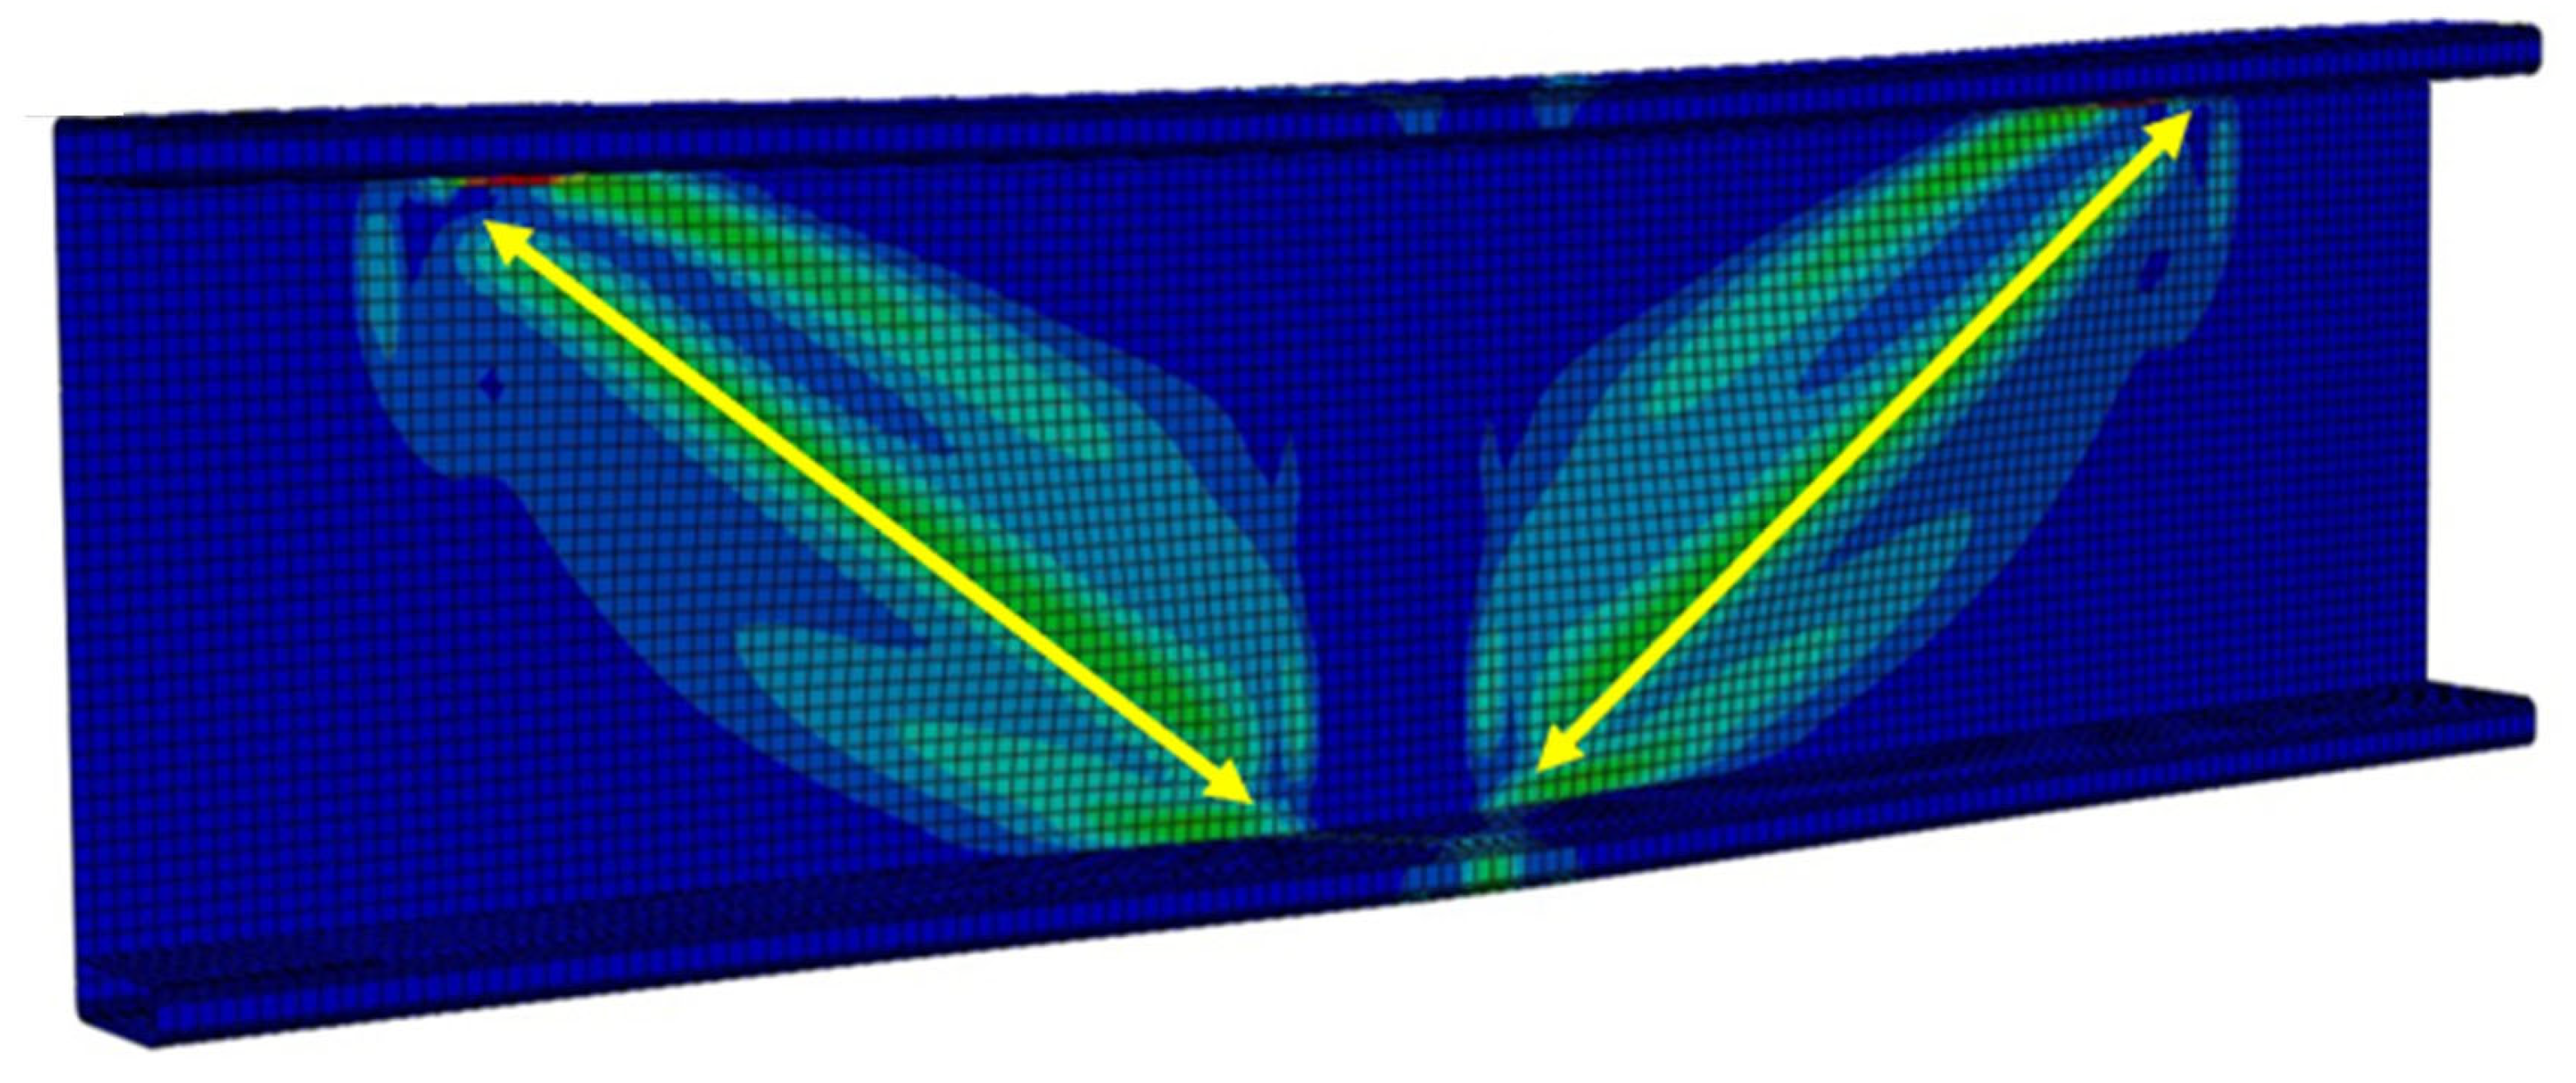
Keerthan Poologanathan
1 and
Thushanthan Kannan
1
1
Faculty of Engineering and Environment, Northumbria University, Newcastle upon Tyne NE1 8ST, UK
2
Klokner Institute, Czech Technical University in Prague, Solinova 7, 160 00 Prague, Czech Republic
3
School of Engineering, University of Surrey, Guildford GU2 7XH, UK
*
Author to whom correspondence should be addressed.
Buildings 2026, 16(8), 1497; https://doi.org/10.3390/buildings16081497
Submission received: 9 February 2026 / Revised: 18 March 2026 / Accepted: 20 March 2026 / Published: 10 April 2026

Abstract

The rapid growth of modular construction has increased the demand for accurate and computationally efficient methods for predicting the shear performance of cold-formed steel members. Modular construction-optimised beams, characterised by a mono-symmetric triangular hollow flange geometry, exhibit shear behaviour that is not well represented by existing analytical formulations. This study proposes an explainable machine learning framework to predict the ultimate shear capacity of cold-formed steel modular construction-optimised beams using a validated finite-element dataset comprising 105 parametric models. Six supervised machine learning algorithms are trained and evaluated using resampling-based validation and statistical performance metrics. Categorical boosting achieved the best predictive performance, with a coefficient of determination of 95.9% and a mean absolute percentage error of 6.49% under 50 repeated train and test splits. Model transparency is supported using Shapley Additive Explanations, which confirm thickness and yield strength as the most influential inputs within the investigated domain. In addition, prediction uncertainty was quantified using empirical 95% prediction intervals, and the modelling workflow was strengthened by explicitly defining reproducibility and no-leakage conditions. Overall, the proposed framework provides an efficient and interpretable finite element surrogate tool for rapid design-oriented estimation of modular construction-optimised beam shear capacity within the defined parameter ranges and loading configuration.

1. Introduction

Cold-formed steel (CFS) sections are increasingly used in construction as primary and secondary load-bearing elements. This is due to its many advantages, including lightweight, high strength-to-weight ratio, and ability to be formed into a range of thicknesses and profiles [1,2,3]. Increasing use of CFS has led to the development of innovative profiles, such as the web-stiffened members, such as the Sigma section [4,5,6], and hollow flange sections [7,8]. Each novel section has its structural advantages and applications.
A key application for CFS sections is the light-gauge steel construction, primary modular construction. A novel section was introduced by [9], it is a monosymmetric triangular hollow flange section, known as the modular construction-optimised (MCO) beam, primarily used as floor joists in South Korea [10]. Figure 1 illustrates the MCO beam profile. The MCO beam was developed with the application of ‘Six-sigma’, utilising customer feedback and market research to allow for a practical, cost-effective CFS section. Furthermore, it is noteworthy to point out that the MCO beam has been determined to have an 18% reduction in weight when compared to standard rectangular hollow flange sections (RHS) [9,10]. Moreover, recent research into the structural performance of the MCO beam by [10] showed enhanced flexural capacity compared to lipped channel beams (LCB) and proposed modified direct strength method (DSM) equations.
Recent research into the study of shear behaviour of CFS sections has been essential in understanding the structural implications of the use of CFS, especially when hollow flanges are introduced to CFS sections. Experimental work by Keerthan and Mahendran [12] provided the foundational work in investigating LCB, with [13] explaining channel sections with longitudinal stiffeners of the RHS. Later, Keerthan and Mahendran [14], using a three-point bending set-up, investigated the shear performance of the hollow flange Listesteel beam (LSB) using tests and extensive Finite Element (FE) parametric studies, investigating the interaction of hollow flanges on the ultimate shear capacity, documenting that current DSM guidelines are overconservative and lead to excessive design, therefore highlighting the need for design considerations and guidelines for CFS sections with hollow flanges.
As research has moved on, ref. [15] investigated the shear behaviour of CFS hollow flange sections, providing insights into the shear performance when stainless steel is utilised instead of carbon steel. Later, ref. [16] investigated the shear performance of doubly symmetric hollow flange beams with and without web openings, again showing current design guidelines being overconservative and leading to inefficient design. This research highlights that despite efforts to refine and improve design guidelines and practices, current analytical and numerical methods are limited by generalisation and the ability to capture complex scenarios and interactions.
A subset of artificial intelligence (AI) known as machine learning (ML) has radically changed numerous fields by utilising large complex datasets to allow for accurate predictions by identifying complicated patterns. ML is gaining traction for its inherent ability in modelling complex behaviours, optimised design and high accuracy in predicting the structural performance of structural elements under various loading conditions [17,18,19,20]. Conventional methods are usually based on empirical formulas and simplified assumptions, which limits their accuracy when it comes to nonlinear relationships and accurately captures the complex, highly variable nature of structural elements.
The application of ML in structural engineering is increasing, with wide applications in structural steel for predicting material properties [20,21] and structural capacities across materials, including concrete and timber [19,22,23]. A key highlight is [19], who applied ML to investigate the shear performance of LCBs and LSBs using neural network and tree-based models, reporting strong predictive accuracy. Related work by [18] considered web-stiffened channel sections. However, these studies focus on conventional channel-type geometries and, in some cases, rectangular hollow flange configurations. Beyond member-capacity prediction, recent studies have also demonstrated the growing use of data-driven methods in structural performance monitoring and warning applications. Recent studies developed warning frameworks for bridge cables based on temperature and displacement monitoring data, and for bridge towers under strong wind action using improved multi-rate data fusion [24,25]. These studies further highlight the broader potential of intelligent data-driven methods for structural assessment, condition monitoring, and decision support in civil engineering systems.
To date, no ML study has specifically investigated the shear performance of triangular hollow flange sections such as the MCO beam. This is an important gap because the MCO geometry produces a different stress distribution and failure response compared with more conventional sections (e.g., LSBs), and prior research has already indicated enhanced structural performance in bending and web crippling. The present study addresses this gap by developing ML surrogates tailored to the MCO section using an FE database that is first benchmarked against experimental evidence, and by reporting model stability through resampling-based uncertainty (mean ± 95% CI) alongside interpretable feature-attribution results.
This research study presents a novel approach for predicting the ultimate shear capacity of the MCO beam using explainable machine learning techniques. It is essential to note that other ML research studies into shear behaviour have not included machine learning explainability methods. By utilising explainability methods, increases confidence in the prediction of the ML model is increased without interfering with the model’s accuracy. The key objectives of this research study are to apply and evaluate the performance of six ML algorithms in predicting the ultimate shear capacity of the MCO beam using a FE data set of 105 MCO beam models. Furthermore, it is important to establish the most influential input variables, using explainable ML techniques including SHAP values and correlation analyses, with the overall aim to present an interpretable predictive framework that can be extended to other CFS members and wider modular construction applications.
This research presents an innovative approach for predicting the shear behaviour and ultimate shear capacity of CFS MCO beams, using advanced machine learning techniques. It is important to point out that previous research into machine learning investigation into shear behaviour has not included machine learning explainability techniques. Explainability methods allow for improved confidence in machine learning predictions by giving reasoning for predictions without hindering the model’s accuracy. The developed and analysed machine learning models provide a more accurate and efficient tool for researchers and engineers, enabling the design of shear behaviour of CFS hollow flange sections, primarily the MCO beam.

2. Numerical Modelling

A detailed FE model has been developed using the commercially available FEA software ABAQUS 2017 [26]. The model replicated the experimental set-up consisting of a simply supported beam under three point-bending set-ups to investigate the ultimate shear capacity of the MCO beam. An aspect ratio of 1.0 (aspect ratio is defined as a/d1, where a is the clear shear span and d1 is the clear web height) was chosen to allow for a predominant shear failure mode, based on previous research on the shear performance of CFS sections [13,27,28]. Other key factors including material properties, boundary conditions, load application and geometrical parameters were included.
The developed FE model consists of two parts, these being the MCO beam and the Web Side Plates (WSPs). Assembly of the WSPs onto the MCO beam was formed using the surface-to-surface ‘Tie’ constraint to replicate the experimental connection between the MCO beam and the WSPs. The MCO beam was modelled using the middle surface offset definition. Where the section is created using the centreline dimensions, then half of the thickness is applied to either side of the section; this is based on previous research studies [11,27,28].

2.1. Element Type and Meshing

The S4R shell element type was selected to model the MCO beam, as the thickness was negligible when compared to other dimensions of the MCO beam. The S4R shell element is a four-node element that is used due to its high accuracy, reduced integration and less computational time required. Therefore, the four-node S4R element was used for this study over other shell element types in ABAQUS for modelling the MCO beam. Whereas WSPs were modelled as an R3D4 rigid element. This was based on similar previous studies [29]
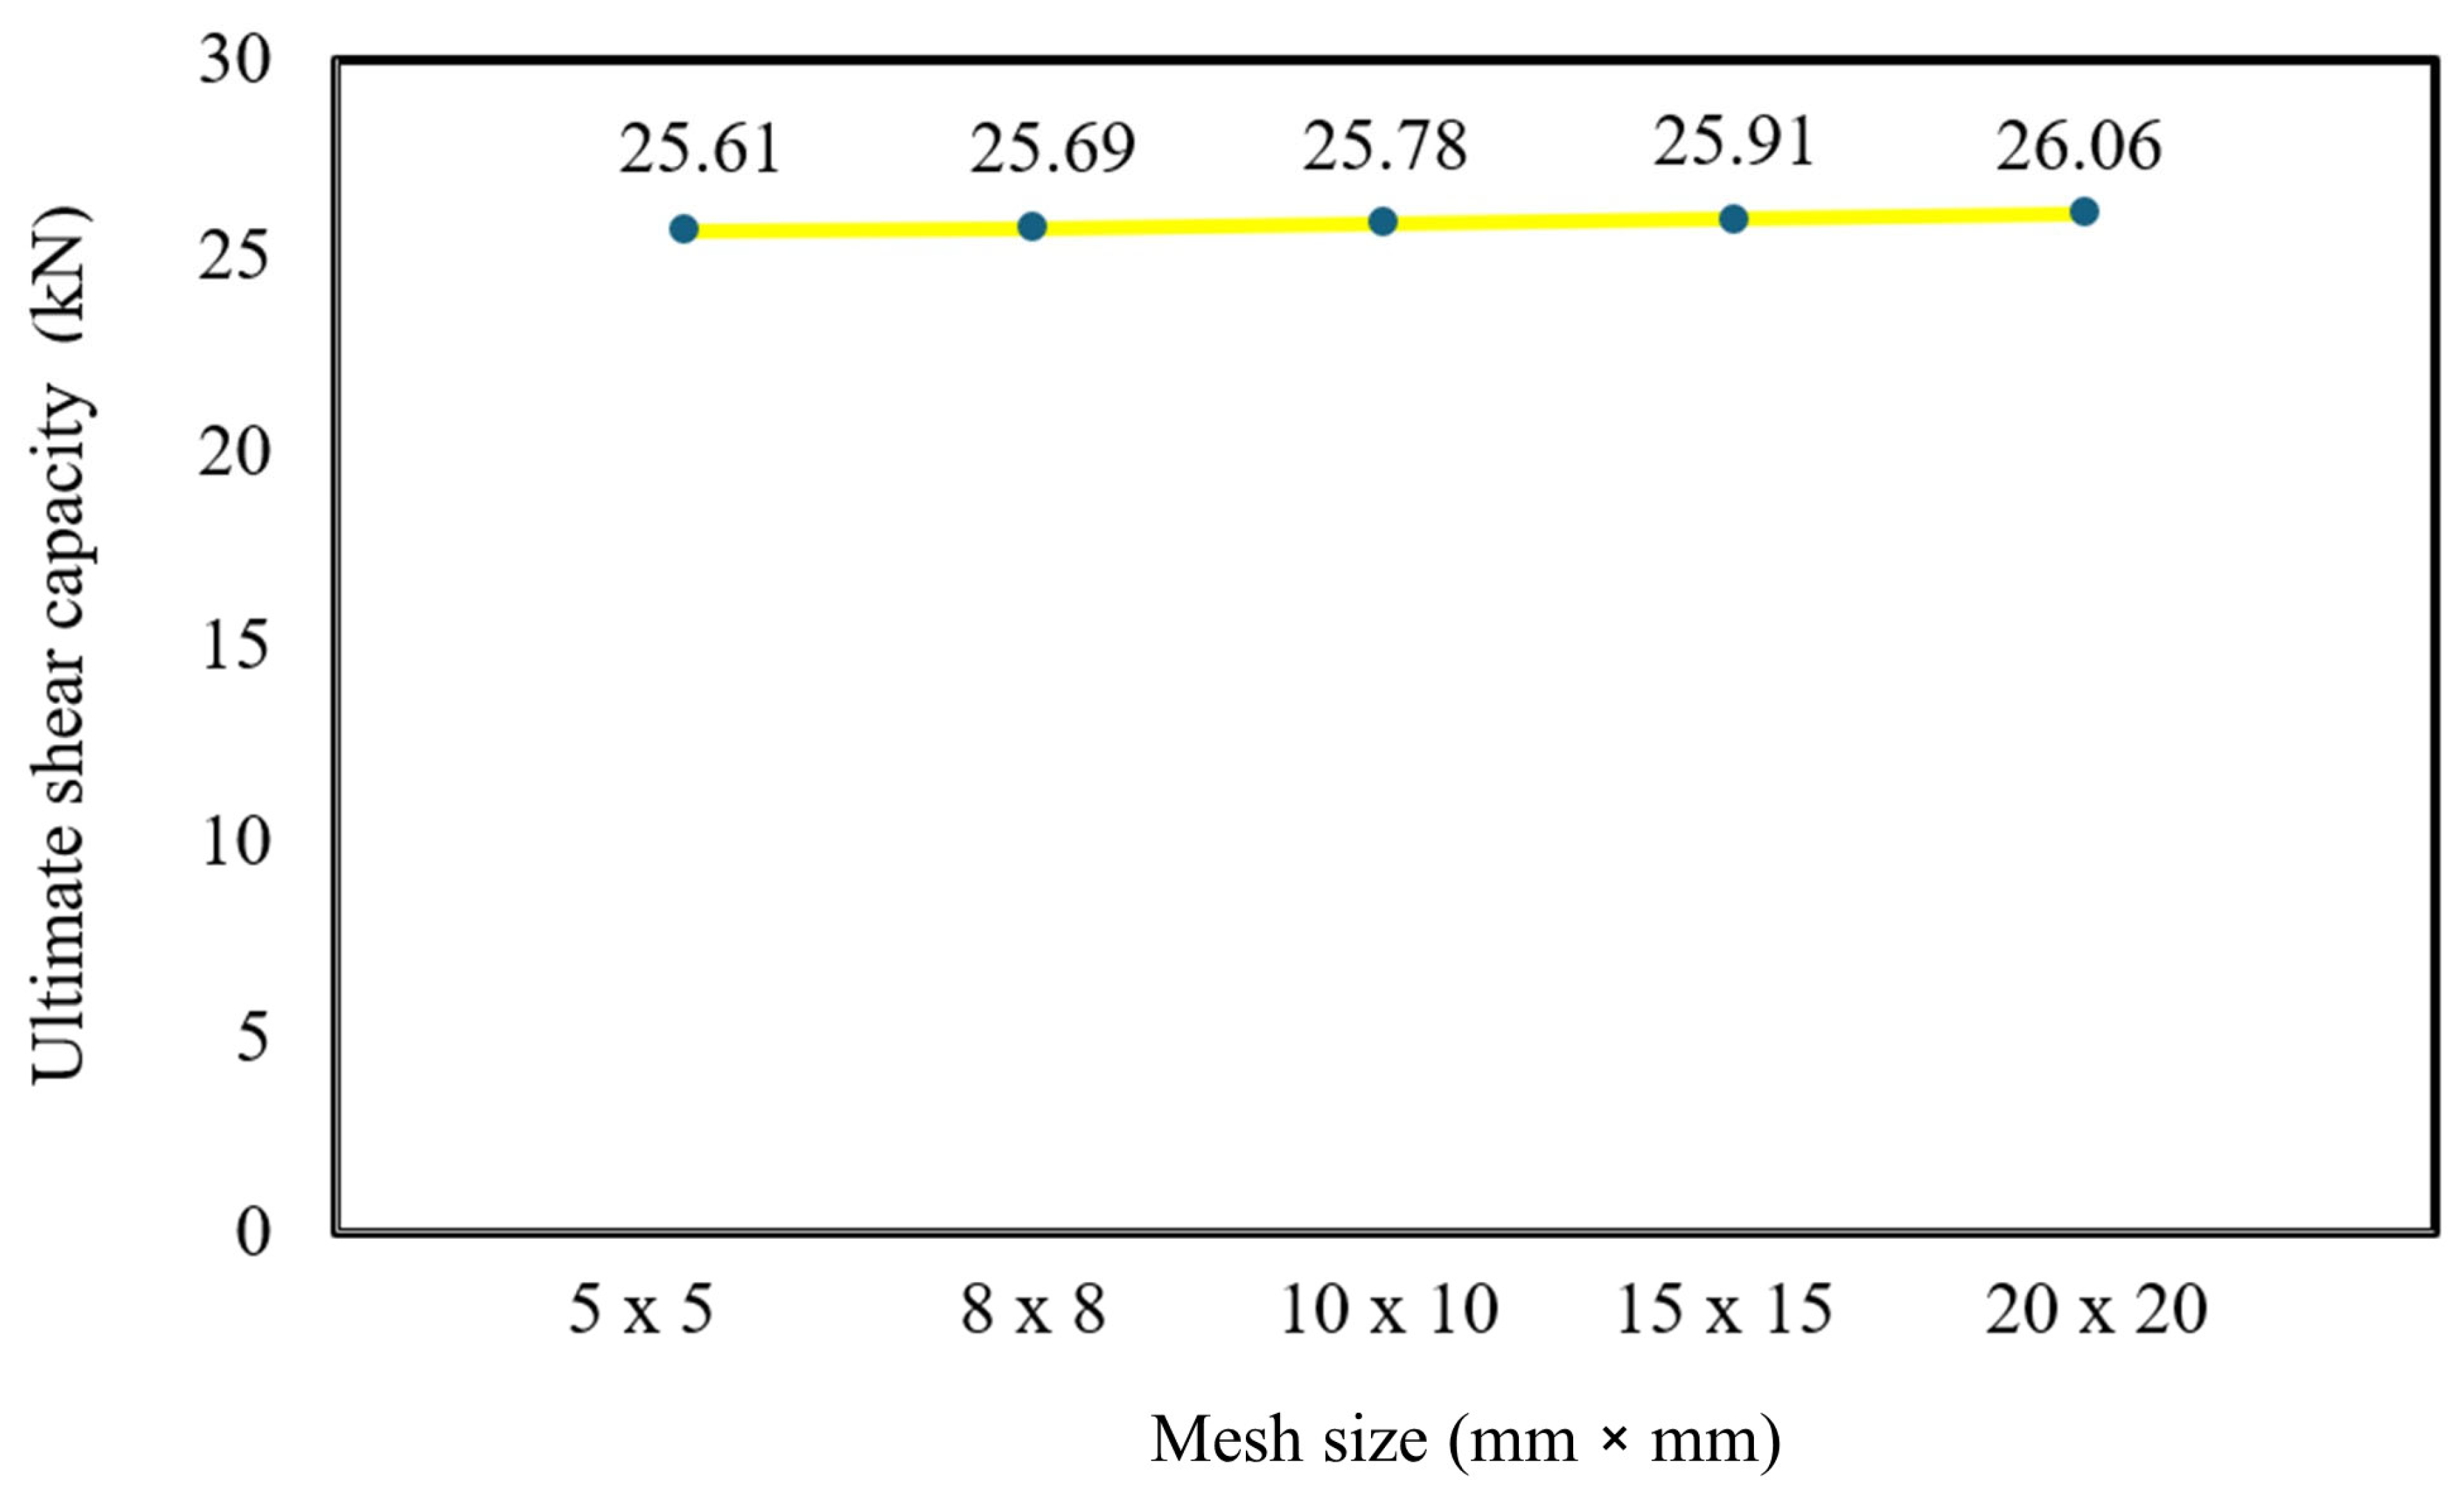
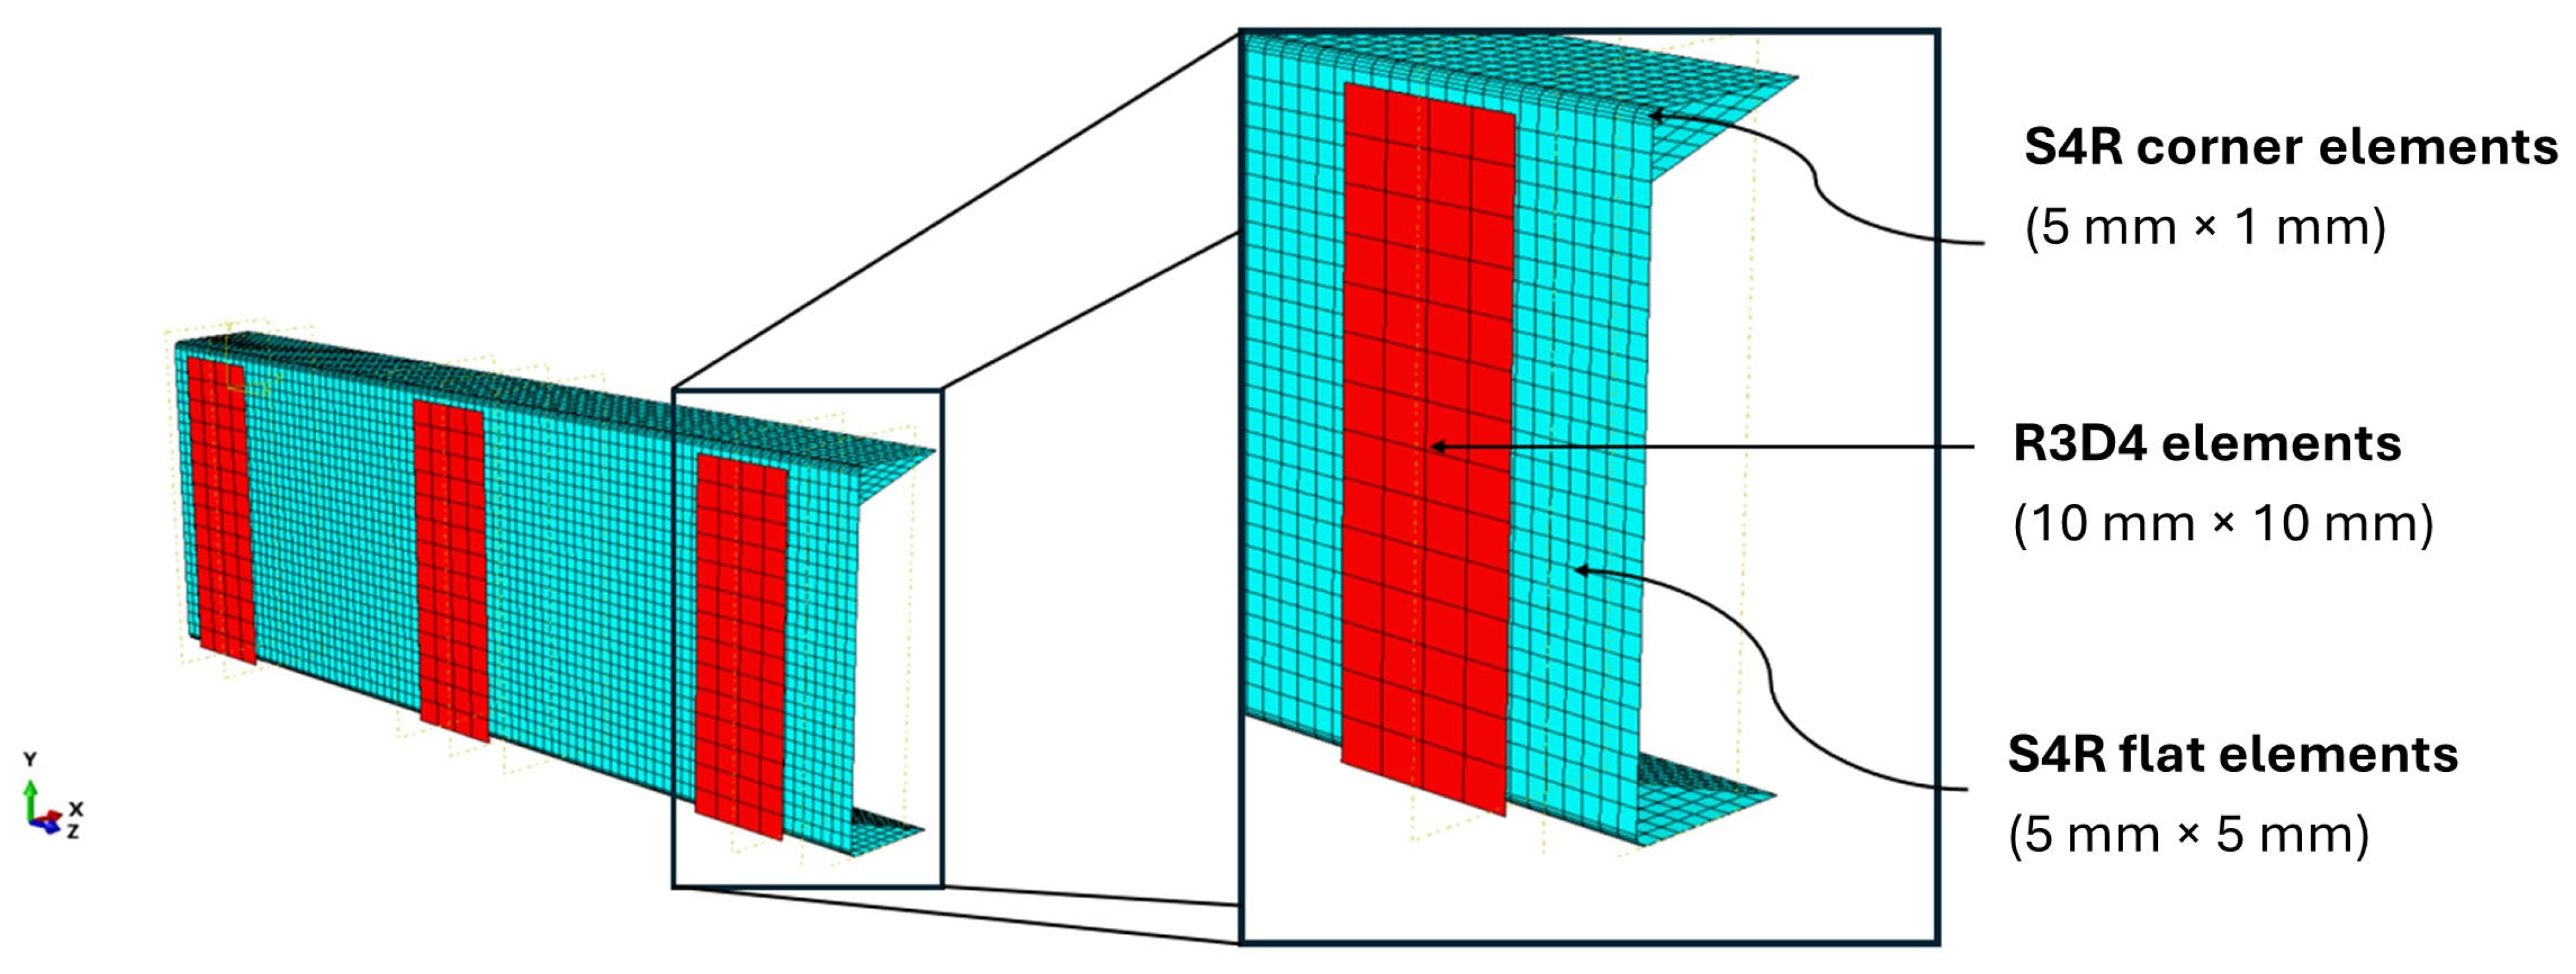
The mesh scheme was developed based on the results of a sensitivity study presented in Figure 2 and previous similar research studies [27]. For the flat region of the MCO beam, a 5 mm × 5 mm mesh size was selected, whereas the corner regions of the MCO beam had a finer mesh of 1 mm × 5 mm, to allow for corner strength enhancement and residual stress effects not to be considered. As corner strength enhancement was found to have little impact on the results, as reported by Wang and Young [29] and Schafer et al. [30]. Furthermore, Schafer et al. [30] concluded that the effects of residual stress and corner strength enhancement can be neglected. A similar concept was included in a study conducted by Perera and Mahendran [31] for the corner regions of hollow flange plate girders. However, for the WSPs, a coarser mesh of 10 mm × 10 mm was utilised, as detailed results for the WSPs were not needed in this research. Figure 3 presents the adopted mesh scheme for the FE models of the MCO beam and WSPs. Following the sensitivity study and based on previous research [28] the adopted mesh scheme was found optimal in terms of computational efficiency and accuracy.

2.2. Material Properties

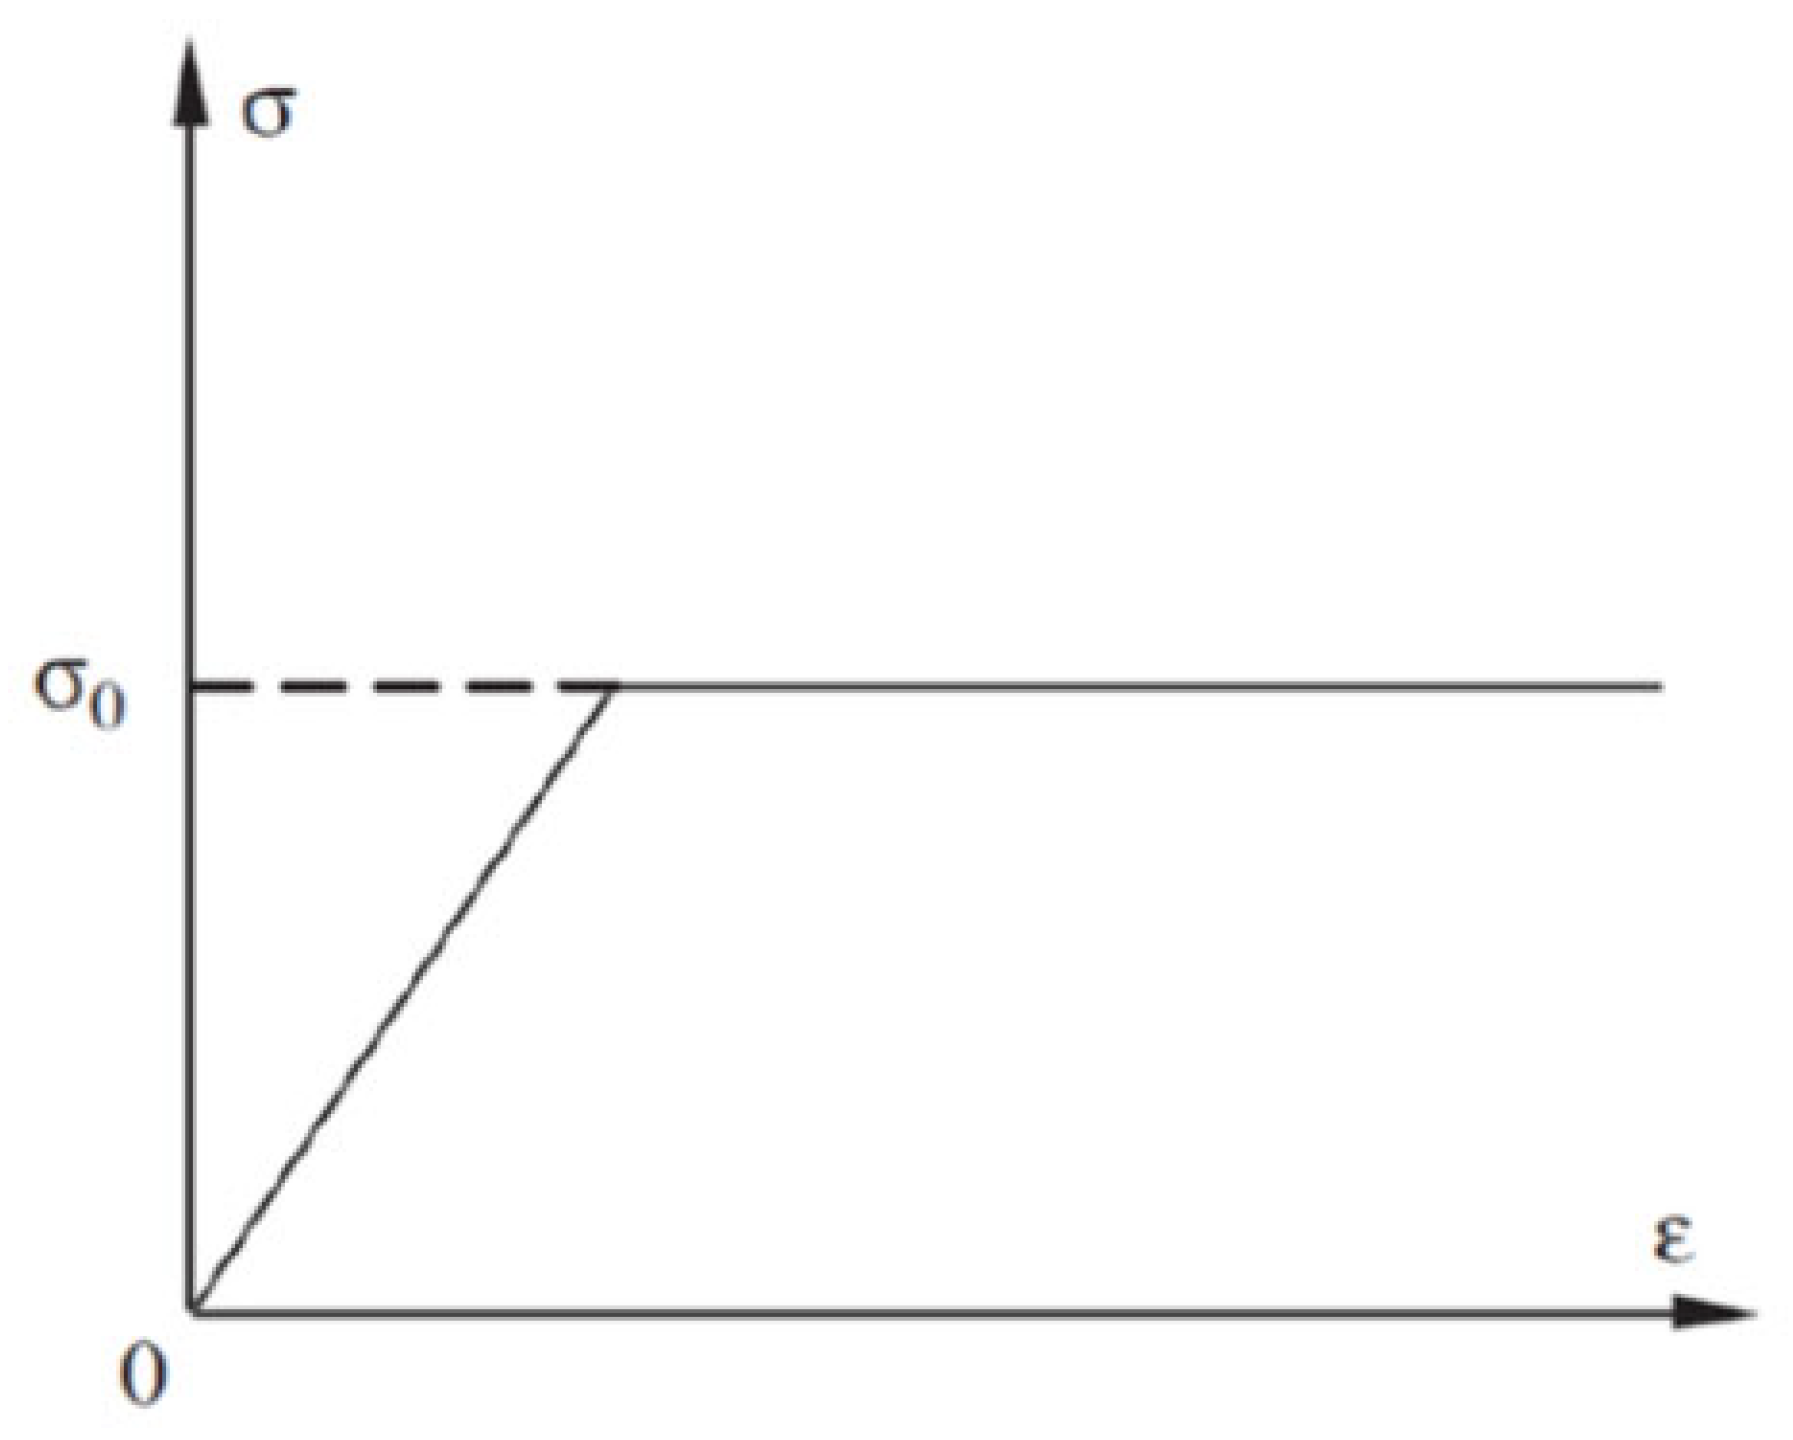
Haidarali and Nethercot [32] demonstrated that strain hardening does not significantly affect the structural behaviour of CFS. Therefore, strain hardening was considered negligible for the developed FE model. A bilinear material model was chosen to represent the stress–strain behaviour of CFS in the numerical modelling. In line with recent research studies [10,20] on the behaviour of CFS sections, an elastic–perfectly plastic material model with nominal yield strength was used to represent the MCO beam; the chosen material model is illustrated in Figure 4. Material properties, such as Young’s modulus and Poisson’s ratio, were assigned values of 200 GPa and 0.3, respectively.

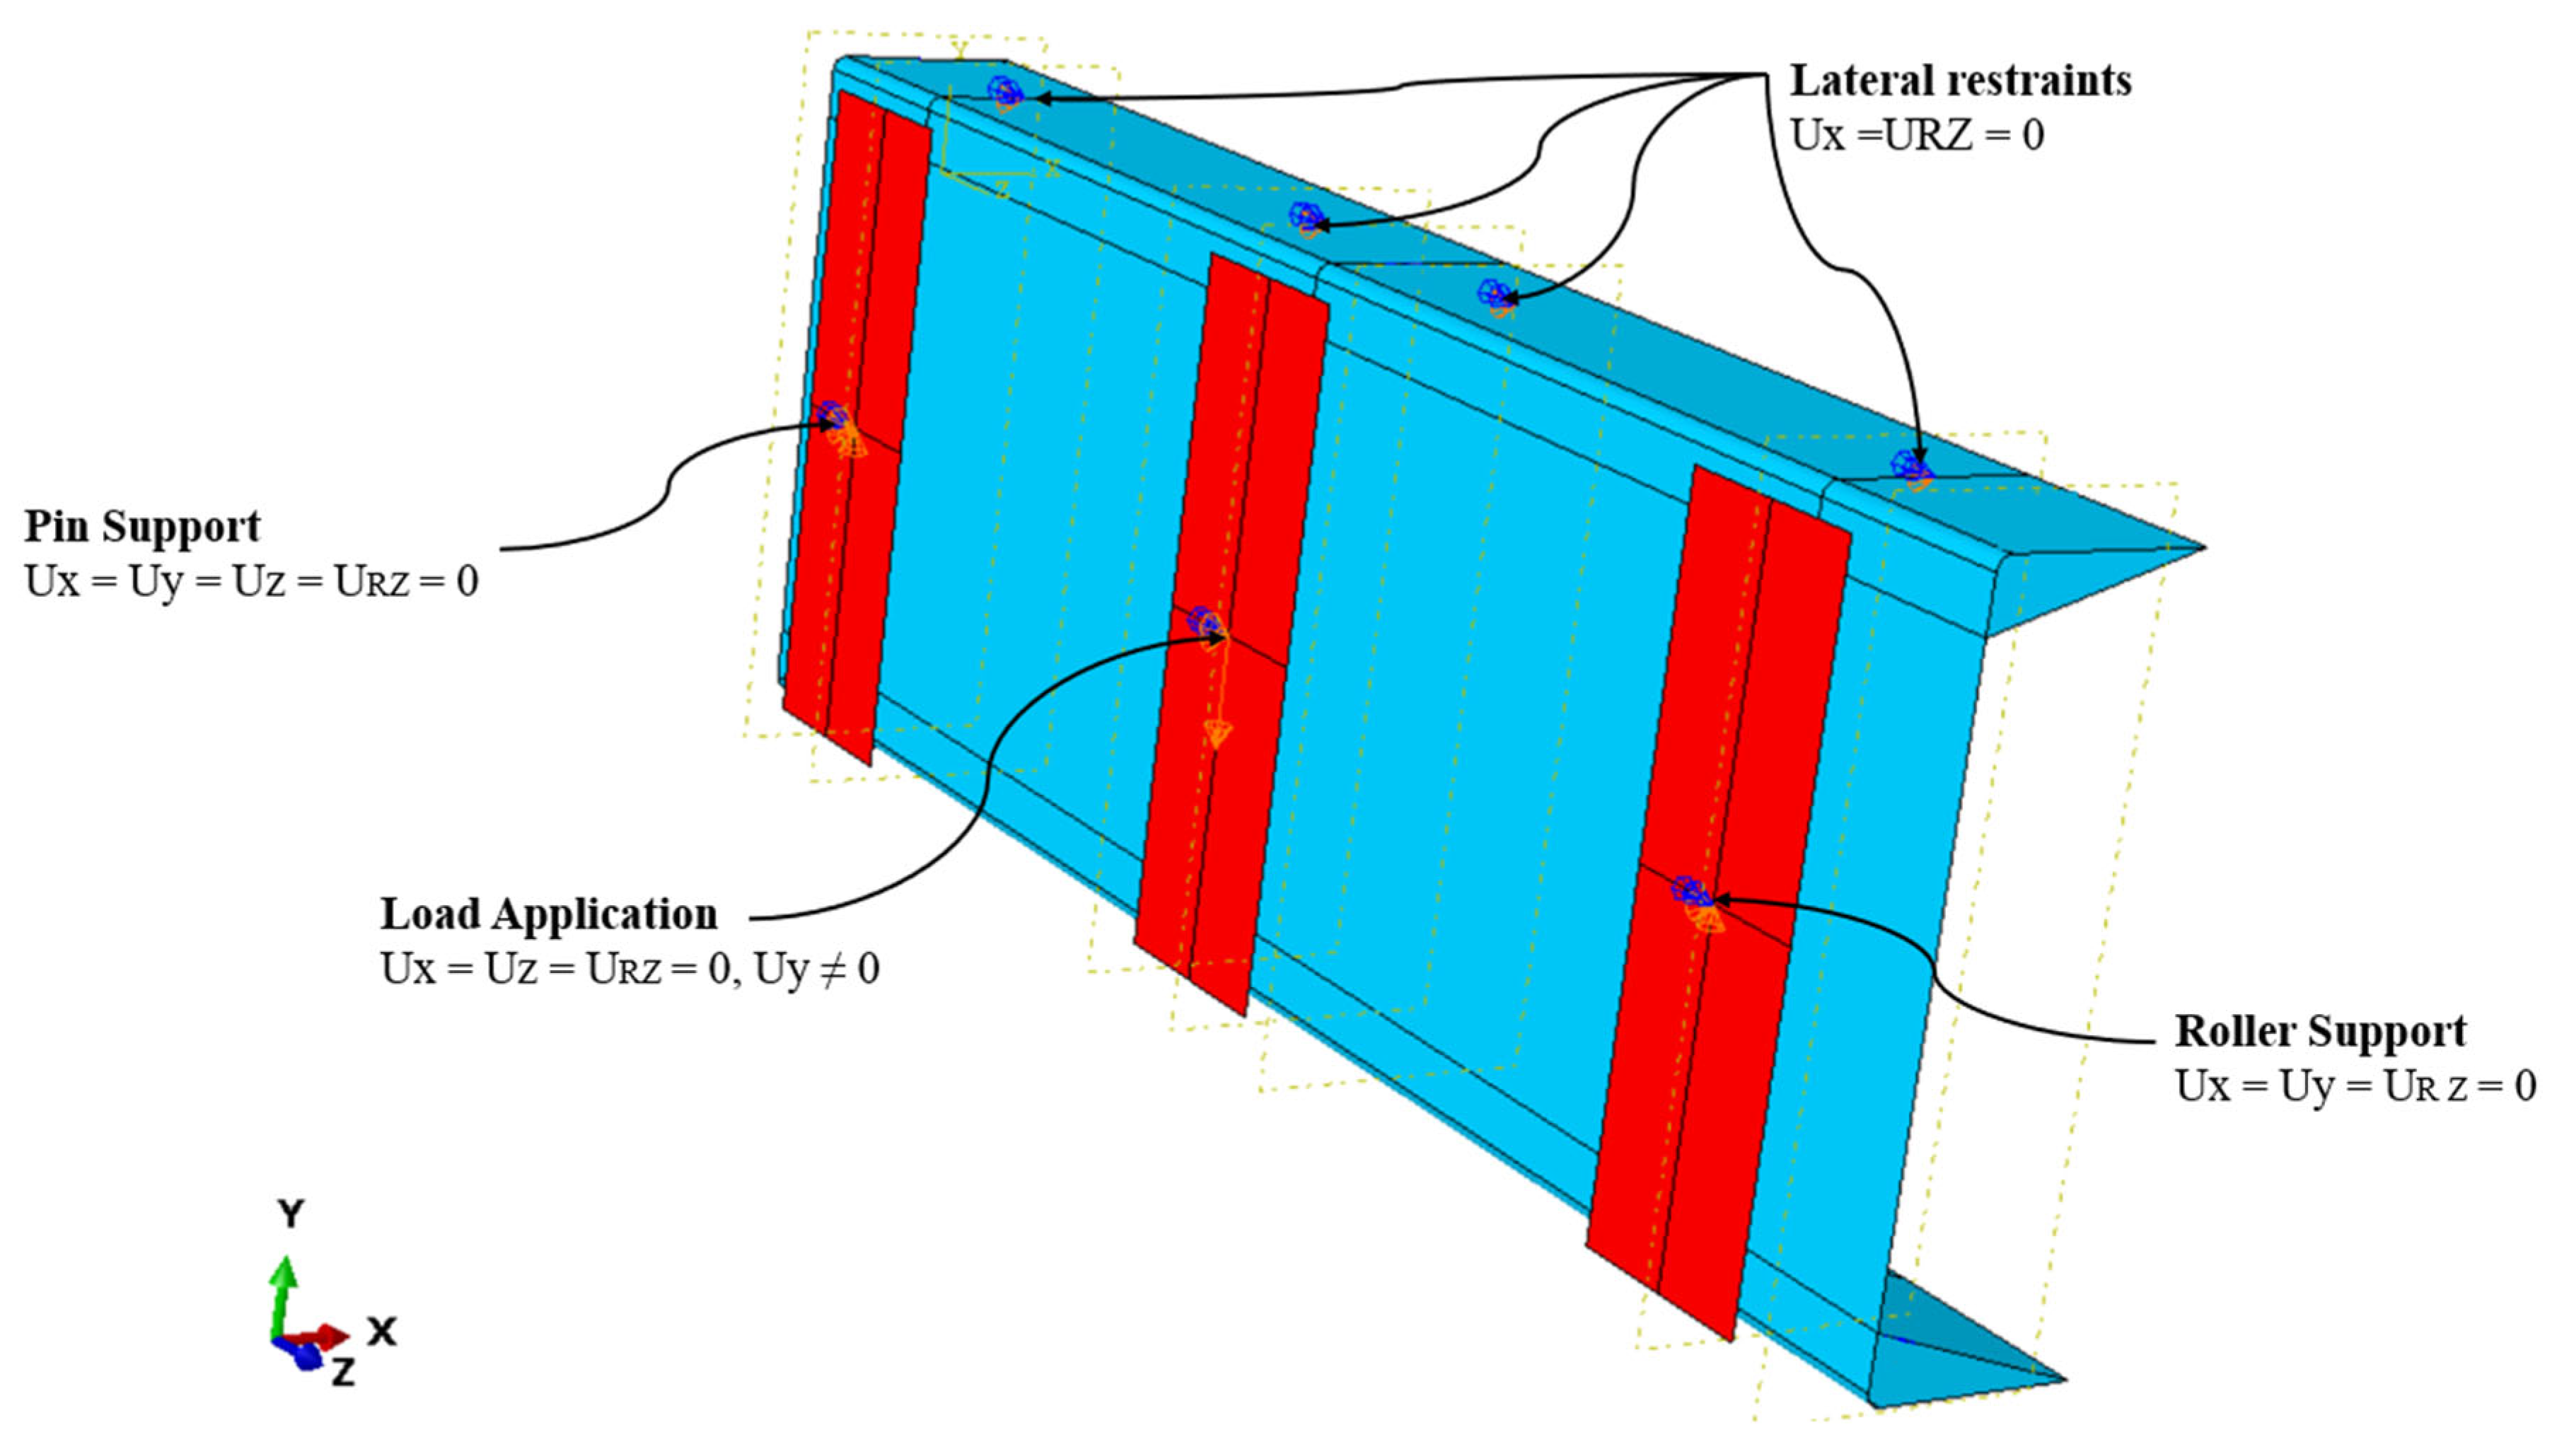
2.3. Load Application and Boundary Condition

The three-point bending setup with simply supported boundary conditions with an aspect ratio of 1.0 was utilised. This is to ensure that the failure mode is predominantly shear and the effects of bending are minimised. Reference points were assigned to the WSPs to assign the boundary conditions as well as the load application. The load application was simulated using the displacement control method based on previous successful research studies [28,33]. Lateral restraints were applied to the top and bottom flanges of the MCO beam. This was based on previous research conducted by Keerthan and Mahendran [12]. A 10% decrease in shear capacity was noted without the application of straps; therefore, straps were applied to reduce unbalanced shear flow as well as prevent distortion of the flanges. The applied boundary conditions and load application are based on similar previous research studies [10]. Figure 5 illustrates the boundary and load application applied to the MCO beam. The ML models were trained on FE data generated for a three-point bending configuration with a fixed shear-span ratio a / d 1 = 1.0 . Accordingly, predictions are intended for interpolation within this setup and the investigated parameter ranges; application to other shear spans or support conditions is outside the scope of the present study.

2.4. Integrating Initial Geometric Imperfection

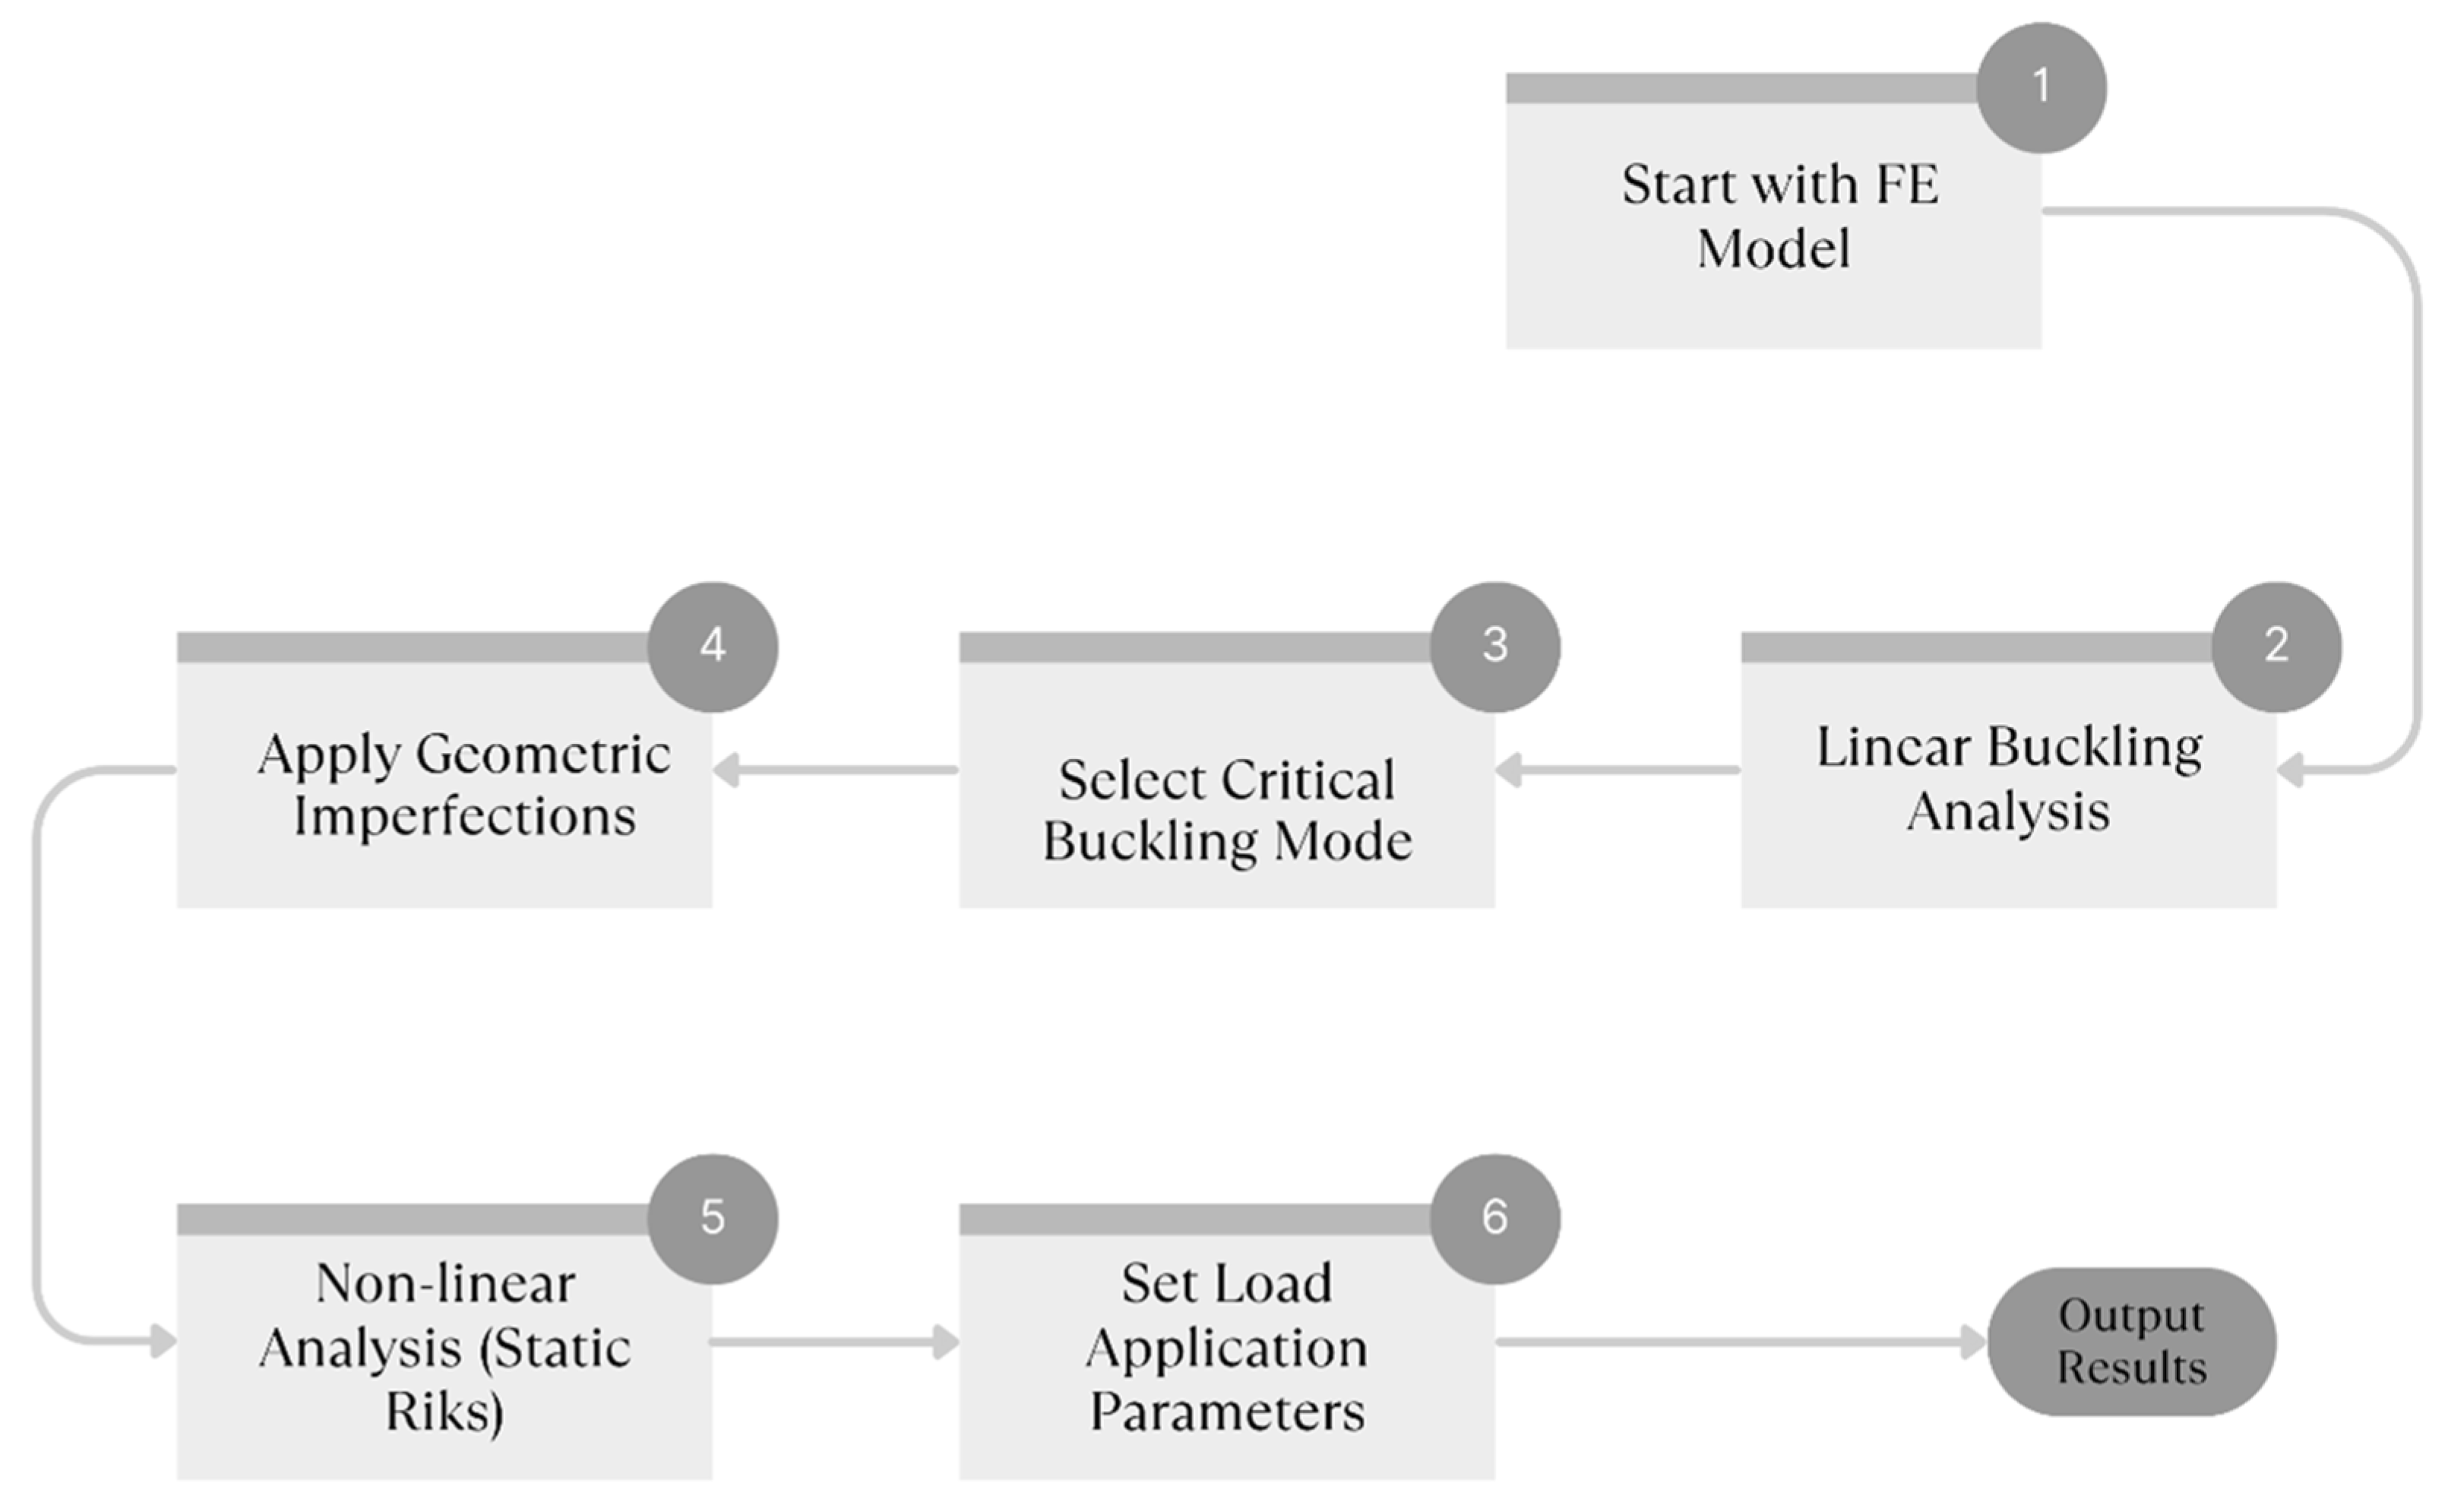
Structural behaviour of the CFS beams is imperfection-sensitive to accurately capture the ultimate shear capacity of the MCO beam; the initial geometric imperfection of the MCO beam was simulated with the choice of buckling modes and magnitudes. The buckling modes were generated using linear buckling analysis, and the critical local buckling mode was selected. The imperfection factor was selected based on the Schafer and Perkoz [30] Cumulative Distribution Function (CDF). The imperfection factor of 0.34 t (where t is the cross-sectional thickness of the MCO beam), a similar imperfection magnitude, was successfully employed by Hadjipantelis et al. [34] to model the CFS beams. The imperfection amplitude was fixed at 0.34 t for consistency across the parametric FE dataset. This represents a modelling assumption and may not capture variability due to manufacturing tolerances; therefore, the FE outputs and the derived ML surrogates inherit this assumption. More importantly, Hadjipantelis et al. [34] successfully used the imperfection factor to study the flexural behaviour of the MCO beam; therefore, it was chosen to be utilised in this study. The critical buckling mode and imperfection factor were applied to the non-linear analysis to obtain the ultimate shear capacity, failure mode and load–displacement curve of the MCO beam.

2.5. Analysis Method

Firstly, a linear buckling analysis was carried out with ten requested eigenvalues. The MCO beam was analysed with a range of buckling modes and magnitudes. Generated using the linear buckling analysis, the critical local buckling mode was selected due to the hollow flanges of the MCO beam preventing distortional buckling of the beam. To accommodate geometric imperfections of the MCO beam, a non-linear analysis was performed to determine the ultimate shear capacity of the MCO beam. For the non-linear analysis, static Riks was used as several research studies have utilised this successfully to analyse CFS sections under different load conditions including shear [32,35]. Load application properties, such as maximum load increments (100), initial increment size (0.01), minimum increment size (1 × 10⁻²⁵), maximum increment size (1.0), and total time (1.0), were based on previous research studies [10]. Figure 6 summarises the FE procedure.

2.6. Validation Procedure

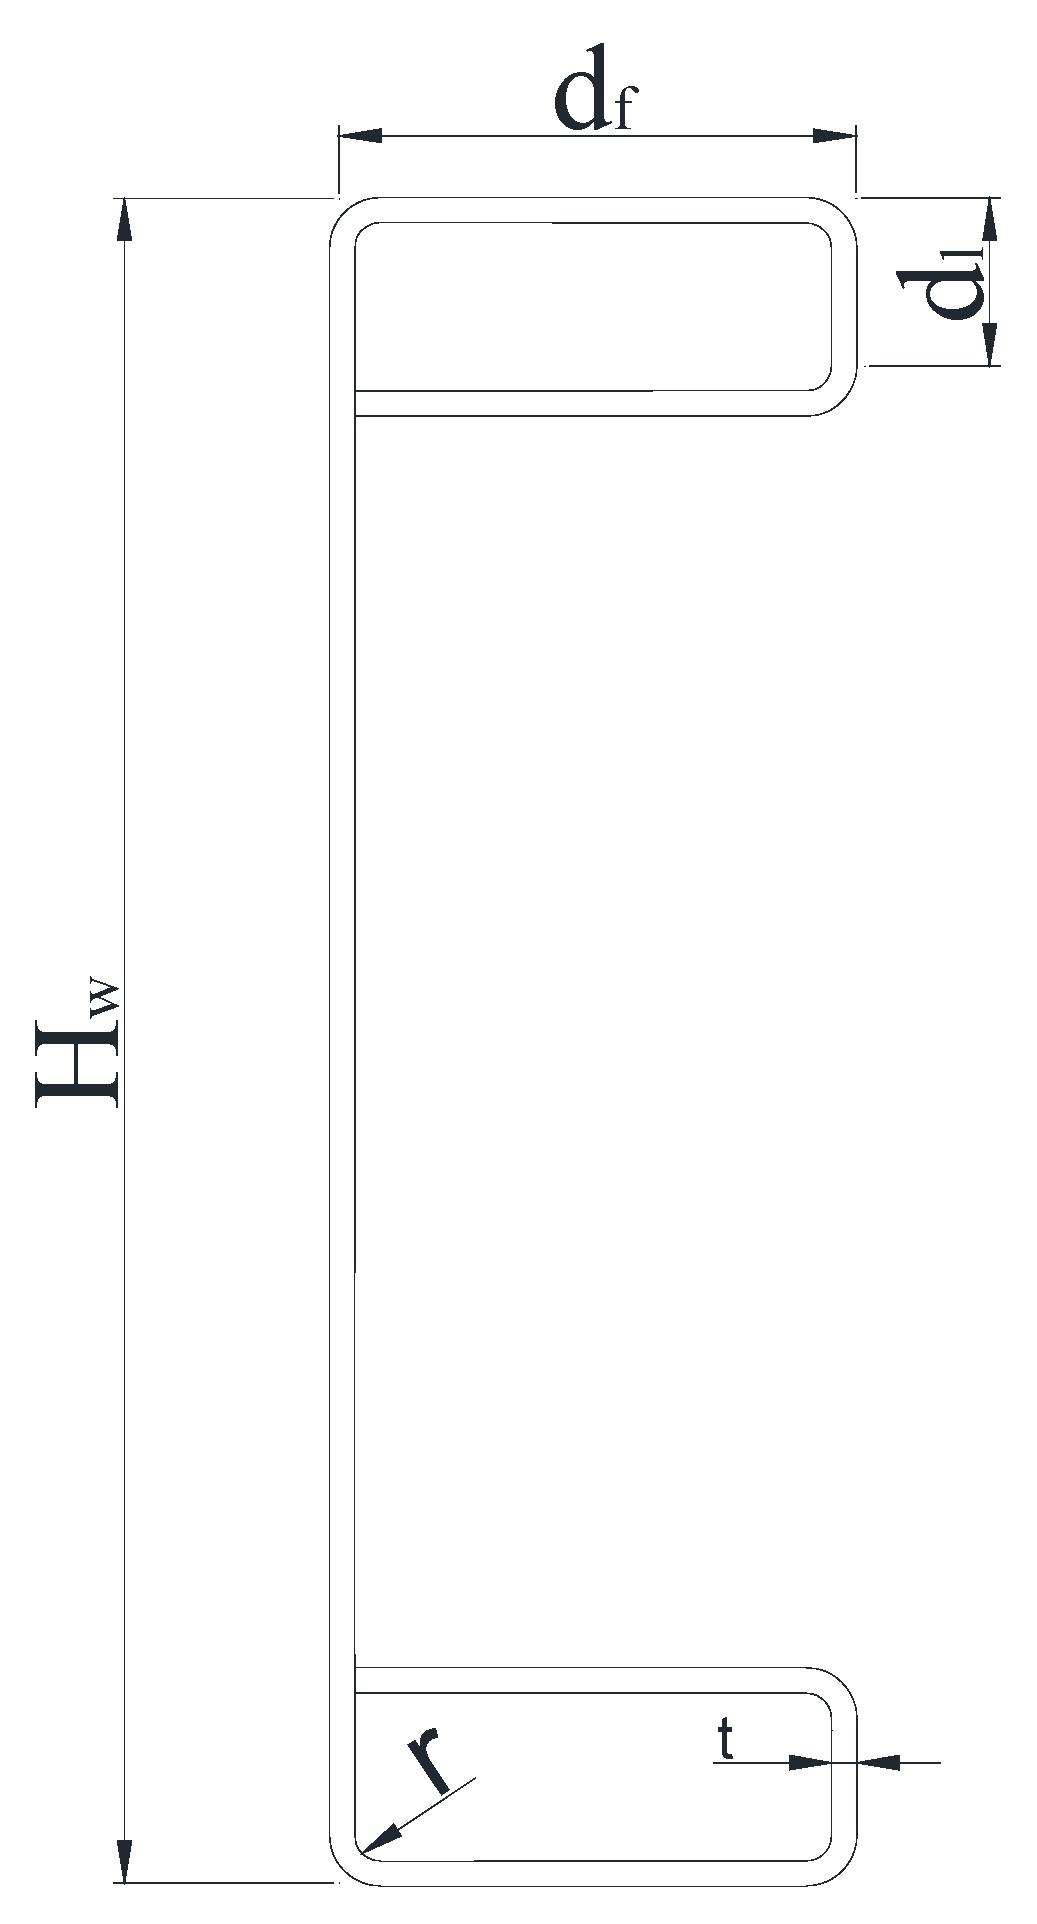
To ensure the reliability of the developed FE model, validation was performed by verifying key parameters such as element type, mesh size, boundary conditions, and loading conditions. The developed FE model was compared with experimental results to assess its accuracy in predicting ultimate shear capacity, failure mechanisms, and load–displacement behaviour. Keerthan and Mahendran’s [36] three-point shear tests of the LSB were considered due to these being similar sections to the MCO beam considered. This was chosen to cover a wide range of parameters and ensure the reliability of the developed FE model. Figure 7 illustrates LCB and LSB cross-sections and notation. Table 1 presents a summary of the validation procedure.
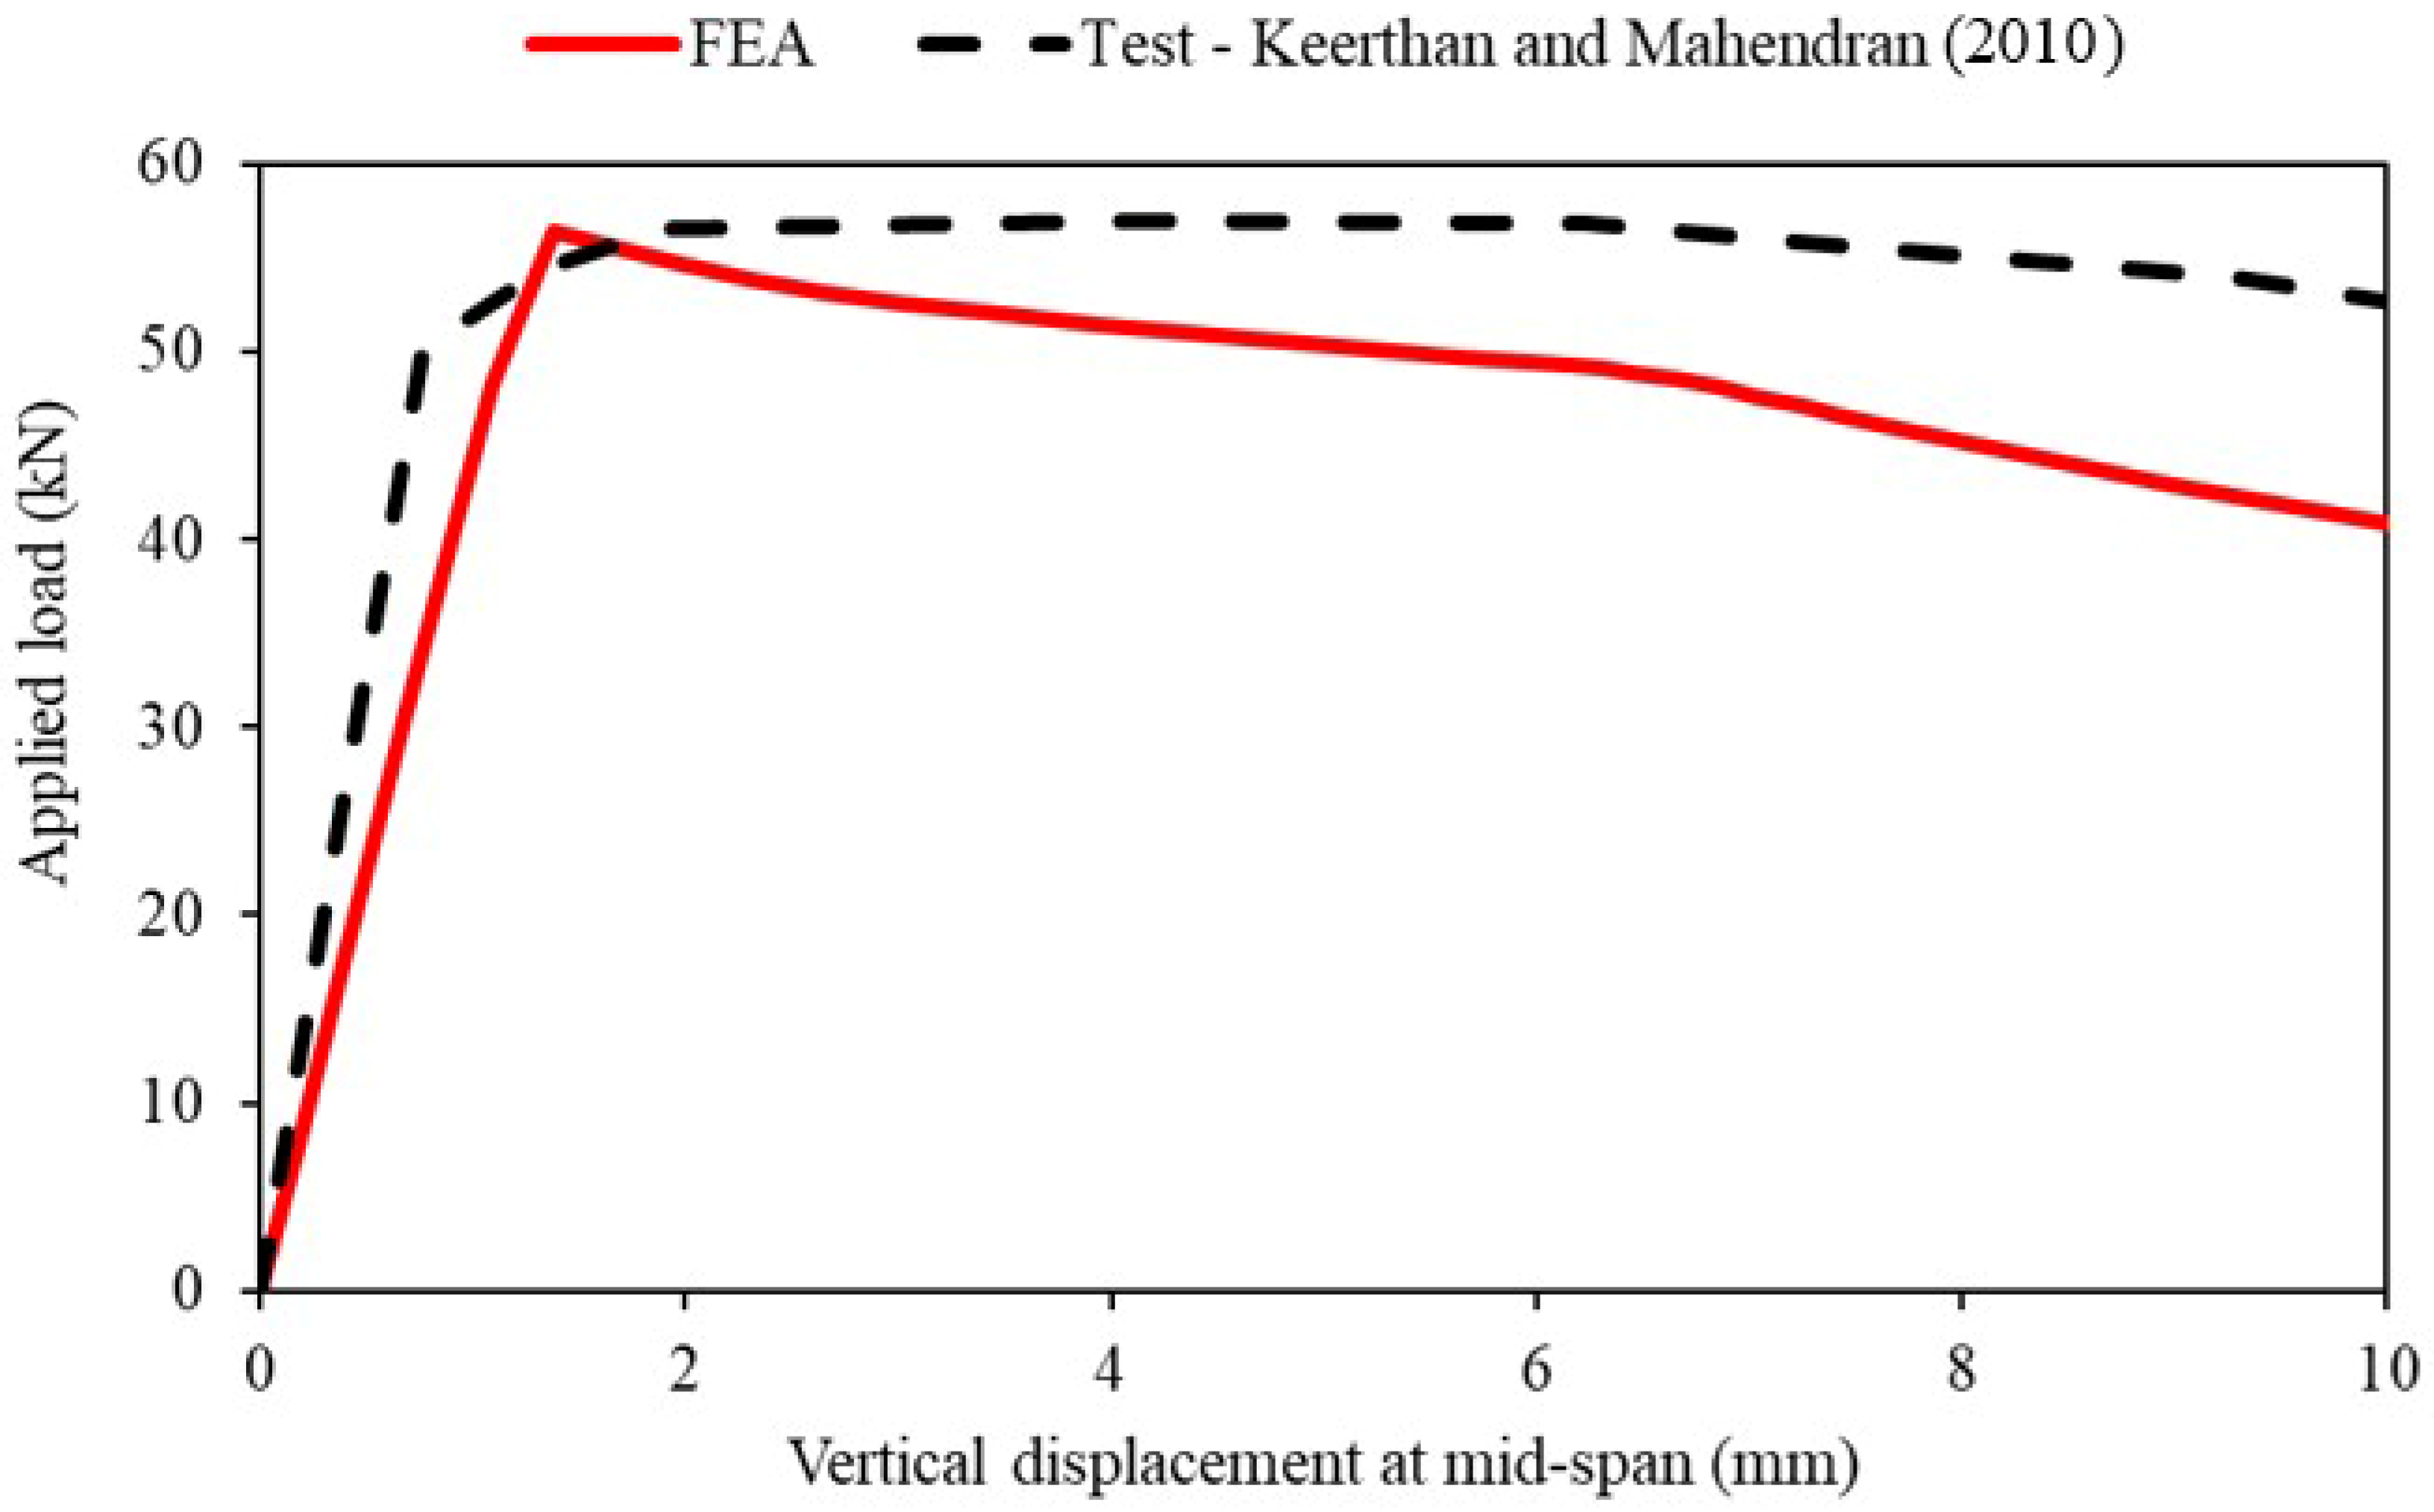
Ultimate shear capacities, failure modes and load–displacement curves taken from the developed FE models displayed a high degree of accuracy when compared to test outcomes, with a corresponding mean value of 0.99 and a Coefficient of Variation (COV) of 0.03 for the LSB. Furthermore, illustrated in Figure 8, the shear-displacement curves and the difference in load–displacement curve comparison are due to initial slip in experiments which were not incorporated in the FE models. Figure 9 presents a failure mode that is in close agreement with the experimental failure mode reported in [36]. Overall, the comparison between FE and the test shows a high degree of accuracy when considering ultimate shear capacity, load–displacement curve and failure modes. Therefore, based on the validation procedure, it was found that the adopted FE model was accurate to replicate test conditions with a high degree of accuracy; therefore, the developed FE model was utilised for the numerical modelling.
Although different failure stages and mechanisms are discussed in the FE framework, the ML models in this study use a single regression target ( V u ) and therefore do not explicitly distinguish between yielding-dominated and shear-buckling-dominated cases. As a result, the reported ML performance reflects average predictive capability across the mixed failure modes represented in the dataset.

2.7. Parametric Study

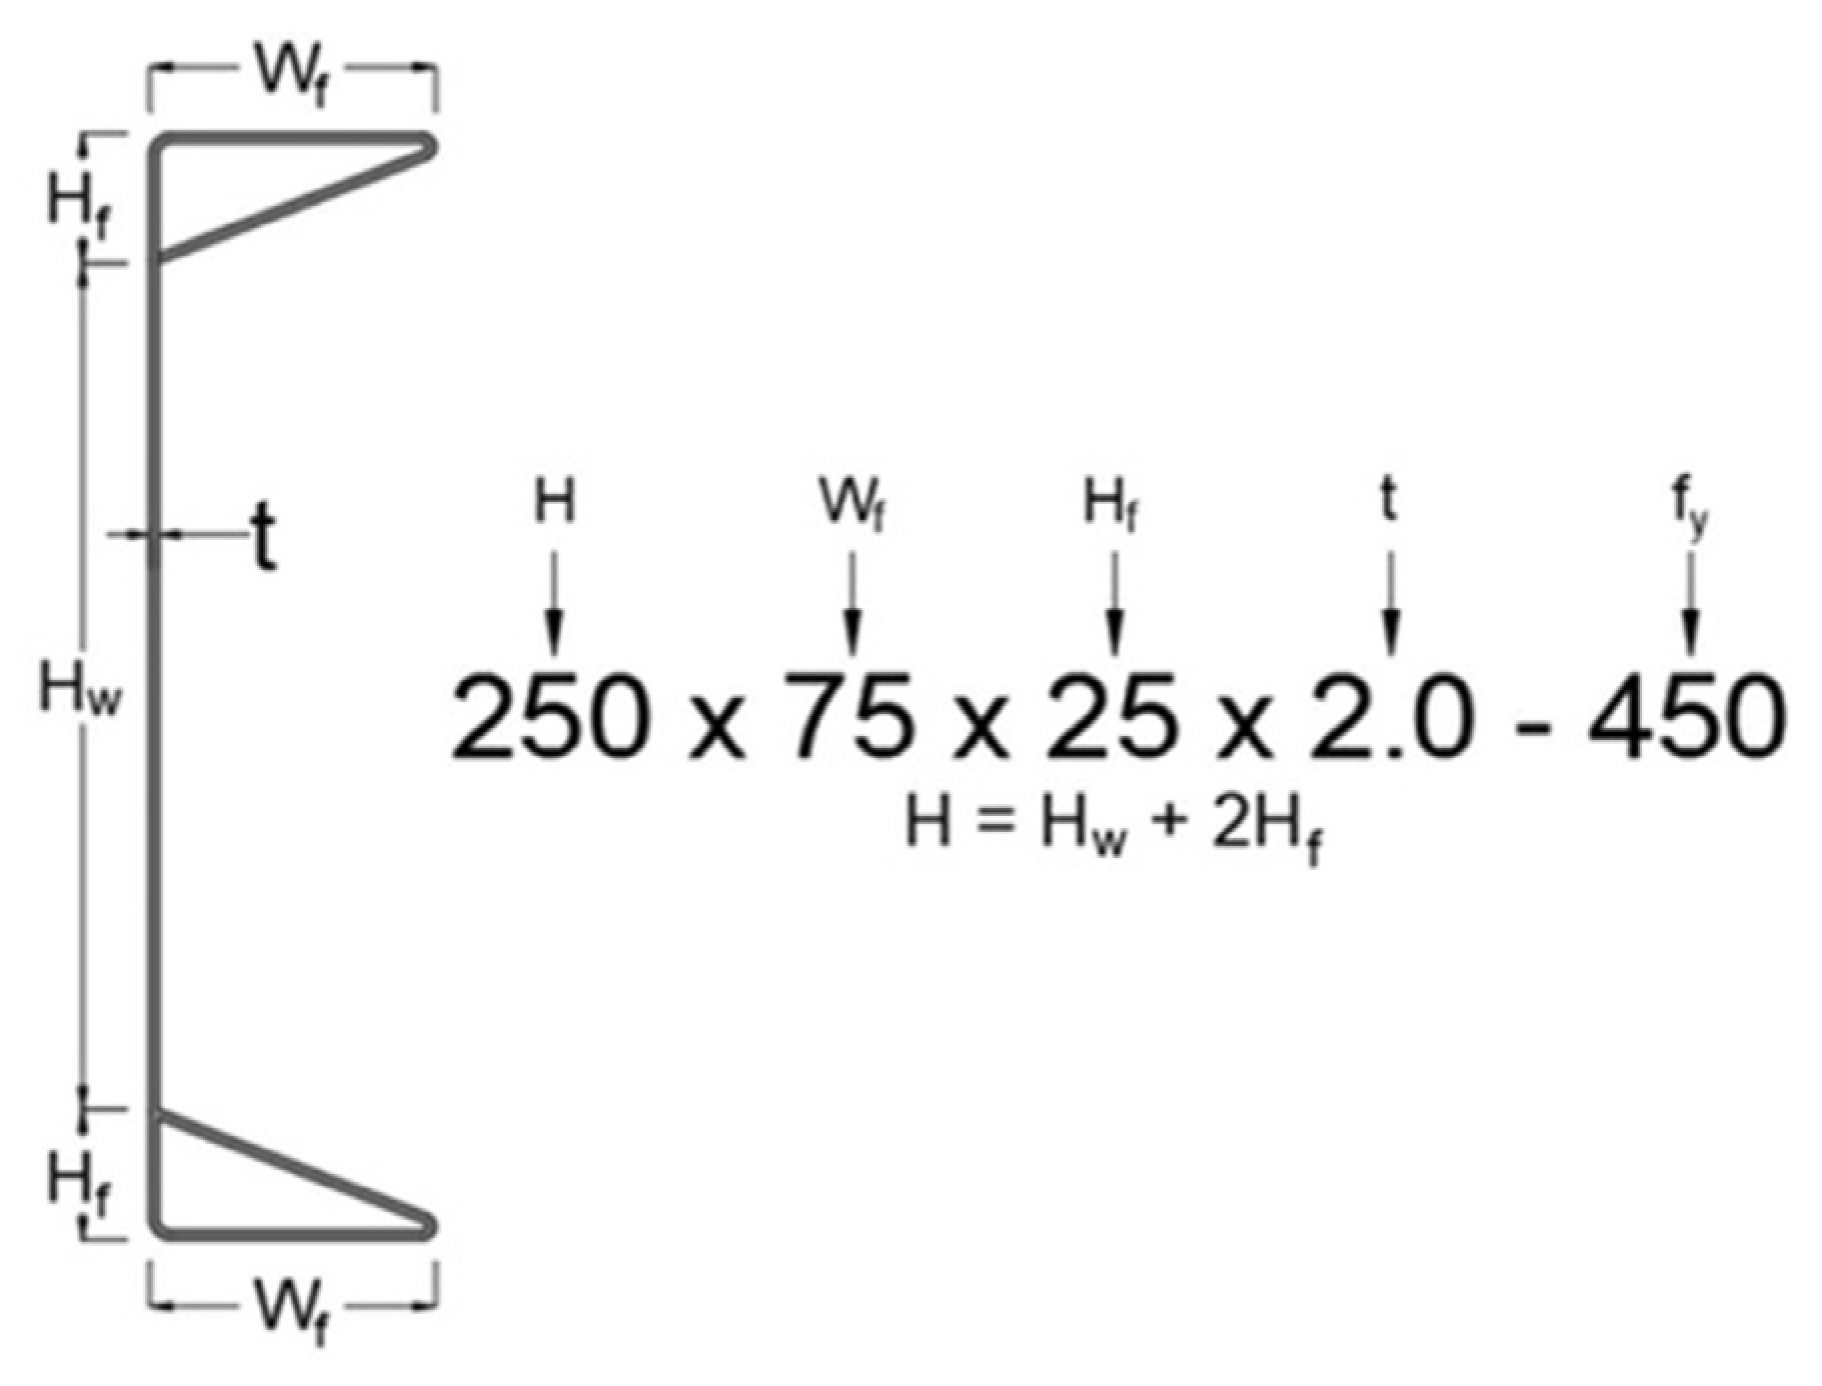
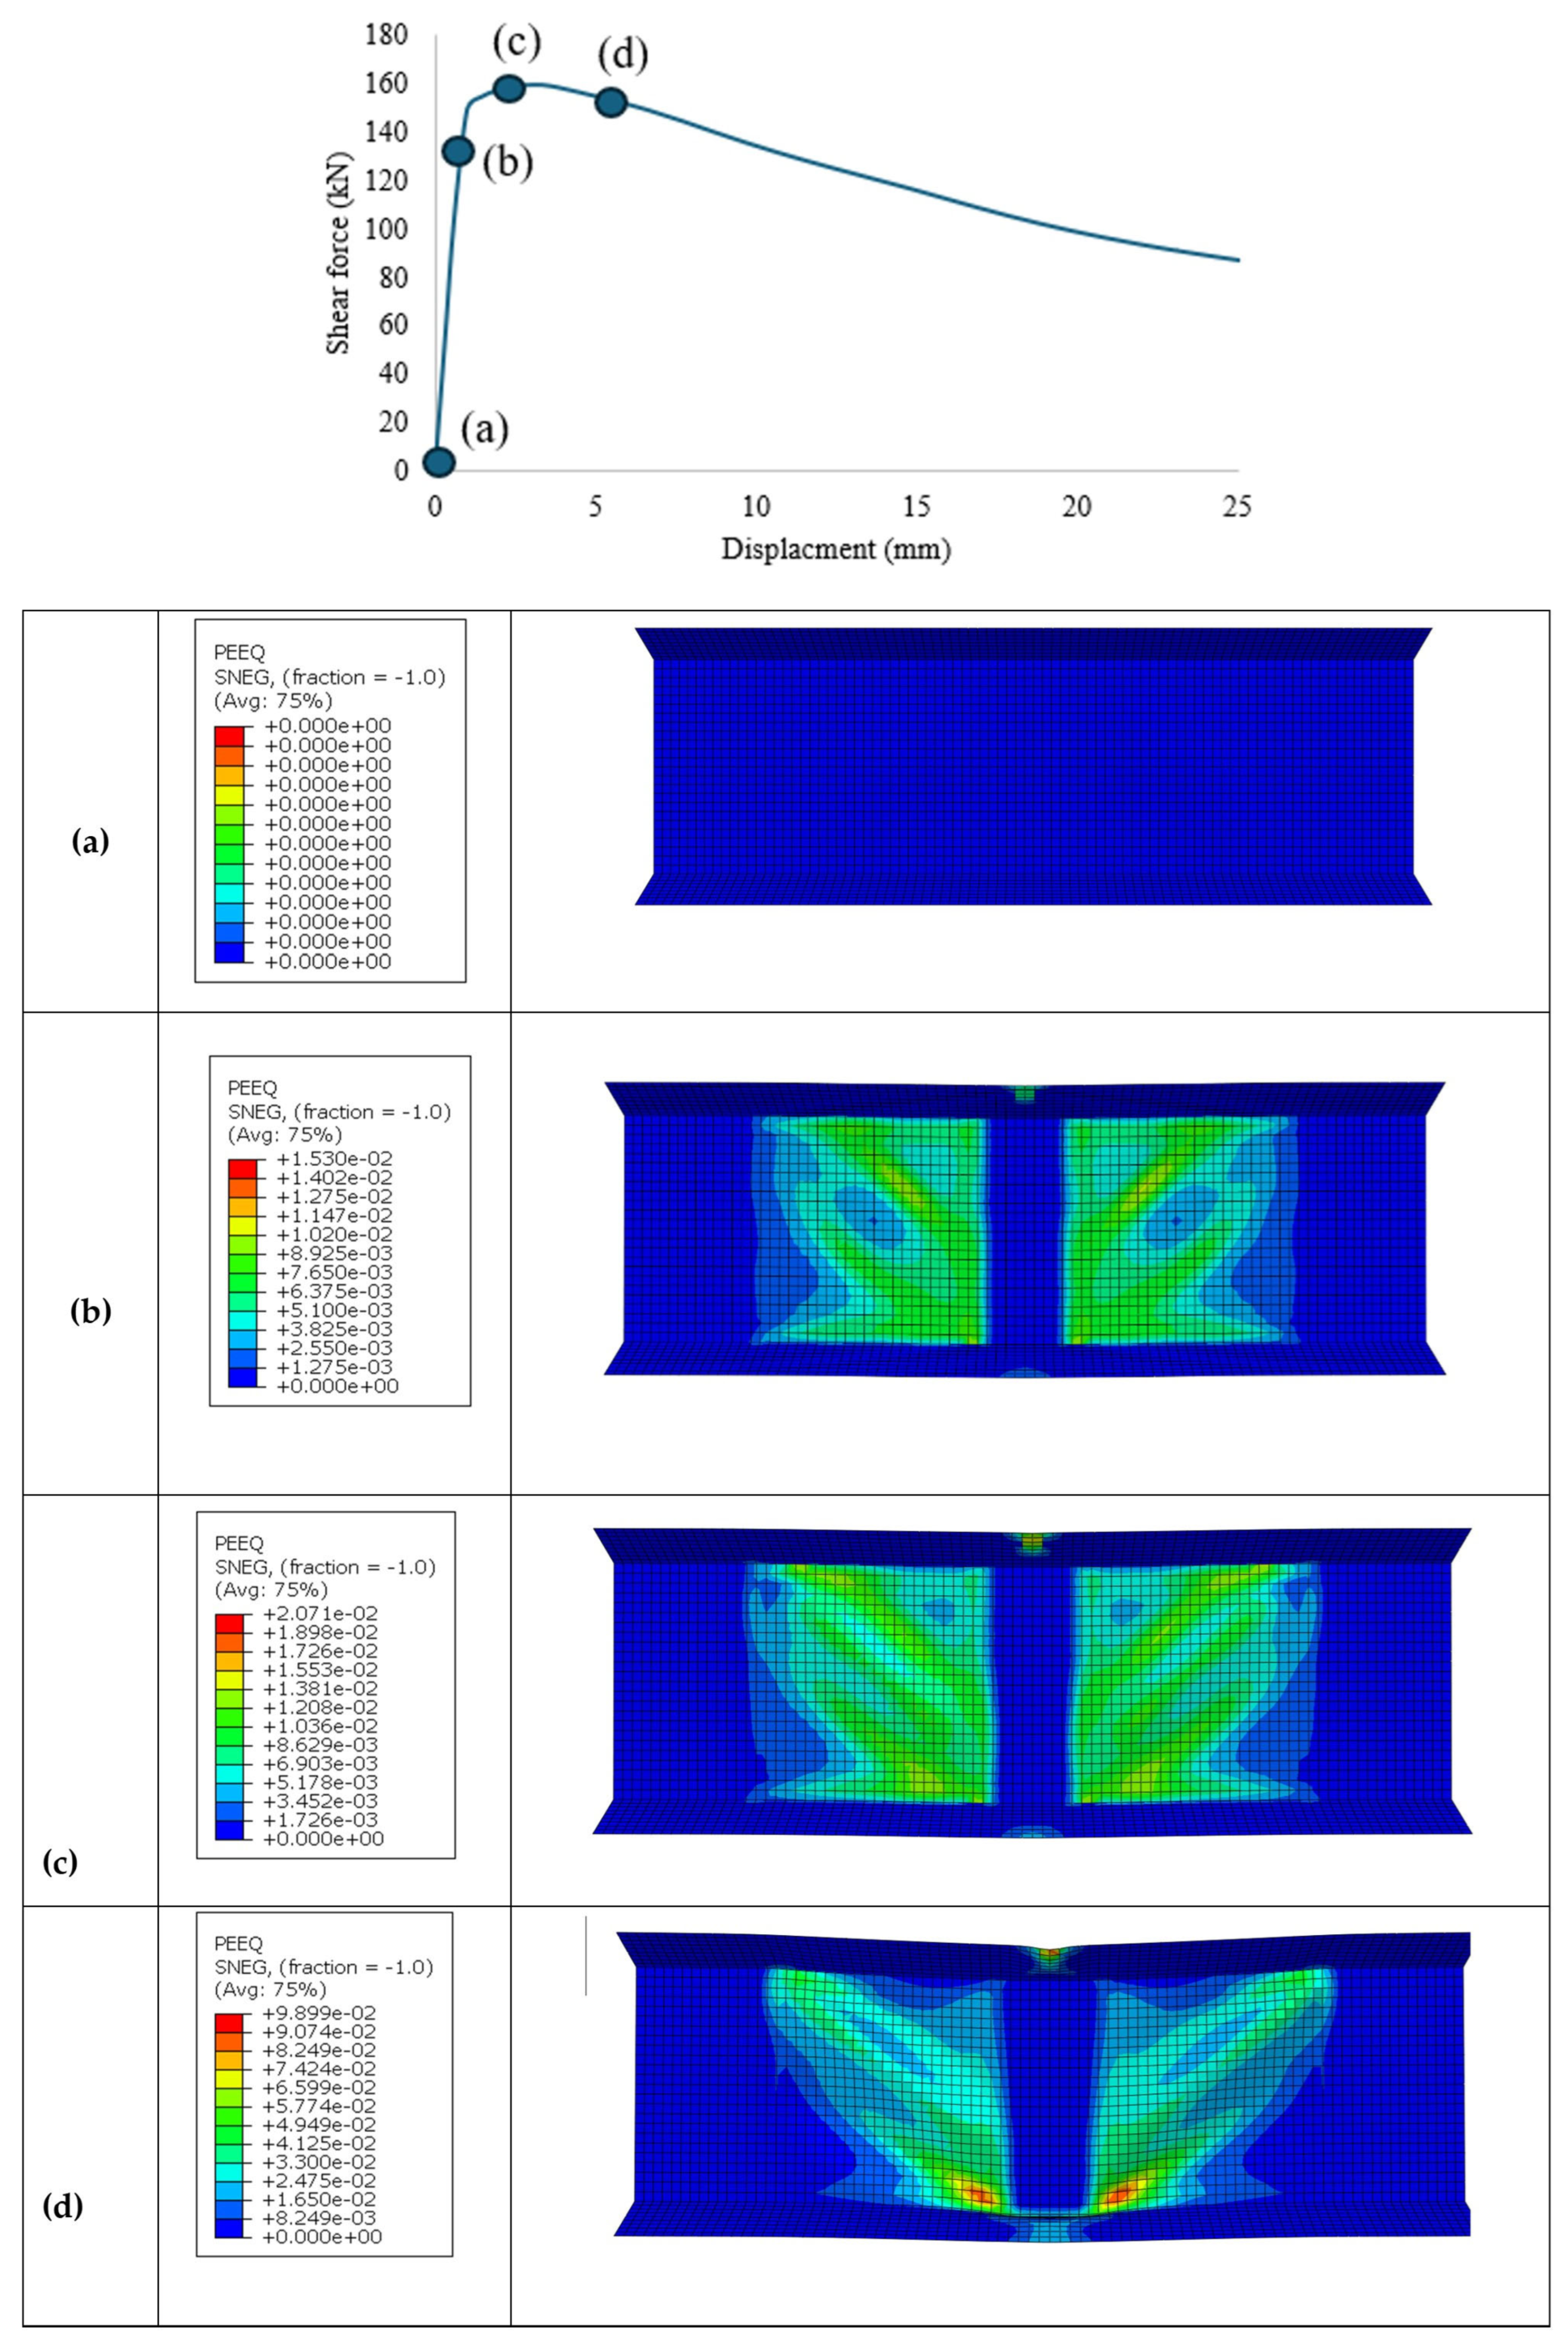
A comprehensive parametric study was conducted to predict the shear behaviour of the MCO beam. Key parameters such as cross-section dimensions, yield strength and thickness were considered based on. Also, an aspect ratio of 1.0 was used to allow for a predominant shear failure to occur. The developed parametric study was based on standard LSB sizes [10,36] as well as based on standard sections and parameters with allowable slenderness values considered in current design standards including Eurocode [37]. Figure 10 illustrates the cross-section and notation of the MCO beam, and Table 2 details the parametric study. Furthermore, 105 FE models were developed to determine the shear behaviour and ultimate shear capacity of the MCO beam. Figure 11 illustrates the typical failure mechanism of the MCO beam under shear. Considering initial loading, pre-failure, failure and post-failure modes referred to the shear–displacement curve with the section 150 mm × 45 mm × 15 mm × 3.0 mm with 600 MPa considered.

3. Methodology

3.1. Selected Machine Learning Algorithms

3.1.1. Overview

To predict the ultimate shear capacity of MCO beams, six supervised machine learning algorithms were employed: Artificial Neural Network (ANN), Adaptive Boosting (AdaBoost), Gradient Boosting Machine (GBM), Light Gradient Boosting Machine (LightGBM), Categorical Boosting (CatBoost), and Extreme Gradient Boosting (XGBoost). These algorithms fall into two main categories: ANN as a neural network-based model, and the others are decision tree-based ensemble learning methods. ANN is well-suited to capturing complex non-linear relationships between input variables and structural response and has been shown to be effective for modelling the shear behaviour of modular steel elements in numerous studies [19,38]. By contrast, boosting algorithms iteratively combine multiple weak learners to improve predictive accuracy and have been shown to be effective in handling heterogeneous inputs and assessing variable importance in numerous studies [20,39,40]. The inclusion of both neural and ensemble-based methods ensures comprehensive modelling capability. ANN is advantageous for identifying smooth trends in the data, while boosting models are more adept at capturing discrete interactions arising from factors such as joint configurations, stiffeners, and sectional geometry. These algorithms have been successfully applied in prior structural engineering studies [19,20], supporting their suitability for assessing MCO beam shear performance.

3.1.2. ANN Model

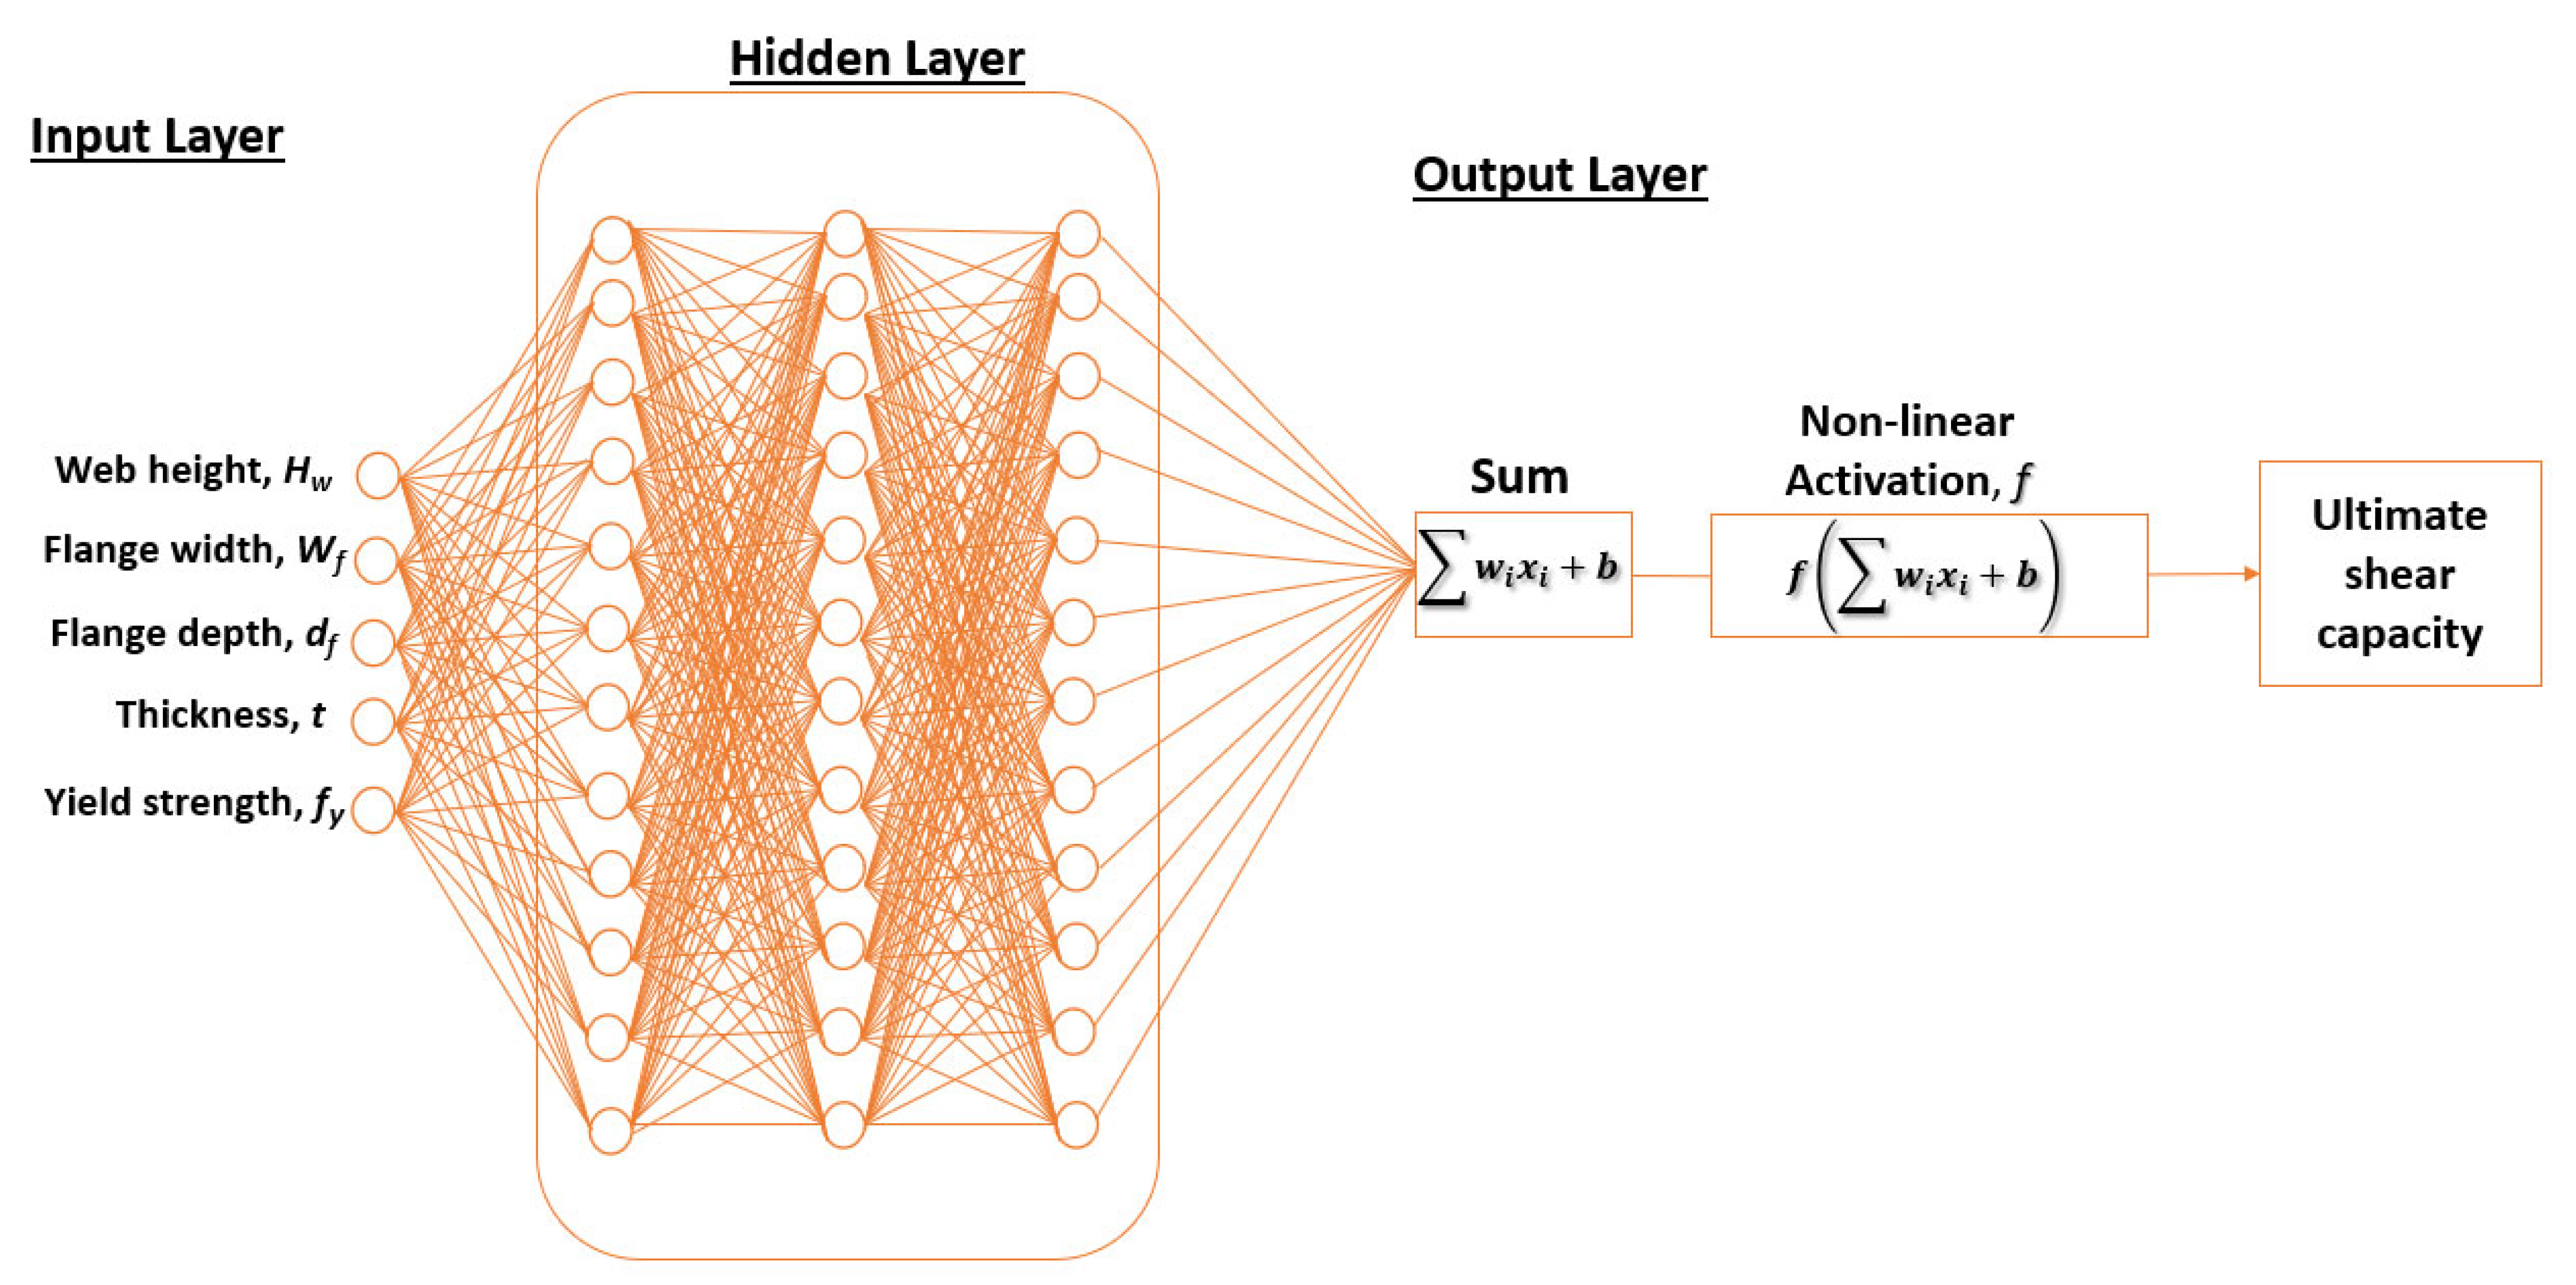
ANNs are inspired by biological neural systems and comprise interconnected layers of nodes (neurons), each linked by weighted connections. Their core computational mechanisms are forward propagation and backpropagation. In forward propagation, input data are linearly combined through weights and passed through non-linear activation functions (such as ReLU or Sigmoid) across hidden layers to produce an output prediction (Figure 12).
During training, backpropagation employs gradient descent to compute the derivatives of a loss function, updating the model weights iteratively via the chain rule. This enables ANNs to model complex, high-dimensional, and non-linear relationships between variables. However, ANNs typically require large datasets and substantial computational resources and are often treated as “black-box” models due to limited interpretability when compared to ensemble models with decision trees.

3.1.3. Tree-Based Ensemble Models

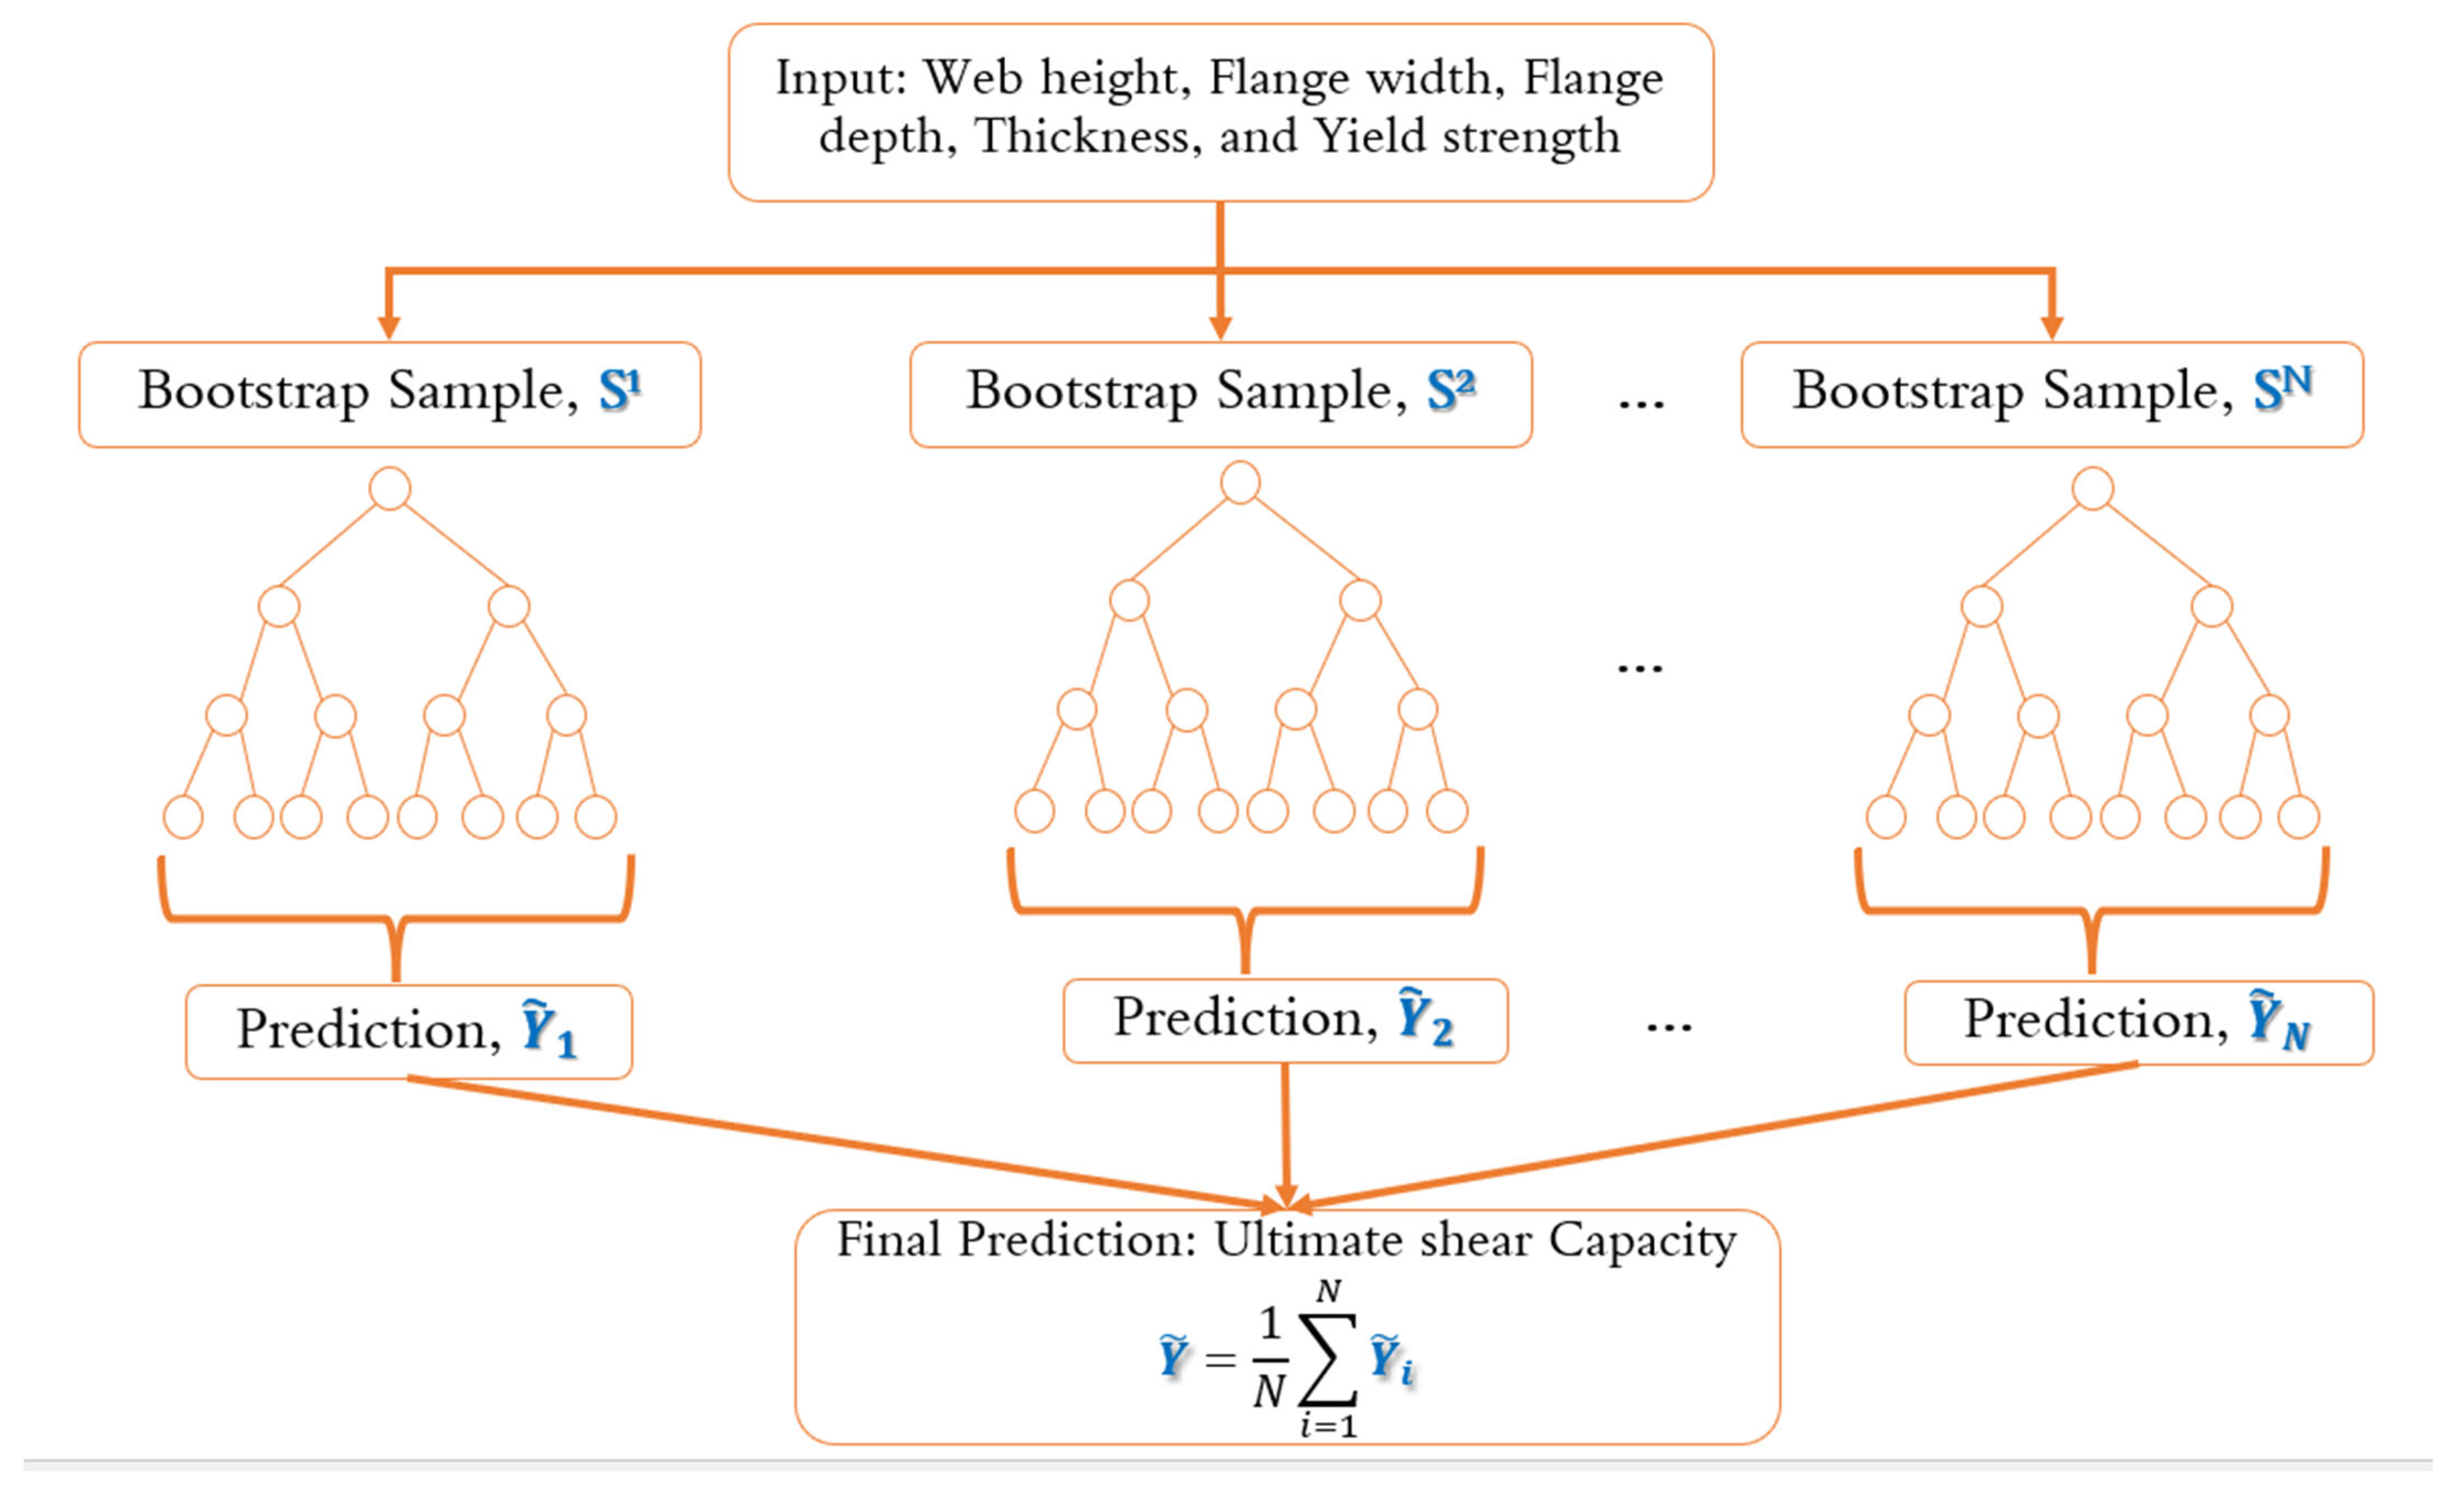
Ensemble learning models based on decision trees, particularly boosting methods (see Figure 13), offer an alternative approach that is efficient and interpretable. LightGBM employs histogram-based feature binning and a leaf-wise tree growth strategy, allowing for fast training on large datasets with low memory consumption, and its depth-limited pruning mechanism also helps to mitigate overfitting [41]. GBM combines shallow decision trees iteratively, where each subsequent tree is trained to correct the residuals of the previous prediction [22,42].
CatBoost introduces innovations for handling categorical variables using ordered target encoding, and constructs symmetric trees to reduce gradient bias and prevent data leakage [43]. XGBoost, an enhanced variant of GBM, incorporates second-order derivative optimisation, regularisation terms, and parallelised execution, improving accuracy and training efficiency, and has shown superior performance for structural behaviour applications [22,42]. Lastly, AdaBoost differs from gradient-based models by dynamically adjusting the weights of training samples based on prediction errors. At each iteration, misclassified observations are assigned higher weights so that subsequent weak learners focus more on those challenging cases [44].

3.1.4. Shapley Additive Explanation

SHAP (SHapley Additive exPlanations) is a unified framework based on cooperative game theory that explains the output of machine learning models by assigning each feature an importance value. It builds on the Shapley value concept, which fairly distributes a model’s prediction among its input features based on their marginal contributions [45]. SHAP ensures properties like local accuracy, consistency, and missingness, making it reliable for model interpretability. This method allows for both global insights into model behaviour and detailed local explanations of individual predictions.

3.2. Dataset Description

This study employs an FE dataset curated to investigate the shear behaviour of MCO beams using ML techniques, as presented in Section 2. The dataset comprises 105 FE models, each representing a unique configuration tested under shear loading conditions. The proposed ML models are surrogates of an FE framework that was validated against experimental data; therefore, their applicability is limited to the validated modelling assumptions and the parameter ranges considered. Each data entry includes five input features that represent key geometric and material characteristics of the MCO beam, and one output feature corresponding to the ultimate shear capacity derived from an FE parametric study. These variables are critical to understanding the mechanical response of MCO beams under shear forces. The input features include overall height of the beam cross-section ( H w ), width of the top/bottom flange ( W f ), depth of the flange section ( D f ), plate thickness ( t ) of the beam, and yield strength of the steel ( f y ). The output feature is the ultimate shear capacity ( V u ) . These parameters were selected based on their known influence on shear resistance in MCO beams. The statistical distribution of each variable is summarised in Table 3. In the current formulation, all samples are treated uniformly, and the models predict V u without a failure-mode label. Consequently, the ML framework does not provide mode-specific predictions for yielding-dominated versus buckling-dominated responses.
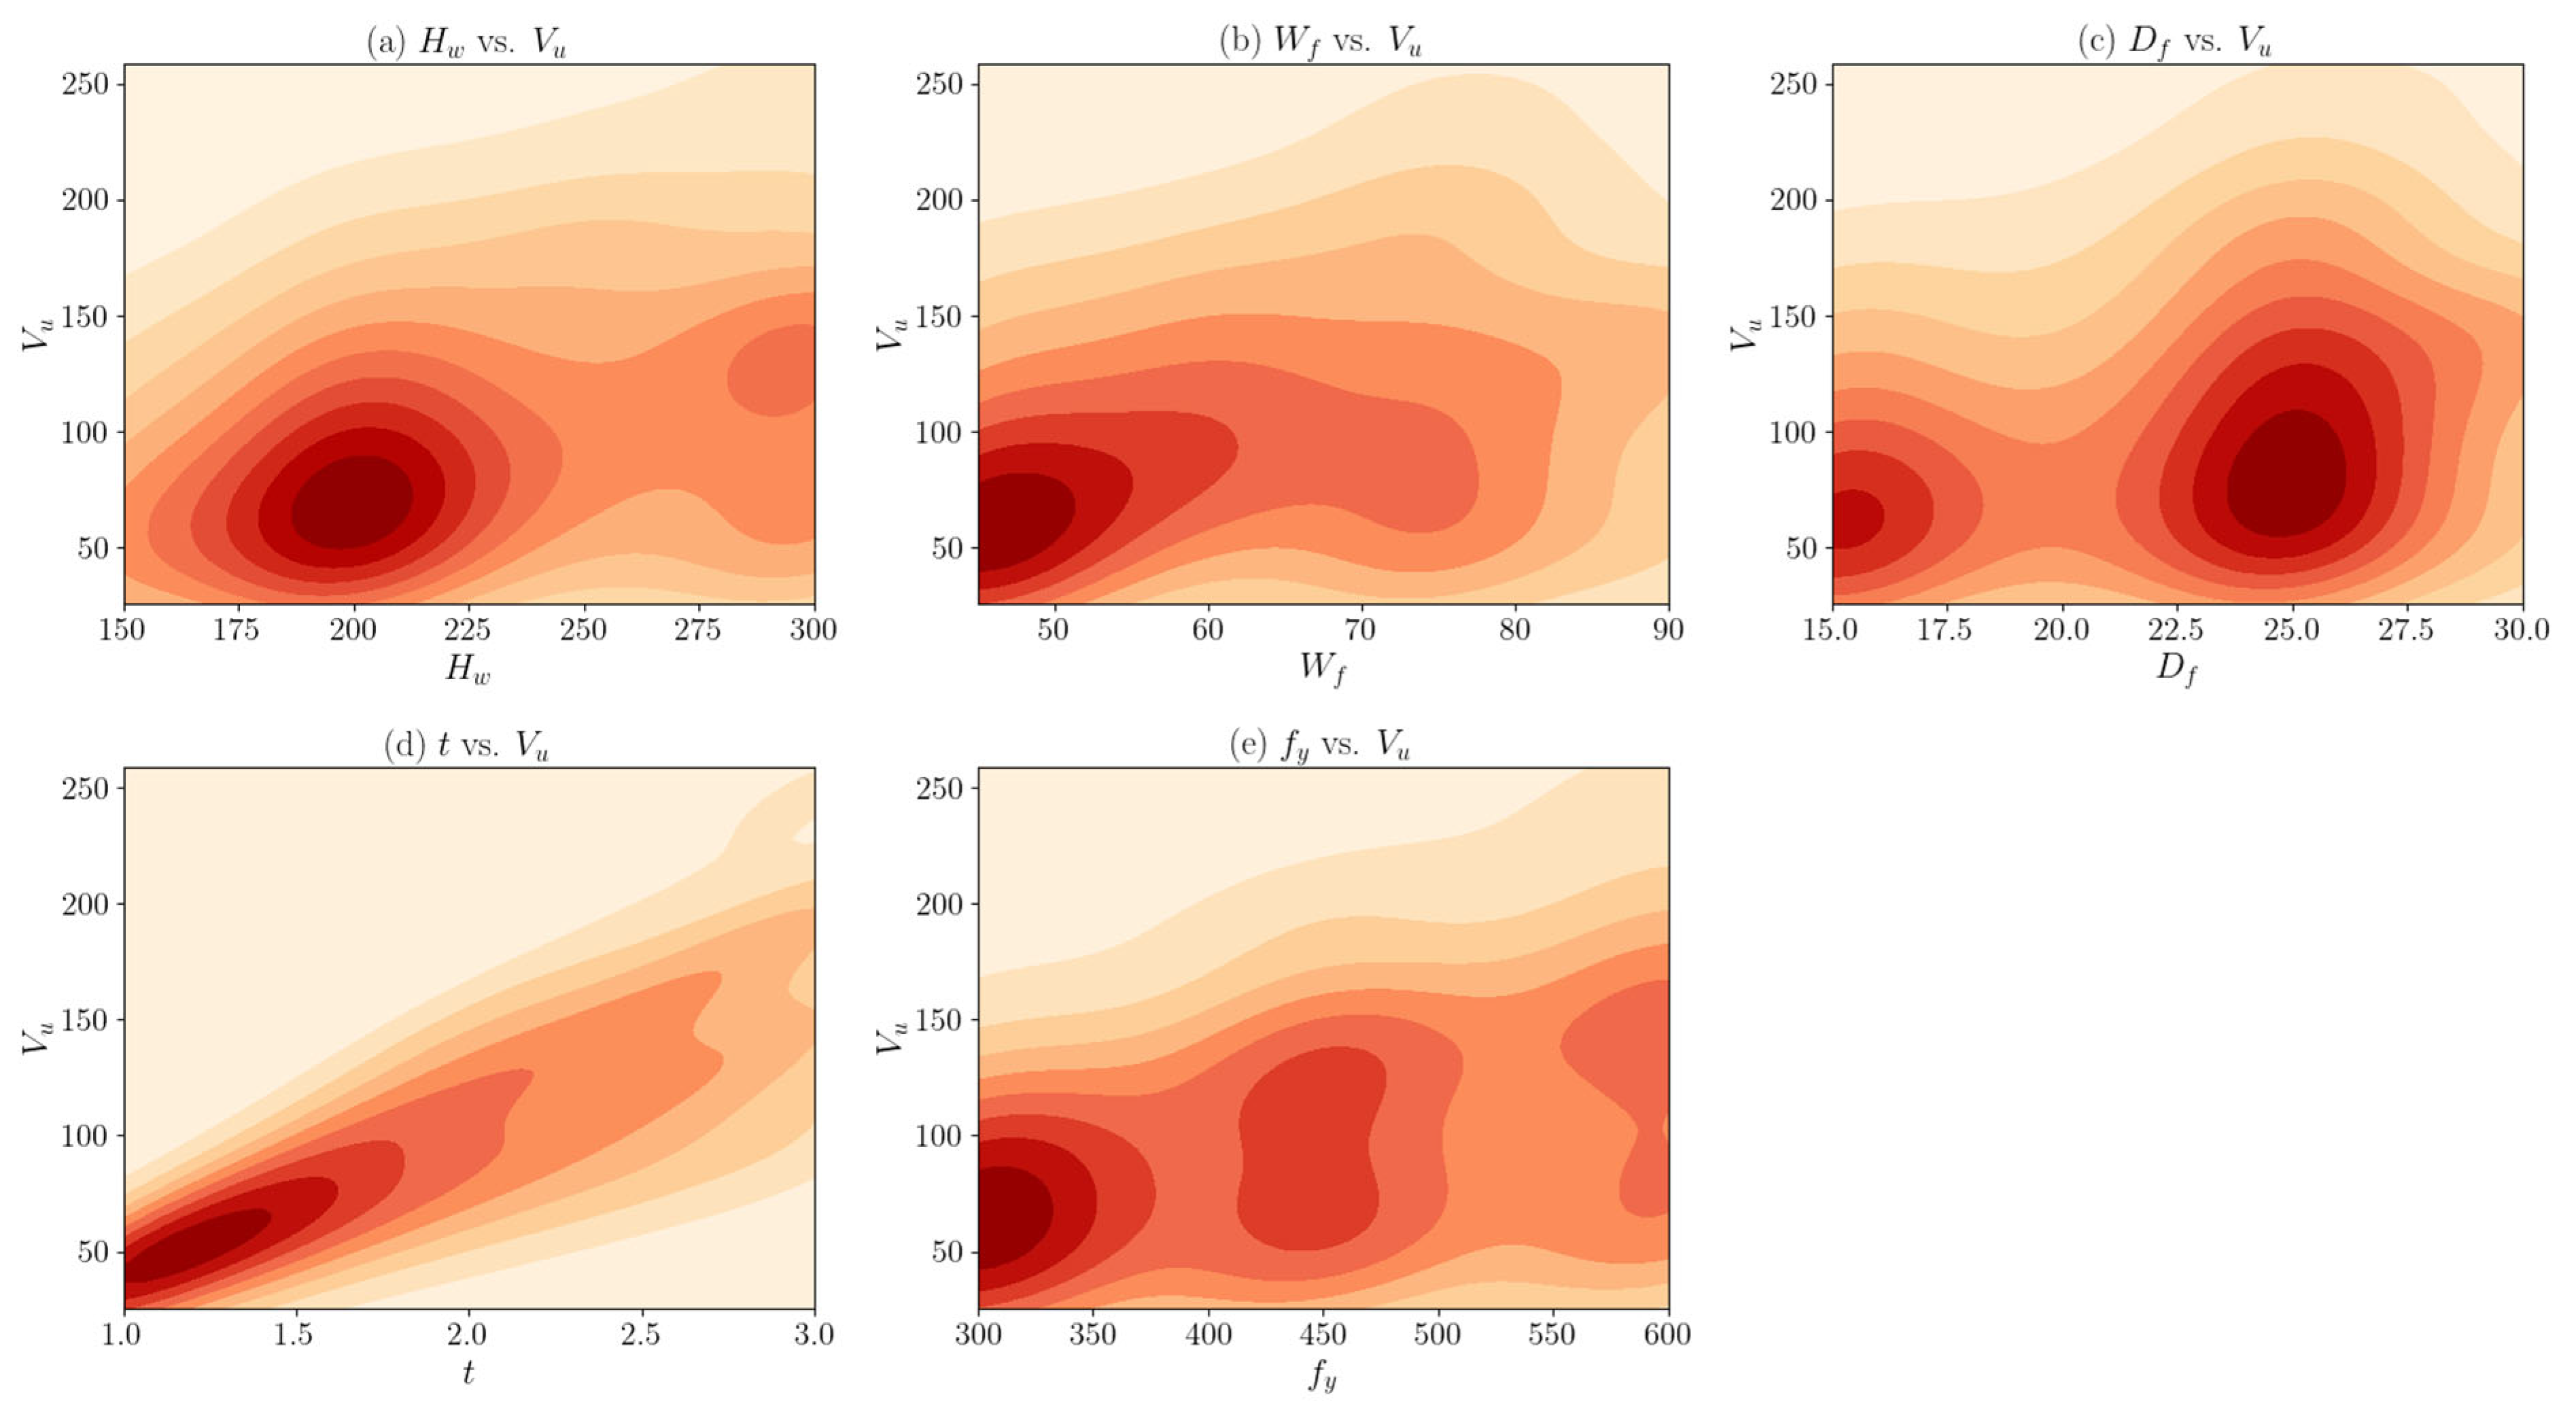
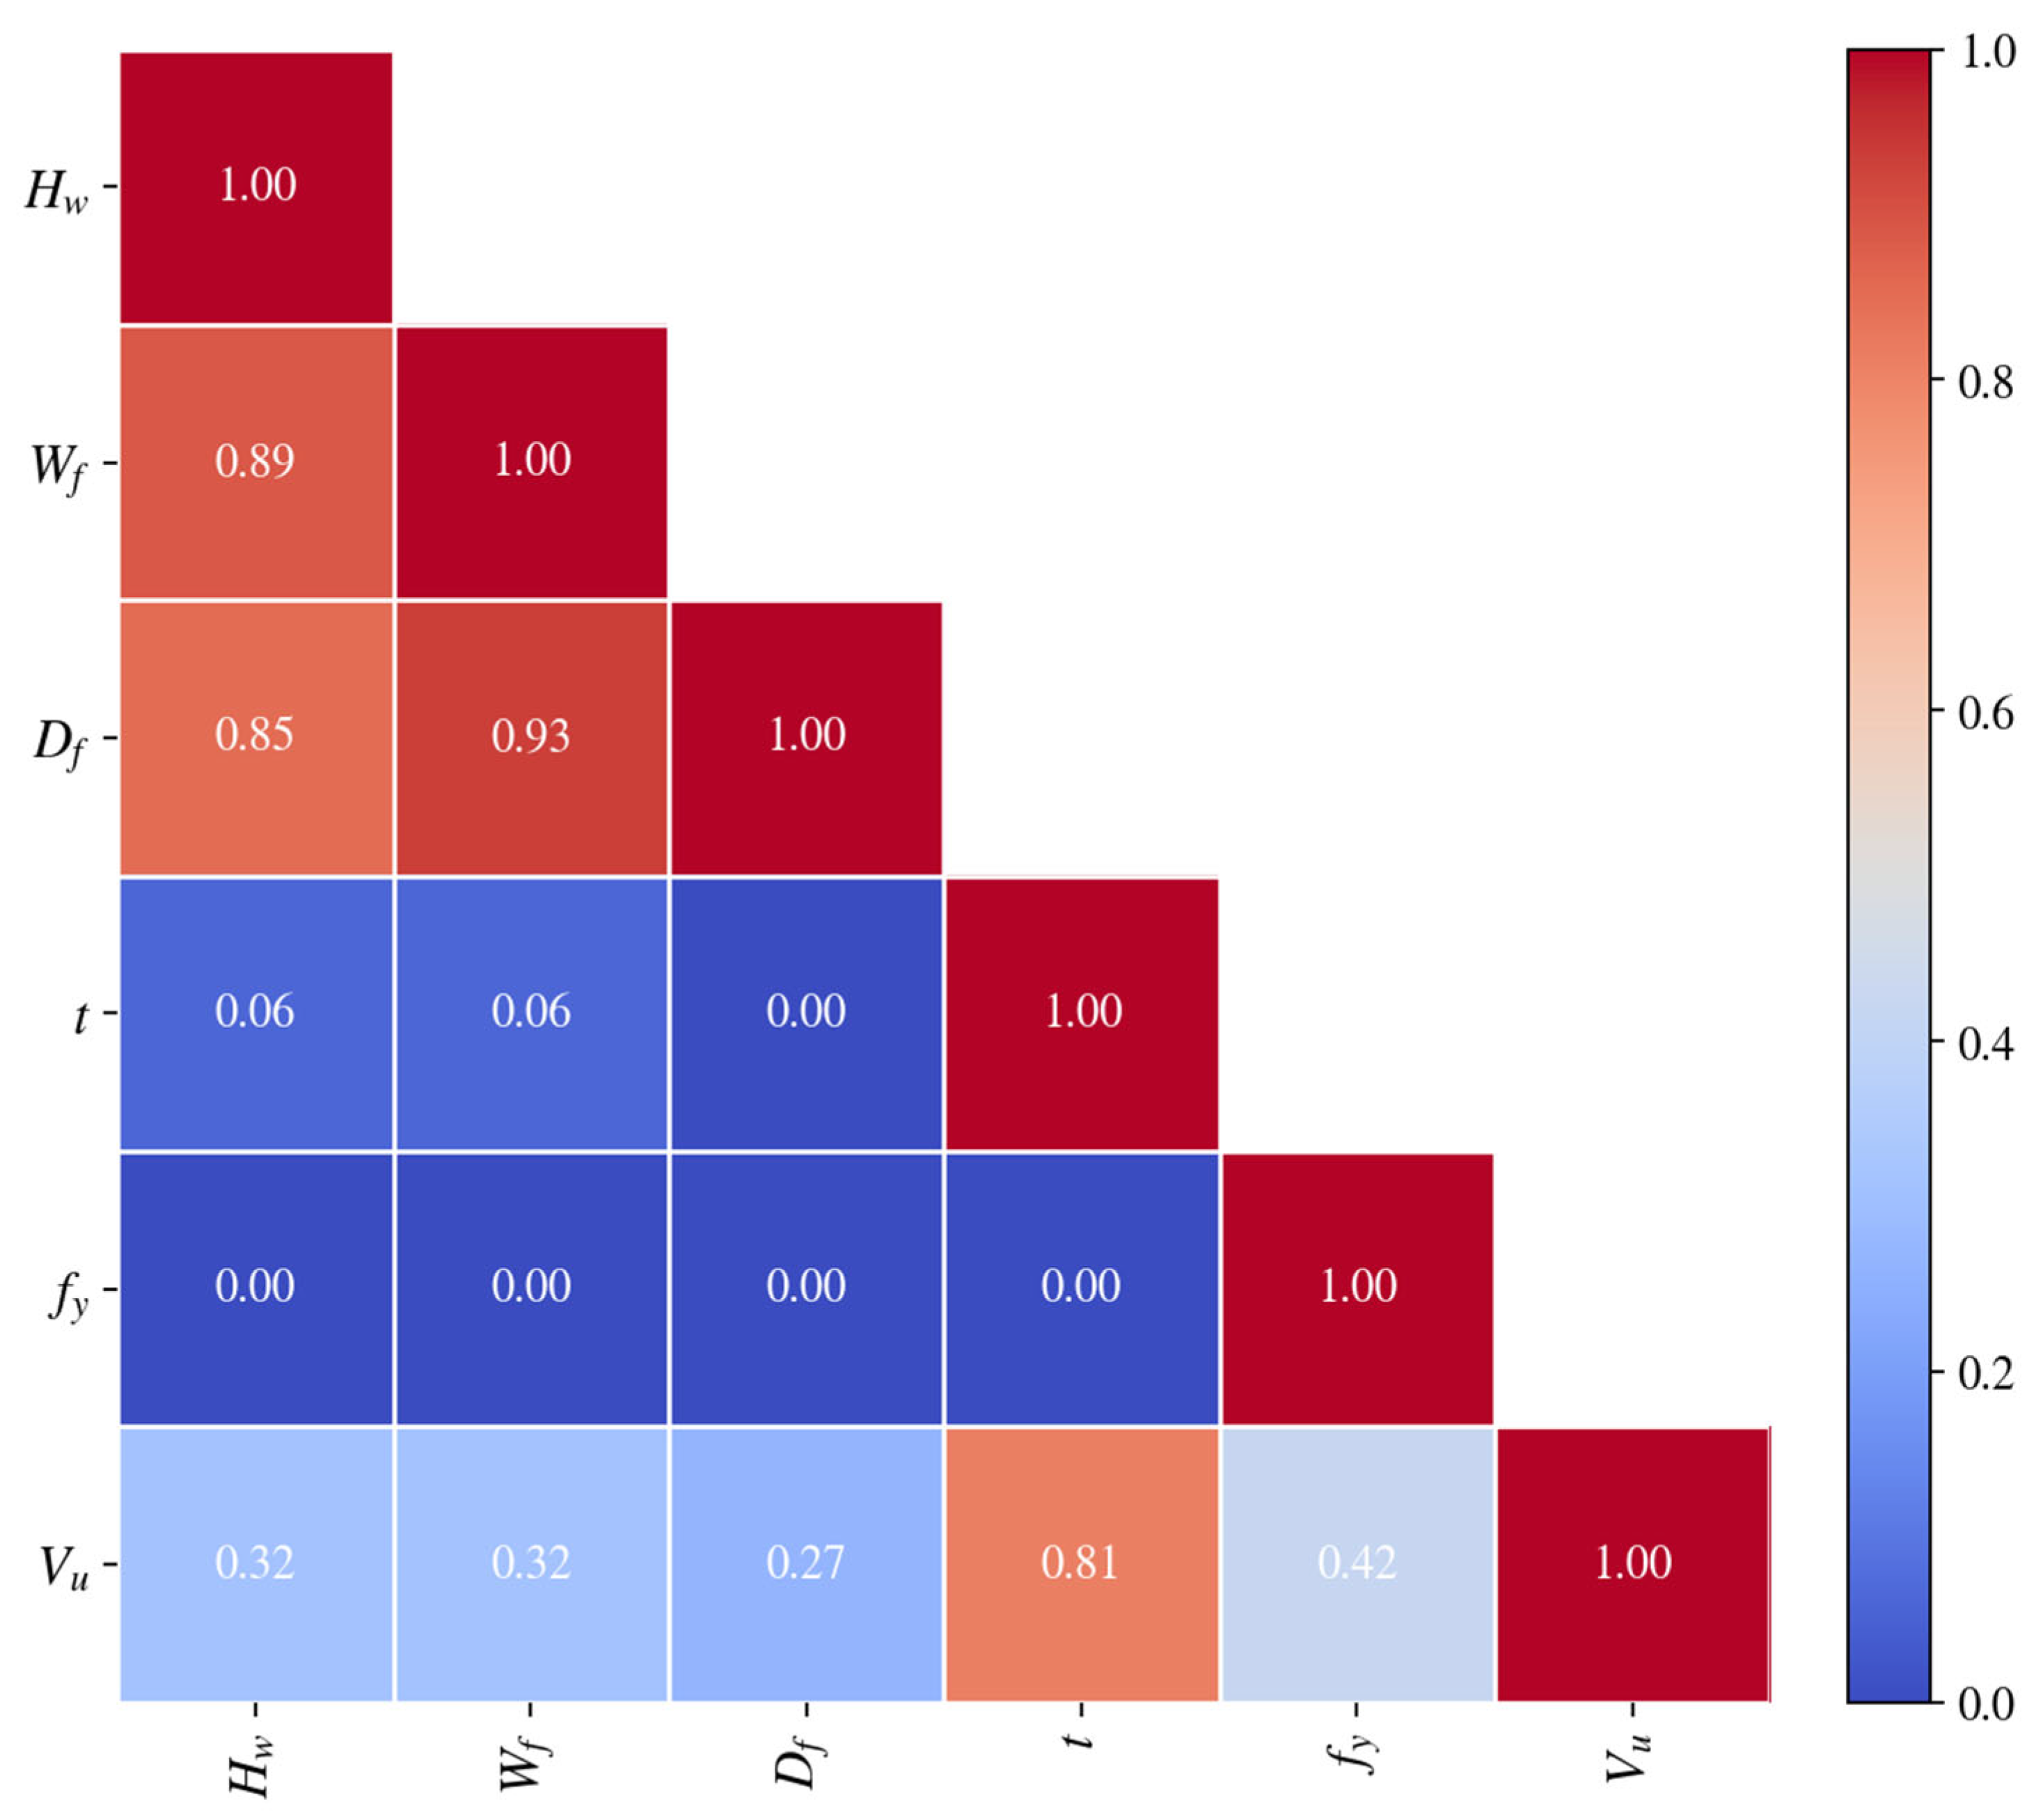
Figure 14 shows contour plots of the dataset distribution for MCO beams, highlighting the relationship between ultimate shear capacity V u and key input variables. Most data points are concentrated in practical design ranges, with clear trends observed for web thickness t and yield strength f y positively influencing V u . In addition, Pearson correlation analysis (see Figure 15) revealed that web thickness t ( r = 0.81 ) and yield strength f y ( r = 0.42 ) are the most influential variables with respect to V u . In contrast, the high intercorrelation among H w , W f , and D f suggests potential multicollinearity among geometric inputs.

3.3. Model Training, Validation and Testing

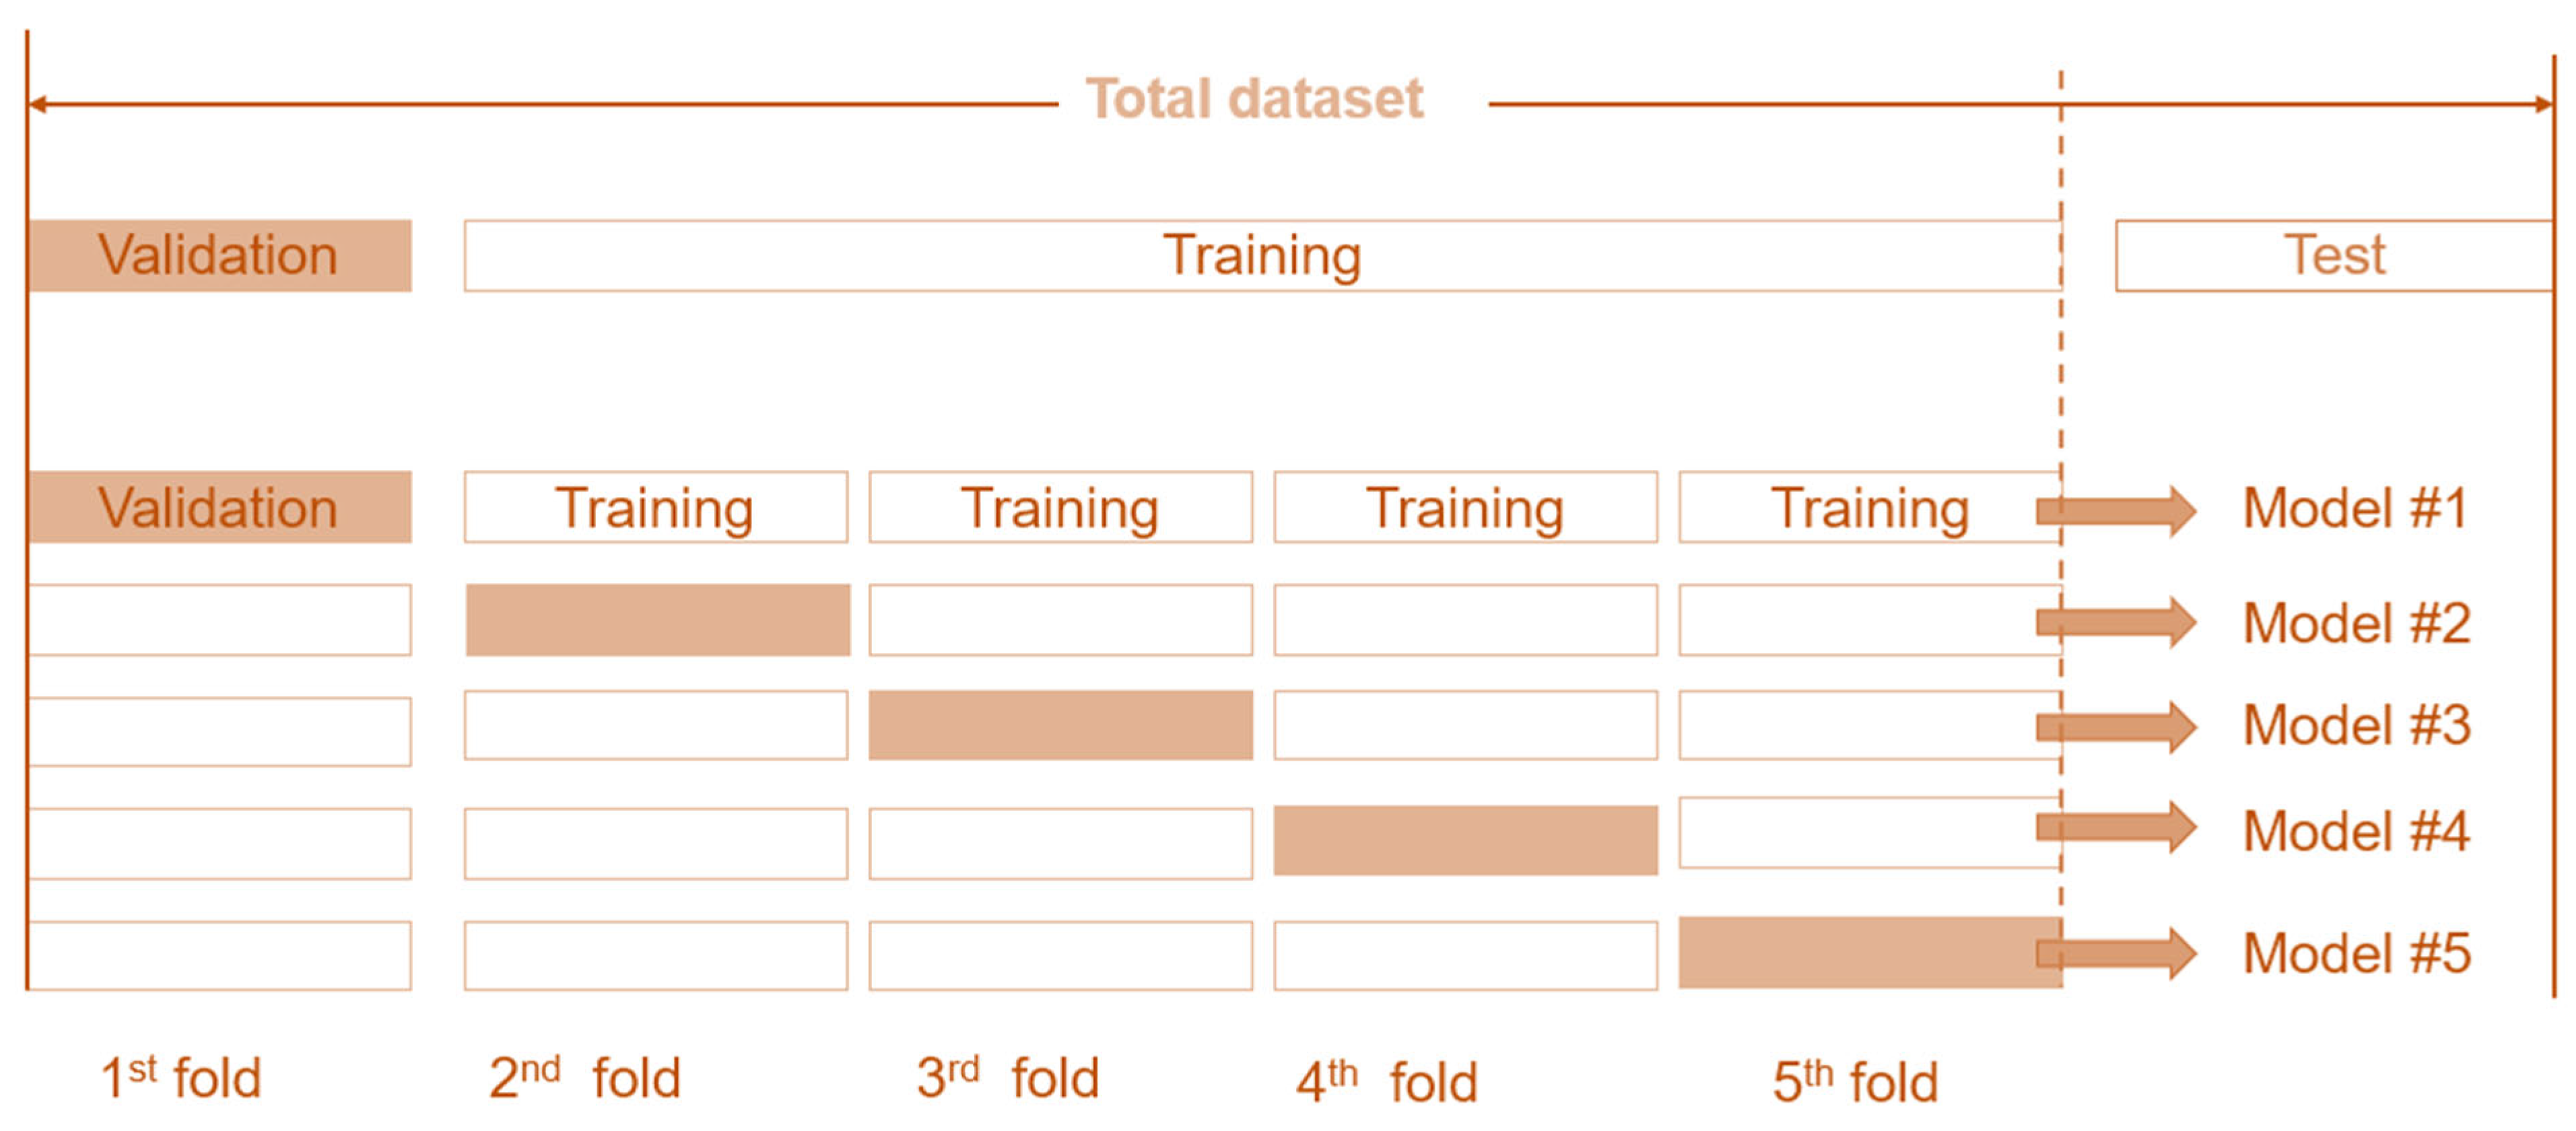
To develop robust and generalizable ML models for predicting the shear behaviour of MCO beams, a structured process involving data splitting, model training, hyperparameter tuning, and performance evaluation was followed. The dataset was randomly divided into training (80%) and testing (20%) subsets. The dataset comprises 105 FE-generated samples obtained from a structured parametric design. We recognise that this size is limited for data-driven modelling and can lead to optimistic performance if evaluation is not carefully designed. Therefore, training-set metrics are not used to claim generalisation. Instead, model performance is reported primarily using repeated five-fold cross-validation with uncertainty quantification (mean ± 95% confidence intervals for R 2 , RMSE, MAE, and MAPE) as shown in Table 4. This provides a more reliable estimate of model stability under resampling of the available data and reduces the risk of overfitting being masked by a single split or a single cross-validation run [46,47]. As illustrated in Figure 16, this method divides the dataset into five equal folds. In each iteration, four folds are used for training and one for validation. The process is repeated five times, ensuring each data point is used for both training and validation exactly once.
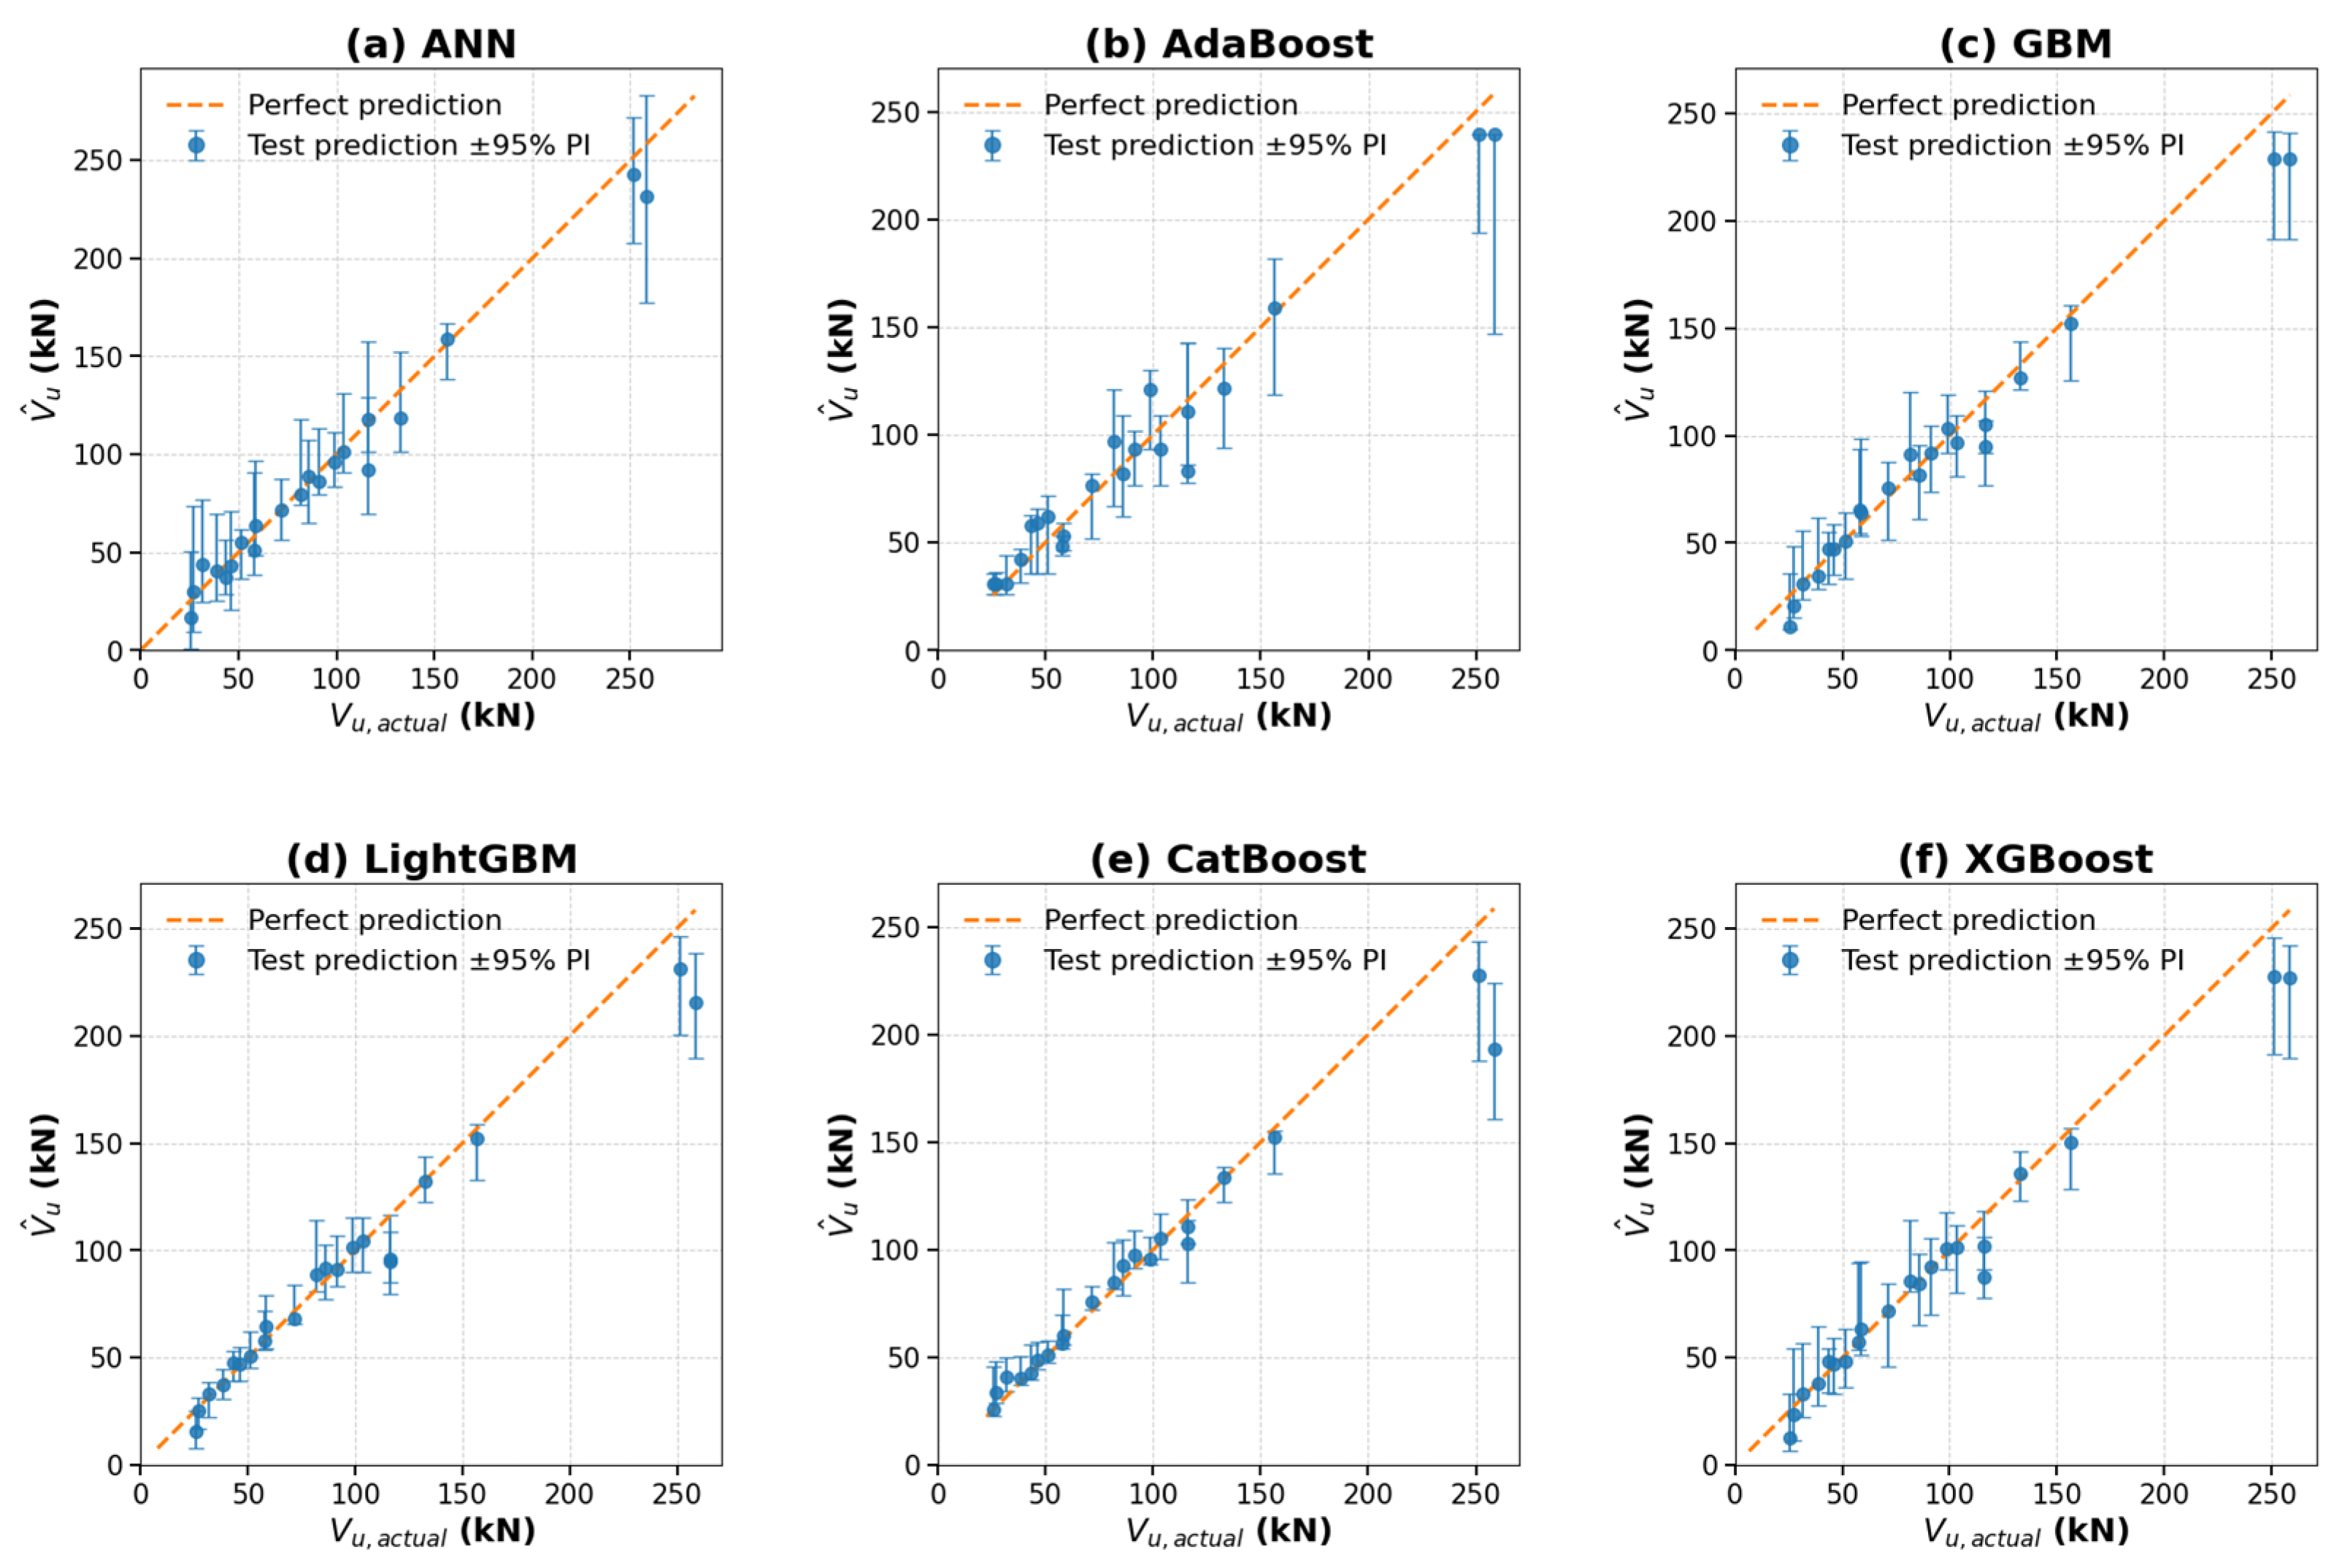
In addition to confidence intervals for aggregate performance metrics, uncertainty at the individual prediction level was quantified using empirical 95% prediction intervals for hold-out test predictions, V ^ u . These intervals were estimated by bootstrap resampling of the training data, retraining the selected learner on each bootstrap sample, and taking the 2.5th and 97.5th empirical percentiles of the resulting prediction distribution for each test instance.
A fixed random seed of 42 was used throughout the study for reproducibility in dataset splitting, repeated resampling, and bootstrap-based prediction-interval estimation. No data leakage was allowed in the modelling workflow. The hold-out test set was kept fully separate from the data used in cross-validation, and no overlap occurred between training folds, validation folds, and the independent test set. In addition, preprocessing operations that depend on sample statistics, such as scaling in the ANN pipeline, were fitted using training data only. The FE validation stage against experimental results was used solely to validate the FE framework and did not introduce overlap or leakage into the ML training and testing stages.
For hyperparameter tuning, Bayesian optimisation was utilised via the Optuna framework [48]. Unlike grid or random search methods, Bayesian optimisation explores the hyperparameter space more efficiently by building a probabilistic model of the objective function. This approach enables faster convergence to optimal settings and has been shown to yield better model performance in various engineering applications [49]. The full search spaces and the final selected hyperparameters for each model are reported in Appendix B. To evaluate model performance, four statistical metrics were adopted, presented in Equations (1)–(4).
R 2 = 1 − ∑ i = 1 n     y i − y ˆ i 2 ∑ i = 1 n     y i − y ‾ 2
R M S E = 1 n ∑ i = 1 n     y i − y ˆ i 2
M A E = 1 n ∑ i = 1 n     y i − y ˆ i
M A P E = 100 % n ∑ i = 1 n     y i − y ˆ i y i
Here, y i and y ˆ i are the actual and predicted values, y ‾ is the mean value, and n is the number of samples. Higher coefficient of determination ( R 2 ) values indicate better model fit, while lower root means square error (RMSE), mean absolute error (MAE), and mean absolute percentage error (MAPE) values signify higher prediction accuracy. The models were trained by minimising the MSE loss.

4. Results and Discussion

4.1. Assessment of ML Model Performance

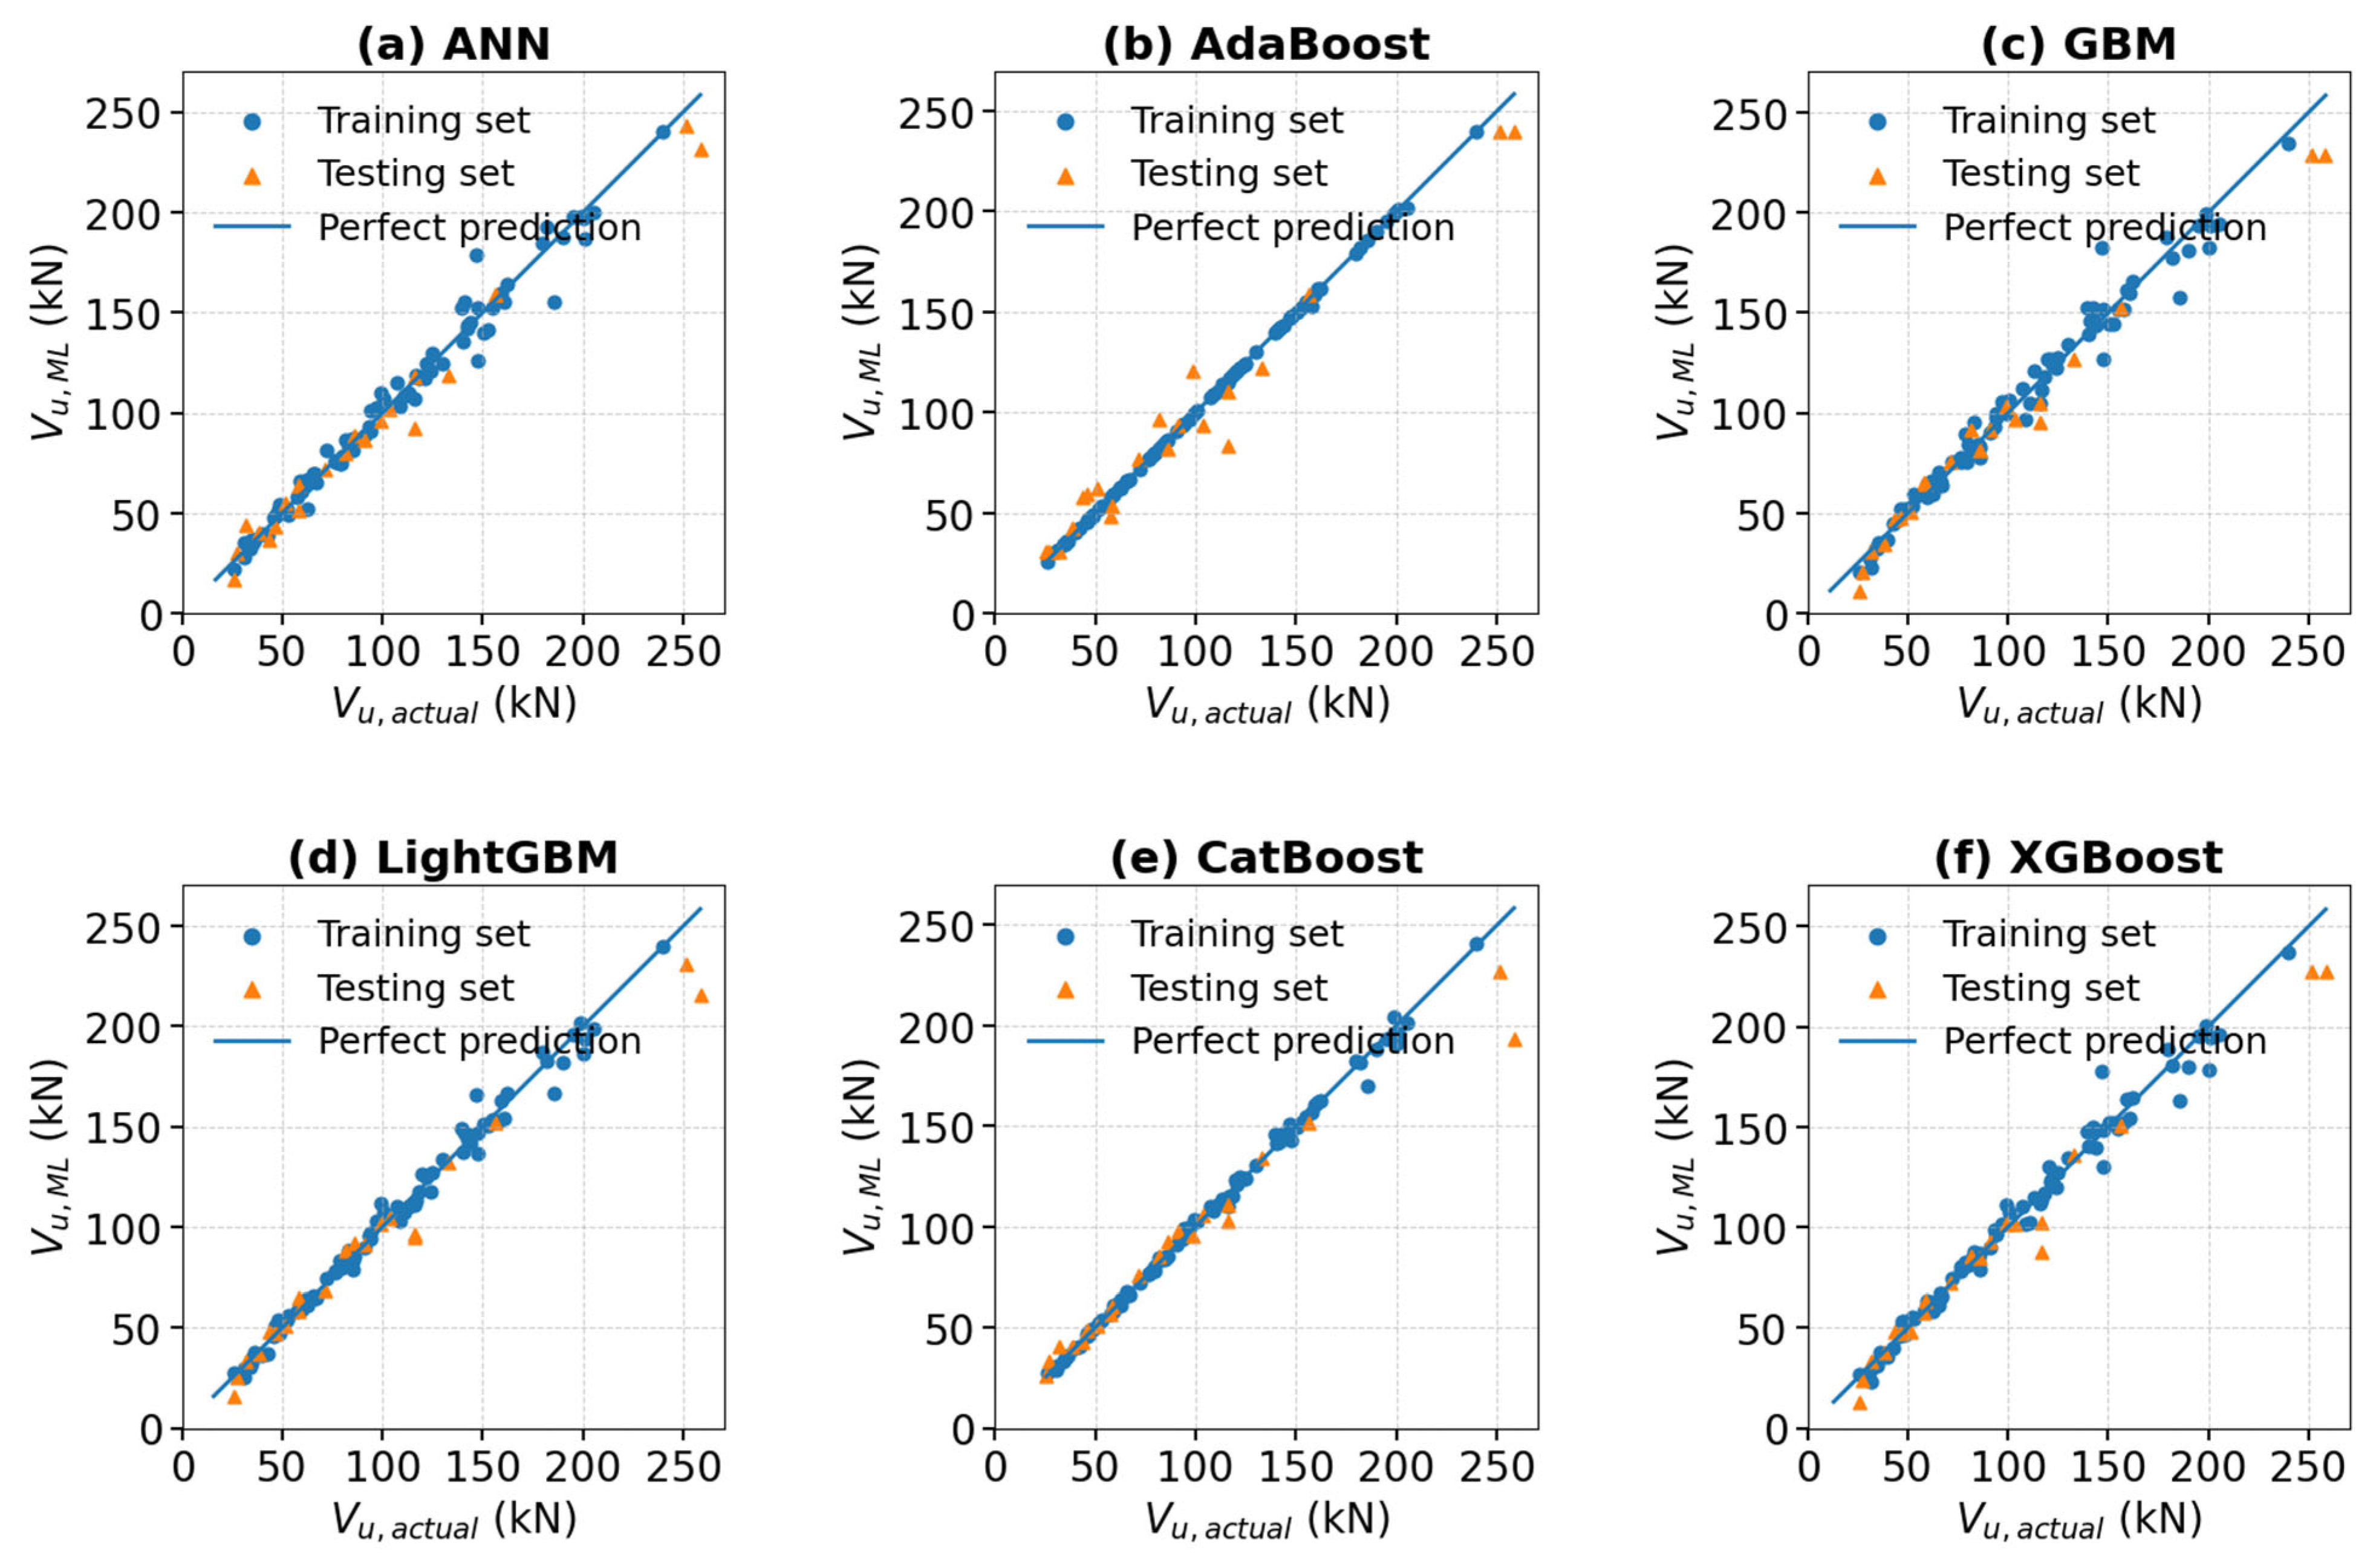
The performance of the six ML models—Artificial Neural Network (ANN), AdaBoost, Gradient Boosting (GBM), LightGBM, Catboost and XGBoost—was compared during training and testing phases for predicting the ultimate shear capacity failure load. Figure 17 shows a scatter plot of the ML algorithms in predicting the ultimate shear capacity Vu, compared to the actual ultimate shear capacity Vu, for the six ML models for both training and testing sets. Data points for most ML models are closely distributed to the prediction diagonal line (x = y). This suggests that the ML models have good accuracy in the prediction of the ultimate shear capacity of the MCO beam. To analyse the performance of the 6 models in further detail. Four metrics were utilised: RMSE, MAPE, MAE, and R2. Despite the limited sample size, the relative ranking of the ML models remains consistent across repeated resampling, as reflected by the narrow confidence intervals reported in Table 4.
The predictive performance of the six ML models is summarised in Table 4 for the training and test splits and further supported by the resampling results (mean ± 95% CI). On the independent test set, the ANN produced the highest R 2 (0.97), indicating strong agreement between the predicted and actual ultimate shear capacity. XGBoost and AdaBoost also achieved high test R 2 values (0.964 and 0.965, respectively). In contrast, LightGBM showed the weakest test performance ( R 2 = 0.833 ), suggesting that this configuration did not capture the response trends as effectively as the other learners. The ANN recorded the lowest test RMSE (10.33) and MAPE (8.72%), while CatBoost and XGBoost provided similarly competitive accuracy with low error metrics. Although AdaBoost attained near-perfect training performance, its larger errors on the test set indicate weaker generalisation, consistent with overfitting on the limited, structured dataset.
The prediction-interval plots (Figure 18) provide an additional layer of interpretation beyond point-prediction accuracy. While metrics such as R 2 , RMSE, MAE, and MAPE quantify average model performance; the empirical 95% prediction intervals indicate the spread of plausible predicted values for each test case. This allows the reader to assess not only how close V ^ u is to V u , but also the uncertainty associated with individual predictions.

4.2. Design Safety Factors for ML-Predicted Ultimate Shear Capacity

To place the reported ML errors (e.g., RMSE and MAPE) into a design context [50,51], the ML predictions were calibrated into code-style LRFD resistance factors and ASD safety factors using the reliability format in AISI S100-16 w/S2-20 [52]. In this study, the ML models provide a rapid surrogate prediction of ultimate shear capacity, V u , M L , while the reference capacity, V u , r e f , is taken as the FE-predicted ultimate shear capacity from the validated FE framework. A model bias ratio is defined as P = V u , r e f V u , M L . From the dataset, the mean P m and the coefficient of variation V P of P are computed and used to calibrate an LRFD resistance factor ϕ v . Following the AISI reliability calibration form, ϕ v is expressed as ϕ v = C ϕ   ( M m F m P m )   e x p   [ β 0 V M 2 + V F 2 + C P V P 2 + V Q 2 ] , and the corresponding ASD safety factor is obtained as Ω v = 1.6 ϕ v . Here, C ϕ is the LRFD calibration coefficient, β 0 is the target reliability index, V M and V F represent the coefficients of variation for material and fabrication effects, V Q represents load-effect variability, and C P accounts for statistical uncertainty due to finite sample size (AISI S100-16 w/S2-20; American Iron and Steel Institute, 2002 [52]). Consistent with AISI guidance for reliability calibration, the variability term V P is not taken less than a prescribed minimum.
Table 5 reports the calibrated statistics and factors for the six ML models. The mean bias P m is close to unity for all models (0.985–1.029), indicating limited systematic bias relative to the FE reference. However, the dispersion V P varies notably between models (0.093–0.239) and drives the calibrated design factors. CatBoost exhibits the lowest dispersion ( V P = 0.093 ) and therefore provides the least conservative calibration ( ϕ v = 0.869 , Ω v = 1.840 ). LightGBM and GBM show moderate dispersion ( V P = 0.141 and 0.149), resulting in similar factors ( ϕ v = 0.843 and 0.833; Ω v = 1.897   and 1.920). AdaBoost shows higher variability ( V P = 0.164 ), while XGBoost and ANN exhibit the largest dispersion ( V P = 0.201 and 0.239), leading to lower ϕ v and higher Ω v values ( ϕ v = 0.781 and 0.740; Ω v = 2.049 and 2.163).
Overall, this calibration provides a design-oriented interpretation of ML prediction scatter: models with similar average accuracy can lead to different design factors if their prediction variability differs. Accordingly, the calibrated ϕ v and Ω v values offer a practical bridge between standard ML metrics and code-consistent reliability treatment for design-oriented use of ML surrogates within the investigated parameter domain (American Iron and Steel Institute, 2002 [52]).

4.3. Model Explanation

With recent advancements in ML, SHAP has been introduced and allowed for increased explainability and transparency in ML predictions. SHAP allows for two levels of explainability, covering both local and global perspectives.
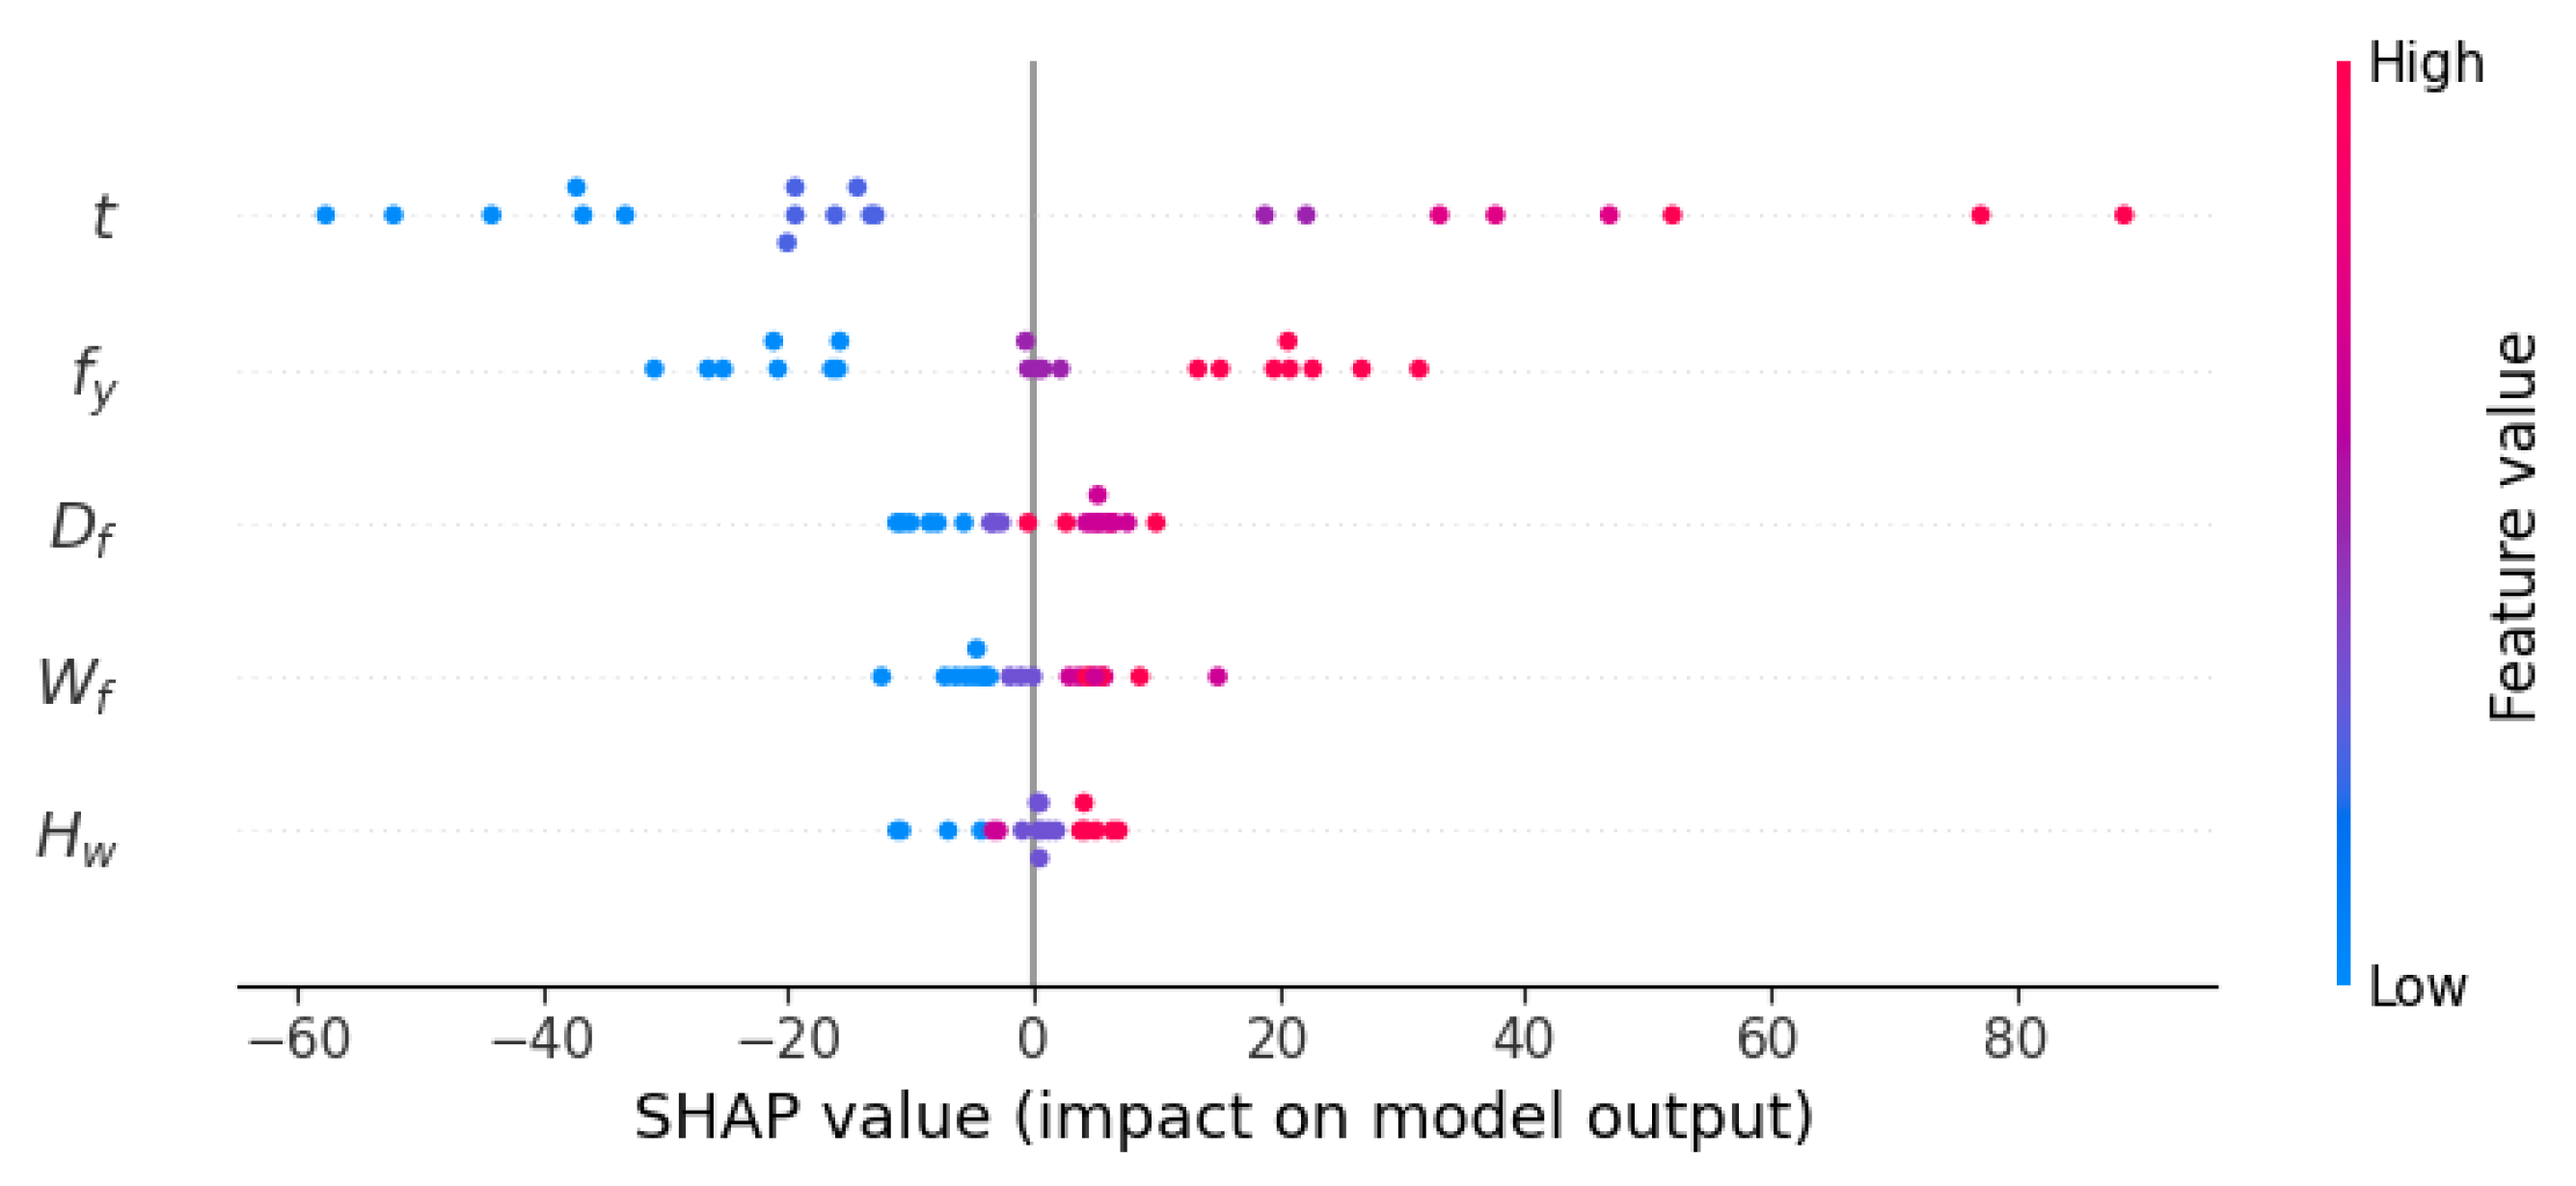
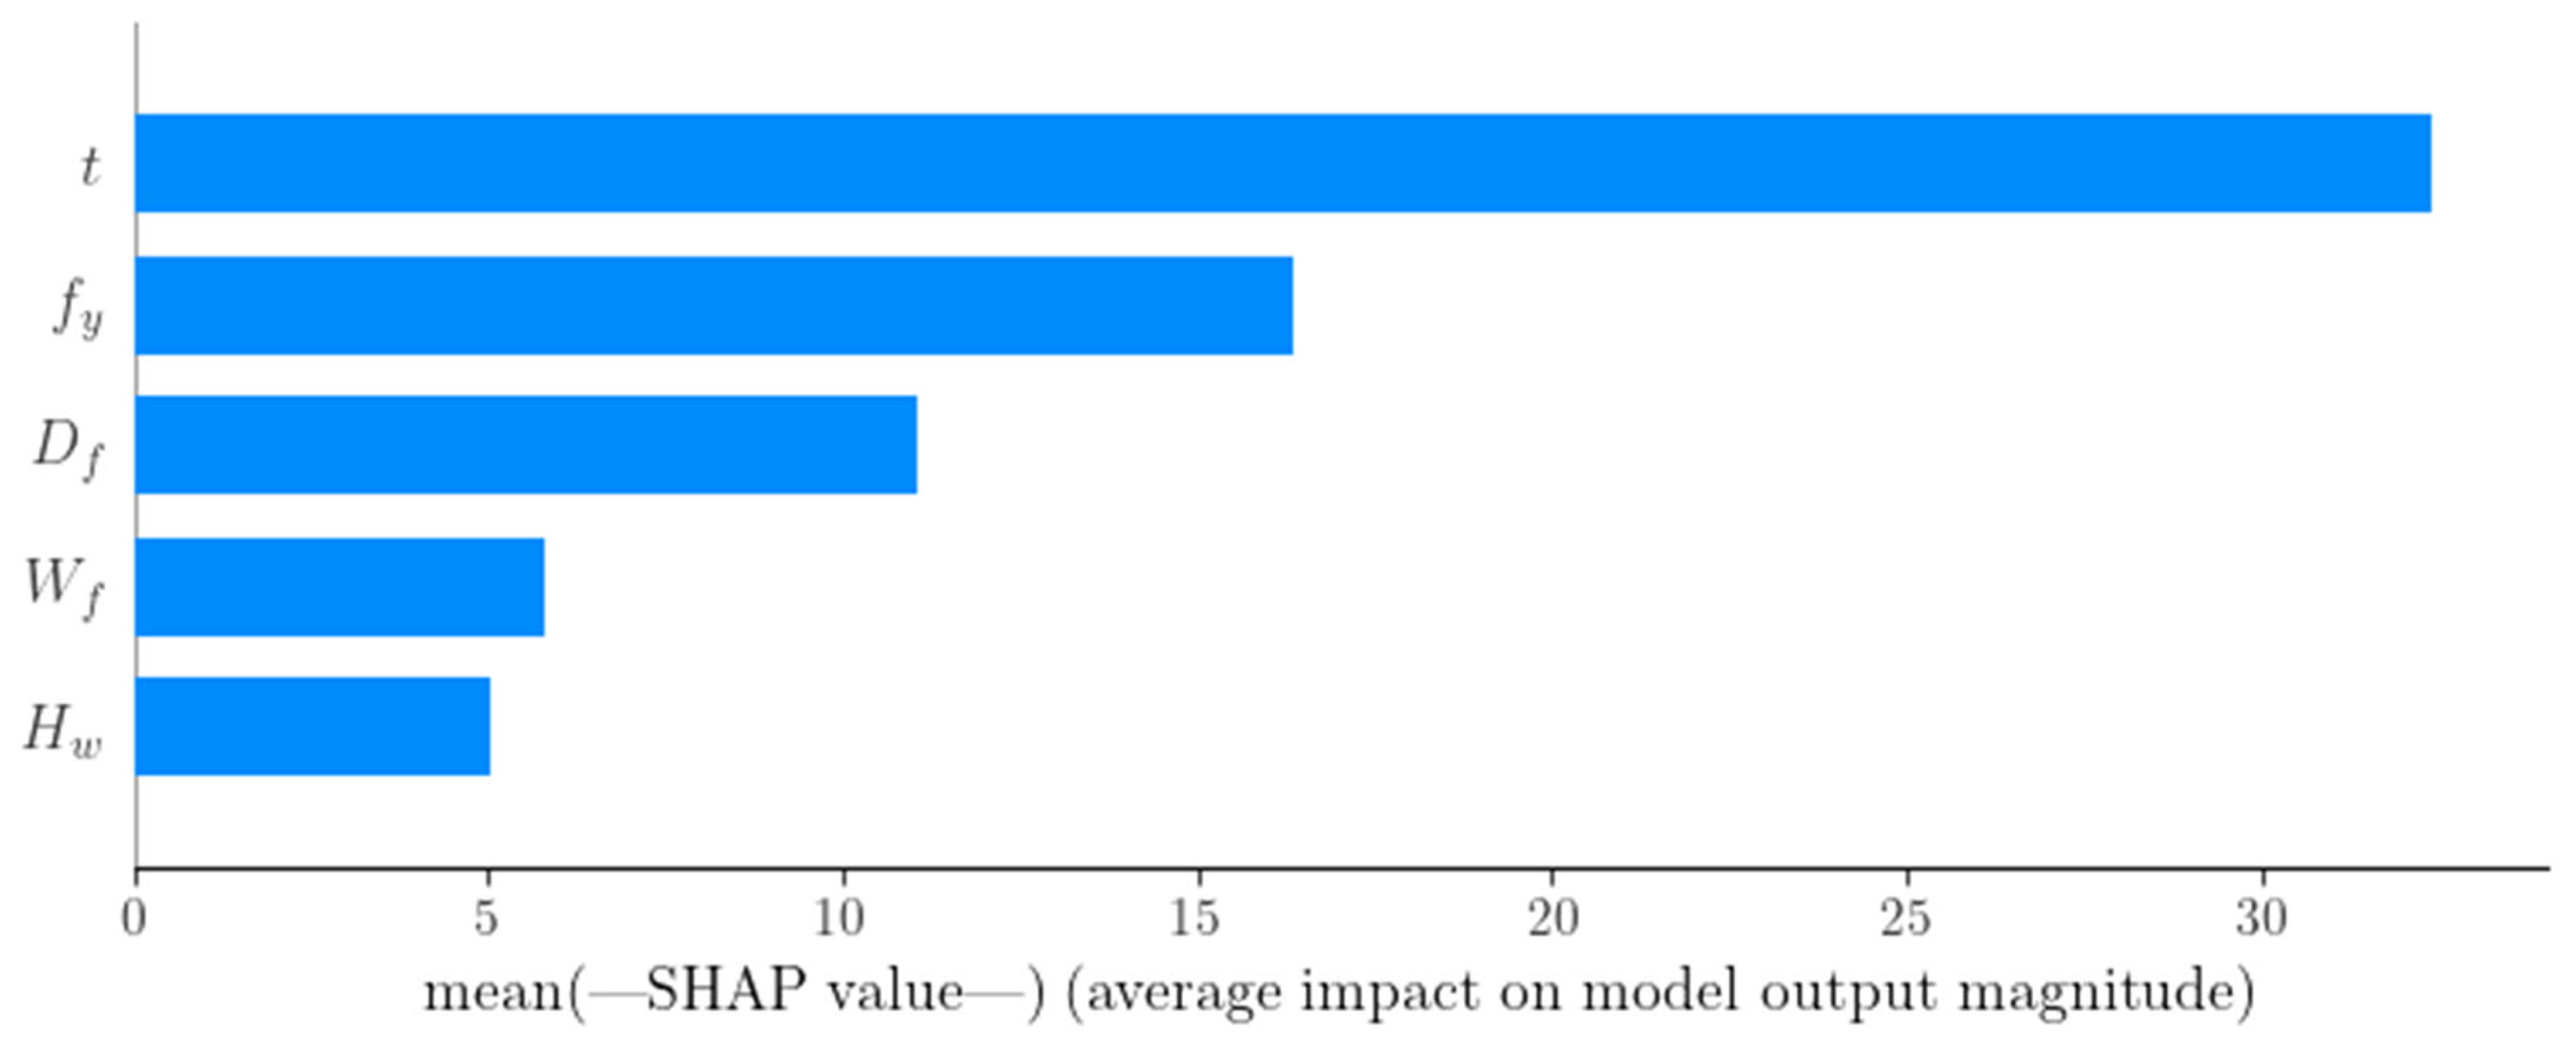
The SHAP global explanation is presented in Figure 19. The blue represents low values of a specific input variable, with the red colour represents the higher values. Moreover, the input values vary between 0 and 100. The values closer to 100 are red and 0 are shown as blue. Thickness (t) is the most important factor which has the greatest impact on the ultimate shear capacity. Moreover, yield strength has a similar impact on the ultimate shear capacity. ANN model provided the most effective amongst the six ML techniques analysed. SHAP results are presented mainly to support model interpretability and to verify physically consistent behaviour of the ML predictions. The identified importance of thickness and yield strength aligns with established shear mechanics; thus, SHAP is used here as a sanity check and quantitative ranking within the investigated parameter range, rather than as evidence of new physical mechanisms specific to the MCO geometry.
Feature importance (FI) analysis was conducted and presented in Figure 20 and Table 6, showing key parameters contributing to the ANN model’s high accuracy prediction. Considering the ANN models, the top-ranked features are t and closely followed by fy, showing that cross-section thickness and material yield strength have the most significant impact on the ultimate shear capacity. Then Df, Wf and Hw represent flange depth, flange width and section depth. The findings of this investigation closely align with features in the context of ultimate shear capacity [15,36].
A local sensitivity check was conducted for one representative section, H w = 200   mm ,   W f = 60   mm ,   H f = 20   mm , t = 2.0   mm , f y = 450   MPa , by perturbing thickness, t , and yield strength, f y , by ± 5 % while keeping the remaining variables fixed. The resulting percentage changes in predicted ultimate shear capacity were then compared across all six ML models as shown in Table 7. The ANN exhibited smooth local sensitivity to both t and f y , whereas the tree-based ensemble models showed either zero or threshold-type changes. This behaviour is expected because tree-based regressors generate piecewise-constant predictions between split thresholds; therefore, the local sensitivity values should be interpreted as model-response characteristics rather than continuous physical gradients.

5. Conclusions

This study demonstrates that explainable machine learning can predict the ultimate shear capacity of mono-symmetric triangular hollow flange modular construction-optimised beams with high accuracy within the investigated parameter domain. A dataset of 105 validated finite element models was used to train and evaluate six supervised machine learning algorithms, enabling a consistent comparison of predictive performance. Categorical boosting achieved the best overall accuracy and stability, with a coefficient of determination of 95.9% and a mean absolute percentage error of 6.49% under 50 repeated train and test splits, showing strong agreement with the finite element reference capacities.
The results indicate that the machine learning models capture the non-linear influence of geometry and yield strength on shear capacity for this section type. Shapley Additive Explanations were used to support interpretability and to confirm physically plausible trends, with thickness and yield strength identified as the dominant variables, followed by geometric parameters of the web and flange. These findings align with the established understanding of thin-walled shear behaviour and provide transparency on how the models form predictions within the studied range.
The study also improves the transparency and reproducibility of the proposed framework by explicitly defining the data-splitting procedure, random seeds, learning objectives, and no-leakage conditions. In addition, empirical 95% prediction intervals were incorporated to quantify uncertainty at the individual prediction level, complementing the confidence intervals reported for aggregate performance metrics. A local ±5% sensitivity check further illustrated differences in model-response behaviour, with the ANN showing smooth variation and tree-based ensemble models showing threshold-type responses, reflecting their piecewise-constant prediction structure.
The proposed framework provides a computationally efficient finite element surrogate for design-oriented estimation of shear capacity for modular construction-optimised beams, reducing reliance on extensive finite element runs for routine assessments. The study also clarifies key limitations, including reliance on a finite element-generated dataset, a fixed shear span ratio, and a single imperfection amplitude. Future work should expand the database across additional geometries, shear span ratios, and loading conditions, and incorporate dedicated experimental results for modular construction-optimised beams to strengthen validation and extend applicability.

6. Future Work

While this study investigated ML-based prediction of the ultimate shear capacity of the MCO beam, several directions remain for future work. First, the dataset is limited to 105 FE models. Expanding the dataset to cover a broader range of MCO geometries and yield strengths is expected to improve model robustness and reduce sensitivity to structured sampling. Second, the ML models are trained entirely on FE-generated results, meaning predictive accuracy depends on the fidelity of the FE framework. Future studies should integrate experimental measurements to strengthen verification and improve confidence in real-world performance. Third, the developed models are tailored to the MCO beam and may not generalise to other CFS sections. Extending the framework to additional CFS geometries and loading conditions would improve applicability. Accordingly, the ML models are intended for interpolation within the FE-calibrated parameter ranges; robustness under distribution shifts (e.g., new sections or loading conditions) requires additional data and is reserved for future work.
Two key limitations of the present study are noted. Only the MCO beam geometry was considered, and the aspect ratio was fixed at 1.0; future work should investigate higher aspect ratios to capture bending–shear interaction and pure bending behaviour. Finally, although high predictive accuracy was achieved within the studied domain, further benchmarking against current and emerging design provisions is needed to position ML performance relative to code-based methods and to support code-consistent adoption.
Another limitation is the adoption of a single imperfection amplitude (0.34 t) across all models. Future work should treat imperfection amplitude as a variable and perform sensitivity/uncertainty analyses to quantify its effect on predicted ultimate shear capacity and to improve the robustness of both FE and ML outcomes.
A further limitation is that failure mode is not explicitly modelled: samples exhibiting yielding-dominated and buckling-dominated behaviour are combined and learned through a single regression mapping to V u . Future work could adopt a two-stage approach, where a classifier first identifies the governing failure mode, and then mode-specific regression models predict V u . This extension requires a larger dataset with reliable failure-mode labels.

Author Contributions

Conceptualization, L.S., M.S. and K.P.; Methodology, L.S. and M.S.; Software, L.S.; Validation, D.T.G. and T.K.; Formal analysis, M.S. and K.P.; Investigation, D.T.G. and L.S.; Writing—original draft, D.T.G. and L.S.; Writing—review and editing, M.S., K.P. and T.K.; Visualisation, M.S. and T.K.; Supervision, M.S. and K.P.; Project administration, K.P. All authors have read and agreed to the published version of the manuscript.

Funding

The involvement of Dr. Lenganji Simwanda in this research was supported by the Global Postdoc Fellowship Program of the Czech Technical University in Prague, and by the Czech Science Foundation under Grant 24-10892S.

Data Availability Statement

The data and code supporting the findings of this study are available in the GitHub project repository: https://github.com/Simwanda/ML_shear_MCO_beams.git (accessed on 10 March 2025).

Conflicts of Interest

The authors declare no conflicts of interest.

Nomenclatures

V u Ultimate shear capacity (reference/target capacity)kN
V u , M L ML-predicted ultimate shear capacitykN
V u , r e f Reference ultimate shear capacity (FE-based in this study)kN
H w Web depth (section depth parameter)mm
W f Flange width (MCO flange parameter)mm
D f Hollow-flange/triangular flange depth parametermm
t Thickness of CFS plate/stripmm
f y Yield strengthMPa
E Young’s modulusMPa (or GPa)
ν Poisson’s ratio–
a Shear span (load to support distance)mm
d 1 Web clear depth (used in shear-span ratio)mm
a / d 1 Shear-span ratio (fixed at 1.0 in this study)–
δ 0 Initial geometric imperfection amplitudemm
0.34 t Adopted imperfection amplitude in FE modelsmm
P Bias   ratio   P = V u , r e f / V u , M L –
P m Mean   of   bias   ratio   P –
V P Coefficient   of   variation   of   P –
ϕ v LRFD resistance factor for shear (calibrated)–
Ω v ASD safety factor for shear (calibrated)–
C ϕ LRFD calibration coefficient–
β 0 Target reliability index–
M m Mean material factor–
F m Mean fabrication factor–
V M COV of material factor–
V F COV of fabrication factor–
V Q COV of load effect–
C P Statistical correction factor for finite sample size–
n Number of samples used in calibration–
m Degrees   of   freedom   parameter   ( m = n − 1 )–
R 2 Coefficient of determination–
RMSERoot-mean-square errorkN
MAEMean absolute errorkN
MAPEMean absolute percentage error%
SHAPShapley Additive Explanations–

Appendix A. FE Modelling Inputs Used in ABAQUS

Table A1. Summary of key FE modelling inputs for MCO shear simulations (ABAQUS).
CategoryFE Input/SettingValue/Description
SoftwareSolverABAQUS (commercial FEA) [11]
Test configurationSetupSimply supported beam under three-point bending
Shear-span ratio a / d 1 = 1.0 (chosen to promote shear-dominant failure) [18,19,29,30]
Model partsComponents(i) MCO beam, (ii) Web Side Plates (WSPs)
ConnectionsBeam–WSP connectionSurface-to-surface Tie constraint
Geometry definitionMCO modelling approachMiddle-surface offset (centrelines with half thickness on each side) [29,30,31]
Element typeMCO beamS4R 4-node shell, reduced integration (thin-walled)
WSPsR3D4 rigid elements [17,32]
MeshingFlat regions5 mm × 5 mm mesh
Corner regions1 mm × 5 mm mesh (refined)
WSPs10 mm × 10 mm mesh (coarser; detailed WSP response not required)
Mesh verificationMesh sensitivity study (Figure 3) + prior guidance [12,20,29,30]
Material modelStress–strain lawBilinear elastic–perfectly plastic (strain hardening neglected) [14,17,24,35]
Elastic properties E = 200   GPa , ν = 0.3
Yield strengthNominal f y used; values as per parametric plan
LoadingMethodDisplacement control (via reference points on WSPs) [9,12,36]
Boundary conditionsSupportsSimply supported (as per three-point bending arrangement)
RestraintsLateral restraintsStraps/restraints applied to top and bottom flanges to reduce unbalanced shear flow and prevent flange distortion [18]
ImperfectionsBuckling modeCritical local buckling eigenmode from linear buckling analysis
Eigenmodes requested10 eigenvalues
Imperfection amplitude δ 0 = 0.34   t (from Schafer & Peköz CDF proposal; also used by Hadjipantelis et al. [34])
Nonlinear analysisProcedureLinear buckling → nonlinear analysis for V u
Nonlinear solverStatic Riks (used for post-buckling/shear problems) [35,37,40]
Riks controlsMax increments100
Initial increment0.01
Minimum increment 1 × 10 − 25
Maximum increment1.0
Total time1.0
Output definitionCapacity extractionUltimate shear capacity taken as peak reaction/peak load from shear–displacement response
ValidationBenchmarkFE compared to Keerthan & Mahendran LSB shear tests [41] (mean V test / V FEA = 0.99 , COV = 0.03)

Appendix B. Hyperparameter Optimisation and Reproducibility

Table A2. The full search spaces and the final selected hyperparameters for each model.
ModelHyperparameterSearch SpaceSelected
ANNnhidden1–31
nunits, l110–20010
activationrelu/tanh/logisticrelu
solveradam/lbfgslbfgs
α10−6–10−2 (log)9.08 × 10⁻⁶
learning_rateconstant/adaptiveadaptive
AdaBoostn_estimators50–800112
learning_rate0.01–1.0 (log)0.0269
losslinear/square/exponentiallinear
max_depth (base tree)1–107
GBMlearning_rate0.01–0.3 (log)0.0641
max_iter100–2000846
max_depth2–122
min_samples_leaf5–8011
l2_regularization0–21.415
max_leaf_nodes15–255236
LightGBMn_estimators200–20001790
learning_rate0.01–0.30.0413
num_leaves16–256189
max_depth−1–3030
min_child_samples5–2007
min_child_weight10−3–10−1 (log)0.0146
subsample0.5–1.00.6936
subsample_freq1–2011
colsample_bytree0.5–1.00.5969
reg_alpha10−3–10 (log)1.3829
reg_lambda10−3–10 (log)1.0364
CatBoostiterations200–15001356
depth4–104
learning_rate0.01–0.3 (log)0.0162
l2_leaf_reg1–20 (log)1.5922
random_strength0–505.4412
bagging_temperature0.01–1.0 (log)0.0870
border_count32–25572
XGBoostn_estimators100–800736
learning_rate0.01–0.30.2552
max_depth3–103
min_child_weight1–1010
subsample0.6–1.00.6291
colsample_bytree0.6–1.00.7606
reg_alpha0–10.6004
reg_lambda0–21.8908

References

  1. Hancock, G. Cold-formed steel structures: Research review 2013–2014. Adv. Struct. Eng. 2016, 19, 393–408. [Google Scholar] [CrossRef] [Scilit]
  2. Lifsey, J.; Gray, D.T.; Sifan, M.; Poologanathan, K.; Lingaretnam, J.; Popo-Ola, S.; Higgins, C. Web crippling design of modular construction optimised beams under interior-two-flange (ITF) loading. Adv. Struct. Eng. 2025, 13694332251369094. [Google Scholar] [CrossRef] [Scilit]
  3. Sifan, M.; Upasiri, I.; Poologanathan, K.; Popo-Ola, S.; Suntharalingam, T.; Thirunavukkarasu, K. Fire performance and design of LSF wall panels with 3D printed concrete and steel lipped channel sections. J. Struct. Fire Eng. 2026, 17, 98–129. [Google Scholar] [CrossRef] [Scilit]
  4. Öztürk, F.; Mojtabaei, S.M.; Şentürk, M.; Pul, S.; Hajirasouliha, I. Buckling behaviour of cold-formed steel sigma and lipped channel beam–column members. Thin-Walled Struct. 2022, 173, 108963. [Google Scholar] [CrossRef] [Scilit]
  5. Laím, L.; Rodrigues, J.P.C.; Craveiro, H.D. Flexural behaviour of beams made of cold-formed steel sigma-shaped sections at ambient and fire conditions. Thin-Walled Struct. 2015, 87, 53–65. [Google Scholar] [CrossRef] [Scilit]
  6. Hossam, M.; El-Aghoury, S.; Ibrahim, S.; Hassan, S. The strength of Sigma section subjected to bending moment according to the direct strength method. Int. J. Sci. Technol. 2021, 10, 86–93. [Google Scholar]
  7. Wanniarachchi, K.S.; Mahendran, M. Experimental study of the section moment capacity of cold-formed and screw-fastened rectangular hollow flange beams. Thin-Walled Struct. 2017, 119, 499–509. [Google Scholar] [CrossRef] [Scilit]
  8. Sifan, M.; Gatheeshgar, P.; Navaratnam, S.; Nagaratnam, B.; Poologanathan, K.; Thamboo, J.; Suntharalingam, T. Flexural behaviour and design of hollow flange cold-formed steel beam filled with lightweight normal and lightweight high strength concrete. J. Build. Eng. 2021, 48, 103878. [Google Scholar] [CrossRef] [Scilit]
  9. Ha, T.-H.; Cho, B.-H.; Kim, H.; Kim, D.-J. Development of an Efficient Steel Beam Section for Modular Construction Based on Six-Sigma. Adv. Mater. Sci. Eng. 2016, 2016, 9687078. [Google Scholar] [CrossRef] [Scilit]
  10. Gatheeshgar, P.; Parker, S.; Askew, K.; Poologanathan, K.; Navaratnam, S.; McIntosh, A.; Widdowfield Small, D. Flexural behaviour and design of modular construction optimised beams. Structures 2021, 32, 1048–1068. [Google Scholar] [CrossRef] [Scilit]
  11. Lifsey, J.; Sifan, M.; Poologanathan, K.; Gray, D.T.; Kajaharan, T.; Elilarasi, K.; Higgins, C. Flexural behaviour and design of modular construction optimised CFS beams with circular web openings. Case Stud. Constr. Mater. 2025, 23, e05220. [Google Scholar] [CrossRef] [Scilit]
  12. Keerthan, P.; Mahendran, M. Experimental investigation and design of lipped channel beams in shear. Thin-Walled Struct. 2015, 86, 174–184. [Google Scholar] [CrossRef] [Scilit]
  13. Pham, C.H.; Bruneau, L.A.; Hancock, G.J. Experimental Study of Longitudinally Stiffened Web Channels Subjected to Combined Bending and Shear. J. Struct. Eng. 2015, 141, 04015018. [Google Scholar] [CrossRef] [Scilit]
  14. Keerthan, P.; Mahendran, M. New design rules for the shear strength of LiteSteel beams. J. Constr. Steel Res. 2011, 67, 1050–1063. [Google Scholar] [CrossRef] [Scilit]
  15. Dissanayake, D.M.M.P.; Zhou, C.; Poologanathan, K.; Gunalan, S.; Tsavdaridis, K.D.; Guss, J. Numerical simulation and design of stainless steel hollow flange beams under shear. J. Constr. Steel Res. 2021, 176, 106414. [Google Scholar] [CrossRef] [Scilit]
  16. Chandramohan, D.L.; Kanthasamy, E.; Gatheeshgar, P.; Poologanathan, K.; Ishqy, M.F.M.; Suntharalingam, T.; Kajaharan, T. Shear behaviour and design of doubly symmetric hollow flange beam with web openings. J. Constr. Steel Res. 2021, 185, 106836. [Google Scholar] [CrossRef] [Scilit]
  17. Ye, J.; Becque, J.; Hajirasouliha, I.; Mojtabaei, S.M.; Lim, J.B.P. Development of optimum cold-formed steel sections for maximum energy dissipation in uniaxial bending. Eng. Struct. 2018, 161, 55–67. [Google Scholar] [CrossRef] [Scilit]
  18. Wang, L.; Jiang, X.; Guo, W.; Lyu, F. Intelligent design of web-stiffened cold-formed steel channel beam section oriented by load-carrying efficiency. Structures 2025, 74, 108571. [Google Scholar] [CrossRef] [Scilit]
  19. Dissanayake, M.; Nguyen, H.; Poologanathan, K.; Perampalam, G.; Upasiri, I.; Rajanayagam, H.; Suntharalingam, T. Prediction of shear capacity of steel channel sections using machine learning algorithms. Thin-Walled Struct. 2022, 175, 109152. [Google Scholar] [CrossRef] [Scilit]
  20. Sifan, M.; Nguyen, H.; Nagaratnam, B.; Thamboo, J.; Poologanathan, K.; Makul, N. Efficient mix design method for lightweight high strength concrete: A machine learning approach. Structures 2023, 55, 1805–1822. [Google Scholar] [CrossRef] [Scilit]
  21. Kateb, M.; Safarian, S. Machine learning-driven predictive modeling of mechanical properties in diverse steels. Mach. Learn. Appl. 2025, 20, 100634. [Google Scholar] [CrossRef] [Scilit]
  22. Simwanda, L.; Gatheeshgar, P.; Ilunga, F.M.; Ikotun, B.D.; Mojtabaei, S.M.; Onyari, E.K. Explainable machine learning models for predicting the ultimate bending capacity of slotted perforated cold-formed steel beams under distortional buckling. Thin-Walled Struct. 2024, 205, 112587. [Google Scholar] [CrossRef] [Scilit]
  23. Fang, Z.; Roy, K.; Xu, J.; Dai, Y.; Paul, B.; Lim, J.B.P. A novel machine learning method to investigate the web crippling behaviour of perforated roll-formed aluminium alloy unlipped channels under interior-two flange loading. J. Build. Eng. 2022, 51, 104261. [Google Scholar] [CrossRef] [Scilit]
  24. Shi, Y.; Wang, Y.; Wang, L.-N.; Wang, W.-N.; Yang, T.-Y. Bridge cable performance warning method based on temperature and displacement monitoring data. Buildings 2025, 15, 2342. [Google Scholar] [CrossRef] [Scilit]
  25. Shi, Y.; Wang, Y.; Wang, L.-N.; Wang, W.-N.; Yang, T.-Y. Bridge Tower Warning Method Based on Improved Multi-Rate Fusion Under Strong Wind Action. Buildings 2025, 15, 2733. [Google Scholar] [CrossRef] [Scilit]
  26. ABAQUS, version 2017; Dessault Systems Simulia Corp: Vélizy-Villacoublay, France, 2017.
  27. Wanniarachchi, K.S.; Mahendran, M.; Keerthan, P. Shear behaviour and design of Lipped Channel Beams with non-circular web openings. Thin-Walled Struct. 2017, 119, 83–102. [Google Scholar] [CrossRef] [Scilit]
  28. Sifan, M.; Gatheeshgar, P.; Nagaratnam, B.; Poologanathan, K.; Navaratnam, S.; Thamboo, J.; Corradi, M. Shear performance of lightweight concrete filled hollow flange cold-formed steel beams. Case Stud. Constr. Mater. 2022, 17, e01160. [Google Scholar] [CrossRef] [Scilit]
  29. Wang, L.; Young, B. Design of cold-formed steel channels with stiffened webs subjected to bending. Thin-Walled Struct. 2014, 85, 81–92. [Google Scholar] [CrossRef] [Scilit]
  30. Schafer, B.W.; Peköz, T. Computational modeling of cold-formed steel: Characterizing geometric imperfections and residual stresses. J. Constr. Steel Res. 1998, 47, 193–210. [Google Scholar] [CrossRef] [Scilit]
  31. Perera, N.; Mahendran, M. Finite element analysis and design for section moment capacities of hollow flange steel plate girders. Thin-Walled Struct. 2019, 135, 356–375. [Google Scholar] [CrossRef] [Scilit]
  32. Haidarali, M.R.; Nethercot, D.A. Finite element modelling of cold-formed steel beams under local buckling or combined local/distortional buckling. Thin-Walled Struct. 2011, 49, 1554–1562. [Google Scholar] [CrossRef] [Scilit]
  33. Mohamed, M.S.; Thamboo, J.A.; Jeyakaran, T. Experimental and numerical assessment of the flexural behaviour of semi-precast-reinforced concrete slabs. Adv. Struct. Eng. 2020, 23, 1865–1879. [Google Scholar] [CrossRef] [Scilit]
  34. Hadjipantelis, N.; Gardner, L.; Wadee, M.A. Prestressed cold-formed steel beams: Concept and mechanical behaviour. Eng. Struct. 2018, 172, 1057–1072. [Google Scholar] [CrossRef] [Scilit]
  35. Zhang, J.-H.; Young, B. Finite element analysis and design of cold-formed steel built-up closed section columns with web stiffeners. Thin-Walled Struct. 2018, 131, 223–237. [Google Scholar] [CrossRef] [Scilit]
  36. Keerthan, P.; Mahendran, M. Experimental studies on the shear behaviour and strength of LiteSteel beams. Eng. Struct. 2010, 32, 3235–3247. [Google Scholar] [CrossRef] [Scilit]
  37. EN 1993-1-3; Eurocode 3—Design of Steel Structures—Part 1–3 General Rules—Supplementary Rules for Cold-Formed Members and Sheeting. British Standard Institute: London, UK, 2006.
  38. Xu, Y.; Zheng, B.; Zhang, M. Capacity prediction of cold-formed stainless steel tubular columns using machine learning methods. J. Constr. Steel Res. 2021, 182, 106682. [Google Scholar] [CrossRef] [Scilit]
  39. Mojtabaei, S.M.; Ye, J.; Hajirasouliha, I. Development of optimum cold-formed steel beams for serviceability and ultimate limit states using Big Bang-Big Crunch optimisation. Eng. Struct. 2019, 195, 172–181. [Google Scholar] [CrossRef] [Scilit]
  40. Mojtabaei, S.M.; Becque, J.; Hajirasouliha, I.; Khandan, R. Predicting the buckling behaviour of thin-walled structural elements using machine learning methods. Thin-Walled Struct. 2023, 184, 110518. [Google Scholar] [CrossRef] [Scilit]
  41. Hajihosseinlou, M.; Maghsoudi, A.; Ghezelbash, R. A Novel Scheme for Mapping of MVT-Type Pb–Zn Prospectivity: LightGBM, a Highly Efficient Gradient Boosting Decision Tree Machine Learning Algorithm. Nat. Resour. Res. 2023, 32, 2417–2438. [Google Scholar] [CrossRef] [Scilit]
  42. Simwanda, L.; Ikotun, B.D. Prediction of Torque Capacity in Circular Concrete-Filled Double-Skin Tubular Members under Pure Torsion via Machine Learning and Shapley Additive Explanations Interpretation. Buildings 2024, 14, 1040. [Google Scholar] [CrossRef] [Scilit]
  43. Prokhorenkova, L.; Gusev, G.; Vorobev, A.; Dorogush, A.V.; Gulin, A. CatBoost: Unbiased boosting with categorical features. In Advances in Neural Information Processing Systems 31 (NeurIPS 2018); Curran Associates, Inc.: Red Hook, NY, USA, 2018; pp. 6638–6648. [Google Scholar]
  44. Shahraki, A.; Abbasi, M.; Haugen, Ø. Boosting algorithms for network intrusion detection: A comparative evaluation of Real AdaBoost, Gentle AdaBoost and Modest AdaBoost. Eng. Appl. Artif. Intell. 2020, 94, 103770. [Google Scholar] [CrossRef] [Scilit]
  45. Huang, X.; Jiang, K.; Zhao, O. Unified machine-learning-aided design of cold-formed steel channel section columns with different buckling modes at ambient and elevated temperatures. Eng. Struct. 2024, 320, 118875. [Google Scholar] [CrossRef] [Scilit]
  46. Jung, Y. Multiple predicting K-fold cross-validation for model selection. J. Nonparametric Stat. 2018, 30, 197–215. [Google Scholar] [CrossRef] [Scilit]
  47. Wong, C.; Lyons, M. Mobilising Across the Nation to Build the Homes Our Children Need, the Lyons Housing Review; Digital Creative Services: London, UK, 2018. [Google Scholar]
  48. Akiba, T.; Sano, S.; Yanase, T.; Ohta, T.; Koyama, M. Optuna: A next-generation hyperparameter optimization framework. In Proceedings of the 25th ACM SIGKDD International Conference on Knowledge Discovery & Data Mining; ACM: New York, NY, USA, 2019; pp. 2623–2631. [Google Scholar] [CrossRef] [Scilit]
  49. Joy, T.T.; Rana, S.; Gupta, S.; Venkatesh, S. Fast hyperparameter tuning using Bayesian optimization with directional derivatives. Knowl. -Based Syst. 2020, 205, 106247. [Google Scholar] [CrossRef] [Scilit]
  50. Simwanda, L.; Gatheeshgar, P.; Sykora, M.; Sejkot, P.; David, A.B.; Olalusi, O.B. Local buckling strength prediction of slotted cold-formed steel beams using ensemble learning. J. Constr. Steel Res. 2026, 236, 110024. [Google Scholar] [CrossRef] [Scilit]
  51. Degtyarev, V.; Naser, M. Boosting machines for predicting shear strength of CFS channels with staggered web perforations. In Proceedings of the Structures; Elsevier: Amsterdam, The Netherlands, 2021; pp. 3391–3403. [Google Scholar]
  52. Iron, A. Commentary on North American Specification for the Design of Cold-Formed Steel Structural Members; American Iron and Steel Institute: Washington, DC, USA, 2002. [Google Scholar]
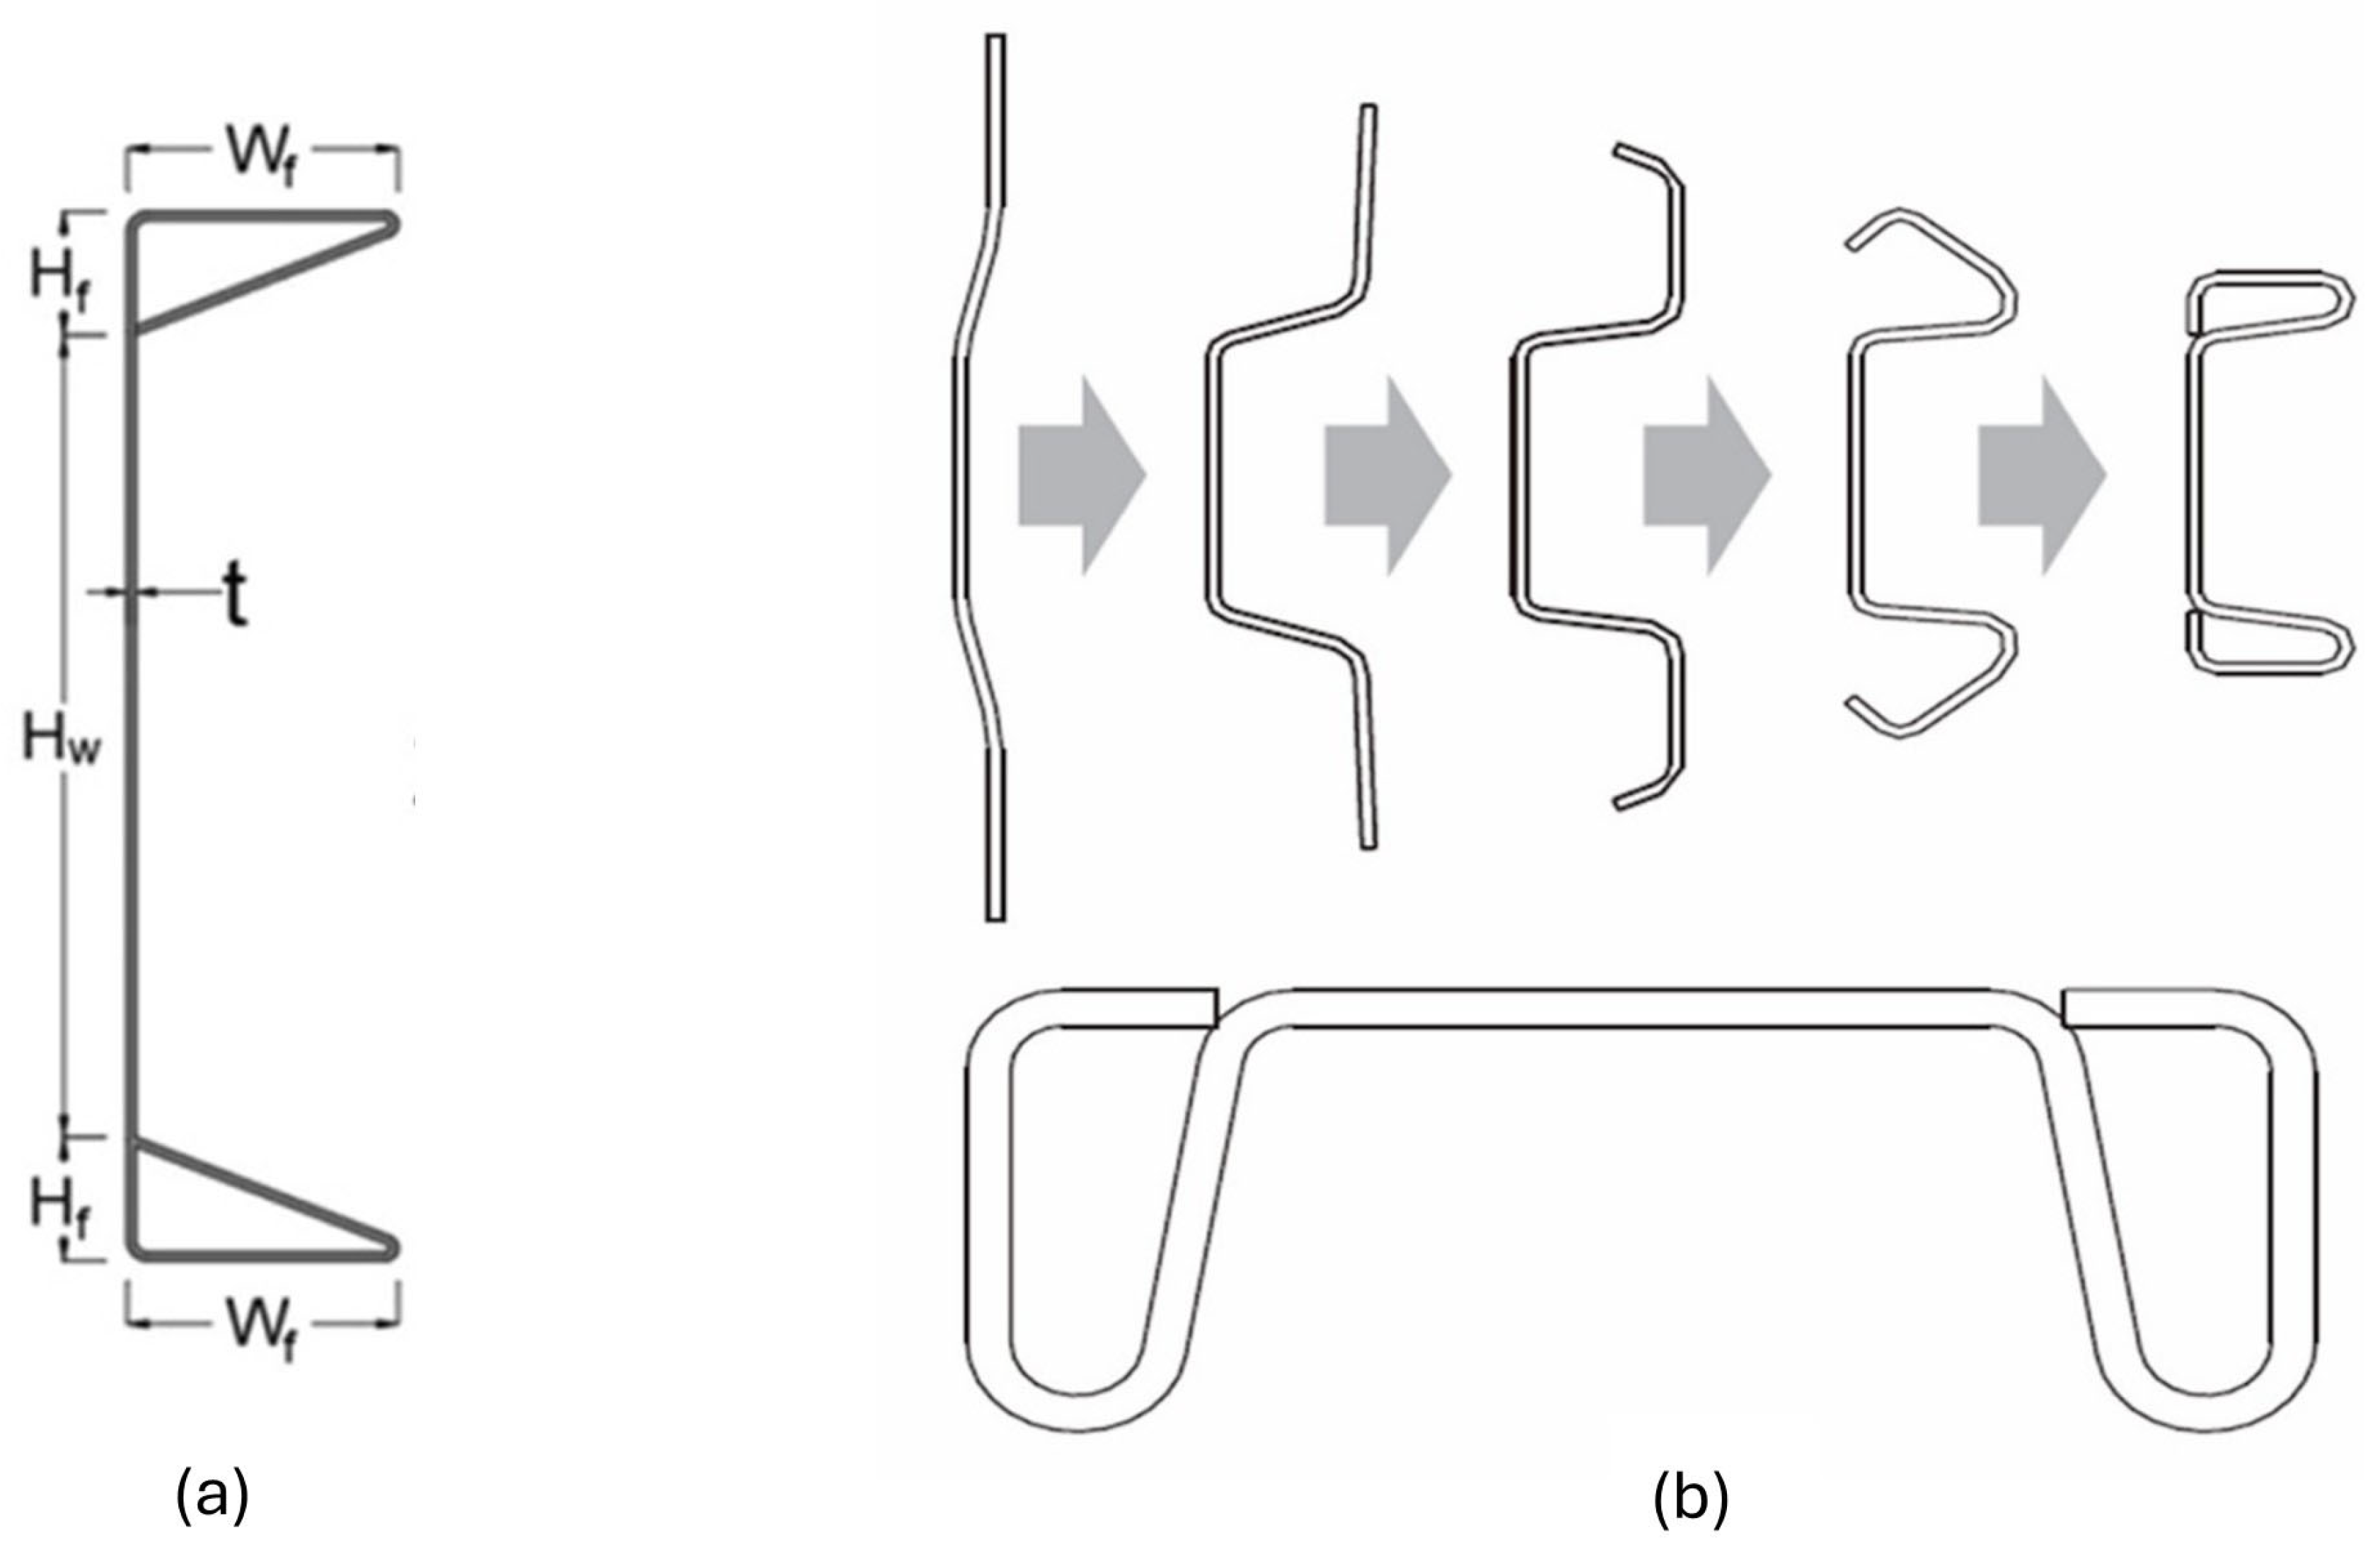
Figure 1. (a) Standard MCO beam profile [11] and (b) manufacturing process of [9].
Buildings 16 01497 g001
Figure 2. Mesh sensitivity analysis (section 150 mm × 45 mm × 15 mm with 1.0 mm thickness and 300 MPa yield strength).
Buildings 16 01497 g002
Figure 3. MCO and WSPs adopted mesh scheme.
Buildings 16 01497 g003
Figure 4. Elastic perfectly plastic material model, where σ is stress, σ 0 is nominal yield stress and ɛ is strain.
Buildings 16 01497 g004
Figure 5. Three-point simply supported boundary conditions and load application.
Buildings 16 01497 g005
Figure 6. Finite element analysis method.
Buildings 16 01497 g006
Figure 7. Profile notation of LSB.
Buildings 16 01497 g007
Figure 8. Comparison between experimental and FE shear-displacement curves 200 mm × 45 mm × 1.6 mm [36].
Buildings 16 01497 g008
Figure 9. Failure mode of FEA model for section 200 mm × 45 mm × 1.6 mm.
Buildings 16 01497 g009
Figure 10. MCO notation of the specimen for the parametric study [11].
Buildings 16 01497 g010
Figure 11. MCO beam failure mechanism. (a) Pre-loading, (b) pre-failure, (c) failure and (d) post-failure for section 150 mm × 45 mm × 15 mm × 3.0 mm with 600 MPa.
Buildings 16 01497 g011
Figure 12. Architecture and mechanism of the ANN algorithm.
Buildings 16 01497 g012
Figure 13. Architecture and mechanism of the tree-based ensemble models.
Buildings 16 01497 g013
Figure 14. Filled contour plots showing the distribution of data samples in relation to ultimate shear capacity and basic variables for MCO beams. Each subplot illustrates the density of data points for: (a) H w vs. V u , (b) W f vs. V u , (c) D f vs. V u , (d) t vs. V u , and (e) f y vs. V u . Darker red regions indicate higher data-sample density, whereas lighter regions indicate lower density.
Buildings 16 01497 g014
Figure 15. Pearson correlation heatmap showing pairwise linear relationships among geometric and material features and ultimate shear capacity Vu for MCO beams.
Buildings 16 01497 g015
Figure 16. Dataset partitioned using five-fold cross-validation. Shaded blocks indicate the fold used for validation in each iteration, while unshaded blocks represent the folds used for training.
Buildings 16 01497 g016
Figure 17. Comparison between training and testing predictions of the ML models for the prediction of ultimate shear capacity.
Buildings 16 01497 g017
Figure 18. Parity plots for hold-out test predictions of the six machine-learning models, including empirical 95% prediction intervals for V ^ u estimated by bootstrap resampling of the training data.
Buildings 16 01497 g018
Figure 19. SHAP explanation of ultimate shear capacity failure predictions.
Buildings 16 01497 g019
Figure 20. Feature importance of the six different models based on mean absolute SHAP-value.
Buildings 16 01497 g020
Table 1. Validation procedure summary [36].
(hw × bf × bl × t)Aspect RatiofyVTestVFEAVTest/VFEA
(mm × mm × mm × mm)(a/d1)(Mpa)(kN)(kN)(kN)
200 × 45 × 1.61.5452.156.856.381.01
150 × 45 × 2.01.0437.168.568.81.00
200 × 60 × 2.01.0440.488.288.950.99
250 × 75 × 2.51.0446140136.61.02
300 × 75 × 2.51.0449.1144152.80.94
Mean0.99
COV0.03
Note: Hw—Section height, bf—Flange width, bl—Lip length, fy—Yield strength, Vtest—Ultimate test shear capacity, VFEA—FE ultimate shear capacity, a—Shear span and d1—Clear web height.
Table 2. Summary of parametric plan.
MCO Beam Profile No.HwbfbltfyNo. of Models
(mm)(mm)(mm)(mm)(MPa)
115045151.0, 1.5, 2.0, 2.5, 3.0300, 450, 60015
220045151.0, 1.5, 2.0, 2.5, 3.0300, 450, 60015
320060201.0, 1.5, 2.0, 2.5, 3.0300, 450, 60015
425060201.0, 1.5, 2.0, 2.5, 3.0300, 450, 60015
525075251.0, 1.5, 2.0, 2.5, 3.0300, 450, 60015
630075251.0, 1.5, 2.0, 2.5, 3.0300, 450, 60015
730090301.0, 1.5, 2.0, 2.5, 3.0300, 450, 60015
Total No. Models105
Note: H—section depth (Hw + 2Hf), bf—flange with, bl—flange depth, t—thickness, fy—yield strength.
Table 3. Statistical summary of dataset features.
FeatureSymbolUnitMin25%50%75%MaxVariable Type
Height H w mm150.0200.0200.0300.0300.0Input
Flange width W f mm45.045.060.075.090.0Input
Flange depth D f mm15.015.025.025.030.0Input
Thickness t mm1.01.52.02.53.0Input
Yield strength f y MPa300.0300.0450.0600.0600.0Input
Ultimate shear capacity V u kN25.658.4893.5141.0258.48Output
Table 4. Model performance from repeated random train–test resampling (50 repeats; mean ± 95% CI).
ModelR2
(Mean ± 95% CI)
RMSE
(Mean ± 95% CI)
MAE
(Mean ± 95% CI)
MAPE %
(Mean ± 95% CI)
CatBoost0.959 ± 0.00810.51 ± 1.326.46 ± 0.646.49 ± 0.51
LightGBM0.954 ± 0.00811.07 ± 1.137.47 ± 0.647.96 ± 0.55
XGBoost0.948 ± 0.01011.70 ± 1.188.23 ± 0.749.00 ± 0.73
GBM0.941 ± 0.01112.44 ± 1.208.76 ± 0.739.01 ± 0.61
ANN (MLP)0.936 ± 0.01013.09 ± 1.249.10 ± 0.7010.32 ± 0.64
AdaBoost0.876 ± 0.02018.27 ± 1.5813.20 ± 1.0512.88 ± 0.75
Note: Values are reported as mean ± 95% confidence interval obtained from 50 repeated random 80/20 train–test splits. The 95% CI is computed as x ˉ ± t 0.975 , n − 1   s / n , where n = 50 .
Table 5. AISI-style design calibration factors for ML-predicted ultimate shear capacity P V u , r e f / V u , M L .
Model P m V P ϕ v Ω v
CatBoost0.9850.0930.8691.840
LightGBM1.0080.1410.8431.897
GBM1.0060.1490.8331.920
AdaBoost1.0020.1640.8131.969
XGBoost1.0180.2010.7812.049
ANN1.0290.2390.7402.163
Table 6. Rank of feature of the different models using SHAP.
Rank#1#2#3#4#5
ML modeltfyDfWfHw
Table 7. Local sensitivity of ML-predicted ultimate shear capacity for a representative MCO section under ± 5 % perturbations in thickness, t , and yield strength, f y .
Model(t) − 5%(t) + 5% ( f y ) − 5% ( f y ) + 5%
ANN−7.2412.87−3.303.30
AdaBoost0.000.000.000.00
GBM0.000.000.000.00
LightGBM0.000.000.000.00
CatBoost0.000.000.000.00
XGBoost−29.390.00−35.080.00
Disclaimer/Publisher’s Note: The statements, opinions and data contained in all publications are solely those of the individual author(s) and contributor(s) and not of MDPI and/or the editor(s). MDPI and/or the editor(s) disclaim responsibility for any injury to people or property resulting from any ideas, methods, instructions or products referred to in the content.