1. Introduction
Modern engineering has increasingly stringent requirements for foundations. These core requirements center on how to improve the foundation bearing capacity and more accurately control its settlement deformation. Rock-socketed piles, characterized by good shaft integrity and high axial bearing capacity, are widely used in high-rise buildings and heavy construction. In engineering practice, the roughness of the borehole wall resulting from manual or mechanical drilling is a significant factor influencing the ultimate bearing capacity. Liu et al. [
1] conducted a statistical analysis of 68 surface curves of rock sockets and found that the larger the RF, the larger the mobilized shaft resistance, and that the analytical solution generally overestimates the mobilized shaft resistance of rock-socketed piles under the same Δs. Regarding the bearing characteristics of rock-socketed piles, some scholars have employed various research methods, including model testing, theoretical derivation, and numerical simulation. Research has primarily focused on analyzing the influence patterns of key factors such as shaft roughness [
2,
3,
4,
5,
6], socketed depth [
7,
8], dynamic loading [
9,
10], and rock layer strength. Zhao [
11], Shen [
12], and Jiang [
13] conducted experiments to analyze the shear characteristics of the concrete–rock interface. Considering the complex and diverse factors influencing pile shaft roughness, and for the convenience of calculation and engineering practice, the pile shaft surface roughness is often simulated in different forms, such as triangular [
14,
15,
16], circular arc [
4], and trapezoid shapes [
17]. Building upon the Horvath and Monash models as well as the Barton model, the joint roughness coefficient (JRC) and the roughness factor RF were proposed [
18,
19,
20,
21] to specify the contribution of roughness to the shear strength of structural planes. A substantial portion of the side resistance originates from the socketed segment, and the effect of roughness within this segment on ultimate bearing capacity is also a research focus. Dai G [
22] and Murali et al. [
23] explored the effects of shaft roughness on the load response and interfacial load-bearing micromechanics. Wang Q Y et al. [
24] found that as the pile surface roughness increases, the load–settlement curve becomes gentler. This leads to the pile shaft resistance accounting for more than 70% of the total load, while simultaneously reducing the proportion of pile tip resistance. Existing studies have mostly focused on single rock layers or homogeneous rock masses, whereas in practice, rock-socketed piles often penetrate multiple complex rock layers of varying strength, and the response mechanisms of different rock layers to pile shaft roughness may differ significantly. Some studies indicate that side resistance increases monotonically with roughness, while others suggest that an optimal roughness range may exist, yet clear experimental evidence and mechanistic explanations are lacking. Most research has primarily focused on the enhancement effect of roughness on total bearing capacity, while systematic experimental investigations have been lacking regarding the attenuation pattern of axial force along depth, the distribution characteristics of side resistance in different rock layers, and the variation pattern of the load sharing ratio between end bearing and side resistance with roughness.
Based on the reconstruction project of Shaoping Bridge, this paper conducts indoor model tests on pile shaft roughness in complex layered rock strata. Introducing Horvath’s definition of roughness [
25], the influence of RF on load transfer behavior in complex layered rock formations is investigated. This study provides experimental evidence for quantifying how RF affects the load sharing ratio between side resistance and end bearing and proposes a shear–dilation–damage coupling hypothesis to explain the observed non-monotonic behavior. These contributions are primarily experimental and interpretative, offering new insights into interface behavior under complex geological conditions.
2. Engineering Situation
Shaoping Bridge is located near Shaoping Village, Xiashi Town, Pingxiang City, Chongzuo City, at K4 + 122 on County Road X462 from Xiashi to Koushan, spanning the Banling River. Site investigations revealed that due to traffic loads and natural environmental erosion, the technical condition of Shaoping Bridge has deteriorated to varying degrees, with localized defects such as cracks, spalling, and exposed reinforcement. The existing bridge no longer meets the vehicle load requirements of the current engineering standards and urgently requires demolition and reconstruction.
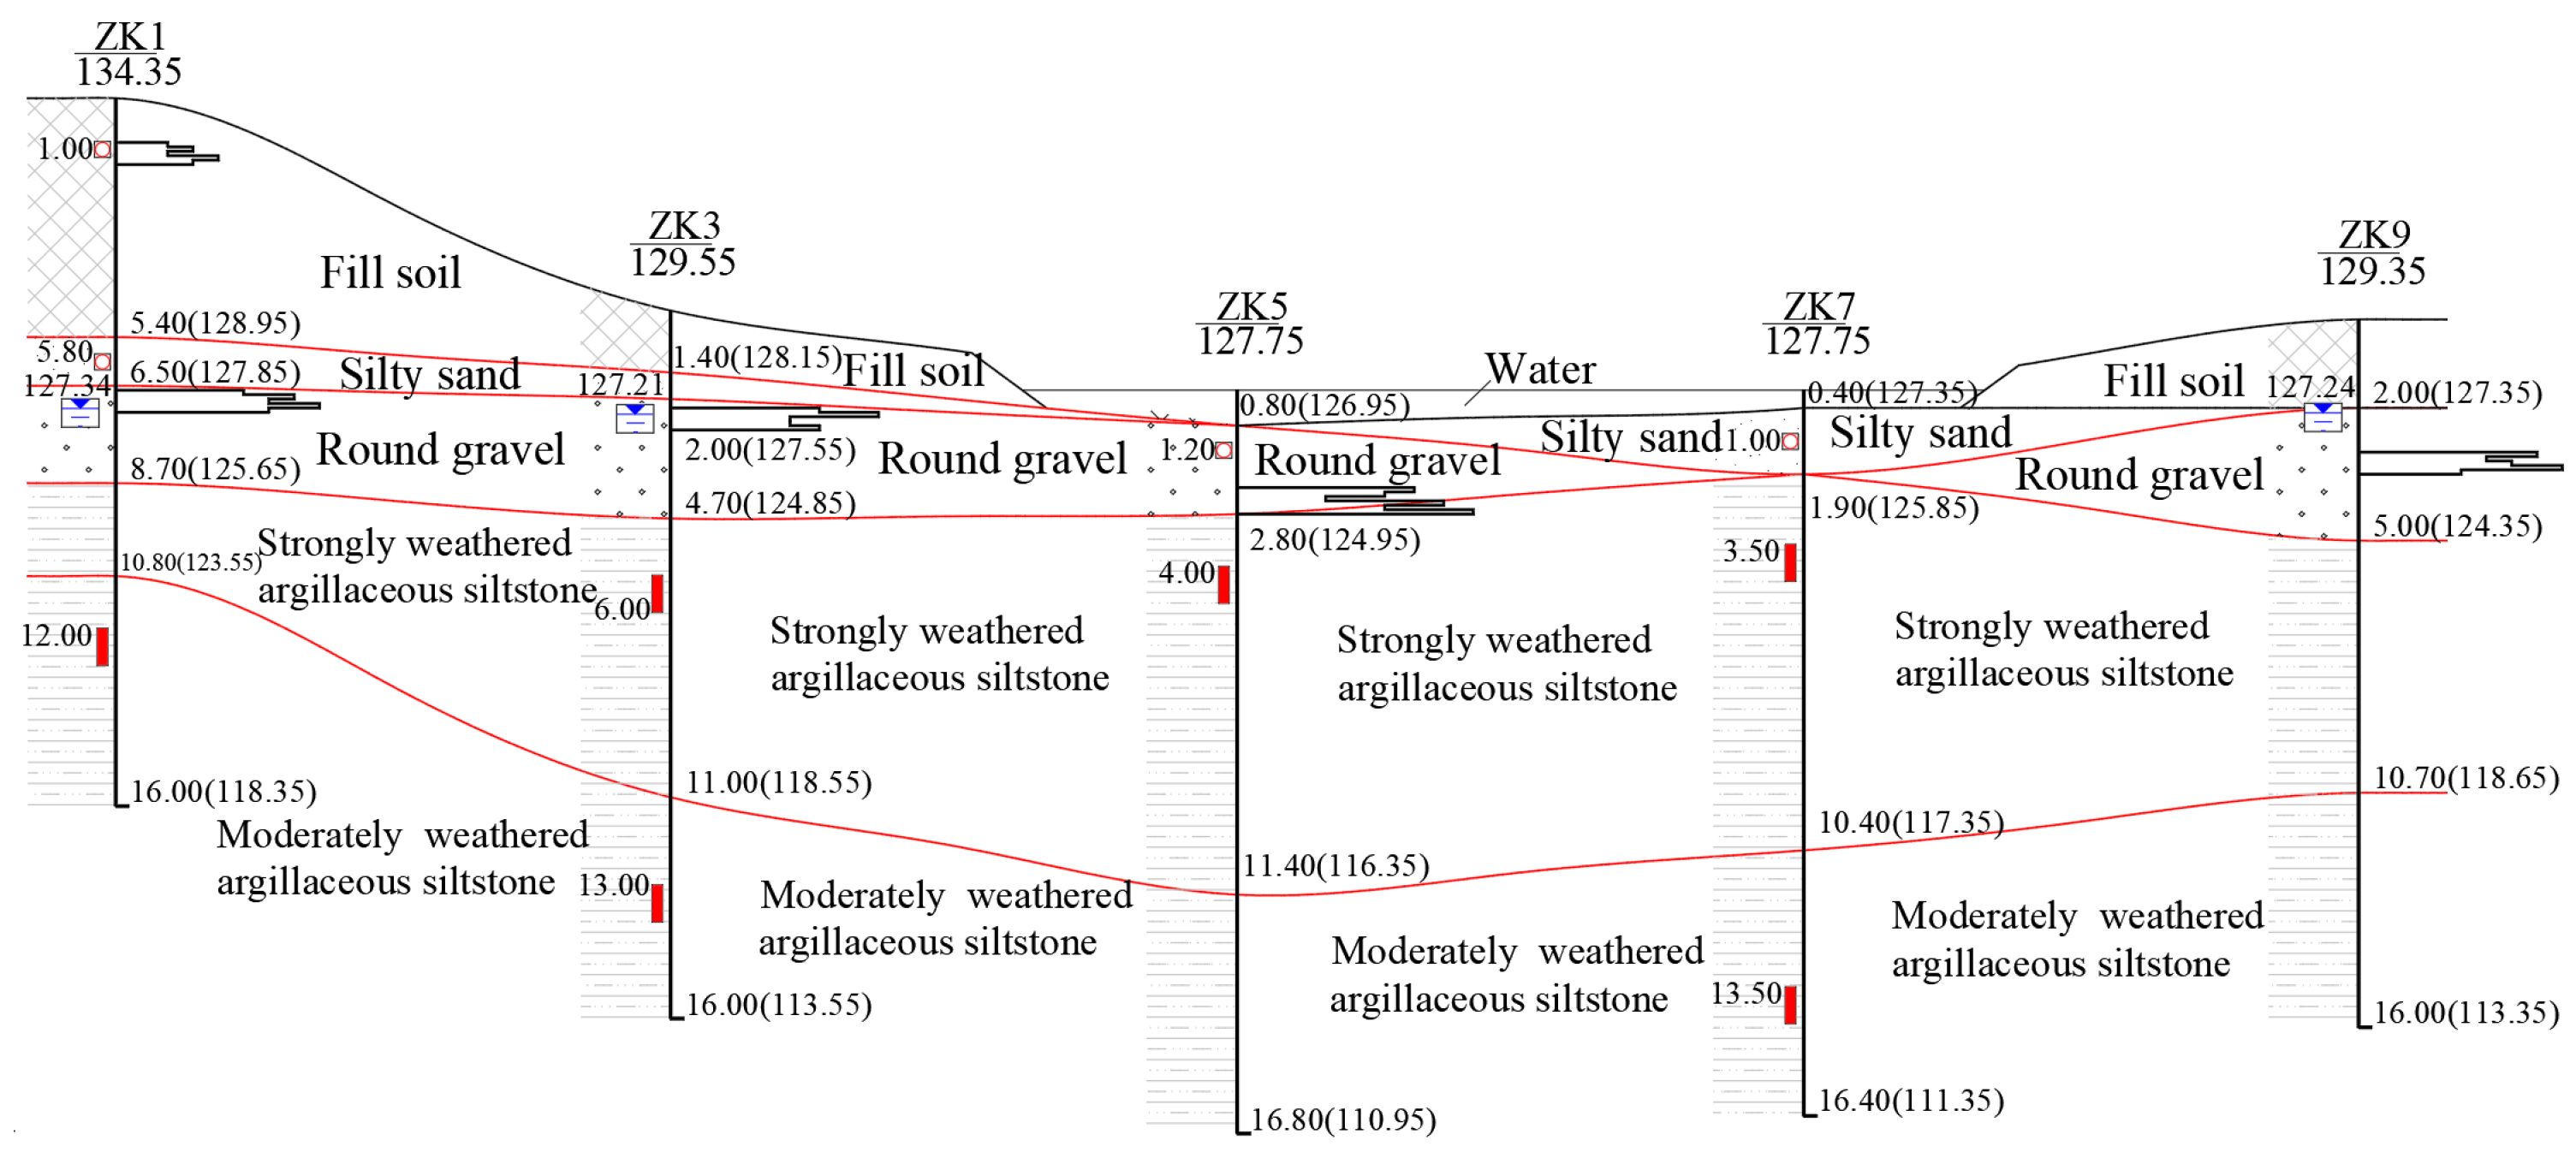
The strata at the bridge site can be generalized into two main units: the overlying Quaternary unconsolidated layer and the underlying Jurassic bedrock (
Figure 1). The unconsolidated layer consists of fill soil ① (Q
4ml), silty sand ② (Q
4al), and round gravel ③ (Q
4al). The bedrock is argillaceous siltstone, exhibiting significant differences in weathering degree: the strongly weathered zone ④ is relatively fragmented, with a compressive strength of only 2.23–4.04 MPa; the moderately weathered zone ⑤ has good integrity, with a significantly increased compressive strength ranging from 8.63 to 12.21 MPa.
Adhering to the principle of safety first, and aiming for economic rationality, minimized traffic impact, and construction convenience, a demolition and reconstruction scheme has been adopted for the old bridge, utilizing rock-socketed cast-in-place pile foundations. Construction processes such as manual excavation or rotary drilling rigs inevitably create irregular concave and convex morphologies on the borehole wall. The presence of soft and hard interbedded rock layers leads to a non-uniform distribution characteristic of borehole wall roughness along the depth direction. When calculating the side resistance, current codes primarily rely on the uniaxial compressive strength. This method provides a standardized calculation path for engineering design. However, the roughness factor is equally critical, as it directly controls the load transfer efficiency at the pile–soil interface, thereby determining whether the lateral resistance can be fully mobilized. Neglecting RF during design may lead to bearing capacity estimation errors, resulting in engineering wastage or safety hazards.
Given this, based on the reconstruction project of Shaoping Bridge, this paper conducts indoor model tests on pile shaft roughness in complex layered rock strata. Introducing Horvath’s definition of roughness, different RF values (0, 0.091, 0.168, 0.234) were set to investigate the bearing characteristics of piles and to provide theoretical support for optimizing the design of rock-socketed piles.
3. Model Test
3.1. Design of Pile Shaft Roughness Morphology
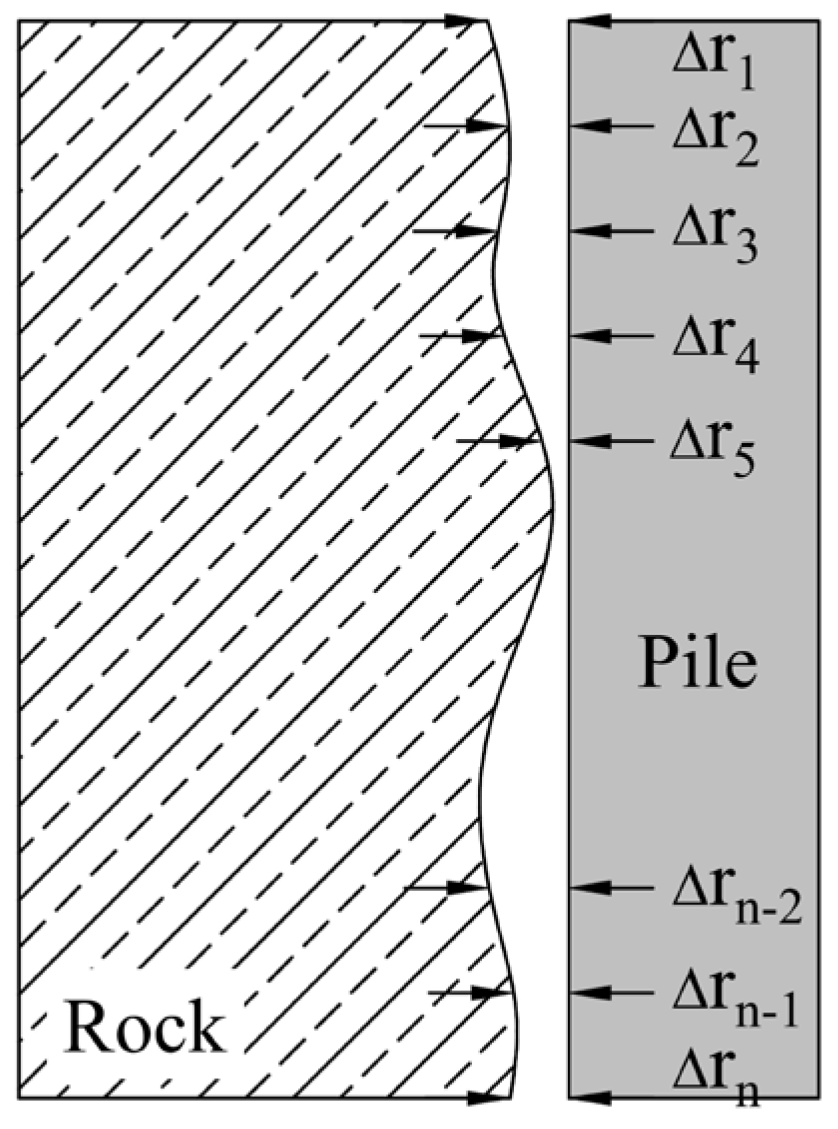
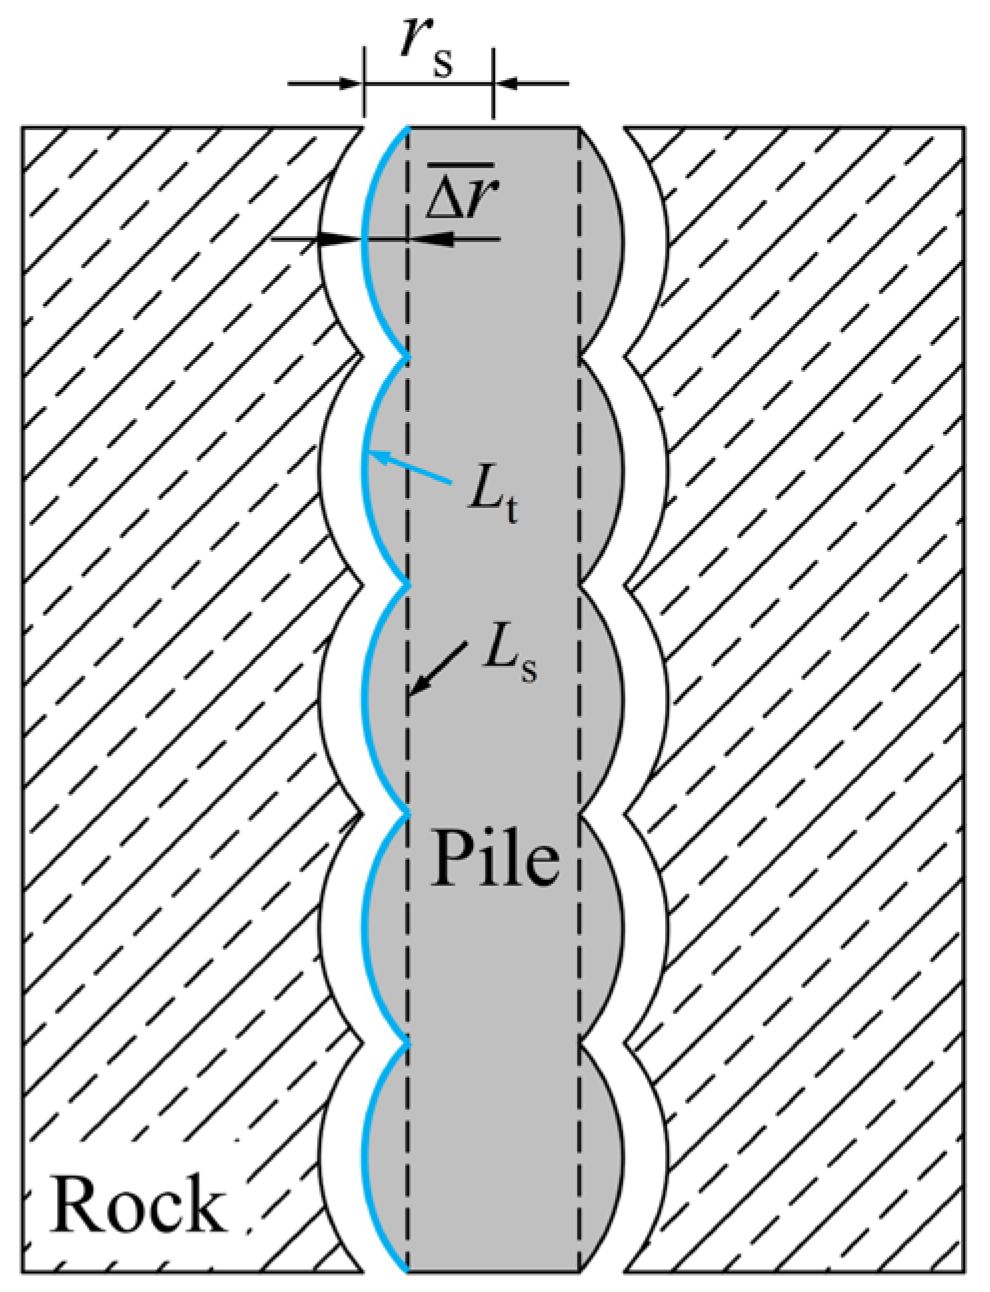
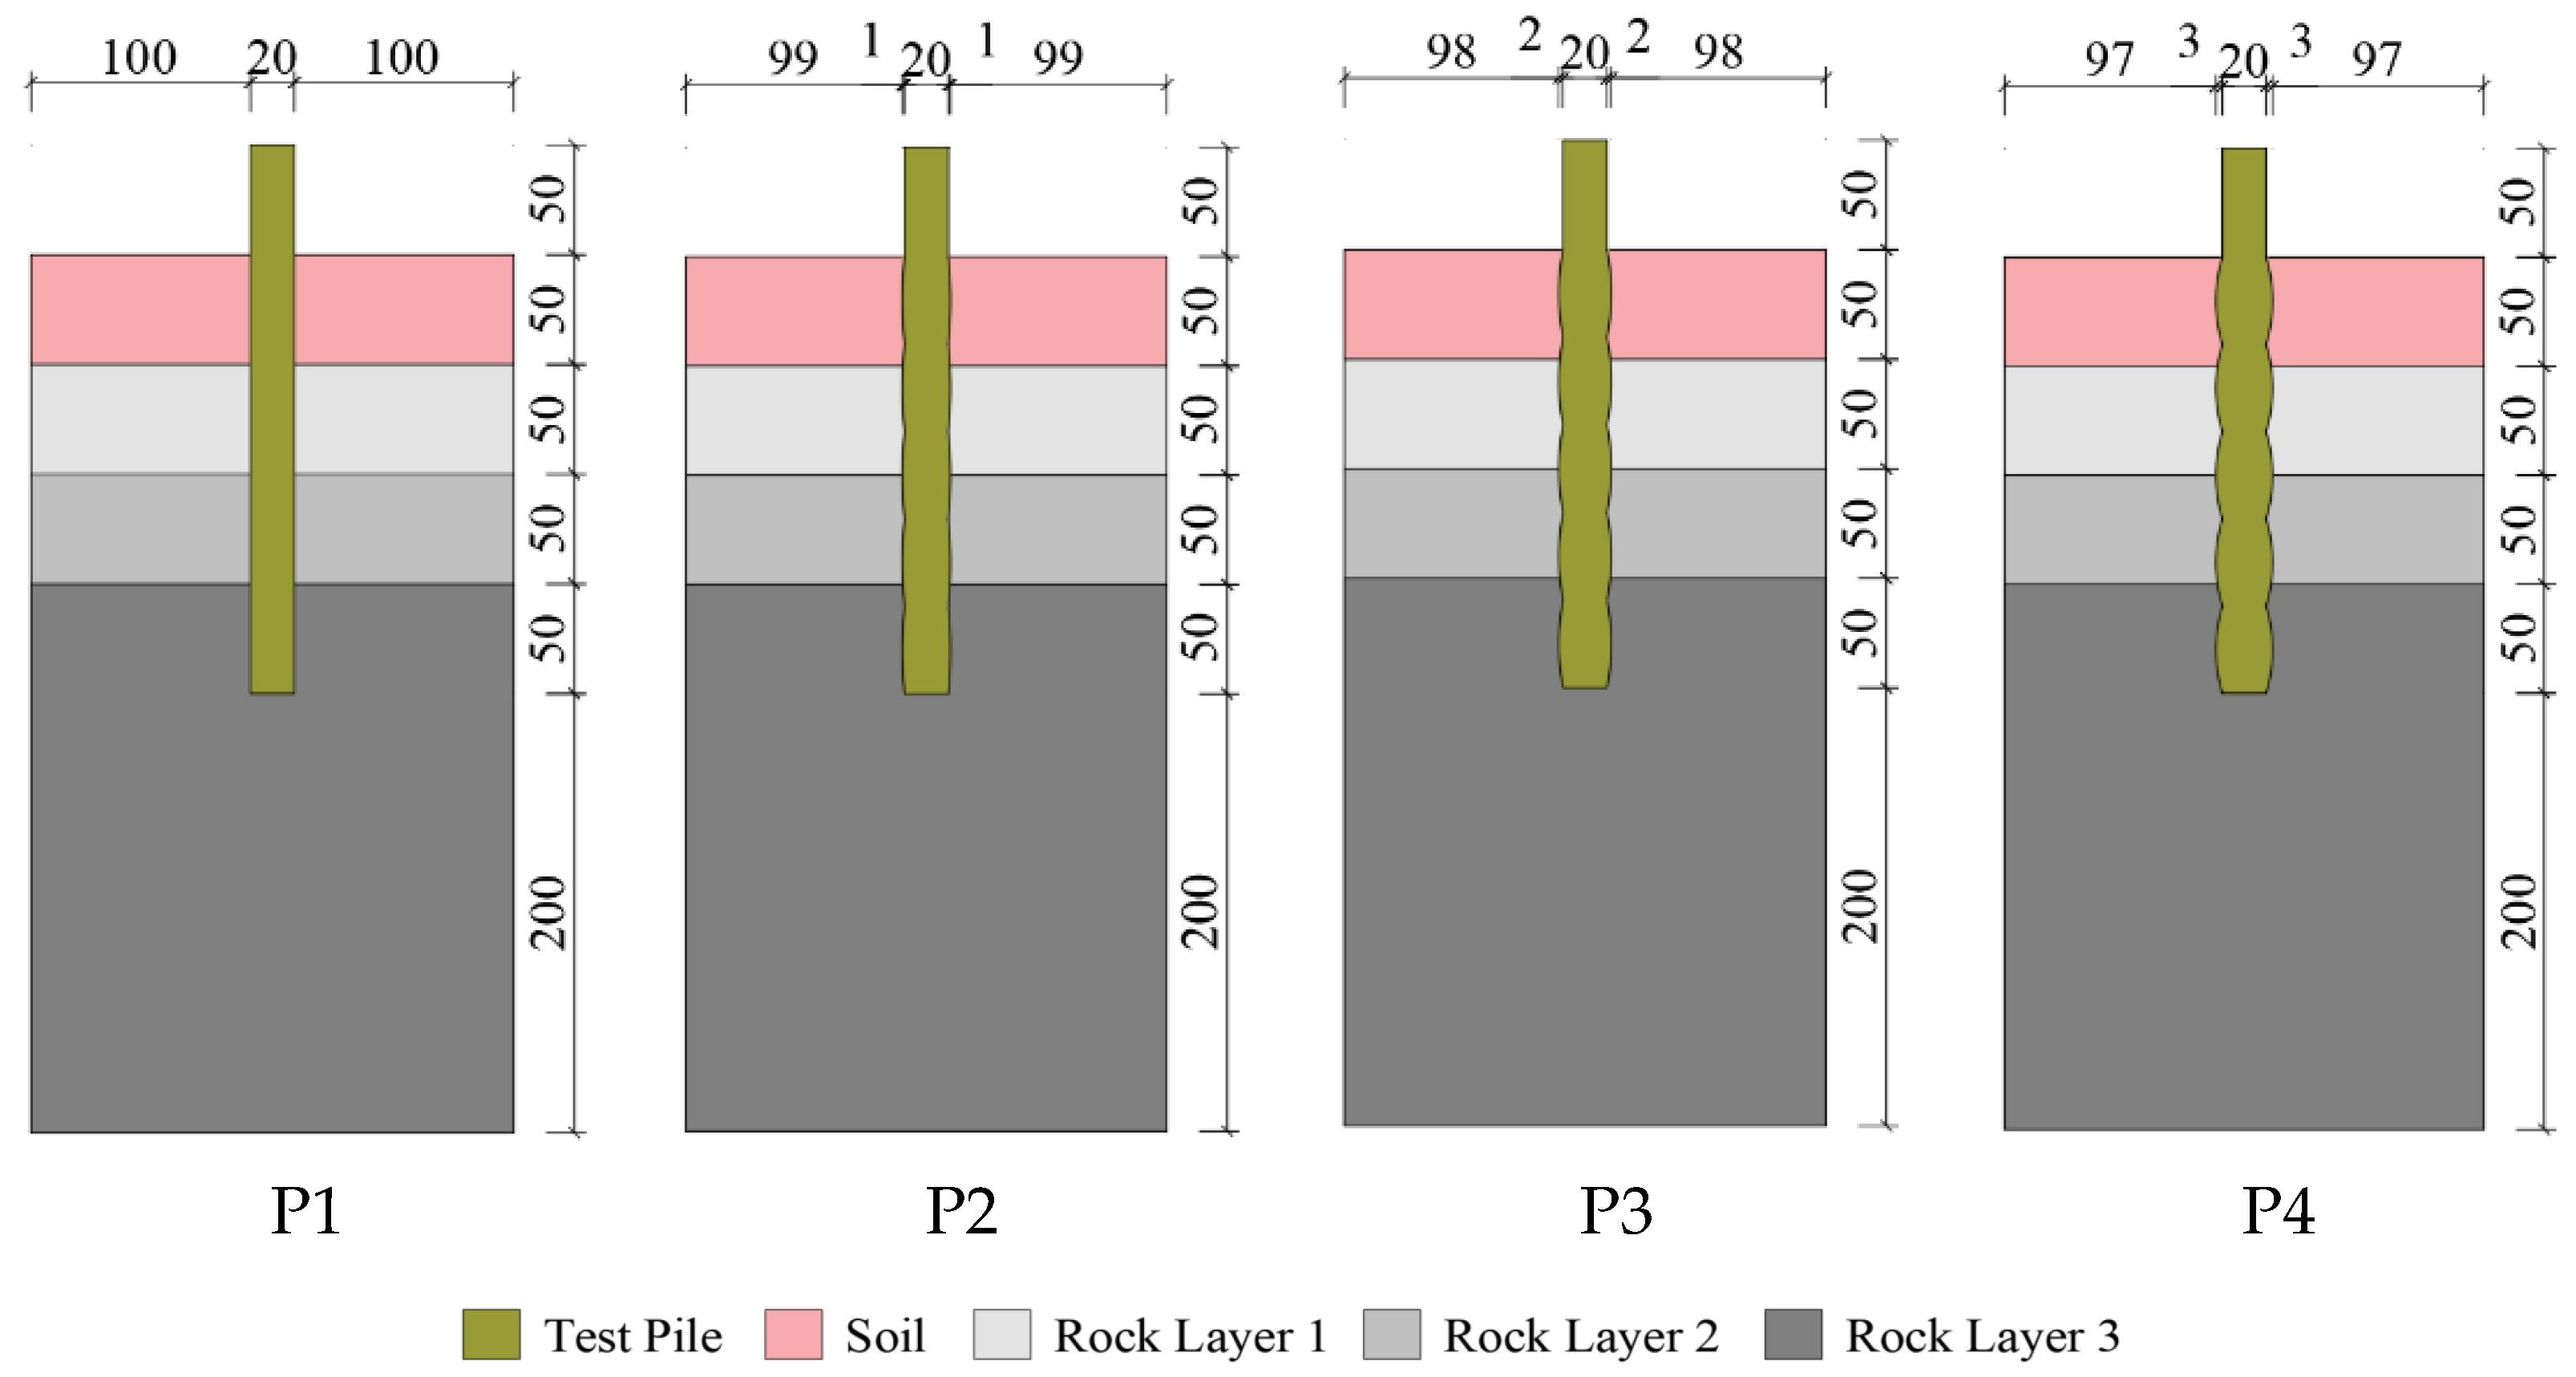
In this test, the pile–rock roughness morphology is assumed to be regularly spaced concave–convex circular arcs. The RF proposed by Horvath is adopted as the quantitative method to describe the borehole wall roughness, as shown in Equations (1) and (2), and
Figure 2. Different
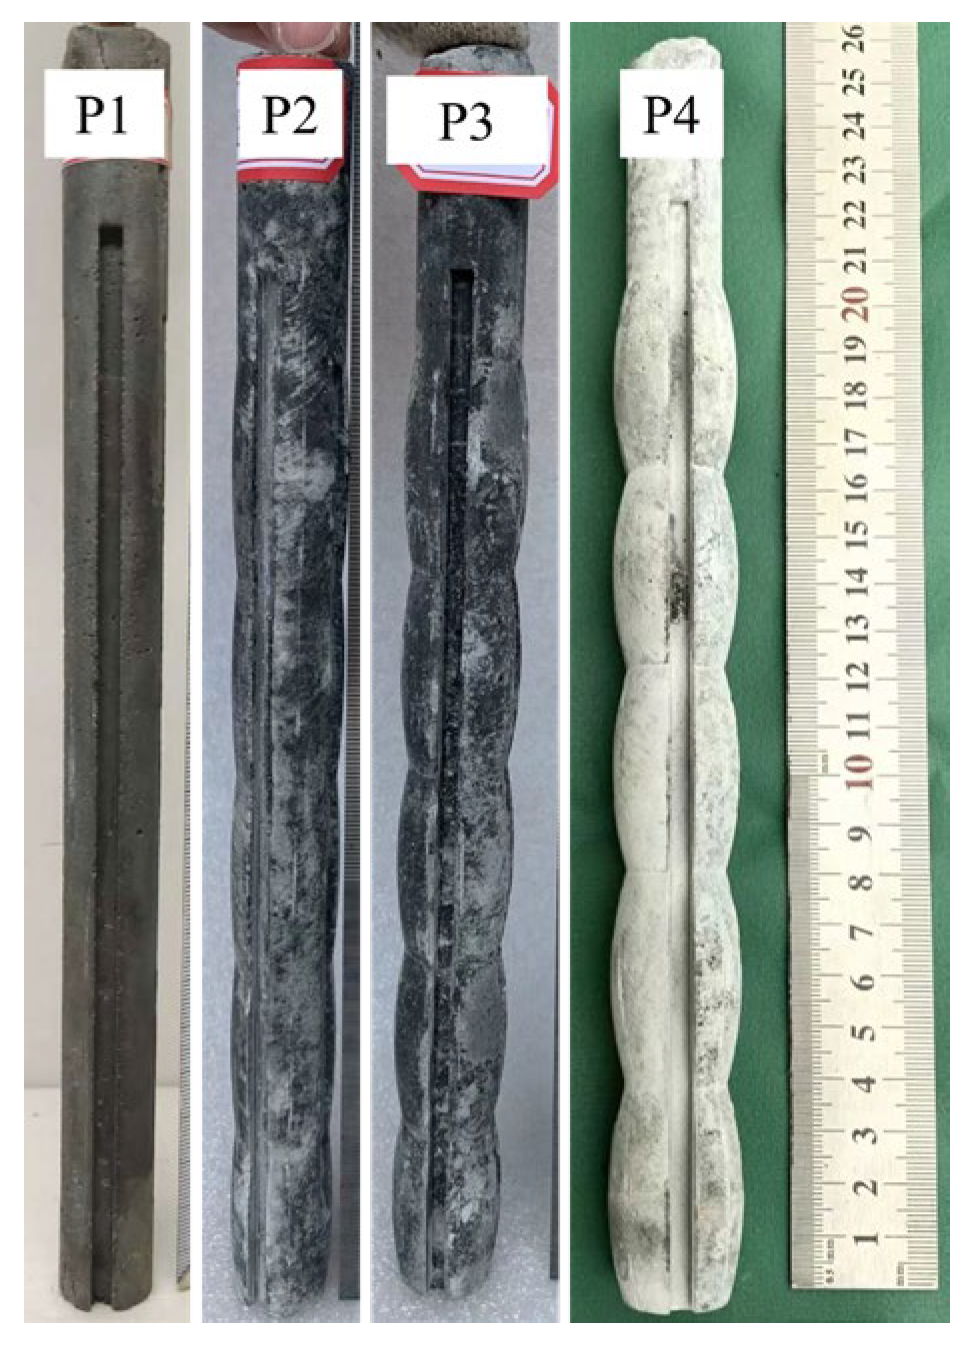
values were designed to represent varying roughness levels of the test piles (
Figure 3). The design schemes for the model piles are presented in
Table 1.
where
is the average radial protrusion;
rs is the average radius;
Lt is the total length of the profile curve;
Ls is the borehole depth. Among these,
reflects the radial undulation;
reflects the depth-wise morphology.
3.2. Model Test Design
Four test piles were selected as the research subjects, and model tests were conducted on single piles. Sheng et al. [
26] indicated that the influence range of pile foundations on the rock and soil mass under upper loads is 5–10 times the pile diameter. By comparing physical model test results with numerical simulations, they demonstrated that when the boundary dimensions exceed 5 times the pile diameter, the discrepancy in bearing capacity between the two methods remains within 10%. The geometric parameters of the model were kept consistent: pile length of 250 mm, pile diameter D = 20 mm, rock-socketed depth of 7.5D, and model dimensions of 220 mm × 220 mm × 400 mm. The model was configured with a soil layer and three rock layers of varying strength, which were arranged along the depth direction as soil layer, Rock Layer I, Rock Layer II, and Rock Layer III, respectively. The test pile was embedded to a depth of 50 mm in each of the rock and soil layers. One test pile without roughness treatment was set as the control group, while the remaining test piles had different roughness factors (
Figure 4).
3.3. Test Procedures
3.3.1. Strain Gauge Arrangement on Pile Shaft
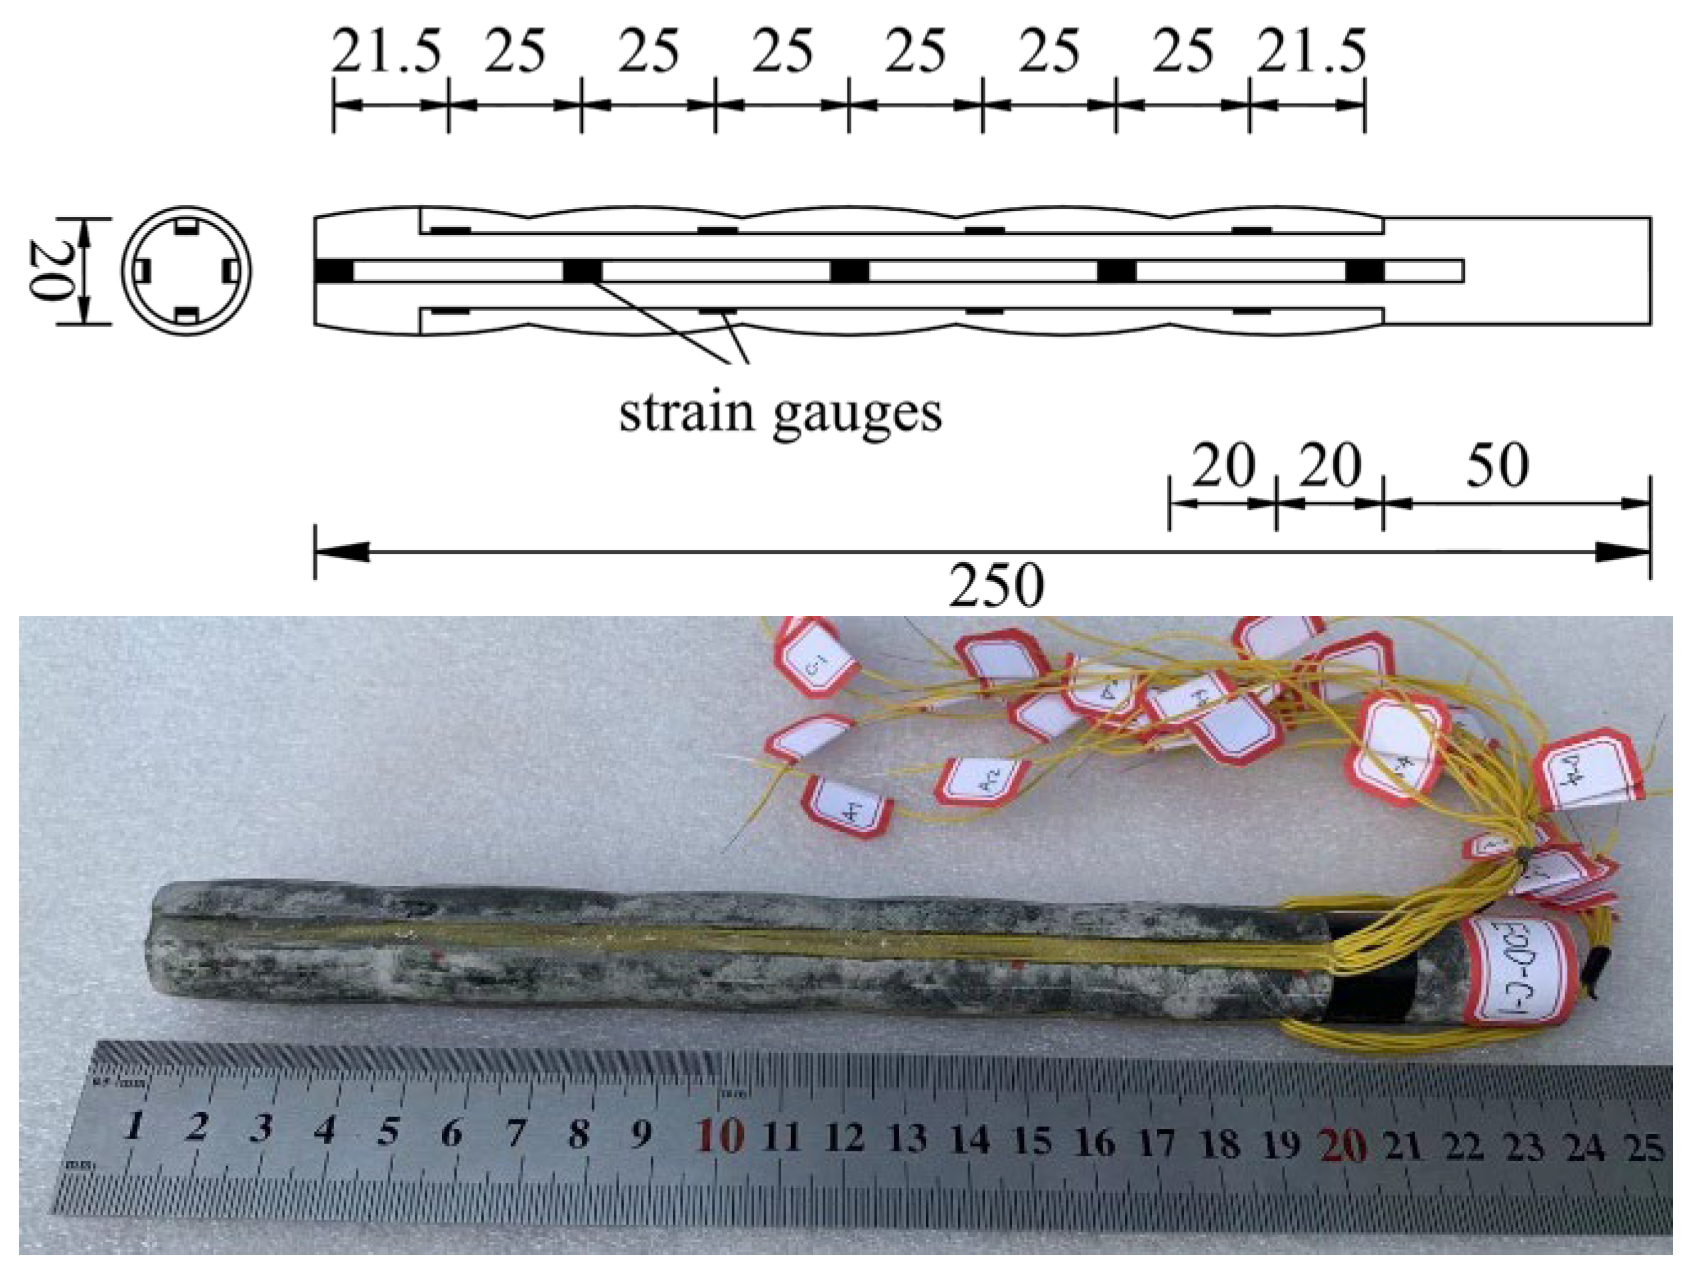
3D printing technology was utilized to fabricate molds for the test piles, enabling the configuration of pile shaft roughness. The model piles were fabricated using high-strength cement mortar with reference to previous studies [
27], and a steel reinforcement cage was incorporated to enhance the flexural strength, as shown in
Figure 5. Electrical resistance strain gauges were adhered along the length of the model piles, arranged at nine cross-sections for attachment. At each section, one strain gauge was adhered within each of the symmetrically positioned grooves, with the symmetrical grooves being adhered alternately (
Figure 6).
3.3.2. Model Pouring
The simulated bedrock was prepared using sand, cement, and water as basic raw materials. To investigate the interface shear characteristics between the test pile and rock masses of varying strengths under different RF values, strict similitude principles were not followed. Instead, the material parameters were primarily selected based on the actual geological conditions of the Shaoping Bridge reconstruction project to simulate strongly weathered, moderately weathered, and unweathered rock masses, reflecting engineering characteristics while taking into account the limitations of the testing equipment. By adjusting the mixing ratios of these three components, different rock layer characteristics were simulated [
28]. An accelerator was also added to achieve the effect of shortening the initial setting time. After 7 days of curing, the actual compressive strengths of Bedrock I, Bedrock II, and Bedrock III were 4.8 MPa, 10.1 MPa, and 15.2 MPa, respectively.
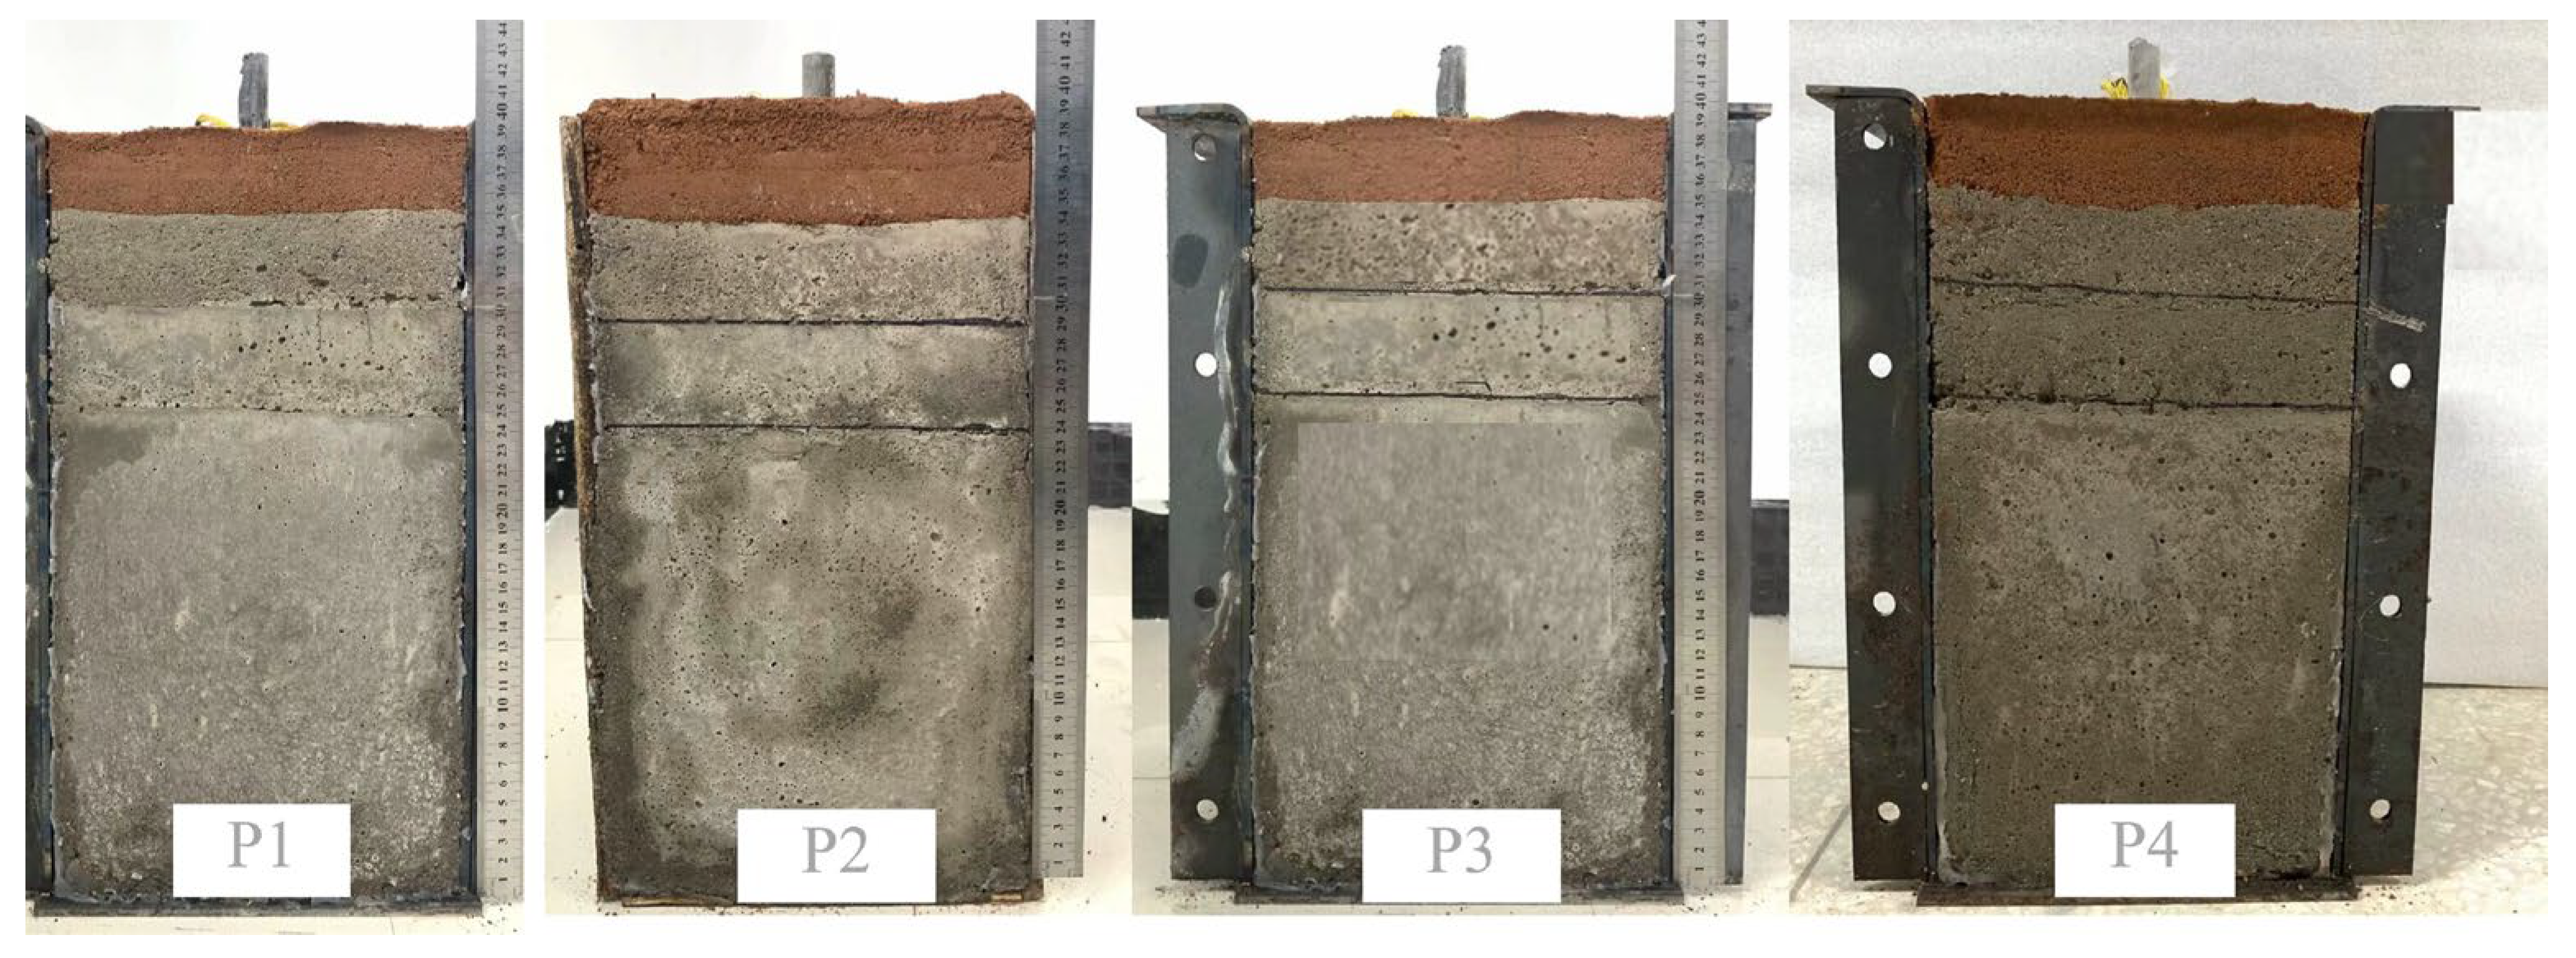
Mixed mortar was prepared according to the design mix proportion, filled in layers, and compacted by vibration. After filling the mixed mortar to the design elevation of Rock III and curing it until the initial setting state, mixed mortar was subsequently poured to the design elevation of Rock II. Rock I was poured after the initial setting of Rock II. The upper part of the model box was also covered with a layer of red clay. The specific layout is shown in
Figure 7.
3.3.3. Model Loading
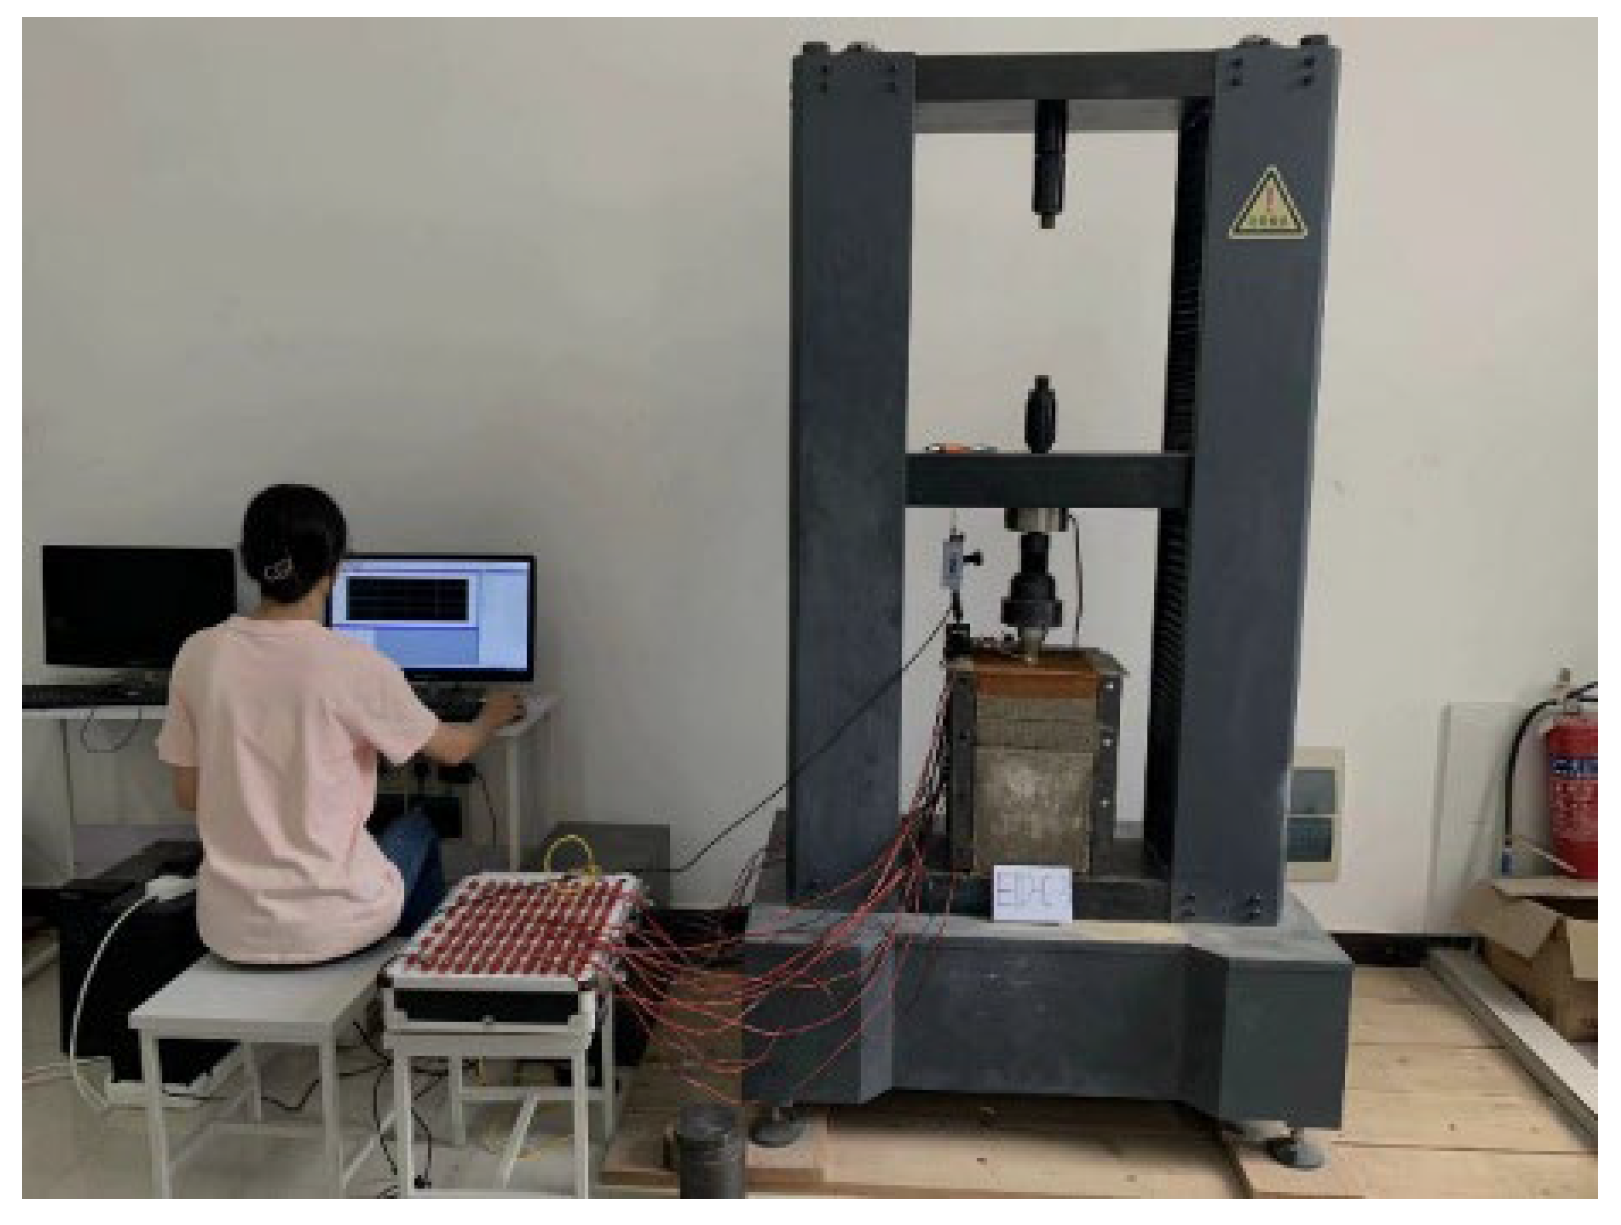
After the model curing was completed, it was placed into the universal testing machine of the loading system. The strain gauges were connected to the ut7110 static stress–strain indicator using the 1/4 bridge method. The YWD-30 displacement transducer was fixed onto the model box to obtain the displacement values. After the instrumentation was connected, the universal testing machine and the strain indicator data acquisition software were operated, channel parameters and acquisition frequency were set, and the strain values were corrected and balanced. The constant penetration rate loading method was adopted. The test was stopped when the test pile body failed or the simulated bedrock failed, and the data were collected and stored. The test setup is shown in
Figure 8.
4. Test Results and Analysis
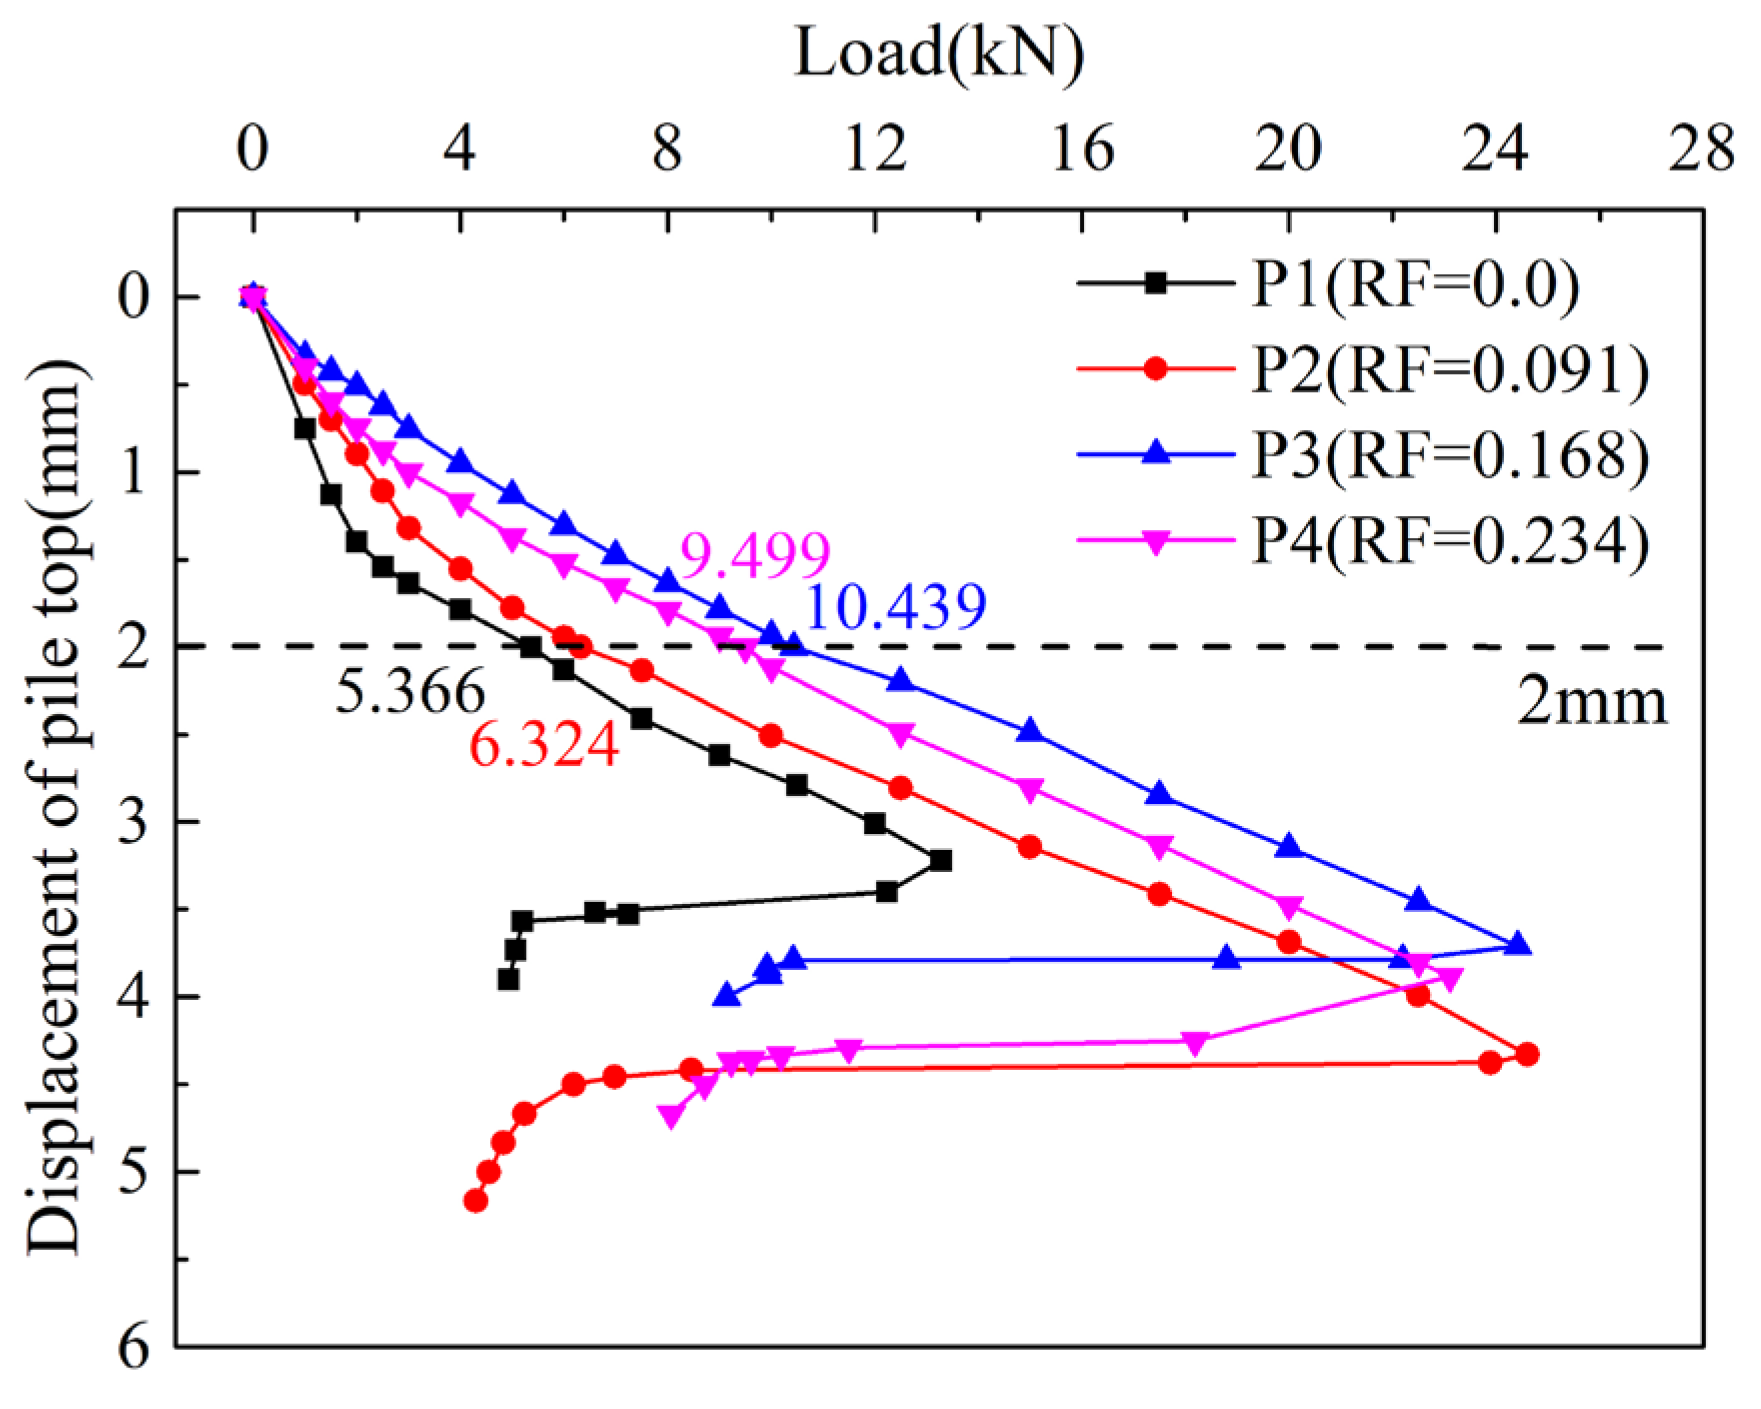
This study established a unified criterion for determining the ultimate load. The specific method was as follows: based on the load–time curve data collected by the universal testing machine, when the cumulative displacement reached 10% of the pile diameter (in this test, the pile diameter D = 20 mm, corresponding to a displacement of 2 mm), the load value corresponding to this point on the curve was identified as the ultimate bearing capacity of the test pile. This criterion was based on reference [
29]. In this indoor test, splitting failure occurred in the pile head portion. Nevertheless, the test was completed as planned, and key data under various load levels were successfully collected, including pile top displacement values and strain gauge readings at various cross-sections. Through calculation and conversion of these raw data, four sets of key relationship curves were obtained and ultimately plotted.
4.1. Data Processing
During the loading process, the resistance strain gauge continuously collected the strain responses at various measuring points on the pile shaft. After data acquisition was completed, Equation (3) was applied to convert the strain values into axial forces
along the pile shaft. Simultaneously, further calculations combined with Equation (4) were performed to isolate the pile shaft resistance
, providing data support for the subsequent analysis of bearing characteristics.
where
is the elastic modulus of the test pile;
and
are the strain values of symmetrically arranged strain gauges;
is the cross-sectional area of the test pile;
is the distance between adjacent strain gauges.
4.2. Failure Mode
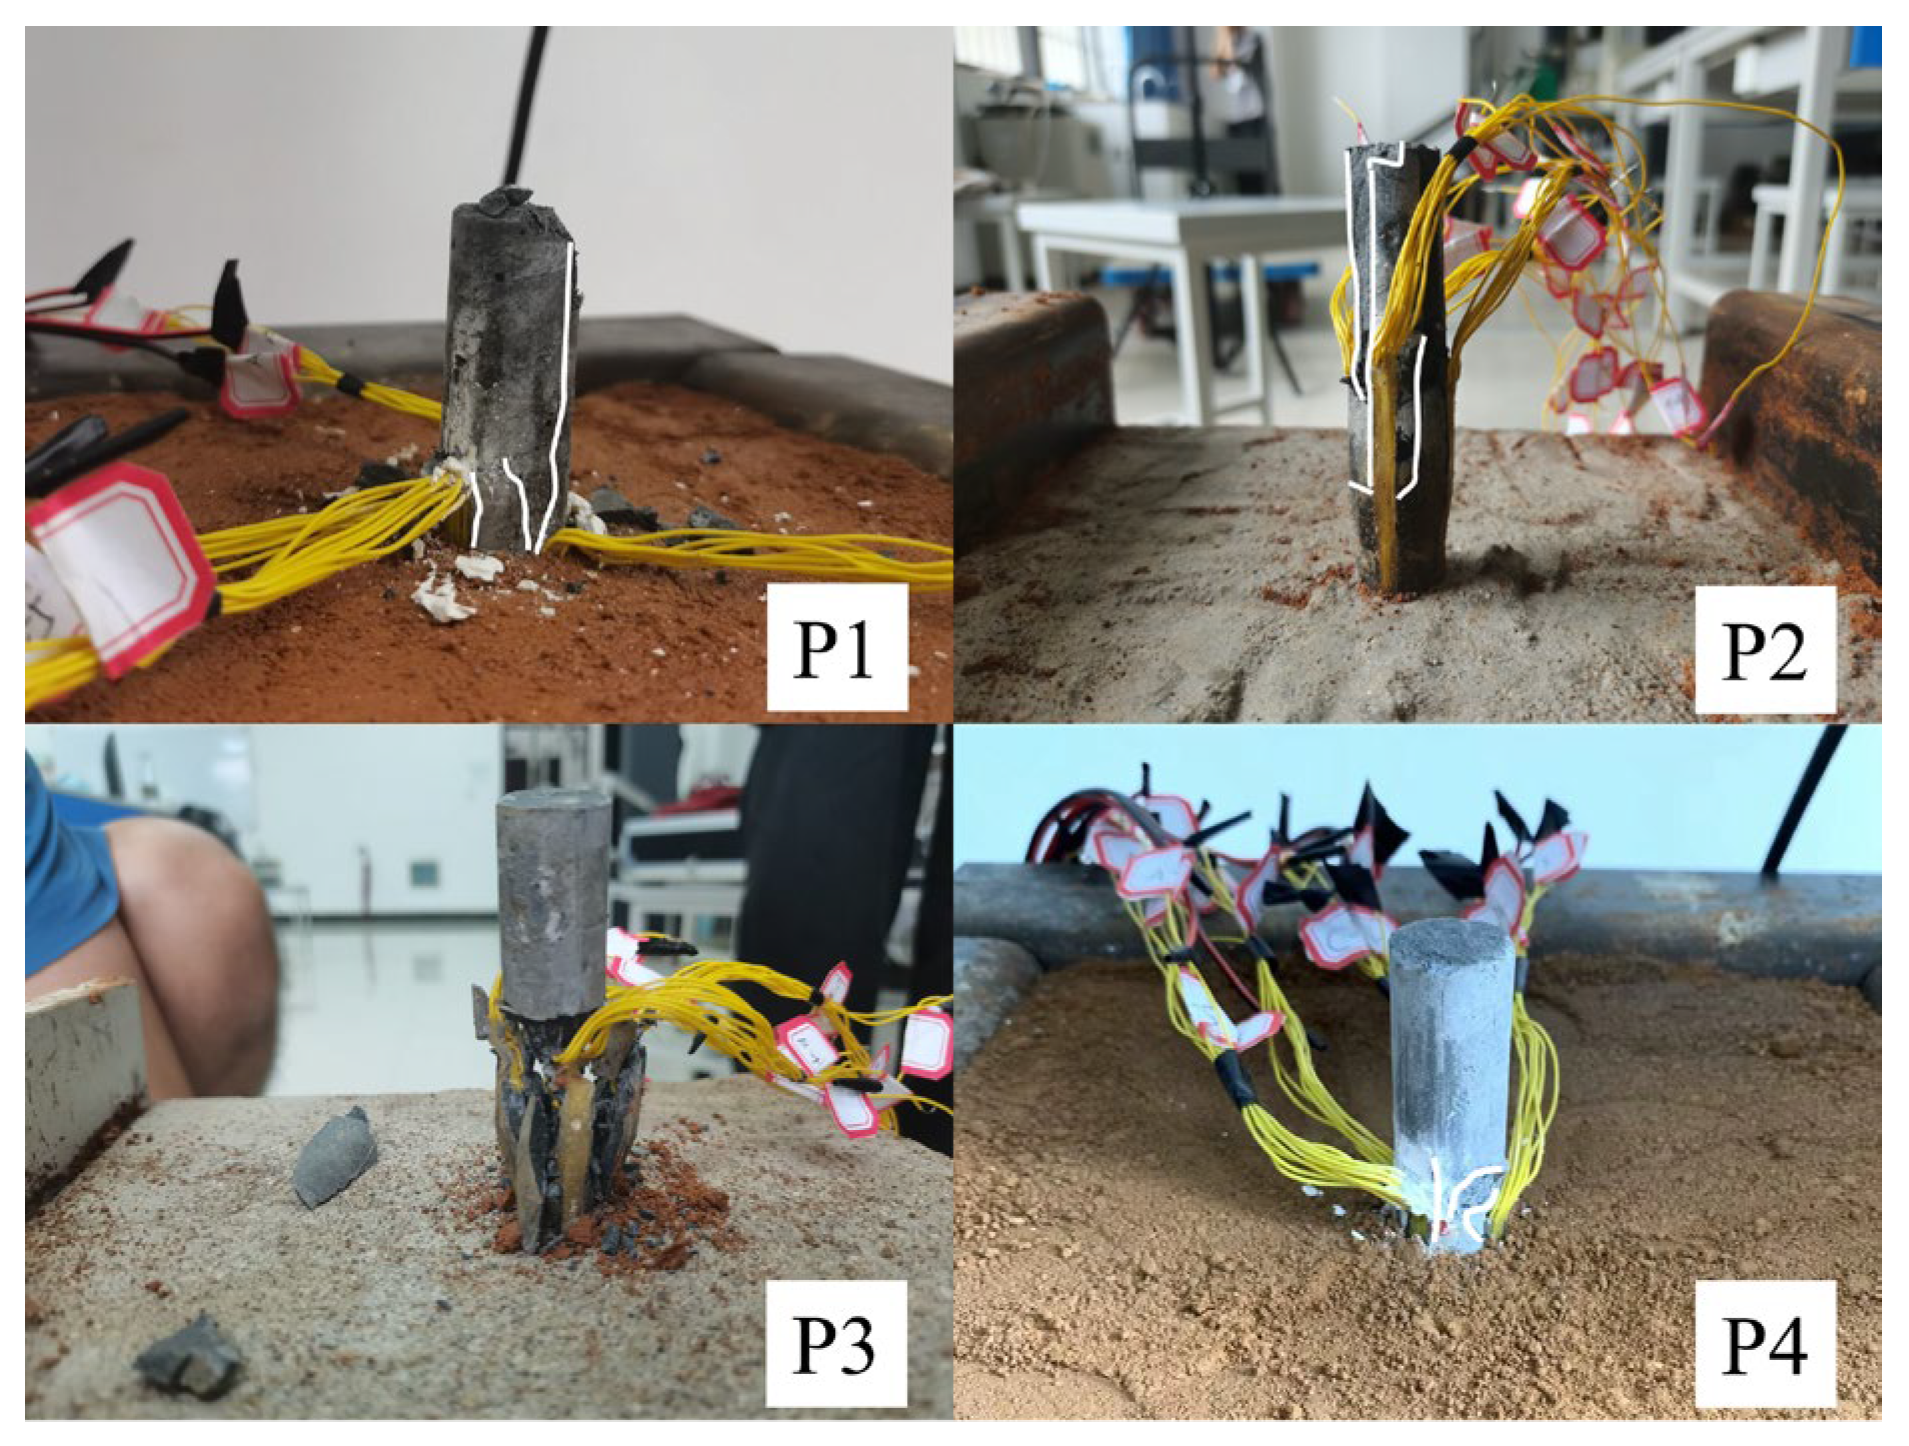
The failure loads of the four groups of end-bearing piles were similar, and all exhibited splitting failure of the pile shaft prior to failure in the rock layer (
Figure 9). During specimen preparation, reinforcement cages were added to enhance the flexural capacity. Although the pile–rock strength ratio was set higher than that in actual engineering practice, the model dimensions were limited by the testing apparatus, resulting in a relatively small specimen with a pile diameter (D = 20 mm), leading to significant size effects. Stress concentration was measured at the pile–rock interface under vertical loading. Even under high confining pressure, splitting failure was not prevented.
The observed stress concentration suggests that vertical loading induced radial expansion and generated circumferential stresses around the pile shaft. The occurrence of splitting failure under high confining pressure indicates that the material properties of the pile shaft were likely the primary factor controlling its maximum load. Furthermore, it is hypothesized that prior to reaching the splitting failure load, the load transfer mechanism at the pile–rock interface had already been fully developed in the elastic and elastoplastic stages, based on the measured load–displacement and strain data. This also indicates that the observed trends across different RF values remain valid for characterizing interface behavior.
4.3. Load–Displacement Relationship
As shown in
Figure 10, the curves generally exhibit a steep descending pattern. When the pile top displacement reached 1.0–1.5 mm, a distinct change in the curve slope occurred, indicating that the test piles had entered the elastoplastic stage. In the later stage of loading, the test piles instantly lost their bearing capacity due to brittle splitting failure, and the load dropped sharply to the residual strength. As shown in
Table 2, as the RF value increased from 0 to 0.234, the ultimate load of the test piles rose from 5366 N to a maximum of 10,439 N and then slightly decreased. Compared with the reference pile (P1) with RF = 0, the bearing capacity increases of P2, P3, and P4 were 17.85%, 94.54%, and 77.02%, respectively. It is noteworthy that P3 with RF = 0.168 exhibited the highest bearing capacity (10,439 N), whereas when RF increased to 0.234, the bearing capacity of P4 decreased by 9% compared with P3 (RF = 0.168). This pattern indicates that moderately increasing pile shaft roughness can enhance the interlocking effect between the pile and rock, thereby improving bearing capacity. However, excessive roughness may induce more cracks and damage in the rock mass at the pile–rock contact area during loading, which is detrimental to the bearing performance. Therefore, there exists an optimal value for pile shaft roughness. Under the test conditions of this study, the highest bearing capacity among the tested RF values was obtained at RF = 0.168.
It is worth noting that a significant discrepancy exists between the “ultimate load” determined by the Weltman criterion (displacement of 2 mm) and the final “maximum load” of the pile shaft. Taking P1 as an example, the ultimate load according to the criterion was 5366 N, while the maximum load reached 13,282 N, representing a difference of approximately 2.5 times. This discrepancy originates from the collaborative working mechanism between the pile–rock interface and the pile shaft material. When the pile head displacement reached 2 mm, the pile–rock interface had already entered the elastoplastic stage, whereas the pile shaft material remained in the elastic or early plastic stage, and the interface side resistance and end bearing had not yet been fully mobilized. As displacement continued to increase, the interlocking effect at the pile–rock interface further intensified, and the load transfer capacity continued to improve, until the pile shaft material reached its tensile strength limit and underwent splitting failure.
4.4. Axial Force
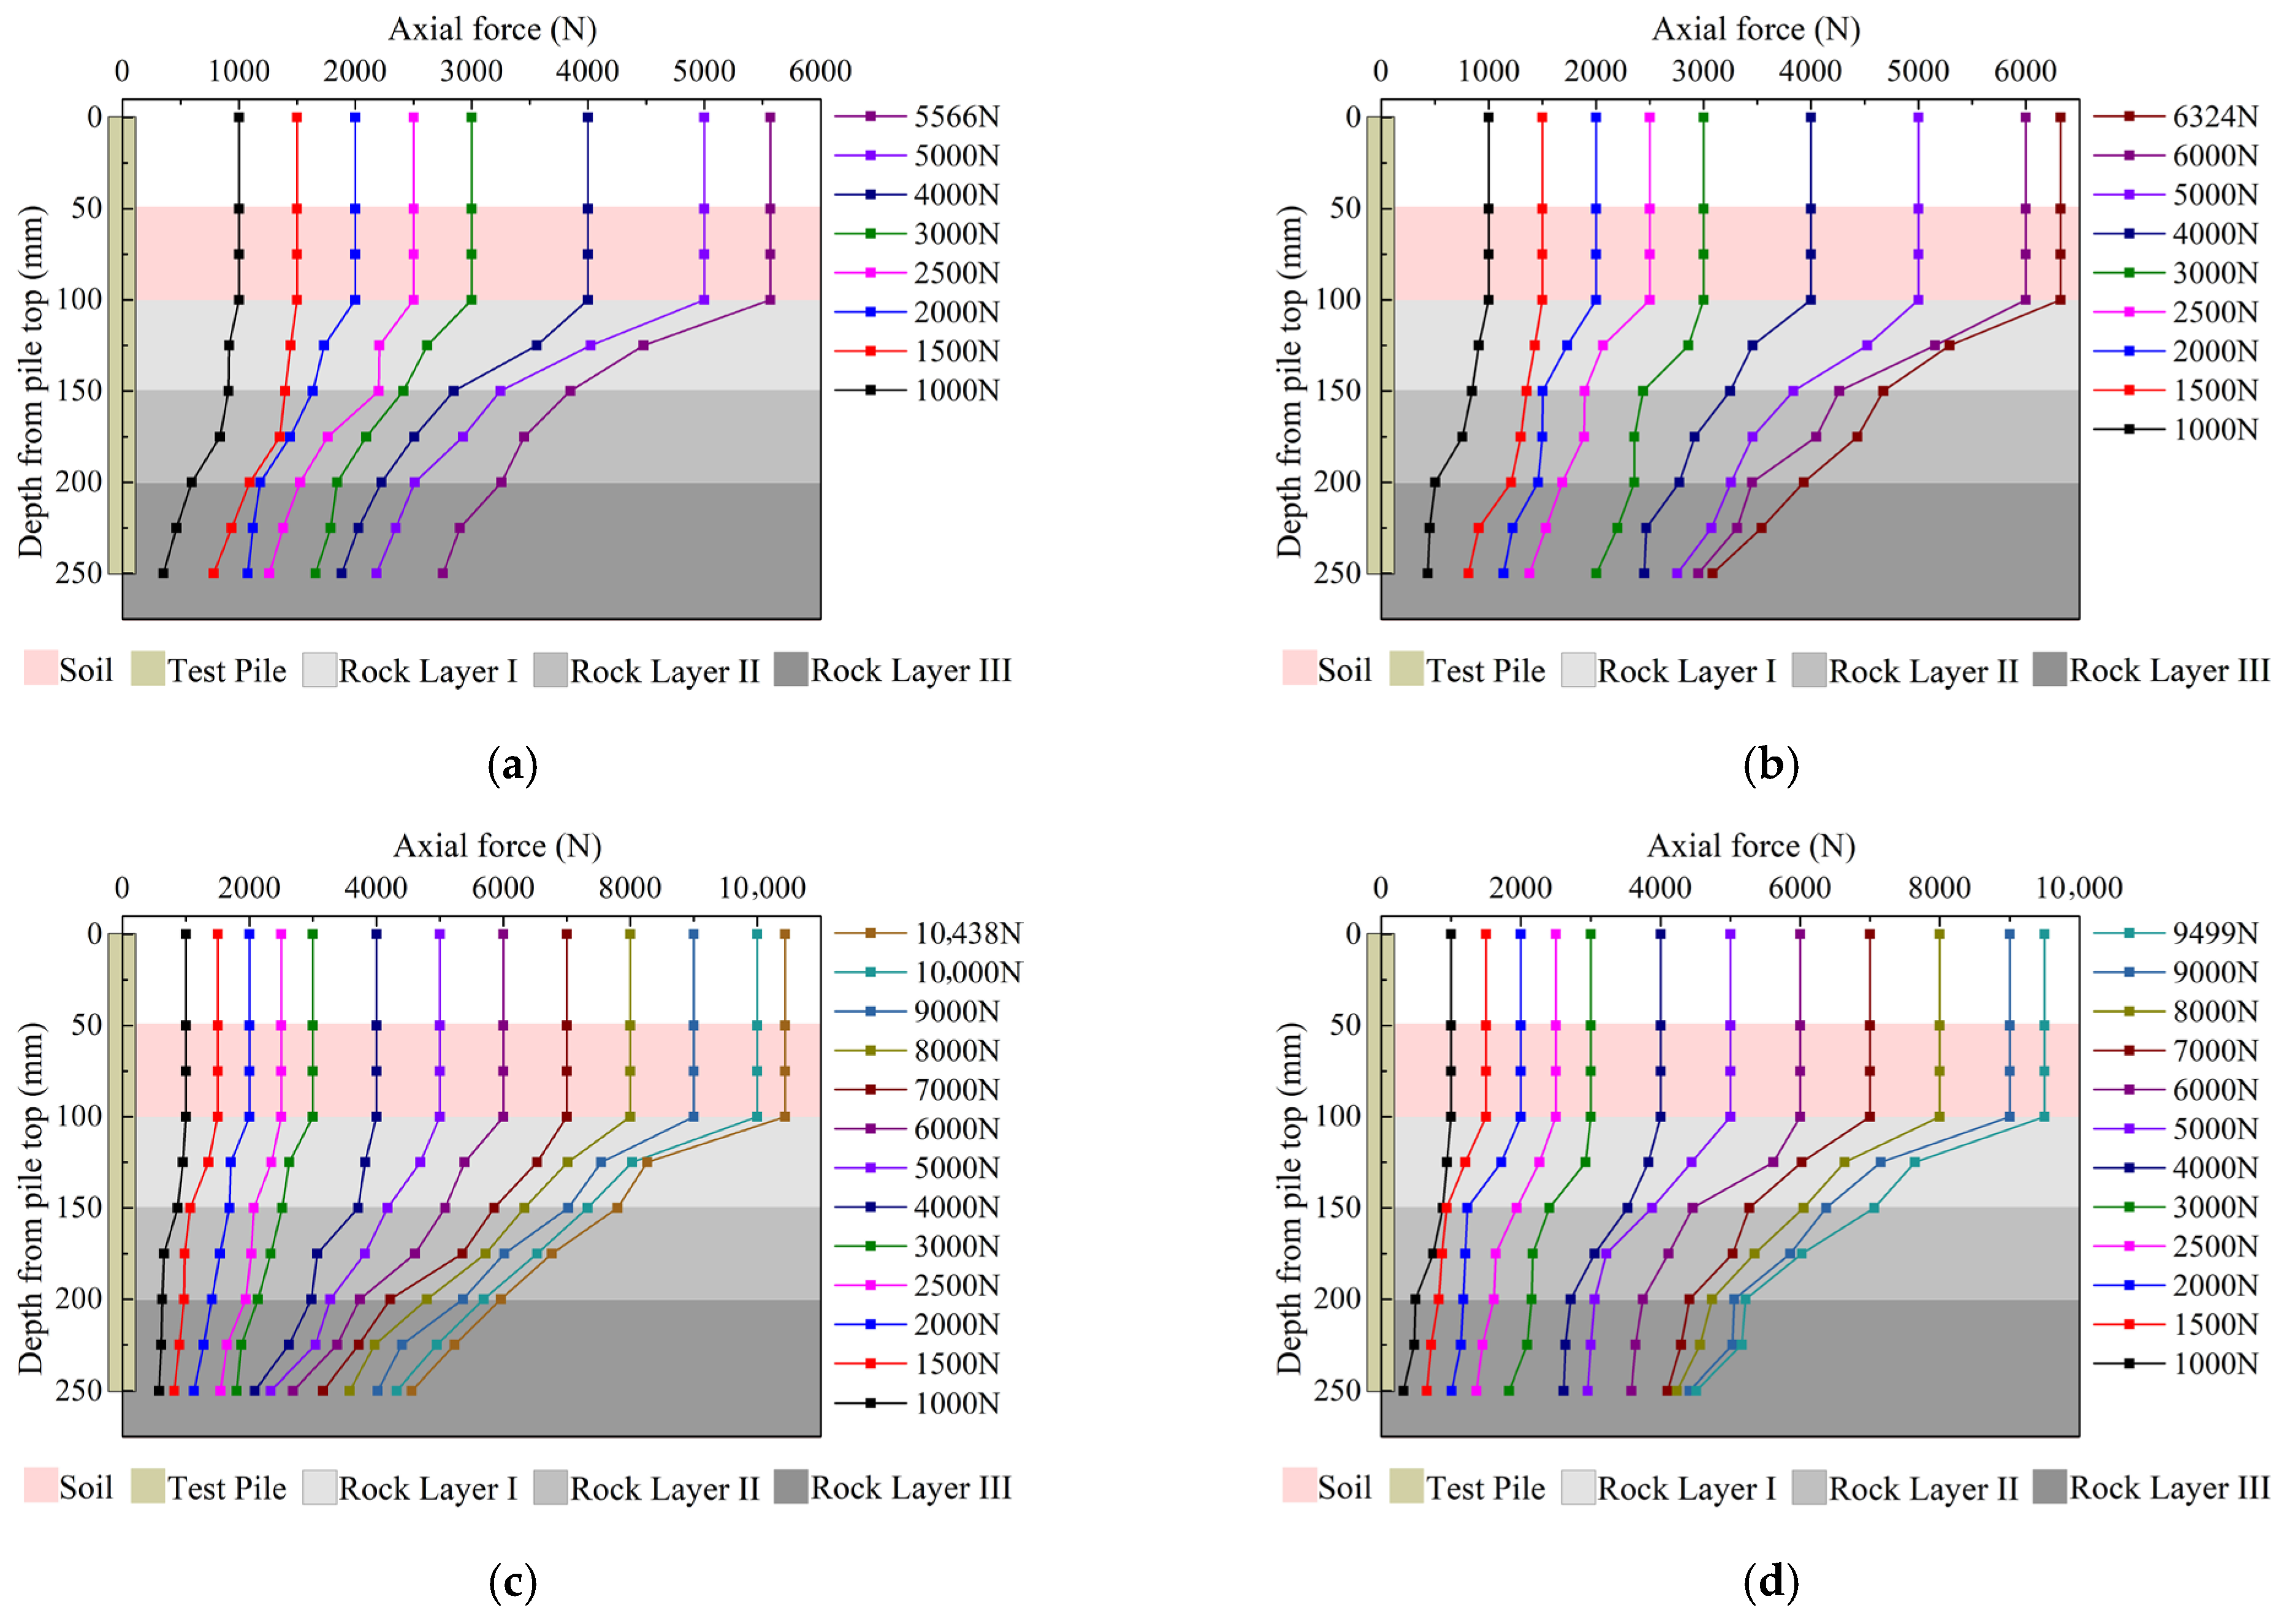
For all test piles, the axial force continuously decreased along the depth direction, and the variation trends were similar (
Figure 11). The pile head and the soil layer portion had no significant influence on axial force transfer, with their axial force variations being minimal compared to those in the rock layer portion. The slope of the curves was nearly constant, approximately maintaining consistency with the applied load. As the load gradually increased, the side resistance in the rock layer segment was activated, and the axial force began to decrease significantly toward the pile end direction. Under the same load, the transfer characteristics of axial force along the depth were closely related to the properties of the bedrock surrounding the pile, with different attenuation rates observed in different rock layer intervals. As the compressive strength of the bedrock increased, the attenuation amplitude of axial force gradually decreased. For the same change in pile depth, the greater the compressive strength of the bedrock, the smaller the relative change in axial force within that pile segment. Under ultimate load, the average reduction amplitudes of axial force in the four test piles were 26.96%, 14.86%, and 10.84% in Rock Layer I, II, and III, respectively. The mechanical properties of bedrock directly regulated the distribution and transmission behavior of loads inside the pile body.
4.5. Side Resistance of Piles
4.5.1. Average Side Resistance
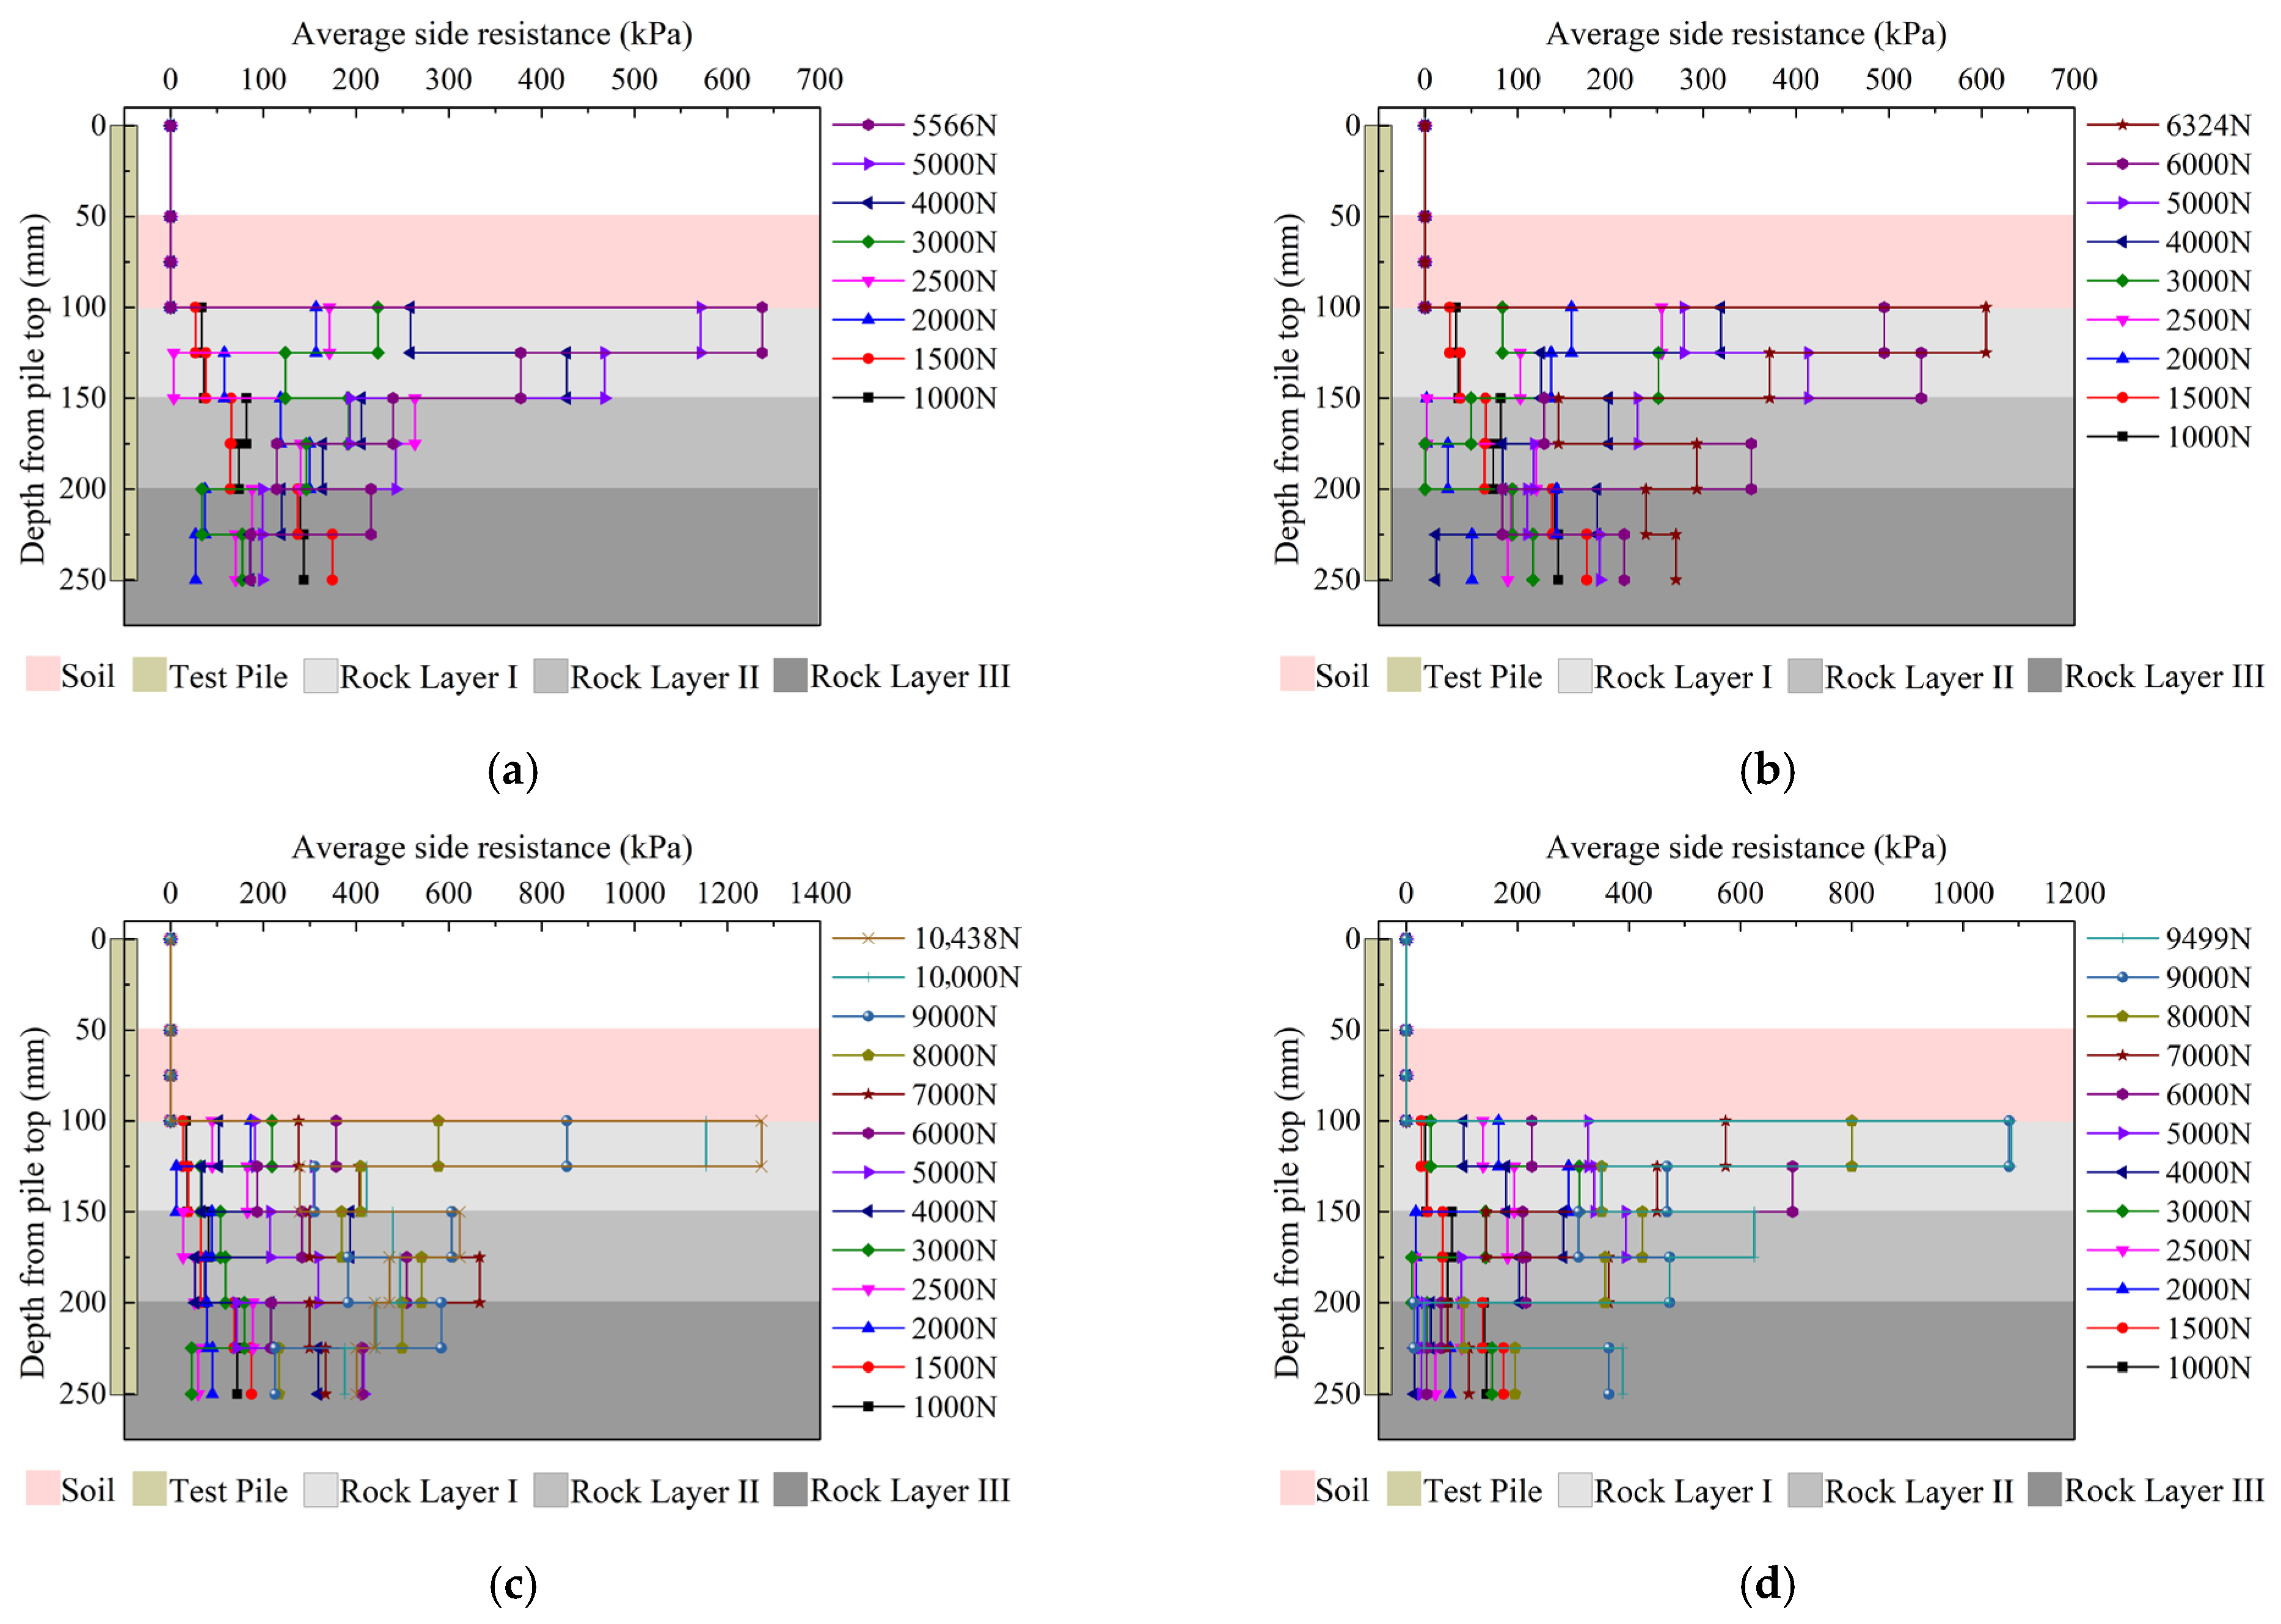
Summarizing the patterns shown in
Figure 12, the variation laws of side resistance for each test pile were consistent: In the shallow non-socketed section (depth < 100 mm), where axial force did not decrease, the side resistance was essentially zero. For the portions of the test piles socketed in the bedrock, as the load increased, the role of pile side resistance was gradually mobilized, and the average side resistance progressively increased. Regarding the distribution pattern, under the same load, the side resistance along the depth exhibited a single-peak distribution, with the peak value located in the Rock I section. This occurred because Rock I responded to the load first, exhibiting higher pile side resistance, while the mobilization of side resistance in the deeper Rock II and III was relatively slower and failed to be fully mobilized. Influenced by RF, the peak side resistance of test pile P3 with optimal roughness was twice that of P1, indicating that the circular arc concave–convex features set on the pile shaft significantly enhanced the interlocking effect at the pile–rock interface. Furthermore, in the pile end region, an increase in RF enhanced the radial pressure through the circular arc concave–convex features, correspondingly increasing the average side resistance near the pile end. This fully demonstrated that optimizing RF not only enhances the peak side resistance but also improves the distribution of side resistance.
4.5.2. Side Resistance Pile–Soil Relative Displacement Relationship
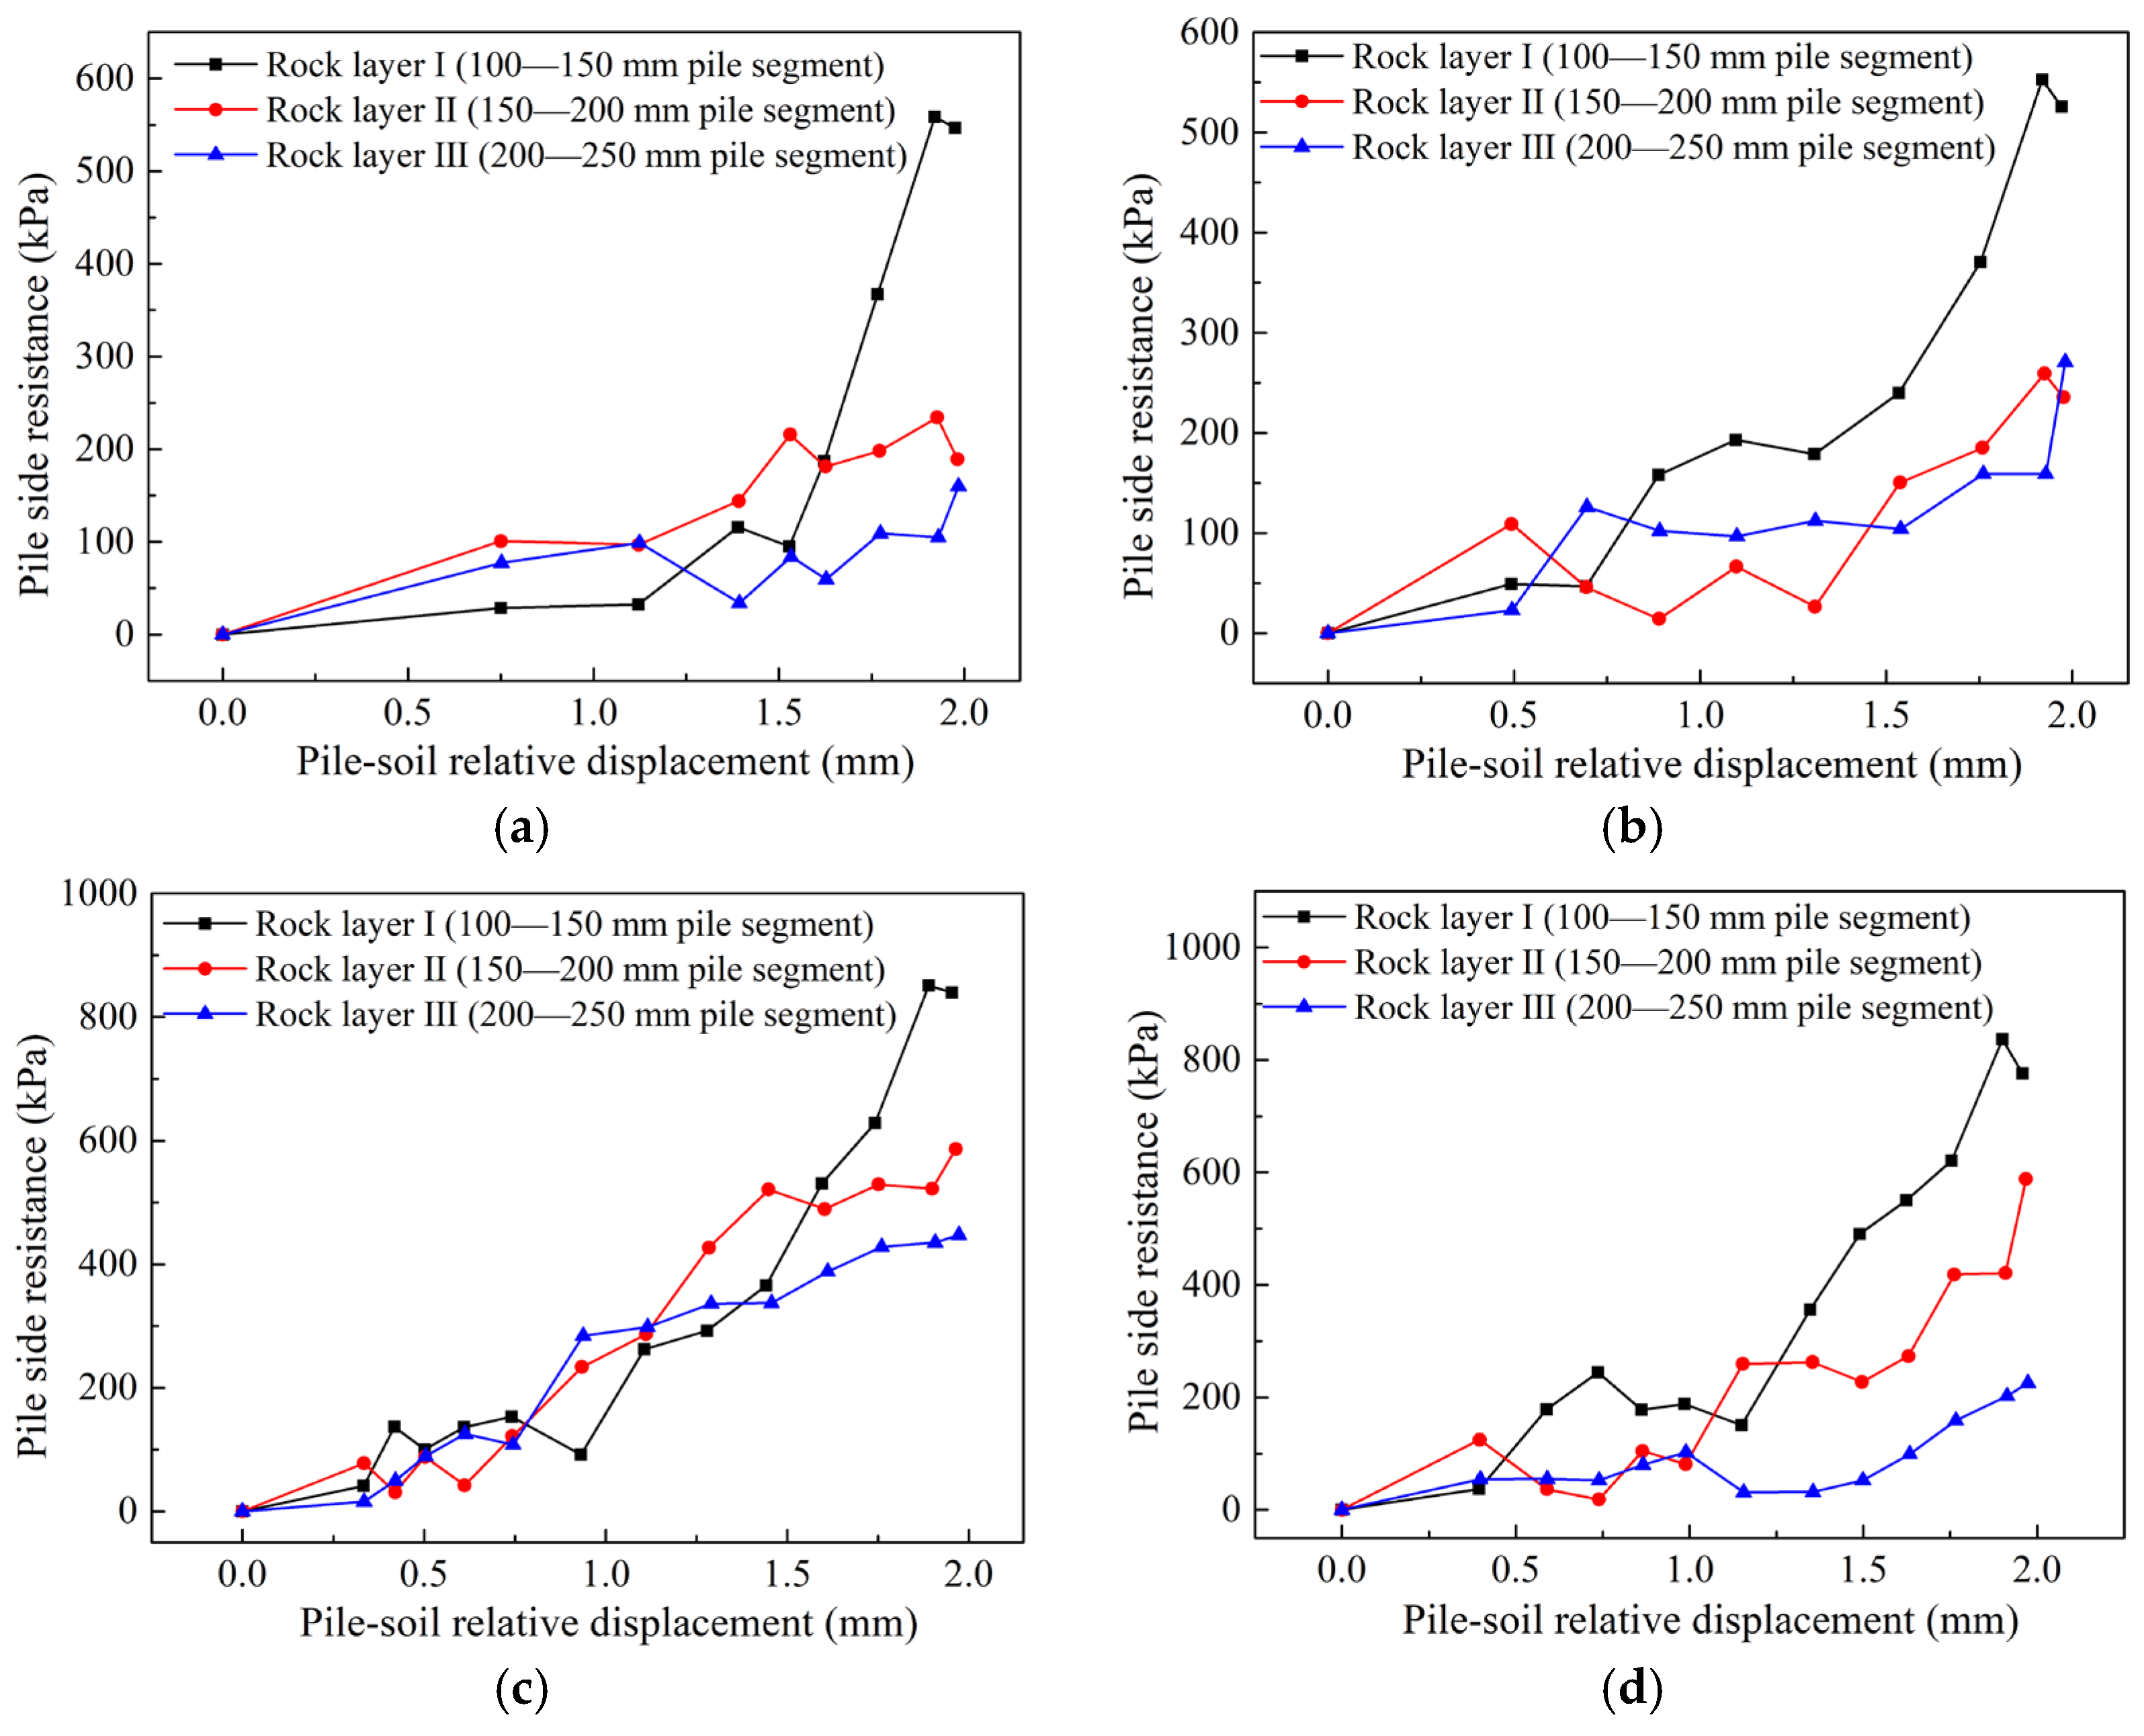
As shown in
Figure 13, in the shallow section (100–150 mm), the side resistance of all test piles exhibited a complete development process of initially increasing and then decreasing. The appearance of the descending segment indicated that the side resistance of the rock layer in this section had reached its ultimate state. The RF value had a significant influence on the magnitude of side resistance: test pile P3 (RF = 0.168) exhibited the highest peak side resistance, reaching 851 kPa, approximately 1.5 times that of P1 (RF = 0); test pile P4 (RF = 0.234) followed with 836 kPa, while P1 and P2 were 558 kPa and 553 kPa, respectively. In the section (150–200 mm), the side resistance of test piles P1 and P2 decreased significantly with increasing pile–soil displacement, reflecting that the side resistance of the rock layer in this section had reached its ultimate state. In contrast, the side resistance of test piles P3 and P4 was still in an upward trend, showing no signs of attenuation. In the pile segment 200–250 mm from the pile head surface, under ultimate load conditions, the load consistently exhibited an increasing trend. The appearance of the descending segment in the shallow section suggests that the side resistance of the rock layer in this section had likely reached its ultimate state. Similarly, the significant decrease in side resistance of P1 and P2 in the 150–200 mm section reflects that the side resistance of the rock layer in this section may have reached its ultimate state.
Based on the observed trends, it is hypothesized that as RF increases, the undulating features alter the mechanical mechanism of pile–rock interaction, transforming the interface failure mode from “pure shear failure” to a complex process involving “shear–dilation–damage coupling,” thereby further enhancing the pile side resistance and enabling it to sustain a greater portion of the applied load.
The specific mechanisms are hypothesized as follows: When RF = 0 (P1), side resistance likely originated solely from interface friction, with the failure mode being pure shear slip. When RF = 0.168 (P2), it is proposed that the asperities produced a moderate dilation effect, which both increased the interface normal stress to enhance the frictional component and generated circumferential compressive stress in the rock mass around the pile to delay damage. Shear and dilation may have formed a positive feedback loop, leading to peak side resistance. When RF = 0.234 (P4), it is inferred that excessive asperities caused radial stress concentration exceeding the rock mass strength, leading to localized crushing and crack propagation at the asperity roots. Damage likely reduced interface stiffness and weakened the interlocking effect, resulting in side resistance lower than that at RF = 0.168. It should be emphasized that the proposed mechanisms, including the shear–dilation–damage coupling hypothesis and the inferred effects of stress concentration and microcracking, are interpretative explanations based on the observed macroscopic behavior. Direct micro-mechanical evidence is not yet available.
4.5.3. Mobilization and Analysis of Pile Shaft Resistance and Pile Tip Resistance
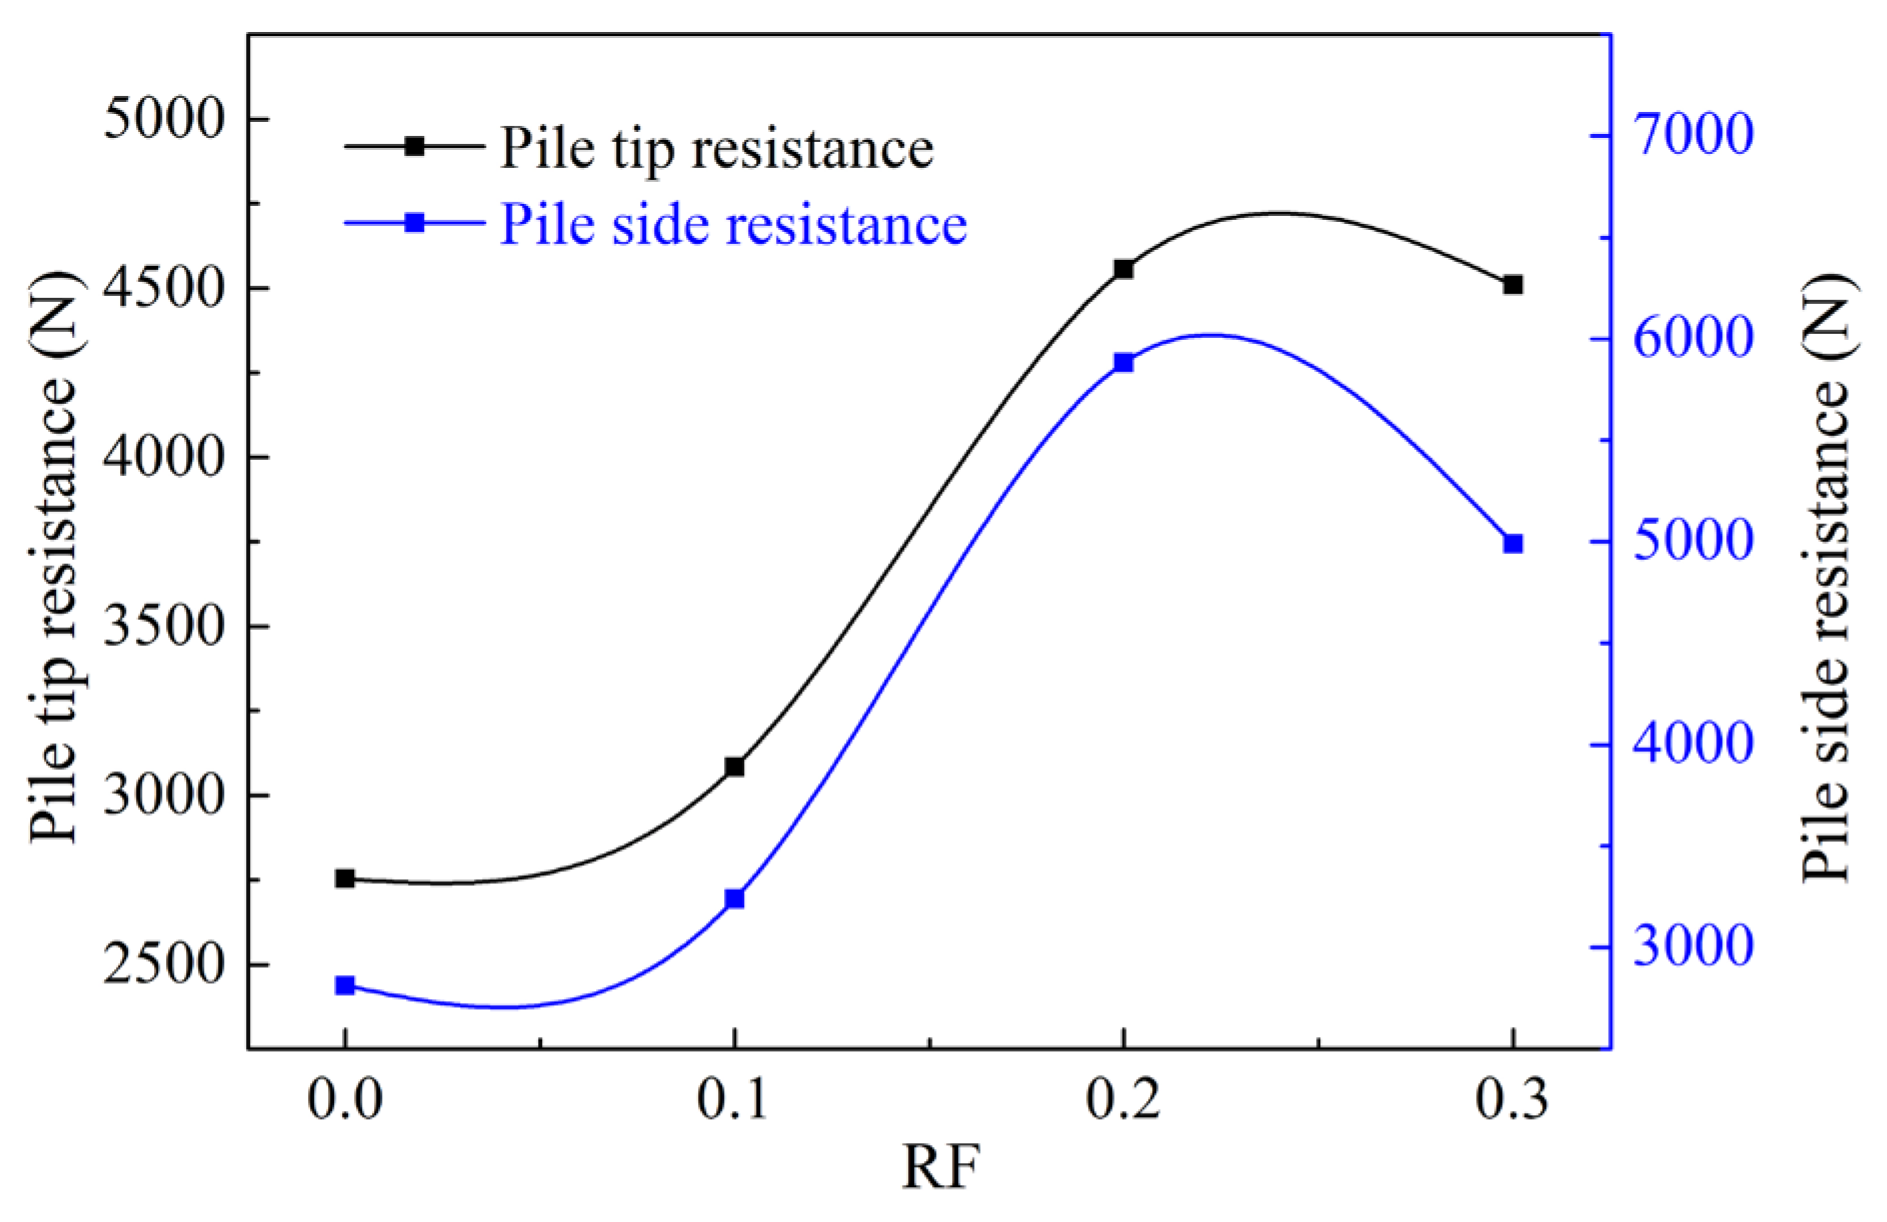
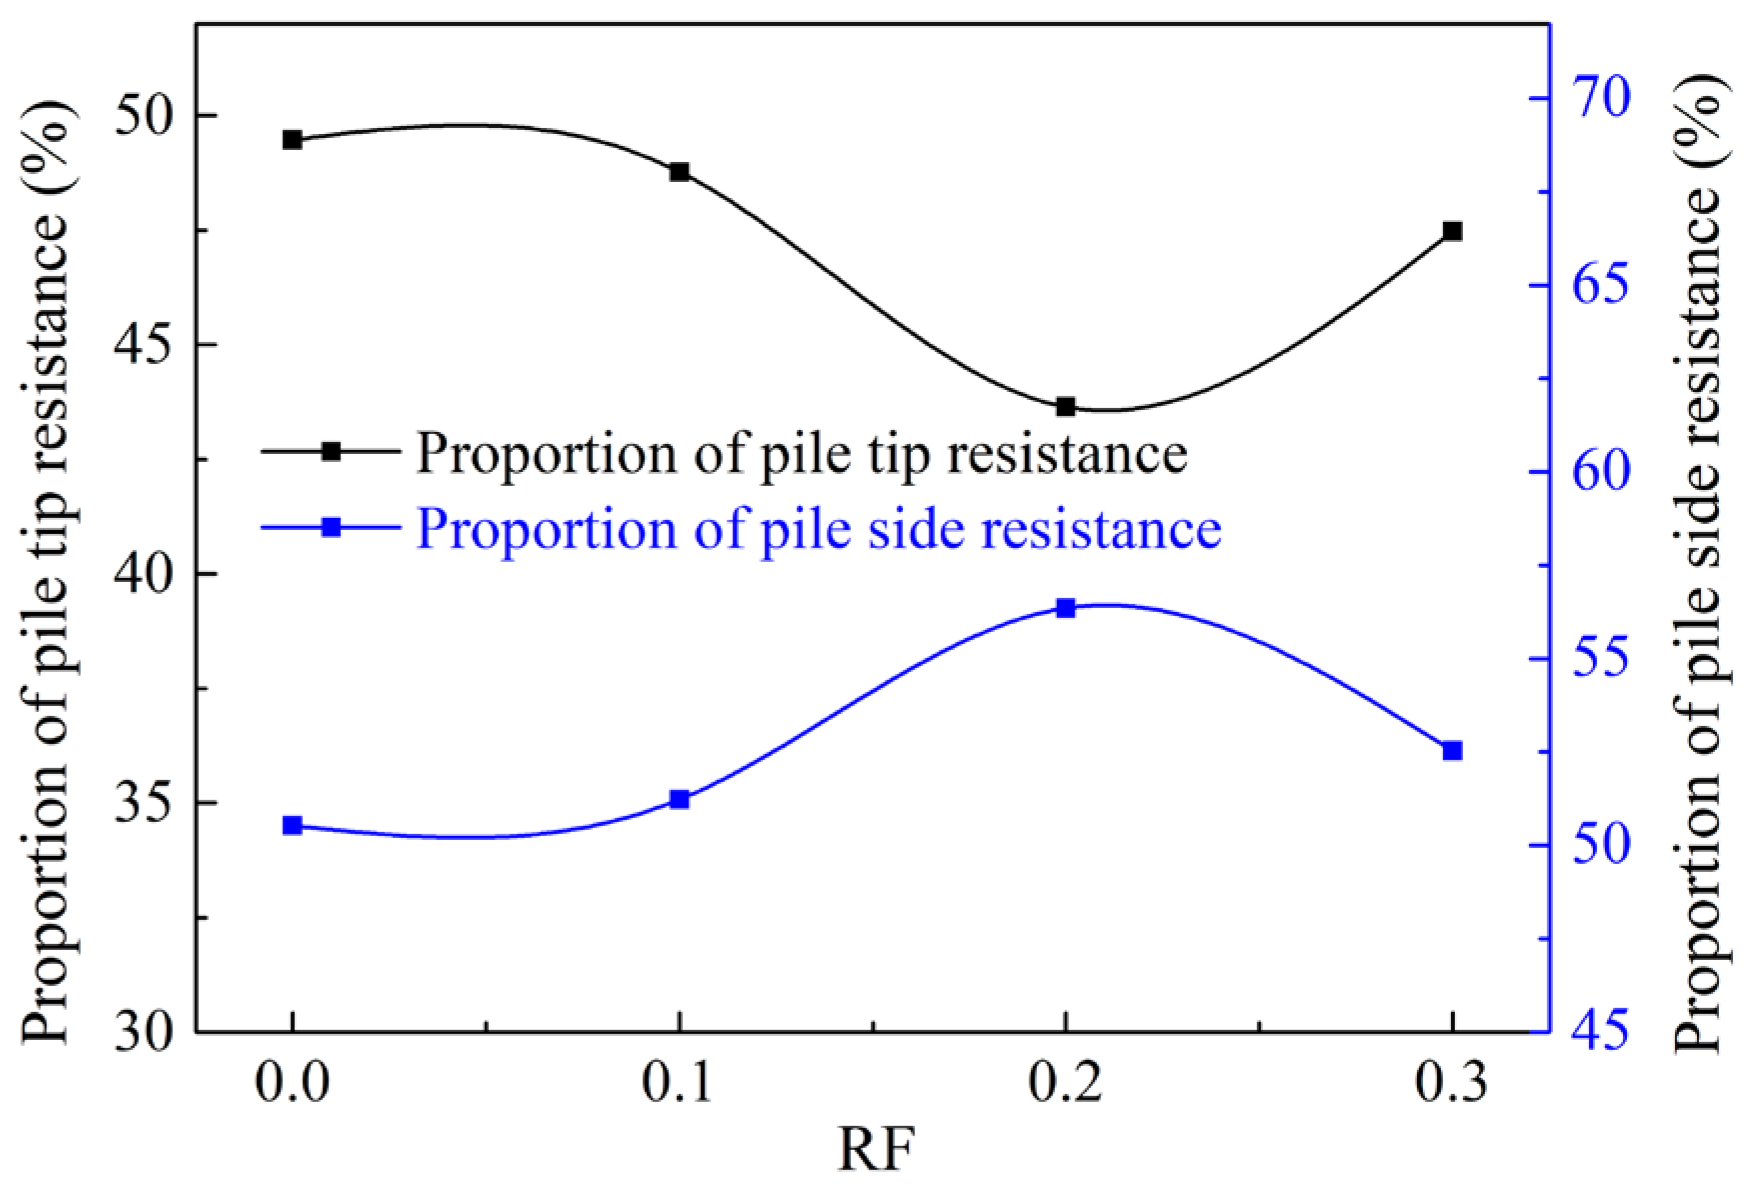
Synthesizing the test data from
Figure 14 and
Figure 15, and
Table 3, RF exerts a significant regulatory effect on the resistance mobilization mode. As RF increased, both pile side resistance and pile tip resistance exhibited an inverted “U”-shaped variation, first increasing and then decreasing, with the peak point within the tested RF range corresponds to RF = 0.168. Compared with P1, the increase in side resistance for P3 reached as high as 109.16%, fully demonstrating the promoting effect of optimal roughness on side resistance mobilization. The proportion of pile tip resistance exhibited a “U”-shaped characteristic with RF variation, first decreasing and then increasing. The end resistance proportions for the four test piles were 49.47%, 48.77%, 43.64%, and 47.47%, respectively.
RF alters the load transfer path by regulating the interfacial stress state. When RF increases from 0 to 0.168, the dilation effect induced by the asperities enhances the interfacial normal stress, leading to increased side resistance stiffness. As a result, the load is preferentially transferred through side resistance, and the proportion of end bearing decreases. When RF increases to 0.234, excessive asperities cause interfacial stress concentration and microcracking damage in the rock mass, reducing the interfacial shear stiffness. Consequently, part of the load is forced to be transmitted downward to the pile tip, and the proportion of end bearing increases accordingly.
In summary, pile shaft roughness profoundly influences the distribution ratio between side resistance and end resistance by altering the interlocking and constraint state at the pile–rock interface. An appropriate RF value (0.168 in this test) can maximize the mobilization degree of side resistance while optimizing the stress state at the pile end, thereby achieving an overall improvement in bearing performance.
5. Discussion
The test piles failed before the rock mass, and the maximum loads of the four test piles were similar, indicating that under the failure mode dominated by pile material strength, the enhancement effect of increasing the roughness factor on ultimate bearing capacity could not be fully realized. Importantly, the splitting failure mode implies that the ultimate load was limited by the pile material rather than by interface or rock mass failure. Consequently, the absolute bearing capacity values may not directly reflect the full potential of interface roughness. However, prior to failure, the load transfer mechanism at the pile–rock interface was fully developed in the elastic and elastoplastic stages, and the patterns of axial force distribution, side resistance development, and load sharing ratio between end bearing and side resistance effectively reflected the response characteristics of the interface under different RF values. Therefore, the comparative trends among RF values, particularly the inverted U-shaped relationship, are considered reliable indicators of interface behavior.
Using cement mortar to simulate rock layers of different strength grades is a simplified approach. Compared with natural argillaceous siltstone, cement mortar exhibits differences in physical and mechanical properties such as brittleness index, joint development degree, and anisotropy. However, this study focuses on the load transfer mechanism at the pile–rock interface, which is primarily governed by the interface friction coefficient and the strength parameters of the rock layers, rather than the details of internal jointing or anisotropy characteristics of the rock mass. Nevertheless, when extrapolating the conclusions of this study to practical engineering, the differences between the simulated material and natural rock mass should be fully considered.
Tests indicate that roughness values that are too low or too high are detrimental to optimal performance, and that an optimal roughness factor exists. Under the specific experimental configuration, the observed value of 0.168 is considered the locally optimal value within the investigated RF range, rather than a universally applicable optimum. Although the range of roughness factor values considered in the tests is relatively narrow, the pattern obtained can still provide a theoretical basis for engineering design, optimize the load sharing ratio between end bearing and side resistance, and enable an economical and rational pile foundation design.
The RF values investigated by Dai et al. were 0, 0.04, 0.082, 0.127, and 0.232. As RF increased, side resistance increased significantly, reaching 59.8–77.2 kN at RF = 0.04; however, when RF increased from 0.04 to 0.232, the increase in side resistance was limited. Both Dai et al. and this study pointed out that “there exists an upper limit of sidewall roughness, beyond which further increasing roughness yields very limited improvement in bearing capacity.” Building upon the work of Dai et al., this study further revealed the regulation of load sharing ratio: RF not only affects the total bearing capacity but also significantly alters the distribution ratio between end bearing and side resistance. In terms of applicability in complex layered rock formations, the influence pattern of RF under multi-layer rock conditions is consistent with that under a single rock layer.
It is important to distinguish between the observed experimental results and the interpretative hypotheses in this study. The proposed mechanistic explanations, including the shear–dilation–damage coupling mechanism and the hypothesized effects of stress concentration and crack propagation at high RF values, are interpretative hypotheses that are consistent with the observed macroscopic behavior. However, these hypotheses lack direct micro-scale or numerical validation within the scope of this study. Future research incorporating micro-mechanical observations or numerical simulations is recommended to further substantiate these interpretations.
6. Conclusions
Based on the reconstruction project of Shaoping Bridge, this paper conducts indoor model tests on pile shaft roughness in complex layered rock strata. Introducing Horvath’s definition of roughness, different RF values were set to investigate the bearing characteristics in complex layered rock and soil geological conditions. The following can be concluded:
The ultimate failure mode of all end-bearing piles was splitting failure. Determined by the same material properties, each test pile exhibited consistency in terms of material strength. Therefore, the differences in their ultimate load values primarily stemmed from variations in RF, rather than from the discreteness of the material itself. After the peak point, the load–displacement curves all exhibited a significant steep descending segment, which is a typical characteristic of brittle failure. The steep descent of the curves indicated that the pile shaft instantly lost its bearing capacity after reaching the ultimate load, with the pile top load dropping sharply to the residual strength.
Under ultimate load, the average attenuation amplitudes of axial force for the four test piles in Bedrock I, II, and III were 26.96%, 14.86%, and 10.84%, respectively. The mobilization of the average side resistance along the pile shaft generally presented a single-peak distribution, with the maximum pile side resistance occurring in Bedrock I.
The enhancing effect of RF on bearing capacity is not monotonically increasing. When RF exceeds a certain threshold, excessively large circular arc concave–convex features will exacerbate crack propagation and damage accumulation in the rock mass at the pile–rock contact area during loading, thereby weakening the bearing capacity. Within the scope of this experimental study, as RF gradually increased from 0 to 0.234, the pile resistance exhibited an inverted “U”-shaped trend, first increasing and then decreasing. Within the scope of this experimental study and among the RF values tested, the highest bearing capacity was obtained at RF = 0.168. This value is considered locally optimal under the present test conditions and should not be generalized without further validation.
Although this study provides a detailed investigation of the ultimate bearing characteristics of piles under different roughness factors, certain limitations exist. It should be noted that the findings of this study are based on a small-scale model test (D = 20 mm). While the qualitative trends, such as the inverted U-shaped relationship between RF and bearing capacity, are considered transferable to field conditions, the quantitative results, including the specific optimal RF value, should be validated through field tests or larger-scale model tests before being applied to engineering design. Specifically, this paper employed regular circular arc concave–convex features to simulate pile shaft roughness, whereas the roughness morphology of borehole walls is random and complex. Only one test was conducted for each roughness factor value, with no replicate tests, so the statistical reliability of the conclusions requires verification through repeated experiments. The selection of only four discrete values (0.0, 0.091, 0.168, 0.234) makes it difficult to accurately characterize the complete curve of bearing capacity variation with RF, particularly the response characteristics near the optimal value. Future research should further validate the patterns revealed in this study by simulating more realistic roughness morphologies, conducting repeated tests, using a denser set of RF values, employing more realistic rock-like materials, and carrying out field tests. Additionally, the proposed shear–dilation–damage coupling mechanism remains interpretative at this stage. Future research incorporating numerical simulations or micro-mechanical observations is necessary to validate the hypothesized mechanisms.