1. Introduction
Since British construction worker Joseph Aspdin invented Portland cement in the early 19th century, the performance of concrete materials has been greatly enhanced over more than two centuries of use and development, while their application technologies have also continuously advanced. Owing to advantages such as abundant raw material resources, easy accessibility, convenient construction, high moldability, and high post-hardening strength, concrete has gradually become one of the most widely used building materials globally [
1].
In essence, concrete is an anisotropic, heterogeneous, porous material composed of mixtures such as water, cement, coarse aggregate, fine aggregate, and admixtures. It inevitably comes into contact with external environmental factors such as water, carbon dioxide, chloride ions, and sulfate ions, leading to chemical corrosion reactions that accelerate the deterioration of concrete and significantly reduce its durability. If ion concentrations exceed certain limits, the service life of concrete structures may fail to meet expectations, resulting in substantial economic losses and even potential safety hazards. Among these factors, chloride salt corrosion is a critical cause of significant durability degradation in concrete. Numerous large-scale coastal and underground engineering projects are threatened by chloride ion erosion. Additionally, although concrete itself is a non-combustible material, exposure to high temperatures can induce complex physical and chemical changes within the concrete, weakening its performance, substantially reducing the structural resistance of concrete, and thereby affecting the normal use and safety of concrete structures [
2]. Therefore, developing new environmentally friendly materials, reducing solid waste generation, and promoting the recycling and reuse of solid waste are essential approaches for the civil engineering industry to adapt to the construction of high-difficulty engineering facilities in the new era.
Wu [
3] demonstrated that concrete small hollow blocks and masonry systems produced by partially replacing sand with molybdenum tailings (MT) powder are suitable for practical engineering applications. Cao et al. [
4] concluded that a 40% MT incorporation rate can meet both strength and durability requirements while maximizing the utilization efficiency of MT resources. Sun et al. [
5] concluded that fly ash can effectively improve the early strength of MT concrete: single incorporation of fly ash increases the compressive strength of MT concrete, while co-incorporation of fly ash and silica fume results in slower early strength gain but faster later strength development. Tao [
6] pointed out that MT enhance the early strength of concrete, but excessive replacement leads to a decline in strength after 7 days. Quan et al. [
7,
8] suggested that the replacement ratio of natural river sand with MT should not exceed 60%, and a 50% replacement of coarse aggregate can increase compressive strength by 14.4%; they also noted that the MT replacement rate should not exceed 50% for concrete used in cold and salt lake regions. Li et al. [
9] proposed that both the cube compressive strength and axial compressive strength of C50 MT concrete gradually decrease with an increasing MT replacement rate, which is also influenced by the fineness modulus of MT sand, along with a slight decrease in elastic modulus. Liu [
10] found that a 30% replacement rate of MT sand increased the compressive and splitting tensile strengths of recycled concrete by 3.12% and 10.36%, respectively. Li et al. [
11] investigated MT as river sand substitutes in concrete, where the optimal strength occurred at a 20% MT replacement, enhancing 28-day compressive and tensile strengths by 10.9% and 14.9%, respectively.
A large number of studies have focused on the durability performance of MT concrete under complex erosive environments. Ye [
12] found that a 3.4% mass fraction composite salt solution improves the frost resistance of concrete members in the early stages of freeze–thaw cycles and delays damage, but exacerbates deterioration in the later stages with an increasing number of cycles. Yang [
13] discovered that the corrosion depth of concrete gradually increases with longer wet–dry cycle durations, and the splitting tensile strength of concrete decreases as the corrosion depth increases. Liu [
14] observed that sulfate/chloride salt corrosion causes an initial increase followed by a decrease in concrete mass, accompanied by surface spalling. Quan et al. [
15] found that, with constant water–binder and sand–binder ratios, partially replacing quartz sand or silica fume with MT reduces the flowability of reactive powder concrete, while an appropriate replacement amount can optimize its mechanical strength. Jin et al. [
16] indicated that appropriately reducing the water–cement ratio is more beneficial for concrete under compressive stress to resist sulfate attack.
Extensive research has been conducted on the high-temperature mechanical properties and damage evolution of MT concrete and cement-based materials. Ma [
17] studied the mechanical properties of C50 MT concrete with a 25% replacement rate after exposure to 200 °C and 400 °C. Xi [
18] found that the mass loss rate of MT concrete specimens increases with rising temperature; the axial compressive strength, elastic modulus, and Poisson’s ratio decrease with increasing temperature and higher MT content, while the peak strain initially decreases and then increases with temperature. Liu [
19] showed that after concrete specimens were subjected to 800 °C high temperature followed by natural cooling and water cooling, the compressive strength of optimally mixed hybrid fiber concrete increased by 82.4% and 155.4%, respectively, compared to C40 plain concrete. Han [
20] investigated the effects of high temperature on the mechanical and water permeability properties of fiber-reinforced self-compacting concrete, using different fiber types, dosages, and target high temperatures as variables. Zhuang [
21] indicated that semi-water cooling conditions cause the most severe deterioration in the elastic modulus of concrete, and found that semi-water cooling results in the greatest damage to concrete after high-temperature exposure. Ma et al. [
22] confirmed that high temperature exacerbates the damage of chloride ions to the compressive strength of concrete, and has an even more significant impact on tensile strength. Wang et al. [
23] investigated the effects of MT content (0–40%) and thermal exposure (300–900 °C) on fly ash-based geopolymers using cubic compressive tests and acoustic emission, with results indicating that 20% MT enhances structural stability, microcrack resistance, and compressive strength below 600 °C, while 40% MT alters damage modes and improves plastic deformation resistance.
Several studies have explored the application of MT in special cement-based composites. Guo et al. [
24] found that aluminum powder significantly enhances the mechanical properties of MT foamed cement, with the optimal performance achieved at a 0.2% aluminum powder content. Zhang et al. [
25] concluded that the optimal mix proportion for MT foam concrete is 30% MT, 70% cement, 0.50% calcium stearate, 2.0% foaming agent, and a water–cement ratio of 0.43, and that its low thermal conductivity makes it suitable for self-insulating blocks. Quan et al. [
26] explored MT as a siliceous sand substitute in autoclaved aerated concrete (AAC), optimized the key parameters, and produced MT-AAC with a 641.3 kg/m
3 dry density and 3.89 MPa compressive strength. Ahmed and Cascardi et al. [
27,
28] explored self-compacting concrete (SCC) incorporating MT as a partial substitute for ground granulated blast furnace slag (GGBS); tests on slump, compressive strength (CS), split tensile strength (STS), pore structure, scanning electron microscope (SEM), and X-ray diffraction (XRD) revealed that 25% MT enhanced microstructure densification and strength, while more than 50% MT increased porosity and reduced CS and STS.
In addition, the hydration mechanism, pozzolanic activity, and microstructure evolution of MT cement-based materials have been systematically investigated in existing studies. Wei et al. [
29] systematically analyzed the feasibility of utilizing MT as supplementary cementitious materials or aggregates in concrete, with an analysis of their influence on concrete workability, mechanical properties, and durability, along with a discussion on technical approaches to enhance utilization efficiency and environmental benefits. Meng et al. [
30] investigated MT powder as a cement admixture, focusing on its hydration characteristics and mechanical properties; results indicate that ≤15% MT accelerates early hydration, advances the second exothermic peak and increases its value, while the 72 h cumulative heat release declines. The 15% MT paste achieved 89.37–96.14% compressive strength of Portland cement at 3–120 days, and MT introduced no new hydration products but altered the Aft-to-AFm transformation and incorporated intrinsic mineral phases. Mu et al. [
31] investigated MT stone powder as a cement replacement in paste; macroscopically, fluidity slightly decreased, while strength initially rose then declined, and microscopic analysis revealed MTSP’s weak activity, partial hydration, and Al incorporation into C(-A)-S-H gels, enhancing polymerization.
In summary, utilizing MT sand in concrete production as a partial replacement for river sand as fine aggregate is an effective approach for recycling molybdenum resources. This not only improves the utilization efficiency of molybdenum resources but also reduces the consumption of river sand and the emission of solid waste, offering significant economic and ecological benefits. However, existing studies mostly focus on the single effect of chloride erosion or high temperature on MT concrete, while there is a lack of systematic research on the mechanical properties of MT concrete under the coupled action of chloride dry–wet cycling and high-temperature exposure.
This study reveals the coupled damage mechanism, verifying the mitigating effect of MT on coupled chloride–thermal damage, and establishing a validated bearing capacity prediction model. A total of 50 circular cross-section short columns measuring 100 mm × 300 mm were prepared based on five MT incorporation levels (0%, 25%, 50%, 75%, 100%) and two theoretical strength grades (C30 and C40). Uniaxial compression failure tests were conducted on these columns, followed by a 30-day dry–wet cycle test using sodium chloride solutions (concentrations of 20,000 mg/L and 50,000 mg/L) in combination with an infrared electric heating air drying oven. Additionally, partial short columns were subjected to a high-temperature test at 400 °C using an electric resistance furnace. Combined with scanning electron microscopy tests, the influence of various parameter variables on the physical and mechanical properties of the MT concrete short columns was analyzed, and the corresponding variation patterns were examined. A strength calculation model after dry–wet cycles and high-temperature exposure was proposed. This research aims to provide a reference for the rescue and rapid reconstruction of MT concrete structures affected by corrosion and fire.
2. Experimental Design
An experimental study was conducted on concrete mixes designed for C30 and C40 grades with five MT replacement rates (0% to 100%). The study involved casting and testing 45 cubic specimens (100 mm × 100 mm × 100 mm) to determine the fundamental mechanical properties of the concrete mixes, specifically the 28-day cubic compressive strength. Then, 50 circular specimens (Φ100 mm × 300 mm), representing all strength grade and replacement rate combinations, were prepared and put through a sequence of experimental phases: property characterization, dry–wet cycling, high-temperature exposure, and axial compression experiment.
2.1. Materials
The raw materials utilized in this study for preparing the concrete specimens included MT sand, river sand, crushed stone, ordinary Portland cement, and tap water. Specimens of MT concrete with varying strength grades were fabricated according to the designed mix proportions.
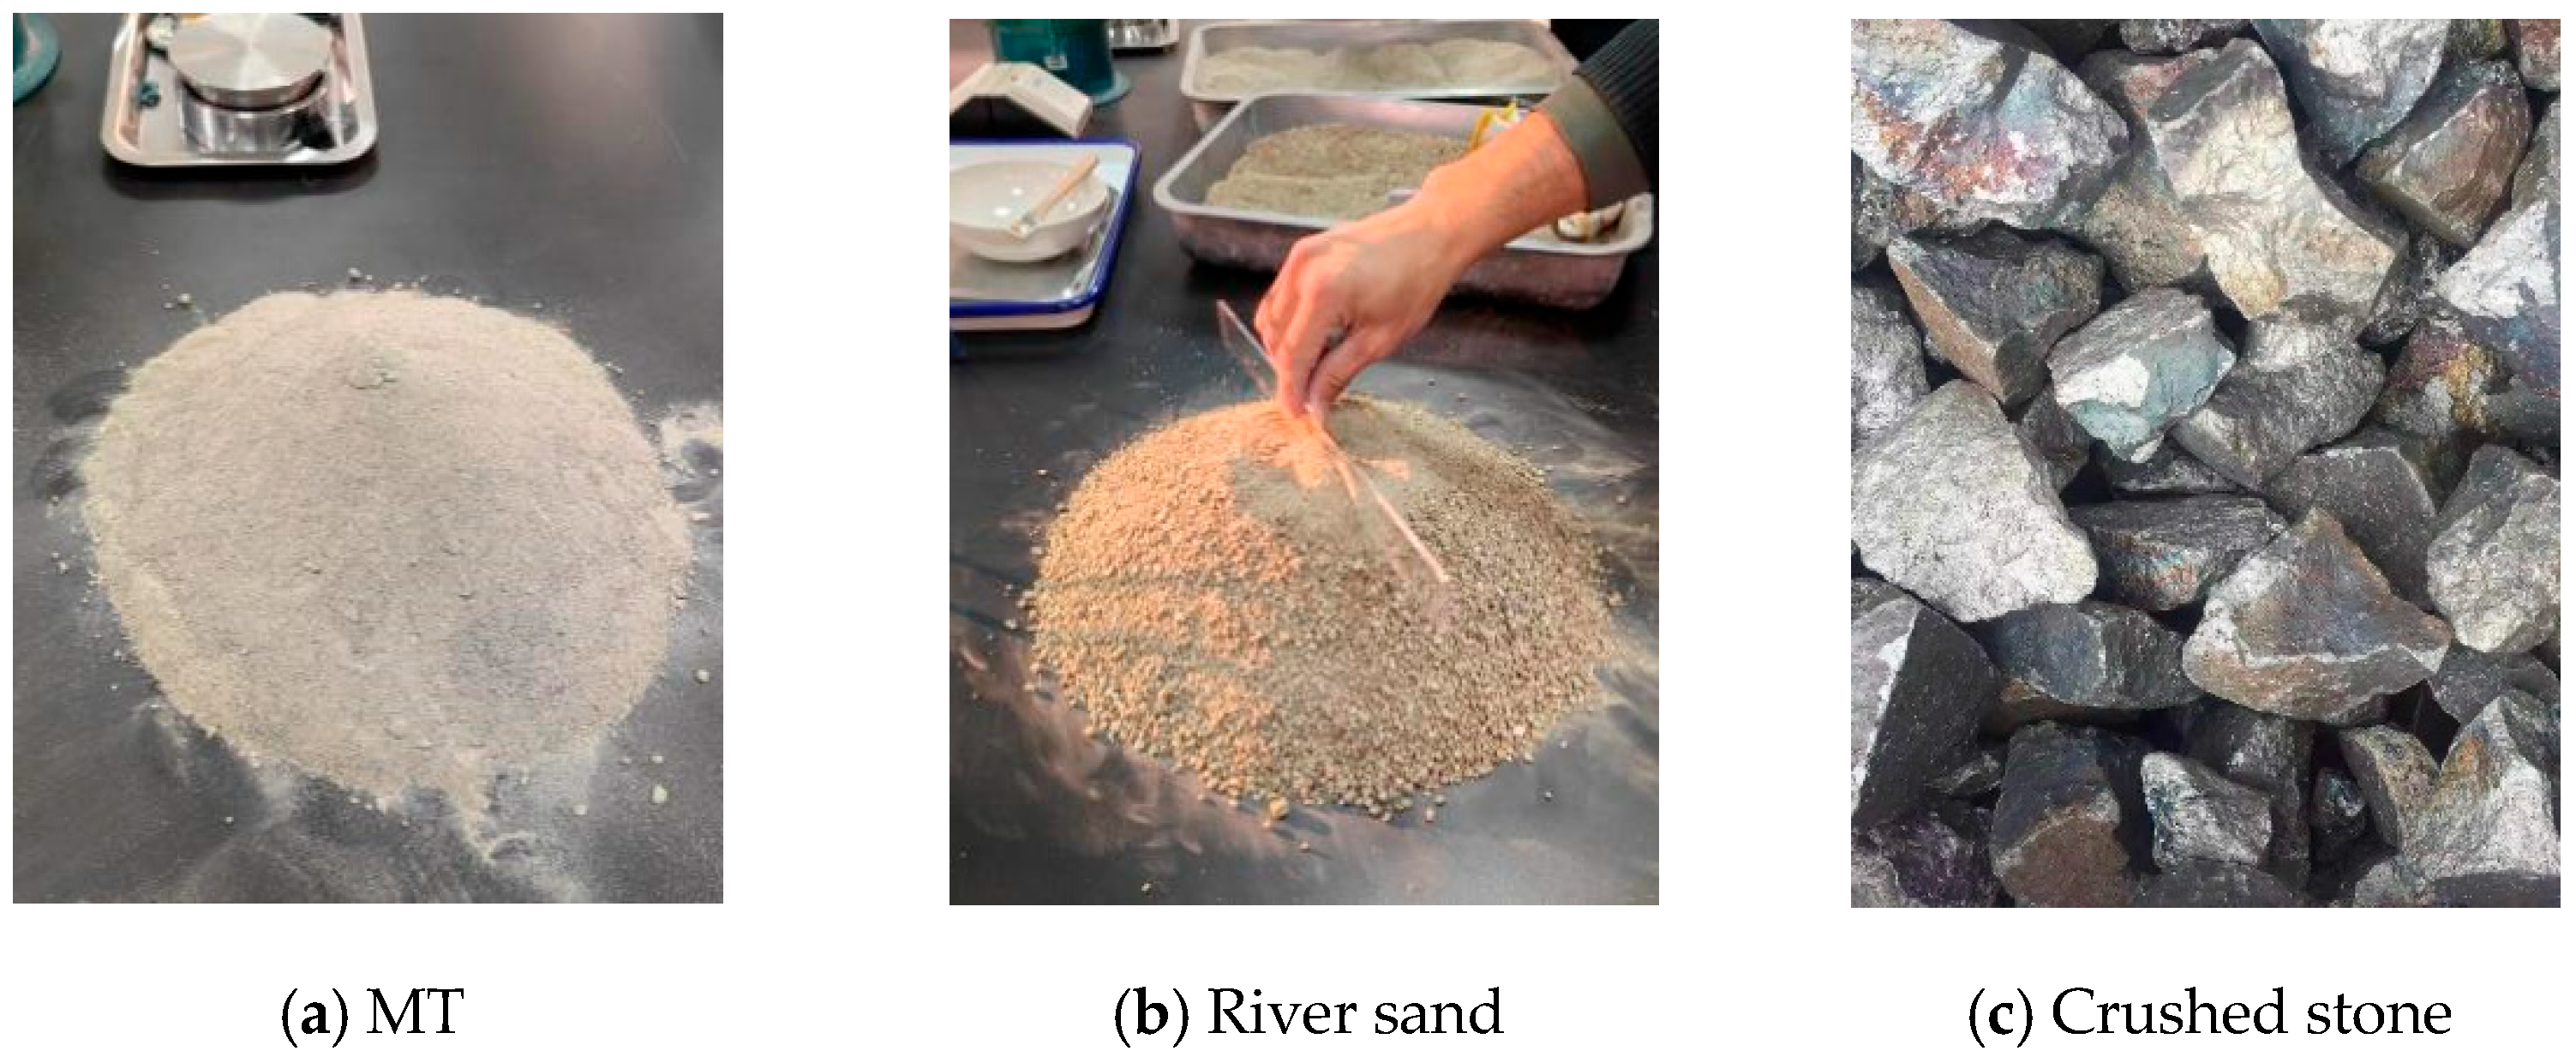
Figure 1 shows the MT material, which was obtained as waste residue from Shaanxi Jindoucheng Molybdenum Co., Ltd., Xi’an, China, following their smelting and processing. River sand was procured as natural sand from Hanzhong City, Shaanxi Province. The coarse aggregate crushed stone sourced from the Qinling Mountains in the Huiyuan District of Xi’an City, Shaanxi Province, was sieved to remove oversized particles, with a maximum aggregate size of 16 mm. The cement used was P·O 42.5 ordinary Portland cement, conforming to the standard [
32]. Tap water was used for mixing.
The feasibility of MT as a replacement for river sand was assessed through a characterization of their physical and chemical properties (data are presented in
Table 1 and
Table 2). The physical properties—including bulk density and apparent density—of the MT are categorized as very fine sand. Chemically, both materials demonstrate considerable stability, with silicon dioxide (SiO
2) as the predominant constituent and comparable levels of metal oxides such as Fe
2O
3 and Al
2O
3. The overall similarity in key physicochemical properties confirms that MT is a suitable substitute for river sand.
This study designed the concrete mix proportions based on two target strength grades (C30 and C40) and five MT replacement rates (0% to 100%). The designs employed Equation (1) for the calculation:
where
fcu,o is the required average compressive strength of the concrete mix (MPa);
fcu,k is the characteristic compressive strength of the concrete, taken as the standard value of the cube compressive strength for the corresponding design grade (MPa); and
δ is the standard deviation of the concrete strength (MPa), with values selected according to the production quality level, as given in
Table 3.
The water–cement ratio was determined by Equation (2):
where A and B are the regression coefficients, taken as 0.53 and 0.20, respectively, for crushed stone concrete;
fce is the 28-day compressive strength of cement (MPa), determined by the following Equation (3):
where
γc is the surplus coefficient of cement, taken as 1.16 and
fce,g is the strength grade value of the cement (MPa).
According to EN [
33], the target slump of the fresh concrete was set to S1, and the initial water content was established as 200 kg/m
3. Following the specification stipulating a maximum cement content of 550 kg per cubic meter of concrete, the water–cement ratios for C30 and C40 concrete, derived from Equation (2), were 0.45 and 0.42, respectively. Consequently, the final water consumption for the concrete mixes was determined to be 173 kg/m
3 and 205 kg/m
3, respectively.
The sand ratios for the C30 and C40 mixes were assigned values of 0.33 and 0.32, respectively, grounded in standard recommendations and a comprehensive analysis of previous slump experiment data. The mass method was employed to calculate the coarse and fine aggregate contents, utilizing Equations (4) and (5):
where
mco denotes the mass of cement per cubic meter (kg/m
3);
mfo denotes the mass of chemical admixture per cubic meter (kg/m
3);
mwo denotes the mass of water per cubic meter (kg/m
3);
mso denotes the mass of fine aggregate (sand) per cubic meter (kg/m
3);
mgo denotes the mass of coarse aggregate per cubic meter (kg/m
3);
mcp is the assumed mass per unit volume of the fresh concrete, with a value of 2400 kg/m
3 adopted in this study; and
βs is the sand ratio (%), defined as the percentage of fine aggregate mass to the total mass of aggregates.
Table 4 shows the specific mass of each material utilized per cubic meter of concrete. In this experimental program, the replacement of fine aggregate by MT was implemented according to the designated ratios, and 45 cubic specimens with dimensions of 100 mm × 100 mm × 100 mm were prepared.
Figure 2 illustrates that the measured compressive strengths of the non-standard concrete specimens were multiplied by a size conversion factor of 0.95, as the concrete strength grade was below C60. These results verify that the actual strengths satisfied the respective target strength grades. The detailed experimental data are summarized in
Table 5.
2.2. Fabrication of Molybdenum Tailings Concrete Specimens
This study adopted a full-factorial experimental design with three core independent variables, including two target concrete strength grades (C30 and C40), five mass replacement ratios of MT for river sand (0%, 25%, 50%, 75% and 100%), and five exposure conditions, specifically the blank control group without any erosion or high-temperature treatment, the ambient temperature group after dry–wet cycling in 20,000 mg/L NaCl solution, the 400 °C high-temperature exposure group after dry–wet cycling in 20,000 mg/L NaCl solution, the ambient temperature group after dry–wet cycling in 50,000 mg/L NaCl solution, and the 400 °C high-temperature exposure group after dry–wet cycling in 50,000 mg/L NaCl solution; for each unique combination of concrete strength grade and MT replacement ratio, 5 replicate specimens were prepared, with 1 specimen assigned to each of the 5 aforementioned exposure conditions, leading to a total of 50 specimens used for the formal axial compression mechanical tests.
This specimen size (Φ100 mm × 300 mm) maintains a stable height-to-diameter ratio of 3:1, which is consistent with the mechanical test principle of standard concrete axial compression specimens (150 mm × 300 mm) specified in ASTM C39/C39M-21 and GB/T 50081-2019. The smaller diameter ensures a more uniform temperature field inside the specimen during 400 °C high-temperature exposure, avoiding the temperature gradient between the surface and core of the specimen caused by the low thermal conductivity of concrete, thus ensuring the accuracy of the high-temperature test results. A standard size conversion factor of 0.95 (specified in GB/T 50081-2019 for concrete with strength grade below C60) was applied to all compressive strength data of the non-standard specimens, to ensure the comparability of the test results with standard specimen data. The feasibility of this size selection for MT concrete mechanical tests has also been verified in previous studies [
13,
14,
15].
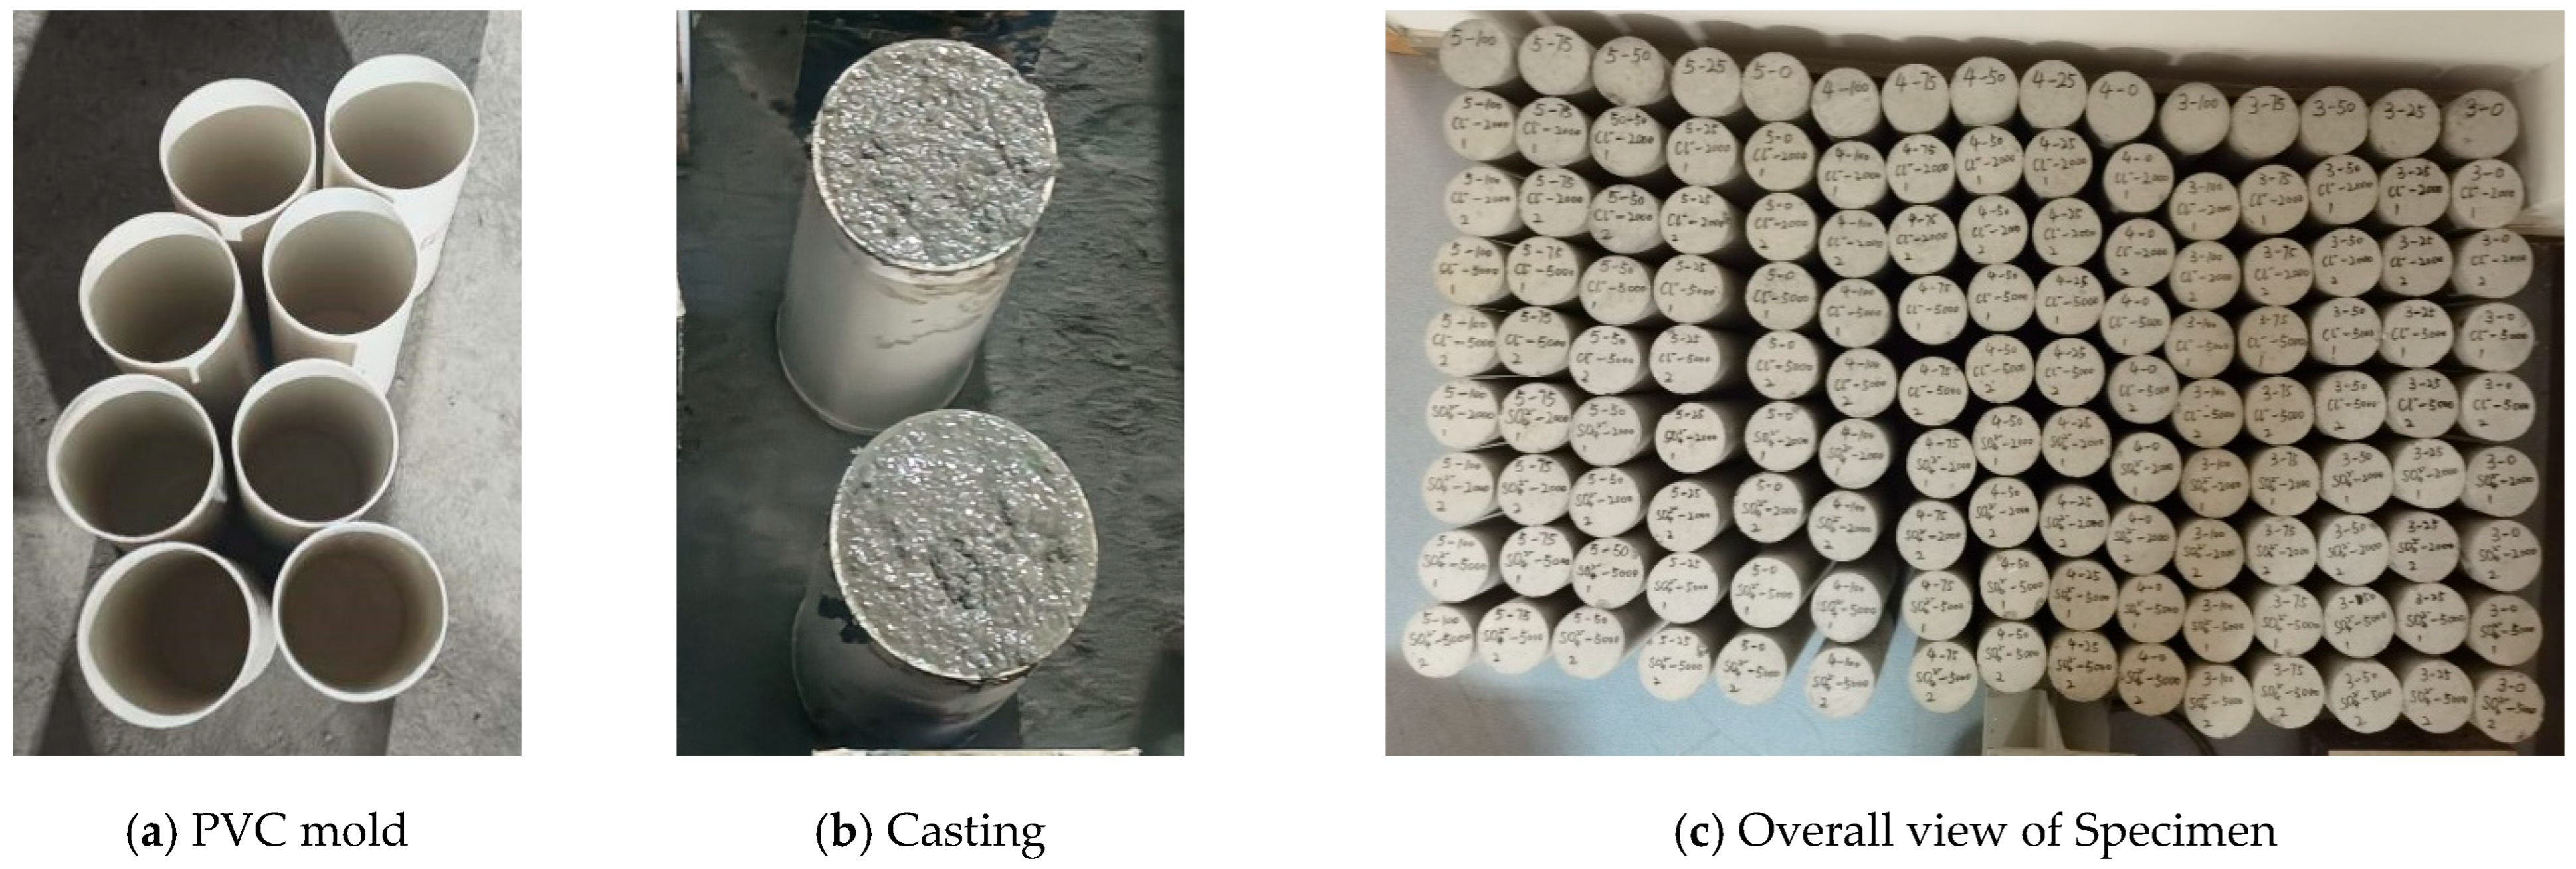
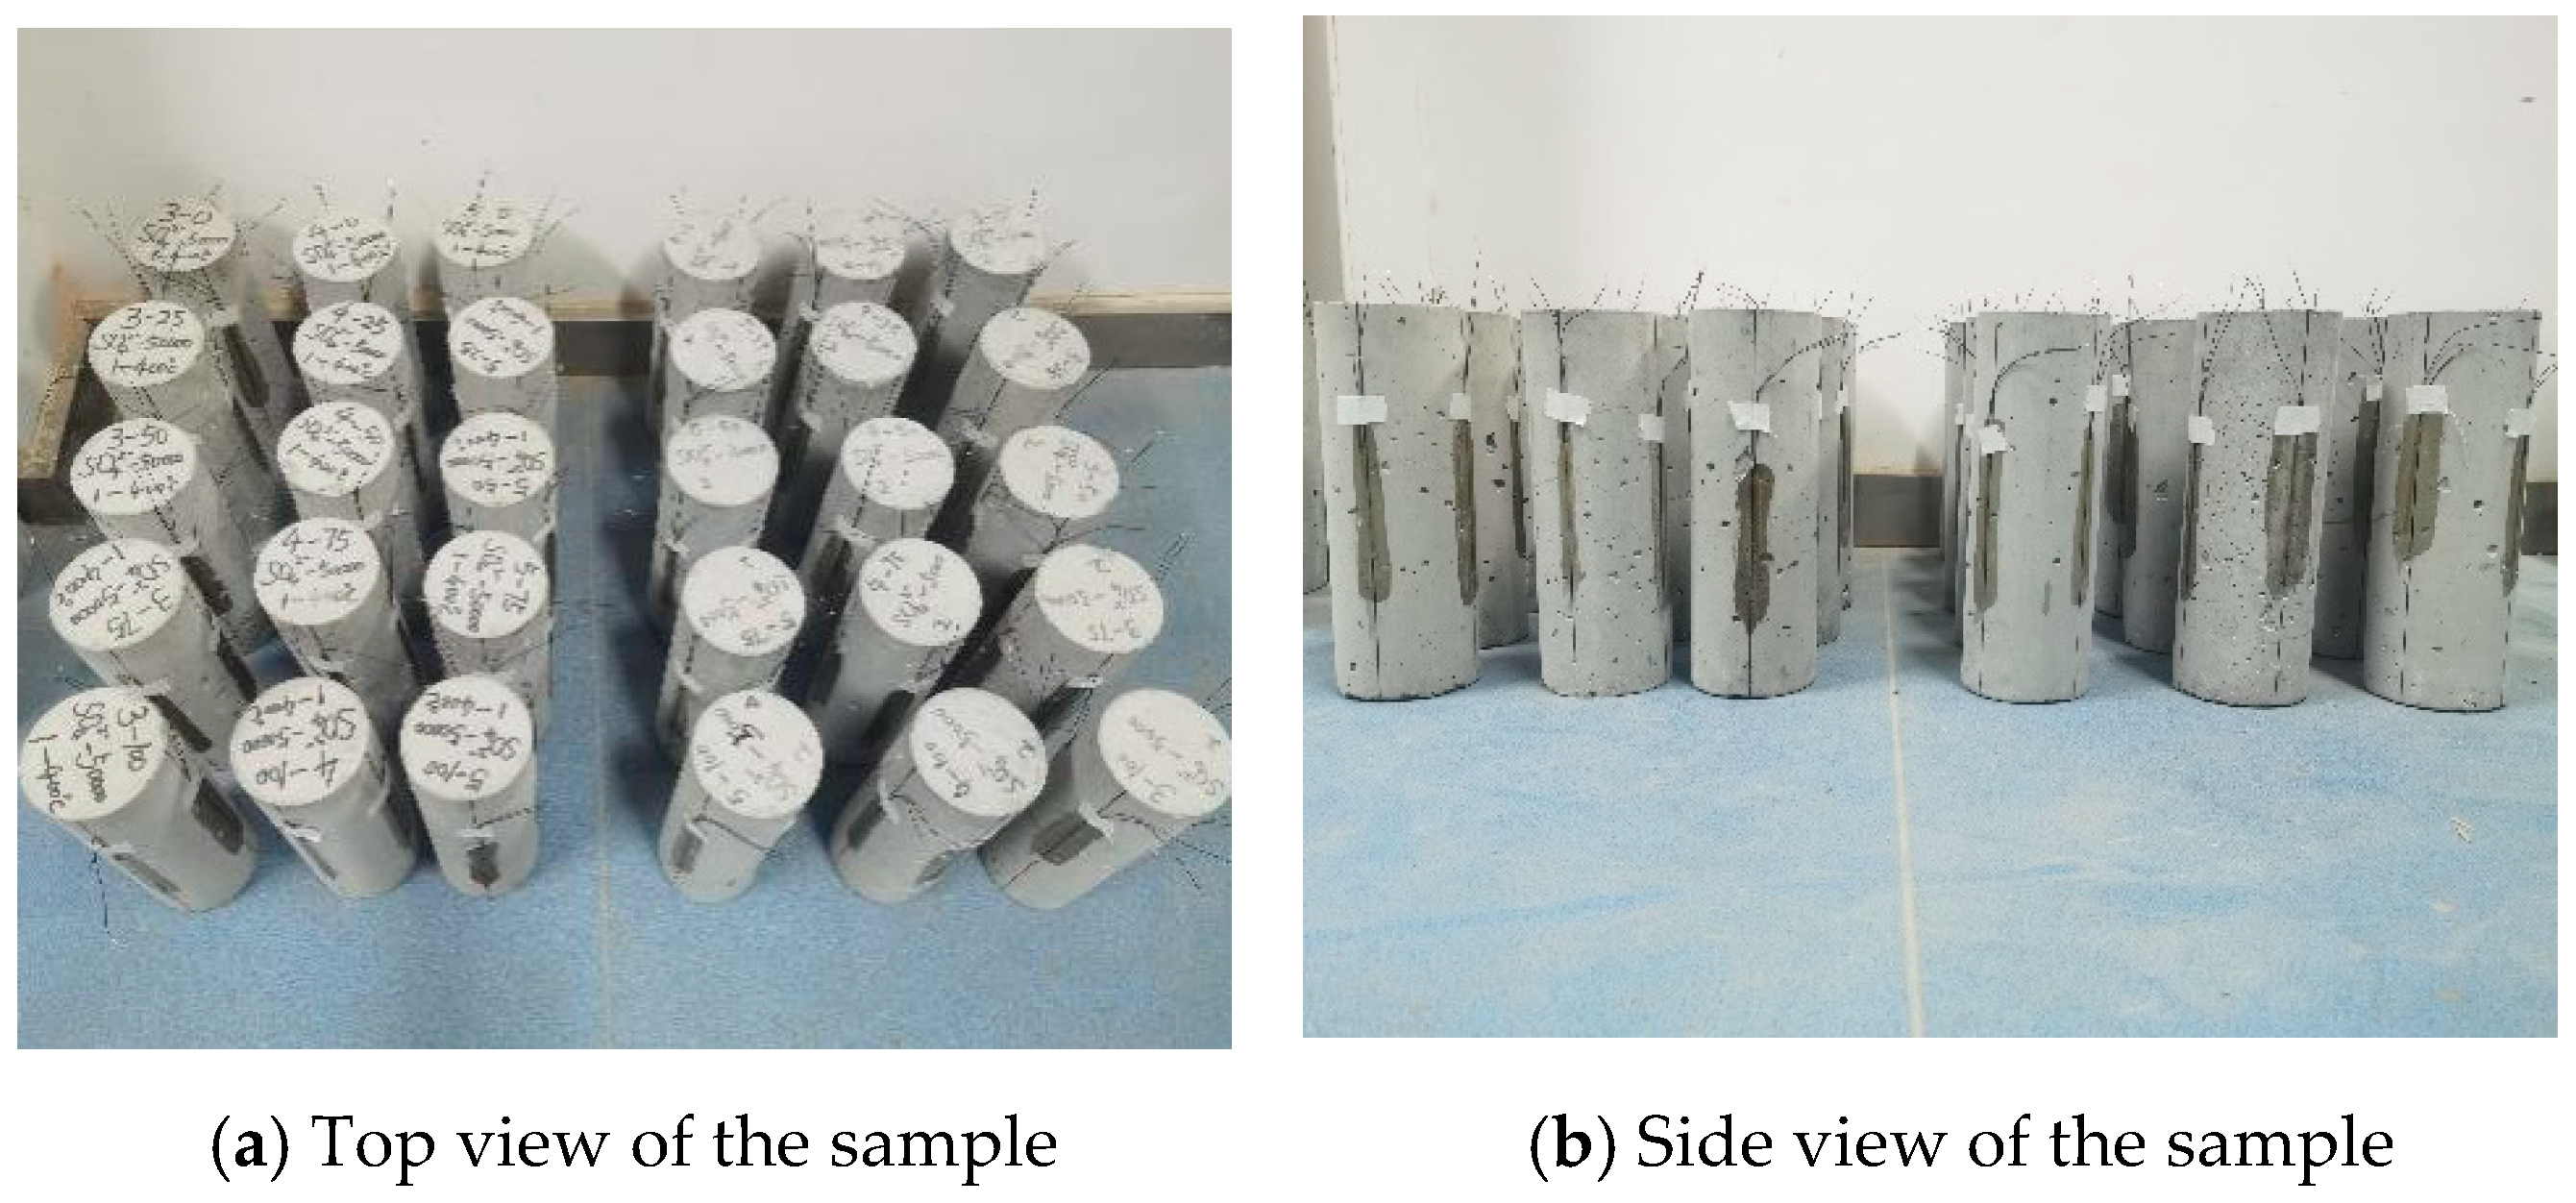
Figure 3 illustrates the specimen preparation process, where custom PVC pipes with an internal diameter of 100 mm and a height of 300 mm were employed as molds. One end of each pipe was sealed with multiple layers of waterproof adhesive tape to prevent leakage. During mixing, the aggregates and cement were first dry-mixed for 30 s. Water was then added gradually, followed by wet mixing for an additional minute. The fresh concrete was poured into the PVC molds, compacted on a vibrating table, and the top end was sealed with cling film to minimize moisture loss. The specimens were demolded after 24 h and subsequently cured under standard conditions for 28 days before being stored in the laboratory under ambient conditions. The design codes are listed in
Table 6.
2.3. Dry–Wet Cycling Experiment
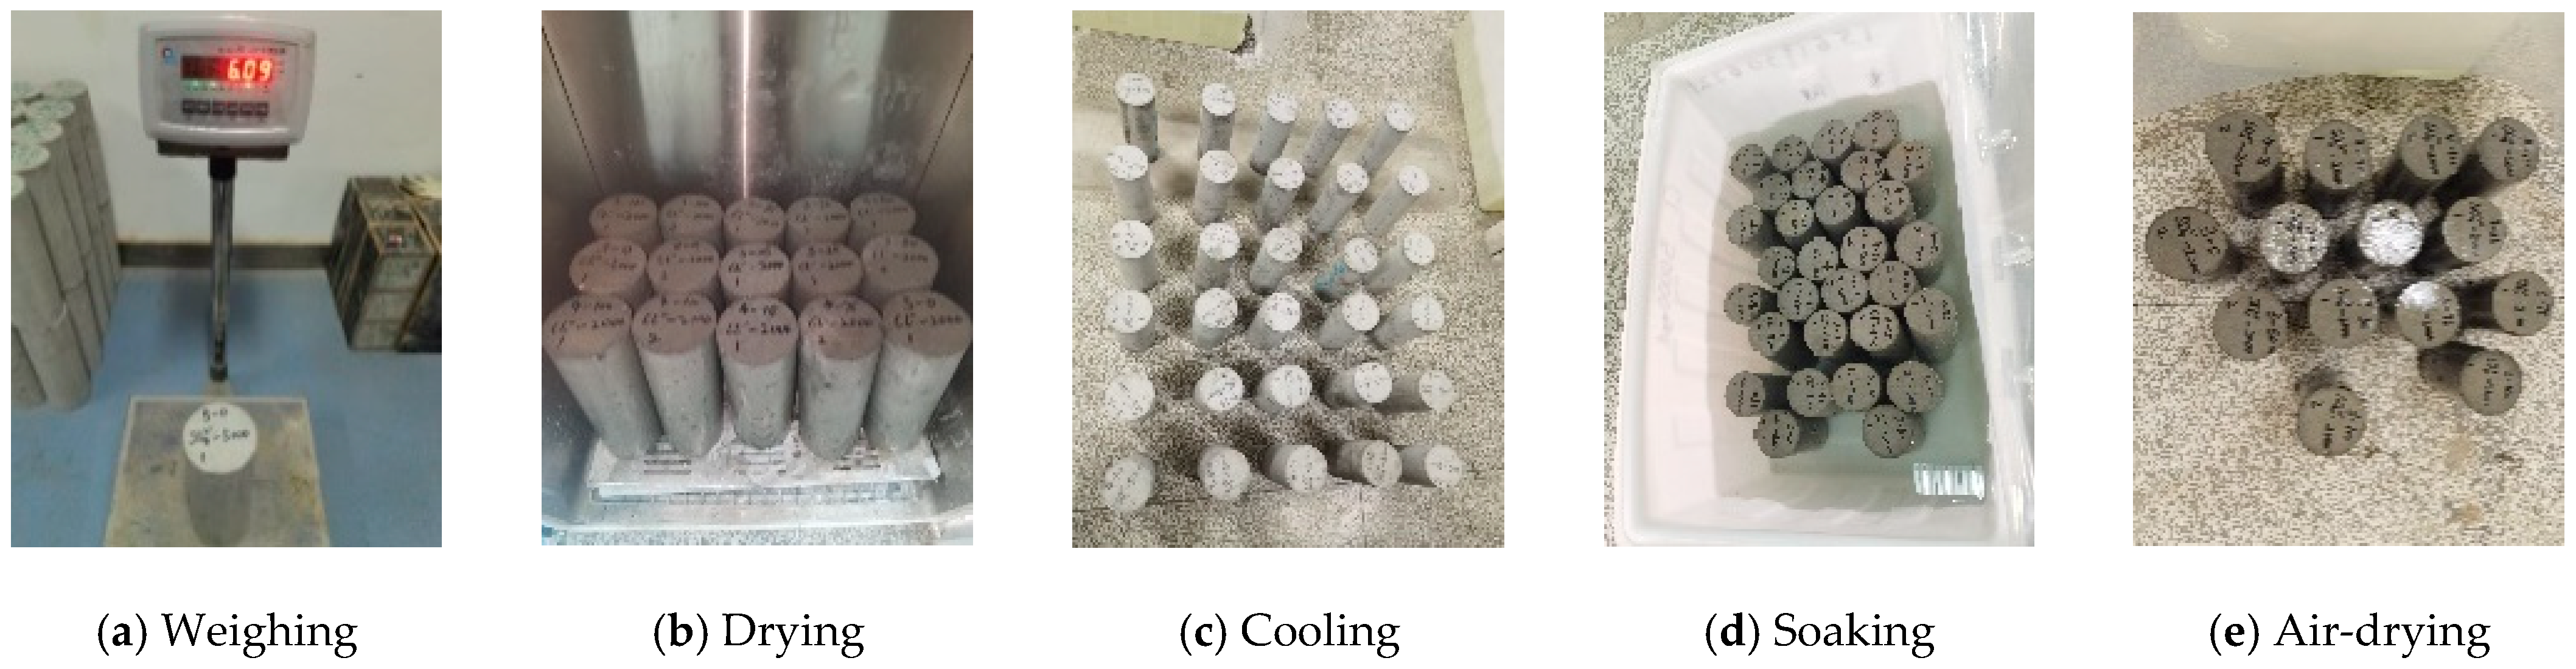
Figure 4 shows the commencement of each dry–wet cycle, which involved the immediate immersion of the cooled specimens into the solution tank within 30 min. For the chloride dry–wet cycling tests, sodium chloride (NaCl) solutions with concentrations of 20,000 and 50,000 mg/L were used, which fully conform to the requirements of the standard [
34]. The specimens remained immersed for a duration of 15 ± 0.5 h. The complete dry–wet cycle procedure was divided into four sequential phases for each 24 h cycle: The immersion phase with specimens fully immersed in NaCl solution for 15 ± 0.5 h, the surface air-drying phase with specimens removed from the solution within 30 min and air-dried on a ventilated surface for 10–30 min to remove free surface water, the constant-temperature drying phase with specimens placed in a 40 ± 2 °C electric drying oven for 8 h to complete the full drying process, and the cooling phase with specimens cooled to ambient temperature in a dry environment for 30 min before entering the next immersion cycle.
The NaCl solution used in the test was freshly prepared with deionized water before the start of the test, and the solution was kept sealed throughout the whole dry–wet cycling process to avoid external contamination and significant fluctuation of solution properties; no solution replacement was performed during the consecutive cycles, which ensured the stability of the test environment for the specimens. Given that the 30 cycles were conducted continuously and completed within one month, the solution was replaced at the end of the experiment regimen. The solution temperature was consistently kept between 25 and 30 °C. The mass of the specimens was recorded at intervals of 10 cycles.
The rate of mass variation quantifies the variation in specimen mass resulting from dry–wet cycles. This change encompasses both physical and chemical effects induced by the solution, which affect the internal pore system of the concrete. The mass change under varying numbers of immersion cycles was determined by Equation (6):
where
ms denotes the percentage of mass variation;
m0 and
m1 represent the mass of the specimen before and after
n dry–wet cycles, respectively (kg).
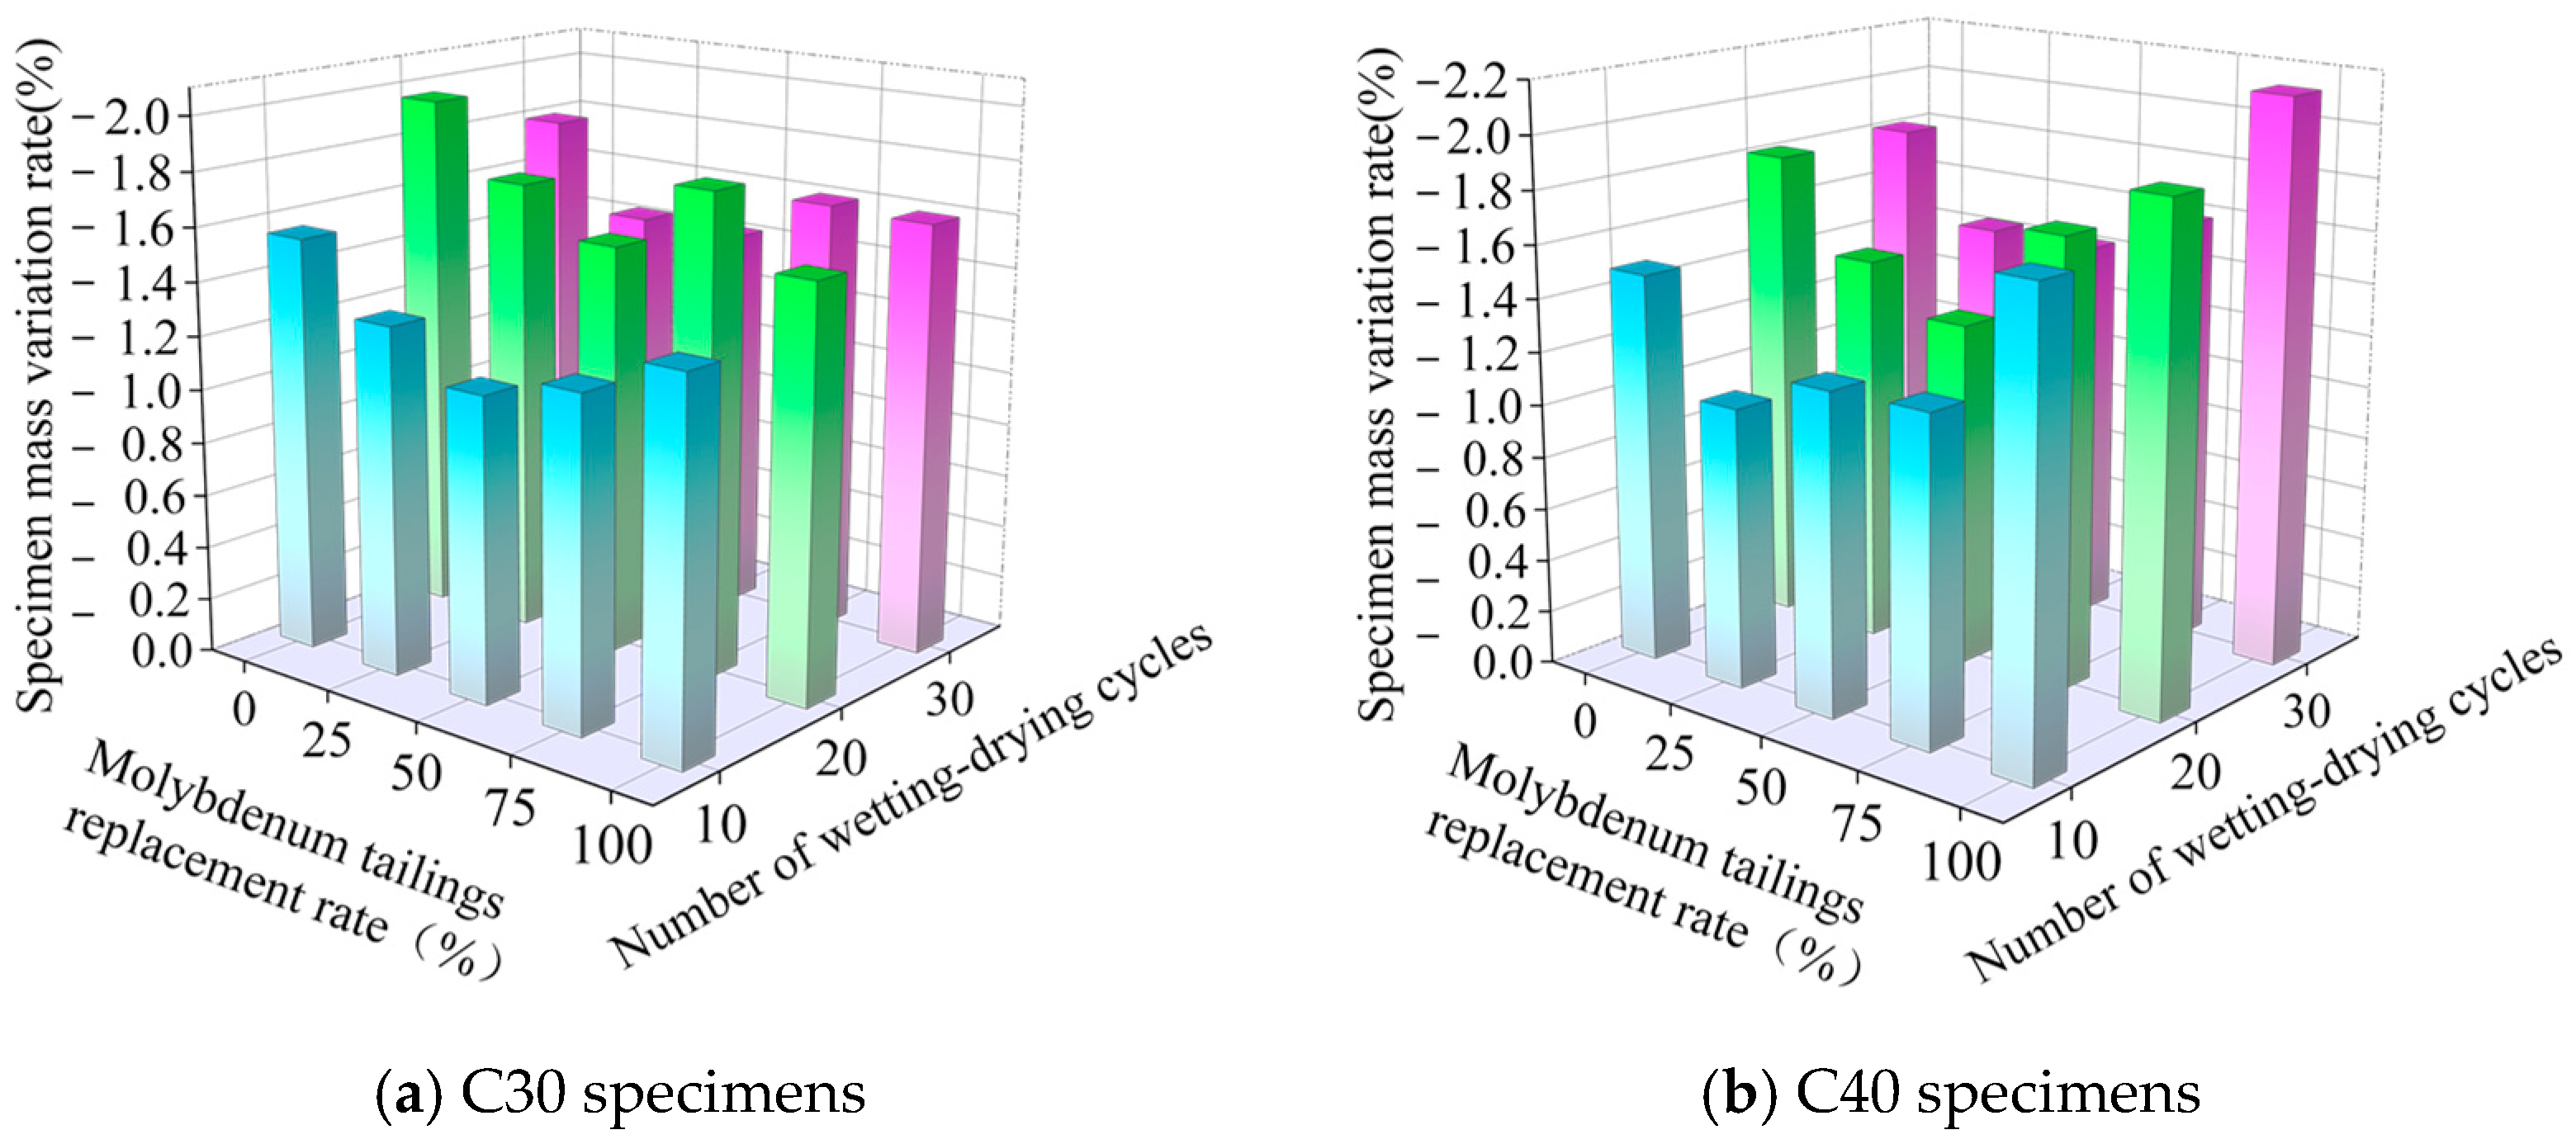
Figure 5 presents the analysis of mass variation, revealing the following trends for the different concrete grades. As shown in
Figure 5a, for C30 specimens, the mass change rate demonstrated an initial increase followed by a decrease with continuing dry–wet cycles. Conversely, with respect to the MT replacement ratio, the rate first decreased and then increased. As shown in
Figure 5b, for C40 specimens, the mass exhibited an overall increasing trend with cycle count, while the relationship with the replacement ratio was non-monotonic, showing an initial increase followed by a decrease, which showed a decreasing-then-increasing pattern.
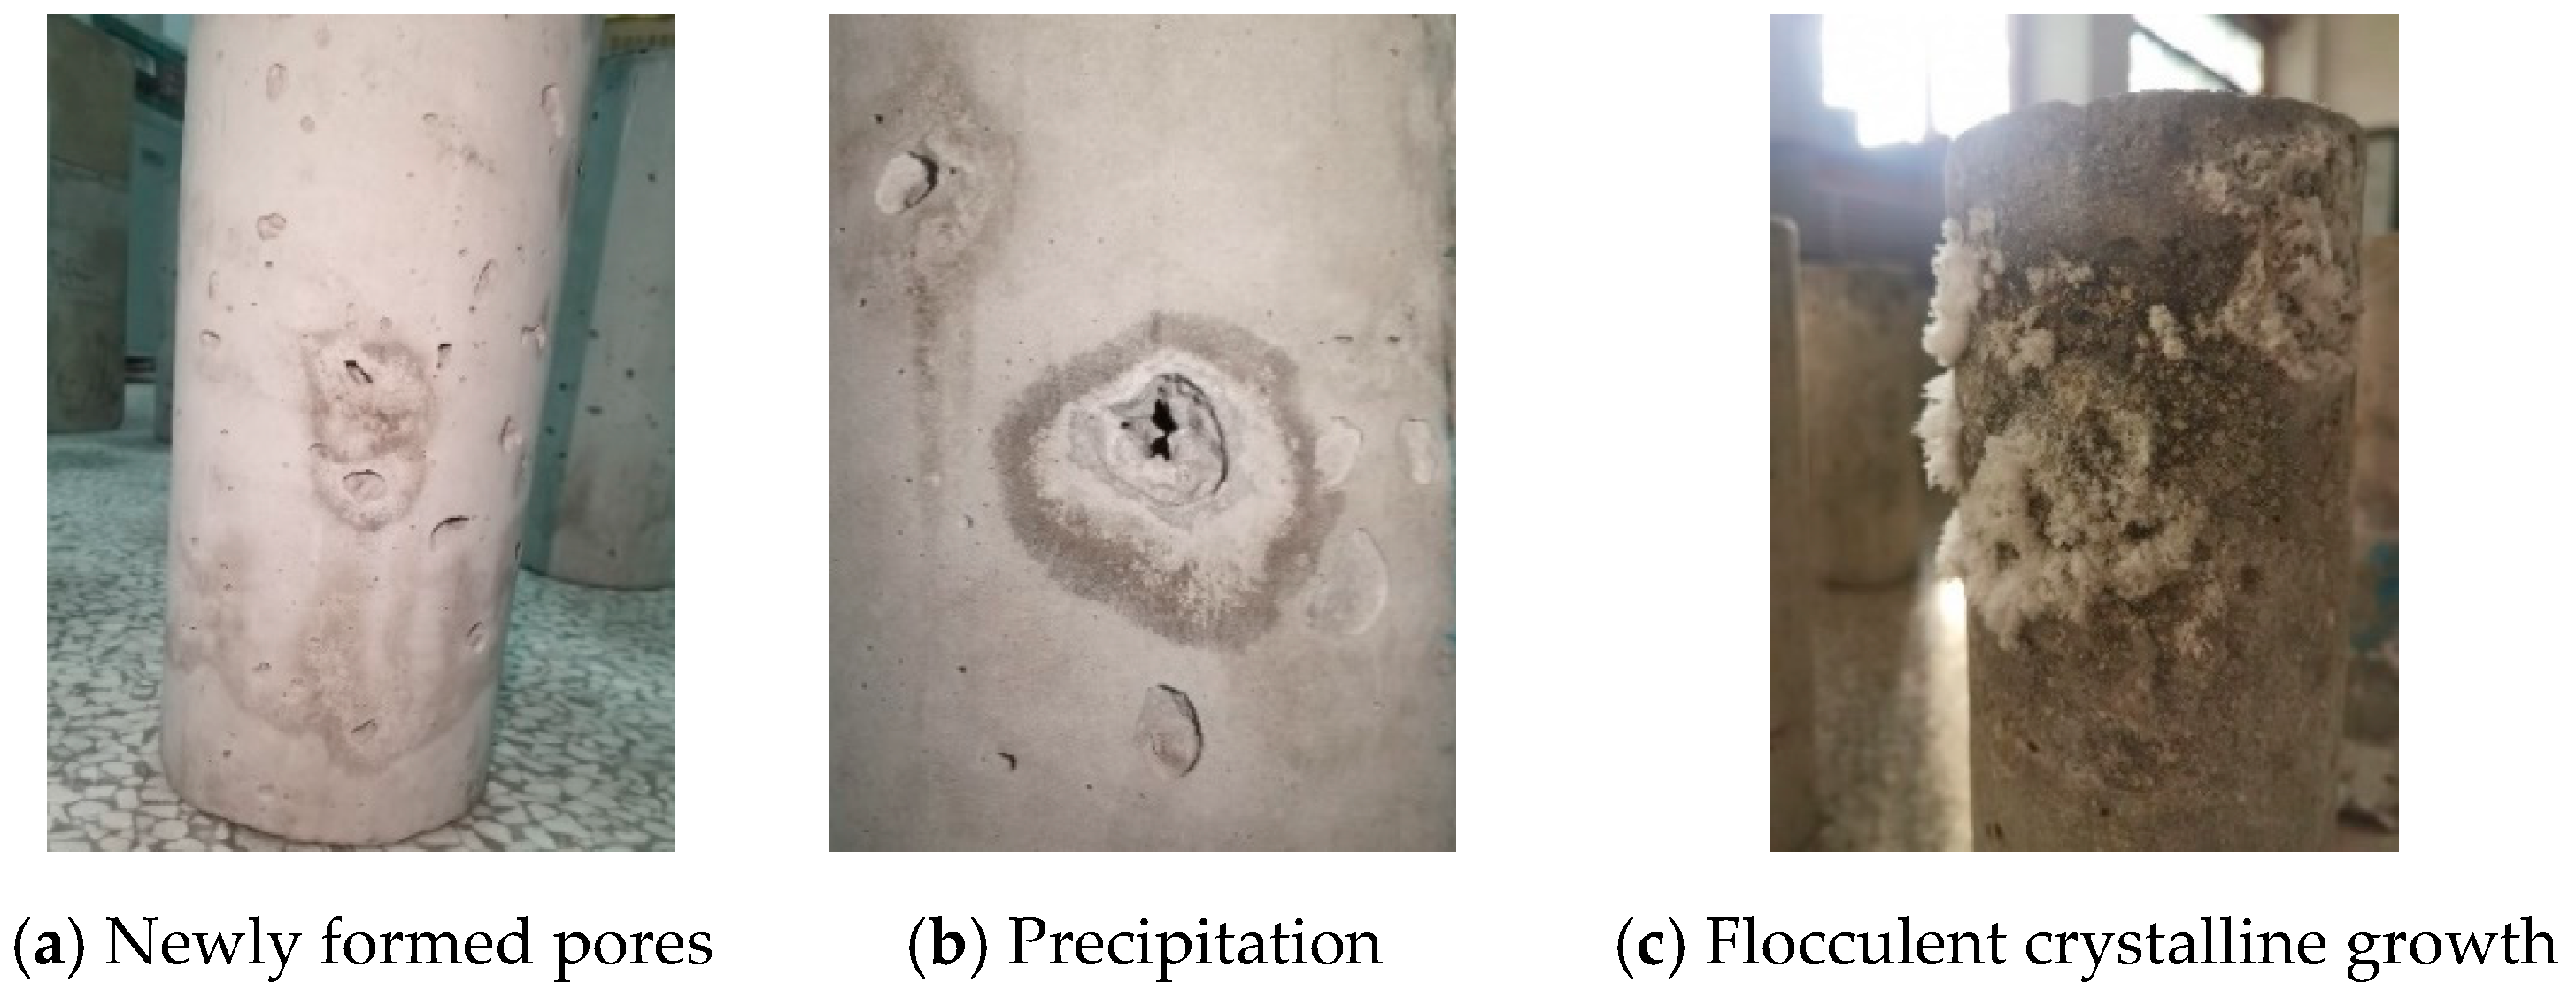
The following conclusions can be drawn from the study: A net mass gain was observed in the specimens after dry–wet cycling and immersion. This was accompanied by visible surface deterioration, including the formation and enlargement of pores, as well as the appearance of white crystalline deposits.
2.4. High-Temperature Exposure Experiment
The experiment protocol consisted of sequential heating, isothermal, and cooling phases. The high-temperature exposure experiments utilized a LYL-17LBT box-type resistance furnace, Luoyang Liyu Kiln Co., Ltd., Luoyang, China (conforming to the Chinese standard [
35]). The thermal load curve of the high-temperature test was designed in accordance with the standard (conforming to the Chinese standard [
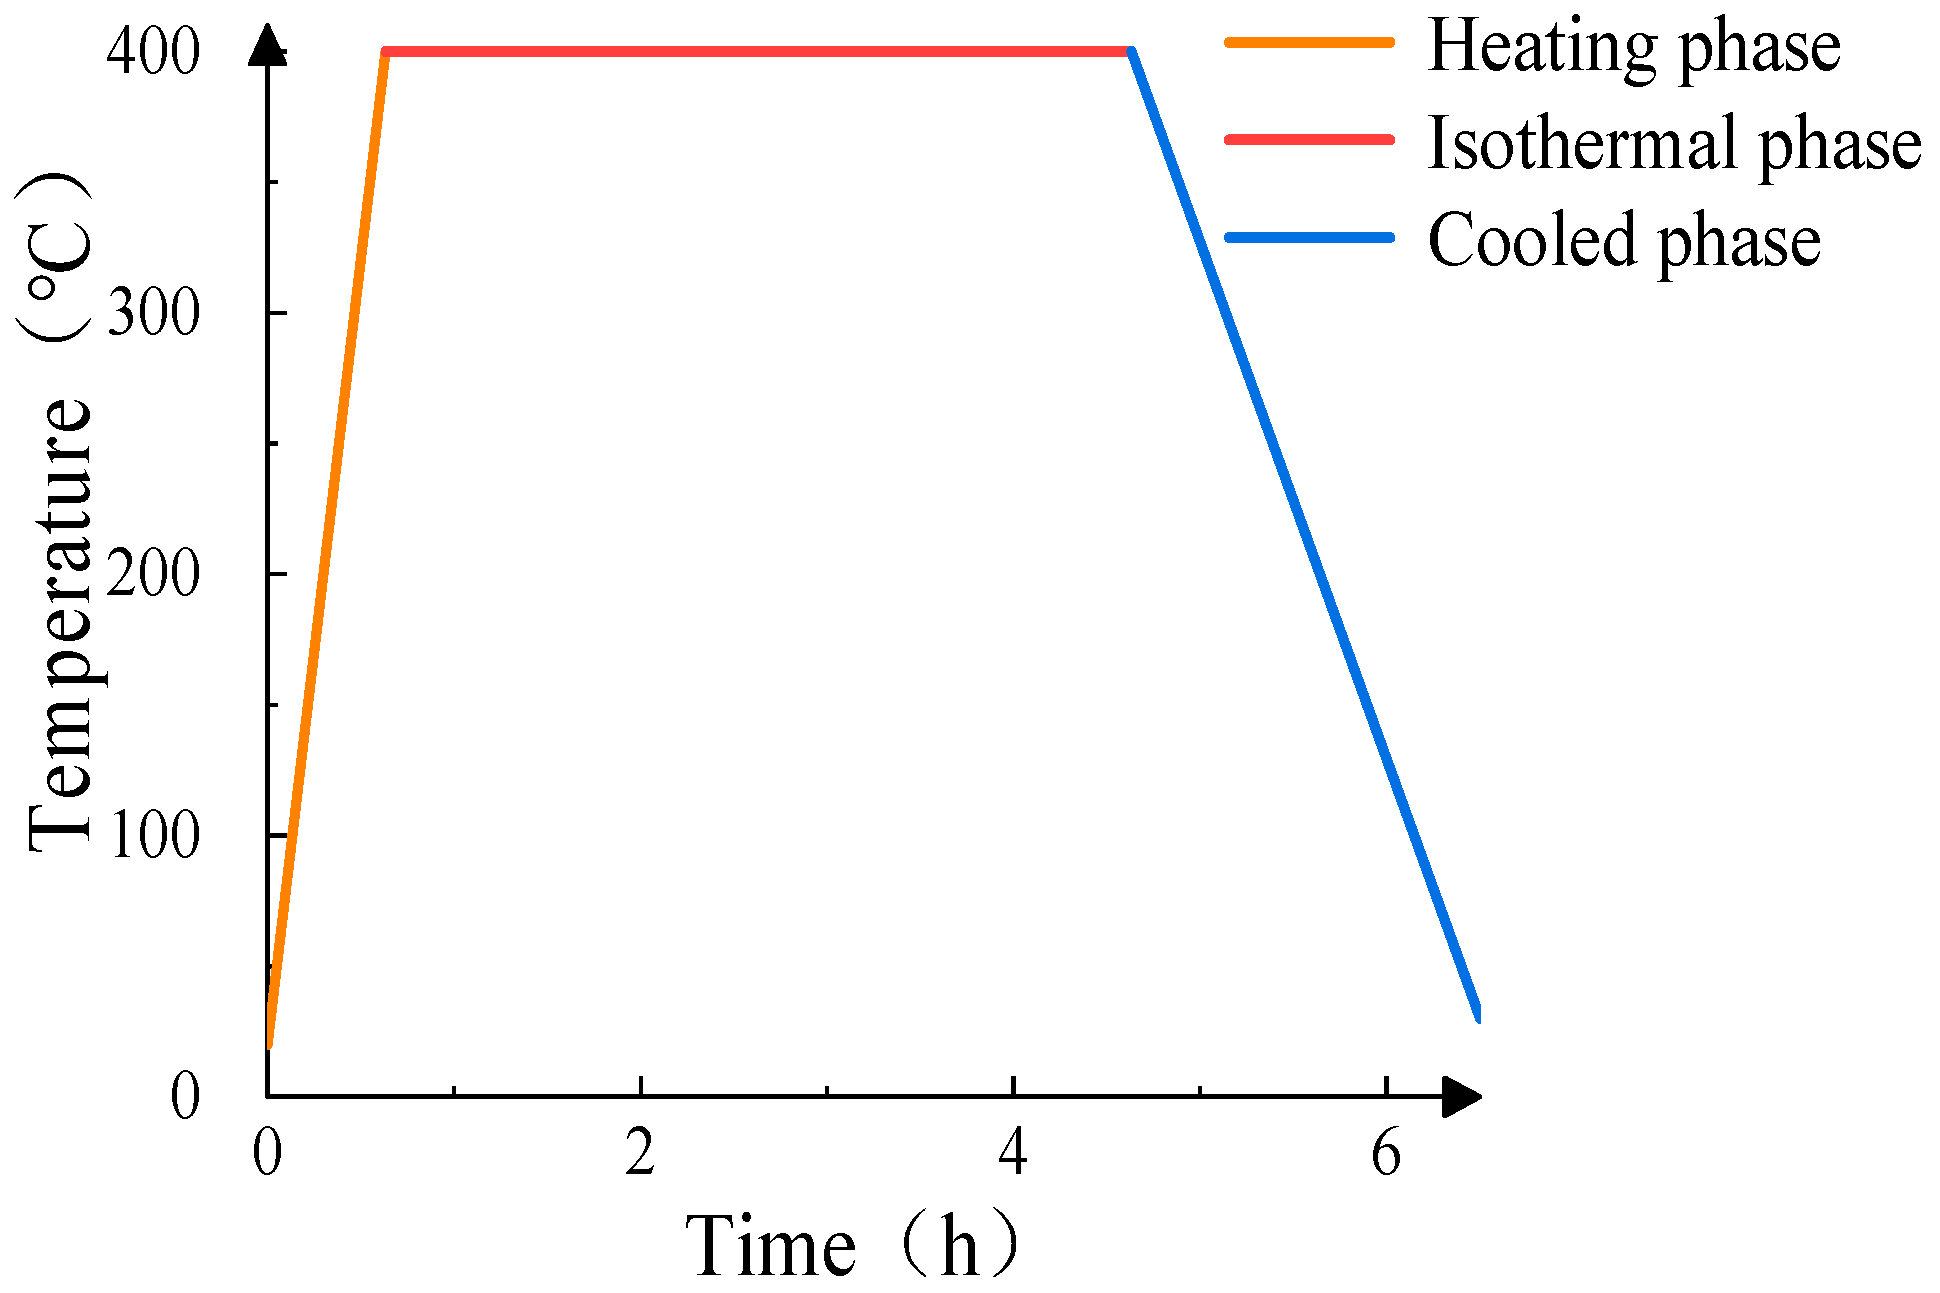
36]), which is compatible with the international standard ASTM E119-22. The heating rate was set at a constant 10 °C/min. Commencing from an initial temperature equivalent to ambient conditions (20 ± 2 °C), the furnace temperature was raised at a constant rate of 10 °C/min. This heating phase persisted for 38 min, culminating in the attainment of the target temperature of 400 °C within the furnace chamber. To account for the inherent low thermal diffusivity of concrete and ensure the core of the MT concrete specimens achieved the target temperature (400 °C), an isothermal holding period of 4 h was implemented immediately upon reaching the set point. The 4 h isothermal holding period at 400 °C was verified by embedded thermocouple monitoring. The natural cooling regime was selected to simulate the actual natural cooling process of concrete structures after a fire, which is the most common working condition in post-fire structural safety assessment. This heating and cooling regime can effectively reflect the actual performance degradation of concrete structures in post-fire corrosive environments.
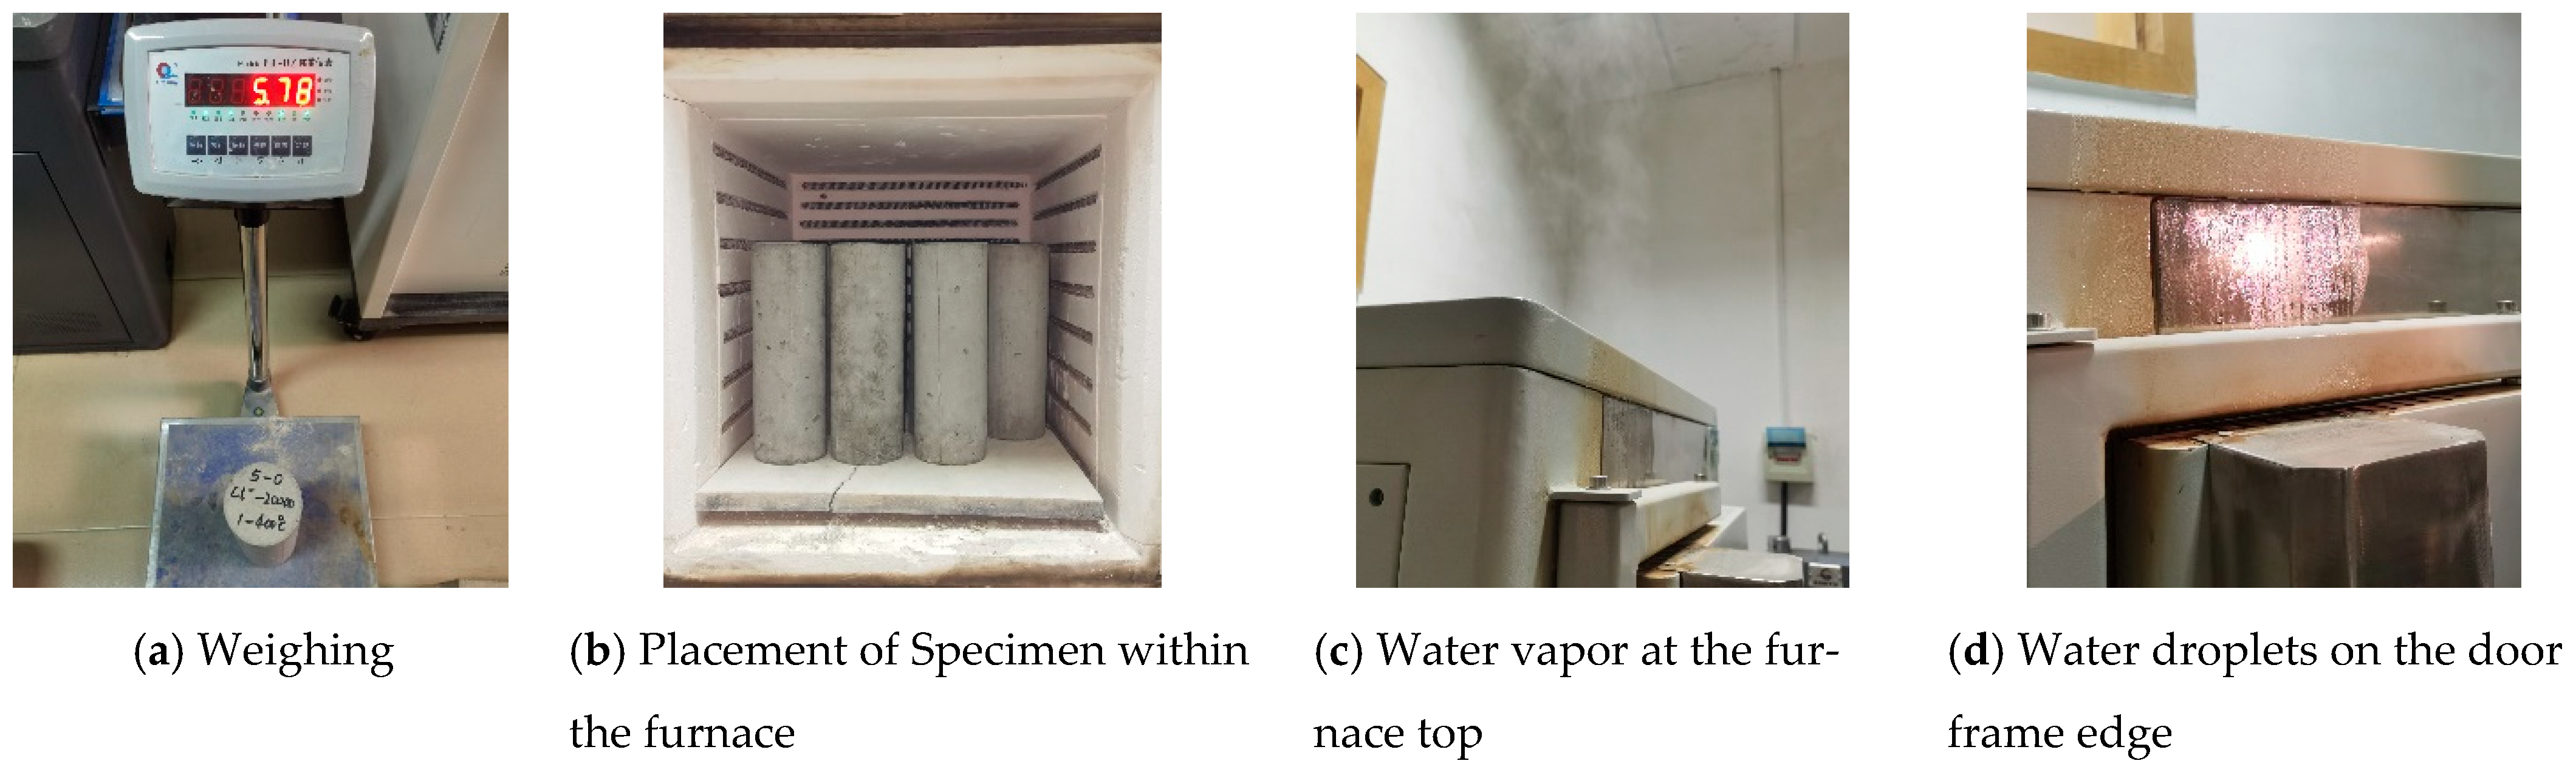
Following this isothermal phase, natural cooling was initiated by opening the furnace door. The naturally cooled specimens were subsequently extracted and their mass recorded. The temporal evolution of the internal furnace temperature throughout the experiment is depicted in
Figure 6.
During the heating stage, initial vapor release, attributable mainly to the evaporation of capillary water, was observed at temperatures below 200 °C.
Figure 7 displays the process of intensive bound water vaporization at the target temperature of 400 °C, which resulted in conspicuous vapor discharge from the furnace vent and was accompanied by a pronounced odor. Post-experiment, the specimens were cooled naturally, extracted, and weighed. The expulsion of moisture from the specimens also led to the corresponding formation of condensed droplets on the cooler surfaces of the furnace door frame.
2.5. Axial Compressive Strength Experiment
Subsequent to the high-temperature experiment, the mass of all specimens was recorded.
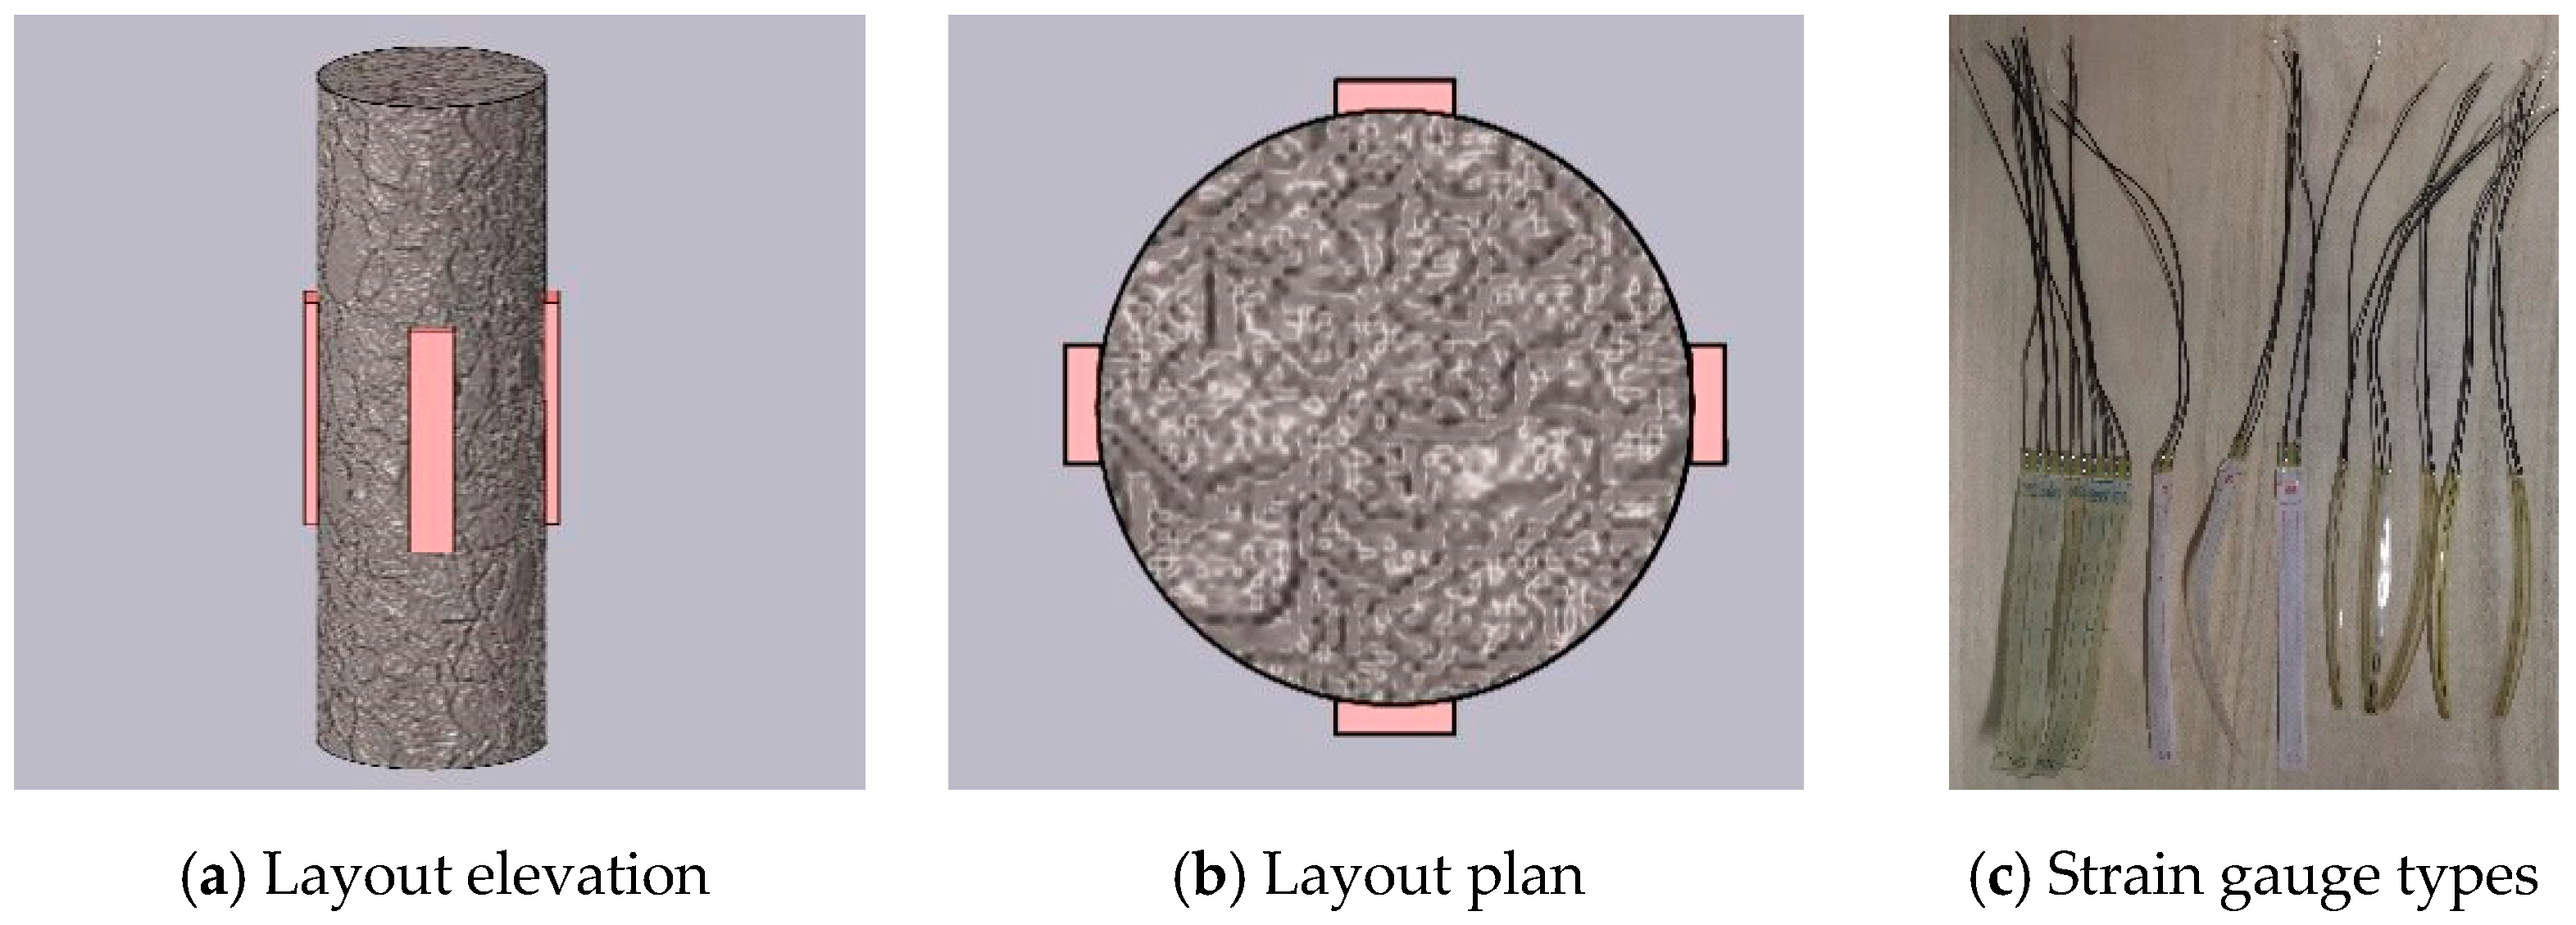
Figure 8 illustrates the installation layout of the four strain gauges attached to each specimen, which were positioned symmetrically at 90° intervals around the central axis. The strain gauges used in this study were solderless types (conforming to the Chinese standard [
37]). Their respective specifications are provided in
Table 7. The axial compression tests were conducted in strict accordance with the standards (conforming to the Chinese standard [
38,
39]).
Figure 9 shows the initial surface preparation step, where each specimen was sanded with 240-grit sandpaper to remove dust and irregularities. Subsequently, the precise locations for gauge attachment were marked. A layer of epoxy resin adhesive was applied to these positions, ensuring that the covered area was slightly larger than the size of the strain gauge. The specimens were then left undisturbed in the laboratory for 24 h to facilitate complete curing of the epoxy. Following curing, the surface was lightly re-sanded to achieve smoothness, and any resulting dust was removed. The strain gauges were aligned with the pre-marked locations. A minimal amount of 502 adhesive was administered along the gauge edges via a dropper. A PTFE film was placed on top and rolled firmly along the gauge’s primary axis to eliminate trapped air and squeeze out surplus adhesive. The film was peeled off after one minute. The leads were finally fastened using pressure-sensitive tape.
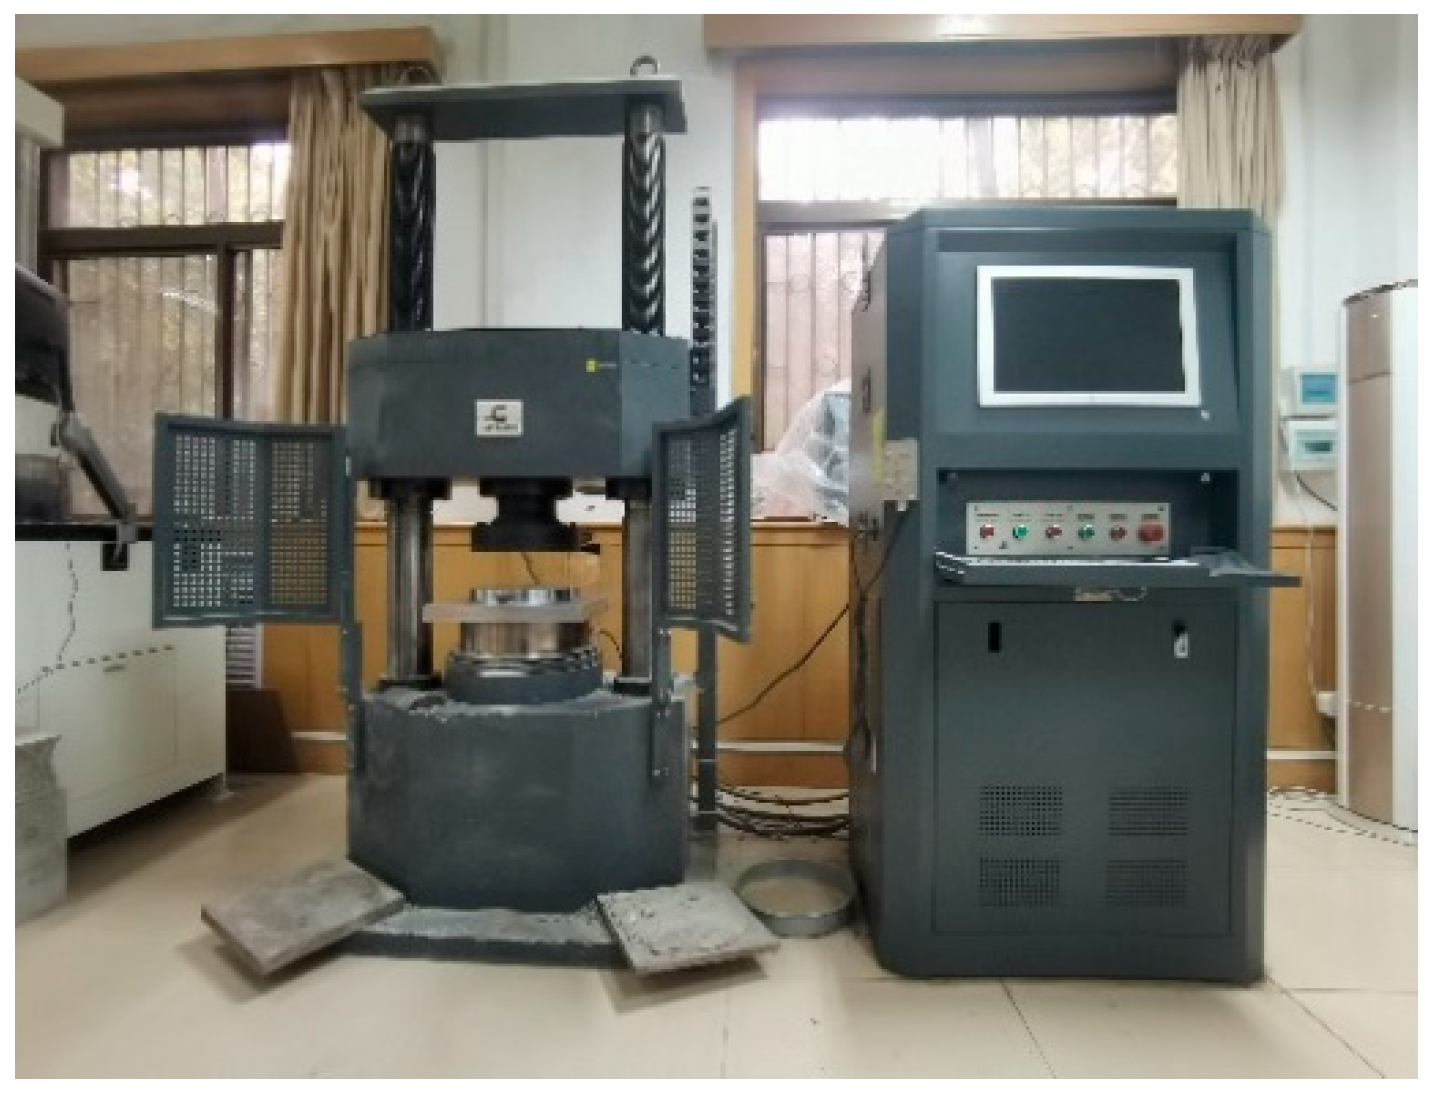
Figure 10 demonstrates the process of initial surface preparation, involving sanding each specimen with 240-grit sandpaper to remove dust and surface irregularities. The test was carried out using a YAW-2000D testing machine manufactured by Jinan Kason Testing Equipment Co., Ltd., Jinan, China.
Figure 11 depicts the initial surface preparation process by sanding the specimens with 240-grit sandpaper to remove dust and surface irregularities. All equipment was calibrated before the experiment. The loading regime was stress-controlled at a rate of 0.5 MPa/s, with data sampled at 10 Hz.
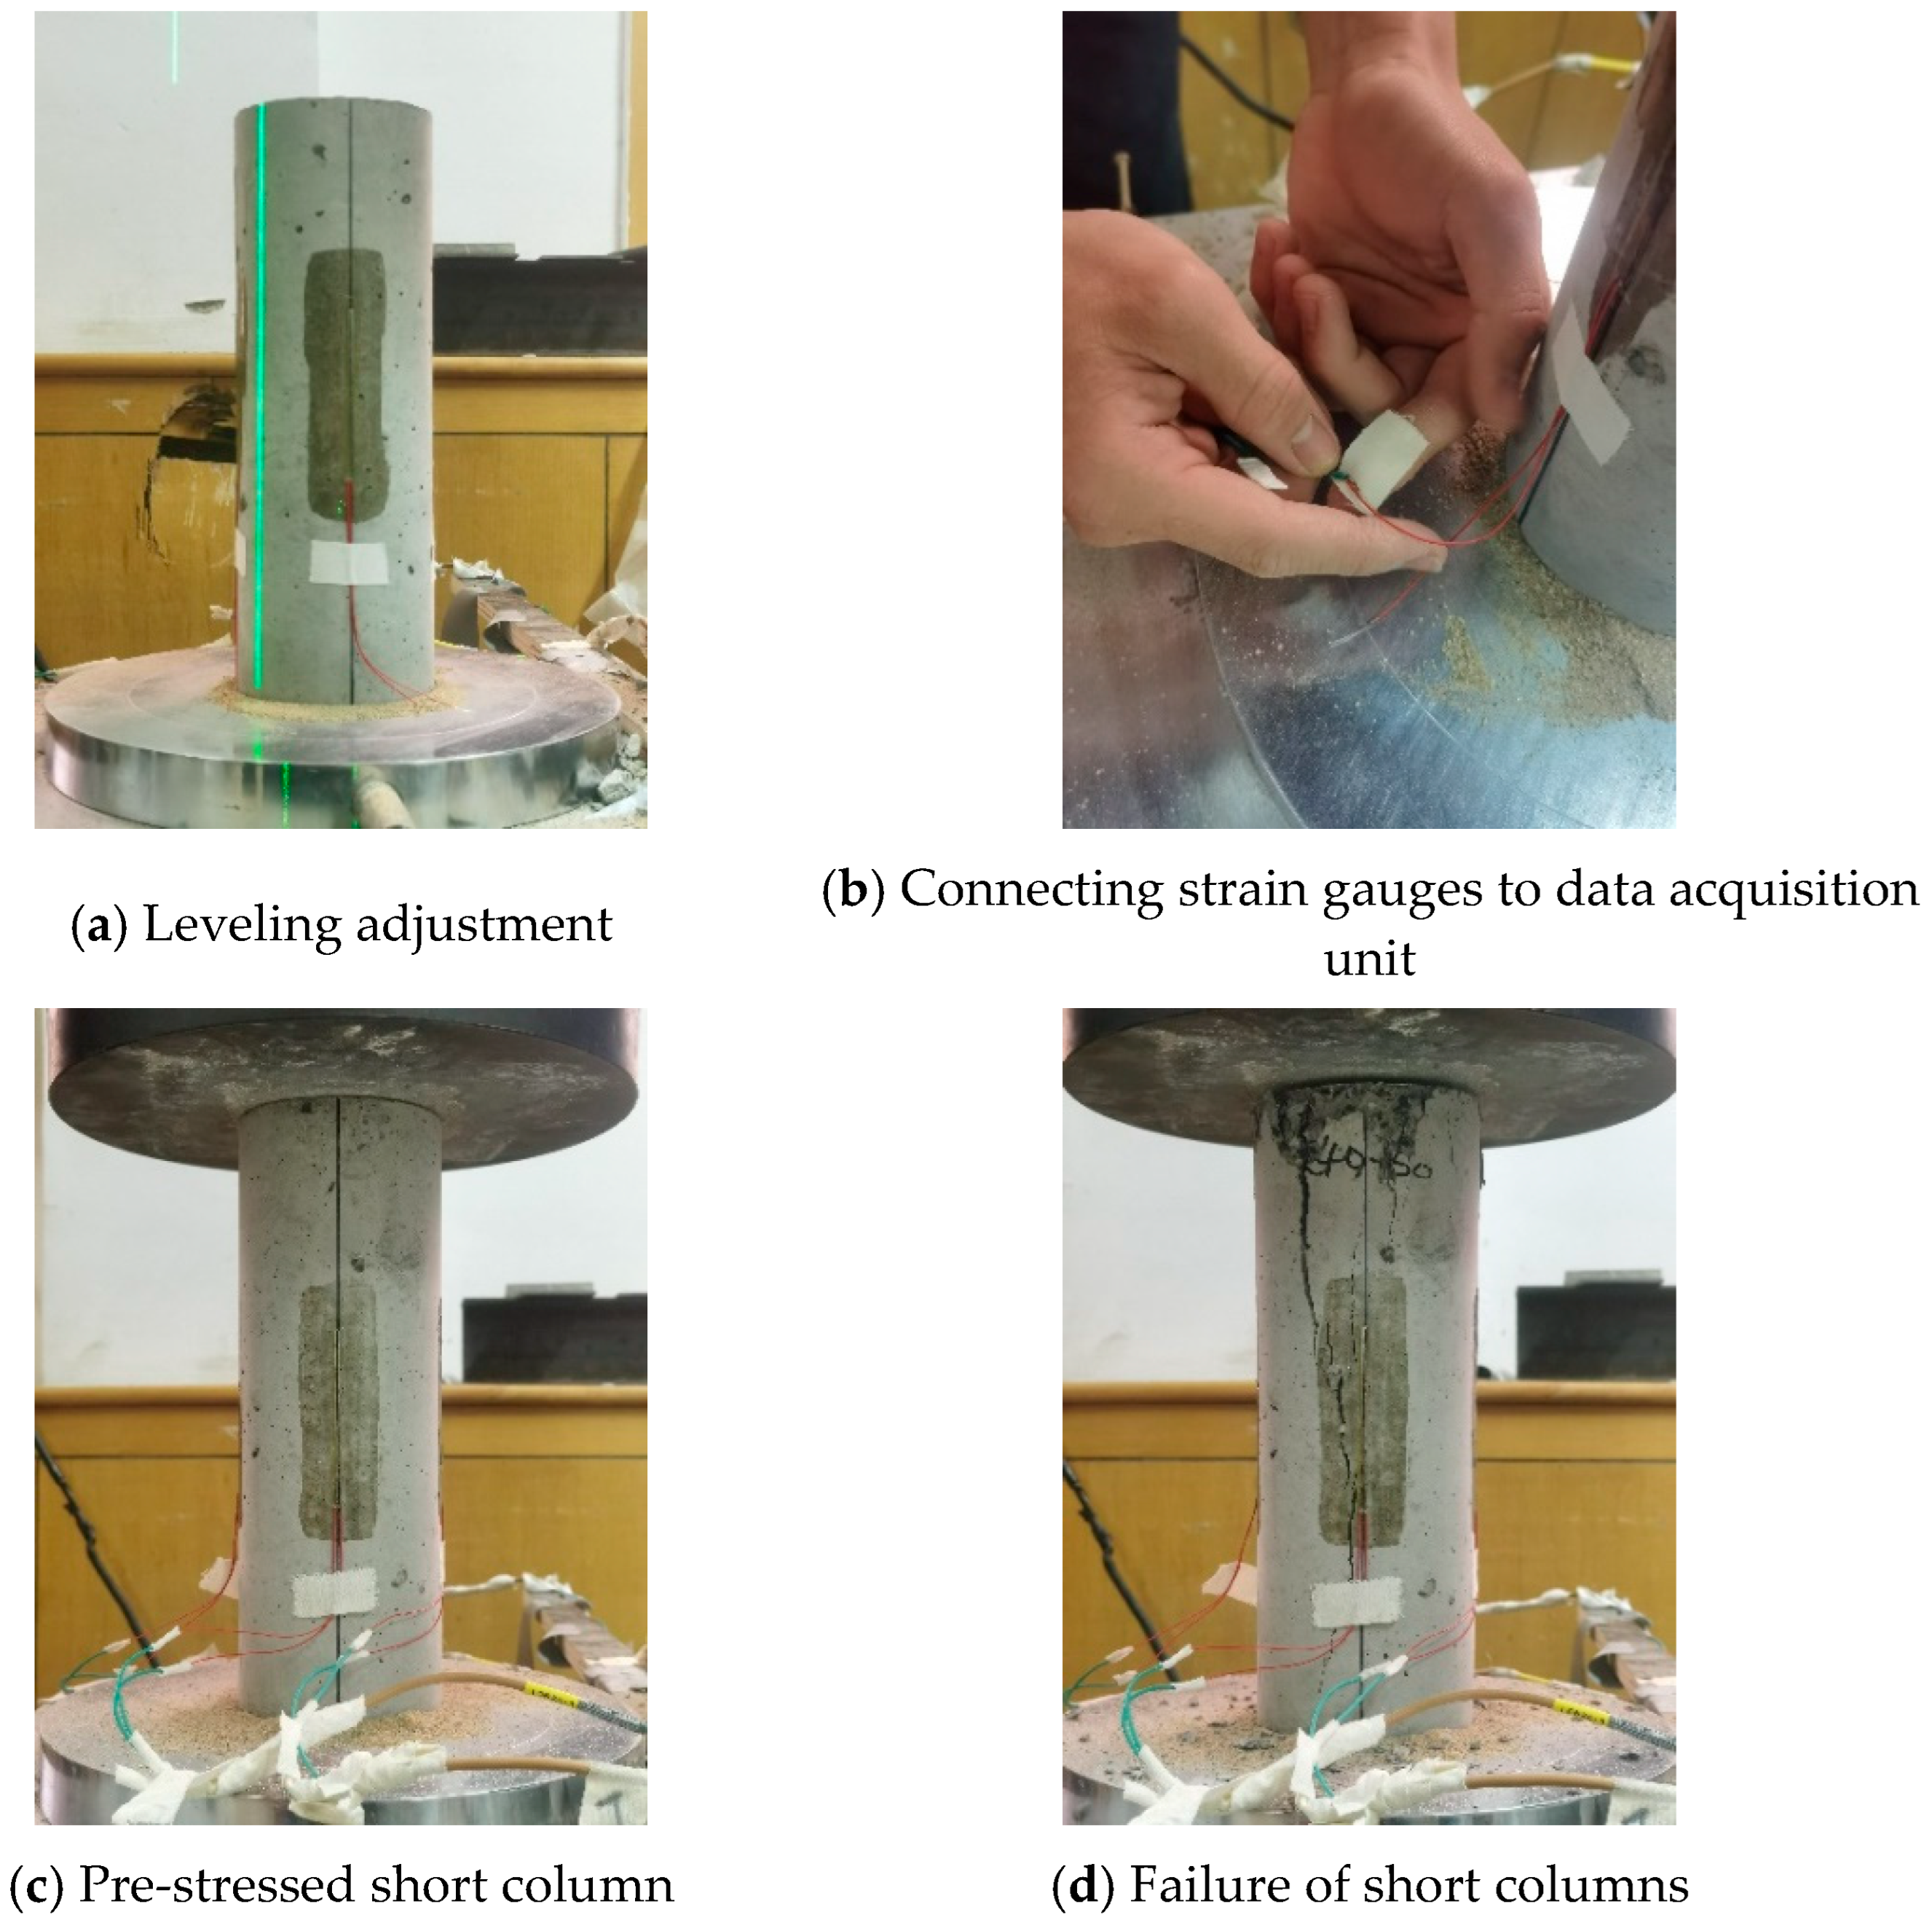
Figure 12 shows a layer of fine sand deposited centrally on the lower bearing pad of the testing machine to facilitate precise leveling of the short column specimen. Once aligned, the strain gauge leads were connected to the data acquisition instrument and fixed in place with adhesive tape. To guarantee axial loading without eccentricity, fine sand was also spread on the specimen’s top surface. The specimen was then subjected to a preload not exceeding 10 kN to verify the stability of the entire setup. Following a successful stability check, the data acquisition system was balanced and zeroed. The formal loading experiment was then initiated, with the testing machine loading the specimen at the predetermined rate while the acquisition system recorded data continuously until failure. All data were recorded post-experiment.
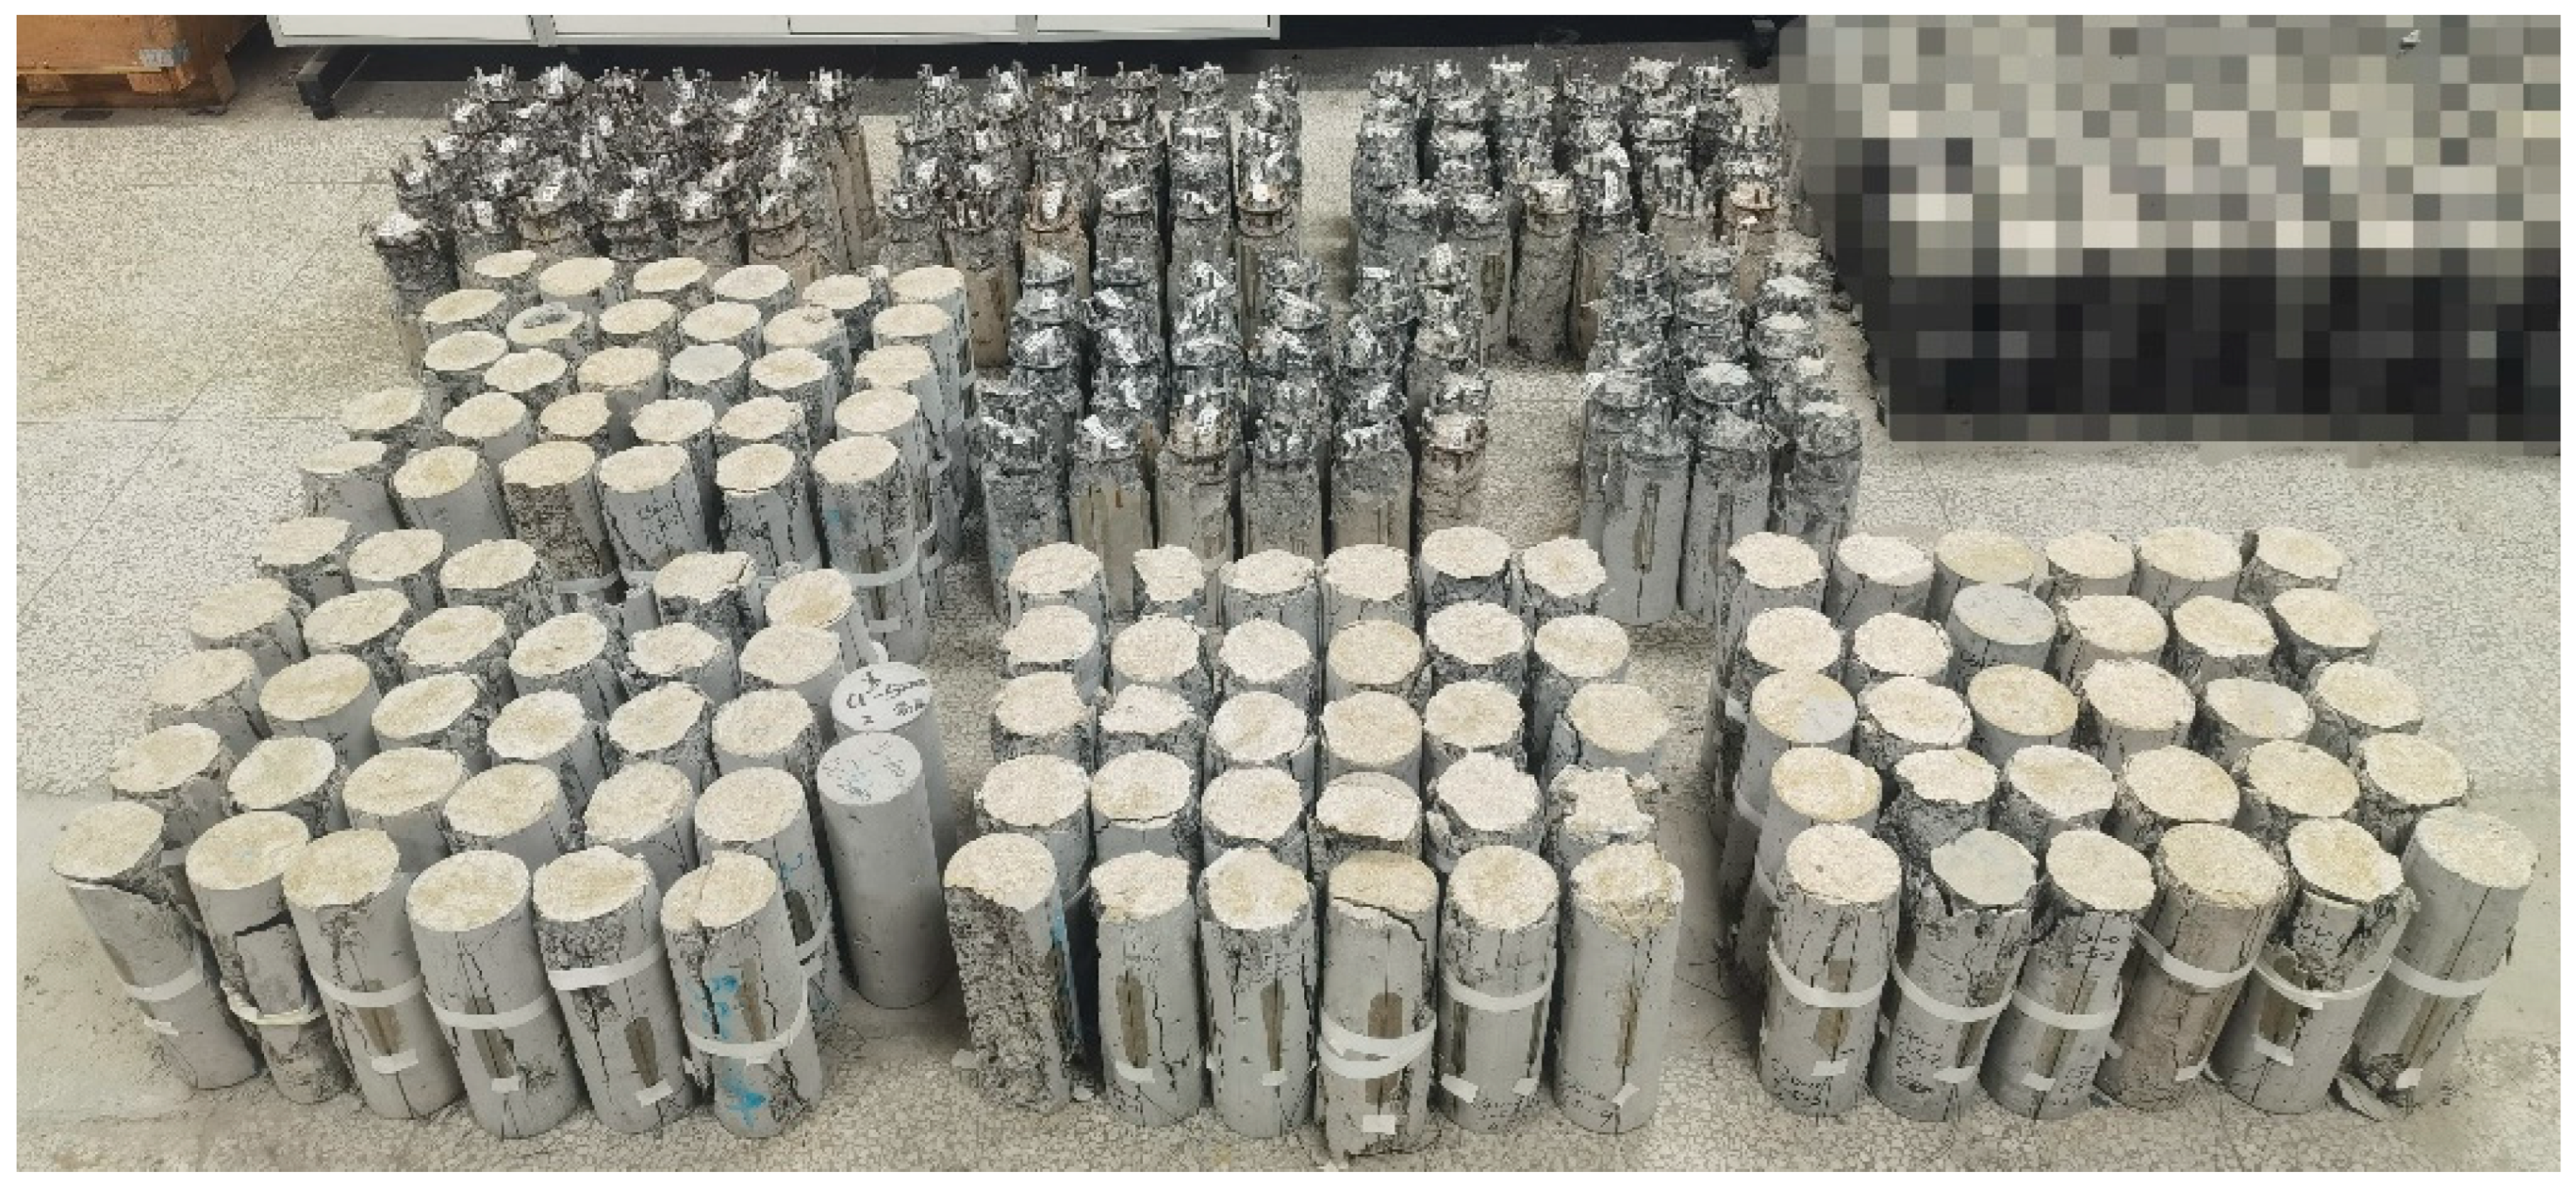
Figure 13 shows the standardized testing methodology used to determine the axial compressive strength of all 50 specimens in this study.
3. Analysis of Experimental Results
Based on a total of 50 axial compression failure tests, a comprehensive investigation of the failure behavior and mechanical properties of MT concrete short columns was conducted. The objectives of this analysis were fourfold: first, the elucidation and summarization of failure modes; second, the processing and statistical collation of experimental data; third, the statistical analysis of ultimate bearing capacity and corresponding displacement, accompanied by an interpretation of the load–displacement relationships; and fourth, an examination of the effects of concrete strength grade, tailings replacement ratio, and environmental conditioning on the ultimate bearing capacity, following the principle of controlling single variables.
3.1. Failure Modes
Figure 14 displays flocculent precipitates, providing direct visual evidence of the specimens’ surface after chloride salt erosion. The mass variation was highly sensitive to the tailings content, with higher replacement ratios leading to greater mass increases. This effect is attributed to the finer particle size of MT, which enhances their water retention capacity during the wet phase of the cycle. The rate of mass change was largely independent of the concrete’s design strength grade.
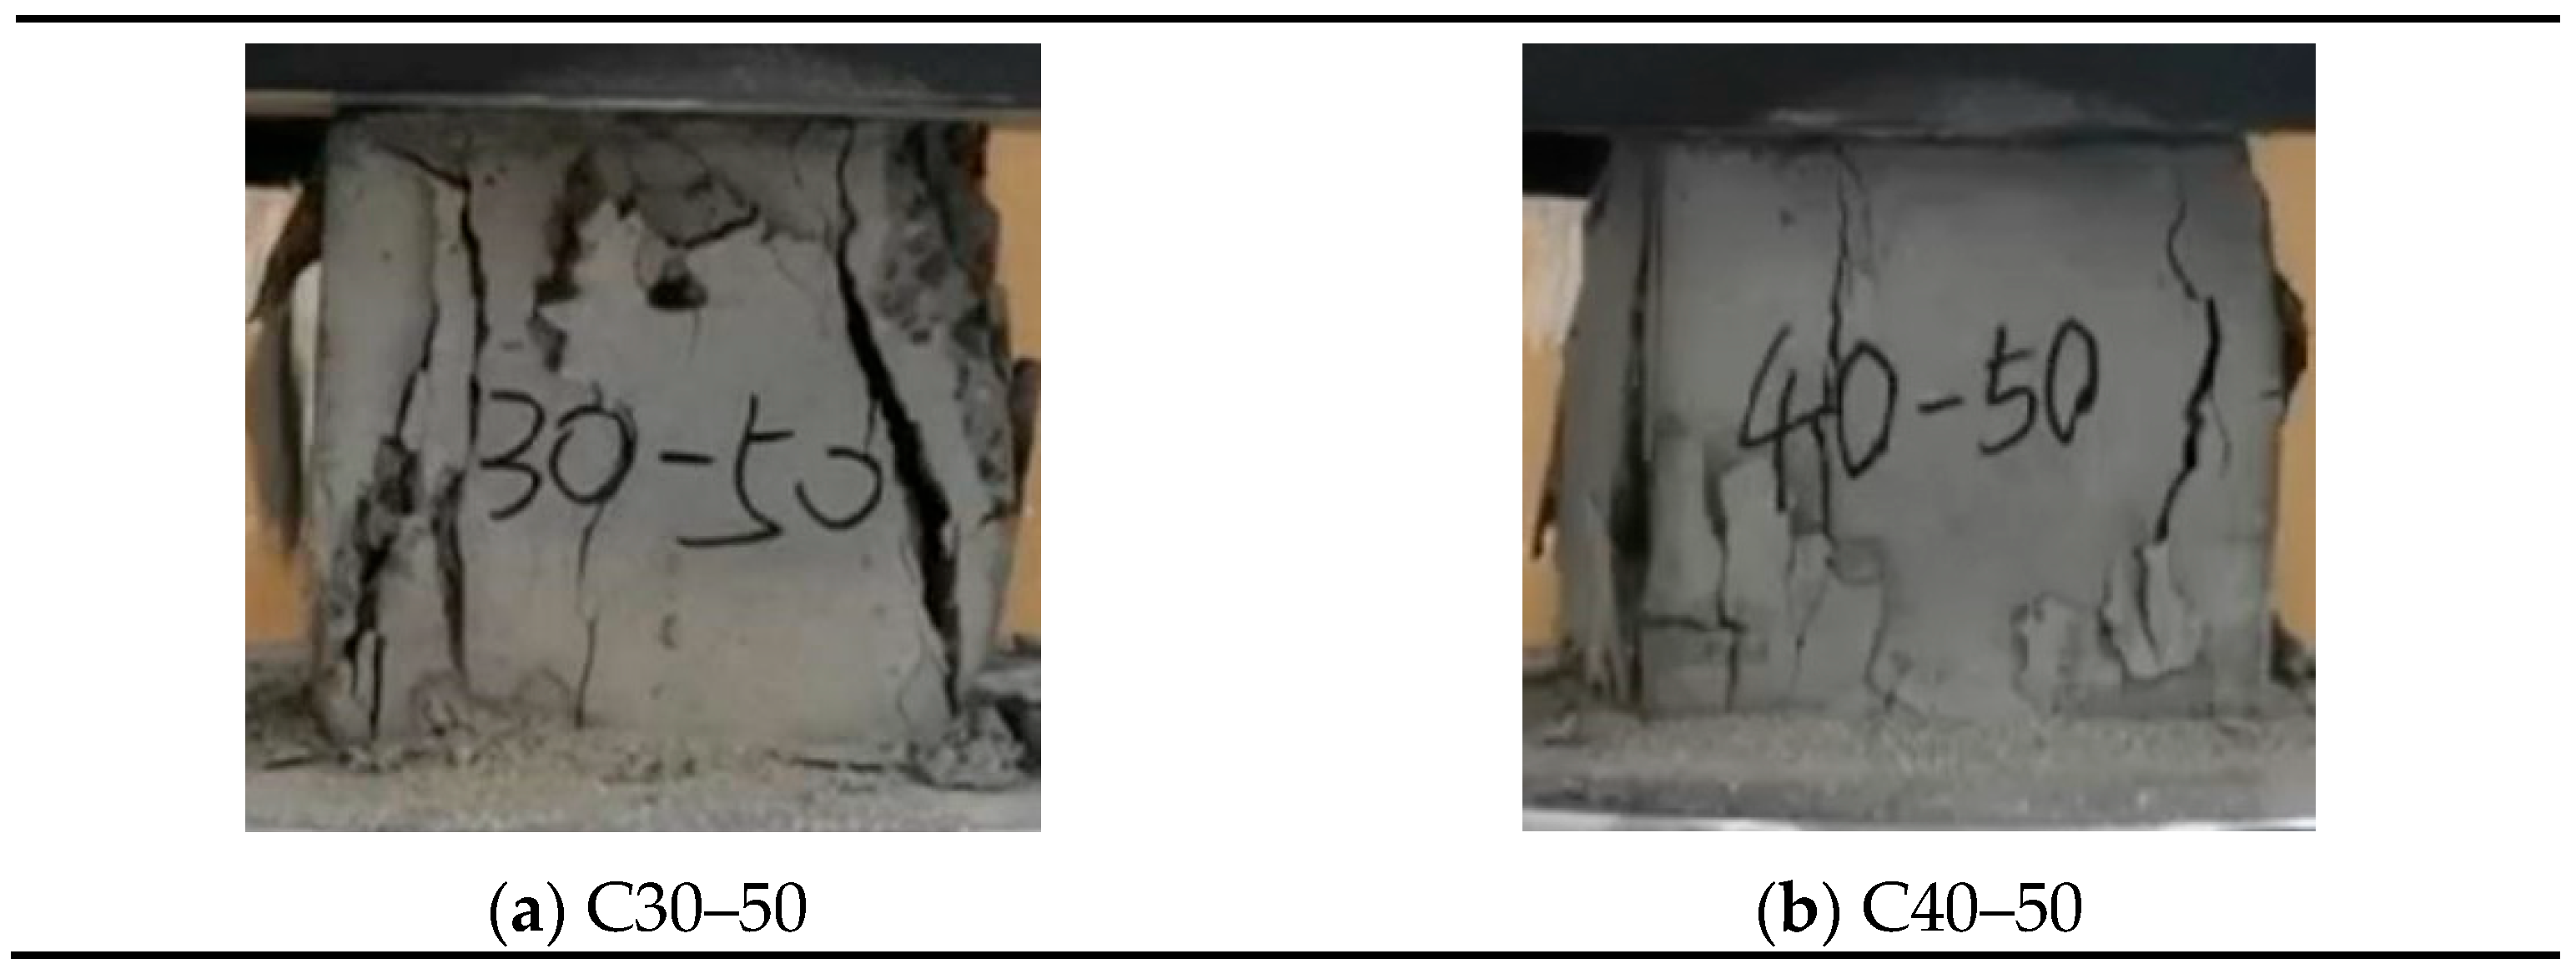
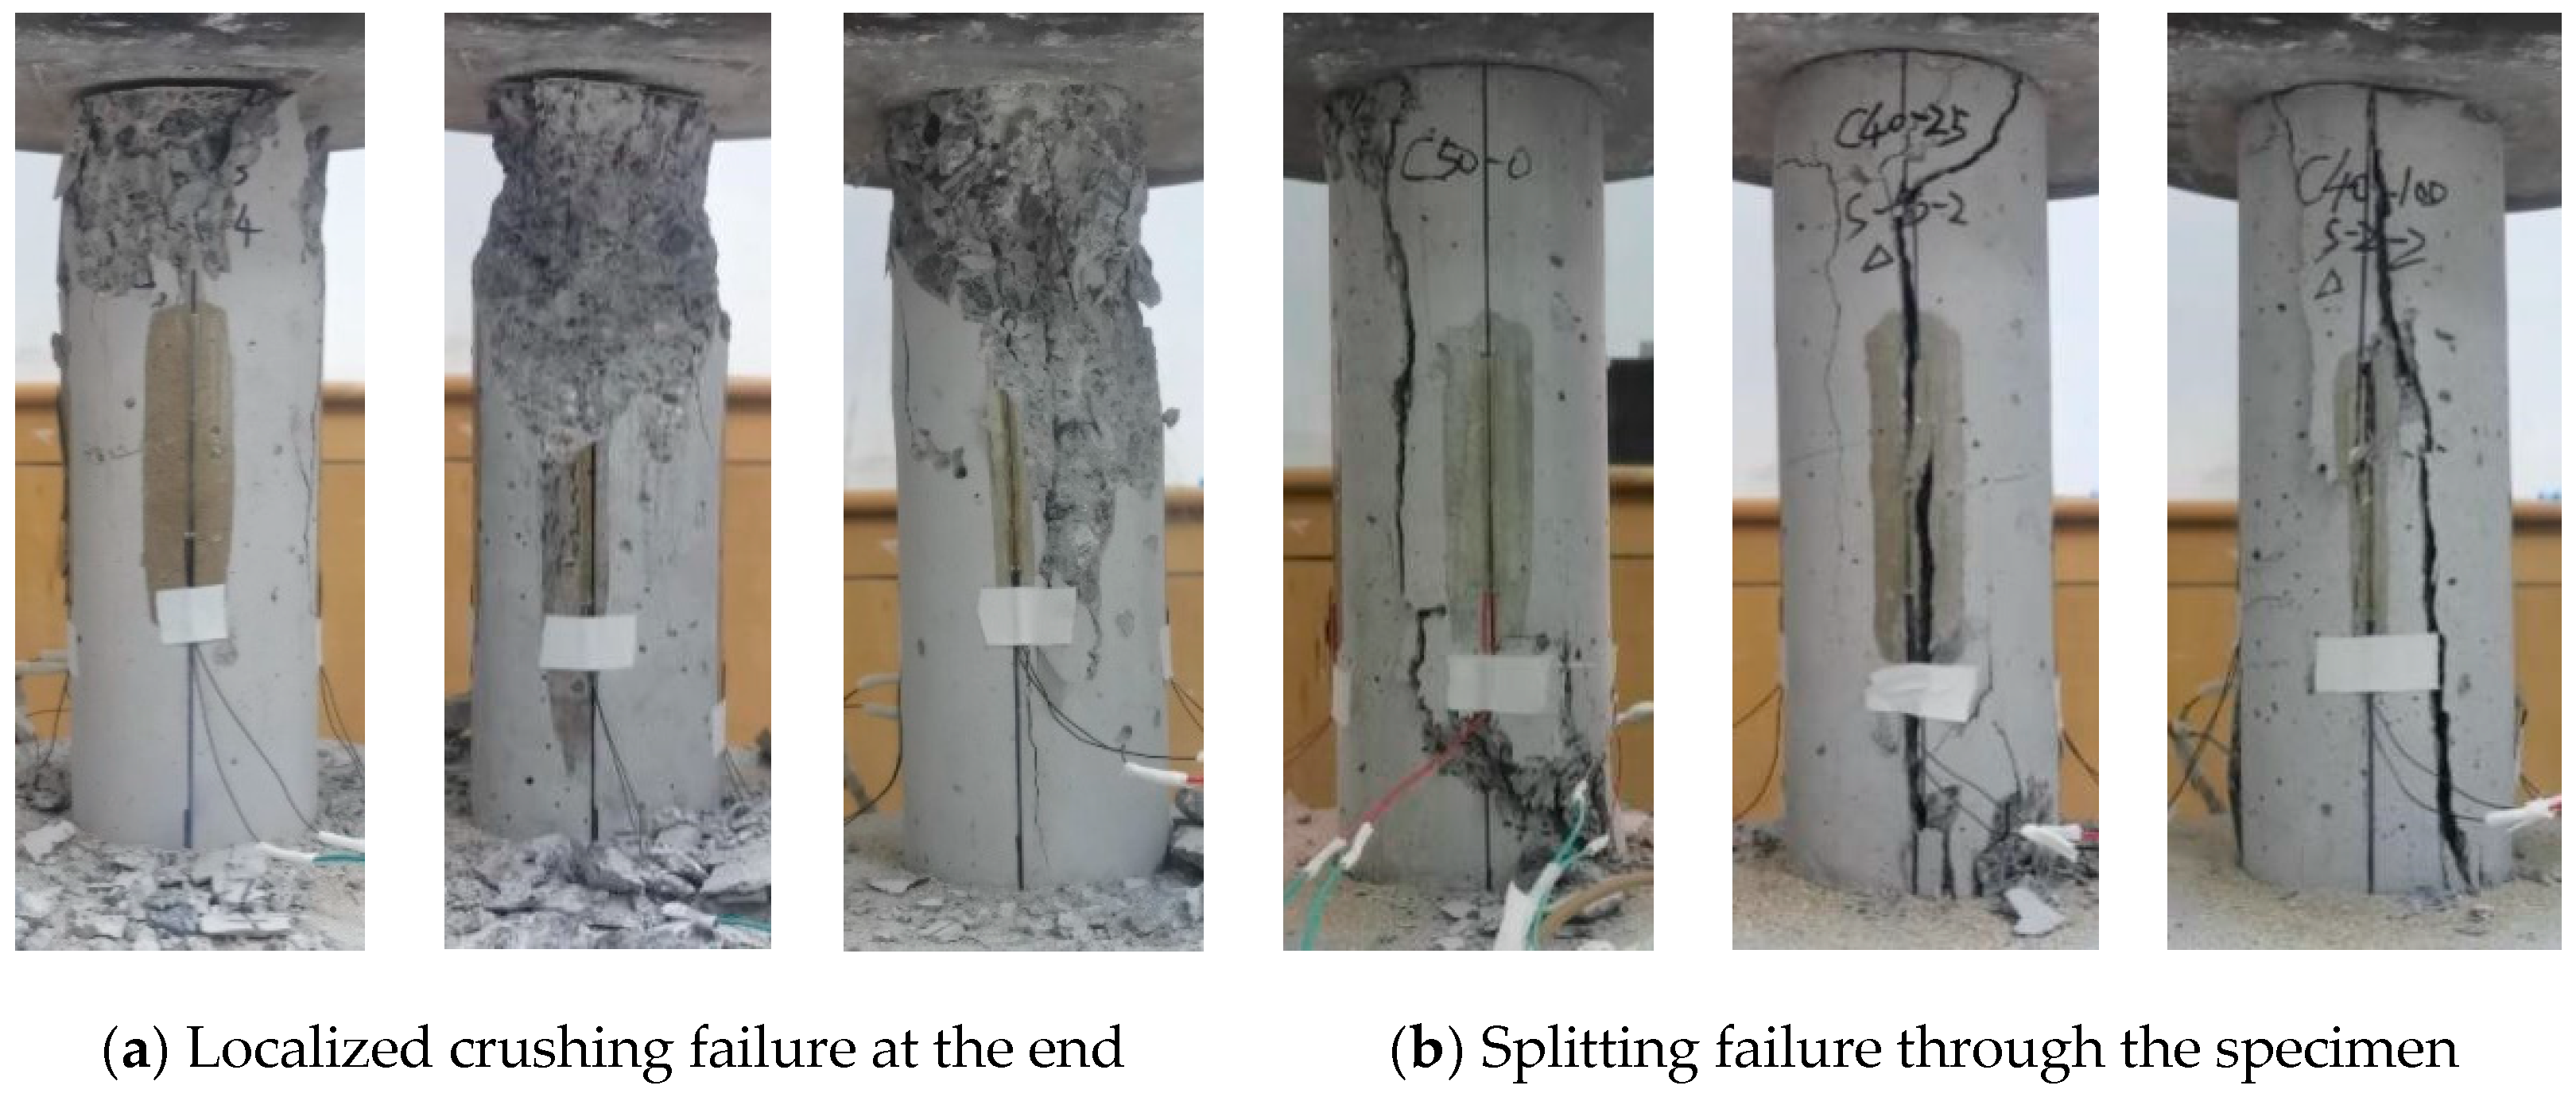
Figure 15 illustrates the loading-to-failure process, from which key parameters including the ultimate bearing capacity were derived. The failure phenomena observed during the axial compression experiments were recorded, enabling the classification of failure modes. It was found that immersion in the salt solution had a negligible effect on the failure modes. Two distinct failure patterns were identified: Type I involved local crushing at the column end, exhibiting an inverted conical fracture; Type II was characterized by overall splitting failure, featuring a predominant penetrating crack along the specimen.
The failure mechanism observed in the short columns was predominantly brittle, aligning with the failure characteristics of conventional concrete under axial compression. The failure progression unfolded in three sequential stages: the initial elastic phase under low load revealed no visible surface alterations; the stable crack propagation phase, where increased loading induced faint auditory cues and the emergence of microcracks; and the unstable failure phase, where upon attaining the peak load, rapid crack interconnection prompted abrupt failure, evidenced by concrete spalling or major crack opening.
A notable difference in crack evolution was observed between groups. Crack development was slower initially but accelerated sharply during loading at ambient temperature. Conversely, specimens subjected to 400 °C exhibited slower post-initiation crack growth. This divergence in behavior is likely due to the thermal-induced degradation of the internal microstructure, which reduces the material’s integrity and consequently slows crack propagation. Post-failure sampling for microanalysis was conducted as per the specimen matrix in
Table 8.
3.2. Investigation of Sample Microstructure
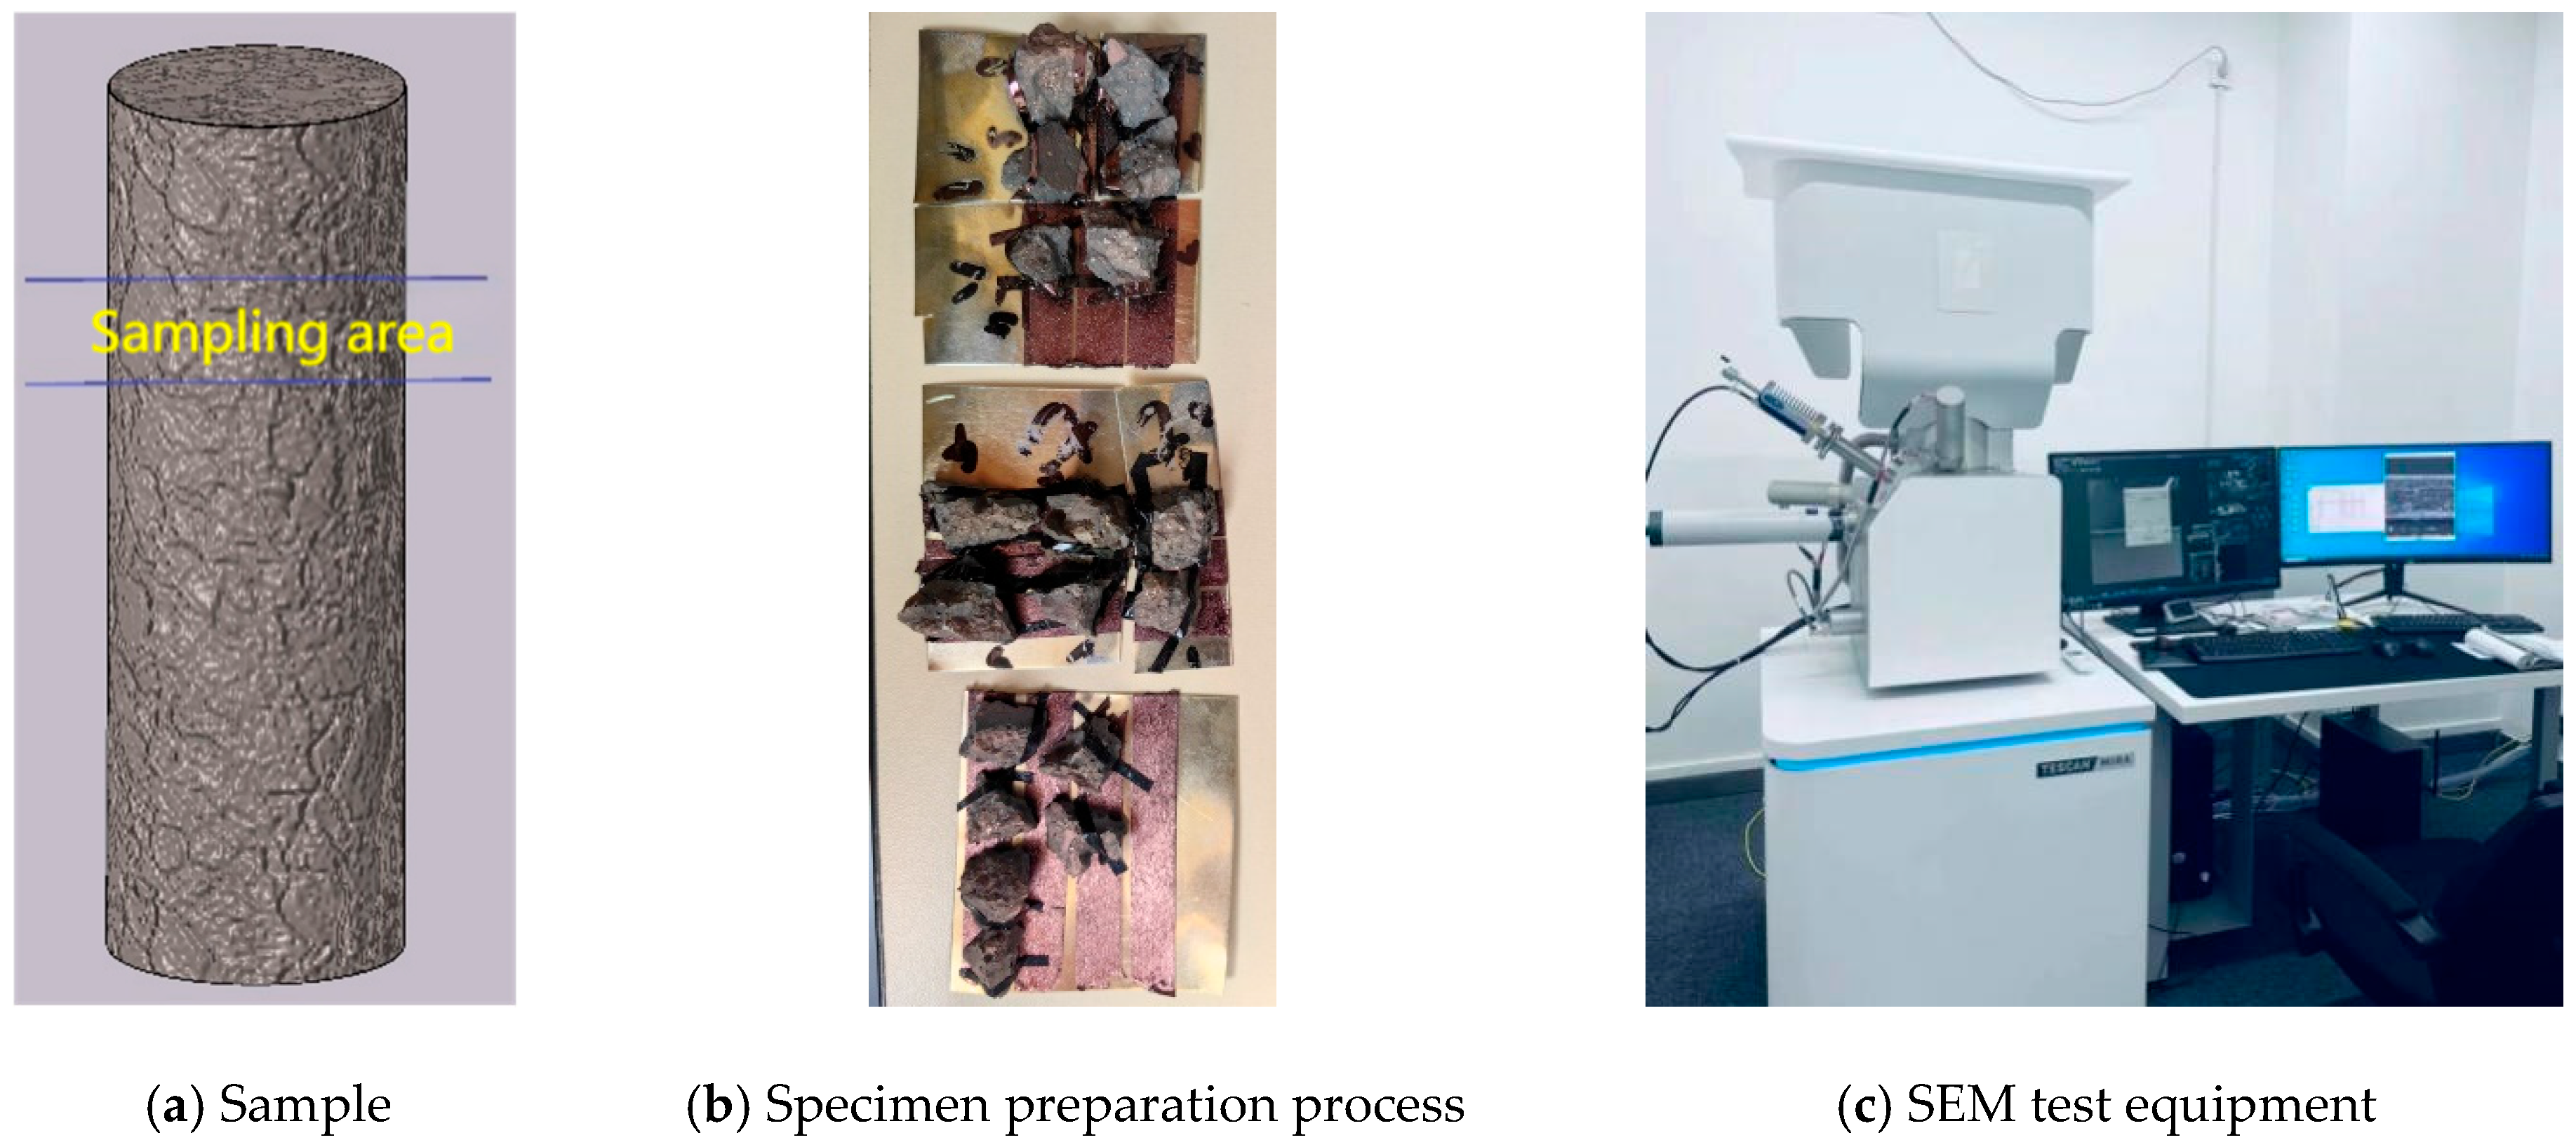
Figure 16 indicates the designated sampling area, which was within 70–100 mm from the end of the specimen and adjacent to its surface. The procured samples were sized and gold-coated for analysis. The micro structural examination was carried out using a field emission scanning electron microscope (conforming to the standard [
40]) equipped, aimed primarily at characterizing hydration products, porosity, crack morphology, and aggregate distribution.
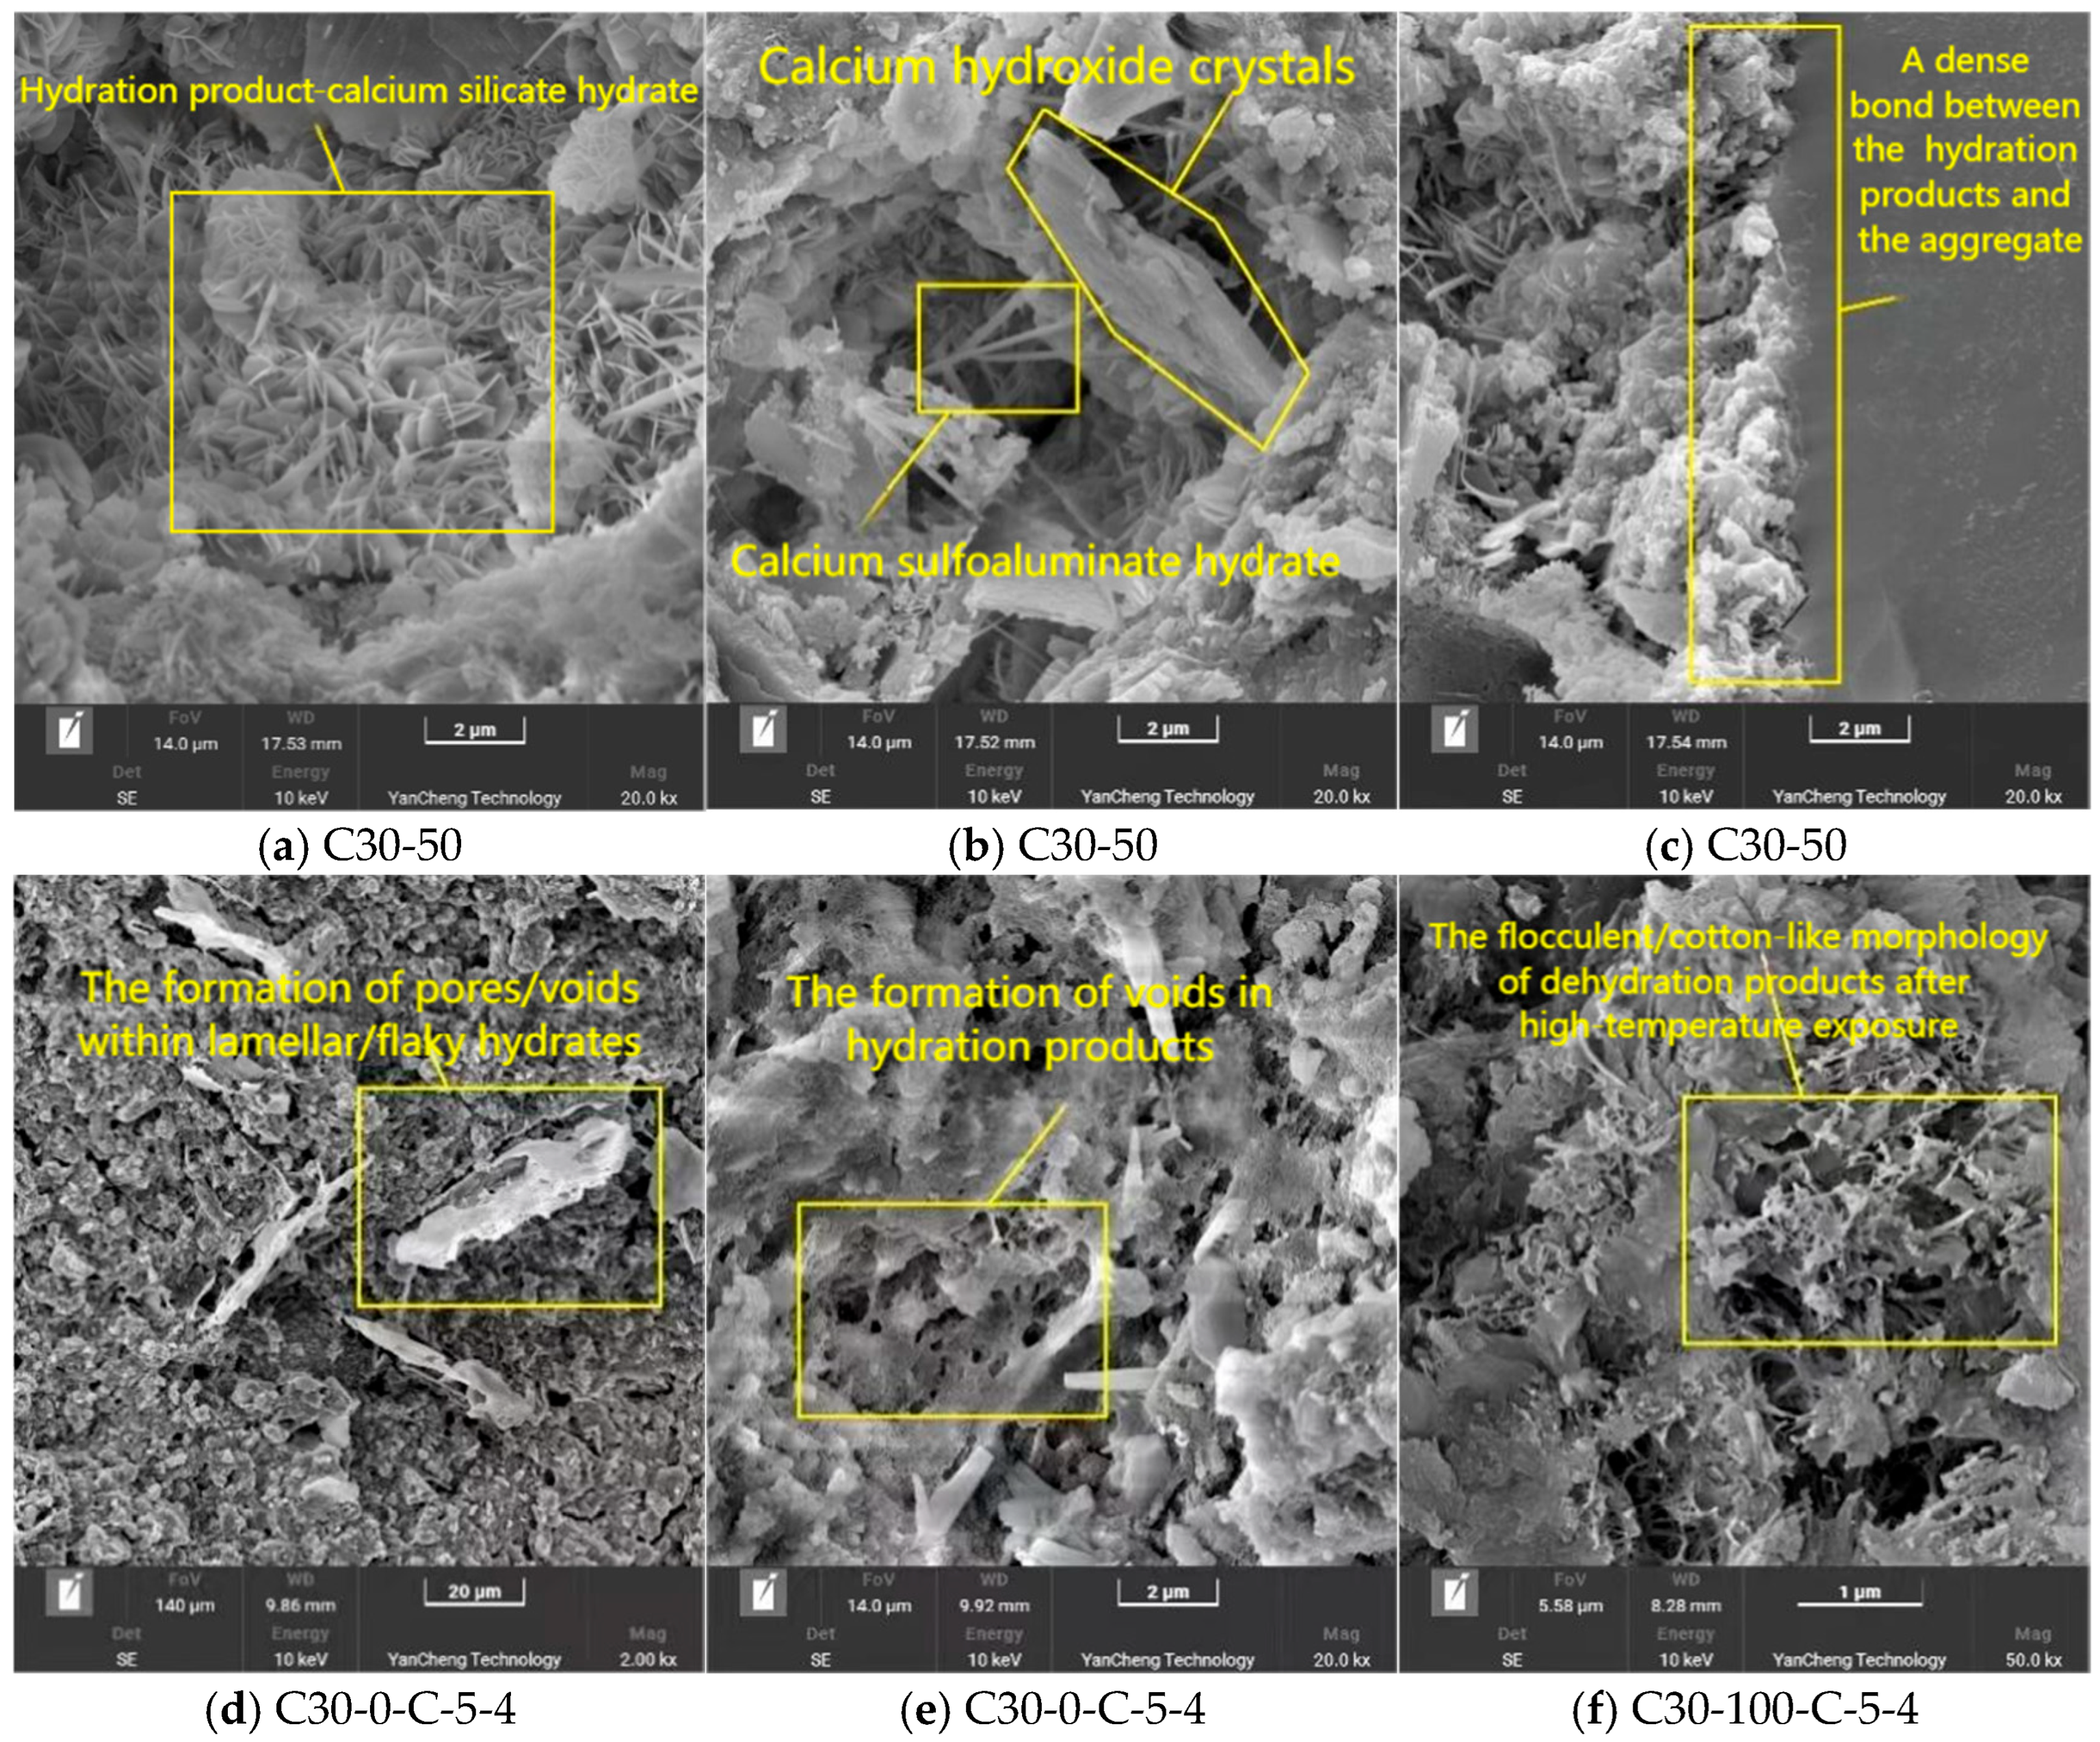
Figure 17 reveals the microstructure of the C30-50 specimen, displaying prominent dense, petal-like C-S-H alongside minor needle-like ettringite and hexagonal portlandite. A coherent interface, largely free of defects, signified a well-hydrated matrix. Subsequent to exposure to 400 °C, the microstructure underwent significant degradation, characterized by extensive microcracking and pore formation. The deterioration mechanism is attributed to the temperature-induced evaporation of free and bound water, which generates internal vapor pressure and leaves voids. Decomposition of the C-S-H gel led to increased porosity and a loss of crystallinity, transforming the needle-like hydrates into shriveled, flocculent structures. The development of these microdefects substantially compromised the integrity of the specimens, leading to the observed reduction in load-bearing capacity.
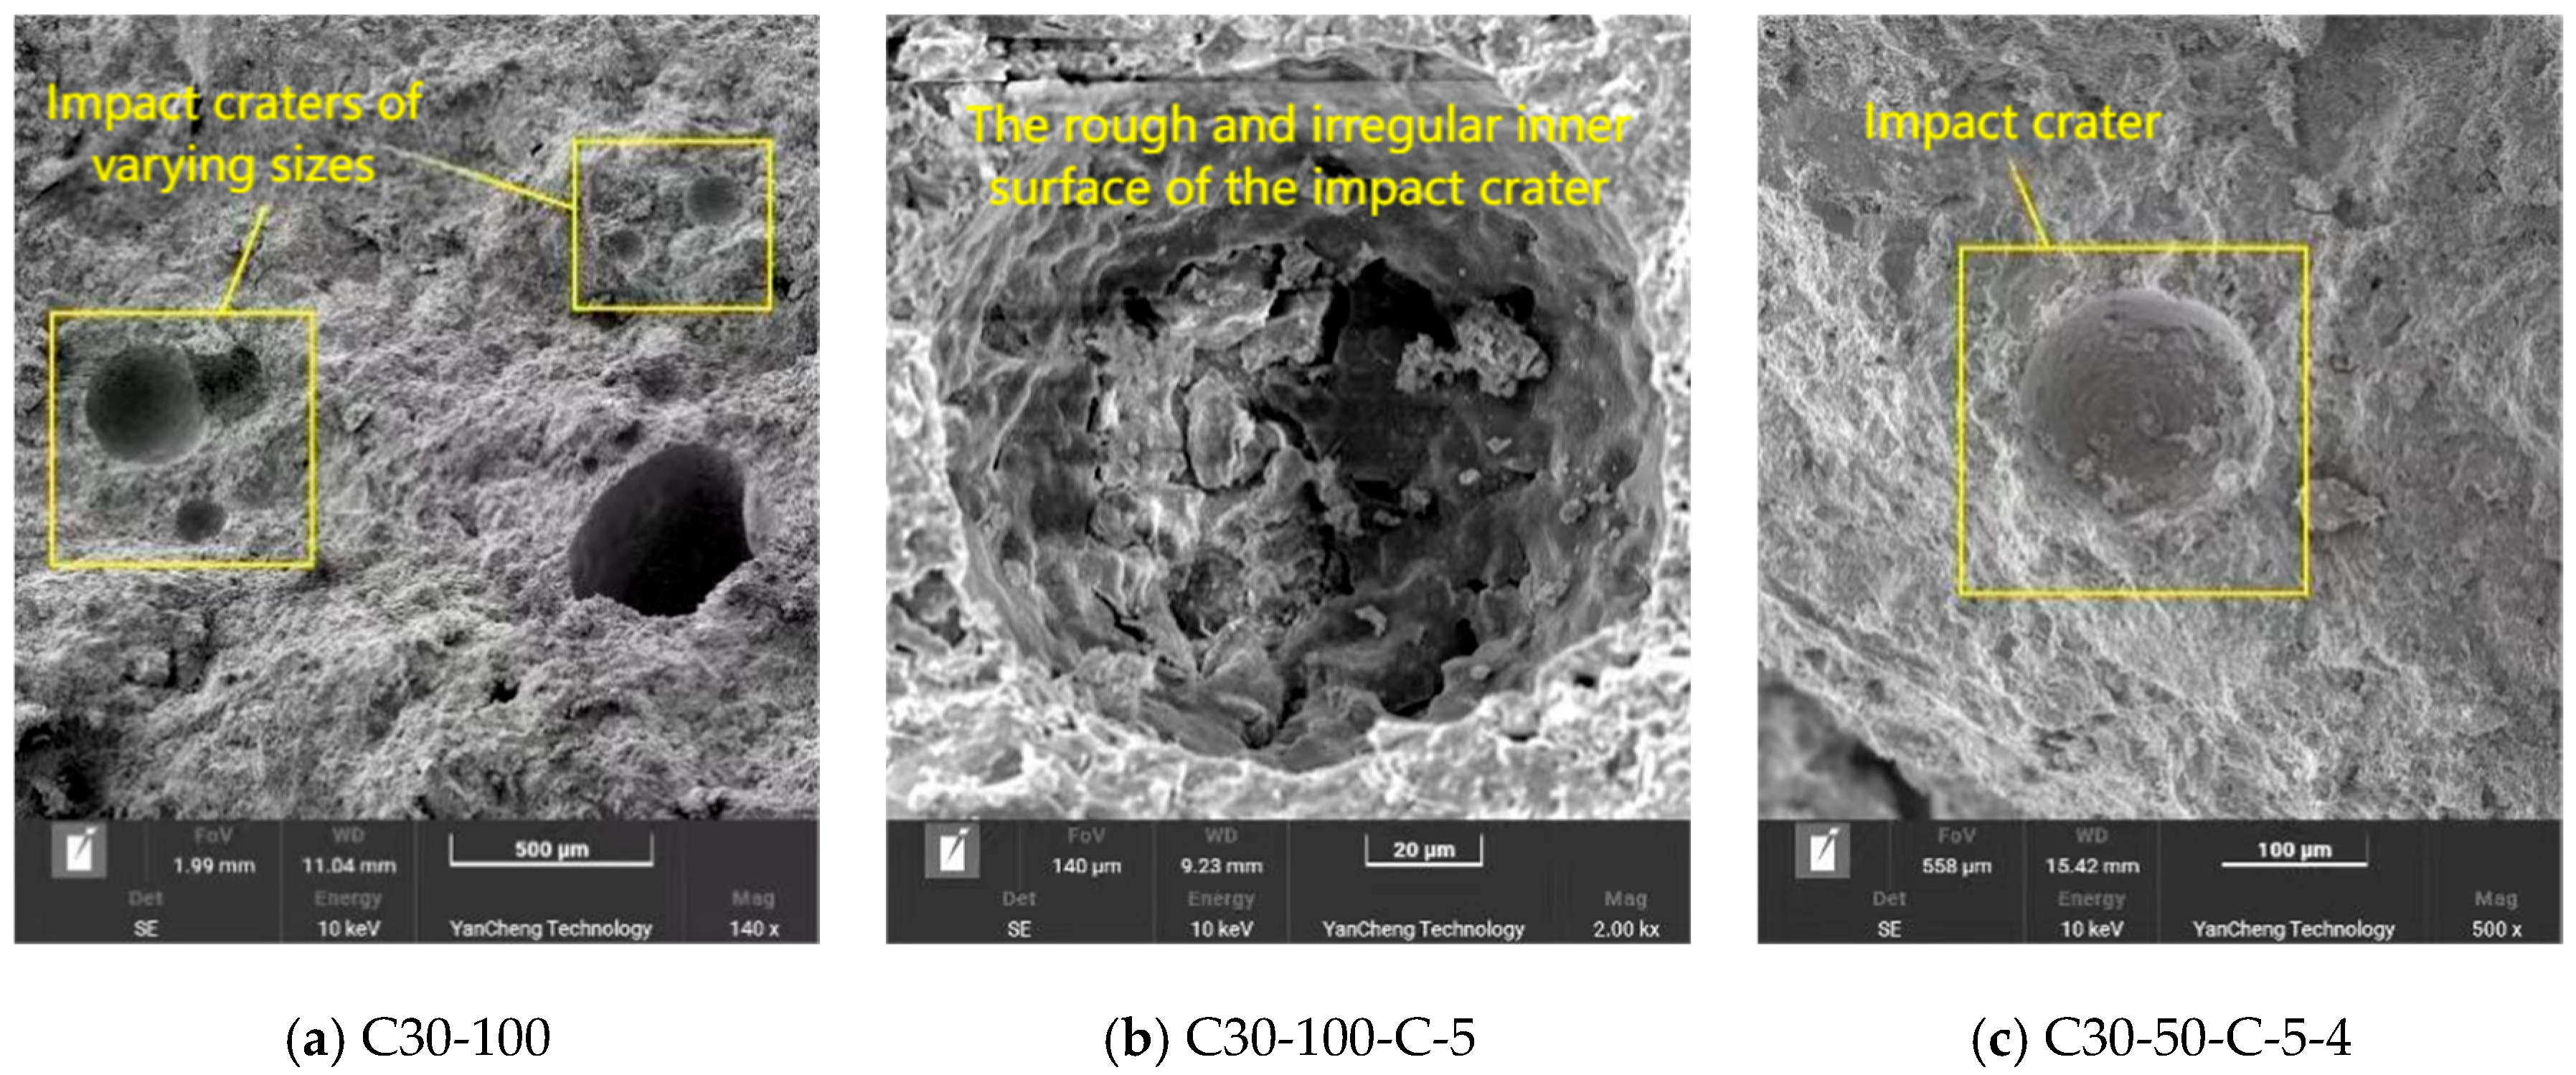
Figure 18 reveals morphological evidence from microscopic examination, indicating that the MT particles possess a spherical geometry. The detachment of these particles results in the formation of distinct, crater-shaped pits. The rough surface topography of these pits suggests the presence of hydration product coatings on the particles, attesting to a strong interfacial bond. After thermal exposure at 400 °C, significant microcracks are evident within these pits, which is a key microstructural deterioration mechanism that adversely affects the macroscopic mechanical properties of the concrete.
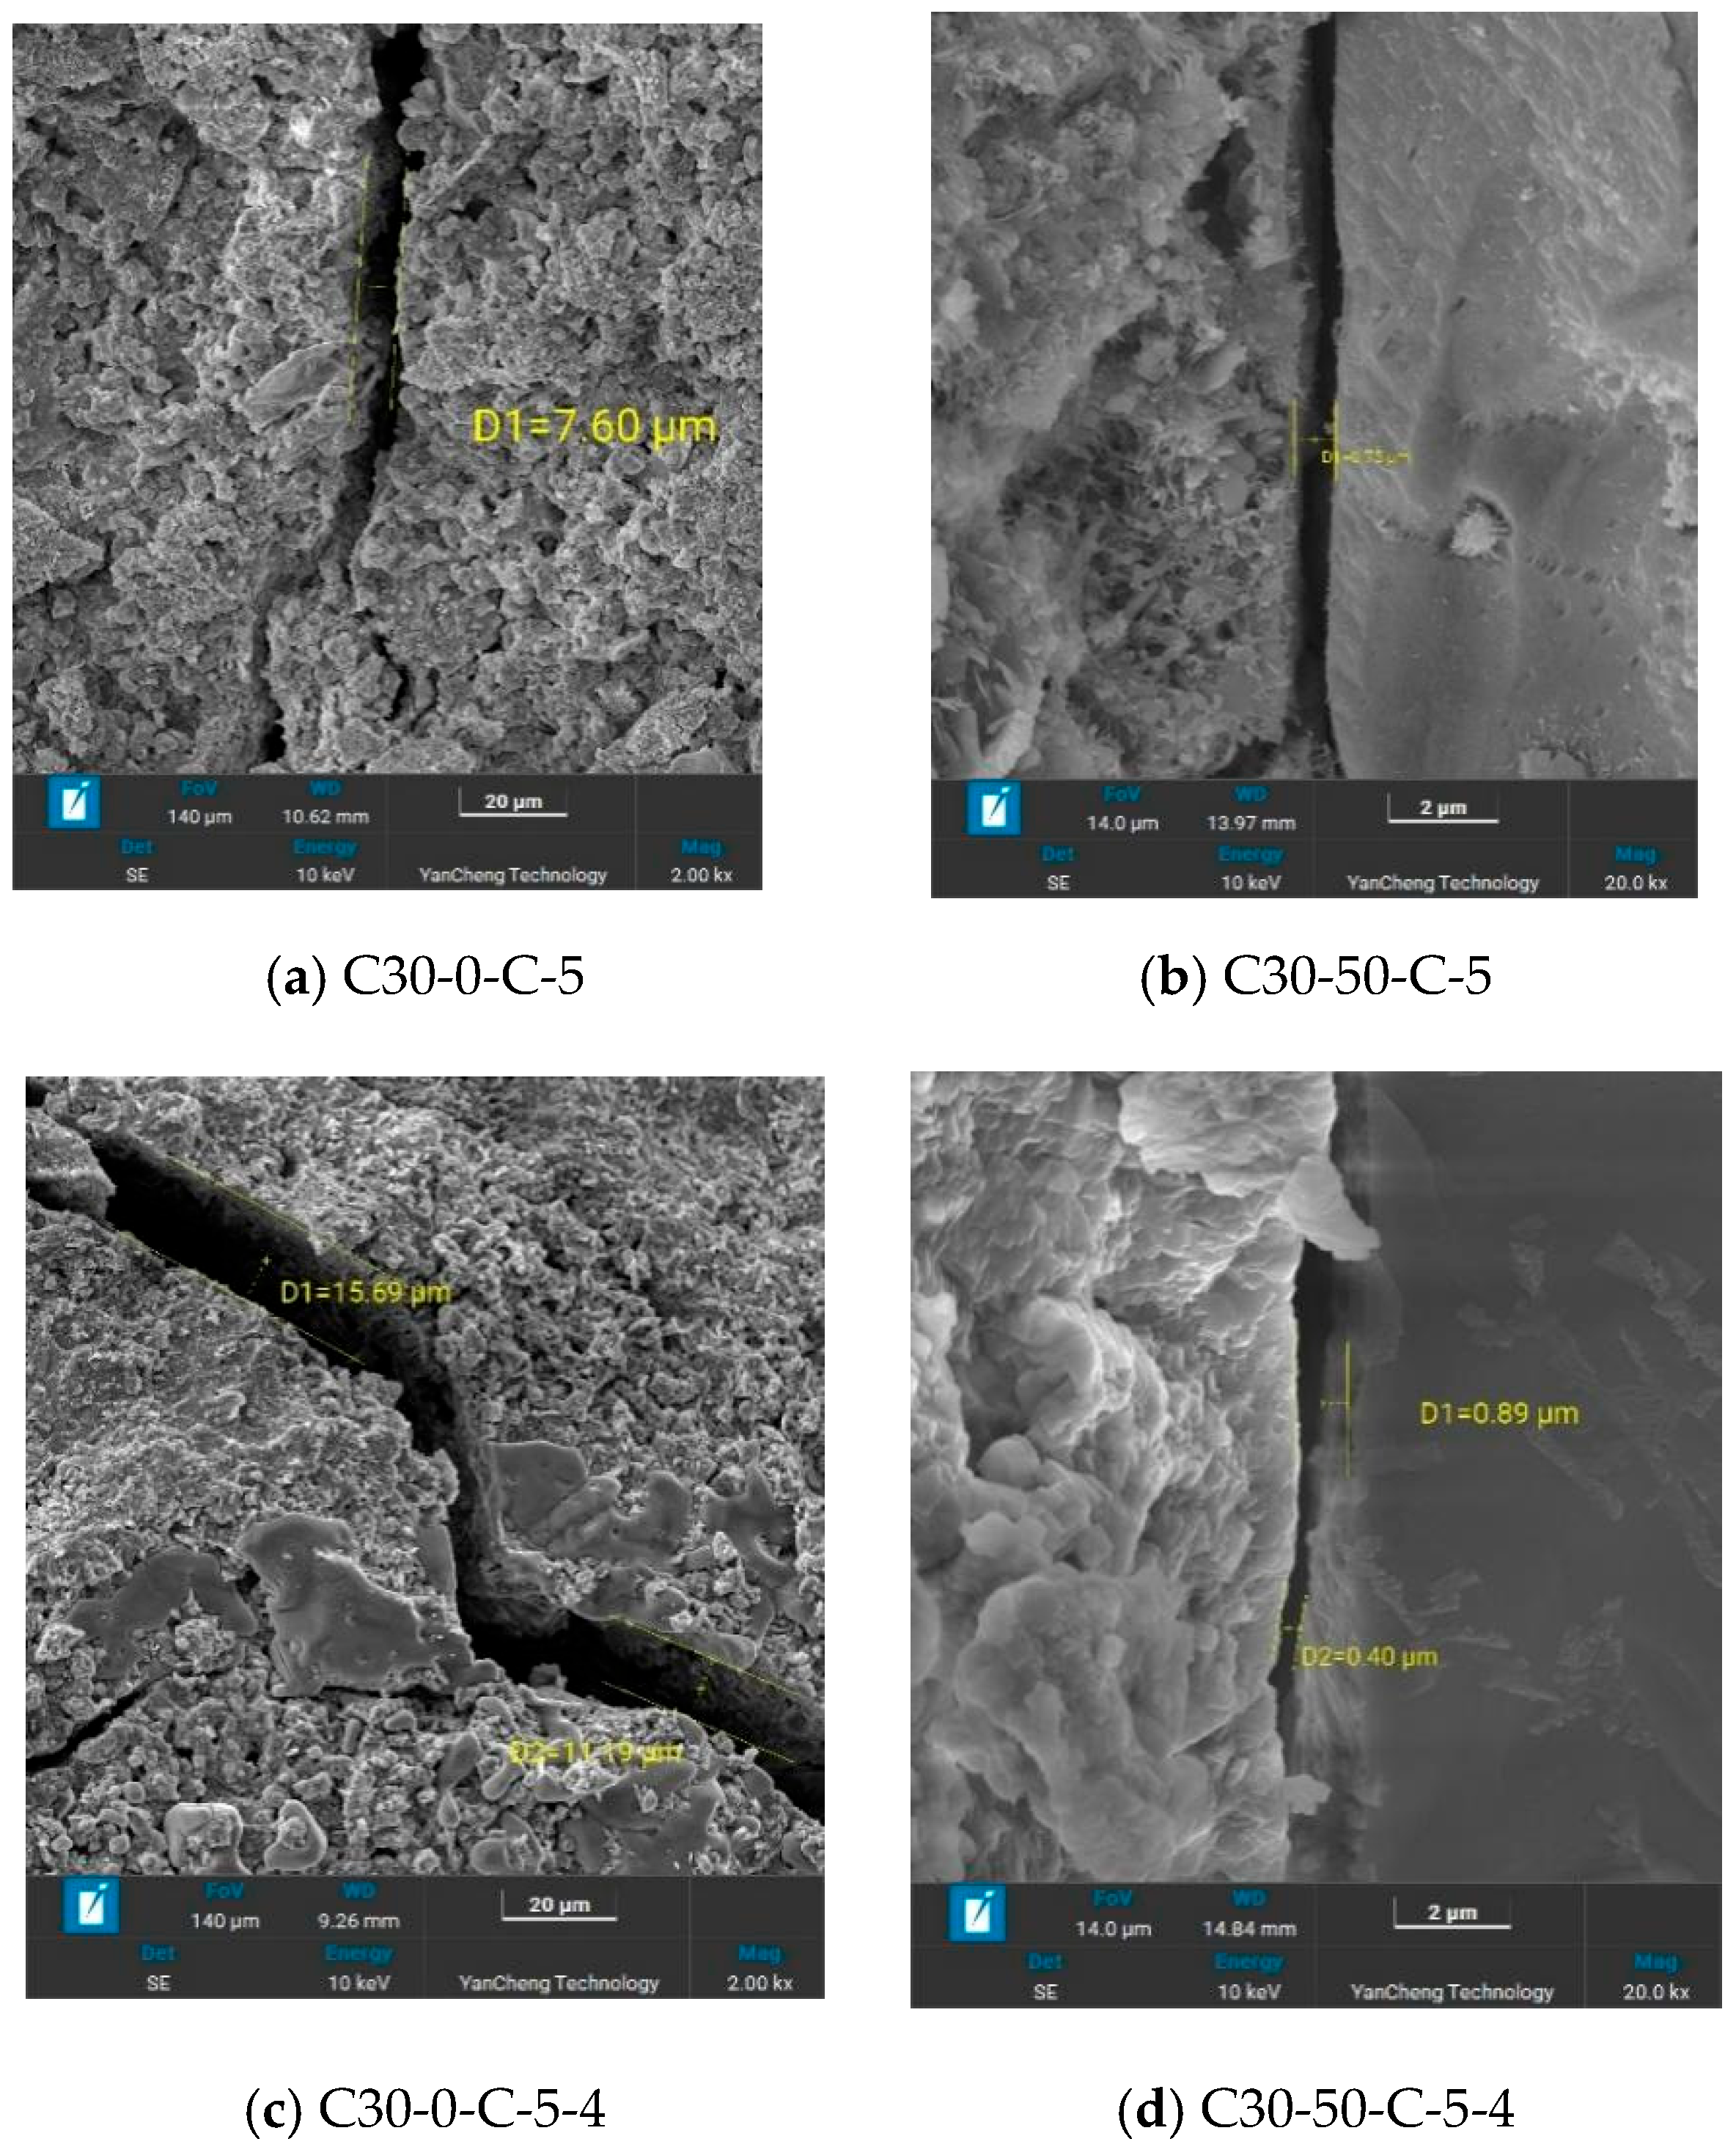
Figure 19 reveals that microcracks in concrete after coupled chloride erosion and 400 °C high-temperature exposure mainly propagate through aggregates, the interfacial transition zone (ITZ), and the hydration product matrix. Dehydration shrinkage caused by 400 °C exposure and the resulting thermal stresses further drive microcrack extension. Quantitative analysis based on the SEM images shows that the crack width of plain concrete (0% MT) reaches 7.60–15.69 μm, while specimens with 50% MT have significantly narrower cracks of only 0.40–0.89 μm. This improvement is attributable to the micro-skeleton and micro-aggregate filling effect of MT particles, which effectively enhances the matrix’s resistance to thermal cracking.
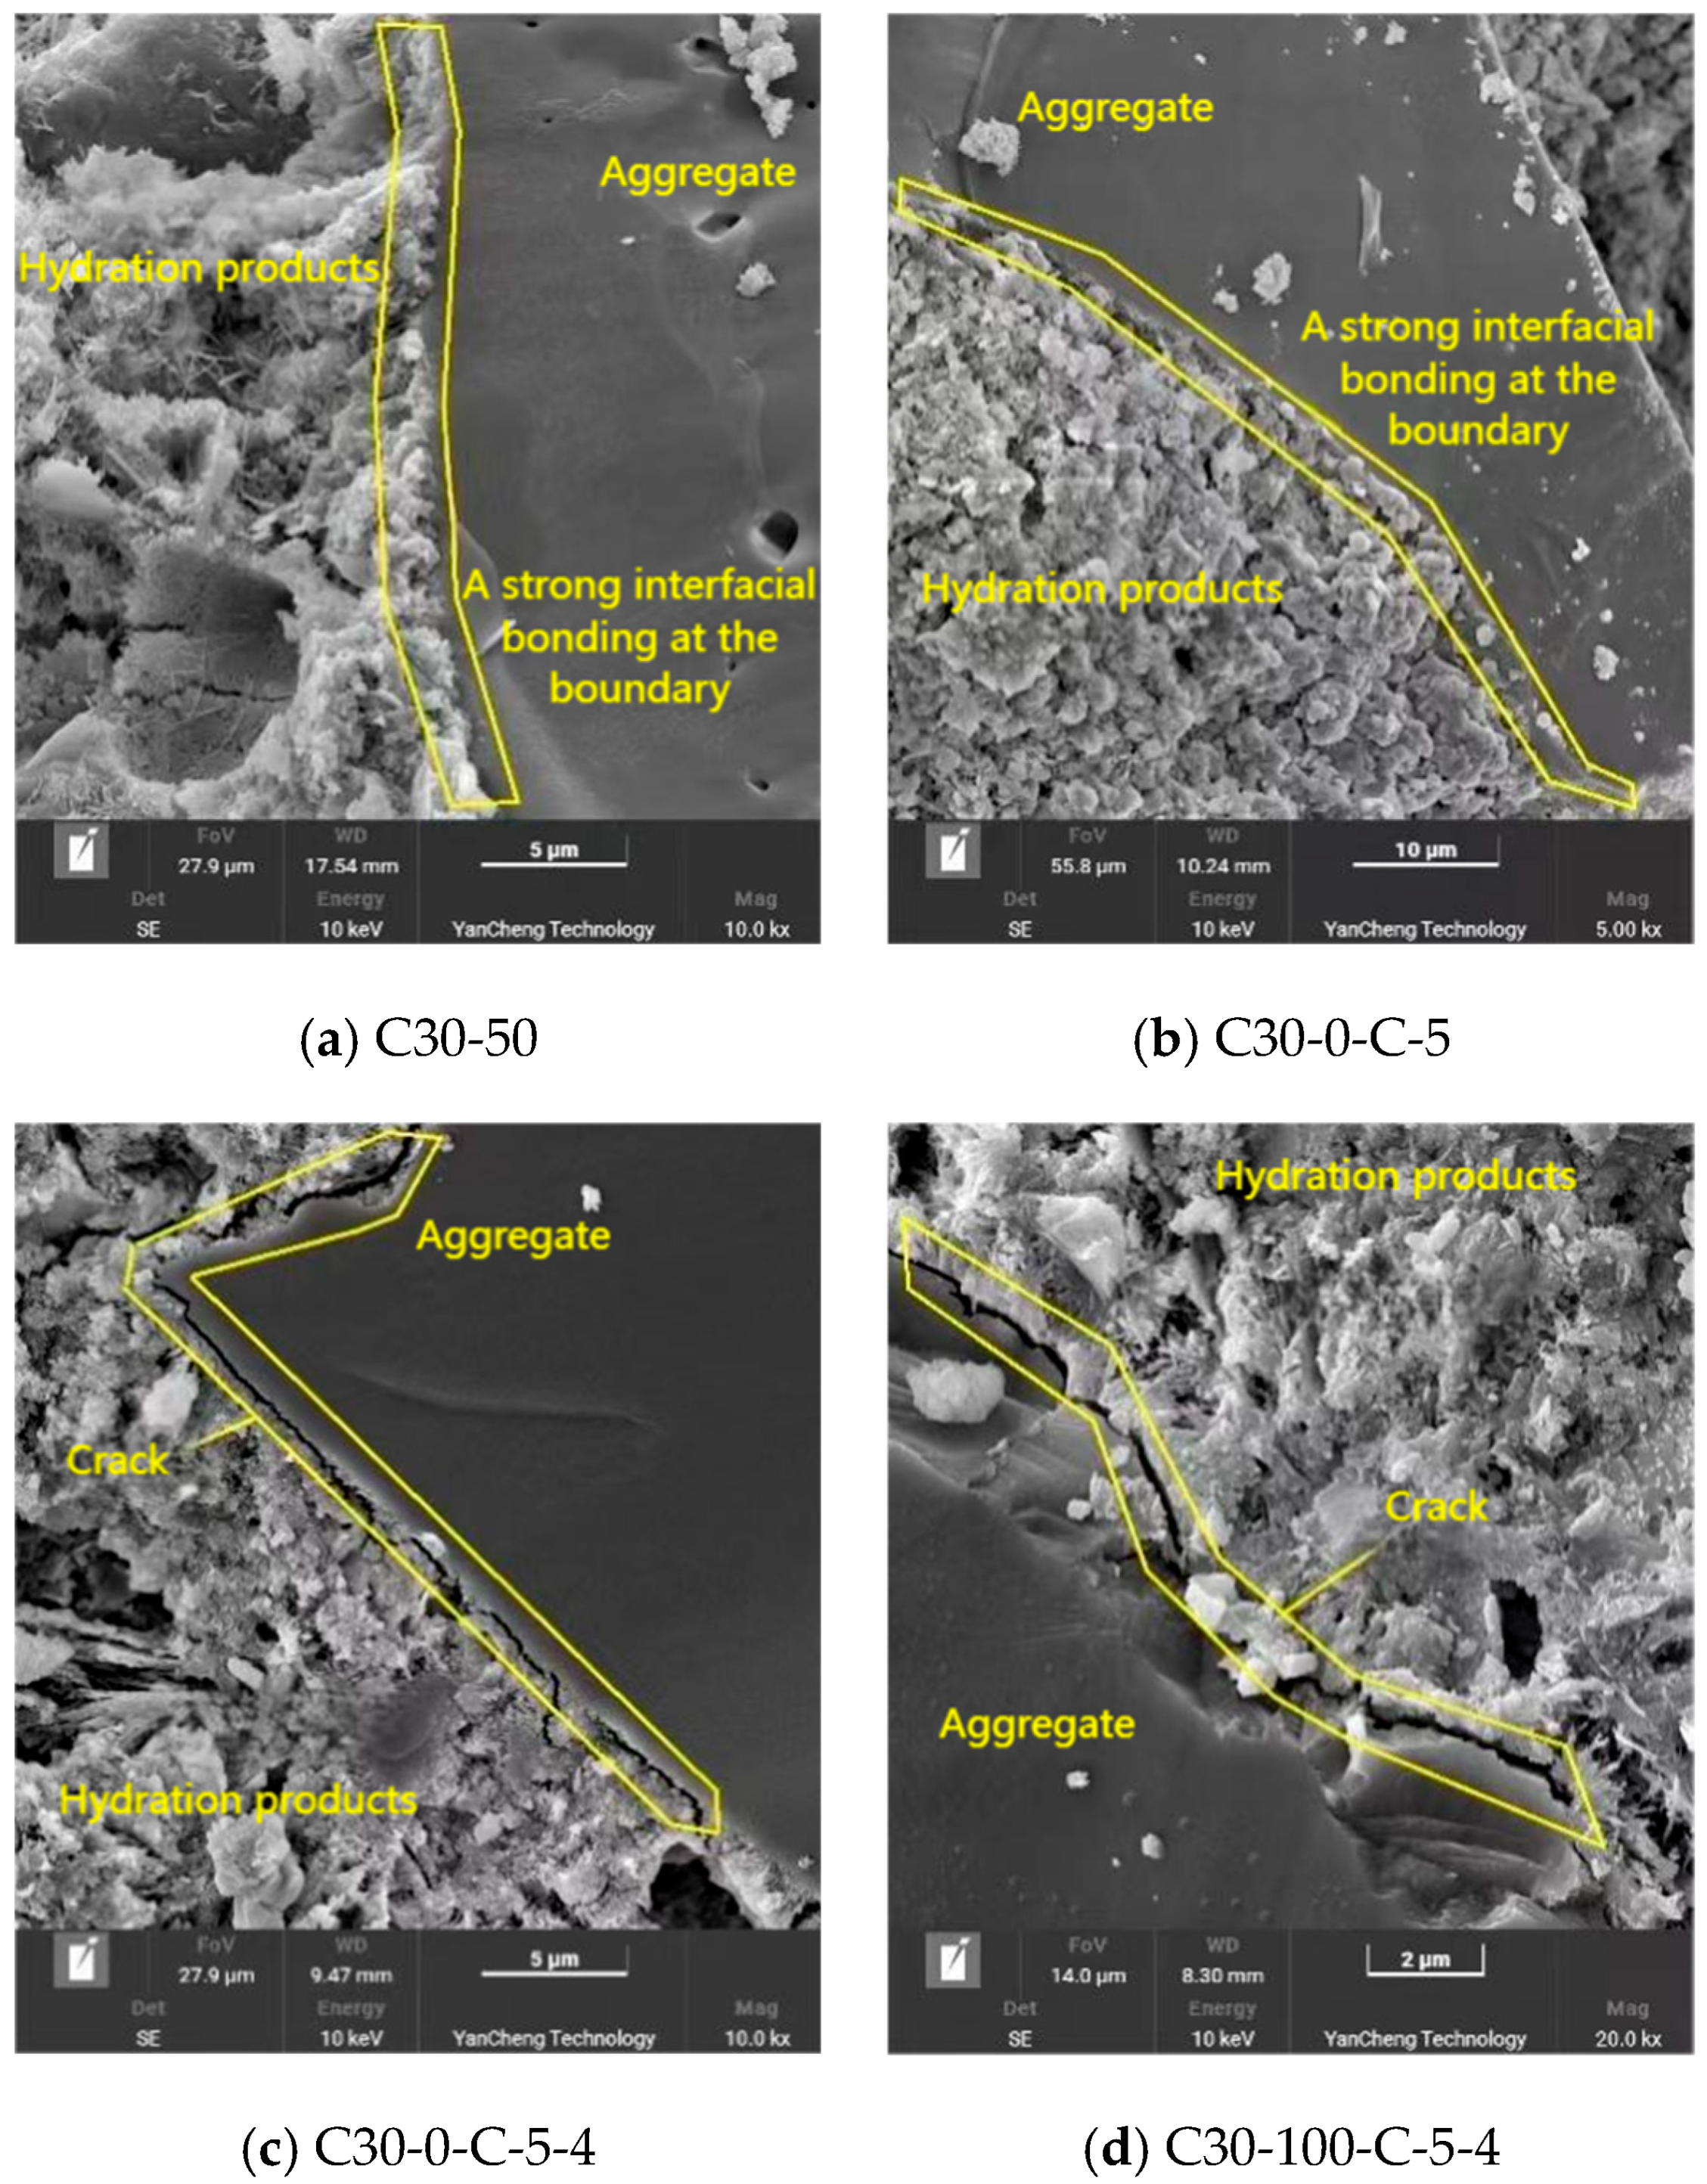
Figure 20 reveals the dense and well-integrated aggregate-paste interface with effective encapsulation prior to thermal loading. Subsequent to exposure to 400 °C, dehydration of the hydration products occurred, transforming the matrix into a more amorphous and porous structure. The deterioration was characterized by the formation of distinct interfacial cracks, which weakened the bond and was a primary factor in the degradation of the concrete’s compressive strength.
Analysis of the results indicates that: High-temperature exposure adversely affects the structural integrity and compressive strength of the MT concrete short columns. The addition of MT provides a mitigating effect against the strength loss typically caused by high temperatures. Dry–wet cycling prior to heating leads to microstructural densification of the hydration products, which implies a positive role in promoting continued hydration and thereby confers an improvement on the strength prior to thermal loading.
3.3. Peak Load–Displacement
While the load–displacement responses were consistent across all tests,
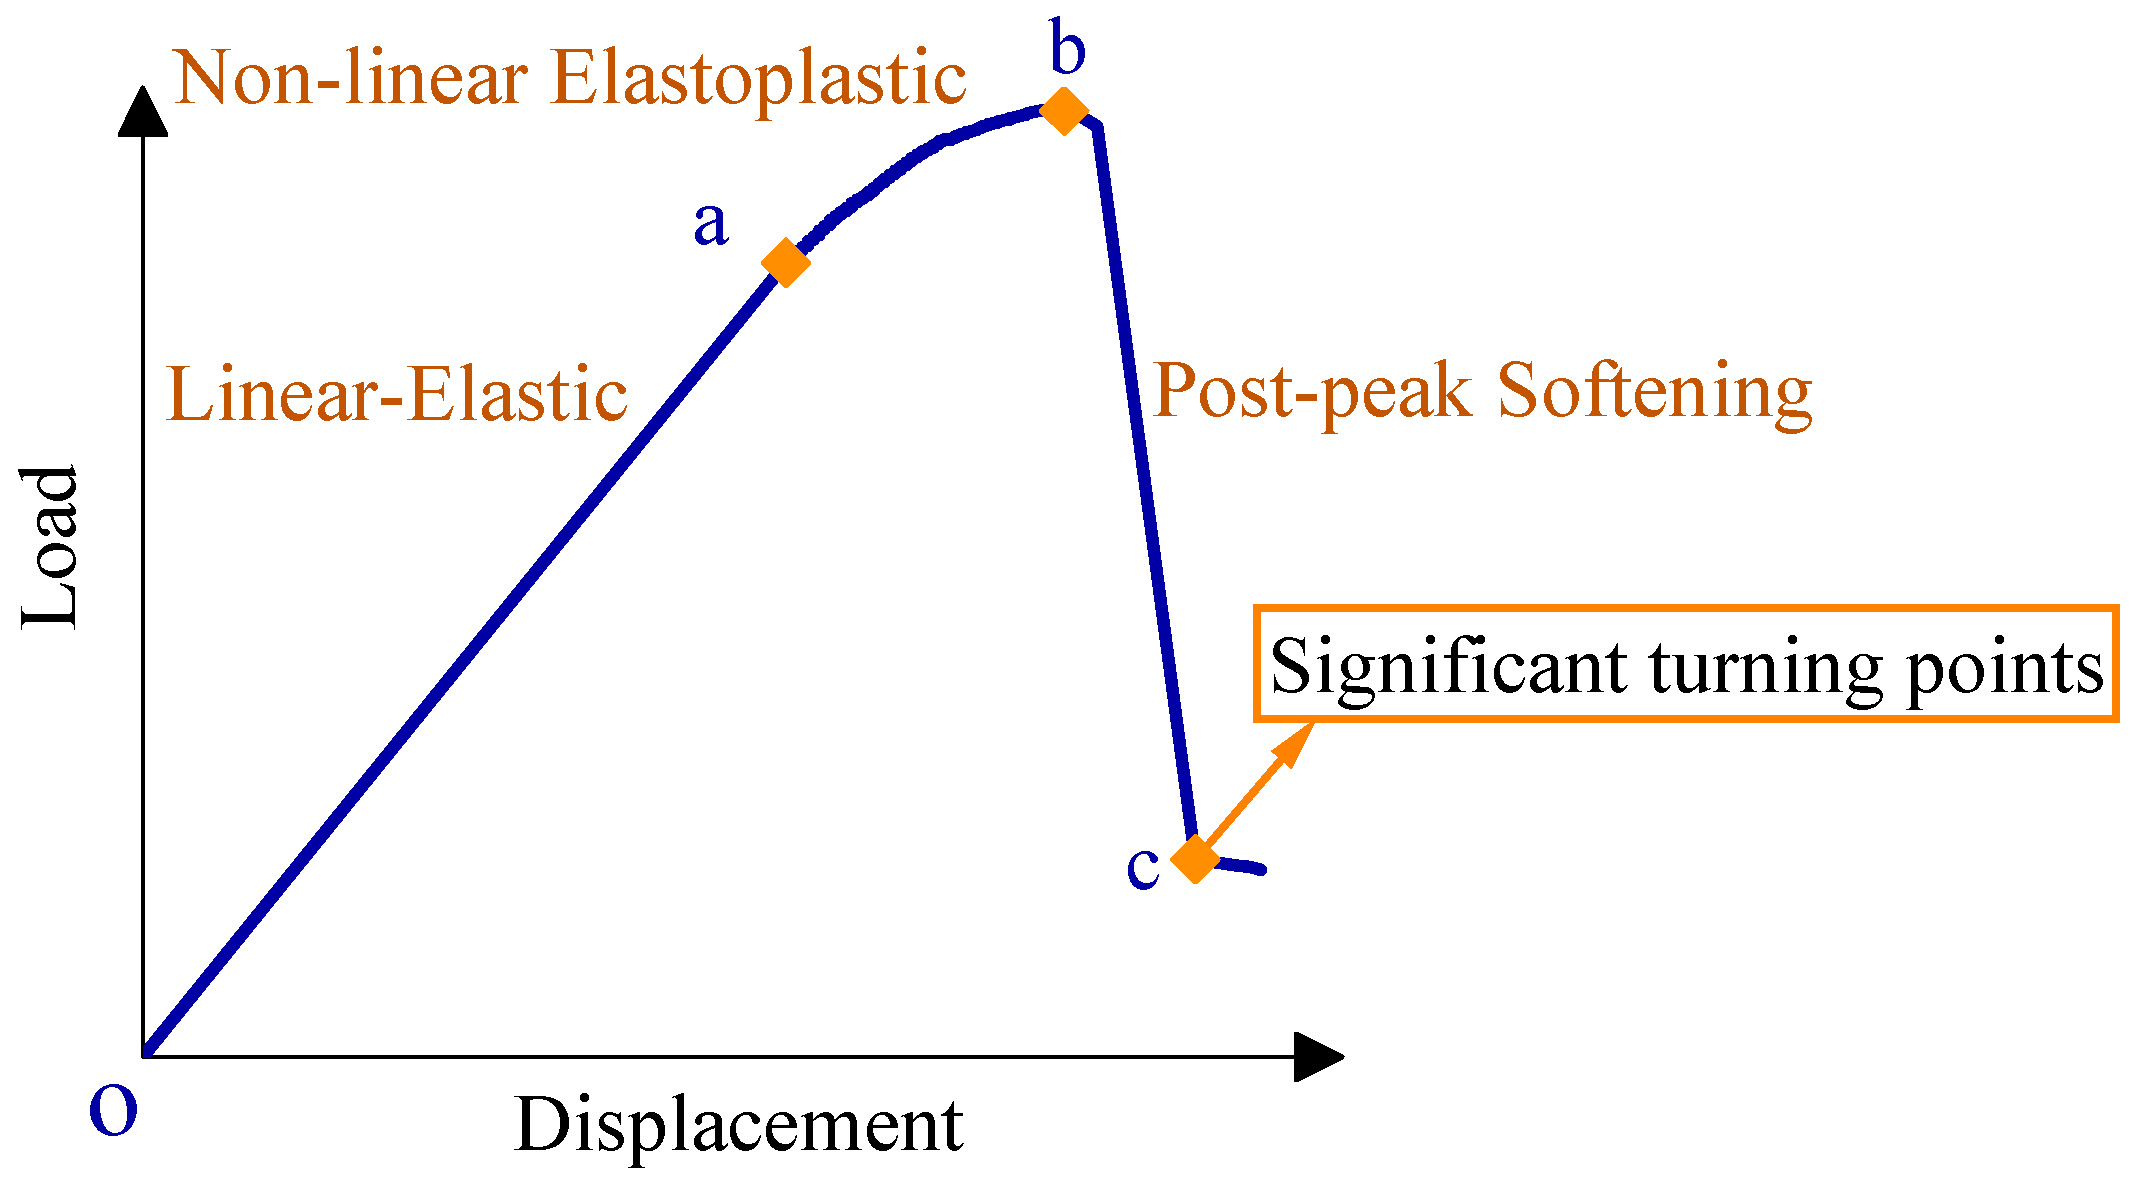
Figure 21 displays a simplified representative curve that delineates the three distinct phases: linear-elastic (oa), non-linear elastoplastic (ab), and post-peak softening (bc).
Linear-Elastic Phase (oa): This initial phase is characterized by a nearly linear load–displacement relationship, where the specimen undergoes recoverable deformation. The rate of displacement accumulation decreases relative to the very initial seating phase, coinciding with the onset of microcracking.
Elastoplastic Phase (ab): Upon further loading, the response deviates from linearity, marked by a gradual reduction in the curve’s slope (tangent stiffness). Macroscopic cracking becomes visible on the specimen’s surface as the load approaches the ultimate strength.
Softening Phase (bc): Upon surpassing the peak load, structural failure occurs, leading to a rapid decline in load-carrying capacity.
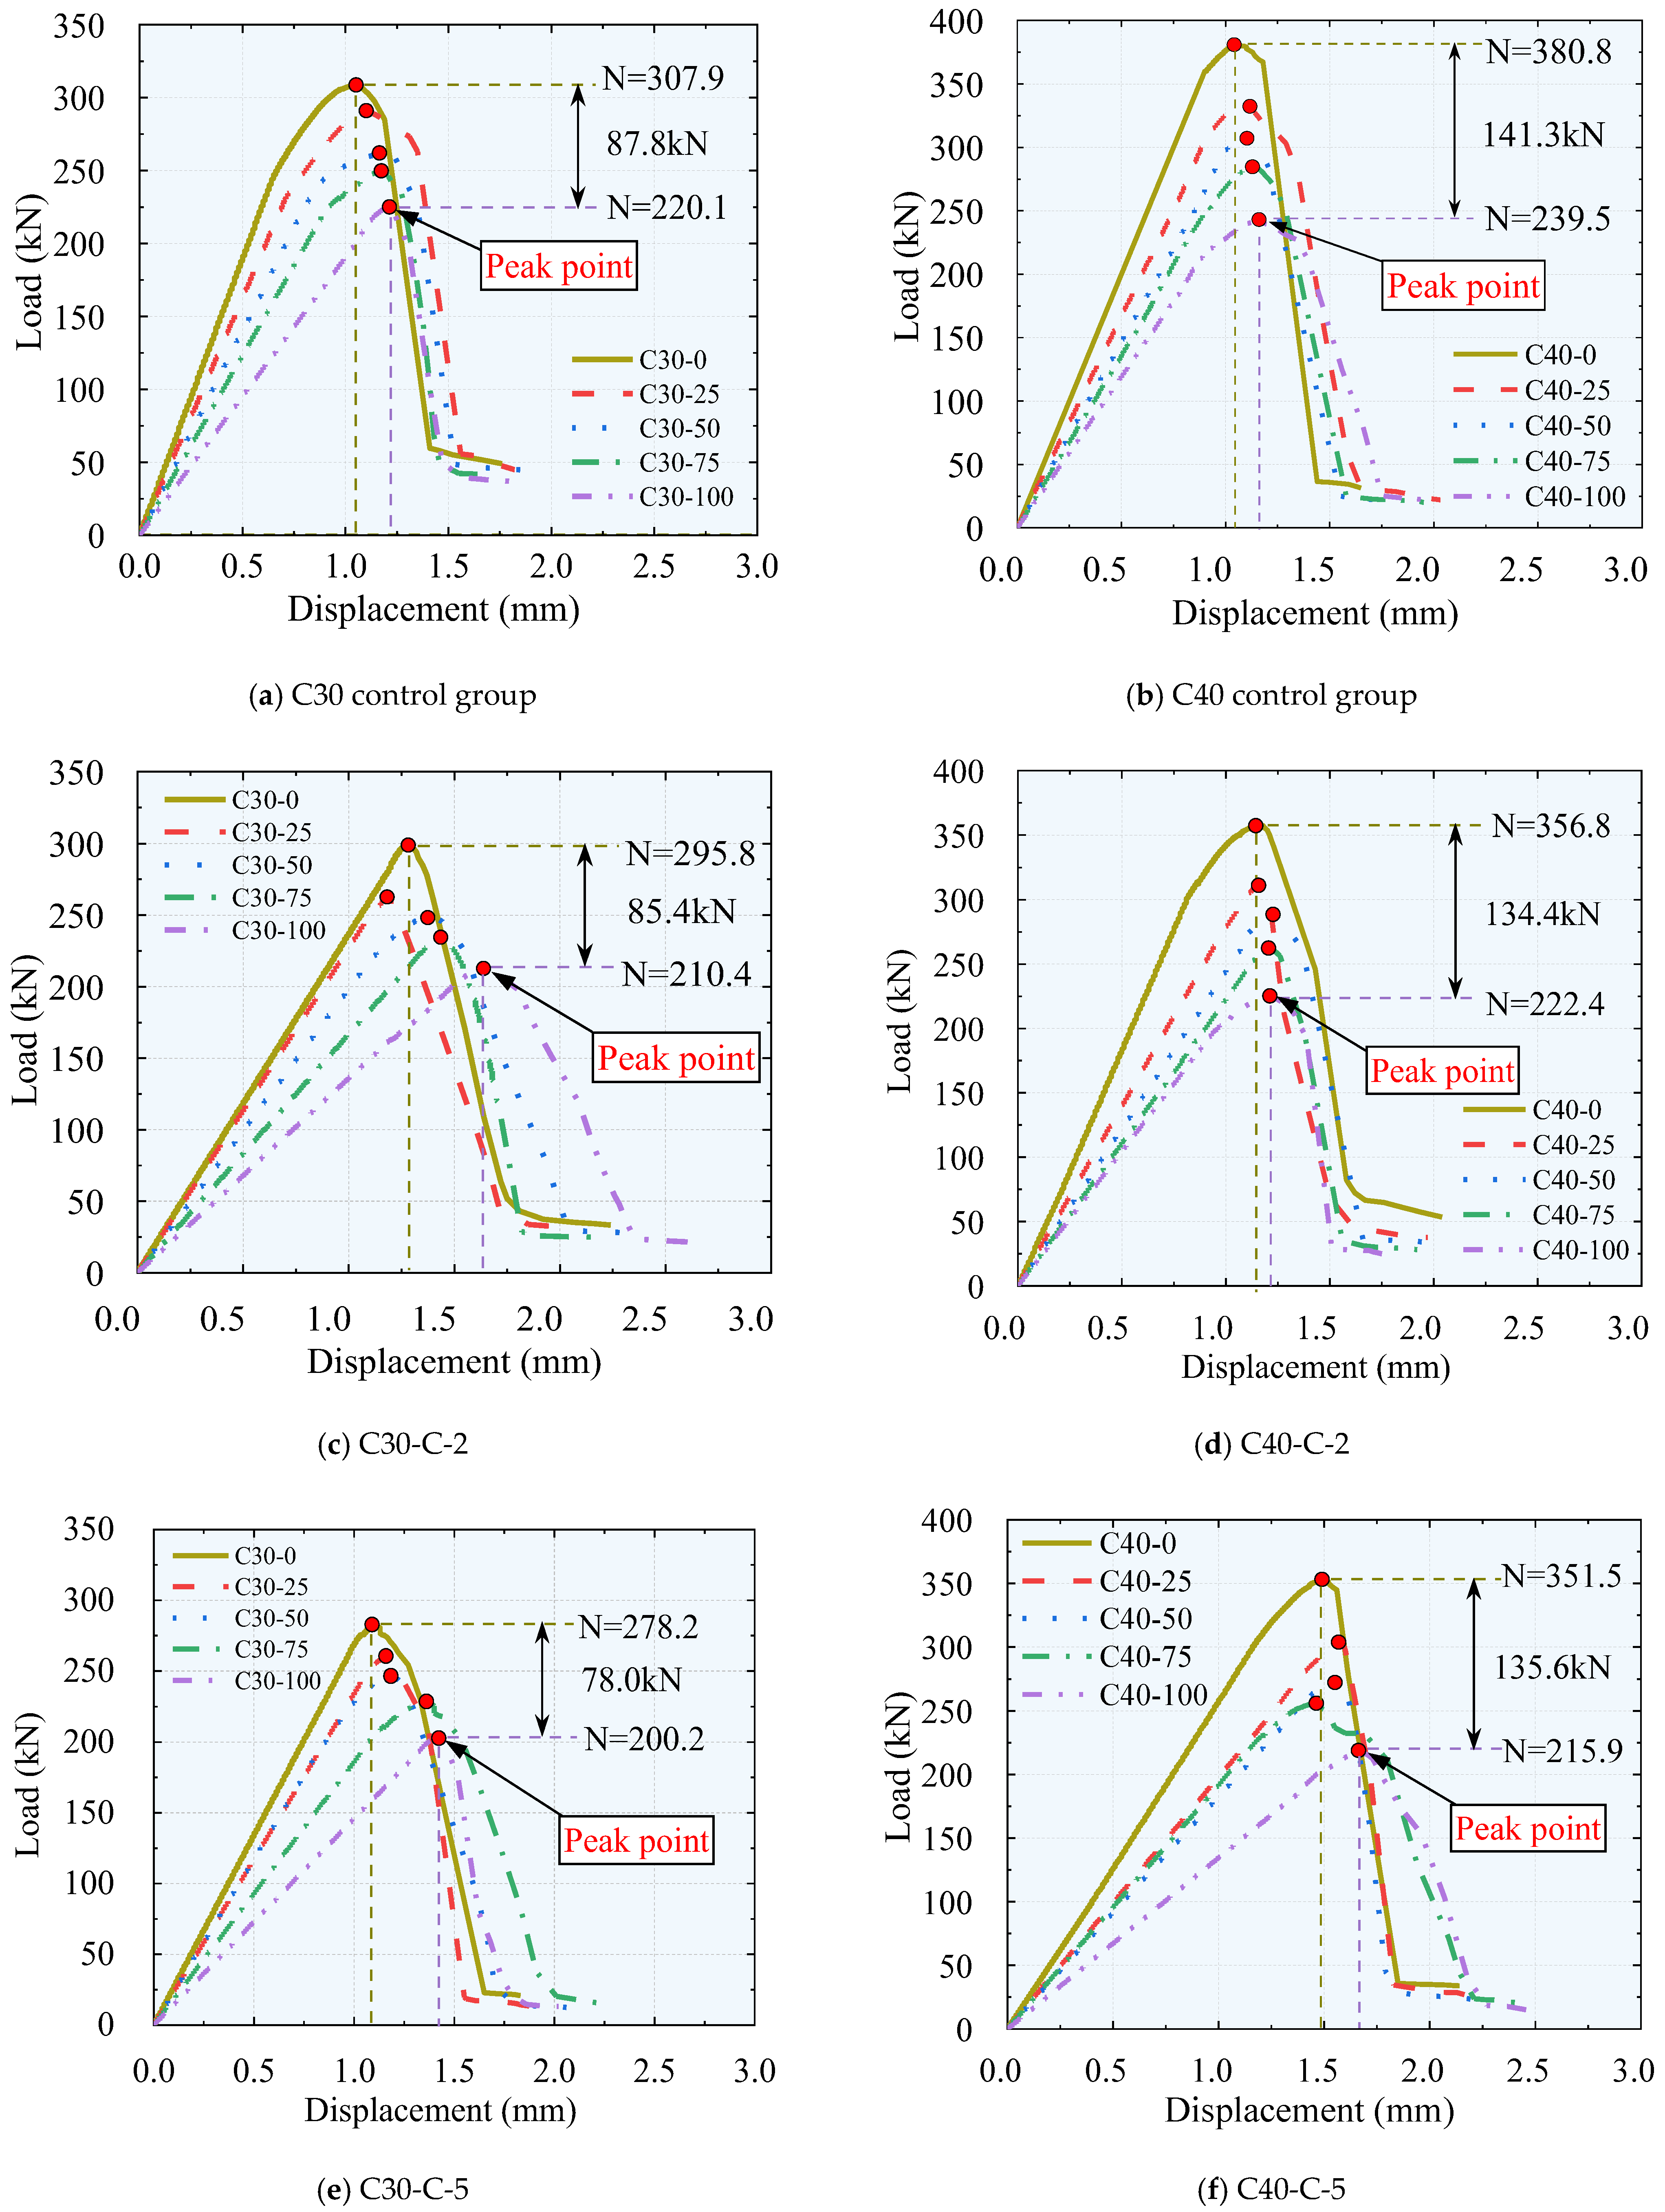
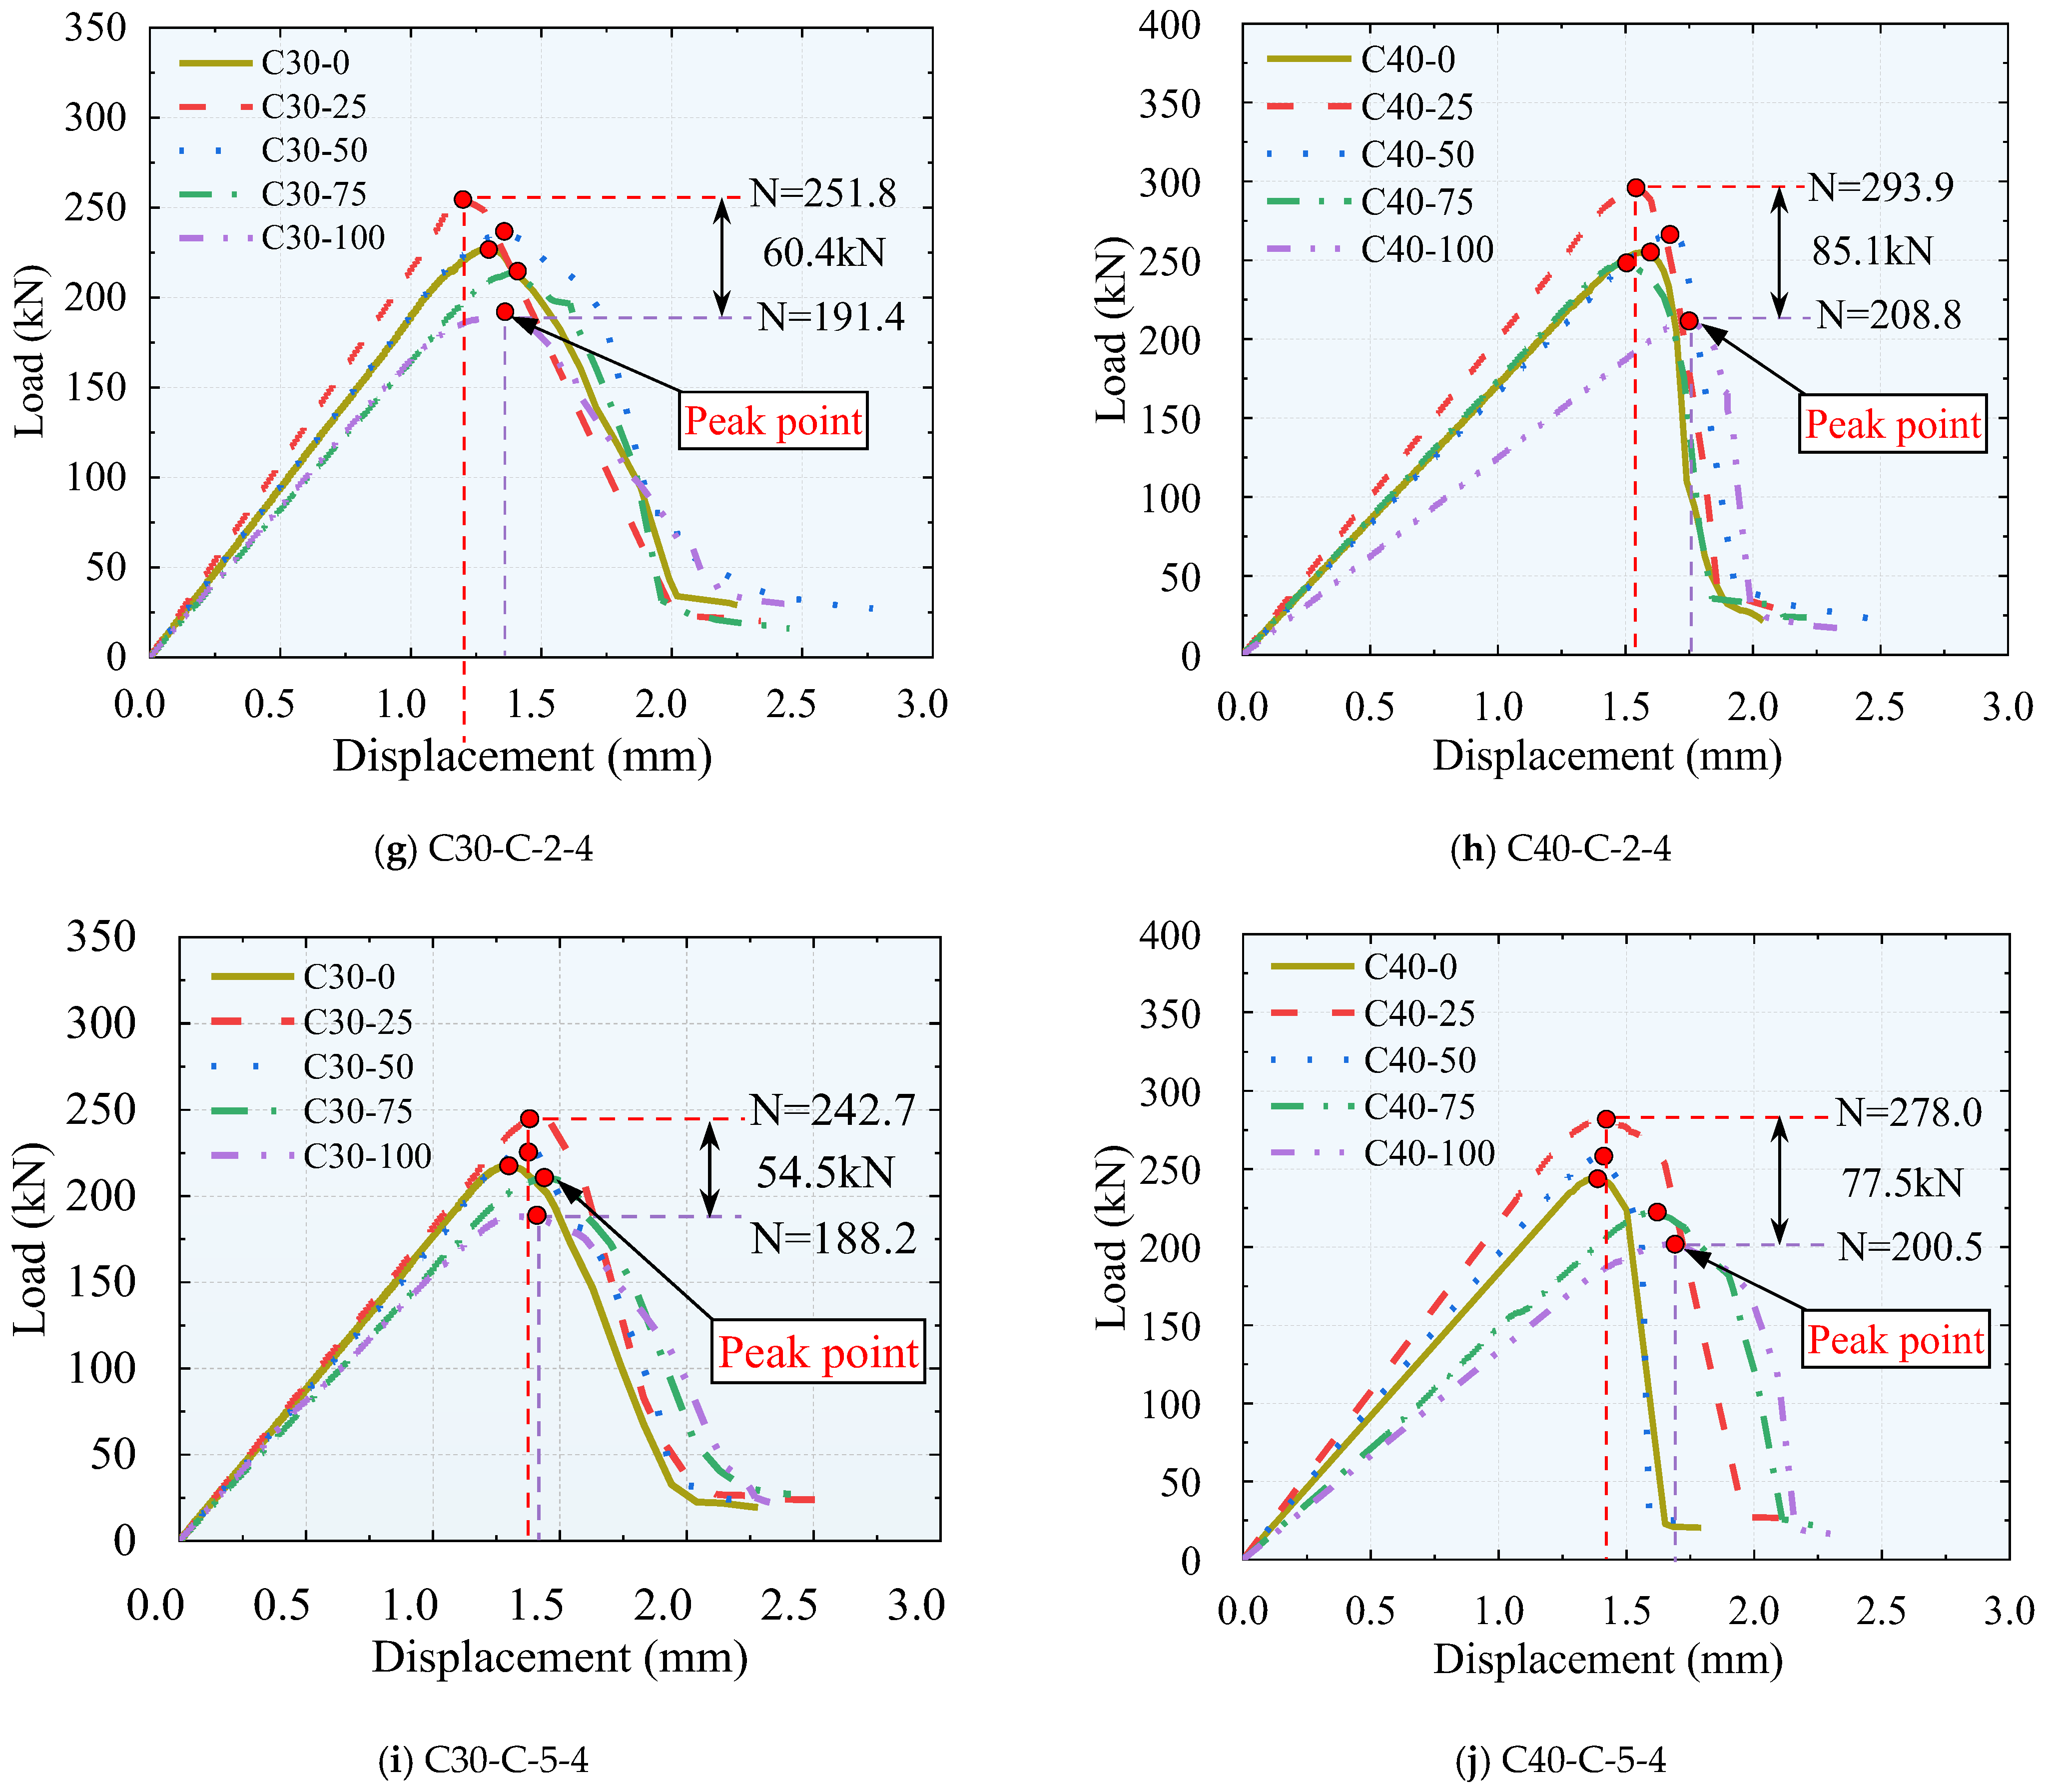
Figure 22 presents the load–displacement curves of C30 and C40 MT concrete short columns under axial compression. Under ambient temperature (without corrosion or high-temperature exposure), as shown in
Figure 22a,b, both C30 and C40 short columns exhibit a consistent trend: the peak load and peak displacement are distinctly dependent on the MT replacement ratio. Under ambient temperature (no corrosive or high-temperature exposure), the peak load exhibits a clear negative correlation with the MT replacement ratio. As the MT replacement ratio increases, the peak load decreases progressively. Especially, for 75% and 100% replacement, the peak load reduces more significantly. Concurrently, the peak displacement increases with higher MT replacement ratios. Similarly, for 75% and 100% replacement, the peak displacement exhibits more notable increases. Compared to C30 short columns, C40 exhibits a higher baseline peak load and identical baseline peak displacement. This trend arises from the inferior reactivity and interface compatibility of MT relative to natural fine aggregate. Higher MT replacement ratios reduce the cementitious matrix’s bond strength with aggregates, weakening the interface transition zone and decreasing the overall compressive strength. Meanwhile, the porous nature of MT introduces more internal voids, which can accommodate greater plastic deformation before failure, leading to a larger peak displacement.
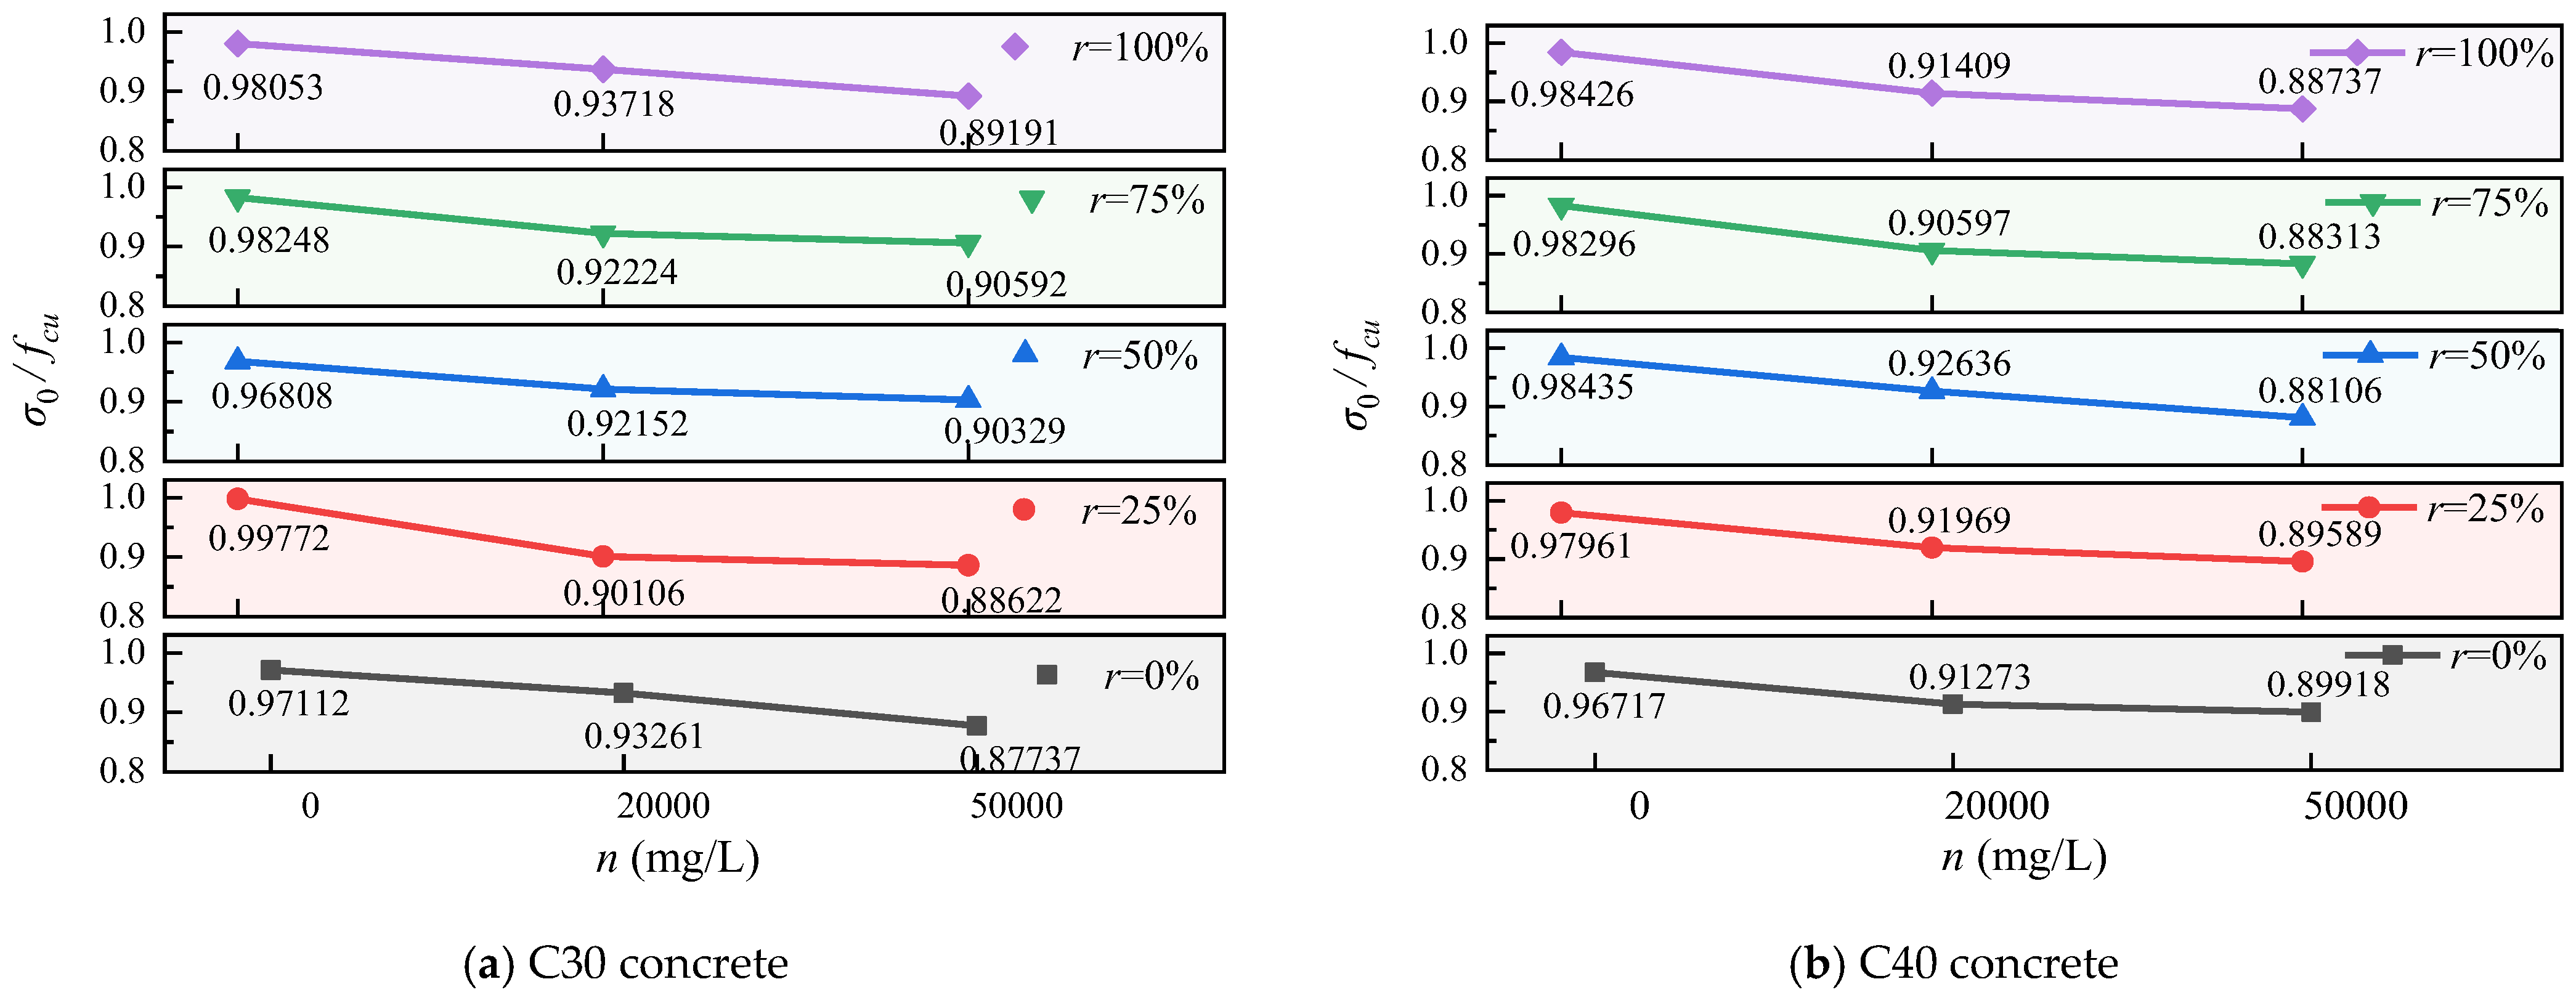
After dry–wet cycling, as shown in
Figure 22c–f, the peak load of all specimens decreases compared to the ambient group, confirming the deleterious effect of chloride ion erosion. However, the 25–50% MT replacement group still maintains a superior peak load and a stable peak displacement. This indicates that appropriate MT incorporation mitigates chloride-induced strength degradation. Molybdenum tailings’ micro-aggregate filling effect refines the pore structure and reduces chloride ion penetration. With NaCl concentration increased from 20,000 mg/L to 50,000 mg/L, the corrosive effect intensifies. Notably, the 25–50% MT replacement group still exhibits a higher peak load and a slightly increased peak displacement, demonstrating that MT alleviate the combined degradation by enhancing matrix compactness.
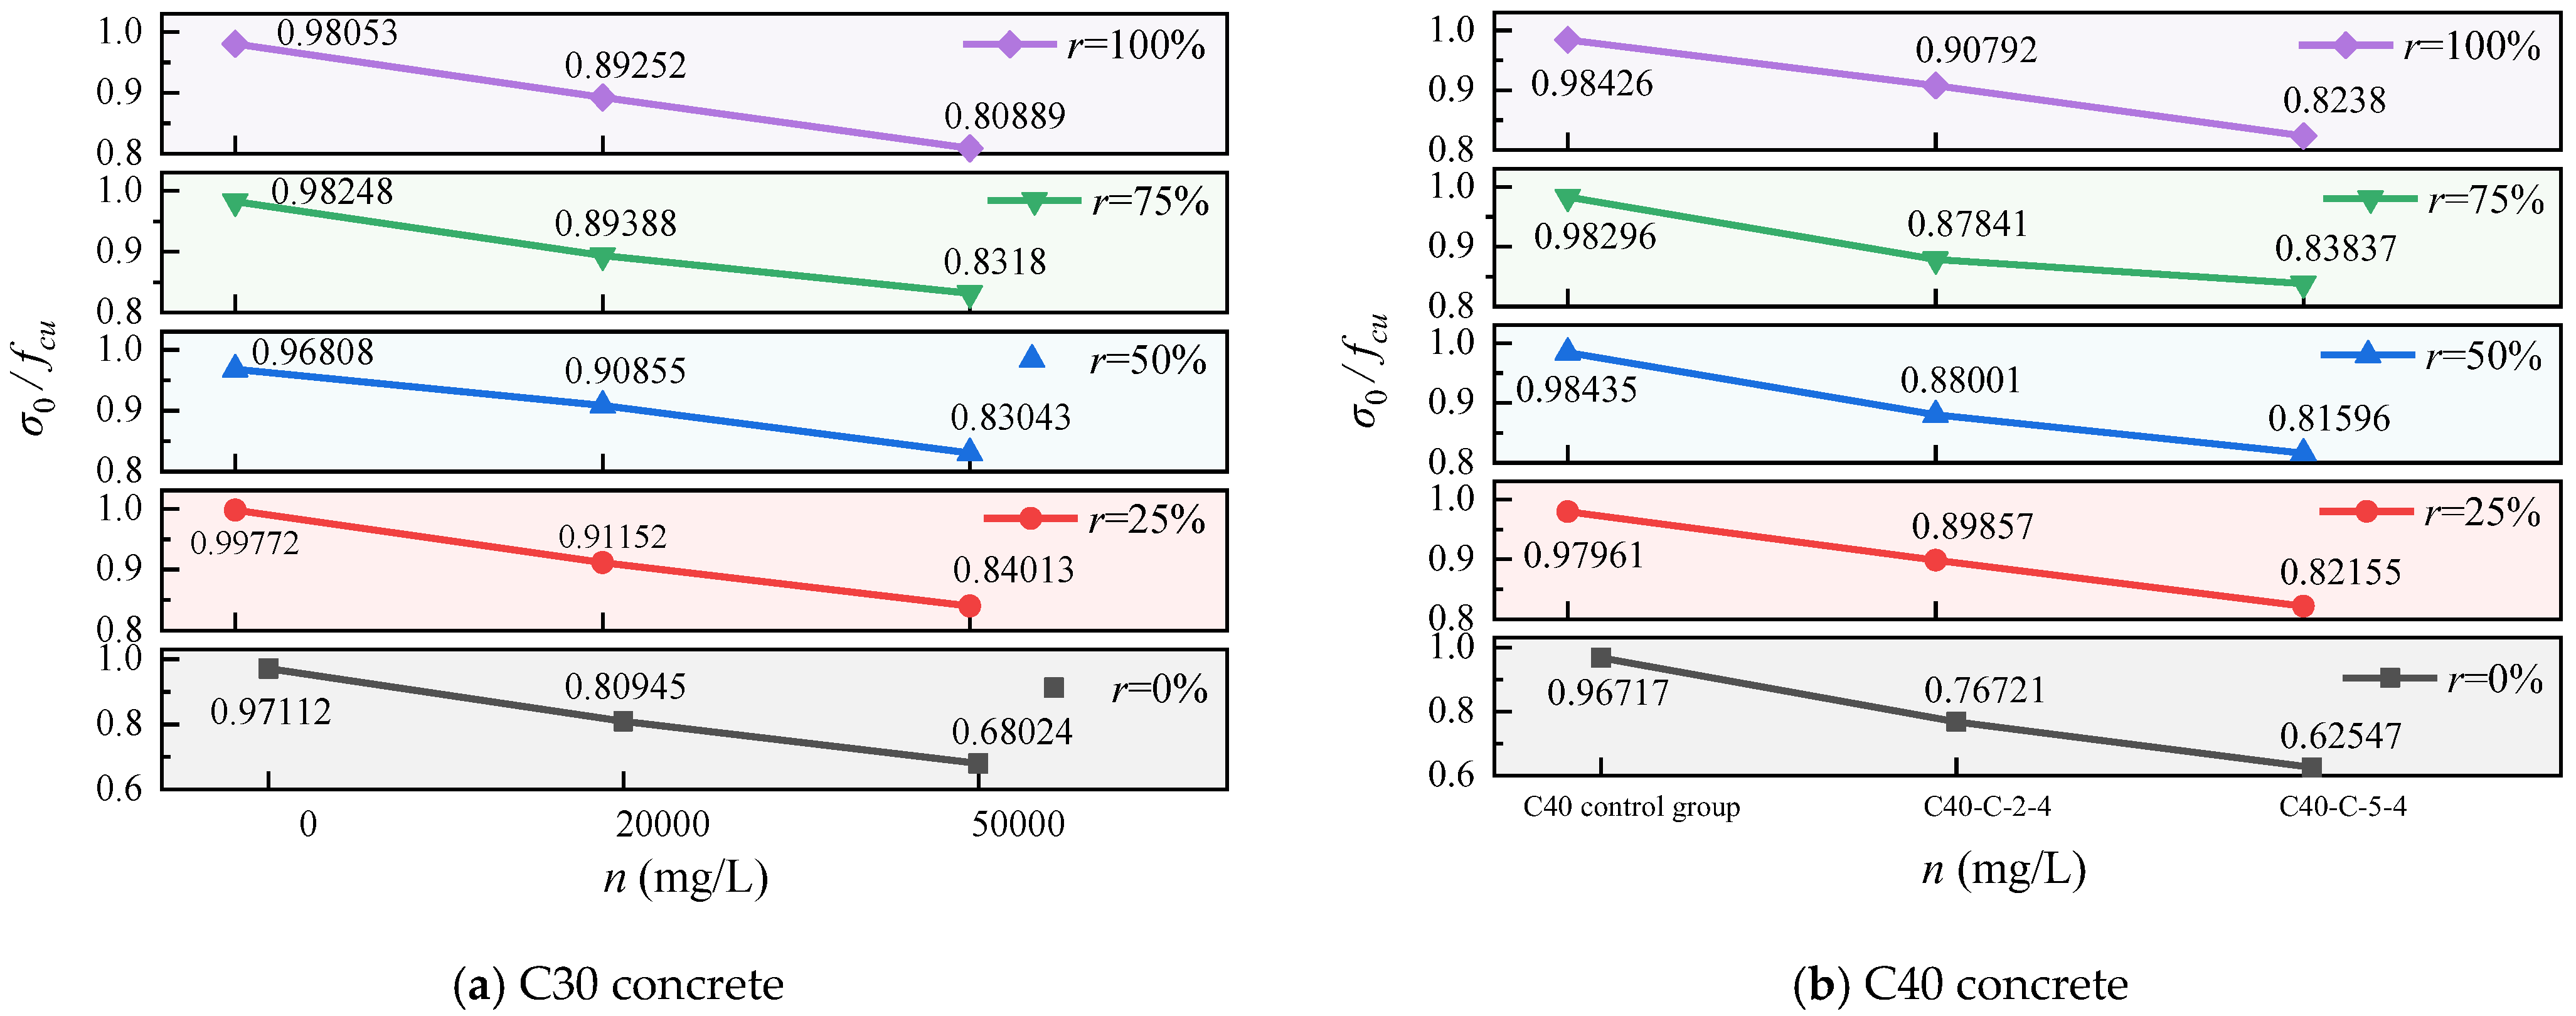
Under the combined action of chloride corrosion and high temperature (400 °C), as shown in
Figure 22g–j, the performance of MT concrete deteriorates more significantly: the peak load further decreases, and the peak displacement decreases. However, the 25–50% MT replacement still provides significant enhancement, and the peak displacement increases, mitigating high-temperature-induced brittleness.
In summary, deterioration induced by salt solution erosion and high-temperature exposure significantly compromised the load-bearing capacity, with the degree of degradation being concentration-dependent. The use of MT was found to effectively counteract this performance loss, thereby improving durability. However, excessive replacement (≥75%) reduces peak load and slightly increases peak displacement. It is evident that the MT specimens retained their mechanical properties effectively after combined environmental exposure, demonstrating a notable resistance to chemical and thermal degradation. The incorporation of tailings also served to mitigate the high-temperature-induced damage to the concrete matrix.
3.4. Axial Compressive Performance
As illustrated in
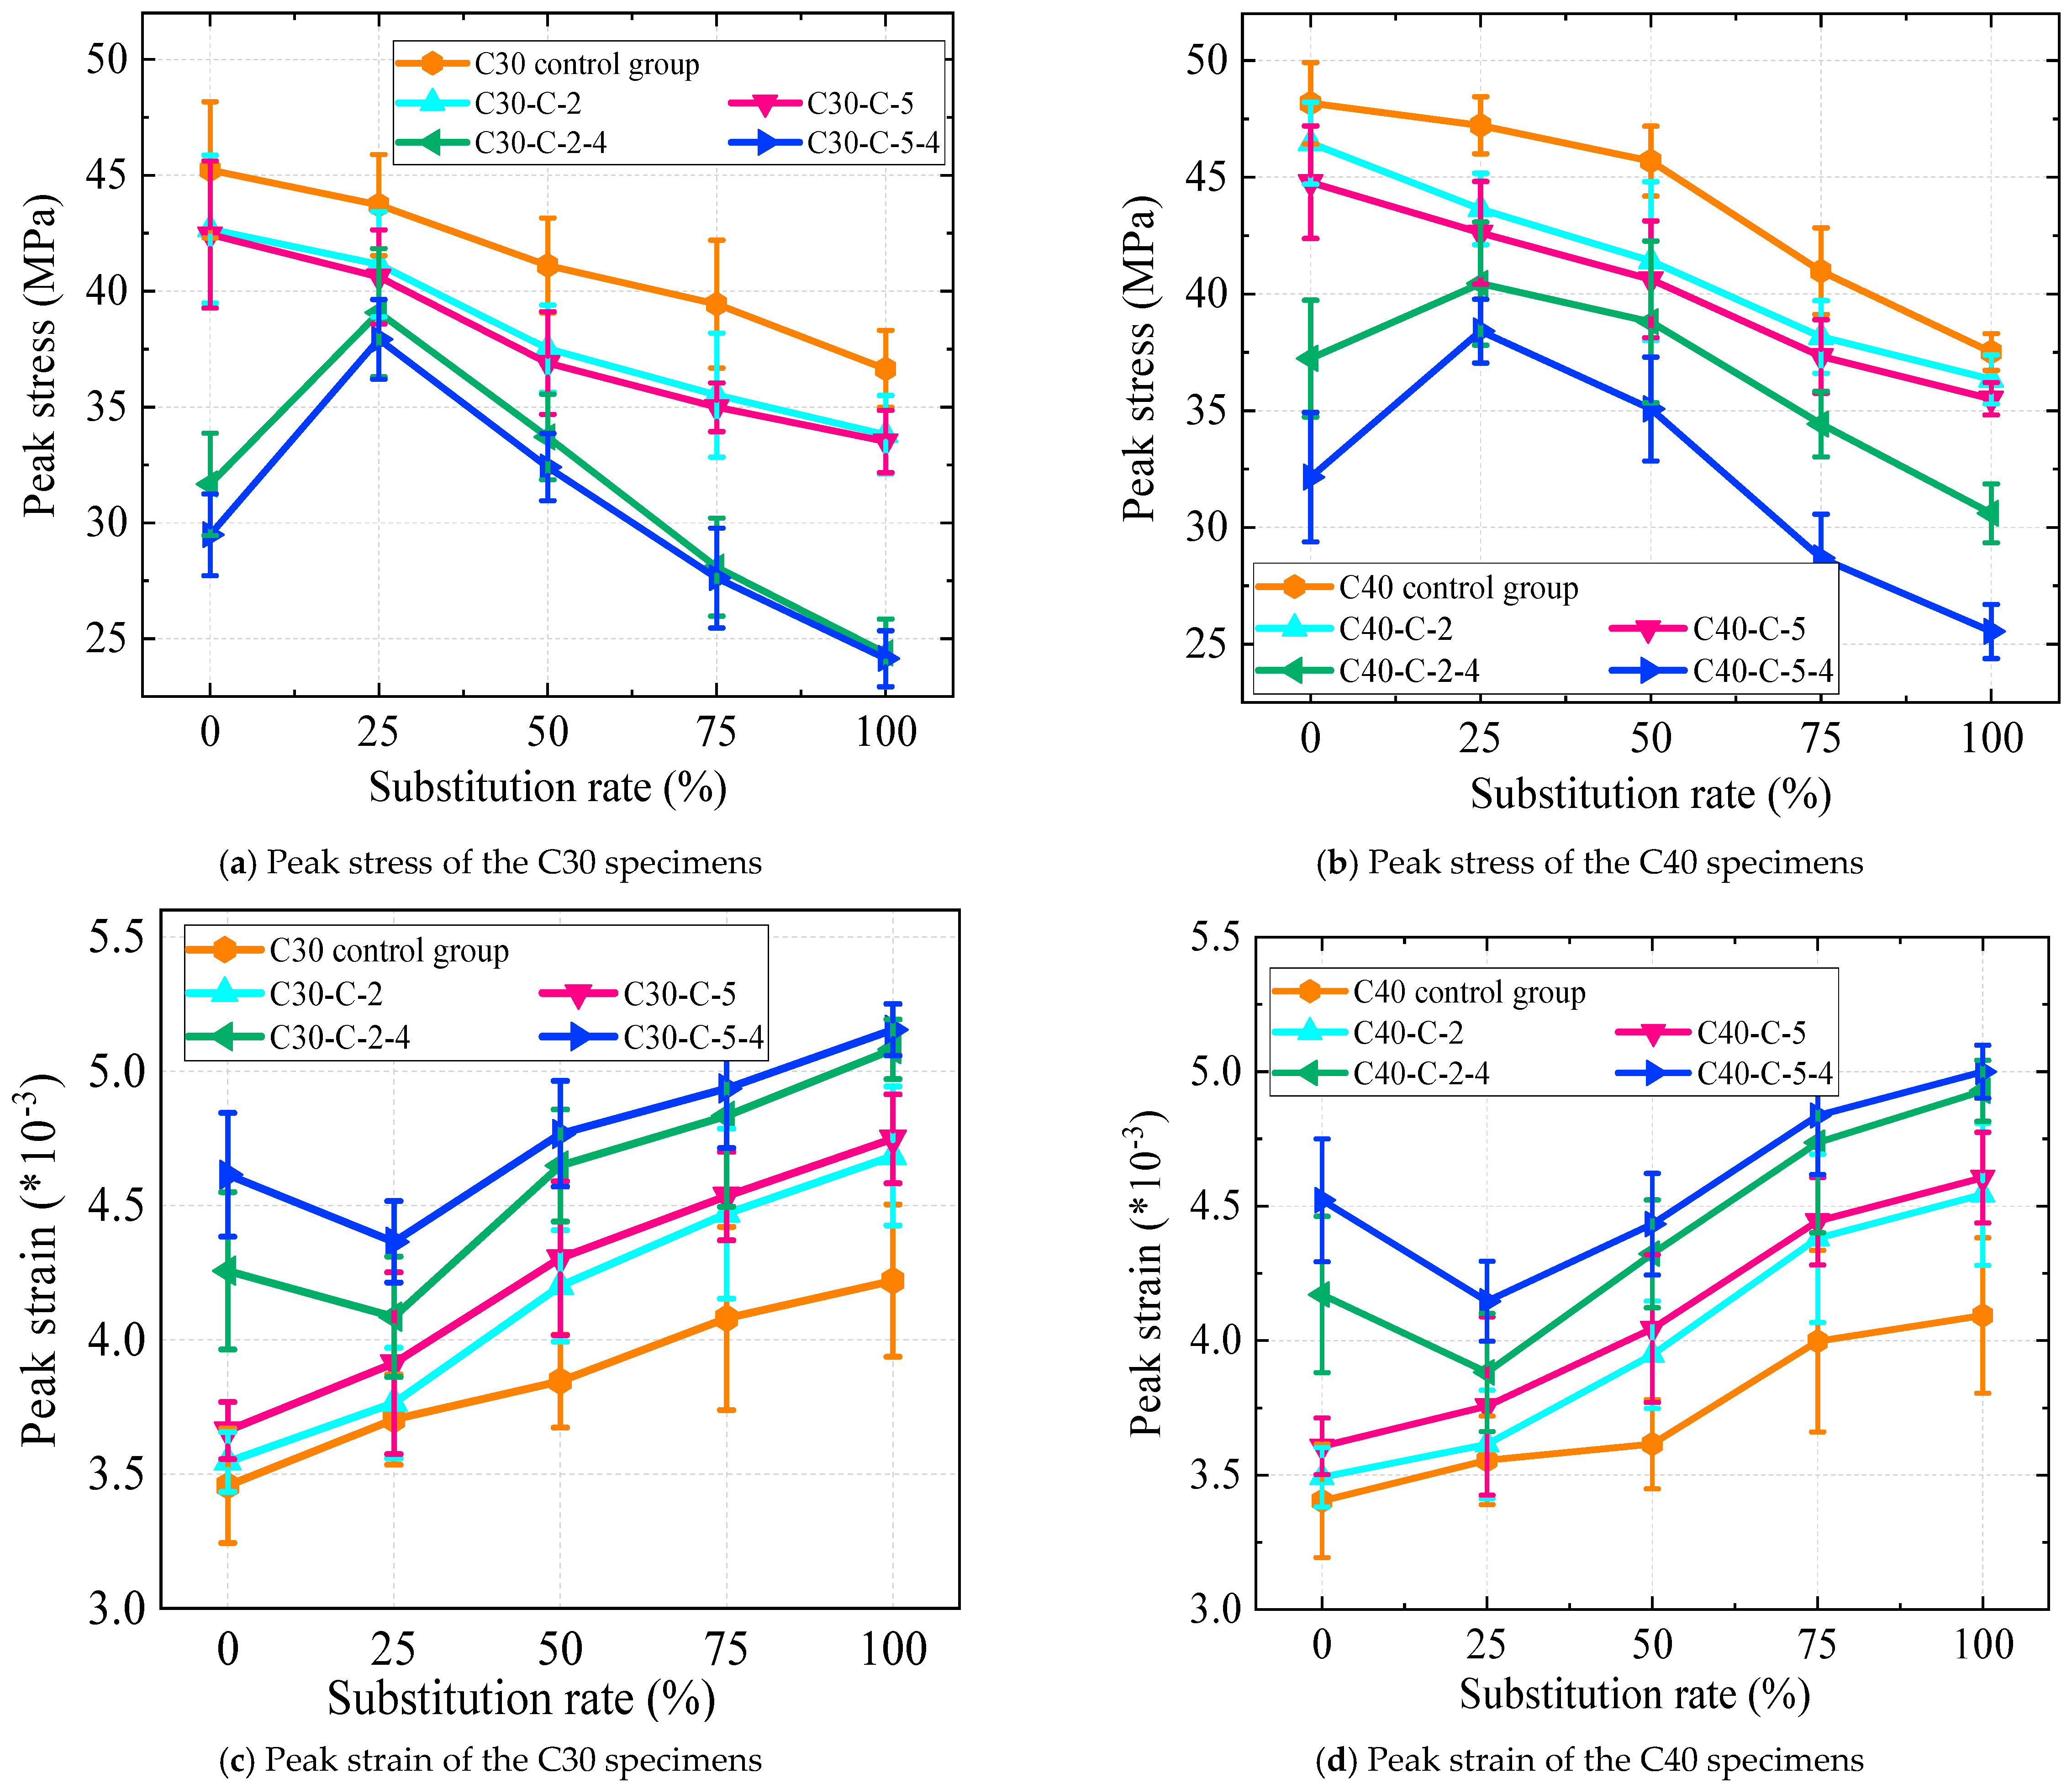
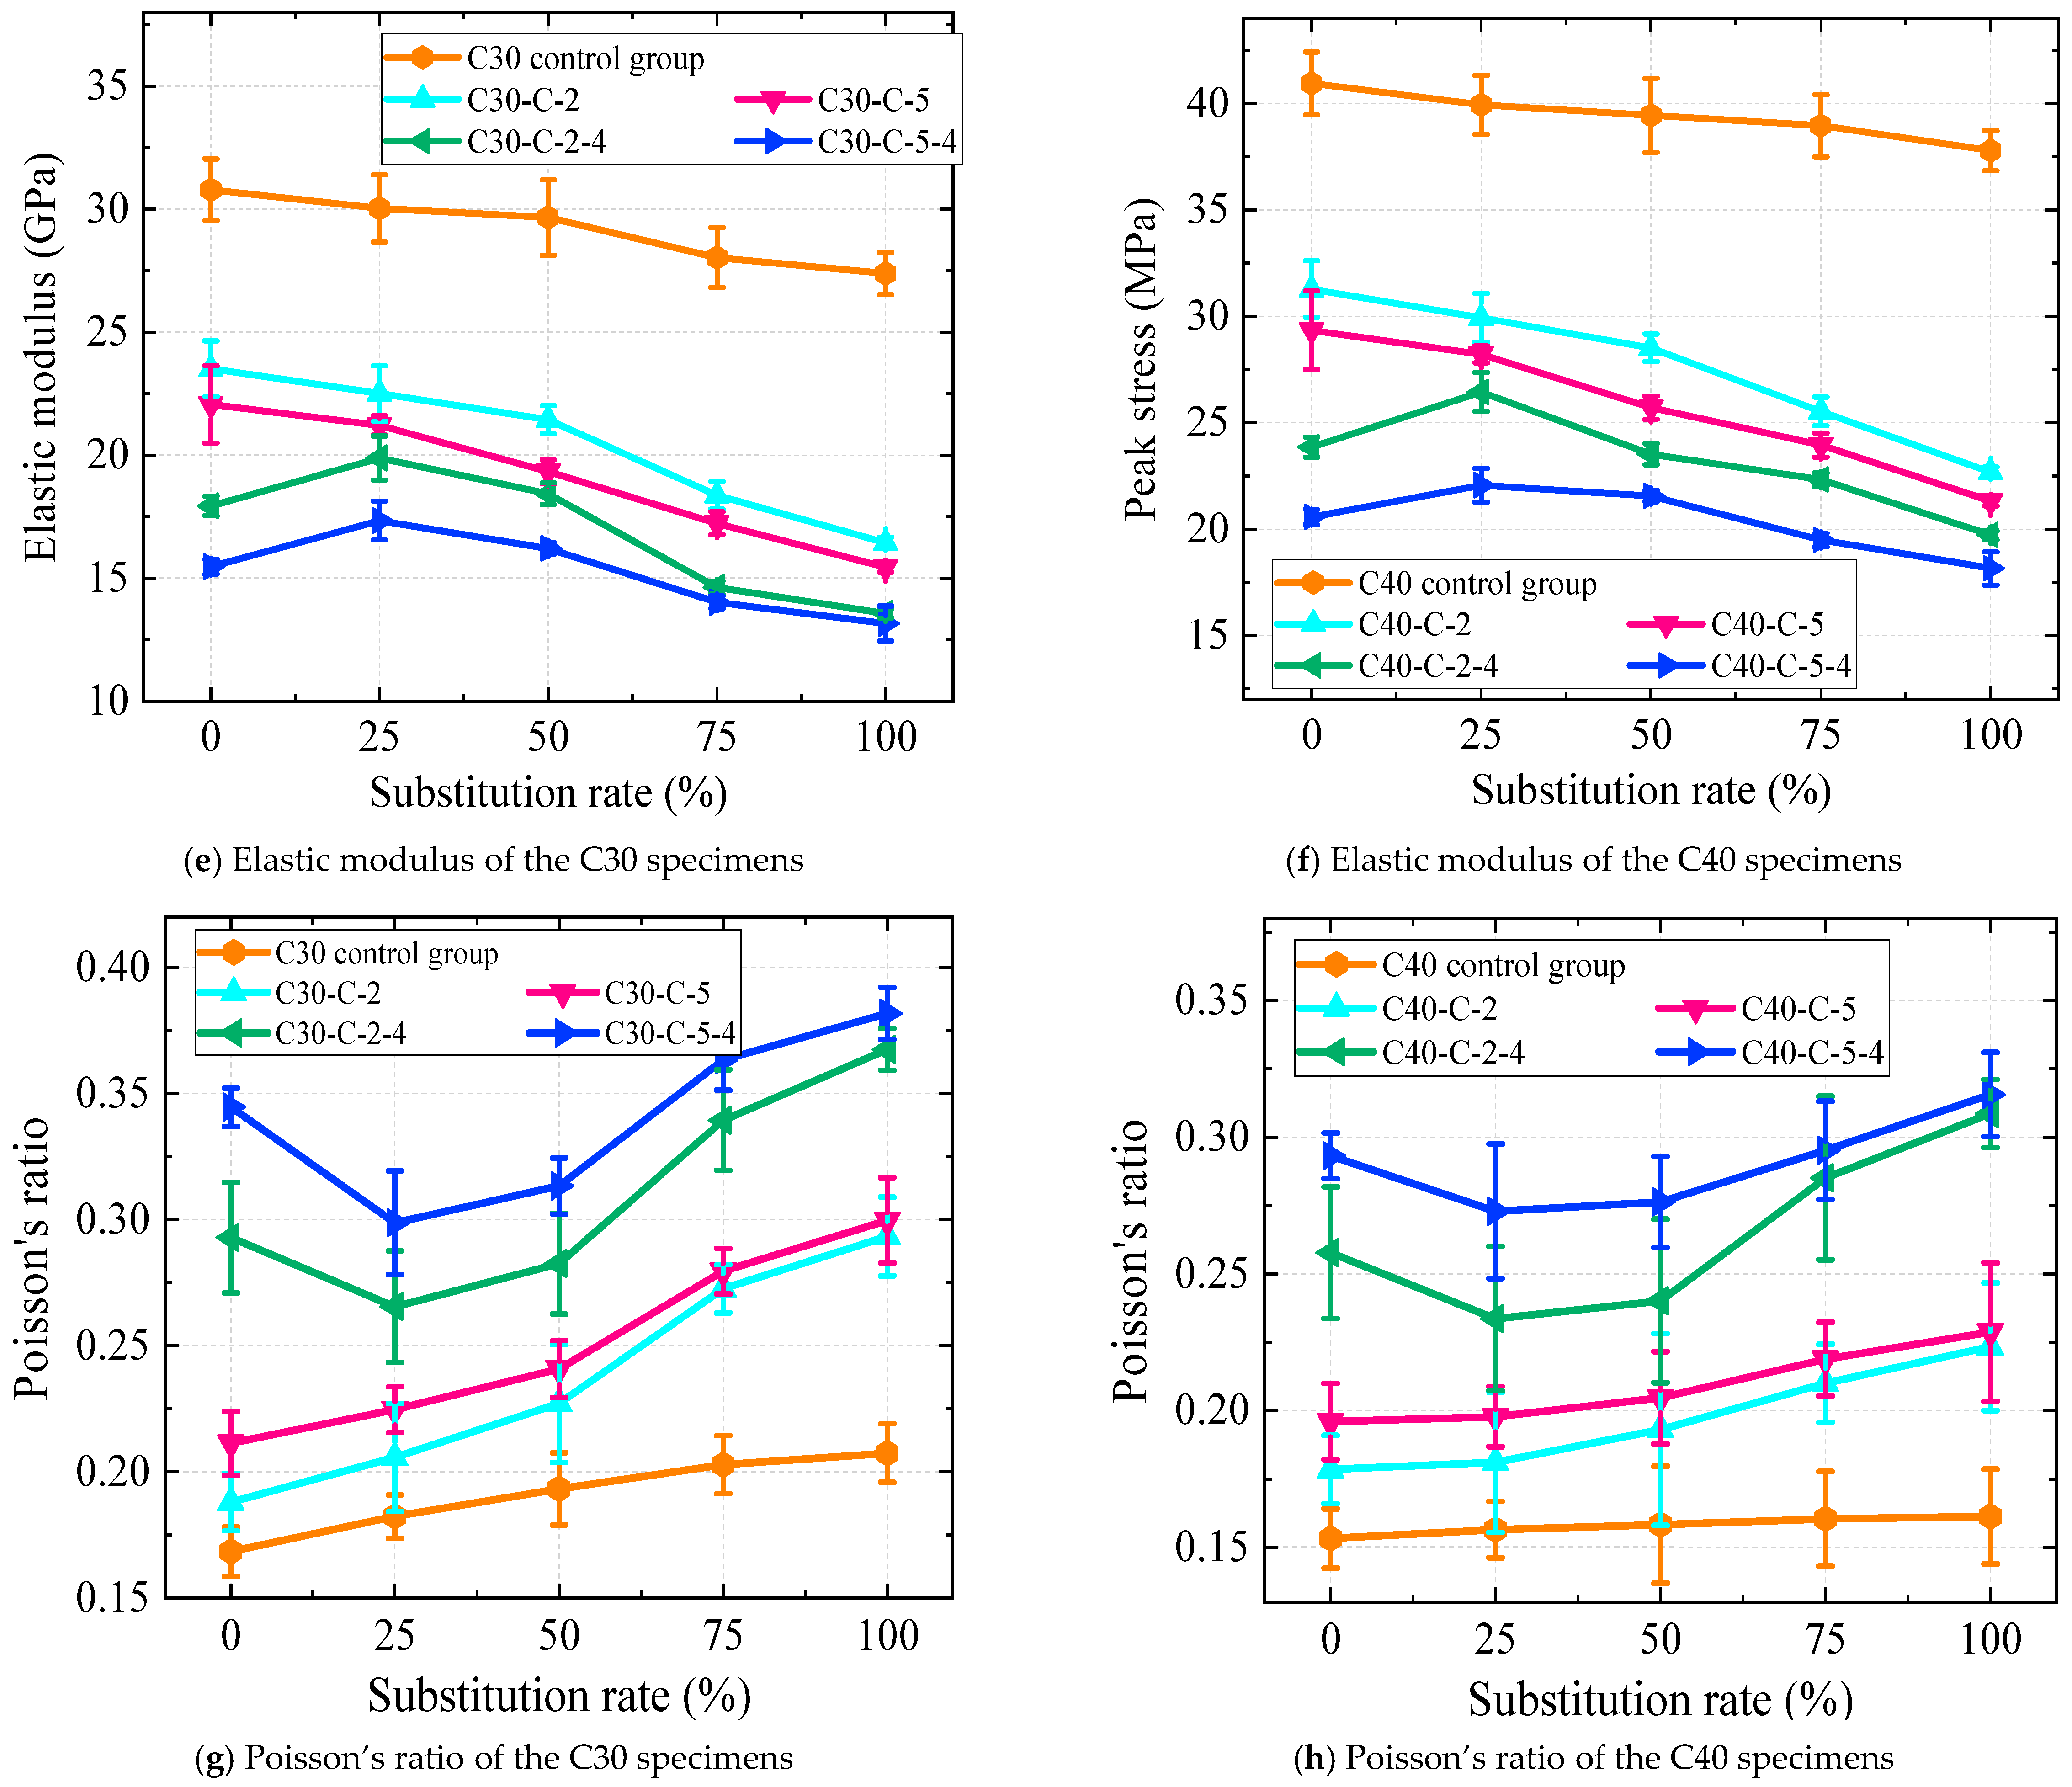
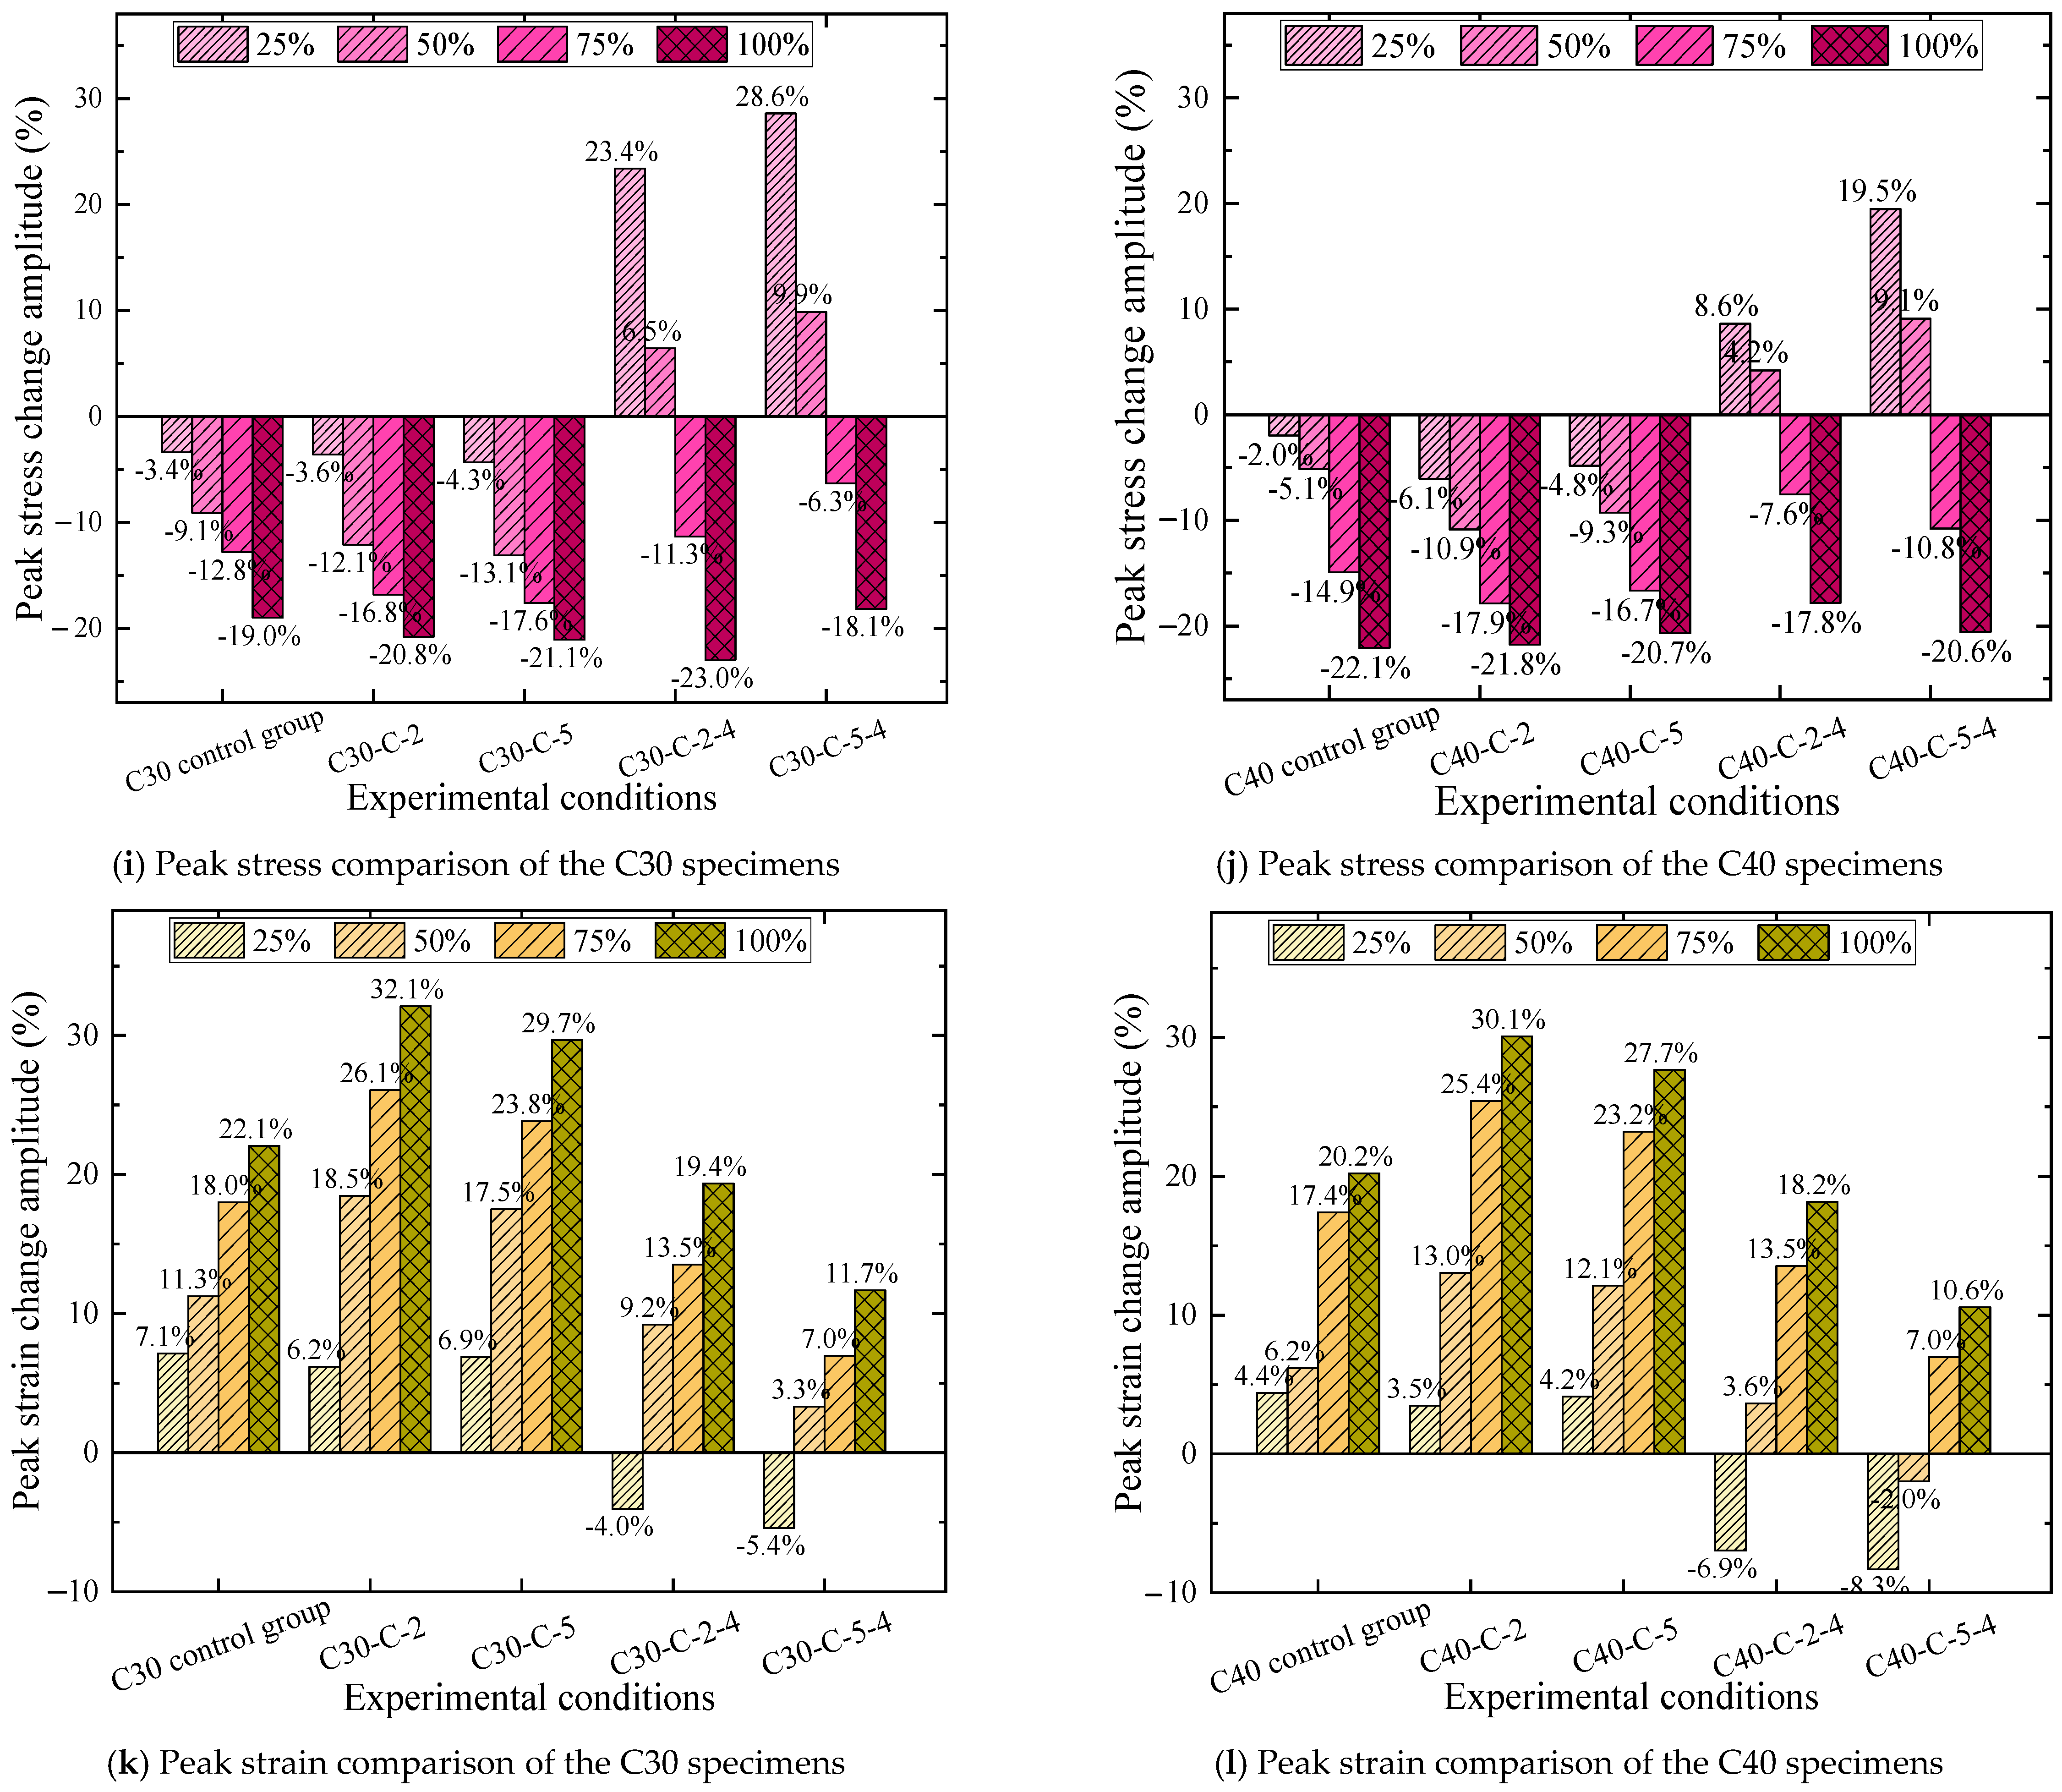
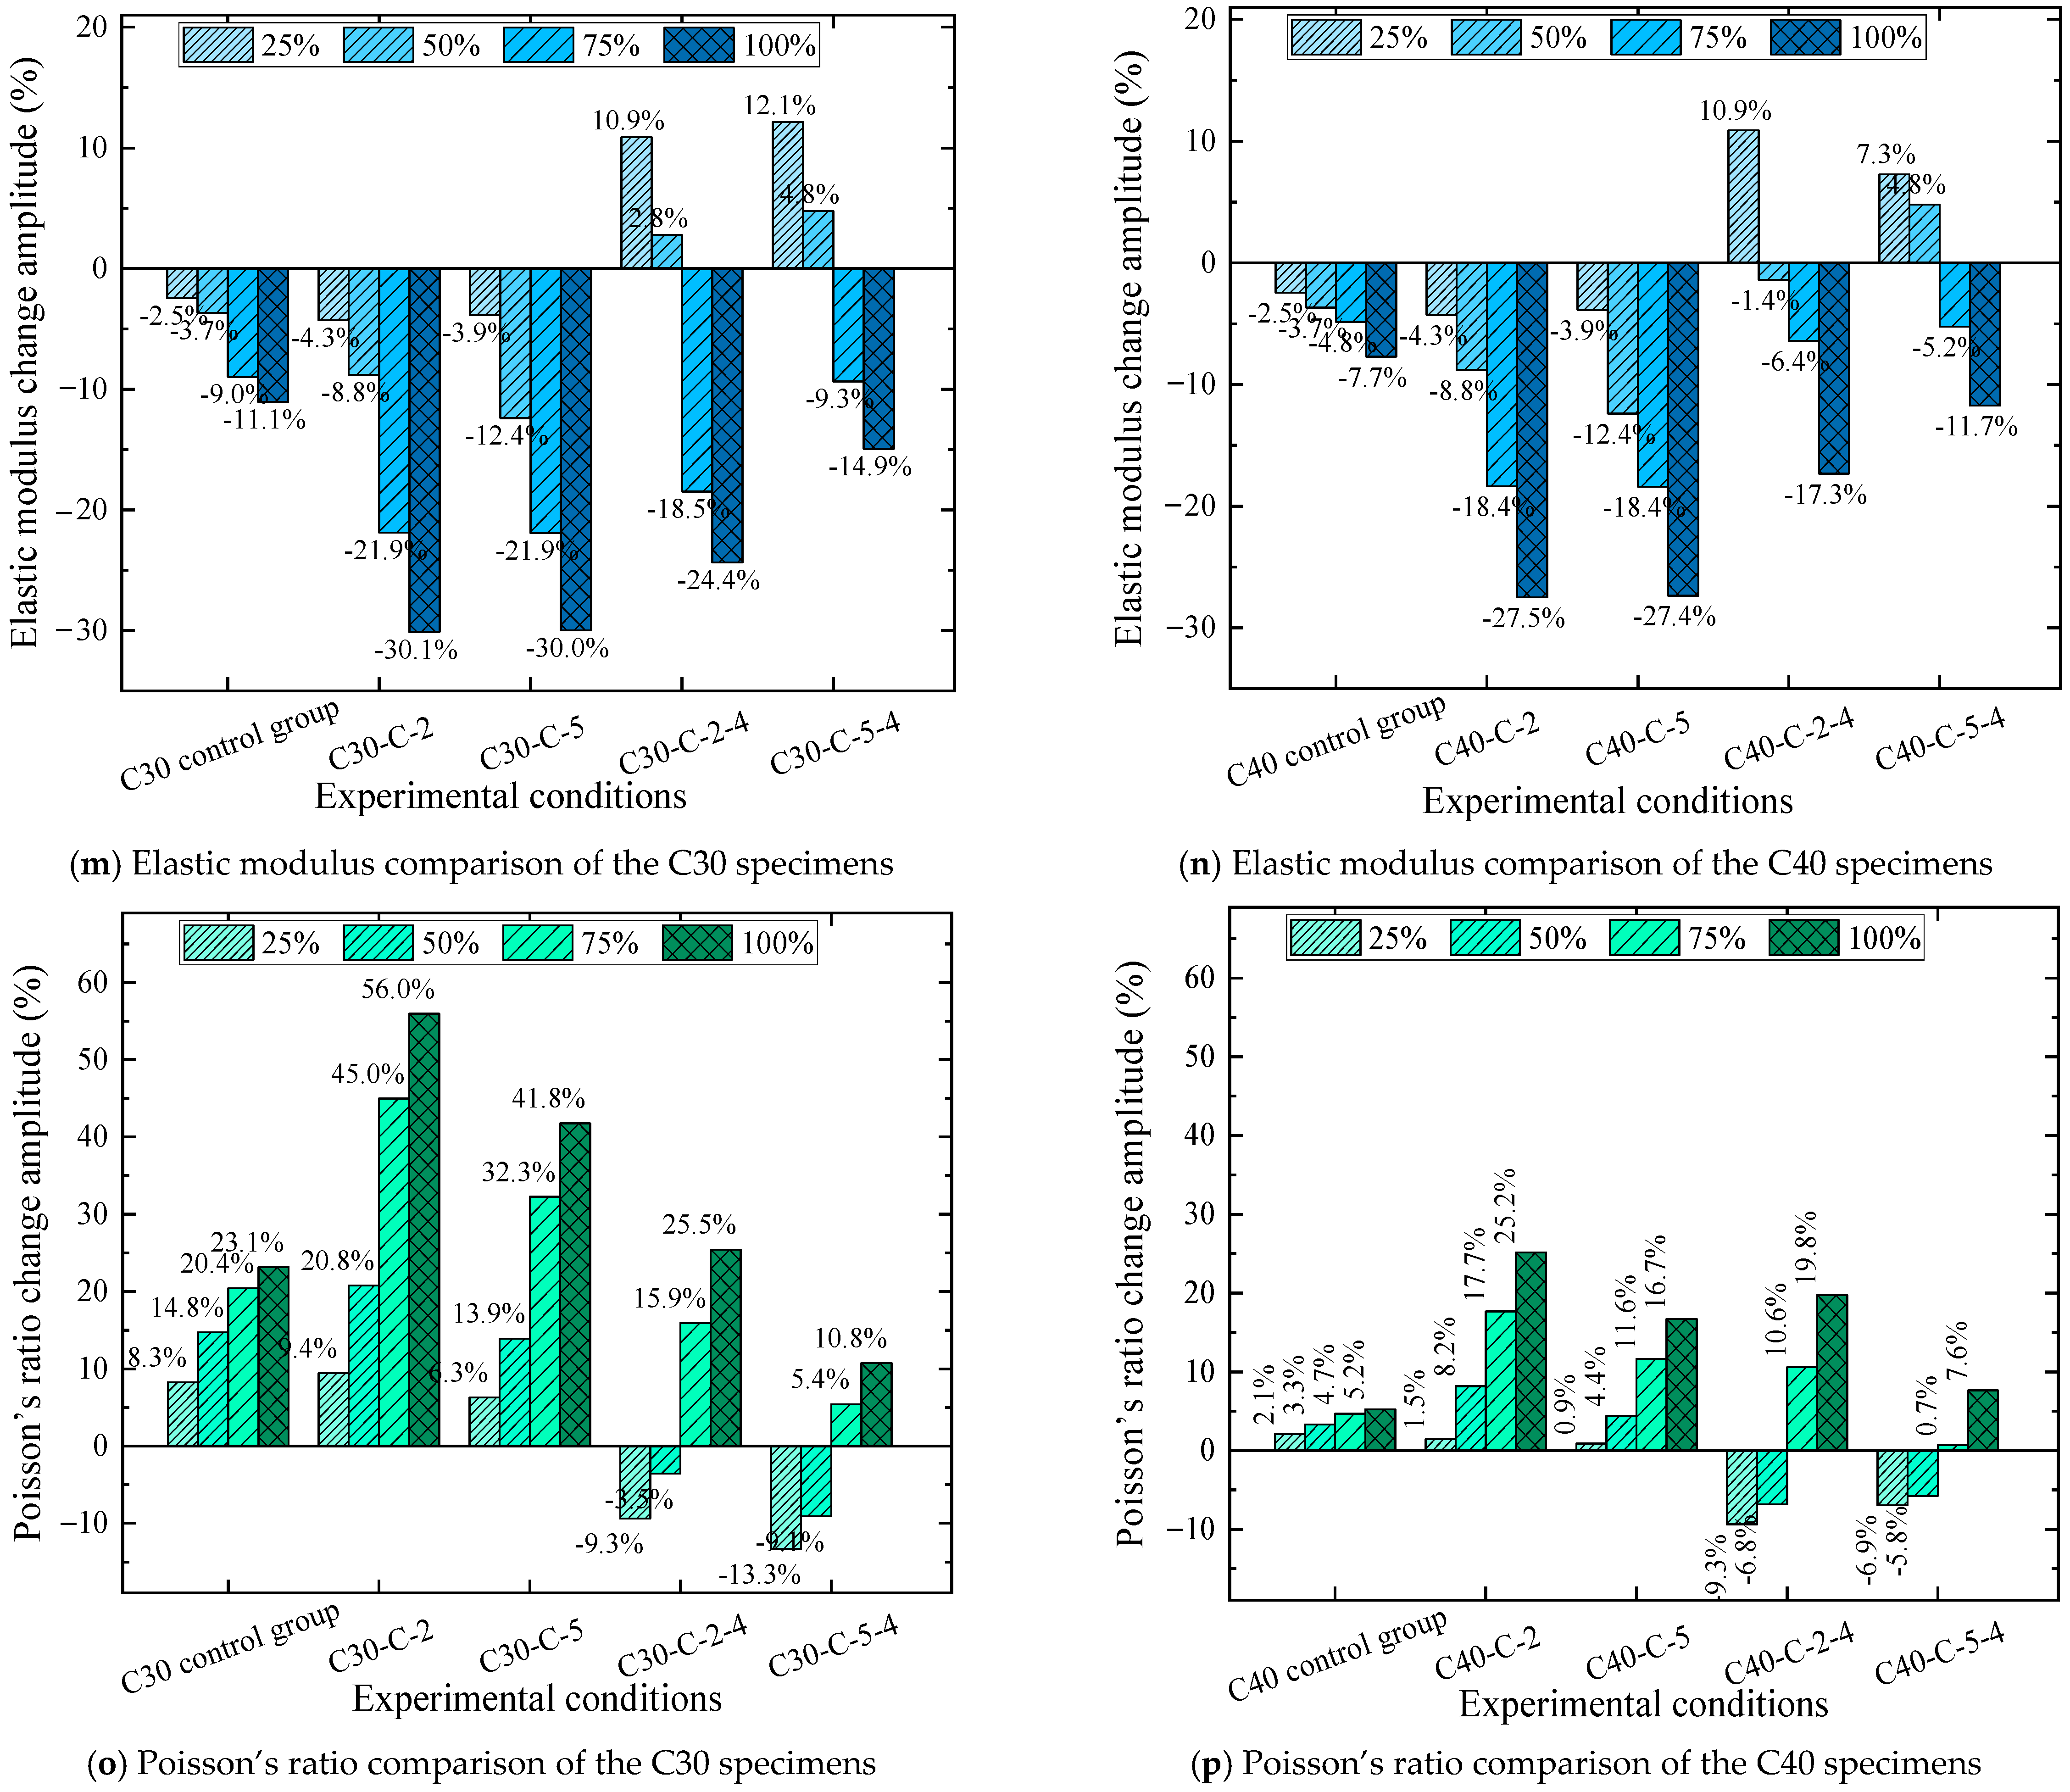
Figure 23, the axial compressive properties of C30 and C40 MT concrete short columns exhibit distinct dependencies on the MT replacement ratio, with critical turning-point behavior at 25% MT replacement under the coupled experiment conditions, with a trend distinct from other environments.
Across non-coupled conditions, as shown in
Figure 23a,b,i,j, peak stress generally decreases monotonically with increasing MT replacement ratio. However, a turning point emerges at 25% MT replacement, peak stress increases, then decreases progressively with further increases in replacement ratio. With the 25% MT group showing a maximum increase compared to the control group, demonstrating the excellent durability of the MT concrete. Peak stress was consistent with the weakening trend of other conditions but with a transient enhancement at 25% MT. Meanwhile, peak strain shows an inverse trend to peak stress, as shown in
Figure 23c,d,k,l, for non-coupled conditions, it increases monotonically with MT replacement. However, peak strain first decreases at 25% MT, then increases. From 0% to 25% MT, peak strain declines, reflecting transient brittleness reduction. Beyond 25% MT, peak strain rises progressively. With the 100% MT group showing a maximum increase compared to the control group, demonstrating greater ductility.
As shown in
Figure 23e,f,m,n, elastic modulus follows a trend aligned with peak stress. For non-coupled conditions, it declines steadily with rising MT content. In contrast, elastic modulus shows a pre-reduction increase at 25% MT, then decreases with higher replacement ratios. This transient stiffness enhancement at 25% MT is unique to the coupled high-temperature-corrosion environment. As shown in
Figure 23g,h,o,p, Poisson’s ratio displays condition-dependent variability. For non-coupled environments, it increases slightly with MT replacement. A turning point occurs at 25% MT, Poisson’s ratio decreases, then rises with further increases in replacement ratio. This trend mirrors peak strain, confirming transient reductions in lateral deformation.
In summary, compared with C30, C40 demonstrates superior mechanical properties, the unique turning-point behavior arises from the synergistic effect of MT’ micro-filling and polarization activity, fills internal pores, refines the interface transition zone between aggregates and cement paste, and promotes the formation of dense hydration products under thermal activation. Thus, transiently enhancing peak stress and elastic modulus, while reducing peak strain and Poisson’s ratio. It should be noted specifically that excessive MT (≥75%) disrupts the aggregate-cement paste skeleton. Fine MT particles occupy spaces originally reserved for cementitious binders, weakening interface bonding and matrix compactness. This leads to progressive reductions in peak stress/elastic modulus and increases in peak strain/Poisson’s ratio, consistent with the degradation trend observed in non-coupled conditions.