Article

Experimental Investigations on Cold-Cast Anchor Stay Cables Under Vehicle Impact

1
The Second Nanjing Yangtze Bridge Co., Ltd., Nanjing 210046, China
2
CCCC National Engineering Research Center of Long Highway Bridge Construction Co., Ltd., Beijing 100120, China
3
College of Civil Engineering, Nanjing Tech University, Nanjing 211816, China
*
Author to whom correspondence should be addressed.
Buildings 2026, 16(7), 1366; https://doi.org/10.3390/buildings16071366
Submission received: 4 March 2026 / Revised: 15 March 2026 / Accepted: 18 March 2026 / Published: 30 March 2026
(This article belongs to the Section Building Structures)

Abstract

Direct vehicle impacts on stay cables are less understood than vehicle–pier collisions, especially for anchorage damage and post-impact load transfer. This study investigates the dynamic responses of stay cables under vehicular impact through a combination of scaled physical tests. This test simulates real-world vehicle collision scenarios using an impact trolley. Two 1:5 inclined specimens (each a 19-wire galvanised steel bundle) were tested using a 1582 kg impact trolley travelling at 4.0 m/s in lateral and frontal conditions. Both tests showed a rapid rise in force to a dominant peak, followed by rebound oscillations and a long-tail decay, with no wire rupture. The lateral impact force peaked at around 241 kN at a displacement of approximately 230 mm. It then declined sharply while the deflection increased to around 268 mm, indicating that large deflections were governed by inertia. In contrast, the frontal impact force reached a maximum of almost 258 kN at a displacement of around 221 mm. However, it maintained higher post-peak forces, reaching approximately 106 kN at around 253 mm. This resulted in enhanced energy transfer. Maximum external work increased from about 20.7 kJ to about 25.2 kJ, and residual energy rose from about 25 percent to about 69 percent. Post-test inspection identified minor debonding near the anchorage exit as a vulnerability.

1. Introduction

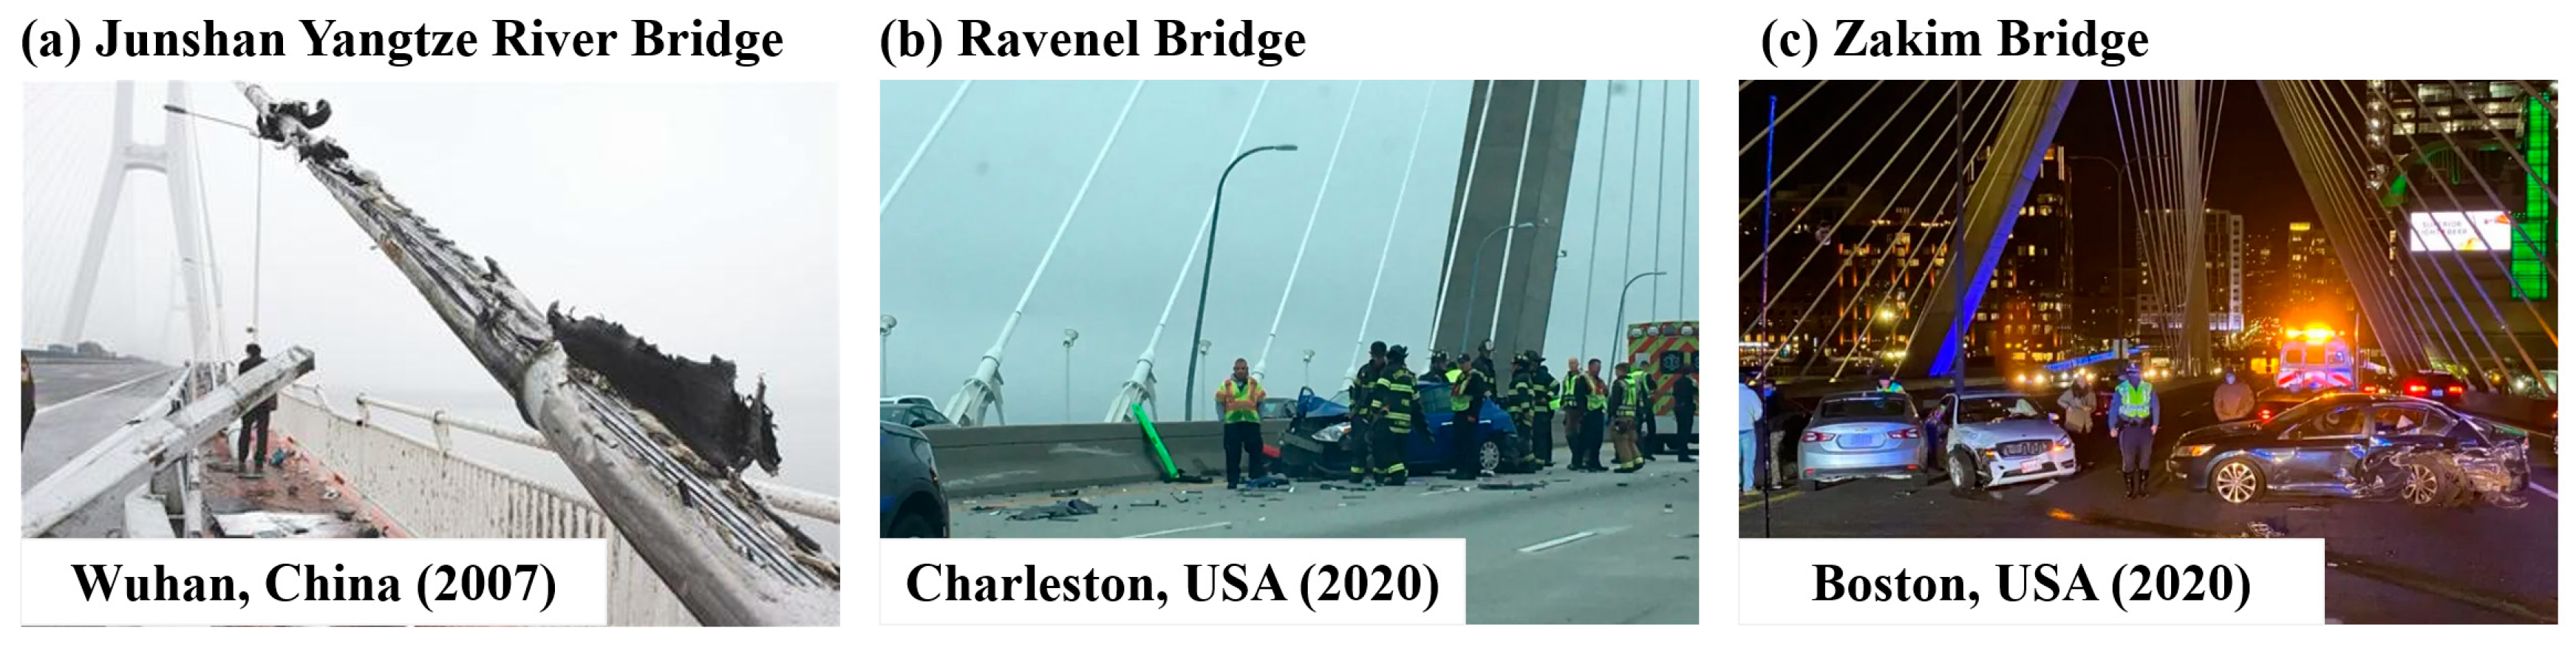
Cable-stayed bridges have become an essential pillar of modern infrastructure, celebrated for their outstanding span-to-weight ratio efficiency, architectural elegance, and adaptability for large-span applications. [1,2]. With the heavy-duty vehicle traffic continuing to grow, risks associated with vehicle collisions have become a prominent issue affecting the structural safety and normal service performance of cable-stayed bridges [3,4]. Among various structural components, stay cables play a critical role in bearing loads and maintaining the overall stiffness of bridges. However, due to their exposed installation location, they are highly susceptible to direct impact from vehicles [5]. In engineering practice, guardrails are designed and installed along bridge decks to withstand vehicle impacts and protect key structural elements of the bridge [6,7]. However, under high-energy impact loads, when the impact energy exceeds the system’s design load capacity, the crash barriers fail and cannot effectively stop the vehicle, leading to a direct collision between the vehicle and the stay cables. Multiple reports of on-site accidents involving cable-stayed bridges have documented instances where vehicles breached crash barriers and directly endangered the cable systems [8,9,10], as illustrated in Figure 1. These incidents demonstrate that, although vehicle–cable collisions are rare, they can have significant and irreversible adverse effects on the structural integrity of bridges and road traffic safety. This constitutes a serious threat to structural safety and operational security [11].
In bridge engineering practice, the vast majority of research efforts have focused on analyzing the impact effects of vehicles on bridge piers and the associated damage mechanisms [12,13,14]. Most existing studies employ theoretical analysis [15], experimental research [16], and numerical simulation [17] to calculate impact forces, characterize component damage patterns, and evaluate the residual load-bearing capacity of structures post-impact [18]. Accurate estimation of impact forces is crucial for assessing structural damage. Research on vehicle collisions with bridge piers has become increasingly abundant. However, studies targeting the superstructure of cable-stayed bridges, particularly the direct collision resistance of stay cables, remain relatively scarce. Currently, research on cable-stayed structures primarily focuses on long-term durability under physicochemical degradation effects such as thermal effects, UV aging, and corrosion fatigue, as well as conventional extreme loads including earthquakes, strong winds, floods, and ship impacts. For instance, studies by Liu et al., Yang et al. and Zhou et al. focused on corrosion-induced damage to cable-stayed bridge cables and their consequences. They respectively investigated the influence of external environments on the differential deflection characteristics of main girders, the evolution patterns of pitting corrosion, the distribution characteristics of corrosion on cable cross-sections, and the accelerated degradation mechanism resulting from the synergistic effects of loading and corrosion [19,20,21]. Wang et al. focused their research on damage to HDPE sheaths of bridge cables induced by ultraviolet radiation, chlorides, and temperature. They investigated the resulting consequences, such as reductions in yield strength and elastic modulus, and the effect of different exposure sequences and temperatures on patterns [22]. Research by Kurino et al. focuses on damage to seismic isolation highway bridges caused by earthquakes and the aging of lead-core rubber bearings. It investigates the resulting degradation of bearing performance, damage to main girders and piers, and the mitigating effect of cable restraints on damage and response uncertainty [23]. It is evident that mature research findings have been established regarding the failure mechanisms of suspension cables under seismic, fatigue, and corrosion effects. However, studies on the dynamic response and damage of suspension cables subjected to vehicle impact loads remain relatively scarce.
In recent years, some scholars have started investigating the impact of cable failure under dynamic loading [24,25,26]. As an example, Mozos et al. conducted a detailed parametric analysis of cable failures in cable-stayed bridges, elucidating the influence of cable arrangement and main girder stiffness on the overall structural stability [27]. Giraldo-Isza et al. employed a progressive damage model in LS-DYNA to simulate collisions between vessels and bridge towers, but their study did not account for direct vehicle impacts on stay cables [28]. Hoang et al. investigated ship collision scenarios and observed chain-reaction failures in stay cables, highlighting the role of structural redundancy in enhancing a bridge’s disaster resilience [29]. Meanwhile, Wang et al. focused on the impact performance of fiber-reinforced polymer (FRP) composites and cables, analyzing key influencing factors such as impact energy, pre-tension, and cable configuration. They explored the significant differences in their impact resistance, damage mechanisms, and static properties [11]. Fang et al. focused on CFRP cable protection sheaths in three bonding states, investigating the optimal impact resistance of semi-fixed sheaths through drop-weight tests [30]. Yang et al. focused on the nonlinear coupled vibration characteristics of BFRP cables in long-span cable-stayed bridges under parametric excitation. Through model establishment and analysis, they discovered that the vibration response outperforms that of conventional steel cables, providing a basis for vibration control [31]. Despite the aforementioned progress, most existing impact studies employ simplified loading methods that are highly sensitive to contact conditions and boundary constraints [32,33], making them difficult to apply to real-world vehicle collision scenarios. Therefore, these simplifications result in research findings that are insufficiently representative of vehicle-induced horizontal impacts. Specifically, the stress behavior of anchor zones under controlled horizontal impacts has not been sufficiently studied, yet it is here that delamination, slippage, and the gradual degradation of load-transfer capacity often occur first.
To address this research gap, this study proposes the following core hypothesis: the direction of impact (lateral vs. frontal) significantly influences the energy dissipation mechanisms and damage evolution pathways of the cable. Specifically, because frontal impacts involve longer contact duration and stronger contact coupling, they lead to more extensive development of irreversible energy dissipation mechanisms—such as frictional sliding and plastic deformation—resulting in more severe damage accumulation; in contrast, lateral impacts are dominated by elastic rebound, leading to relatively milder damage. To verify this hypothesis, this study conducted scaled horizontal impact tests on inclined cable specimens equipped with cold-cast anchorage systems to simulate the effects of vehicle collisions on cable stays. Under controlled conditions, the tests systematically varied key parameters such as impact velocity and impact location, comprehensively recording the transient response and damage evolution throughout the entire impact process, with a focus on interface delamination and slippage behavior in the anchorage zone, as well as the associated failure characteristics and energy dissipation mechanisms. Through a comparative analysis of force responses, displacement development, energy distribution, and damage morphology under lateral and frontal impact conditions, this study provides systematic experimental evidence to elucidate the mechanisms of impact-induced anchorage damage. The research findings can establish reasonable evaluation criteria for cable-stayed systems subjected to vehicle impacts and provide scientific support for the development of effective protective measures.

2. Experimental Program

2.1. Test Specimen

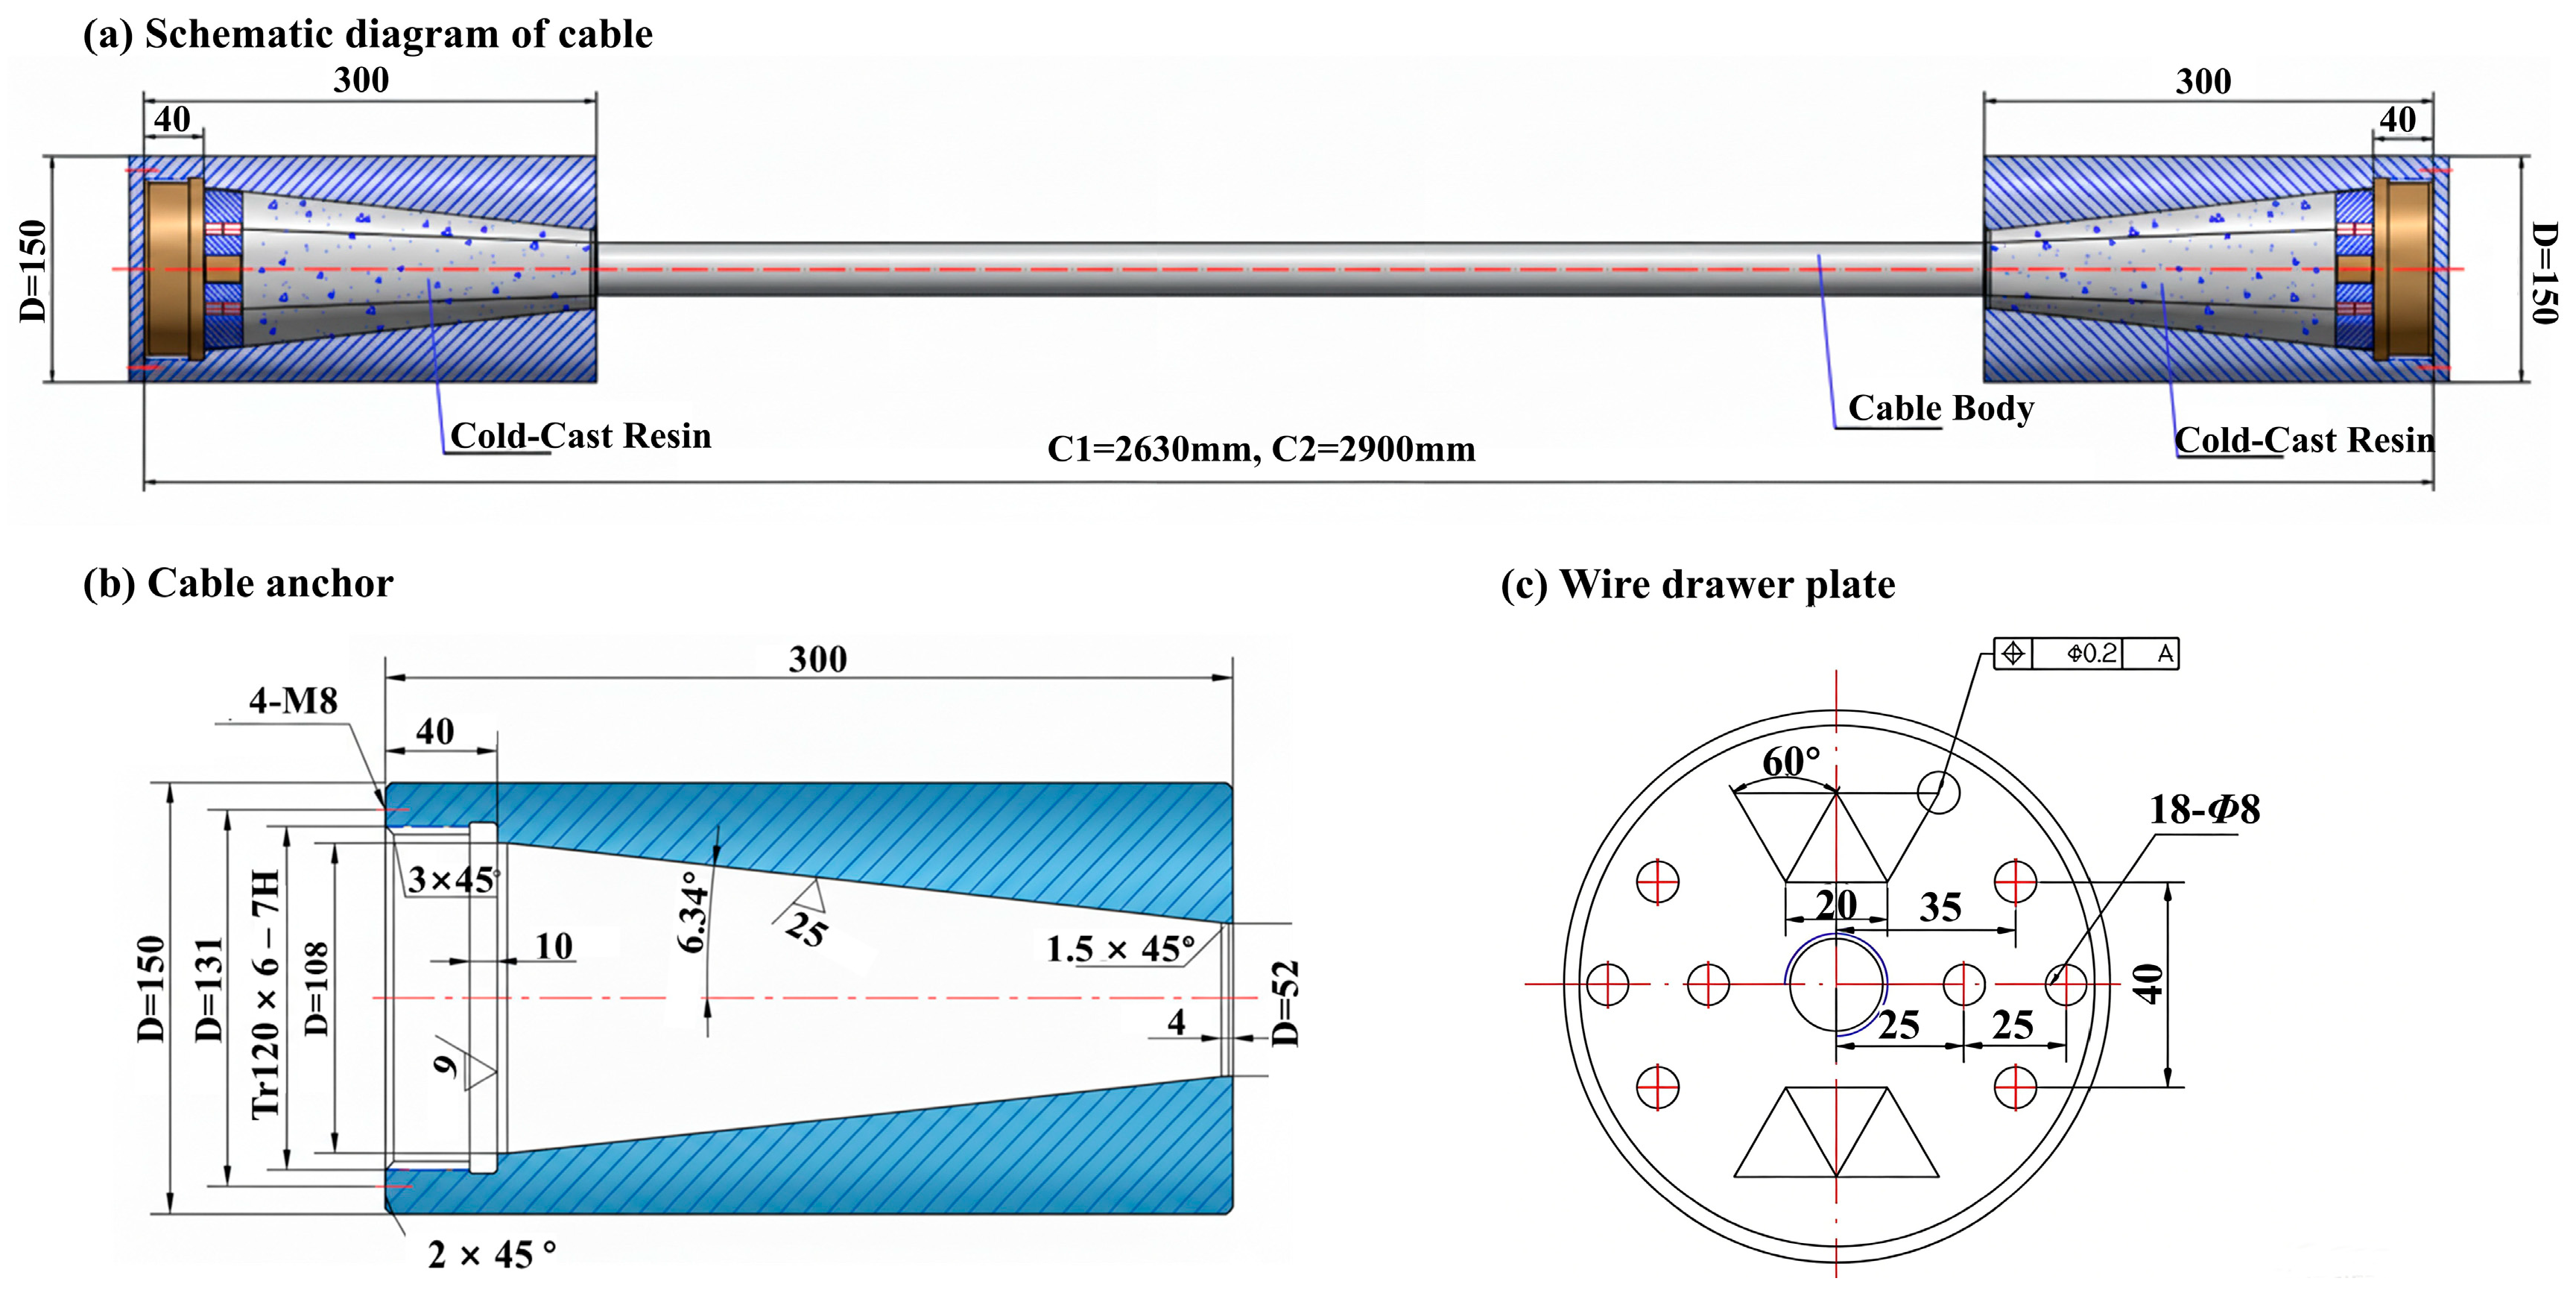
Figure 2 shows two 1:5 scaled stay-cable specimens that were fabricated by Shanghai Pujiang Rope Co., Ltd., Shanghai, China. Each specimen consisted of 19 galvanized, high-strength, low-relaxation steel wires, each 7 mm in diameter, with a nominal strength of 1670 MPa. The assembled bundle had a nominal diameter of 35 mm, a total cross-sectional area of 731 mm2, and a standard breaking load of 1147 kN. Anchorage assemblies were installed at both ends using anchorage-type anchorages. The anchor cups were cast with an epoxy–resin composite containing iron sand and mineral powder, along with a curing agent and a toughening agent. This cast body provided a reliable bond between the cable and the anchorage. Based on existing research, the mechanical properties of the cold-cast epoxy grout discussed in this paper are derived from the finite element model established by Wu et al. [34] and the experimental data reported by Michels et al. [35], with a modulus of elasticity of approximately 5–8 GPa; the bond strength at the anchorage start point is approximately 6.61 MPa; No specific studies on the compressive strength of cold-cast epoxy composite anchoring materials have been identified in the existing literature; however, the performance characteristics of similar epoxy composite materials may serve as a reference. The measured tensile strength of commercial cold-curing epoxy resins ranges from 12–37 MPa [35], whilst the compressive strength of anchoring materials containing iron sand fillers is typically significantly higher than their tensile strength due to the filling effect. Combining this with findings from research on carbon fibre composite reinforcement anchoring, which indicate a strength retention rate of approximately 78.87% following high-temperature curing of cold-cast fillers [36], it can be tentatively inferred that the compressive strength of this material is approximately 80–120 MPa. The specimen lengths were 2630 mm and 2900 mm. For each specimen, the two end anchorages had a combined length of 300 mm, and the effective anchorage length was 260 mm.

2.2. Anchorage Connection Device

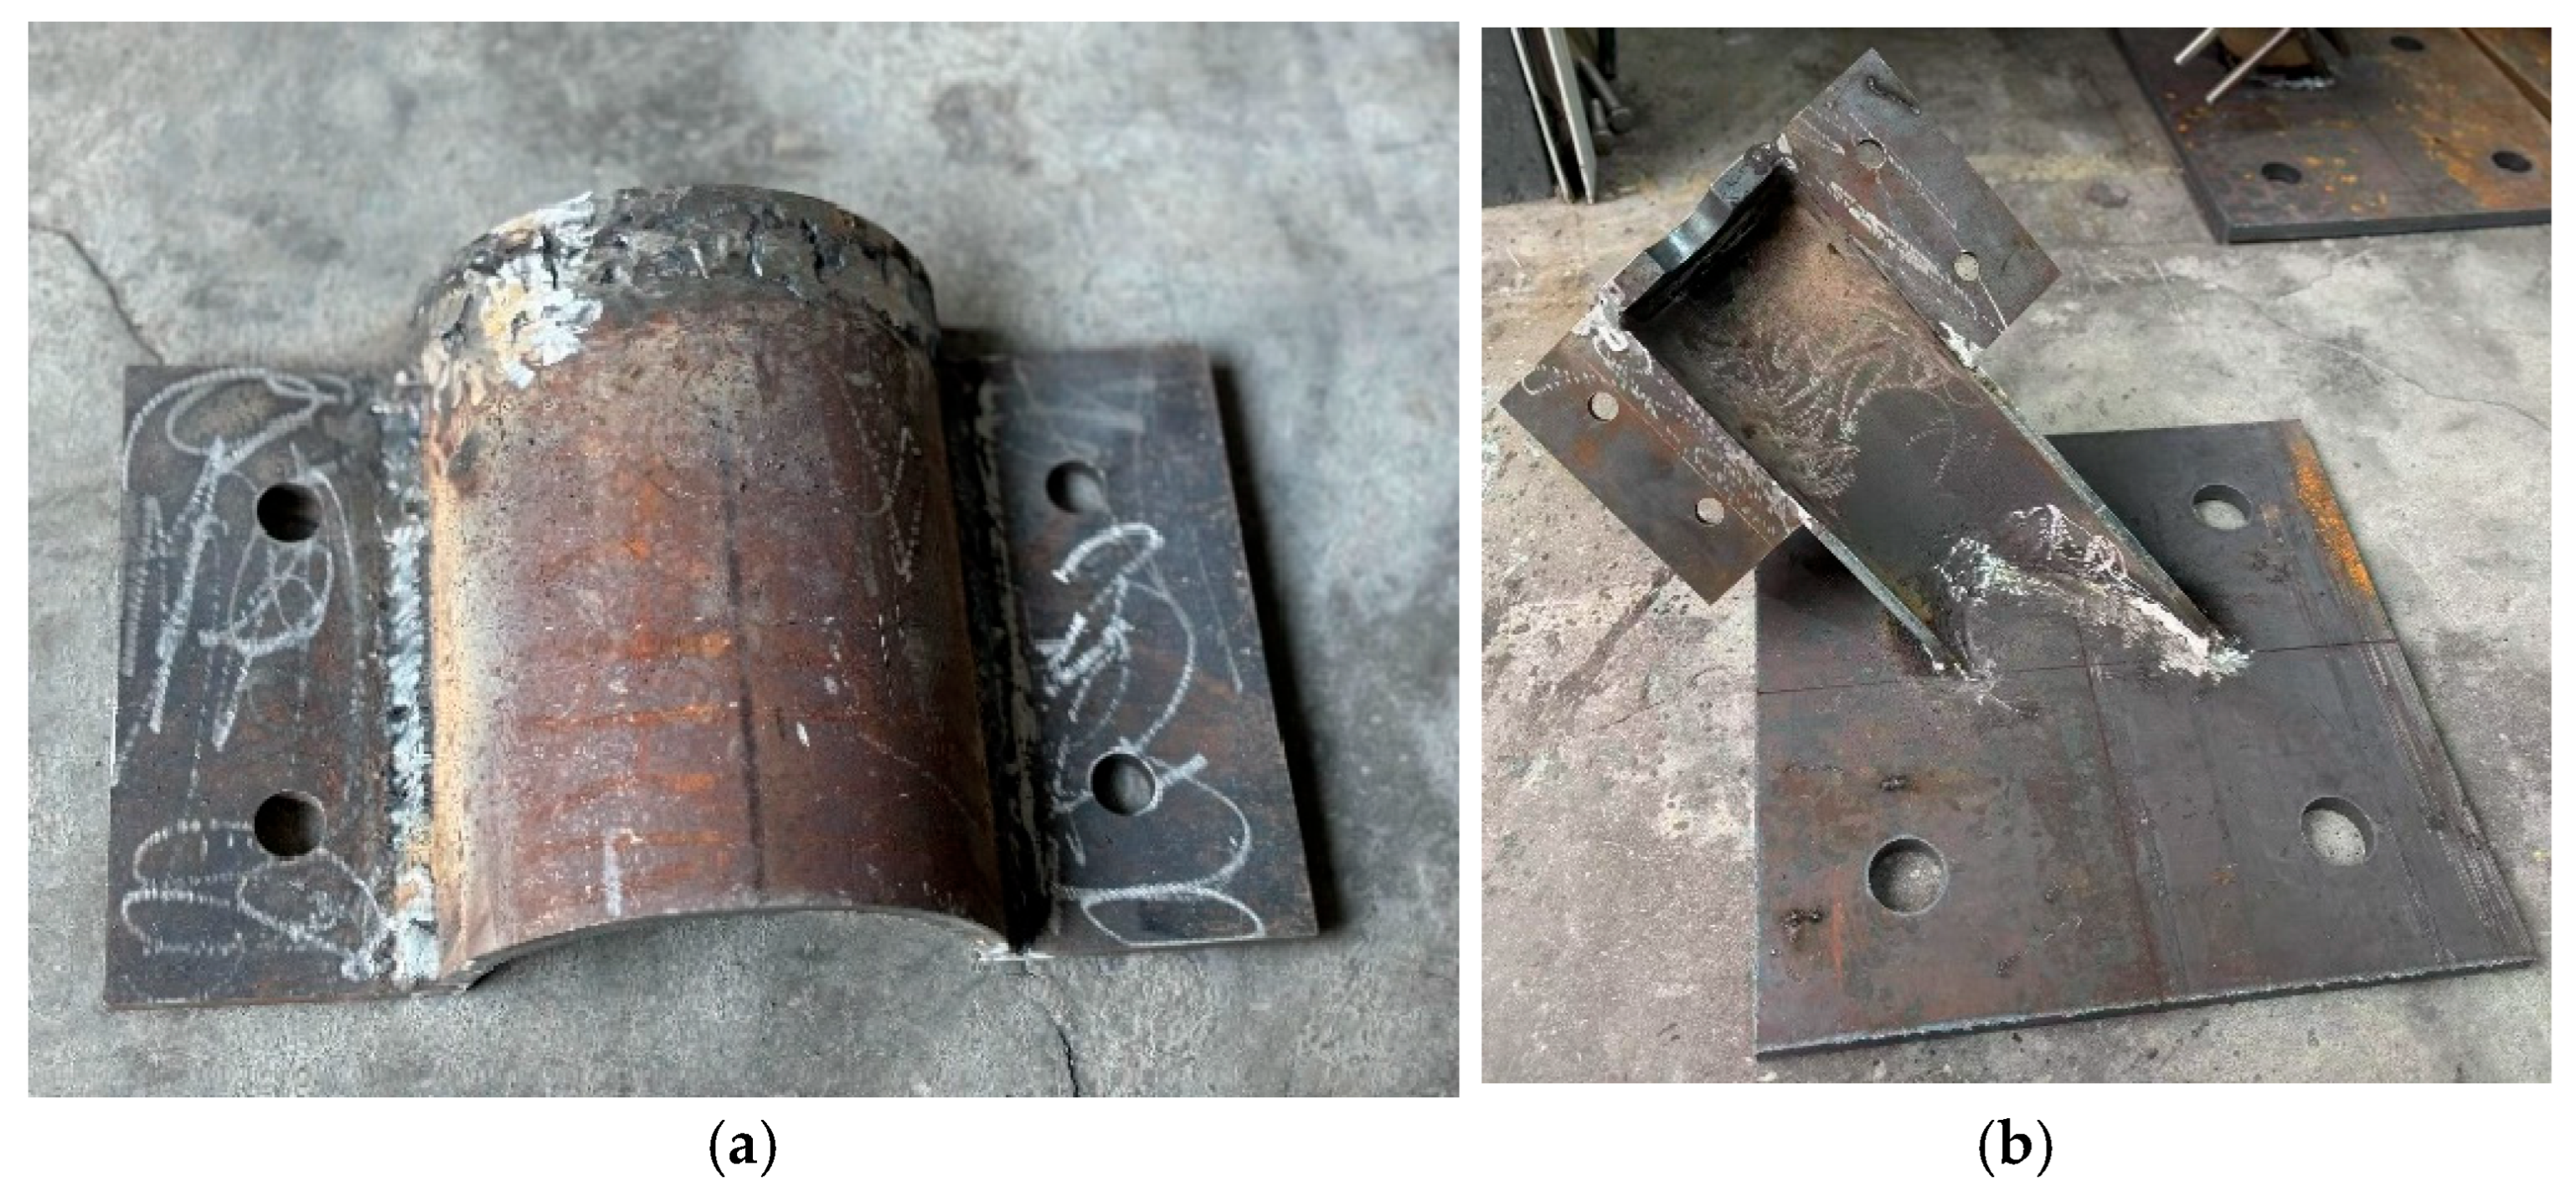
To ensure reliable force transfer between the laboratory reaction wall and the loading bearing block, this study developed a modular combined anchorage–connection device, as shown in Figure 3. The device was manufactured from Q345 low-alloy steel through welding and casting and comprised two components, namely a precision-machined anchorage base and a detachable cover plate. The base was assembled from standardized parts, including a square base plate 20 mm thick, an arc-shaped guiding segment with a 75 mm radius, and a rectangular lug plate 10 mm thick. The cover plate incorporated an arc-shaped guiding segment with a radius of 75 mm and a 10 mm thick rectangular lug plate. The anchoring procedure comprised three steps. First, the base was rigidly connected to the reaction wall and the bearing block using high-strength bolts. Second, the anchored end of the stay cable was seated in the arc-shaped guiding segment and adjusted to the required inclination angle. Third, the cover plate was bolted to the base to clamp the cable end, thereby restraining the anchorage segment against translation and rotation in all directions.

2.3. Test Setup and Procedure

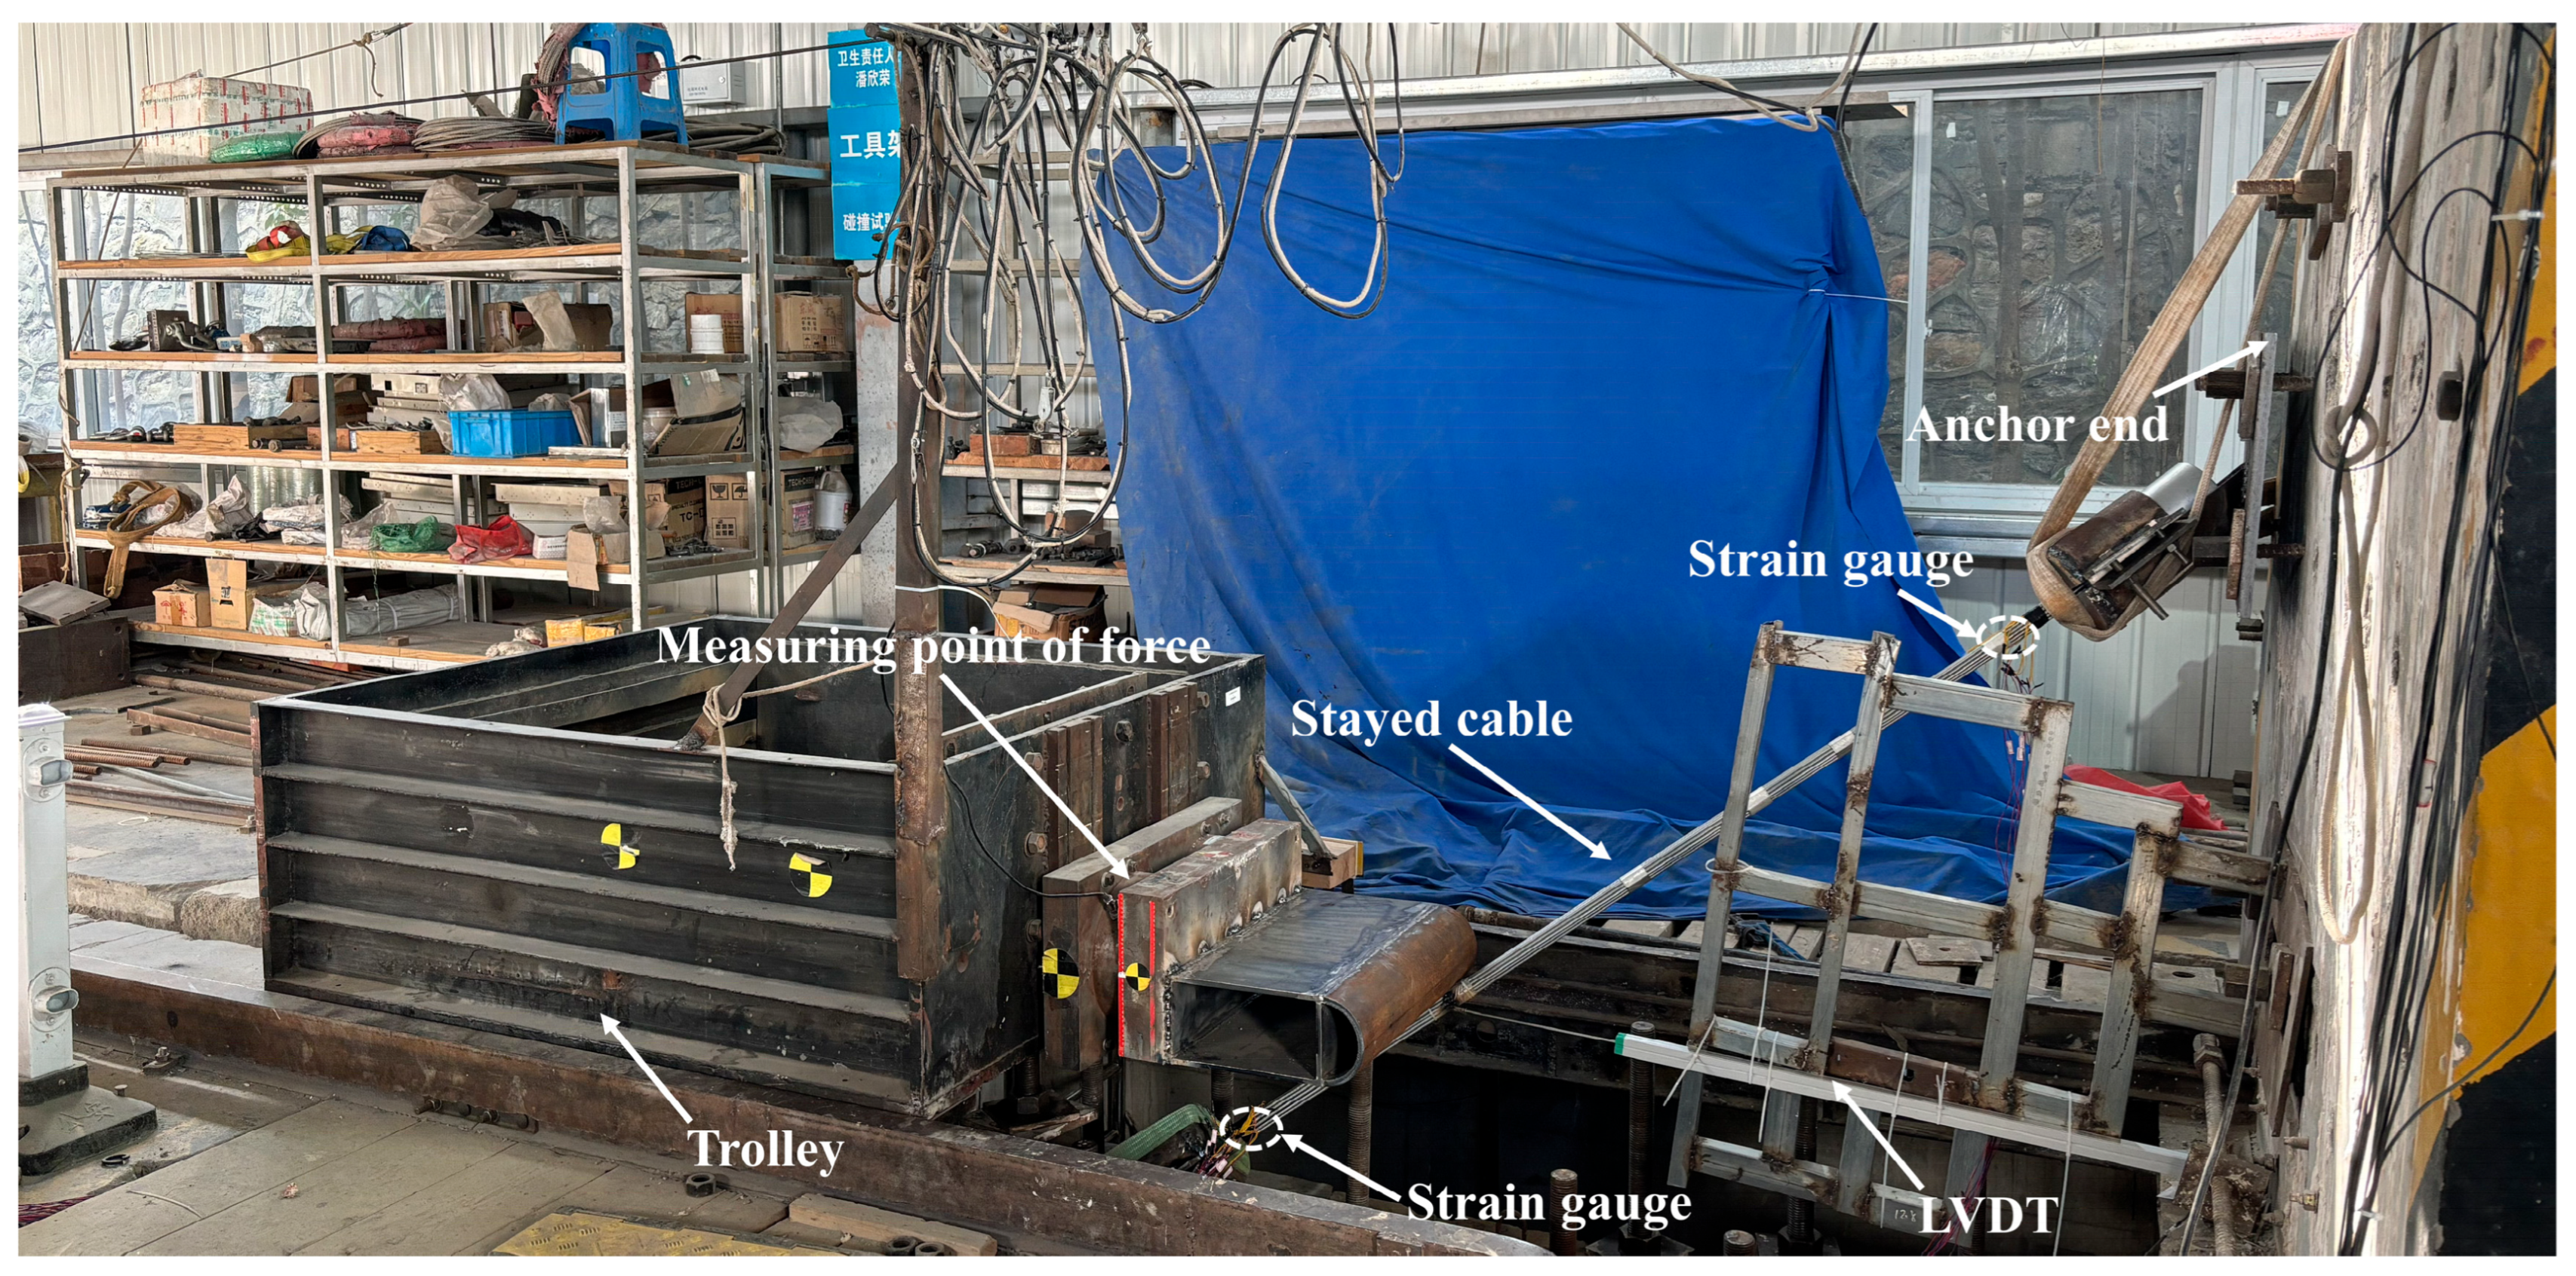
As shown in Figure 4, horizontal impact tests were performed in the Impact Testing Laboratory at Nanjing Tech University. The impact trolley had a mass of 1582 kg, and the hammer head had a mass of 55 kg. The target impact velocity of the impact trolley was 4.0 m/s. To reduce local stress concentration caused by direct contact between the impact trolley body and the stay cable, a dedicated impact-nose assembly was developed for these tests. The assembly was fabricated from 10 mm thick Q345B steel plates and rigidly welded to the front of the impact trolley using continuous fillet welds. The nose provided an arc-shaped guiding surface with a curvature radius of 80 mm to promote stress redistribution upon contact with the cable. The anchored end of the cable was fixed to the reaction wall, and the tensioning end was anchored to a concrete ground block. The impact point was set at the lower one-eighth of the cable length by adjusting the anchorage positions.
The selection of this location was based on the following considerations: (i) its proximity to the anchorage zone, which is the key area of focus in this study regarding impact-induced debonding and slippage; (ii) the lower cable, which is subject to anchorage constraints and experiences greater bending moments and shear forces during impact, making it a critical area for damage assessment; (iii) fixing this location ensures comparability between the two test conditions (C1 and C2). Post-test observations confirmed that this location successfully induced observable anchorage damage, validating its suitability as a representative impact location.

2.4. Instruments and Monitoring

To comprehensively capture the stress behavior of the anchorage zone under impact loads, this study installed strain gauges circumferentially along the anchorage zones at both ends of the cable to record the dynamic strain response; reference points were pre-established at the anchorage ends, and a high-speed camera system combined with digital image correlation technology was employed to track the relative slippage between the cable and the cold-cast grout throughout the entire process; and the interface separation distance was measured using a Vernier caliper before and after the impact to quantify residual damage.

3. Experimental Results and Analysis

3.1. Impact Process

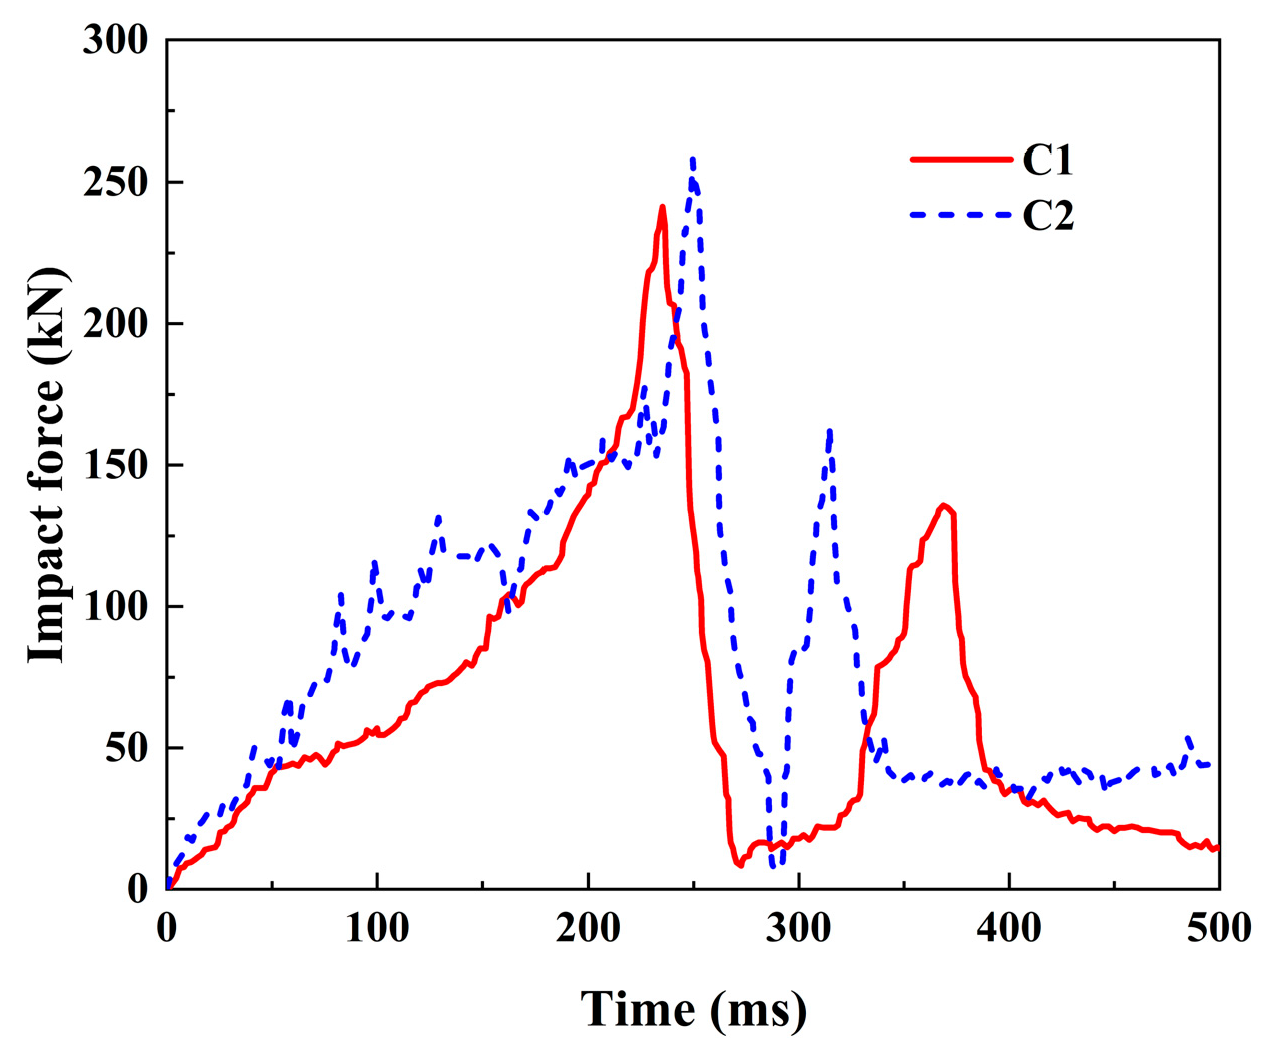
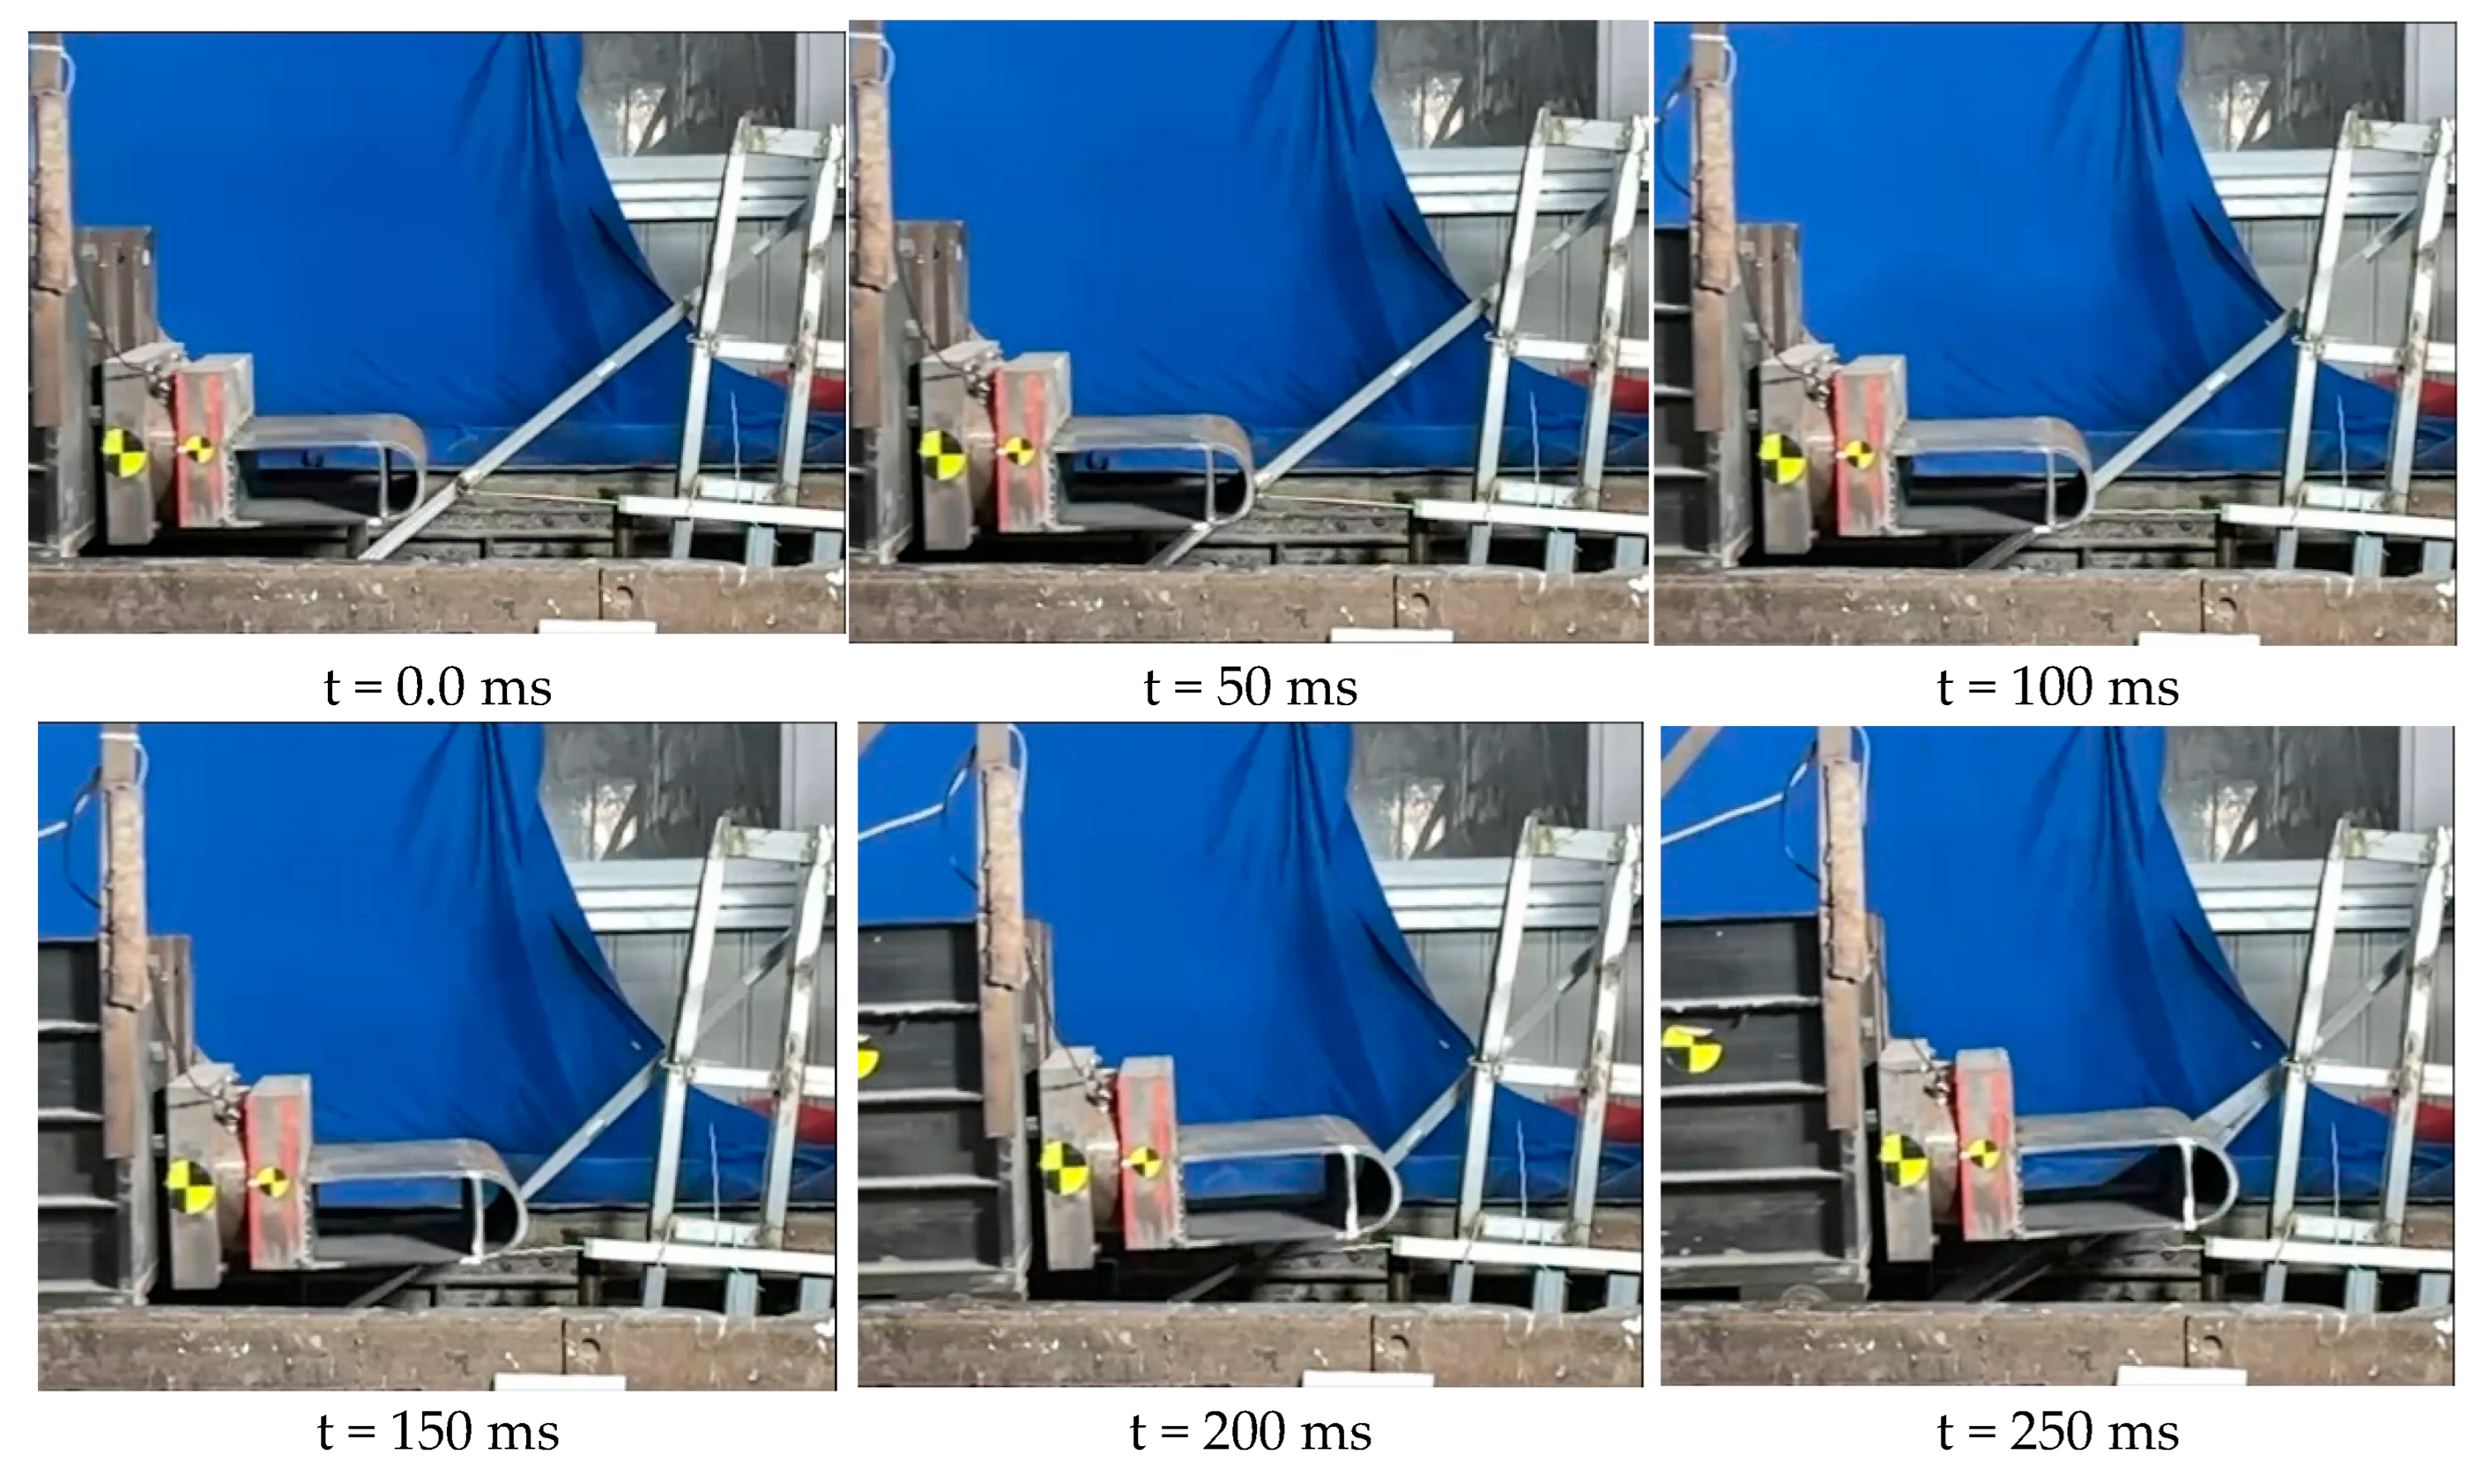
As shown in Figure 5, both specimens showed a characteristic transverse impact response. The impact force rose sharply to a peak within a short time, then entered a post-peak stage with oscillation and rebound, and finally transitioned into a slowly decaying long-tail phase. The two cases differed mainly in contact duration and in the dominant mechanisms after the peak. Under the C1 condition, the force reached its peak earlier, whereas the displacement peak occurred much later. This trend indicates that the continued growth of displacement after the force peak was governed primarily by inertia, with additional influence from geometric nonlinearity associated with large deflection. The strain peak appeared before the force peak, implying that transverse impact tends to trigger early strain localization due to the combined effects of local bending and compression.
By contrast, during frontal impact, the peaks occurred slightly later, and the loading was sustained for a longer period. The force remained at a relatively high level when the displacement reached its peak. This indicates stronger contact interaction and a longer effective contact duration. This loading feature promotes the continued activation of energy-dissipation mechanisms. In addition, the strain peak under frontal impact occurred after the force peak. This trend suggests that strain localization developed more gradually, after global deformation had formed and the contact region had expanded, aided by relative slip within the wire bundle and the associated stress redistribution.
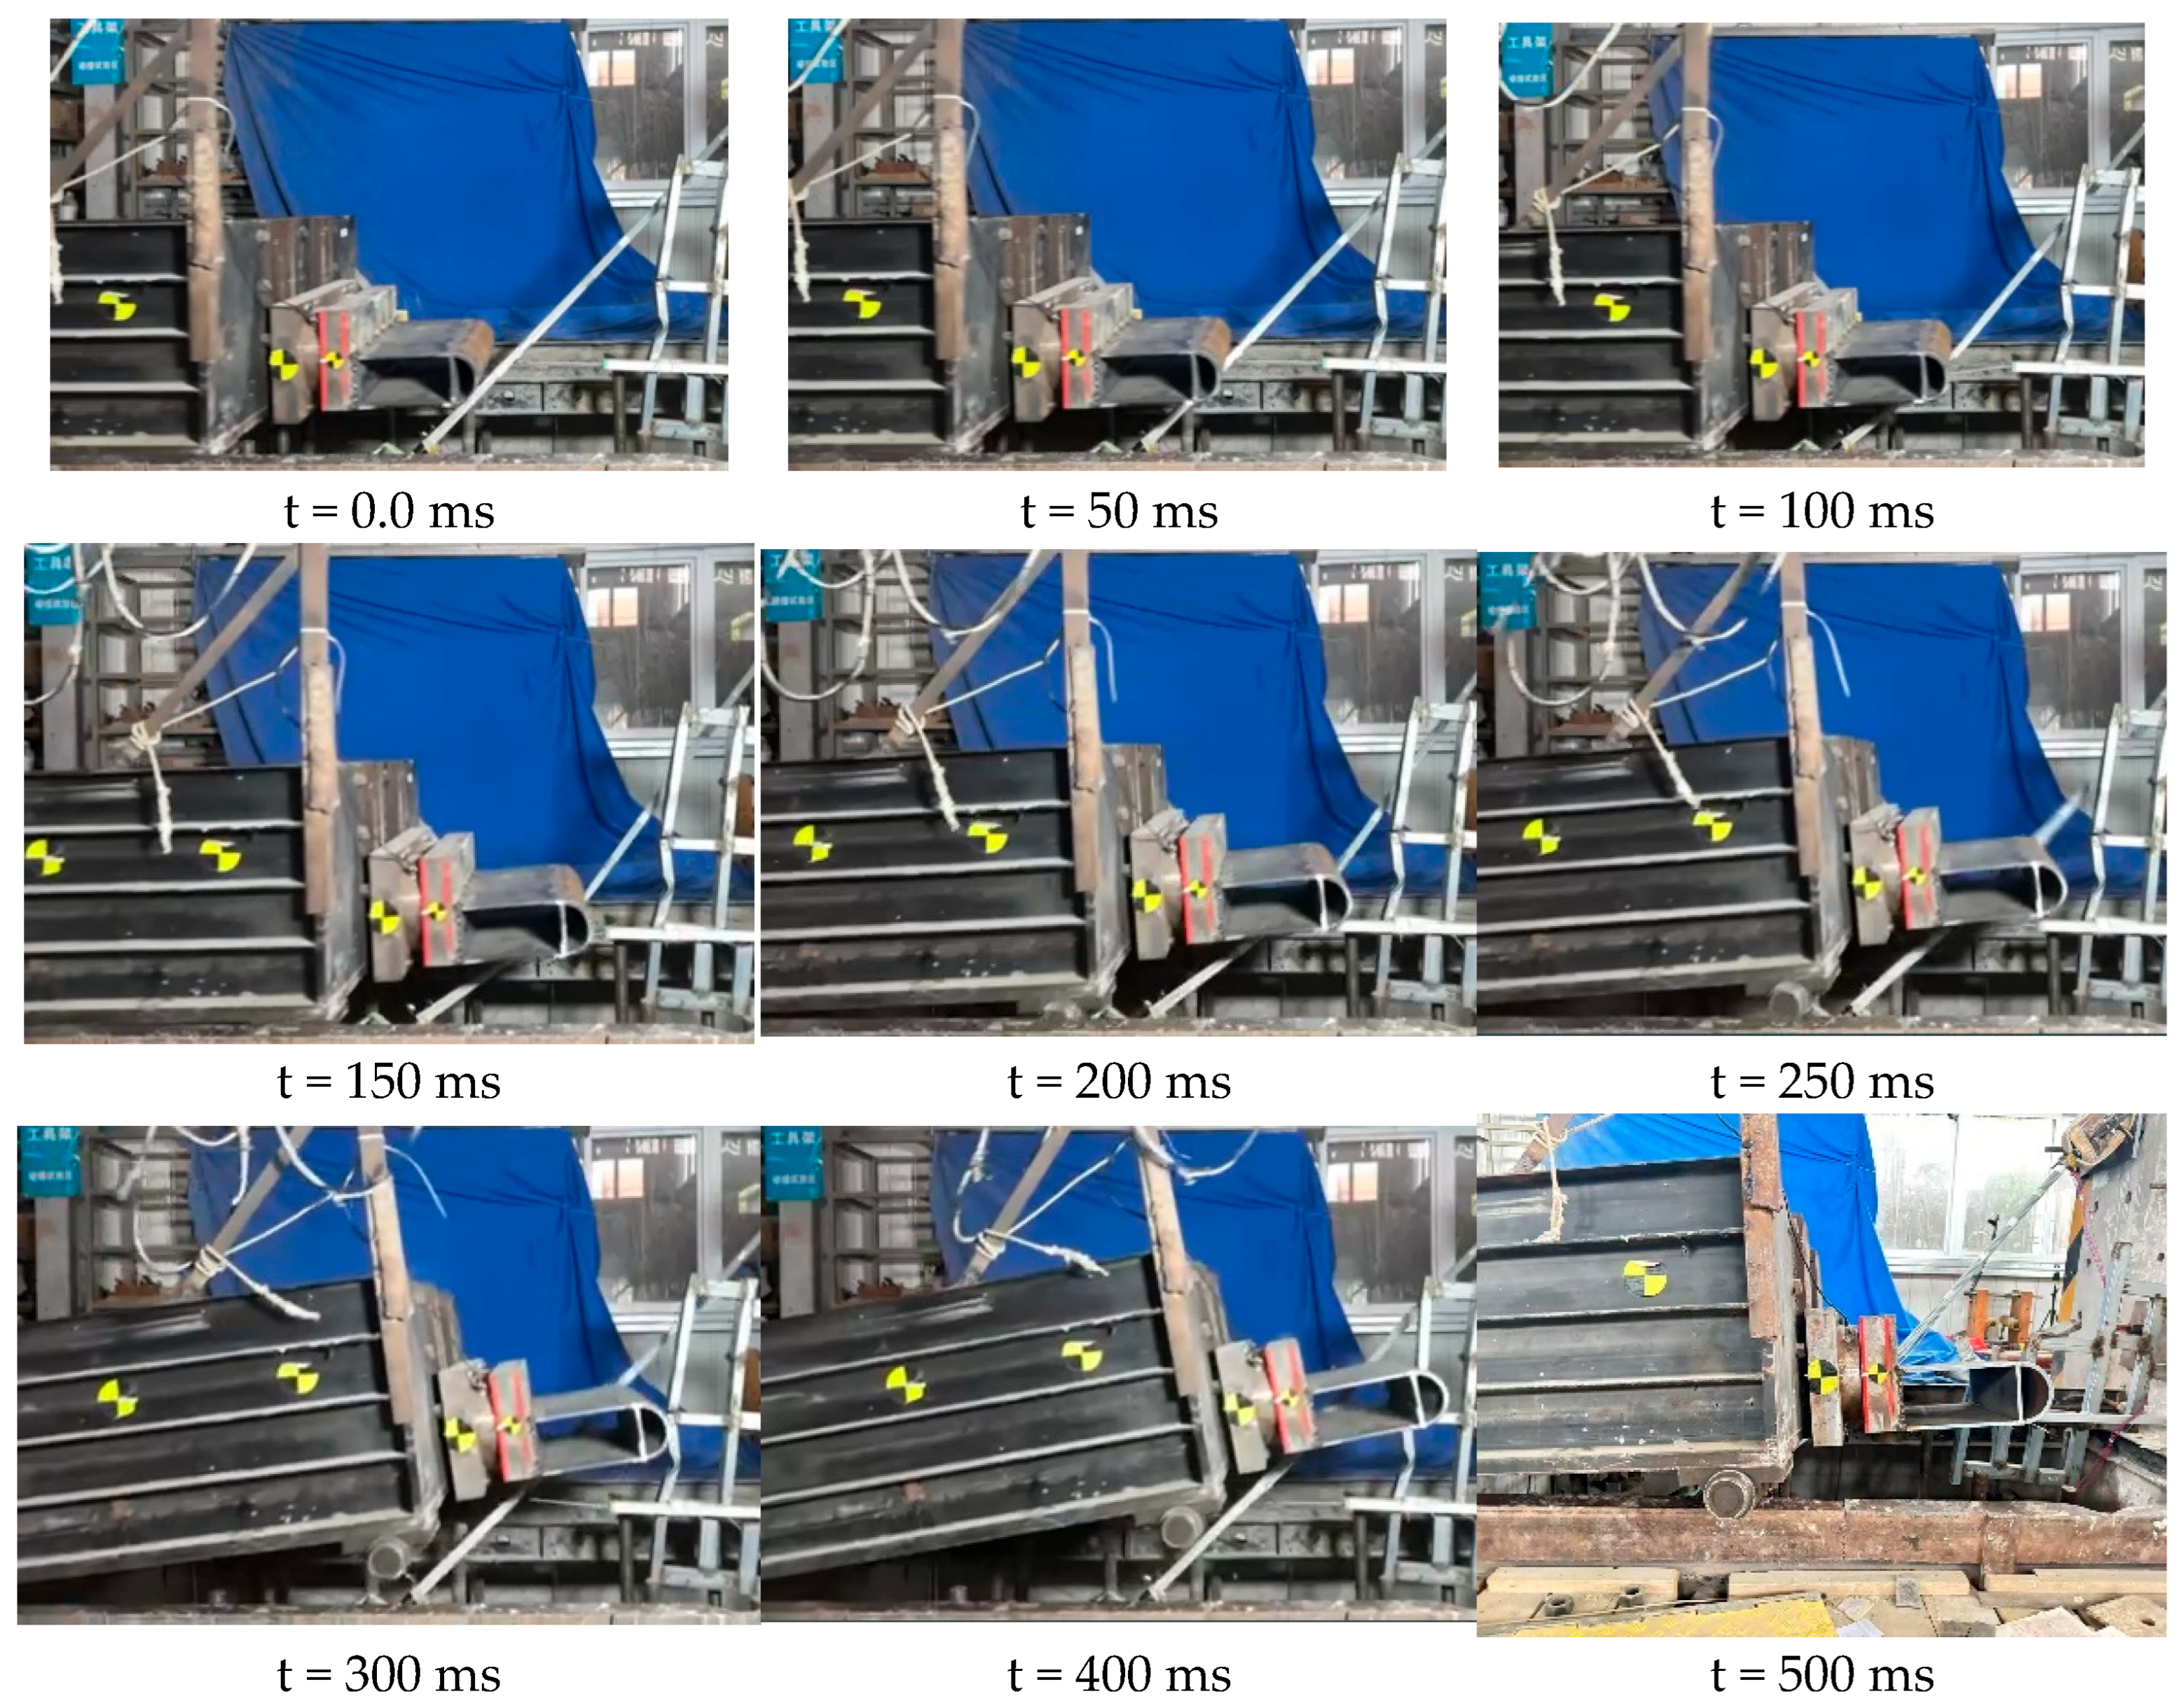
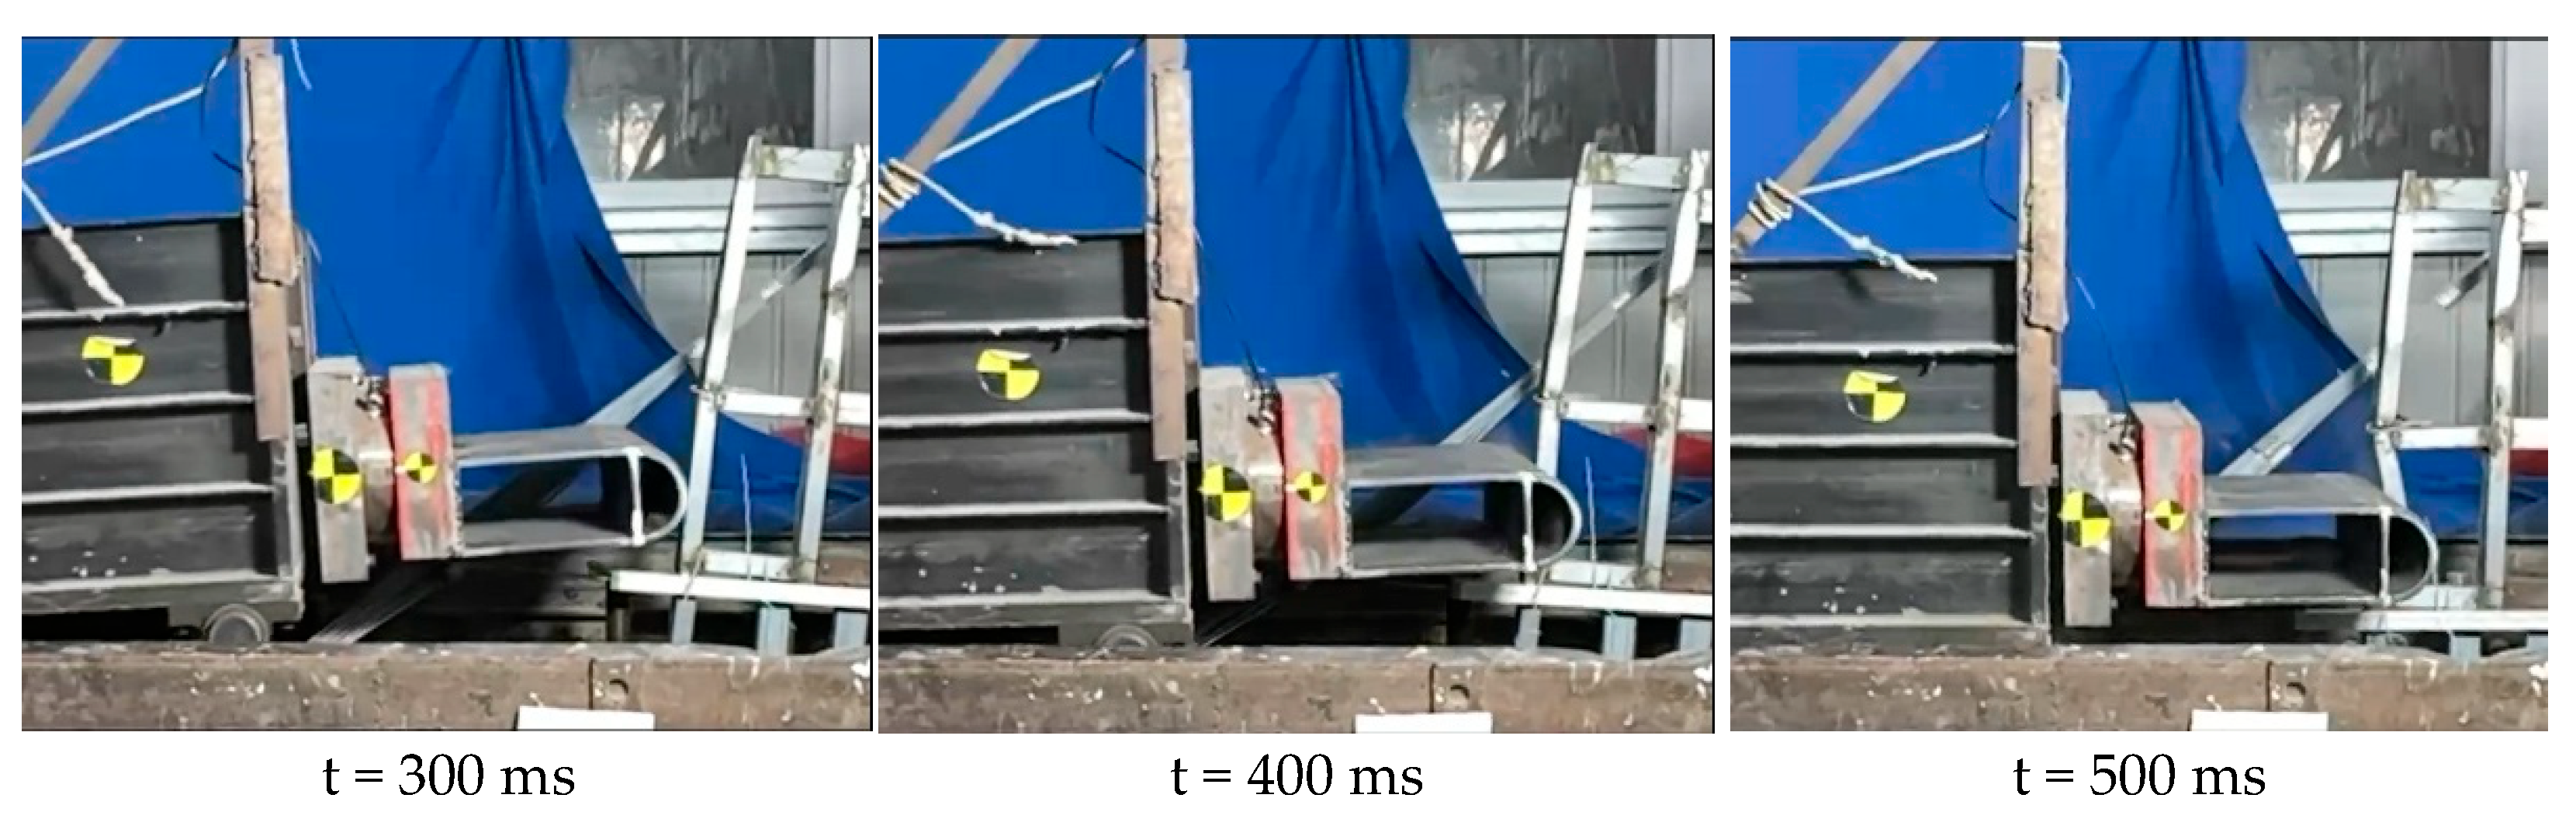
For C1, the impact trolley completed most of the momentum transfer within a very short time and decelerated sharply. It then underwent a brief upward climbing motion driven by the cable reaction. Contact was lost at about 300 ms, and derailment occurred. As shown in Figure 6, C2 displayed a more pronounced climbing process. After the initial deceleration, the impact trolley continued to move upward along the cable. The eccentric cable reaction generated an overturning moment that progressively increased the rollover tendency, ultimately causing clear trajectory instability and rail deviation after roughly 300 ms.
So, in this study, the impact process is said to have three stages:
  • Phase I: Initial Contact and Force Rise Phase.
This phase begins with the initial contact between the impactor and the cable. The impact force rises rapidly to its peak within approximately 0–50 ms. During this phase, localized deformation occurs in the contact area of the cable, and the momentum transferred from the impactor to the cable is highly concentrated. The force peak for C1 occurs at approximately 30 ms, while the force peak for C2 occurs at approximately 40 ms, indicating that the contact duration is longer in a head-on collision. The energy absorbed during this phase primarily comes from the kinetic energy transferred by the impactor, which is stored in the cable as elastic deformation energy.
  • Phase II: Post-Peak Contact and Energy Dissipation Phase.
After the peak, the response enters the post-peak phase, characterized by force oscillations, rebound, and continued increase in displacement. This phase roughly spans from 50 ms to 250 ms. Under condition C1, the force decreases rapidly after the peak, while the displacement continues to increase—indicating that inertia and large-deformation geometric nonlinearity dominate the subsequent response. In contrast, under C2 conditions, the force remains at a relatively high level after the peak, with multiple significant secondary peaks appearing, indicating sustained contact and repeated energy exchange. This phase is a critical period during which energy is dissipated through friction, wire bundle rearrangement, and local plastic deformation.
  • Phase III: Rebound and Separation Phase.
After about 250 mms, the force of the impact goes down slowly and the trolley slowly stops touching the cable. Under Condition C1, contact is lost after around 300 ms, followed by derailment. Under Condition C2, the trolley exhibits a more pronounced climbing motion along the cable. After around 300 ms, its trajectory becomes unstable and it deviates from the track. During this final stage, the cable undergoes elastic recovery, releasing some of the stored strain energy, while residual plastic deformation and damage are retained.
In summary, C1 was governed by rapid strain localization in the early impact stage, followed by post-peak displacement growth dominated by inertia. In contrast, C2 involved a longer effective contact duration and stronger geometric and contact coupling due to cable-guided climbing. These effects increased energy dissipation and further promoted instability of the impact trolley trajectory.

3.2. Damage Pattern

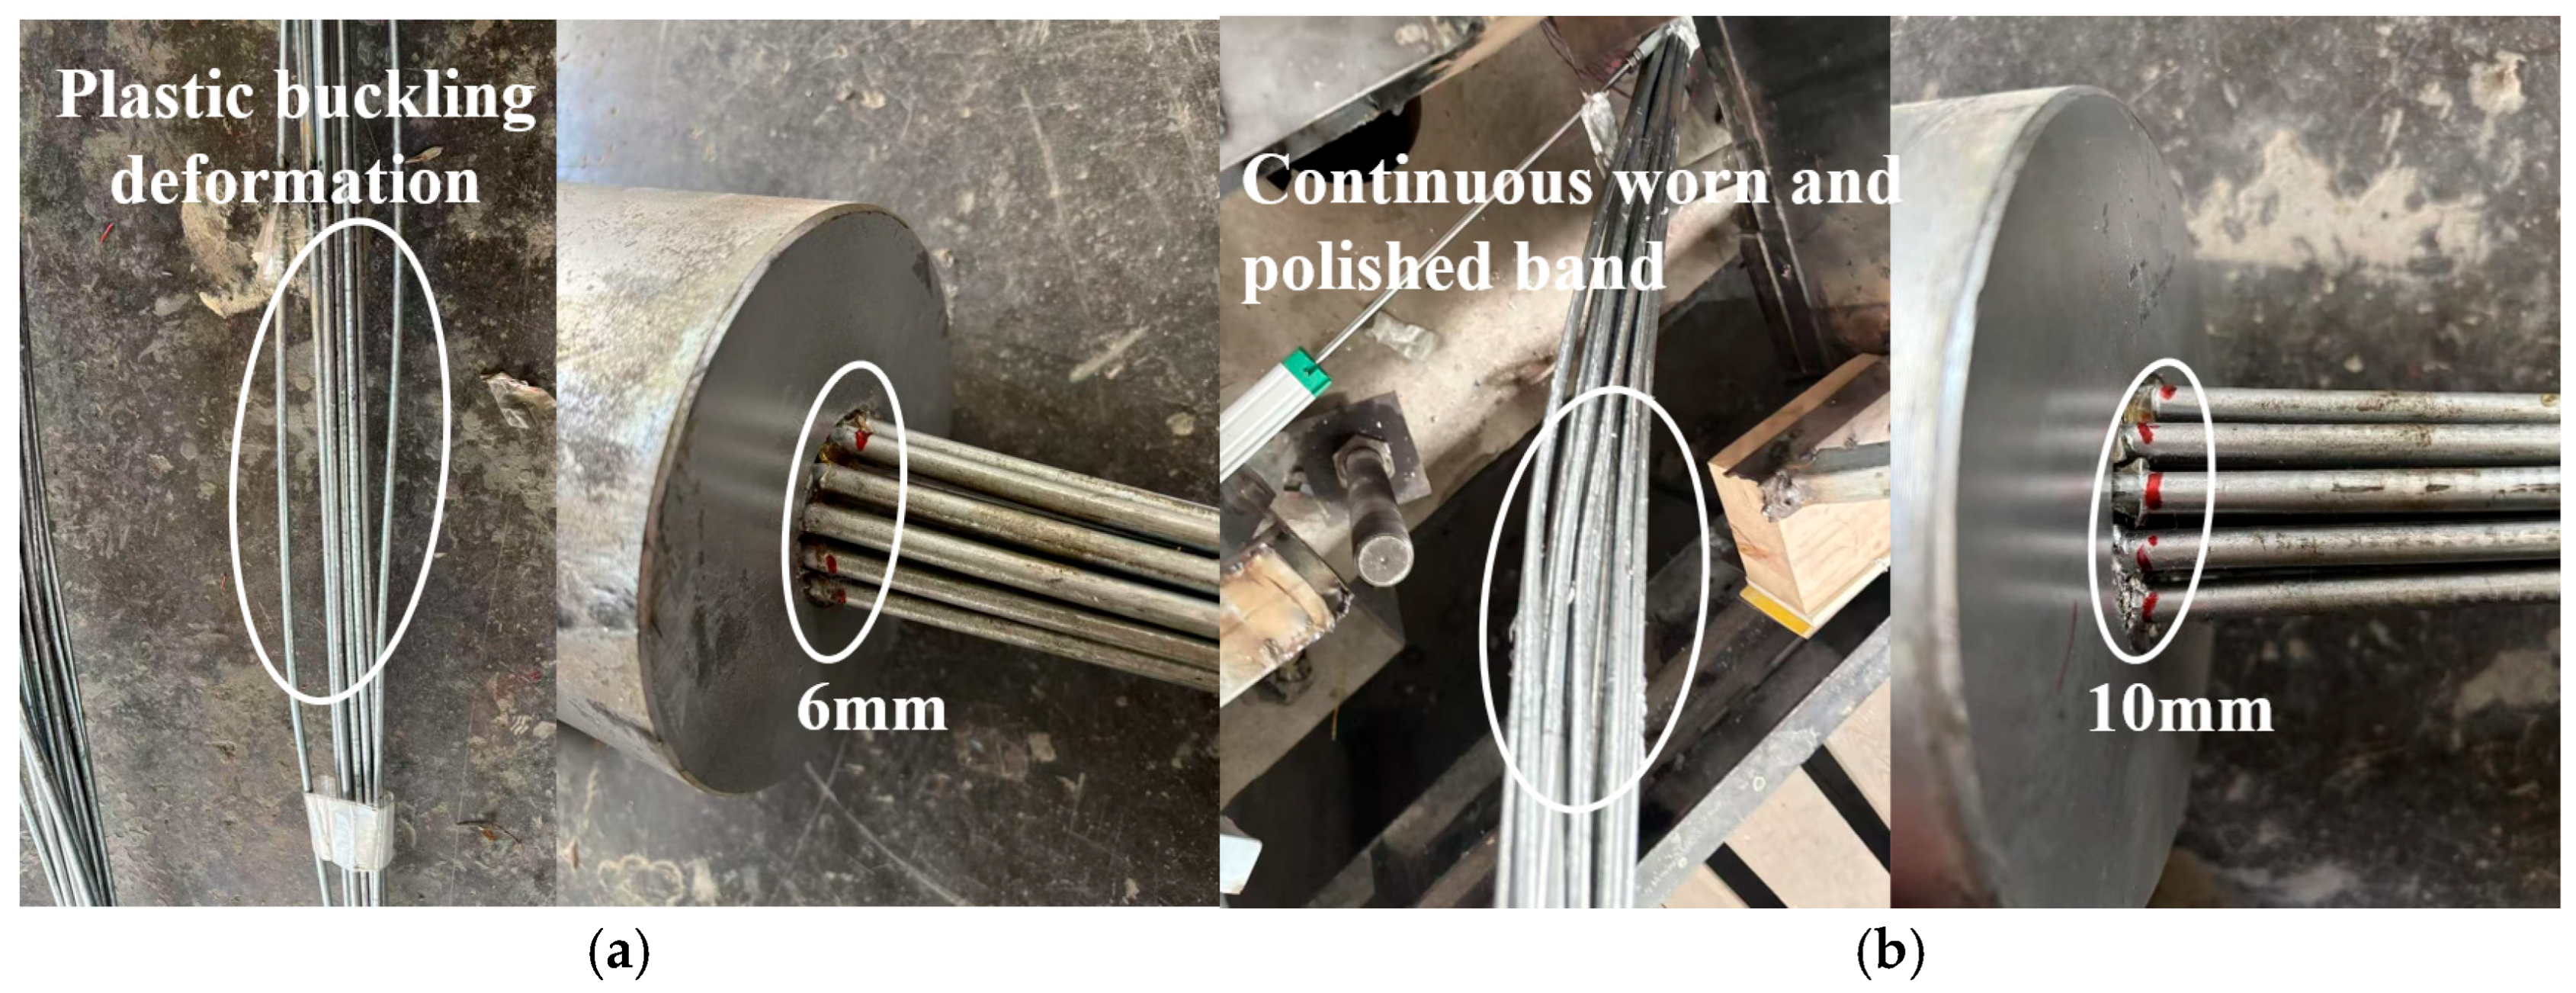
As shown in Figure 7, neither specimen exhibited macroscopic wire breakage or global instability after impact. The observed damage was mainly residual bending of the wire bundle and surface deterioration in the contact region. To reduce subjective judgment, the damage comparison is described here using visible post-impact features, including the continuity of wear traces, the presence of local cross-sectional flattening, the degree of wire misalignment/rearrangement, and local spalling near the anchorage exit or restraining components.
For C1, the post-impact morphology was characterized by localized residual curvature near the impact region. Several outer-layer wires exhibited slight outward bulging and limited visible misalignment, while the overall bundle compactness remained generally preserved. In the contact zone, the wire surfaces mainly showed discontinuous axial scratches and scattered point-type indentations, and no continuous wear band was observed. Near the anchorage exit, minor wear traces and localized filler-edge spalling were identified, indicating local amplification of bending and shear effects by the end restraint.
For C2, the damage features were more concentrated in the contact path. The bundle exhibited permanent local kinking together with visible cross-sectional flattening, and the outer-layer wires showed more evident misalignment and rearrangement than those in C1. In contrast to the discontinuous scratches observed in C1, the contact zone in C2 formed a continuous worn/polished band, locally accompanied by squeeze marks and spalled debris. Additional tearing residues of adhered material were also observed near restraining components, suggesting secondary contact during rebound and trajectory deviation. These visible damage features are consistent with the measured response, in which C2 maintained a substantially higher post-peak force and larger residual energy than C1.
In addition to the macroscopic damage patterns described above, the anchorage zone also exhibited significant stress responses and interface damage. According to data recorded by strain gauges in the anchorage exit zone, under Condition C1, the strain at the anchorage end increased sharply approximately 50 ms after the impact, with a peak strain of approximately 3800 μm, corresponding to a stress of approximately 741 MPa in the high-strength steel wires. Under C2 conditions, the strain response at the anchorage end was even more severe, with a peak strain of approximately 4025 μm, corresponding to a stress in the high-strength steel wire of about 785 MPa, reaching 47% of the material’s yield strength. Physical measurements after the impact showed that slight interface separation occurred between the cable body and the cold-cast filler, with a separation of approximately 6 mm under the side impact condition and approximately 10 mm under the frontal impact condition. These quantitative observations directly address the research gap noted in the introduction regarding the “insufficient study of stress behavior in the anchorage zone,” revealing the vulnerability of the anchorage exit zone under lateral vehicle impact, with the primary damage mechanism being progressive debonding at the bond interface due to strain rate effects.

3.3. Impact Force

As shown in Figure 8, the two specimens developed comparable peak horizontal forces. The peak force under condition C2 was only about 7 percent higher than that under condition C1. Nevertheless, the force–time histories provide a more direct description of the contact evolution and the associated path of damage accumulation.
The response under condition C1 was characterized by a single dominant peak followed by a rapid reduction in force. A distinct re-contact peak emerged later, after which the force transitioned into a low-amplitude long-tail decay. This sequence indicates that the main momentum and energy transfer occurred during the primary contact event, and that the subsequent rebound involved only brief and limited re-contact. In contrast, C2 maintained a relatively high force level after the primary peak and showed multiple secondary peaks with noticeable amplitudes. This behavior suggests repeated changes in contact condition and recurrent energy exchange. The trend is consistent with cable-guided climbing, during which the contact location migrated, the contact area evolved, and structural vibration became more influential in the measured response.

3.4. Force–Displacement Relationship

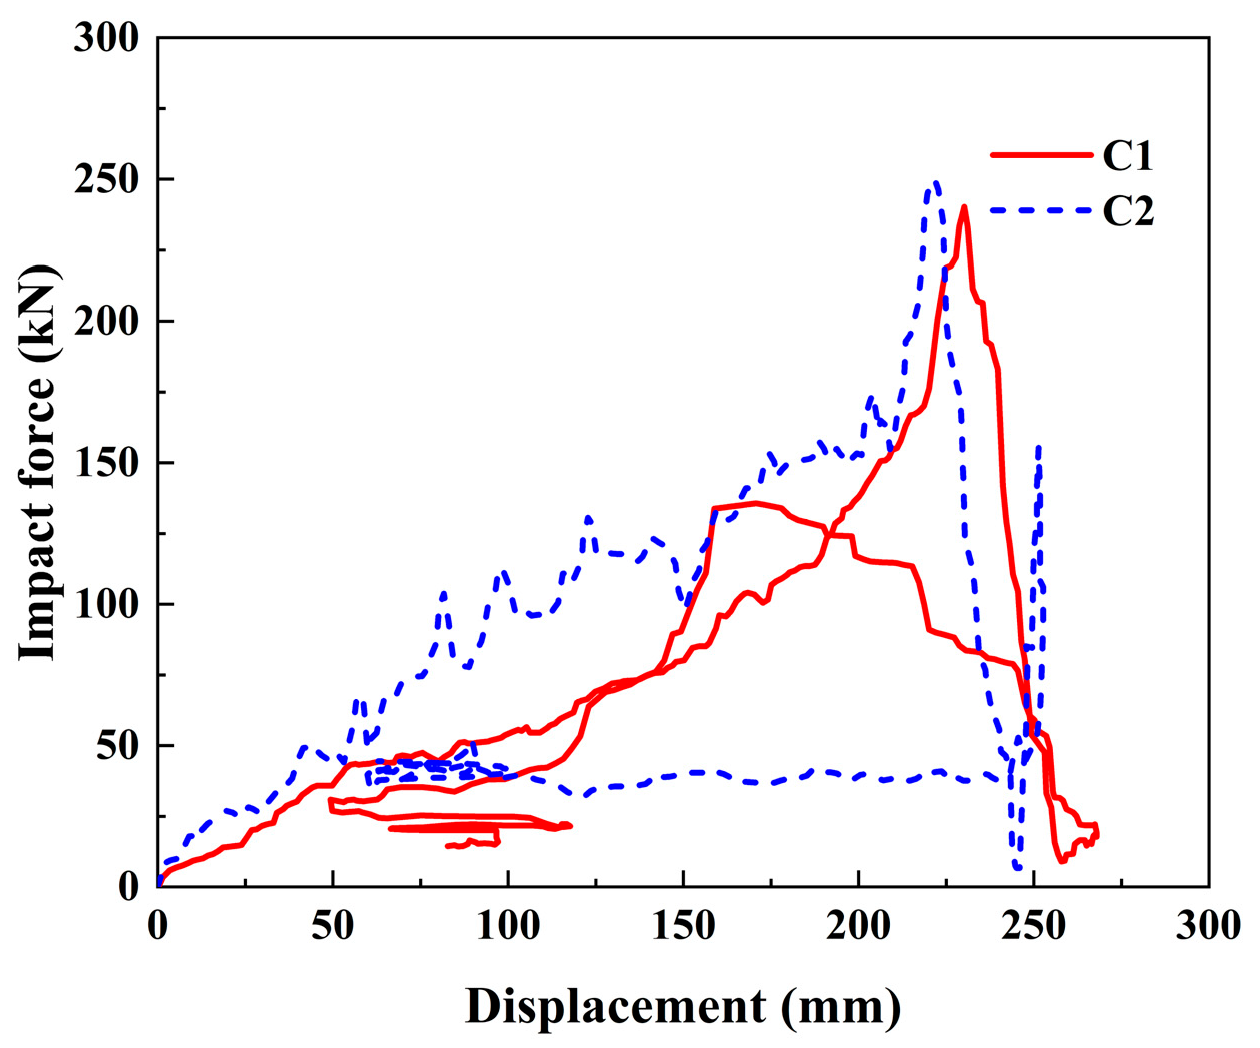
As shown in Figure 9, both specimens displayed an approximately linear force increase during the initial loading stage. As cable deflection increased and the contact region evolved, the response gradually entered a strongly nonlinear regime. Near the peak, the behavior shifted from being governed mainly by contact interaction to being governed mainly by dynamic inertia. While the peak force levels under the two conditions were similar, the way the peak formed and, more crucially, whether contact was maintained after the peak dictated the subsequent curve shape and the degree of damage accumulation.
Under condition C1, the rising branch was relatively gentle, with an initial stiffness of about 0.44 kN per millimetre. This trend suggests that, under lateral loading, the load-carrying wires were engaged progressively and the build-up of overall resistance lagged. The impact force increases with displacement, reaching a peak of 242.23 kN at a displacement of 234.6 ms. After reaching its peak, the curve dropped off sharply, indicating a significant loss in load-carrying capacity. Meanwhile, the displacement continued to increase, reaching a maximum of 267.94 mm by the time the external force had decreased to around 19 kN. This behavior is consistent with the time-history results, where the post-peak force decayed quickly and transitioned into a long-tail stage. The response implies pronounced degradation of contact stiffness after the peak, with subsequent displacement growth governed mainly by inertia and large-deflection geometric effects. Combined with slip and rebound as contact weakened, this produced a clear post-peak divergence between force and displacement.
Under condition C2, the rising branch was steeper, with an initial stiffness of about 0.81 kN per millimetre, indicating stronger direct contact interaction under frontal loading and earlier development of coordinated load sharing within the cable bundle. The peak force was 258.03 kN at a displacement close to 221 mm. Perhaps more importantly, the load did not collapse immediately after the peak. The displacement increased to 252.23 mm. The force remained around 106 kN. This is substantially higher than the corresponding level under condition C1. In line with the time-history response, several pronounced secondary peaks followed the primary peak, indicating repeated transitions between sliding and re-contact. As a result, the post-peak stage sustained a higher average load and continued to accumulate external work, producing a more complete force–displacement envelope.

3.5. Energy History

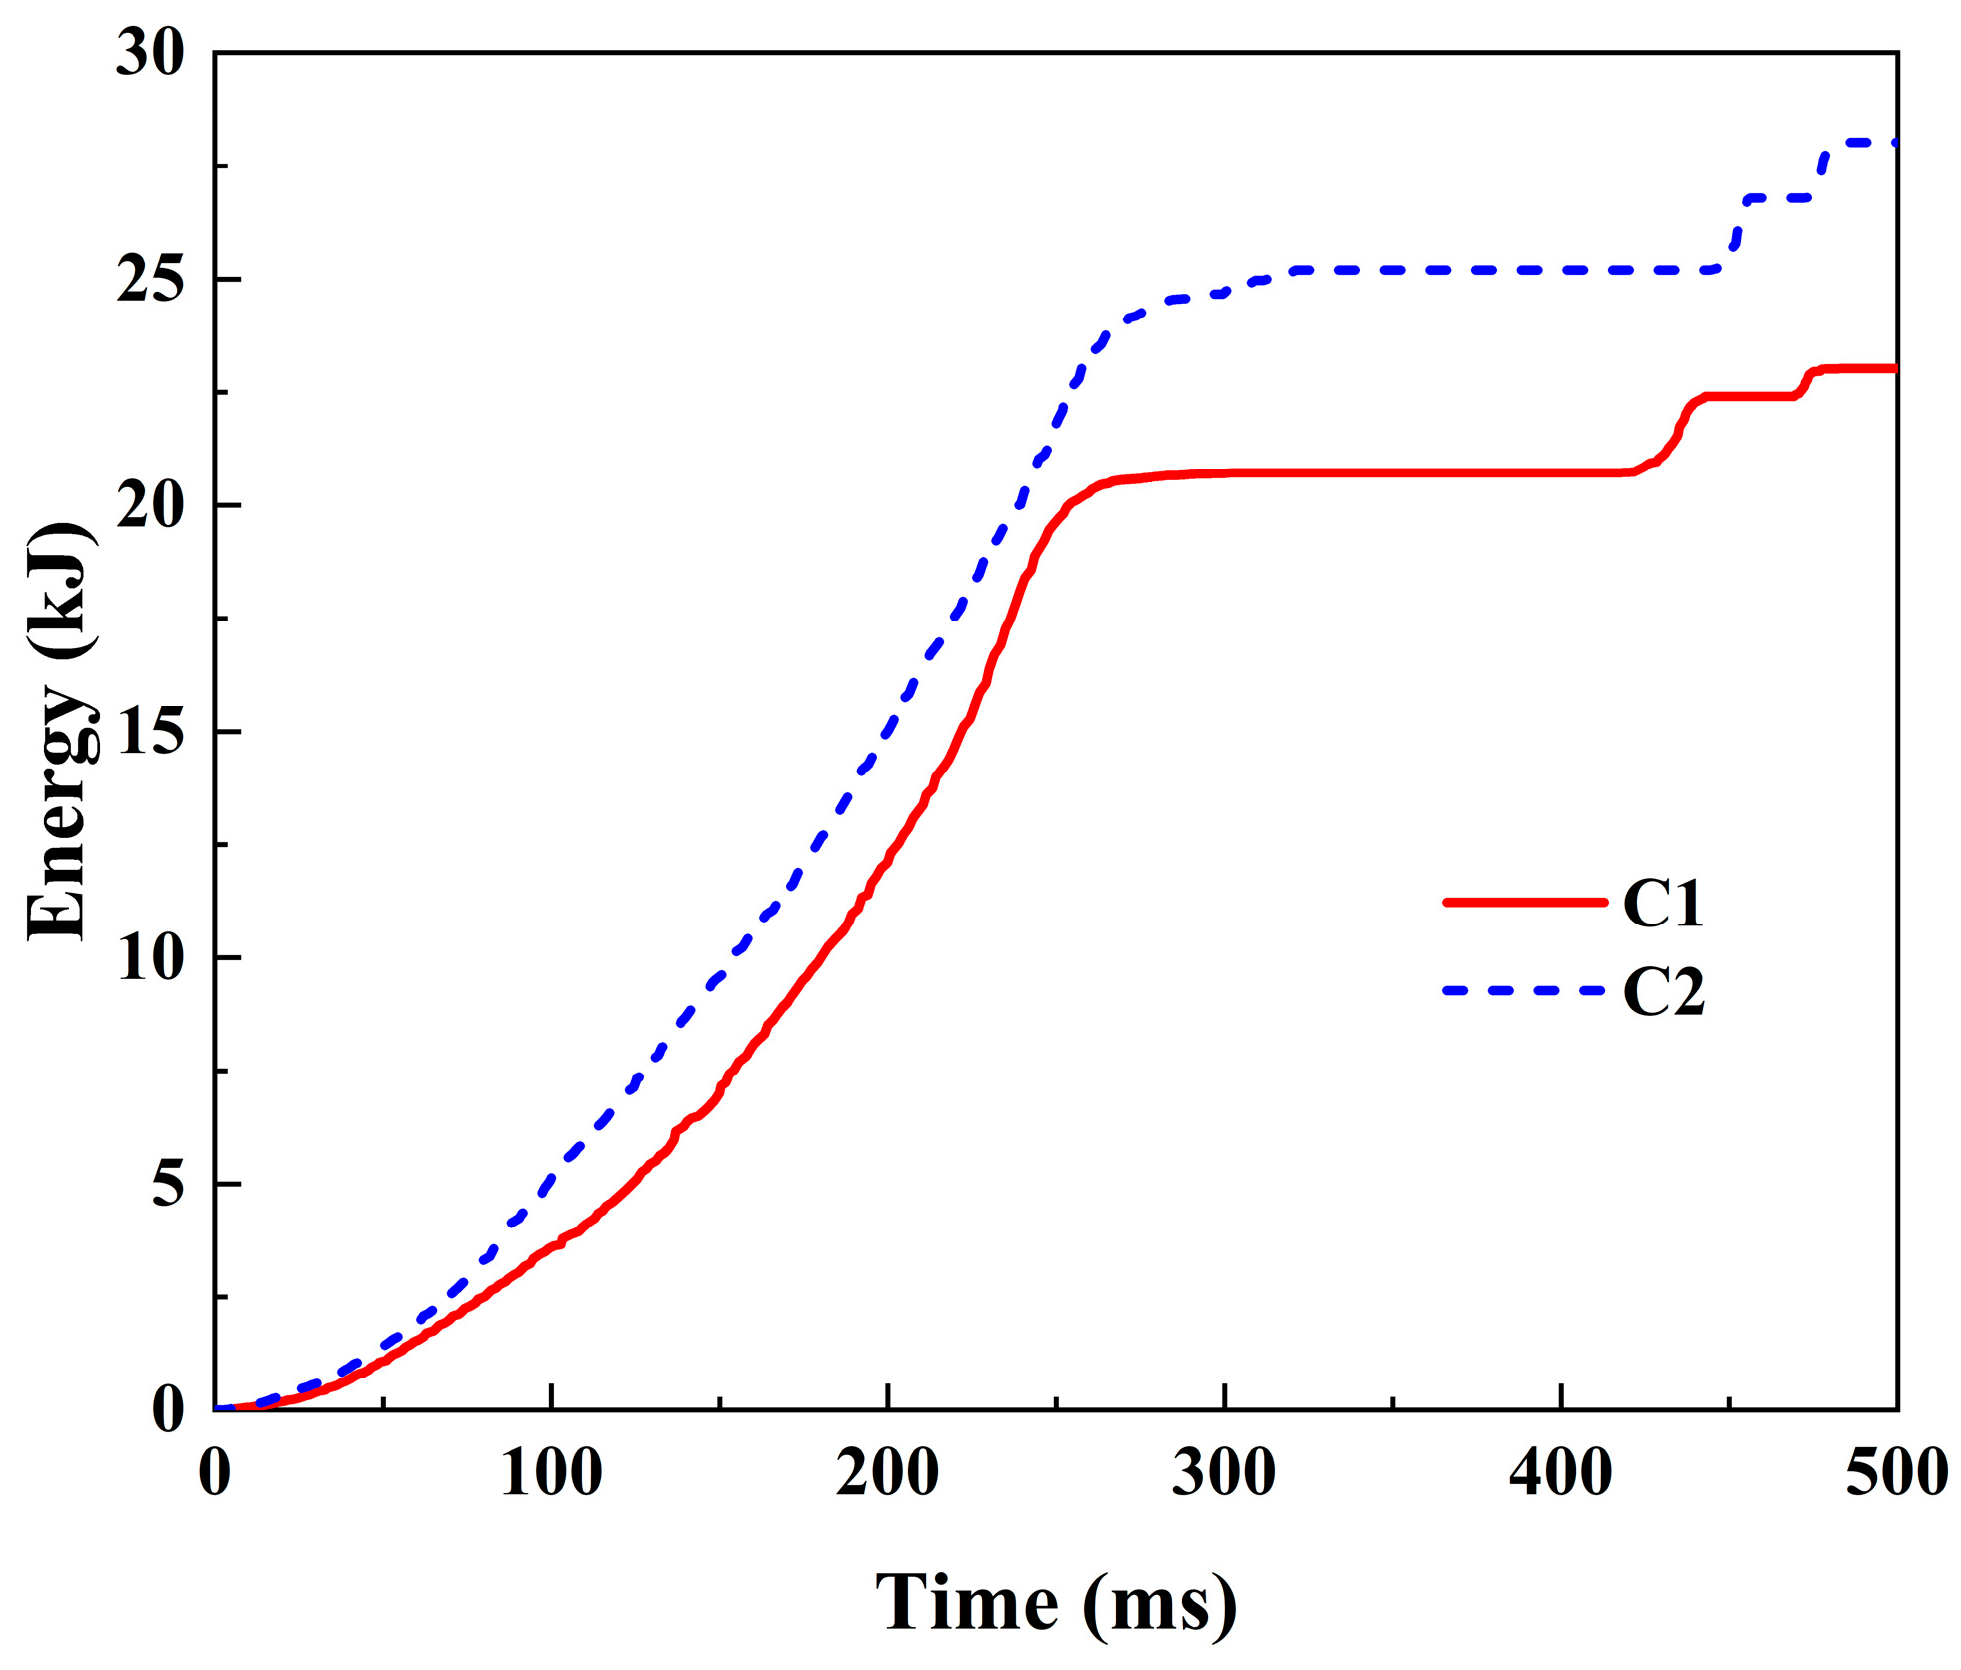
The energy transferred from the impact trolley to the specimen during impact was evaluated using Equation (1). The corresponding energy–time histories for all specimens are shown in Figure 10.
E ( t ) = 0 δ ( t ) F ( t ) d δ
where δ(t) and F(t) represent the displacement and impact force at time t, respectively.
The external work increased monotonically until the displacement reached its maximum and then decreased during rebound, producing a typical energy evolution with an initial rise followed by a drop. Under condition C1, the work value increases rapidly during the early loading phase. Calculation of the impact force using Equation (1) gives an approximate result of 17.3 kJ at the point of peak force. It continued to rise to approximately 20.7 kJ near the displacement peak, which was the maximum external work during the event. Afterward, the curve decreased markedly, and about 5.3 kJ remained at the end of the record, corresponding to roughly 25 percent of the maximum value. This behaviour indicates a pronounced rebound response, with recoverable elastic energy dominating. The post-peak stage was governed mainly by global rebound and energy release, and the overall energy dissipation was therefore limited.
Under condition C2, the energy input was sustained over a longer duration. Calculation Equation (1) shows that the external work is approximately 21.7 kJ. This was when the impact force peaked. It increased further to approximately 25.2 kJ. This was near the displacement peak. This is about 21.5 percent higher than that under condition C1. This trend indicates continued energy transfer under stronger contact interaction.
Rebound-related energy release was much less pronounced than in condition C1. After the peak, the energy curve decreased only slightly and remained at about 17.4 kJ at the end of the record, corresponding to roughly 69 percent of the maximum external work. In terms of energy partitioning, this response implies a larger share of irrecoverable dissipated energy and a smaller share of recoverable elastic energy. The interpretation is consistent with the multi-peak force history, together with more evident frictional slip and local nonlinear response, and it helps explain why damage accumulated more readily and progressed to a more severe state under frontal impact. Table 1 compares the key parameters of C1 and C2.
To further elucidate the fundamental differences in the energy dissipation behavior between C1 and C2, it is necessary to analyze the primary pathways of impact kinetic energy dissipation.
(1)
Friction and sliding energy dissipation: Friction energy is dissipated due to relative sliding within the wire bundle and between the wires and the impact head. The C2 contact zone exhibits continuous wear bands and indentation marks, indicating a strong coupling between normal pressure and tangential friction; the effective sliding distance and friction energy dissipation are significantly higher than the intermittent scratches observed in C1.
(2)
Energy dissipation due to plastic deformation: The impact causes permanent bending and local buckling of the cable. The residual bending in C2 is more pronounced (exhibiting a zigzag profile), accompanied by cross-sectional flattening and wire rearrangement; the proportion of plastic energy dissipation is higher. In C1, plastic deformation is concentrated in localized kinked regions.
(3)
Elastic strain energy storage and release: The proportion of elastic strain energy released during the rebound phase directly affects the residual energy ratio. The residual energy ratio for C1 is only 25%, indicating that most of the energy was reversibly stored and released in an elastic form; the residual energy ratio for C2 is as high as 69%, implying a relatively small proportion of elastic energy, with more energy dissipated through irreversible pathways.
From the perspective of energy distribution, energy dissipation in C1 is dominated by elastic strain energy, with limited contributions from frictional slip and plastic deformation; consequently, the overall damage is relatively minor. In contrast, due to longer contact duration and stronger contact interactions, C2 exhibits fully developed frictional sliding and plastic deformation, resulting in a significantly higher proportion of irreversible energy dissipation. This fundamentally explains why damage accumulation is more severe in C2. Consequently, this study reveals the root cause of the more severe damage resulting from frontal collisions: the energy dissipation pathway shifts from being dominated by elastic rebound to being dominated by frictional sliding and plastic deformation.

4. Conclusions

4.1. Research Findings

This study investigated the dynamic response of stay cables in cable-stayed bridges under vehicle impact loads through scaled model testing. The following conclusions can be drawn:
(1)
The impact response evolved through three distinct stages. The boundaries between stages were identified using both the impact trolley deceleration history and the characteristic changes in the impact force.
(2)
Although C1 and C2 reached comparable peak impact forces, C2 consistently produced a larger climbing height and a greater derailment angle. This outcome indicates that frontal impact maintains stronger cable–impact trolley interaction after the peak, thereby sustaining constraint and energy exchange into the post-peak stage and ultimately exacerbating orbital instability.
(3)
Both C1 and C2 exhibited visible plastic deformation at the impact location, without macroscopic failure such as wire rupture. This response indicates that the cable maintained structural continuity and residual load-carrying capacity after impact. However, minor interfacial debonding between the cable body and the cold-cast filler was observed near the anchorage end, identifying the anchorage exit as a potential weak region that warrants particular attention in impact-resistant design and assessment.

4.2. Specific Engineering Recommendations

The following specific engineering recommendations are proposed for cable-stayed bridges like the prototype bridge in this study (the Nanjing Baguazhou Yangtze River Bridge), based on the findings from the above tests:
(1)
Local protection of anchorage exit zones: Tests showed that 6–10 mm of the connection between the strong steel cables and the cold grout near the anchorage ends broke, causing big changes in pressure. This indicates anchorage exit zones as vulnerable locations under impact loading. It is therefore recommended that flexible composite wrapping or steel sleeves be installed on the cable body within this zone, covering approximately 1.0–1.5 m of the cable’s initial section. This will prevent interface separation from progressing and enhance the anchorage system’s impact resistance.
(2)
Incorporate anchorage slip into health monitoring metrics. Experimentally measured 6–10 mm slip provides a quantifiable early warning indicator. Dynamic displacement sensors should be installed at anchorage exit points in high-risk zones. Trigger targeted inspections to assess potential damage and ensure structural integrity when cumulative slip exceeds the preset threshold of 6 mm.

4.3. Research Limitations and Future Prospects

Research Limitations and Future Prospects: This study used scaled-down model tests to analyse the damage progression and anchorage failure characteristics of stay cables under vehicle impact loads. This approach yielded valuable experimental results and preliminary conclusions. However, due to constraints such as testing conditions, model scale, and loading methods, several aspects warrant further refinement and expansion:
(1)
The key materials of the stay cables were not subjected to dedicated material property tests. For example, the mechanical properties of core components, such as 7 mm high-strength steel wires and cold-cast anchor grout, were not calibrated through testing, which could affect the accuracy of parameter selection and result analysis. Additionally, the impact vehicle features a rigid front-end design, disregarding the role of vehicle components such as bumpers that provide cushioning and energy absorption in real collisions. This meant that the load boundary conditions were easier to work out than they would have been in real life.
(2)
It should also be noted that this study was conducted using only two scaled specimens, with the impact velocity fixed at 4.0 m/s. This limitation stems primarily from the high cost and complex fabrication process involved in producing cold-cast anchored cable-stayed specimens. Nevertheless, these two test conditions were carefully selected based on preliminary analysis to represent the most critical impact directions, and the fixed impact velocity ensures comparability between the two conditions. Therefore, the conclusions of this study are based on specific test conditions and may not be directly applicable to all possible vehicle collision scenarios.
(3)
Future research could address these limitations by:
-
Supplementing material property tests for key cable components to establish more accurate constitutive relationships;
-
Adopting impact heads that more closely resemble actual vehicles to optimise loading conditions and enhance the relevance of test results to engineering practice;
-
Expanding the scope of the parametric study to include different impact speeds, impact locations, cable inclinations, and anchorage types, in order to provide a more comprehensive understanding of the dynamic response mechanisms of cable-stayed bridges under vehicle impact;
-
Refining cable impact damage assessment methods and protective design recommendations based on these improvements to facilitate the translation of research findings into engineering applications.

Author Contributions

N.Y.: Investigation, Conceptualization, Methodology, Formal analysis. Y.Z.: Conceptualization, Supervision, Methodology. L.D.: Resources, Investigation, Writing—Original Draft. X.W.: Formal analysis, Data curation. Y.M.: Writing—Original Draft, Writing—Review and Editing. T.D.: Investigation, Writing—Original Draft, Writing—Review and Editing. H.F.: Supervision, Funding acquisition, Writing—Review and Editing. All authors have read and agreed to the published version of the manuscript.

Funding

This study is supported by the Technology Program Special Foundation of Jiangsu Province/Hong Kong Macao Taiwan Science and Technology Cooperation Program (Grant No. BZ2024058).

Data Availability Statement

The raw/processed data required to reproduce these findings cannot be shared at this time as the data also forms part of an ongoing study. The original contributions presented in the study are included in the article, further inquiries can be directed to the corresponding author.

Conflicts of Interest

Author Nan Yang was employed by the company The Second Nanjing Yangtze Bridge Co., Ltd. Author Yaoyu Zhu and Xiaochen Wei were employed by the company CCCC National Engineering Research Center of Long Highway Bridge Construction Co., Ltd. The remaining authors declare that the research was conducted in the absence of any commercial or financial relationships that could be construed as a potential conflict of interest.

References

  1. He, X.; Wang, Z.; Li, C.; Gao, C.; Liu, Y.; Li, C.; Liu, B. Experimental Test and Finite Element Analysis on a Concrete Box Girder of a Cable-Stayed Bridge with W-Shaped Prestressed Concrete Diagonal Braces. Buildings 2024, 14, 506. [Google Scholar] [CrossRef] [Scilit]
  2. Guo, S.; Jiang, Y.; Zhang, W.; Zeng, Y. Study on Dynamic Characteristics of Long-Span Highway-Rail Double-Tower Cable-Stayed Bridge. Buildings 2024, 14, 1733. [Google Scholar]
  3. Zhou, Y.; Chen, S. Reliability Assessment Framework of the Long-Span Cable-Stayed Bridge and Traffic System Subjected to Cable Breakage Events. J. Bridge Eng. 2017, 22, 04016133. [Google Scholar] [CrossRef] [Scilit]
  4. Ma, T.; Zhu, Y.; Xiong, W.; Zhang, B. Bridge post-disaster rapid inspection using 3D point cloud: A case study on vehicle-bridge collision. J. Infrastruct. Intell. Resil. 2025, 4, 100153. [Google Scholar]
  5. Chen, Q.; Wang, H.; El-Tawil, S.; Agrawal, A.; Bhattacharya, B.; Wong, W. Progressive Collapse Behavior of a Long-Span Cable-Stayed Bridge Induced by Cable Loss. J. Bridge Eng. 2023, 28, 05023005. [Google Scholar] [CrossRef] [Scilit]
  6. Rostami, M.; Sennah, K.; Mostafa, A. Experimental Investigation of the Lateral Load-Carrying Capacity of a Developed GFRP-Reinforced TL-5 Bridge Barrier Using Special Profile Hooked Bars. J. Compos. Constr. 2019, 23, 04019027. [Google Scholar]
  7. Sennah, K.; Mostafa, A. Performance of a Developed TL-5 Concrete Bridge Barrier Reinforced with GFRP Hooked Bars: Vehicle Crash Testing. J. Bridge Eng. 2018, 23, 04017139. [Google Scholar]
  8. The Boston Globe. Multi-vehicle crash on Zakim Bridge leaves some with non-life-threatening injuries. The Boston Globe, 30 December 2020.
  9. MLive. Multiple lanes closed on Ravenel Bridge due to two car collision. MLive, 1 February 2020.
  10. Changjiang Daily. Oil tanker truck crashes through guardrail of Junshan Bridge. Changjiang Daily, 28 December 2007.
  11. Wang, Z.; Xian, G. Impact performances of fiber reinforced polymer composites and cables: A review. Compos. Struct. 2023, 319, 117128. [Google Scholar] [CrossRef] [Scilit]
  12. Geng, Y.; Zheng, T.; Zhu, J.; Yang, B.; Wang, H.; Zhao, C. Structural Response and Damage of RPC Bridge Piers Under Heavy Vehicle Impact: A High-Fidelity FE Study. Buildings 2026, 16, 549. [Google Scholar] [CrossRef] [Scilit]
  13. Wang, W.; Chen, J.; Zhou, R.; Zhong, J. A simplified coupled model for predicting dynamic processes of vehicle impact on pier columns. Structures 2022, 41, 997–1013. [Google Scholar] [CrossRef] [Scilit]
  14. Yu, X.; Chen, Y.; He, Y. Vulnerability Assessment of Reinforced Concrete Piers Under Vehicle Collision Considering the Influence of Uncertainty. Buildings 2025, 15, 1222. [Google Scholar] [CrossRef] [Scilit]
  15. Chen, L.; Qian, J.; Tu, B.; Frangopol, D.M.; Dong, Y. Performance-based risk assessment of reinforced concrete bridge piers subjected to vehicle collision. Eng. Struct. 2021, 229, 111640. [Google Scholar] [CrossRef] [Scilit]
  16. Chen, L.; Wu, H.; Fang, Q.; Li, R. Full-Scale Experimental Study of a Reinforced Concrete Bridge Pier under Truck Collision. J. Bridge Eng. 2021, 26, 05021008. [Google Scholar] [CrossRef] [Scilit]
  17. Abdelkarim, O.I.; ElGawady, M.A. Performance of bridge piers under vehicle collision. Eng. Struct. 2017, 140, 337–352. [Google Scholar] [CrossRef] [Scilit]
  18. Jiang, L.; Wang, K.; Fang, H.; Chen, B.; Zhu, L.; Zhang, Q. Protection performance of a novel anti-collision guardrail with recycled foamed concrete under vehicle collision. Eng. Struct. 2024, 305, 117795. [Google Scholar] [CrossRef] [Scilit]
  19. Liu, X.; Wang, X.; Zhou, J.; Li, F.; Xie, J.; Wu, Z. Corrosion Fatigue Degradation of Frp Tendon after Acidic Corrosion Coupling with Sustaining/Fatigue Loading. Eng. Struct. 2025, 335, 120383. [Google Scholar] [CrossRef] [Scilit]
  20. Yang, Y.; Su, M.; Liu, H. Sensitivity Analysis of Deflection Variation of the Cable-Stayed Bridge to the Cable Damage. Buildings 2023, 13, 1014. [Google Scholar] [CrossRef] [Scilit]
  21. Zhou, L.; Yao, G.; Zeng, G.; He, Z.; Gou, X.; He, X. Cellular Automata-Based Experimental Study on the Evolution of Corrosion Damage in Bridge Cable Steel Wire. Buildings 2024, 14, 3354. [Google Scholar] [CrossRef] [Scilit]
  22. Wang, J.; Duan, H.; Zhao, Q.; Meng, Q.; Zhang, K. Temperature-Dependent Tensile Degradation of HDPE Sheaths for Bridge Cables Considering UV-Chloride Exposure. Buildings 2026, 16, 736. [Google Scholar] [CrossRef] [Scilit]
  23. Kurino, S.; Wei, W.; Igarashi, A. Seismic fragility and uncertainty mitigation of cable restrainer retrofit for isolated highway bridges incorporated with deteriorated elastomeric bearings. Eng. Struct. 2021, 237, 112190. [Google Scholar] [CrossRef] [Scilit]
  24. Soto, N.; Cid, C.; Baldomir, A.; Hernández, S. Fail-safe optimum cable system under cable breakage in cable-stayed bridges. Application to the Queensferry Crossing Bridge. Eng. Struct. 2023, 279, 115557. [Google Scholar] [CrossRef] [Scilit]
  25. Zhang, H.; Lv, H.; Zhu, Z.; Chen, Z.; Chu, Y. Study on the Dynamic Response of the Component Failure of Drum-Shaped Honeycomb-Type III Cable Dome with Quad-Strut Layout. Buildings 2023, 13, 1894. [Google Scholar] [CrossRef] [Scilit]
  26. Huang, Z.; Khan, M.Z.N.; Chen, W.; Hao, H. Effectiveness of reinforcing methods in enhancing the lateral impact performance of geopolymer concrete column reinforced with BFRP bars. Int. J. Impact Eng. 2023, 175, 104544. [Google Scholar] [CrossRef] [Scilit]
  27. Mozos, C.M.; Aparicio, A.C. Numerical and experimental study on the interaction cable structure during the failure of a stay in a cable stayed bridge. Eng. Struct. 2011, 33, 2330–2341. [Google Scholar] [CrossRef] [Scilit]
  28. Giraldo-Isaza, J.P.; Giraldo-Londoño, O.; Washer, G.A.; Myers, J.J. Numerical modeling of the effects of impact conditions, foundation stiffness, and cable pretension on the behavior of high-tension guard cable systems. Eng. Fail. Anal. 2024, 165, 108692. [Google Scholar] [CrossRef] [Scilit]
  29. Hoang, V.; Kiyomiya, O.; An, T. Experimental and Numerical Study of Lateral Cable Rupture in Cable-Stayed Bridges: Case Study. J. Bridge Eng. 2018, 23, 05018004. [Google Scholar] [CrossRef] [Scilit]
  30. Fang, Y.; Xiang, Y.; Fang, Z. Impact Behaviour of Carbon Fibre-Reinforced Polymer (CFRP) Cables with Protective Sheaths. Constr. Build. Mater. 2024, 450, 138599. [Google Scholar] [CrossRef] [Scilit]
  31. Yang, Y.; Zhou, Z.; Guan, Y.; Shi, J.; Zhan, Q.; Fahmy, M.F.M.; Wu, B. Nonlinear Coupled Vibration Behavior of BFRP Cables on Long-Span Cable-Stayed Bridges under Parametric Excitation. Buildings 2023, 13, 3082. [Google Scholar] [CrossRef] [Scilit]
  32. Xiang, Y.; Fang, Z.; Wang, C.; Zhang, Y.; Fang, Y. Experimental Investigations on Impact Behavior of CFRP Cables under Pretension. J. Compos. Constr. 2017, 21, 04016087. [Google Scholar] [CrossRef] [Scilit]
  33. Xiang, Y.; Fang, Z.; Fang, Y. Single and multiple impact behavior of CFRP cables under pretension. Constr. Build. Mater. 2017, 140, 521–533. [Google Scholar] [CrossRef] [Scilit]
  34. Wu, J.; Zhou, S.; Shu, Y.; Cao, S.; Zhou, Y. Fiber monitoring of cold-casting anchor’s performance. J. Traffic Transp. Eng. 2019, 19, 37–44. [Google Scholar]
  35. Michels, J.; Sena-Cruz, J.; Czaderski, C.; Motavalli, M. Thermo-mechanical properties of commercially available epoxy resins for structural applications. In Proceedings of the Third Conference on Smart Monitoring, Assessment and Rehabilitation of Civil Structures, Antalya, Turkey, 7–9 September 2015. [Google Scholar]
  36. Zhu, Y.; Liu, L.; Zhang, J.; Jiang, T. Experimental Study on the Anchoring Performance of Carbon Fibre Reinforcement in Different Anchoring Grouts. Fiber Reinf. Plast. Compos. 2015, 7, 78–82. [Google Scholar]
Figure 1. Typical vehicle collisions on cable-stayed bridges.
Buildings 16 01366 g001
Figure 2. Schematic diagram of cable and anchorage structure dimensions.
Buildings 16 01366 g002
Figure 3. Anchorage connection device. (a) Cover plate. (b) Connecting device.
Buildings 16 01366 g003
Figure 4. Layout of the horizontal impact testing system.
Buildings 16 01366 g004
Figure 5. Impact process diagram of C1.
Buildings 16 01366 g005aBuildings 16 01366 g005b
Figure 6. Impact process diagram of C2.
Buildings 16 01366 g006
Figure 7. Typical damage pattern. (a) C1. (b) C2.
Buildings 16 01366 g007
Figure 8. Typical impact force histories.
Buildings 16 01366 g008
Figure 9. Impact force–displacement curves.
Buildings 16 01366 g009
Figure 10. Energy histories.
Buildings 16 01366 g010
Table 1. Comparison of the key parameters of C1 and C2.
ParametersC1C2Difference
Peak force242.23258.03+6.5%
Peak displacement234.6221−5.8%
Initial stiffness0.440.81+84.1%
Maximum external work20.725.2+21.5%
Residual energy ratio2569+176%
Primary damage featuresLocalised kinks, intermittent scratches, and slight wear at the anchoring endPermanent bending, continuous wear zones, re-arrangement of steel wires, spalling at the anchorage endDamage is more concentrated; friction is the dominant factor
Disclaimer/Publisher’s Note: The statements, opinions and data contained in all publications are solely those of the individual author(s) and contributor(s) and not of MDPI and/or the editor(s). MDPI and/or the editor(s) disclaim responsibility for any injury to people or property resulting from any ideas, methods, instructions or products referred to in the content.