Article

Validation and Optimization of the Cite Frequency Approach in Identifying Potential Factors Affecting the Bid/No-Bid Decision

1
Sichuan Business School, Sichuan University, Chengdu 610065, China
2
College of Environment and Civil Engineering, Chengdu University of Technology, Chengdu 610059, China
3
School of Financial Accounting, Chengdu Jincheng College, Chengdu 611731, China
4
School of Architecture and Built Environment, Deakin University, Geelong, VIC 3220, Australia
*
Author to whom correspondence should be addressed.
Buildings 2026, 16(7), 1322; https://doi.org/10.3390/buildings16071322
Submission received: 25 February 2026 / Revised: 16 March 2026 / Accepted: 20 March 2026 / Published: 26 March 2026

Abstract

The Cite Frequency Approach (CFA) is an accepted method for identifying potential factors influencing bid/no-bid decisions, yet no study has systematically validated its theoretical foundation. The aim of this study was to elucidate the theoretical basis of CFA and ascertain whether citation frequency truly reflects factor importance. Through rigorous screening undertaken using the PRISMA method, 24 journal articles with bid/no-bid decision (BNBD) factors’ RII were extracted for analysis. By constructing a 276-times pairwise comparisons of these articles, a matrix of 121 factors’ RII was built. Based on the matrix data, 2380 Spearman correlation coefficients (rhos) between cite frequency and RII were calculated. Significant level rhos of medium and high strength account for only 15.59%. This demonstrates that the cite frequencies of factors found in previous studies are not highly representative of their importance. Cite frequencies are therefore shown to be unreliable in identifying the potential factors affecting BNBD. Moreover, the Meta-Analyses approach (MAA) is proposed as a superior factor selection method (MAA), and this was verified to be more representative and effective than CFA. This study provides the first systematic and global validation of CFA’s core assumption supported by robust and generalizable findings. It enriches the methods for identifying potential factors affecting decisions, including but not limited to BNBD.

1. Introduction

The bid/no-bid decision (BNBD) has long been a difficult decision for project contractors to make on account of its complexity, combined with the uncertainty inherent in its numerous interrelated factors [1,2]. This is particularly true of the construction project bid/no-bid decision (BNBD). Numerous studies have addressed the BNBD problem on two main aspects. These are: factor identification and decision-making methods. Ahmad and Minkarah [3] argued that identifying the influencing factors is the primary task in solving the BNBD problem. In their seminal study, they conducted a questionnaire survey intended to identify the decision factors considered by contractors in the U.S.A. Since then, identifying the key factors that influence BNBD represents a significant area of research in the field of construction. Their approach has been replicated and further enhanced by subsequent researchers. Accordingly, the questionnaire survey method has garnered widespread acceptance among scholars as a means to elucidate the factors influencing bid decisions, across both domestic and international projects. [4,5,6,7,8,9,10,11].
Identifying those potential factors that impact the BNBD constitutes a significant and necessary preliminary step in formulating a decision questionnaire survey. During the pioneering stage of BNBD research, factors could be identified by simply collating their appearance in the relevant literature [3,4]. However, with the present proliferation of studies on the topic and the subsequent burgeoning of identified factors, researchers are faced with the challenge of reducing the huge field of candidate factors to the few most pertinent to their study. Simply, it is impractical to include every factor identified to date in questionnaire or interview designs, as these now exceed one hundred [12,13]. Including every identified factor in a single questionnaire is impractical. Overly long instruments burden respondents, reduce response quality, and threaten data validity. In addressing this problem, Citation Frequency Analysis (CFA) has become a popular method for selecting salient factors based on how often they appear across previous studies [8,9,10]. The core assumption of CFA is that higher citation frequencies indicate greater importance. However, despite its widespread adoption, the assumption lacks rigorous theoretical and empirical justification. This oversight constitutes a critical deficiency in existing BNBD research. A factor may be frequently cited, yet be consistently unimportant in the original surveys. Moreover, frequency thresholds used to filter factors vary arbitrarily across studies [10,14,15], further weakening the consistency and legitimacy of this approach.
Prior research has neither systematically validated this core assumption nor explored the validity of CFA itself. This leaves a key methodological gap in BNBD factor selection. Despite CFA’s dominance in BNBD questionnaire design, its theoretical foundation remains underexamined. Most studies adopt citation frequency as a proxy for importance without offering a rationale, justifying applicability, or admitting to inherent limitations. The oversight can lead to inconsistent results and inappropriate methodological choices. This gap spotlights a need for a means of systematic validation of CFA, which is the primary novelty and core objective of the present study.

2. Literature Review and Hypothesis Development

The BNBD is among the most critical decisions faced by construction contractors. Building on the 31 factors identified by Ahmad and Minkarah [3], subsequent studies proceeded to expand the factor set. Shash [4] increased the list to 55 factors, and Fayek et al. [12] documented 118 potential factors affecting BNBD. As the factor list continues to grow, including them all in a single questionnaire has become unfeasible. The practical challenge is to identify a more efficient filter and in so doing retain only the most influential factors, while at the same time maintaining survey quality. However, existing filtering methods, primarily CFA, remain unvalidated, creating a pressing need for a more rigorous approach.
In practice, many studies derive factor lists from literature reviews, but the selection process is often poorly justified or unexplained [5,14,15,16,17]. Leśniak and Plebankiewicz [7] included 16 factors in their questionnaire without providing any rationale. Similarly, Bageis and Fortune [17] identified 100 factors from six previous related studies, yet ultimately reduced their survey list to 87 factors, without explanation. Cheng et al. [14] identified 44 factors from 10 previous studies, reducing this to sixteen on the basis that those sixteen were mentioned in five reviewed articles. Similarly, in order to generate an initial list of factors to be used in their questionnaire, Mohamed and Emad [15] calculated the number of repetitions of each factor in eight previous studies and determined 38 potential factors which were cited no less than four times. Over time, the approach of using factor cite frequency, as documented in earlier studies, has become the prevalent method for determining factors to be considered in subsequent studies. Clearly, in this way inherent biases become compounded and amplified.
CFA is the most common approach taken in standardizing factor screening. Although CFA provides a systematic procedure for identifying potential factors to be incorporated in new questionnaires, it nevertheless lacks a solid theoretical foundation. Specifically, it suffers from two limitations. First and foremost, frequently cited factors may not be genuinely important in practice, with biases magnifying over time. Furthermore, CFA ignores contextual differences, meaning that while factors might be important in some settings they may be irrelevant in others. For example, Odusote and Fellows [18] used CFA to develop their factor list but found that the most frequently cited factors were not rated as significant by respondents. Similar inconsistencies were reported in other studies [11,19,20]. However, to date, no study has systematically addressed these inconsistencies or validated the core assumption of CFA at a global level.
Therefore, there is a critical and unaddressed research gap. Although existing BNBD studies widely use CFA for factor selection, they are universally accepted without interrogating the assumption that citation frequency equates with importance. Few studies have critically evaluated the theoretical validity, contextual dependencies, or biases of this practice, and no study has systematically validated CFA across multiple study portfolios to confirm reliability. This gap is particularly notable given the widespread use of CFA in BNBD research and the potential for flawed factor selection to undermine the validity of subsequent studies.
Of the relevant literature, only Oo et al. [21] have questioned the legitimacy of CFA. They alone have indevoured to compare rankings based on citation frequency and the Relative Importance Index (RII). Using meta-analysis (MAA) to synthesize factor importance across previous studies, they uncovered considerable discrepancies wherein many frequently cited factors turned out to have low actual importance and vice versa. They concluded that citation frequency does not reliably reflect importance and suggested that MAA may be more appropriate than CFA. However, their analysis was severely limited. They relied on only one aggregated portfolio of studies and failed to conduct a comprehensive validation of CFA. This study advances beyond Oo et al. [21] by providing the first global and systematic validation of CFA across multiple diverse study portfolios. This study addresses the limitations of their preliminary work.
To achieve the novel objectives, the present study systematically examined the legitimacy and validity of CFA. The core research objective was to verify the relationship between citation frequency and RII from a global perspective using multiple portfolios of existing studies. The following hypothesis was tested:
H0: 
In BNBD studies, the citation frequency of factors can highly represent their actual importance (RII).
By analyzing thousands of correlation coefficients across diverse study portfolios, this research provides a robust and comprehensive evaluation of whether citation frequency truly reflects factor importance. If the hypothesis is rejected, an improved framework incorporating actual factor importance will be proposed to strengthen the rationality and effectiveness of factor selection in future BNBD research, further enhancing the study’s practical and theoretical novelty.

3. Research Methods

The methodology proposed in this study relies on precedents gleaned from previous research. Through a comprehensive literature review, studies utilizing questionnaire surveys to determine factors affecting BNBD with RII are selected. Through pairwise comparison among these studies, the identical factors with their RII can be extracted in matrix form. Based on the derived matrix data, validation of the hypotheses can be conducted.

3.1. Literature Screening and Collection

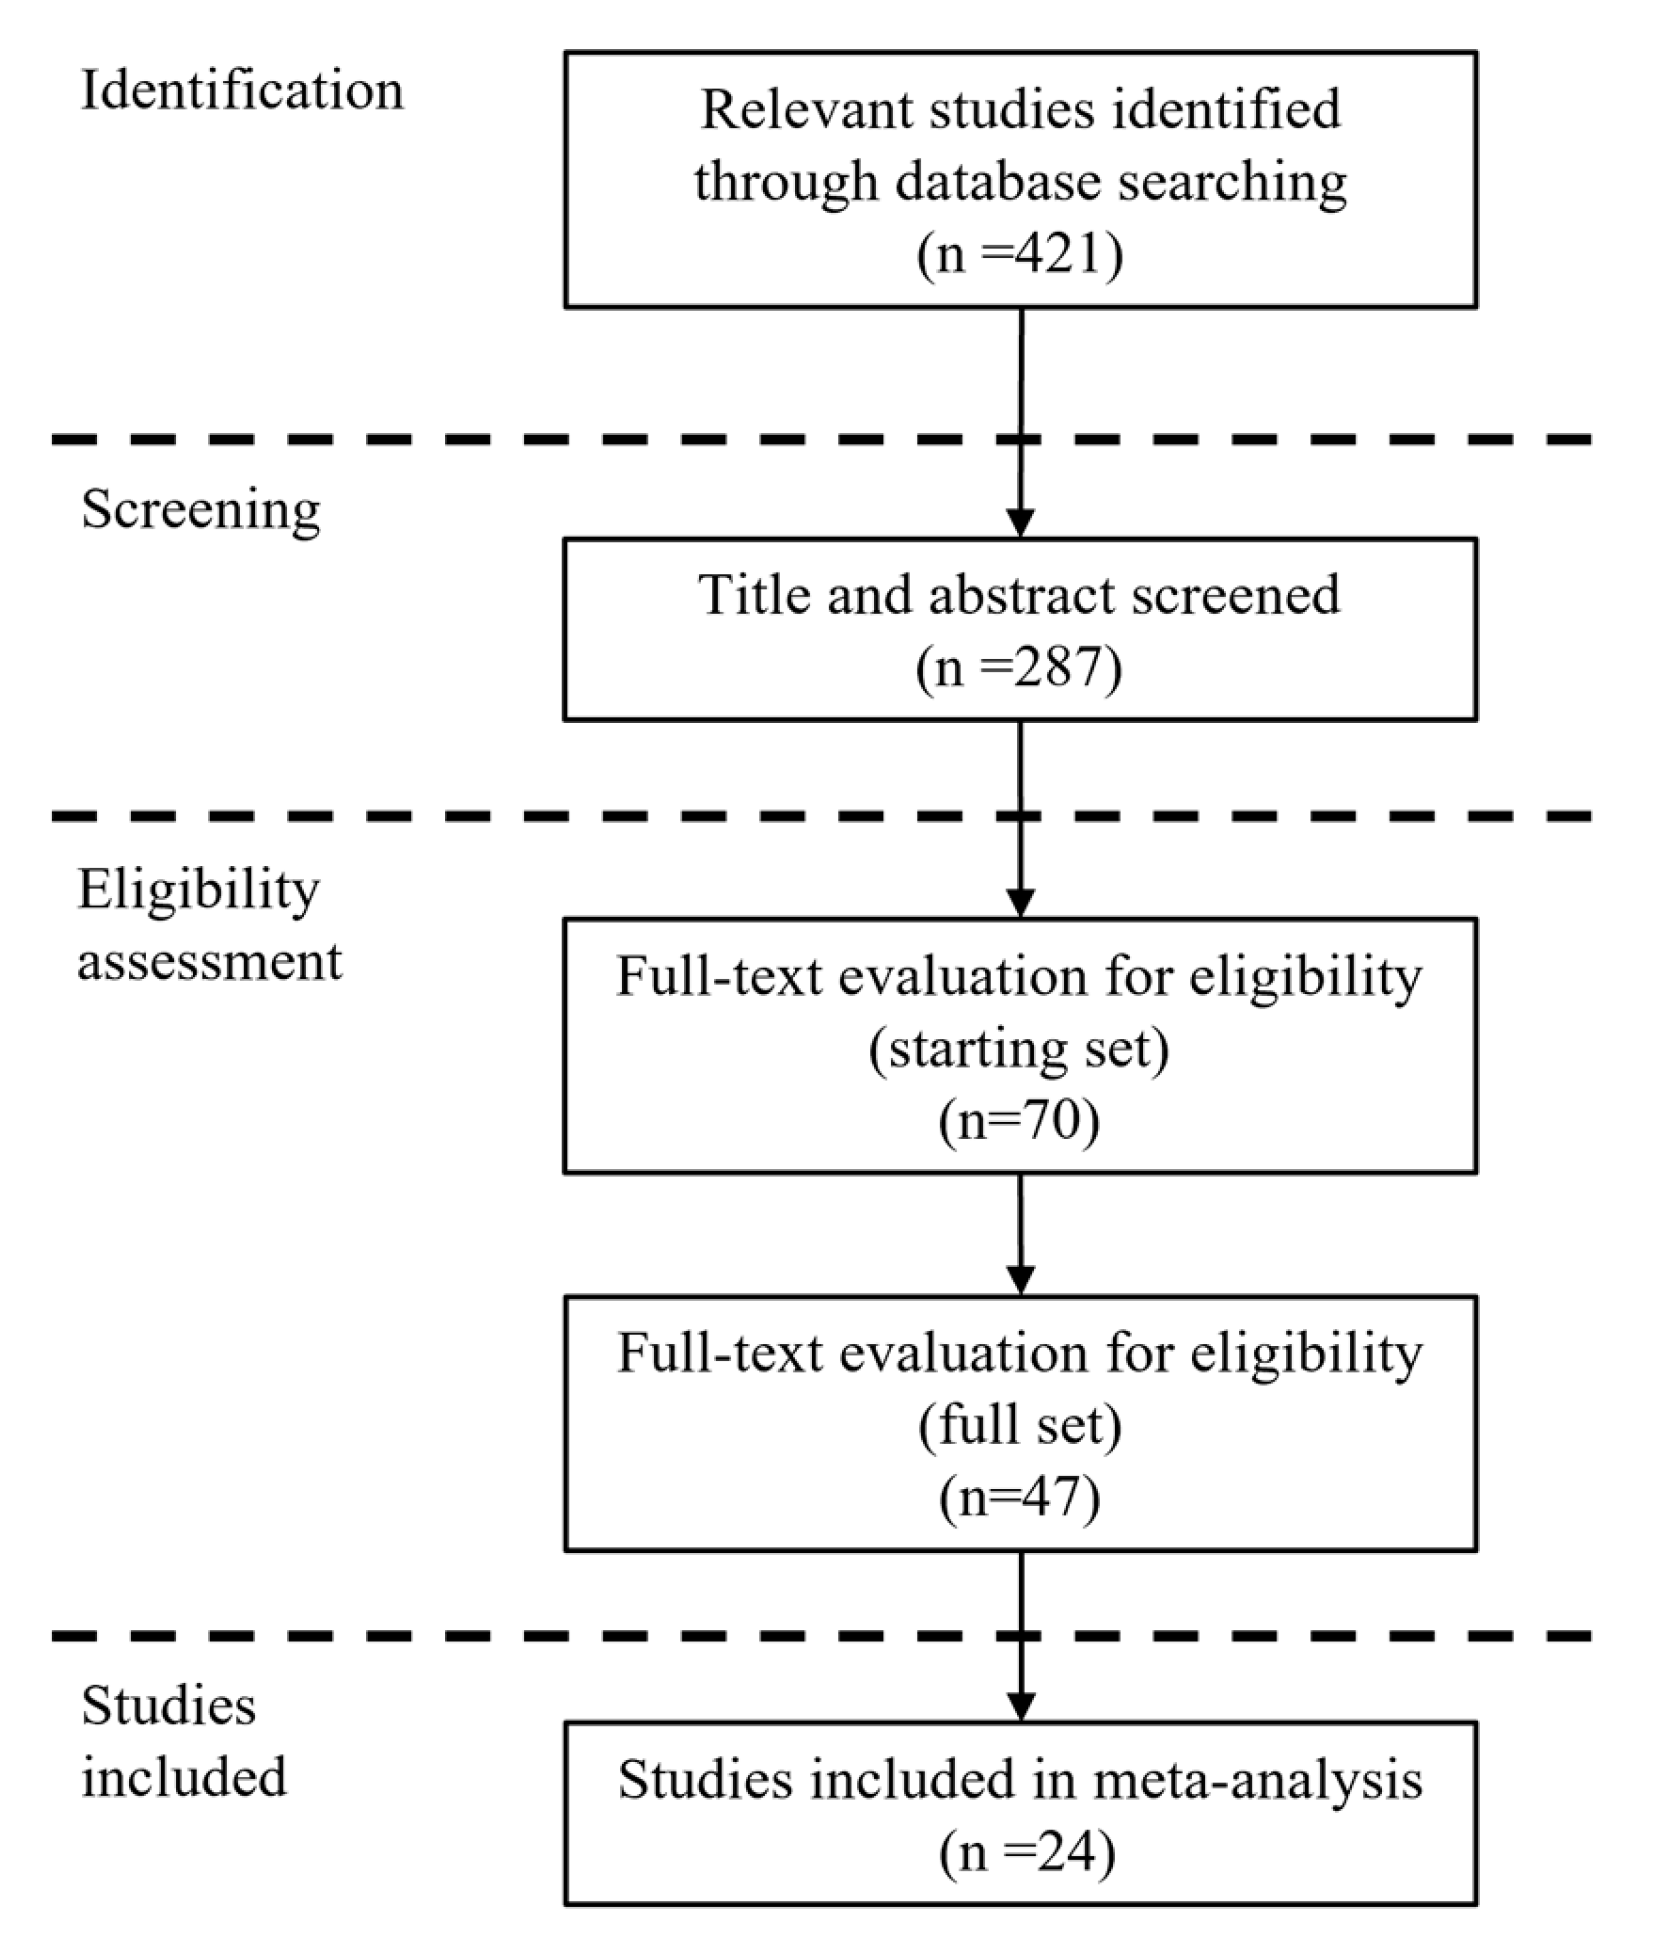
This study uses the Preferred Reporting Items for Systematic Reviews and Meta-Analyses (PRISMA) method to screen the extant literature. The PRISMA method is recommended by many authors undertaking systematic reviews [21,22,23]. Four main inclusion criteria are set for literature screening and collection, which are as follows: (1) Articles that focused on factors affecting BNBD; (2) Articles that provided the factors’ RII (or mean scores); (3) Only the primary article is selected where duplicate studies exist; (4) Journal papers published in English. The screening process is divided into four steps, as shown in Figure 1.
(1) Identification
Relevant literature was retrieved and extracted from the following authoritative databases: ASCE Library, Web of Science, Scopus, SpringerLink, and Google Scholar. Keywords used for database searching included: bid/no-bid decision, continue/stop decision, bidding decision, and bidding selection. Only journal papers published in English were included. To ensure the reliability and continuity of the data, a full 38-year time span from 1988 to 2025 was selected. In addition, a secondary search was conducted on the references cited in the initially retrieved literature to capture important studies that may have been overlooked in the initial search. A total of 421 relevant studies were retrieved and passed into the screening process.
(2) Screening
To rapidly narrow the screening scope and ensure relevance to the research topic, only studies focusing on the factors influencing bid/no-bid decision (BNBD) in the title and abstract were retained. A total of 134 ineligible studies were excluded, and 287 studies were retained for full-text eligibility assessment.
(3) Eligibility assessment
A preliminary full-text assessment was performed on the studies retained after the initial screening. To avoid data duplication, studies with overlapping samples and duplicate publications were excluded, Thus, only the primary publication was retained for each independent study to ensure the integrity of the data. A total of 217 studies were excluded in this step, and 70 studies were retained to form the initial set for full-text eligibility assessment.
To further strictly enforce the assessment criteria and improve the quality of the included literature, an in-depth full-text review was conducted on the remaining studies. Only studies adopting empirical research methods were included, while theoretical studies such as literature reviews and case studies were excluded. A total of 23 non-empirical studies were removed, and 47 studies were retained to form the full set for final inclusion screening.
(4) Studies included
Finally, to ensure the reliability of the pooled effect size results in the meta-analysis, only studies reporting the Relative Importance Index (RII) or mean score of the influencing factors were selected. A total of 23 studies that did not provide the required effect size data were excluded, and 24 studies were ultimately included in the final meta-analysis. A breakdown of these papers showing authors, year, country of investigation, sample size, and number of factors considered is summarized in Table 1. These papers are arranged in chronological order of publication.

3.2. Building Factors’ RII Matrix Among Studies

Based on the factors and their importance as determined in the 24 articles, a two-dimension matrix table of factors’ importance is developed. In the matrix, the vertical title is the list of factors and the horizontal title is the papers selected, arranged in chronological order. This process entails completing two tasks: determining the list of factors appearing at least twice in the 24 selected papers and filling in the factors’ importance based on the values noted in the corresponding papers.
For the first task, pairwise comparisons are conducted across the 24 papers to identify identical factors. For each comparison, the identical factors between the two studies are paired manually looking to match factors with congruent meaning, cognizant that terminology may differ somewhat. To ensure reliability, predefined decision rules are used to identify identical factors across the two articles. These are as follows: (1) Whether factors referred to the same construct, concept, or theoretical dimension; (2) Whether they were used interchangeably in the original literature; (3) Whether they overlapped in core meaning despite differences in labeling or wording. These criteria are applied consistently during the manual comparison process. Totally, there are 276 times of pairwise comparisons and 276 groups of factors identical between two studies that can be derived. Subsequently, all factors identified can be summarized into a list.
The mean values and RII values are the two common methods for presenting the importance of factors affecting BNBD in the 24 articles. The two methods are essentially identical in reflecting the importance of factors. They only differ in form and can be mutually converted. For the purpose of future analysis, the mean values of factors are converted to RII values, according to the Likert scale chosen. The transformation is conducted as follows:
RIIij = kij/sj ∗ 100
where RIIij denotes the normalized importance of factor i in paper j, kij is the origin importance of factor i in paper j, sj is the scale value of the Likert scale in paper j. For example, where a factor’s mean value is rated 4.3 in a paper by a 1–5 Likert scale, its RII value converts to 86 (4.3/5 ∗ 100 = 86).
The RII of factors can be populated into a two-dimensional matrix table. Through pairwise comparisons of the 24 papers, 121 identical factors and their RII are determined, as shown in Table 2.

3.3. Validation of the Hypothesis

To validate the hypothesis, the cite frequency and RII of factors is determined first. The cite frequency of factors is determined by the papers selected. The number of selected papers is set to be no less than five. Conventionally, when reviewing literature, one would select articles published over several consecutive years. Thus, the articles are selected consecutively according to the order shown in Table 2. Each portfolio contains 12 articles, with 13 portfolios covering the full 24 articles, as shown in Appendix A. Each portfolio can produce a group of cite frequencies which are paired with the factors’ RII of its 12 articles. Thus, 12 articles can form 13 portfolios, and generate 156 (13 × 12 = 156) pairs of groups of cite frequency and RII. Totally, there are 210 portfolios of articles, generating 2380 pairs of groups of cite frequency and RII, as shown in Table 3 and Table 4. In each portfolio, the group of cite frequencies is the number of times each factor appears. Taking the factor “Project location” for example, the portfolio of 24 papers has a cite frequency of 20. In this way the RII of factors is determined for each study selected.
To verify the overall relationship between cite frequency and RII, the Spearman correlation coefficient (rho) is employed for analysis since the cite frequency is a nominal variable. The correlation coefficient takes on values from −1 to +1, where the sign indicates positive or negative correlation. The absolute value of the coefficient (rho) reflects the strength of correlation. In this study, the judgment of parameter suggested by Pallant J [39] is adopted, where rho < 0.30 equates to low strength, 0.30 ≤ rho < 0.50 equates to medium strength, and 0.50 ≤ rho ≤ 1.0 equates to high strength. A rho of less than 0.30 (including negative values) indicates low strength. Similarly, the significance level is taken as a measure of value confidence. A p-value of less than 0.05 suggests a coefficient with a high level of significance, affording confidence in the result. Finally, the hypothesis can be judged based on the percentage of medium and high rhos combined with high significance levels.

3.4. Optimization by Meta-Analyses Method

Where the validation of the hypothesis is not ideal, the Meta-Analyses approach may be taken to optimize the CFA. The Meta-Analyses method is adopted to integrate the RII values of each factor from different papers in a portfolio. Simply, the integrated RII values may be used instead of cite frequency values. Prior to integration, the heterogeneity test is conducted to confirm the model for integration.
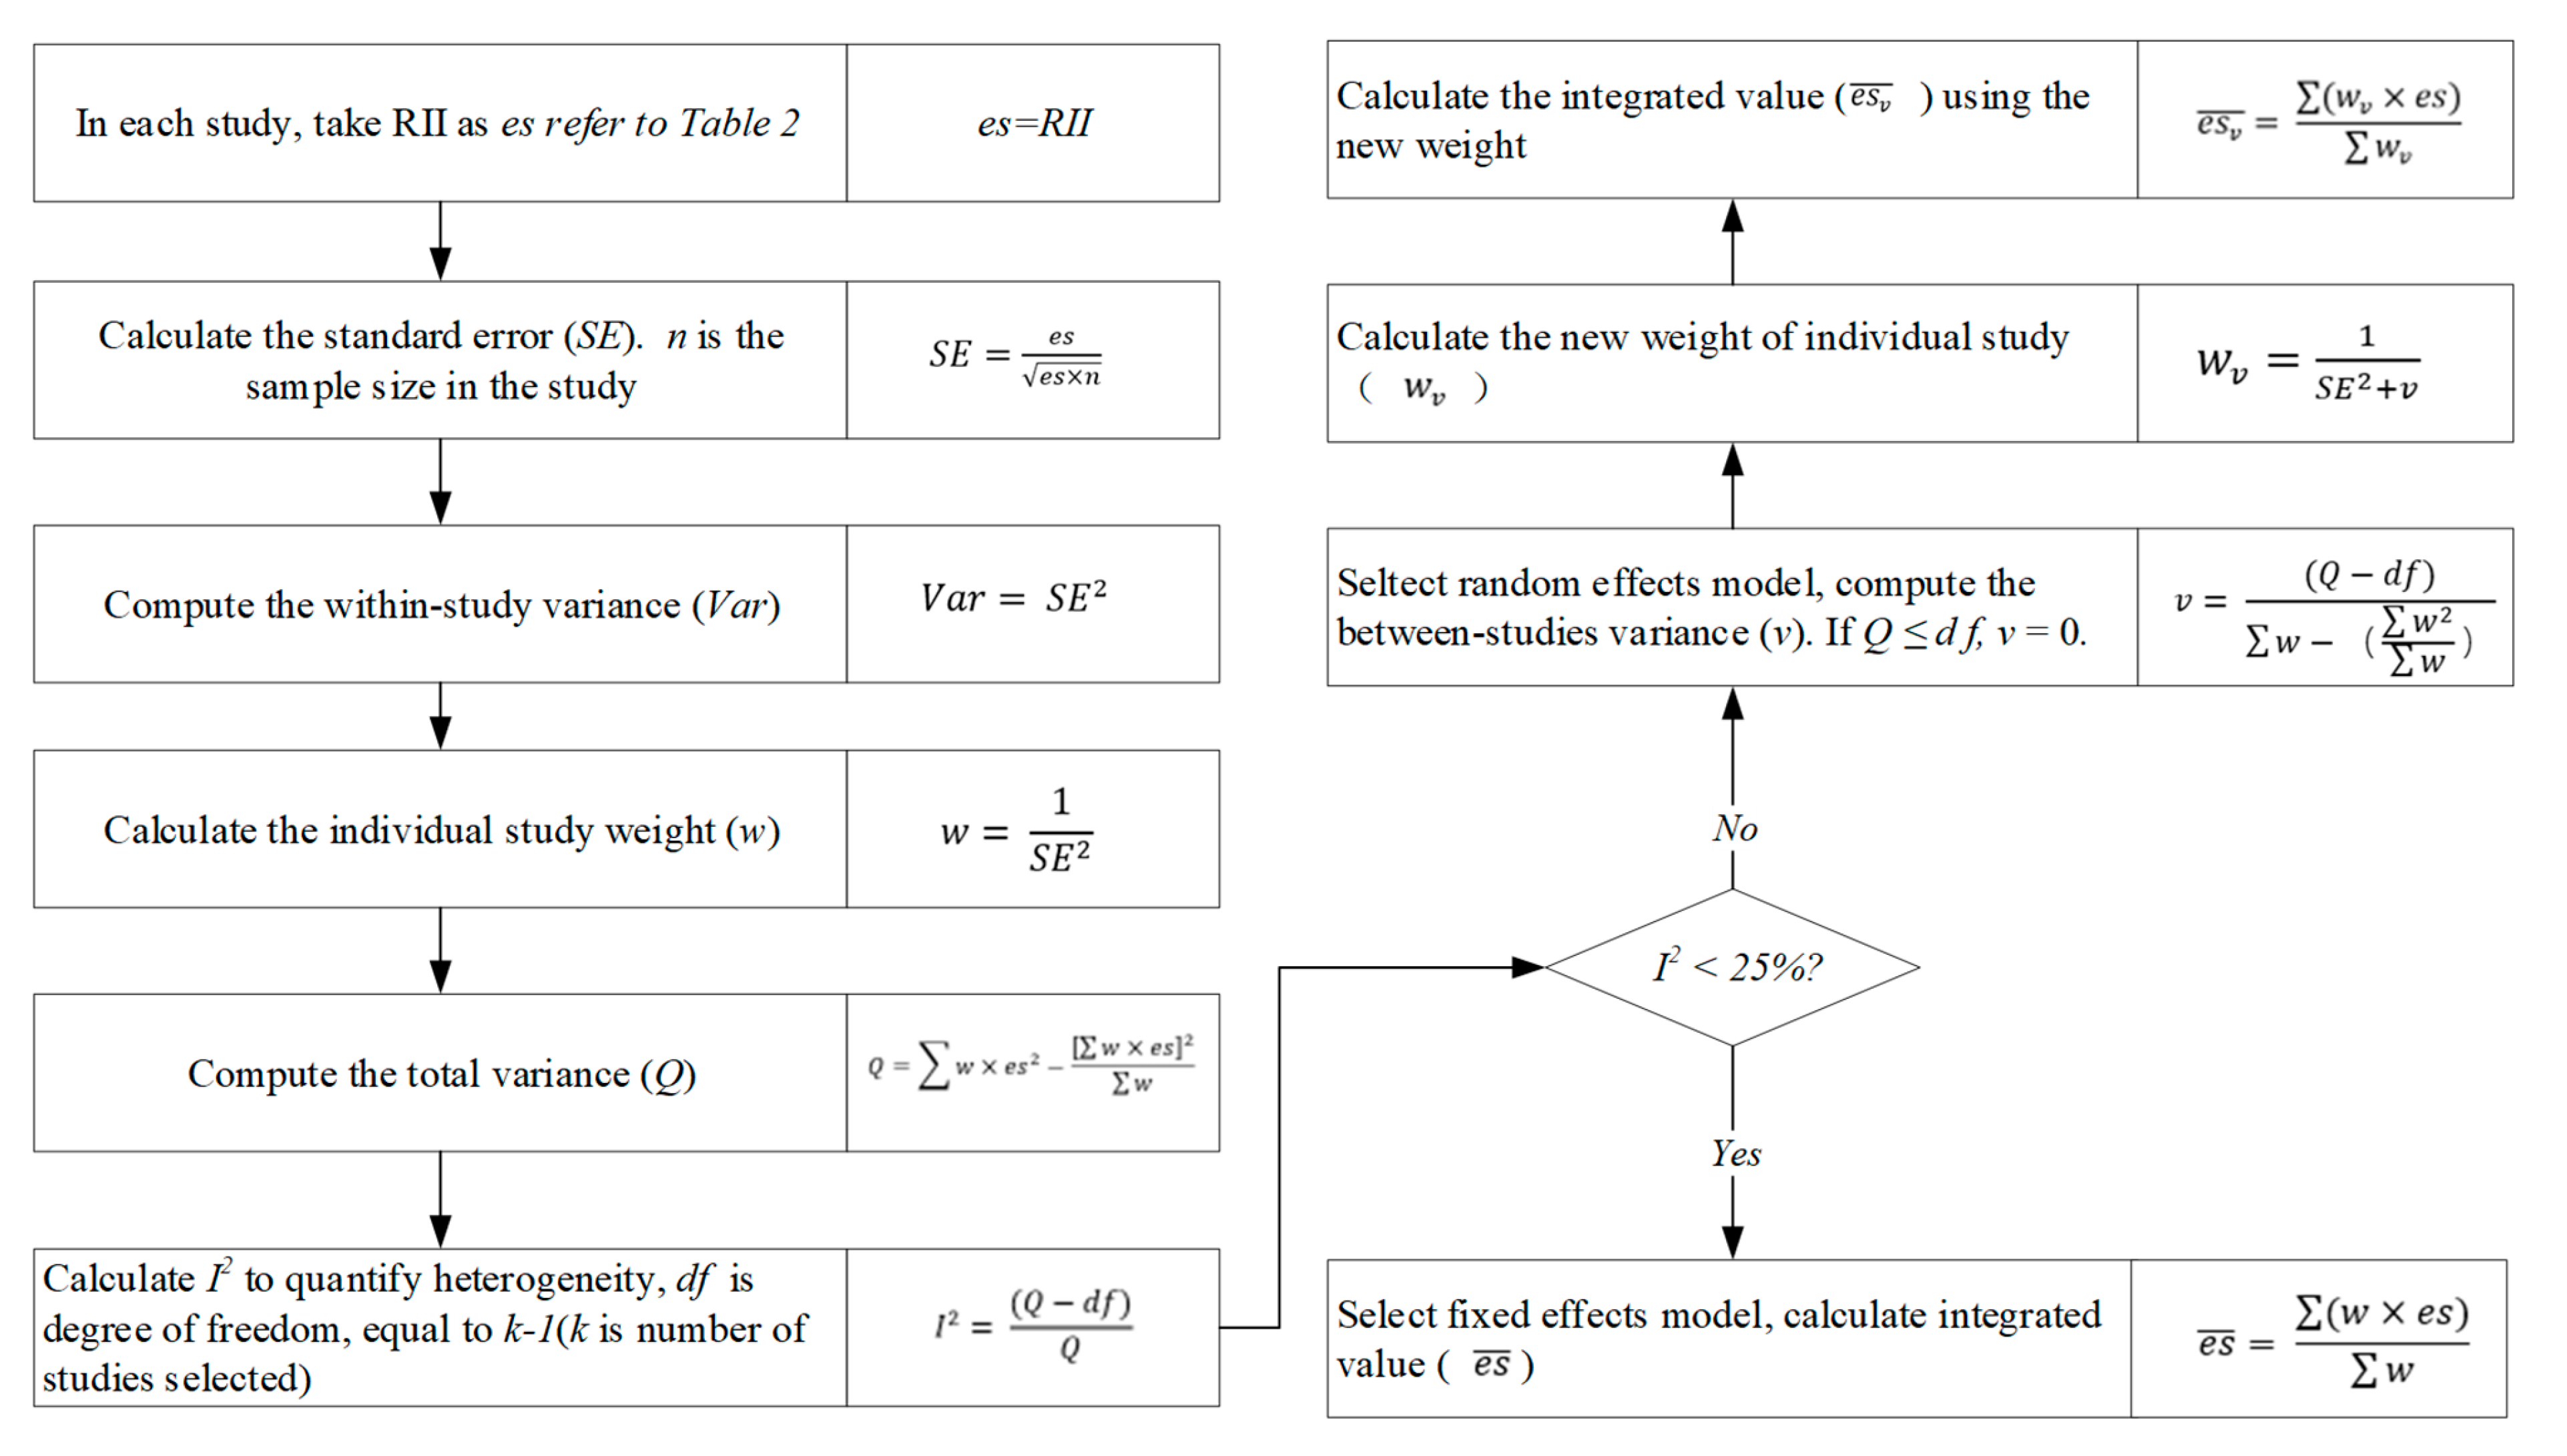
The heterogeneity test is used to check the variability in Meta-Analyses between findings of different studies. This variability stems from genuine differences across studies, rather than being attributable to random error. In this study, the result of the heterogeneity test explains the reasonability of the Cite Frequency Approach, at least to some extent. Thus, it is very important to quantify the heterogeneity, which can be determined by calculating the ratio of true heterogeneity to total observed variance (I2). According to the rule recommended by Higgins et al. [40], I2 > 75% indicates high heterogeneity, I2 between 25% and 75% implies moderate heterogeneity, and I2 < 25% indicates low heterogeneity. For low heterogeneity, a fixed-effects model is indicated. Conversely, a random-effects model is recommended for moderate or high heterogeneity [41]. Based on the rule mentioned above, the integration of RII of factors in each portfolio of studies is shown in Figure 2.
After the integrations of RII into study portfolios, the relationship between integrated RII in each study portfolio and factors’ RII is analyzed. Since the two different RII are continuous variables, the Pearson correlation coefficient (r) is used to determine their relationship. Outcome determination is the same as for the Spearman correlation.
To illustrate whether the MAA provides better representation, the comparison of the percentage of high and medium correlation coefficients between the two methods is first compared. Additionally, to enhance the persuasiveness of the data results and mitigate the impact of threshold settings, the paired samples T-test is used to compare the differences in correlation coefficients determined by the two methods. If the T-test significance level is less than 0.05 and the mean value of correlation coefficients ascertained by MAA is more than that determined by CFA, it can be concluded that the MAA is more advantageous than CFA in representativeness.

3.5. Effectiveness Comparison Between the Two Methods

Based on the above analyses, the results reveal differences in representativeness between the two methods. However, they do not reveal which is more effective. A comparison of the effectiveness of the CFA and MAA methods is required. Cite frequency and integrated RII are derived by processing the early findings of a study portfolio using the two methods, similar to the former two steps. After confirmation of a study portfolio, the remaining papers are ranked after the portfolio in chronological order. They are used to determine the arrays of RII for determination of the correlation coefficients with cite frequency and integrated RII. Based on the rule of judgement mentioned in the preceding two steps, the relative superiority of the two methods can be determined by assessing the proportion of medium and high coefficients that hold a high level of significance. And the paired samples T-test is also used to judge which one is more effective.

4. Data Analysis

4.1. Validation of Hypothesis

Based on the data of Table 2, all statistical data analysis is performed with the aid of Software R(Version 4.5.3), including the determination of study portfolios, the calculation of cite frequency, integration of RII, and the correlation analysis. There are 210 study portfolios, along with 2380 Spearman correlation coefficients (rho). According to their level of strength and significance, the correlation coefficients are classified into three types, calculating the proportion of each category in the total, as shown in Table 3.
Table 3 shows that there are 1723 coefficients at less than 0.3, 628 coefficients between 0.3 and 0.5, and 29 coefficients more than 0.5. However, coefficients greater than 0.3, that also carry a high level of significance, account for only 15.59% (14.41% + 1.18%). This result indicates that the hypothesis is largely untrue, but not entirely untrue. Simply, using cite frequency to represent the importance of factors is, more likely than not, misleading.

4.2. Representativeness of Meta-Analyses Method

The validation of the hypothesis reveals that the cite frequency calculated by CFA has limited presentiveness. In order to improve the CFA, the Meta-Analyses approach (MAA) is adopted to fuse the importance of factors within each study portfolio. The number of study portfolios and Pearson correlation coefficients (r) is the same as that used in the validation of the hypothesis. According to the process illustrated in Figure 2, the R software produces results as shown in Table 4. Table 4 presents identical content to Table 3 yet yields distinct results because of the use of alternative methodologies.
Table 4 shows that there are 147 coefficients at less than 0.3, with 394 coefficients between 0.3 and 0.5, and 1839 coefficients at more than 0.5. Coefficients greater than 0.3, and with a high level of significance, account for 87.86% (12.02% + 75.84%). Surprisingly, the results obtained using this method are an inversion of those obtained by CFA. Additionally, the paired samples T-test shows that the significance level of the test is less than 0.01, and the mean value of the correlation coefficients (0.613) ascertained by the MAA is obviously more than that (0.216) determined by the CFA.
To more intuitively illustrate the differences between the two methods, this paper presents the correlation coefficients obtained from portfolios made up of 12 articles, as shown in Appendix A. Even the number of studies in the portfolio changes, while the results obtained are similar. However, due to space limitations, not all items are shown here. Both the coefficient strength and number of coefficients with high significance level are better captured by Meta-Analyses than by CFA. From both a holistic and a local perspective, the findings demonstrate that the RII fused by Meta-Analyses is more representative than the cite frequency calculated by CFA.

4.3. Result of the Effectiveness Comparison

Unlike the analyses mentioned above, the objects of the correlation analysis have changed, and therefore the number of correlation coefficients has also changed. There are 210 study portfolios, with 1330 coefficients. According to the methodology described above along with the calculation process followed earlier, R software is used to produce the correlation coefficients as determined by the two methods. The two sets of data are compared in Table 5. The coefficients (rho) as determined by CFA, at 0.3 or above with a high level of significance, account for 5.94% (5.34% + 0.60%). While the coefficient (r), as determined by MAA at 0.3 or above with a high level of significance, accounts for 31.81% (18.65% + 13.16%). The number of high strength coefficients, as determined by MAA, is nearly five times that determined by CFA. Furthermore, the paired samples T-test indicates that the significance level of the test is less than 0.01, and the mean values of the coefficients (0.316) are greater than that (0.168) determined by CFA. The clear conclusion is that the MAA is more effective than the CFA.

5. Discussion

5.1. Validation of the Hypothesis

Results of the data analysis call for a rejection of the hypothesis. This outcome is consistent with the finding of Oo et al. [21], demonstrating that CFA-based identification of potential factors is unjustified. This study acknowledges and affirms the contribution made by Oo et al. [21] in challenging the CFA method. Nevertheless, in contrast to the analysis conducted by Oo et al. [21], the results of this study are fully global in scope and robust in their conclusion. Primarily, the findings of Oo et al. [21] are derived from the differences of ranking between RII and the citation frequency of certain factors, while the findings reported here are derived from the correlation coefficients between cite frequency and RII. The former study only analyzed local differences for a subset of factors, whereas this study examines the global relationship across all factors. Additionally, the conclusions drawn by Oo et al. [21] were based on a single portfolio of studies (one case), whereas the present study employed a large number of diverse portfolios (210), generating 2380 coefficients. Ultimately, the study of Oo et al. [21] aimed to provide a comprehensive list of potential factors affecting BNBD, while this study aims to systemically elucidate the theoretical basis of CFA. The significant refinements of this study over that of Oo et al. demonstrate the novelty of the present work.
Simply, the result of this study categorically demonstrates that the CFA method for identifying potentially important BNBD factors is flawed, and that the method lacks a sound theoretical basis. The finding carries important implications for both researchers and industry practitioners. As for researchers, the result warns against over-reliance on citation counts in assessing the theoretical or practical importance of factors. Researchers should avoid assuming that highly cited factors are the most critical. For practitioners, the findings remind decision-makers in bid/no-bid situations to resist prioritizing factors based only on the frequency with which they are mentioned in the literature. Instead, they should focus on empirically supported metrics.
Additionally, the validation of the hypothesis does not completely negate the usability of the CFA. In some cases, citation frequency can reflect the importance of a factor. In the study of Odusote and Fellows [18], they pointed out that a positive correlation is shown for the cite frequency obtained from previous studies and factor’s RII obtained from a questionnaire survey. Meanwhile, in analyzing the correlation coefficients, we found that some research results from certain countries did show a high frequency of correlation across many portfolios. Examples of such studies are that of Jarkas et al. [28], conducted in Qatar, and that of Bageis et al. [36], carried out in Saudi Arabia. This phenomenon may be explained from the following two perspectives. First, in the 24 articles shown in Table 1, the studies of 13 articles were implemented in Middle Eastern countries, which share a high degree of homogeneity. In addition, Li et al. [42] revealed that contractors from certain countries exhibit homogeneity in their perceptions of the importance of factors influencing BNBD. In their study, they grouped Saudi Arabia, Qatar, Turkey, Nigeria, Egypt, Syria, and Jordan into one category. This demonstrates homogeneity among Middle Eastern countries in respect of the importance of BNBD factors, as well as substantial heterogeneity between many African countries and Middle Eastern countries.

5.2. Enrichment of Approach in Identifying Potential BNBD Factors

Meta-Analyses can be taken as an effective method for identifying potential factors influencing decision-making, not only in regard to the bid/no-bid decision. In terms of both representativeness and effectiveness, CFA was validated to be inferior to the Meta-Analyses approach. Oo et al. [21] addressed a list of 28 critical factors affecting BNBD by using Meta-Analyses to synthesize the factors influencing the decision to bid or not bid, in multiple studies. Their research focused on potential factors influencing BNBD, rather than methods for identifying these factors. Therefore, there is a lack of work validating the superiority of the Meta-Analyses method. This study stems from a critique of the CFA for identifying latent factors. While identifying the critical problems with the CFA methodology, this study also considers better methods to compensate for its shortcomings. During the literature review, it was found that meta-methods can effectively synthesize the results of numerous studies. Therefore, this paper used Meta-Analyses to synthesize the RII of BNBD factors and verified that this method is superior to the CFA. The method of using the importance of factors is superior to the method of using the cite frequency of factors. Thus, Meta-Analyses methods are not only used to identify factors influencing BNBD but can also be applied to the identification of other decision-making factors.

5.3. Limitations

This study is not without limitations. The first limitation is that this study only focuses on one decision domain. There is a plethora of studies that focus on BNBD, providing the necessary conditions to conduct this research. However, the BNBD is just one of many domains of decision making. In this sense, the findings of this study lack generalizability. Second, the identification of identical factors is determined manually, which while time-consuming, also introduced a measure of subjectivity. The process relies on the researchers’ thematic and semantic judgment, and conceivably different analysts may produce slightly different categorizations. Future research efforts mitigating this limitation might benefit from the employment of inter-coder reliability tests, structured coding schemes, or computational semantic analysis (e.g., text mining, NLP).

6. Conclusions

In order to validate the hypothesis proposed, an analysis of the relationship between cite frequency and the factor’s importance was undertaken. Through a literature review based on PRISMA, 24 papers invoking BNBD factors’ importance across nearly 40 years of research were analyzed. By comparing these papers pairwise, a matrix of factors’ RII among 24 papers was built. Based on the data of the matrix, 2380 rhos between cite frequency and RII were calculated, where 15.59% of rhos showed median and high relationships at significant levels. The result illustrates that cite frequencies of factors in previous studies cannot be highly representative of their importance. This means the CFA is not a reliable indicator of potential factors. To compensate for the shortcomings of the CFA, the MAA was developed as a more reliable alternative to identify the potential factors. This was verified as substantially more representative and effective than the CFA.
As a result of this study, two implications can be drawn, as follows:
(1)
The introduction of MAA is not a replacement for CFA, but rather a complement. While cite frequency offers some degree of insight into the importance of a factor, it does not provide a complete picture. Given the importance of factors, the MAA augments shortcomings of the former. However, the weakness of the MAA is that it is informed by the importance value of factors as determined in previous studies. Thus, it is prudent to employ the CFA at the initial stages of research. As the body of research grows and more studies identify the importance of factors, the MAA can be expected to become more reliable.
(2)
MAA provides a list of potential factors that is universally applicable, but the heterogeneity that exists across different backgrounds needs to be considered. The most significant characteristic of Meta-Analyses is its synthesis of numerous research findings, reflecting their common features, rather than any special feature of individual studies. Thus, the potential factors identified by MAA reflect the common critical factors of all studies, where the heterogeneity of any specific study may be neglected. After the determination of the potential factors identified by MAA, a pilot study and expert interviews should be used to supplement potential factors in accordance with specific study conditions.
This study has three key contributions. Primarily, it provides the first systematic and global validation of CFA’s core assumption. In addition, this research tested the relationship between citation frequency and RII across numerous diverse study portfolios, ensuring robust and generalizable conclusions. Finally, where the core assumption of CFA is largely rejected, the study proposes an improved factor selection method (MAA), which was verified to be more representative and effective than CFA.

Author Contributions

Conceptualization, G.L. and C.C.; methodology, G.L.; software, D.Y.; validation, D.Y. and Y.Z.; formal analysis, G.L.; investigation, L.C.; resources, Y.Z.; data curation, D.Y.; writing—original draft preparation, G.L.; writing—review and editing, I.M.; visualization, Y.Z.; supervision, C.C.; project administration, C.C.; funding acquisition, C.C. All authors have read and agreed to the published version of the manuscript.

Funding

This study is supported by the National Natural Science Foundation of China (No. 71971147, 71872180) and State Key Laboratory of Geohazard Prevention and Geo-environment Protection Independent Research Project (SKLGP2025Z004).

Data Availability Statement

Data used and analyzed during this study are available from the corresponding author by request.

Conflicts of Interest

The authors declare no conflict of interest.

Appendix A

Table A1. Comparison the results determined by the two methods in 12 study portfolios.
Cite Frequency Approach (CFA)
PortfoliosA1A2A3A4A5A6A7A8A9A10A11A12A13A14A15A16A17A18A19A20A21A22A23A24
A1–A120.353 *0.325 *0.0350.446 **0.1480.168−0.1080.3170.359 *0.319 *0.535 *0.137
A2–A13 0.332 *0.1440.418 *0.1930.224−0.1170.2460.403 **0.349 *0.5 *0.1460.06
A3–A14 0.1870.452 **0.2210.228−0.0990.3320.422 **0.386 *0.4060.1680.0860.133
A4–A15 0.468 **0.1830.239 *−0.0650.3150.423 **0.348 *0.512 *0.2050.0720.166−0.09
A5–A16 0.1660.275 *−0.0750.2310.459 **0.37 *0.4770.2220.0830.162−0.0230.152
A6–A17 0.274 *−0.0850.2730.419 **0.354 *0.380.2180.1030.128−0.0180.2150.322
A7–A18 −0.0980.2840.437 **0.351 *0.3840.1820.0980.165−0.0110.1930.3390.05
A8–A19 0.2360.448 **0.2910.3610.2310.0810.2−0.010.1630.3720.0360.139
A9–A20 0.46 **0.2810.1670.250.090.1950.0540.1460.3210.0310.1370.299
A10–A21 0.2510.0190.2670.0940.239−0.0080.1880.2870.0410.1620.3180.383 *
A11–A22 −0.0640.2690.1110.2030.0410.1710.343−0.0160.0670.350.356 *0.092
A12–A23 0.2590.1720.2120.0350.2120.3570.0210.110.3410.3280.057−0.01
A13–A24 0.1630.2850.1290.1580.3670.0180.0290.3490.3320.0140.0510.224
Meta-Analyses Approach (MAA)
PortfoliosA1A2A3A4A5A6A7A8A9A10A11A12A13A14A15A16A17A18A19A20A21A22A23A24
A1–A120.72 **0.664 **0.758 **0.813 **0.67 **0.685 **0.714 **0.592 **0.688 **0.819 **0.679 **0.701 **
A2–A130.618 **0.738 **0.816 **0.669 **0.696 **0.715 **0.59 **0.687 **0.849 **0.669 **0.67 **0.48 *
A3–A140.686 **0.845 **0.649 **0.674 **0.695 **0.708 **0.683 **0.813 **0.639 **0.704 **0.469 *0.551 **
A4–A150.859 **0.724 **0.66 **0.782 **0.76 **0.65 **0.832 **0.614 *0.67 **0.56 **0.547 **0.539 **
A5–A160.739 **0.757 **0.833 **0.785 **0.738 **0.844 **0.588 *0.699 **0.486 *0.518 **0.617 **0.61 **
A6–A170.747 **0.842 **0.755 **0.73 **0.844 **0.544 *0.685 **0.464 *0.472 **0.627 **0.652 **0.721 *
A7–A180.841 **0.786 **0.643 **0.834 **0.595 *0.68 **0.458 *0.454 **0.658 **0.614 **0.678 *0.796 **
A8–A190.782 **0.659 **0.771 **0.525 *0.733 **0.501 *0.528 **0.616 **0.622 **0.74 *0.755 **0.295
A9–A200.632 **0.759 **0.539 *0.721 **0.459 *0.51 **0.562 **0.627 **0.714 *0.723 **0.2790.38 *
A10–A210.769 **0.4930.714 **0.456 *0.493 **0.551 **0.653 **0.7 *0.704 **0.2690.3580.606 **
A11–A220.4220.693 **0.2960.562 **0.479 **0.678 **0.6220.688 **0.3260.2640.614 **0.474 **
A12–A230.669 **0.2930.535 **0.476 **0.683 **0.7 *0.76 **0.3720.2780.604 **0.456 **0.388 *
A13–A240.0040.565 **0.394 *0.508 **0.5110.713 **0.3880.260.586 **0.569 **0.2460.774 **
Note: A1–A12 Presents the portfolios of 12 articles from A1, A2, …, A12; * indicates p value is less than 0.05, ** means p value is less than 0.01.

References

  1. Wanous, M.; Boussabaine, H.A.; Lewis, J. A Neural Network Bid/No Bid Model: The Case for Contractors in Syria. Constr. Manag. Econ. 2003, 21, 737–744. [Google Scholar] [CrossRef] [Scilit]
  2. Jarkas, A.M. Primary Factors Influencing Bid Mark-up Size Decisions of General Contractors in Kuwait. J. Financ. Manag. Prop. Constr. 2013, 18, 53–75. [Google Scholar] [CrossRef] [Scilit]
  3. Ahmad, I.; Minkarah, I. Questionnaire Survey on Bidding in Construction. J. Manag. Eng. 1988, 4, 229–243. [Google Scholar] [CrossRef] [Scilit]
  4. Shash, A.A. Factors Considered in Tendering Decisions by Top UK Contractors. Constr. Manag. Econ. 1993, 11, 111–118. [Google Scholar] [CrossRef] [Scilit]
  5. Egemen, M.; Mohamed, A. A Framework for Contractors to Reach Strategically Correct Bid/No Bid and Mark-up Size Decisions. Build. Environ. 2007, 42, 1373–1385. [Google Scholar] [CrossRef] [Scilit]
  6. El-mashaleh, M.S. Empirical Framework for Making the Bid/No-Bid Decision. J. Manag. Eng. 2013, 29, 200–205. [Google Scholar] [CrossRef] [Scilit]
  7. Leśniak, A.; Plebankiewicz, E. Modeling the Decision-Making Process Concerning Participation in Construction Bidding. J. Manag. Eng. 2015, 31, 04014032. [Google Scholar] [CrossRef] [Scilit]
  8. Olatunji, O.A.; Aje, O.I.; Makanjuola, S. Bid or No-Bid Decision Factors of Indigenous Contractors in Nigeria. Eng. Constr. Archit. Manag. 2017, 24, 378–392. [Google Scholar]
  9. Chileshe, N.; Kavishe, N.; Edwards, D.J. Critical Factors Influencing the Bid or No-Bid Decision of the Indigenous Small Building Contractors in Tanzania. Constr. Innov. 2020, 21, 182–202. [Google Scholar] [CrossRef] [Scilit]
  10. Li, G.; Chen, C.; Zhang, G.; Martek, I. Bid/No-Bid Decision Factors for Chinese International Contractors in International Construction Projects. Eng. Constr. Archit. Manag. 2020, 27, 1619–1643. [Google Scholar] [CrossRef] [Scilit]
  11. Dodanwala, T.C.; Santoso, D.S. Critical Factors Influencing the Bid/No-Bid Decisions of Small and Medium-Sized Contractors in Sri Lanka. Int. J. Constr. Educ. Res. 2024, 21, 24–29. [Google Scholar] [CrossRef] [Scilit]
  12. Fayek, A.; Ghoshal, I.; AbouRizk, S. A Survey of the Bidding Practices of Canadian Civil Engineering Construction Contractors. Can. J. Civ. Eng. 1999, 26, 13–25. [Google Scholar] [CrossRef]
  13. Maqsoom, A.; Shaheen, I.; Asshraf, H.; Zahoor, H.; Khan, S.Y. Intrinsic Factors Influencing the Bid/No-Bid Decision of Pakistani Contractors. In Proceedings of the ICCREM 2020: Intelligent Construction and Sustainable Buildings, Stockholm, Sweden, 24–25 August 2020; American Society of Civil Engineers: Reston, VA, USA, 2020; pp. 602–610. [Google Scholar]
  14. Cheng, M.-Y.; Hsiang, C.-C.; Tsai, H.-C.; Do, H.-L. Bidding Decision Making For Construction Company Using A Multi-Criteria Prospect Model. J. Civ. Eng. Manag. 2011, 17, 424–436. [Google Scholar] [CrossRef] [Scilit]
  15. Mohamed, M.; Emad, M. Modeling Bid/No Bid Decisions Using Fuzzy Fault Tree. Constr. Innov. 2018, 18, 90–108. [Google Scholar] [CrossRef] [Scilit]
  16. Hassanein, A.A.G.; Hakam, Z.H.R. A Bidding Decision Index for Construction Contractors. Build. Res. Inf. 1996, 24, 237–244. [Google Scholar] [CrossRef] [Scilit]
  17. Bageis, A.S.; Fortune, C. Factors Affecting the Bid/No Bid Decision in the Saudi Arabian Construction Contractors. Constr. Manag. Econ. 2009, 27, 53–71. [Google Scholar] [CrossRef] [Scilit]
  18. Odusote, O.O.; Fellows, R.F. An Examination of the Importance of Resource Considerations When Contractors Make Project Selection Decisions. Constr. Manag. Econ. 1992, 10, 137–151. [Google Scholar] [CrossRef] [Scilit]
  19. Gunduz, M.; Al-Ajji, I. Employment of CHAID and CRT Decision Tree Algorithms to Develop Bid/No-Bid Decision-Making Models for Contractors. Eng. Constr. Archit. Manag. 2022, 29, 3712–3736. [Google Scholar] [CrossRef] [Scilit]
  20. Zhang, Y.; Oo, B.L.; Lim, B.T.H. Factors Affecting Contractors’ Bid or No-Bid and Mark-up Decisions: A Case of the Jilin Province, China. Constr. Innov. 2023, 23, 1232–1254. [Google Scholar] [CrossRef] [Scilit]
  21. Oo, B.L.; Lim, T.H.B.; Runeson, G. Critical Factors Affecting Contractors’ Decision to Bid: A Global Perspective. Buildings 2022, 12, 379. [Google Scholar] [CrossRef] [Scilit]
  22. Sanni-Anibire, M.O.; Mohamad Zin, R.; Olatunji, S.O. Causes of Delay in the Global Construction Industry: A Meta Analytical Review. Int. J. Constr. Manag. 2022, 22, 1395–1407. [Google Scholar] [CrossRef] [Scilit]
  23. Hussein, M.; Zayed, T. Critical Factors for Successful Implementation of Just-in-Time Concept in Modular Integrated Construction: A Systematic Review and Meta-Analysis. J. Clean. Prod. 2021, 284, 124716. [Google Scholar] [CrossRef] [Scilit] [PubMed]
  24. Wanous, M.; Boussabaine, A.H.; Lewis, J. Tendering Factors Considered by Syrian Contractors. In Proceedings of the 14th Annual ARCOM Conference; University of Reading. Association of Researchers in Construction Management: Liverpool, UK, 1998; Volume 2, pp. 535–543. [Google Scholar]
  25. Enshassi, A.; Mohamed, S.; El Karriri, A. Factors Affecting the Bid/No Bid Decision in the Palestinian Construction Industry. J. Financ. Manag. Prop. Constr. 2010, 15, 118–142. [Google Scholar] [CrossRef] [Scilit]
  26. Enshassi, A.; Mohamed, S.; El Karriri, A. Factores Affecting Bid/No Bid Decision in the Gaza Strip-Congtractors’ Perspective. Rev. Ing. Construcción 2011, 26, 41–60. [Google Scholar] [CrossRef] [Scilit]
  27. Fidelis Asuquo, C.; Nwahizu, C. Factors Affecting Building Contractors’ Decision To Tender. J. Environ. Des. 2012, 7, 148–154. [Google Scholar]
  28. Jarkas, A.M.; Mubarak, S.A.; Kadri, C.Y. Critical Factors Determining Bid / No Bid Decisions of Contractors in Qatar. J. Manag. Eng. 2014, 30, 0501400. [Google Scholar] [CrossRef] [Scilit]
  29. Leśniak, A. Reliability Assessment of Research into Contractors’ Bidding Decisions. Procedia Eng. 2015, 122, 251–257. [Google Scholar] [CrossRef] [Scilit]
  30. Oyeyipo, O.O.; Odusami, K.T.; Ojelabi, R.A.; Afolabi, A.O. Factors Affecting Contractors’ Bidding Decisions for Construction Projects in Nigeria. J. Constr. Dev. Ctries. 2016, 21, 21–35. [Google Scholar] [CrossRef] [Scilit]
  31. Shokri-Ghasabeh, M.; Chileshe, N. Critical Factors Influencing the Bid/No Bid Decision in the Australian Construction Industry. Constr. Innov. 2016, 16, 127–157. [Google Scholar] [CrossRef] [Scilit]
  32. Maqsoom, A.; Farjad, M.M.; Abbas, M.S.; Ehtesham-ul-haque, M. Strategic Factors Influencing Bid/No-Bid Decision of Pakistani Contractors. In Proceedings of the 21st International Symposium on Advancement of Construction Management and Real Estate; Springer: Singapore, 2018; pp. 1345–1353. [Google Scholar]
  33. Oke, A.; Omoraka, A.; Olatunbode, A. Appraisal of Factors Affecting Bidding Decisions in Nigeria. Int. J. Constr. Manag. 2018, 20, 169–175. [Google Scholar] [CrossRef] [Scilit]
  34. Wang, J.; Wang, L.; Ye, K.; Shan, Y. Will Bid/No-Bid Decision Factors for Construction Projects Be Different in Economic Downturns? A Chinese Study. Appl. Sci. 2020, 10, 1899. [Google Scholar]
  35. Alsaedi, M.; Assaf, S.; Hassanain, M.A.; Abdallah, A. Factors Affecting Contractors’ Bidding Decisions for Construction Projects in Saudi Arabia. Buildings 2019, 9, 33. [Google Scholar] [CrossRef] [Scilit]
  36. Bageis, A.; Falqi, I.I.; Alshehri, A.; Alsulamy, S.; Alsahli, T.A. Behavioral Differences Towards Internal and External Factors in Making the Bid/No Bid Decision. Civ. Eng. J. 2019, 5, 1189–1196. [Google Scholar] [CrossRef] [Scilit]
  37. Chileshe, N.; Edwards, D.J.; Kavishe, N.; Haupt, T.C. Perception on Challenges Impacting Bid Decision of Indigenous Building Contractors in Dar Es Salaam, Tanzania. J. Eng. Des. Technol. 2020, 18, 1641–1662. [Google Scholar] [CrossRef] [Scilit]
  38. Gunduz, M.; Lutfi, H.M.A. Go/No-Go Decision Model for Owners Using Exhaustive CHAID and QUEST Decision Tree Algorithms. Sustainability 2021, 13, 815. [Google Scholar] [CrossRef] [Scilit]
  39. Pallant, J. SPSS Survival Manual, 6th ed.; McGraw-Hill Education: London, UK, 2016; ISBN 0335208908. [Google Scholar]
  40. Higgins, J.P.T.; Thompson, S.G.; Deeks, J.J.; Altman, D.G. Measuring Inconsistency in Meta-Analyses. BMJ 2003, 327, 557–560. [Google Scholar] [CrossRef] [Scilit] [PubMed]
  41. Deeks, J.J.; Higgins, J.P.T.; Altman, D.G. Analysing Data and Undertaking Meta-Analyses. In Cochrane Handbook for Systematic Reviews of Interventions; John Wiley & Sons, Ltd.: Hoboken, NJ, USA, 2019; pp. 241–284. [Google Scholar] [CrossRef] [Scilit]
  42. Li, G.; Chen, C.; Dai, J. The Relationships of the Bid No Bid Decision Factors Considered among Local Contractors from Different Countriese. In Proceedings of the 24th International Symposium on Advancement of Construction Management and Real Estate; Springer: Singapore, 2021; pp. 1047–1061. [Google Scholar]
Figure 1. PRISMA flow diagram for screening and selecting relevant studies.
Buildings 16 01322 g001
Figure 2. Process of integration of RII by Meta-Analyses.
Buildings 16 01322 g002
Table 1. Profile of studies on bid/no-bid decision.
No.AuthorsYearCountrySample SizeNumber of Factors
A1Ahmad and Minkarah [3]1988USA9031
A2Shash [4] 1993UK8555
A3Wanous et al. [24]1998Syria6138
A4Egemen and Mohame [5]2007Turkey8084
A5Bageis and Fortune [18]2009Saudi Arabia9139
A6Enshassi et al. [25]2010Palestine6578
A7Enshassi et al. [26]2011Palestine7794
A8Fidelis Asuquo et al. [27]2012Nigeria6420
A9El-mashaleh [6]2013Jordan4353
A10Jarkas et al. [28]2014Qatar9243
A11Leśniak et al. [29]2015Poland6116
A12Oyeyipo et al. [30]2016Nigeria5548
A13Shokri-Ghasabeh et al. [31]2016Australia8126
A14Olatunji et al. [8]2017Nigeria6441
A15Marzouk and Mohamed [15]2017Egypt2238
A16Maqsoom et al. [32]2018Pakistan16724
A17Oke et al. [33]2018Nigeria10018
A18Wang et al. [34]2018China10933
A19Mohammad et al. [35]2019Saudi Arabia6731
A20Bageis et al. [36]2019Saudi Arabia9726
A21Chileshe et al. [37]2020Tanzania3330
A22Gunduz and Al-Ajj [38]2021Qatar16934
A23Zhang et al. [20]2023China2040
A24Dodanwala and Santoso [11]2024Sri Lanka27643
Table 2. Matrix of factors identified with RII in 24 articles.
No.Factors (ei,j)A1A2A3A4A5A24Total Frequency
1Project location76.48 74.12 -13.30 79.1275.11 20
2Project duration52.82 51.43 55.5-73.8977.84 20
3Project type84.82 78.57 ---78.42 19
4Experience with similar projects-83.16 6477.90 8559.78 19
5Project size73.70 75.46 73.17-82.2295.32 19
6Financial capability of the client-58.50 77.6789.20 94.8780.43 18
7Current workload73.70 83.16 65.8390.40 80.5690.36 18
8Availability of qualified technical staff-71.6058.0069.4078.1683.8117
117Degree of difficulty73.3361.73----2
118Confidence in workforce70.5562.99----2
119Capital requirement51.12-----2
120Quality of the available labor-68.20----2
121Project supervision procedure-----73.63-2
Note: The A1…A24 is same as that in Table 1, which represents the articles collected. “-” means a factor is not in one paper. “…” denotes represents too much information to be shown here.
Table 3. The number of rhos and percentage of rhos with significant level (CFA).
Number of StudiesNumber of
Portfolios
Number of
Coefficients
Number of Coefficients
rho < 0.30p < 0.050.30 ≤ rho < 0.50p < 0.05rho ≥ 0.5p < 0.05
52010084013732
61910493119922
718126960291411
817136982361822
9161441002432211
10151501036452322
11141541024492533
12131561073462533
13121561113432522
14111541124382544
15101501105372433
1691441054382311
1781361005352311
187126923332011
196104821321800
205100722281500
21484593251100
2236648218800
2324633113600
241241618200
In total21023801723526283432928
Percentage 100%72.39%2.18%26.39%14.41%1.22%1.18%
Table 4. The number of r and percentage of r with significant level (MAA).
Number of StudiesNumber of
Portfolios
Number of
Coefficients
Number of Coefficients
r < 0.30p < 0.050.30 ≤ r < 0.50p < 0.05rho ≥ 0.5p < 0.05
52010050868787
61910470989898
718126501412107106
817136502018111109
916144402316117116
1015150302816119119
1114154702718120119
12131561002317123121
1312156902116126122
14111541002315121116
15101501002114119113
1691441002114113108
178136100251410198
18712610027188986
19610410024188079
2051009022176969
214848022185454
223667018154141
232465011103030
2412430761414
In total2102380147039428618391805
Percentage 100%6.18%0.00%16.55%12.02%77.27%75.84%
Table 5. Effectiveness comparison between the two methods.
MethodsItemsRho(r) < 0.300.30 ≤ rho(r) < 0.500.50 ≤ rho/(r) ≤ 1.0
Cite Frequency ApproachNumber of coefficients113218810
Number of coefficients (p < 0.05)0718
Proportion of coefficients (p < 0.05)0.00%5.34%0.60%
Meta-Analyses ApproachNumber of coefficients688457185
Number of coefficients (p < 0.05)0248175
Proportion of coefficients (p < 0.05)0.00%18.65%13.16%
Disclaimer/Publisher’s Note: The statements, opinions and data contained in all publications are solely those of the individual author(s) and contributor(s) and not of MDPI and/or the editor(s). MDPI and/or the editor(s) disclaim responsibility for any injury to people or property resulting from any ideas, methods, instructions or products referred to in the content.