Article

Spatial Distribution and Influencing Factors of Speech Intelligibility in Round-Table Conversation Scenarios


1
School of Civil Engineering and Architecture, Guangxi University, East Daxue Road, No. 100, Nanning 530004, China
2
School of Forestry, Guangxi University, Nanning 530004, China
*
Author to whom correspondence should be addressed.
Buildings 2026, 16(6), 1258; https://doi.org/10.3390/buildings16061258
Submission received: 6 March 2026 / Revised: 19 March 2026 / Accepted: 20 March 2026 / Published: 23 March 2026
(This article belongs to the Section Building Energy, Physics, Environment, and Systems)

Abstract

Round-table conversations, as common social environments, greatly depend on effective verbal communication to enrich the interactive experience. However, considerable variations in speech intelligibility (SI) occur among listeners at different positions under negative factors. This study employed numerical simulations, in situ measurements, and subjective listening tests to evaluate the main factors affecting SI, and quantified SI using the Speech Transmission Index (STI) and Speech Reception Threshold (SRT). The results demonstrate that SI varies with listener position, with the extent of these variations surpassing expectations. The listeners closer to the speaker have a significantly greater SI than those across the table, with STI variations reaching 0.55 in the free field and 0.23 (SRT variations up to 3.1 dB) in the actual room. Both speaker orientation and listener head orientation greatly influence SI distribution and its positional sensitivity. Furthermore, the overall STI among listeners decreases by no more than 0.2 for each increase in table diameter. Overall, the trend of the change in SI in the actual room is essentially consistent with those in the free field, but reflections improve SI for listeners in less favorable positions. These findings reveal SI distribution patterns in round-table scenarios, providing evidence and insights for future research.

1. Introduction

Round-table discussions are a common and popular form of social interaction that frequently occur in both everyday situations and professional environments, such as official meetings, business talks, and family events. The distinctive circular design of the round table encourages unfettered interactions among participants, establishing an open and inclusive communication atmosphere that reflects the values of equal speaking opportunity, comprehensive discussion, and fair treatment for everyone present [1]. For functionality, round tables feature a smooth, continuous circular perimeter with no sharp corners, enabling high seating efficiency and the ability to accommodate more people. Owing to the importance of round-table discussions, it is crucial for speakers to be heard clearly by all participants. Thus, as the need for better acoustic environments grows, studying communication efficiency in these settings is quite important [2]. Unfortunately, the unique acoustic issues in this context have been largely overlooked and require further study.
High-quality verbal communication plays a vital role in round-table conversations and is often characterized by speech intelligibility (SI) [3]. In these settings, participants sit in a circle, leading to a radially symmetric pattern between speakers and listeners. This setup might cause specific spatial changes in SI due to shifting relative positions. With respect to indoor acoustic transmission, sound waves from a speaker reflect off room boundaries and are scattered and diffracted by participants’ physiological structures before they reach the ears [4,5]. Factors such as head shadow [6], the speaker’s radiation pattern [7] (e.g., directivity), and the acoustic environment jointly affect the quality of the received speech. Without a sound reinforcement system, SI may vary greatly across different seats at the same table, causing hearing difficulties for some participants and ultimately hindering information accuracy and discussion effectiveness. These key factors that impact round-table conversation quality still lack sufficient attention. Thus, a comprehensive study of the spatial distribution of SI around circular tables and the variations therein, alongside an analysis of the contributing factors, holds both theoretical and practical importance. This research enhances our understanding of speech perception mechanisms in various spatial setups and offers valuable insights for improving verbal communication efficiency in round-table discussions.
In typical round-table discussions, the proximity of speakers to the audience leads to variations in SI depending on seating arrangements, primarily because of listener-specific binaural effects. The influence of the binaural effect on SI is determined by the position-dependent characteristics of the source, encompassing both direction and distance [5]. The fundamental binaural mechanisms consist of two elements: the head shadow effect and binaural interaction [8,9]. The head shadow effect results in a higher signal-to-noise ratio (SNR) at the ear situated on the same side as the sound source than at the ear on the opposite side [10]. Moreover, the binaural SNR is influenced by the spatial location of the sound source, resulting in variations in SI, especially within the near-field range [11]. Liang and Yu [6] reported that SI is maximized when the sound source is located directly in front-lateral of the listener, and it diminishes considerably as the source moves away from this optimal direction. In the near-field region, SI under the influence of the binaural effect demonstrated a distinct relationship that varied with distance. Furthermore, research has indicated that, within natural communication contexts, listeners actively modify their head and eye orientations to align with the positions of sound sources, thus enhancing signal reception or transmitting suitable nonverbal signals [12,13]. Consequently, this head orientation behavior, which is inherently connected to the binaural effect, plays a substantial role in influencing SI [14].
In the context of room acoustics, the influence of speaker directivity on indoor SI is significant, as it affects the spatial distribution of sound [15]. Zhu et al. [16] explored the impact of source directivity by utilizing an artificial mouth, monitor loudspeakers, and a dodecahedral sound source. The findings indicated that source directivity could cause substantial differences in objective SI assessments, with the speech transmission index (STI) showing variations up to 0.123. Peng et al. [7] evaluated subjective Mandarin SI using an omnidirectional sound source, a directional source with radiation patterns similar to those of a human speaker, and actual human speakers in both physical and virtual rectangular rooms featuring various reverberation times (RTs). The study revealed that SI scores obtained with the omnidirectional source were lower than those obtained with the other source types. Compared with real human speech in the room, the omnidirectional source led to decreased SI scores. In practical scenarios, the influence of source directivity on the sound field distribution is evident mainly in the direct sound component, followed by its effects on the reflected sound. Therefore, when direct sound prevails, such as in near-field situations or when the sound source is located within the reverberation radius [4], SI is largely affected by source directivity. In typical round-table discussions, a reduced distance for spoken communication may result in noticeable variations in SI for listeners seated at various locations around the table.
Moreover, round-table discussion scenarios generally take place indoors, where conversational quality and background noise levels are strongly influenced by the acoustic boundary conditions of the room. The airborne sound insulation of vertical partitions directly governs noise transmission from adjacent spaces, thereby impacting SI in enclosed conversational environments. Nicoletti et al. [17] demonstrated that appropriate partition design and material selection can significantly enhance indoor sound insulation, providing valuable guidance for defining realistic acoustic boundary conditions. Qu et al. [18] reported that lightweight composite partitions possess outstanding sound insulation properties, indicating substantial potential for improving indoor acoustics. Furthermore, robust methods for measuring and predicting the sound insulation performance of indoor partitions have been firmly established [19,20,21], offering strong support for the acoustic design and evaluation of enclosed spaces.
Meanwhile, although direct sound dominates in the near field and the influence of reflected sound is expected to be limited, it is still worthwhile to explore the role of reflected sound as an acoustic factor in indoor environments. Several studies have examined how early and late reflections influence SI. According to Lochner and Burger [22], in quiet environments, reflections with delays of less than 30 ms can increase the effective SNR by more than 3 dB. However, this beneficial impact decreased as the delay increased and was entirely absent beyond 95 ms. Nábělek et al. [23] performed subjective SI tests and reported that early reflections with delays within 20 ms notably improved SI. Nakajima et al. [24] reported that extended reflection delays reduced SI, whereas early reflections arriving at nearly 90 ° angles were more beneficial. Generally, reflections that arrive earlier tend to merge more seamlessly with the direct sound, leading to improvements in both the effective SNR and SI [25,26].
According to the existing research mentioned above, early reflections enhance the SNRs in disadvantaged situations (e.g., certain positions or orientations) in terms of binaural effects and source directivity, thereby enhancing SI. Conversely, late reflections or reverberation tend to decrease SI overall [27]. Therefore, the difference in SI spatial distribution around a round table between real indoor environments and free fields warrants investigation.
As mentioned earlier, SI can be significantly influenced by binaural effects and source directivity, especially during typical round-table discussions where speakers are in close proximity to the audience. The scenario includes several listener positions characterized by a radially symmetric spread of azimuth angles, alongside minor variations in head orientation for either the speaker or listener. In round-table discussions, despite the close distance typically ensuring effective verbal communication, there can still be issues with poor SI in specific noisy environments [28]. These observations suggest the need for a detailed analysis of SI for individuals seated at a round table, considering factors such as the relative positions of the speaker and listeners, their head orientations, the table’s dimensions, and the acoustic environment.
Nevertheless, existing research has not yet presented the distribution and fluctuation patterns of SI in round-table conversations. The combined effects of speaker/listener positioning, head orientation, table dimensions, and acoustic environment on SI remain underexplored, leaving a gap in understanding speech perception in such settings. Examining how these diverse factors interact will facilitate a thorough understanding of speech communication quality in complex social scenarios, thereby providing a theoretical basis for the acoustic design of circular seating layouts and improving communication efficiency in both daily and professional scenarios, and ultimately filling the existing research gap.
The aim of this study is to examine the spatial distribution and variation of SI in round-table conversation scenarios. Numerical simulations of free-field binaural impulse responses were first conducted to separate the effects of the relative positioning of the speaker and listener or head orientation on SI from the interference caused by reflections from room boundaries. These simulations were then used to compute binaural STI values for listeners. The STI results were adjusted for the directivity of the sound source while considering various listener head orientations and table diameters, allowing for an analysis of STI variation patterns in environments without reflections, such as open outdoor conditions. Following this, a common indoor round-table scenario was chosen for actual-room measurements of binaural room impulse responses (BRIRs) to compare with the free-field measurements. Finally, a subjective evaluation was conducted to measure the speech reception threshold (SRT), defined as the SNR for achieving 50% intelligibility, to validate and supplement the objective findings regarding STI.

2. Materials and Methods

2.1. Experimental Setup

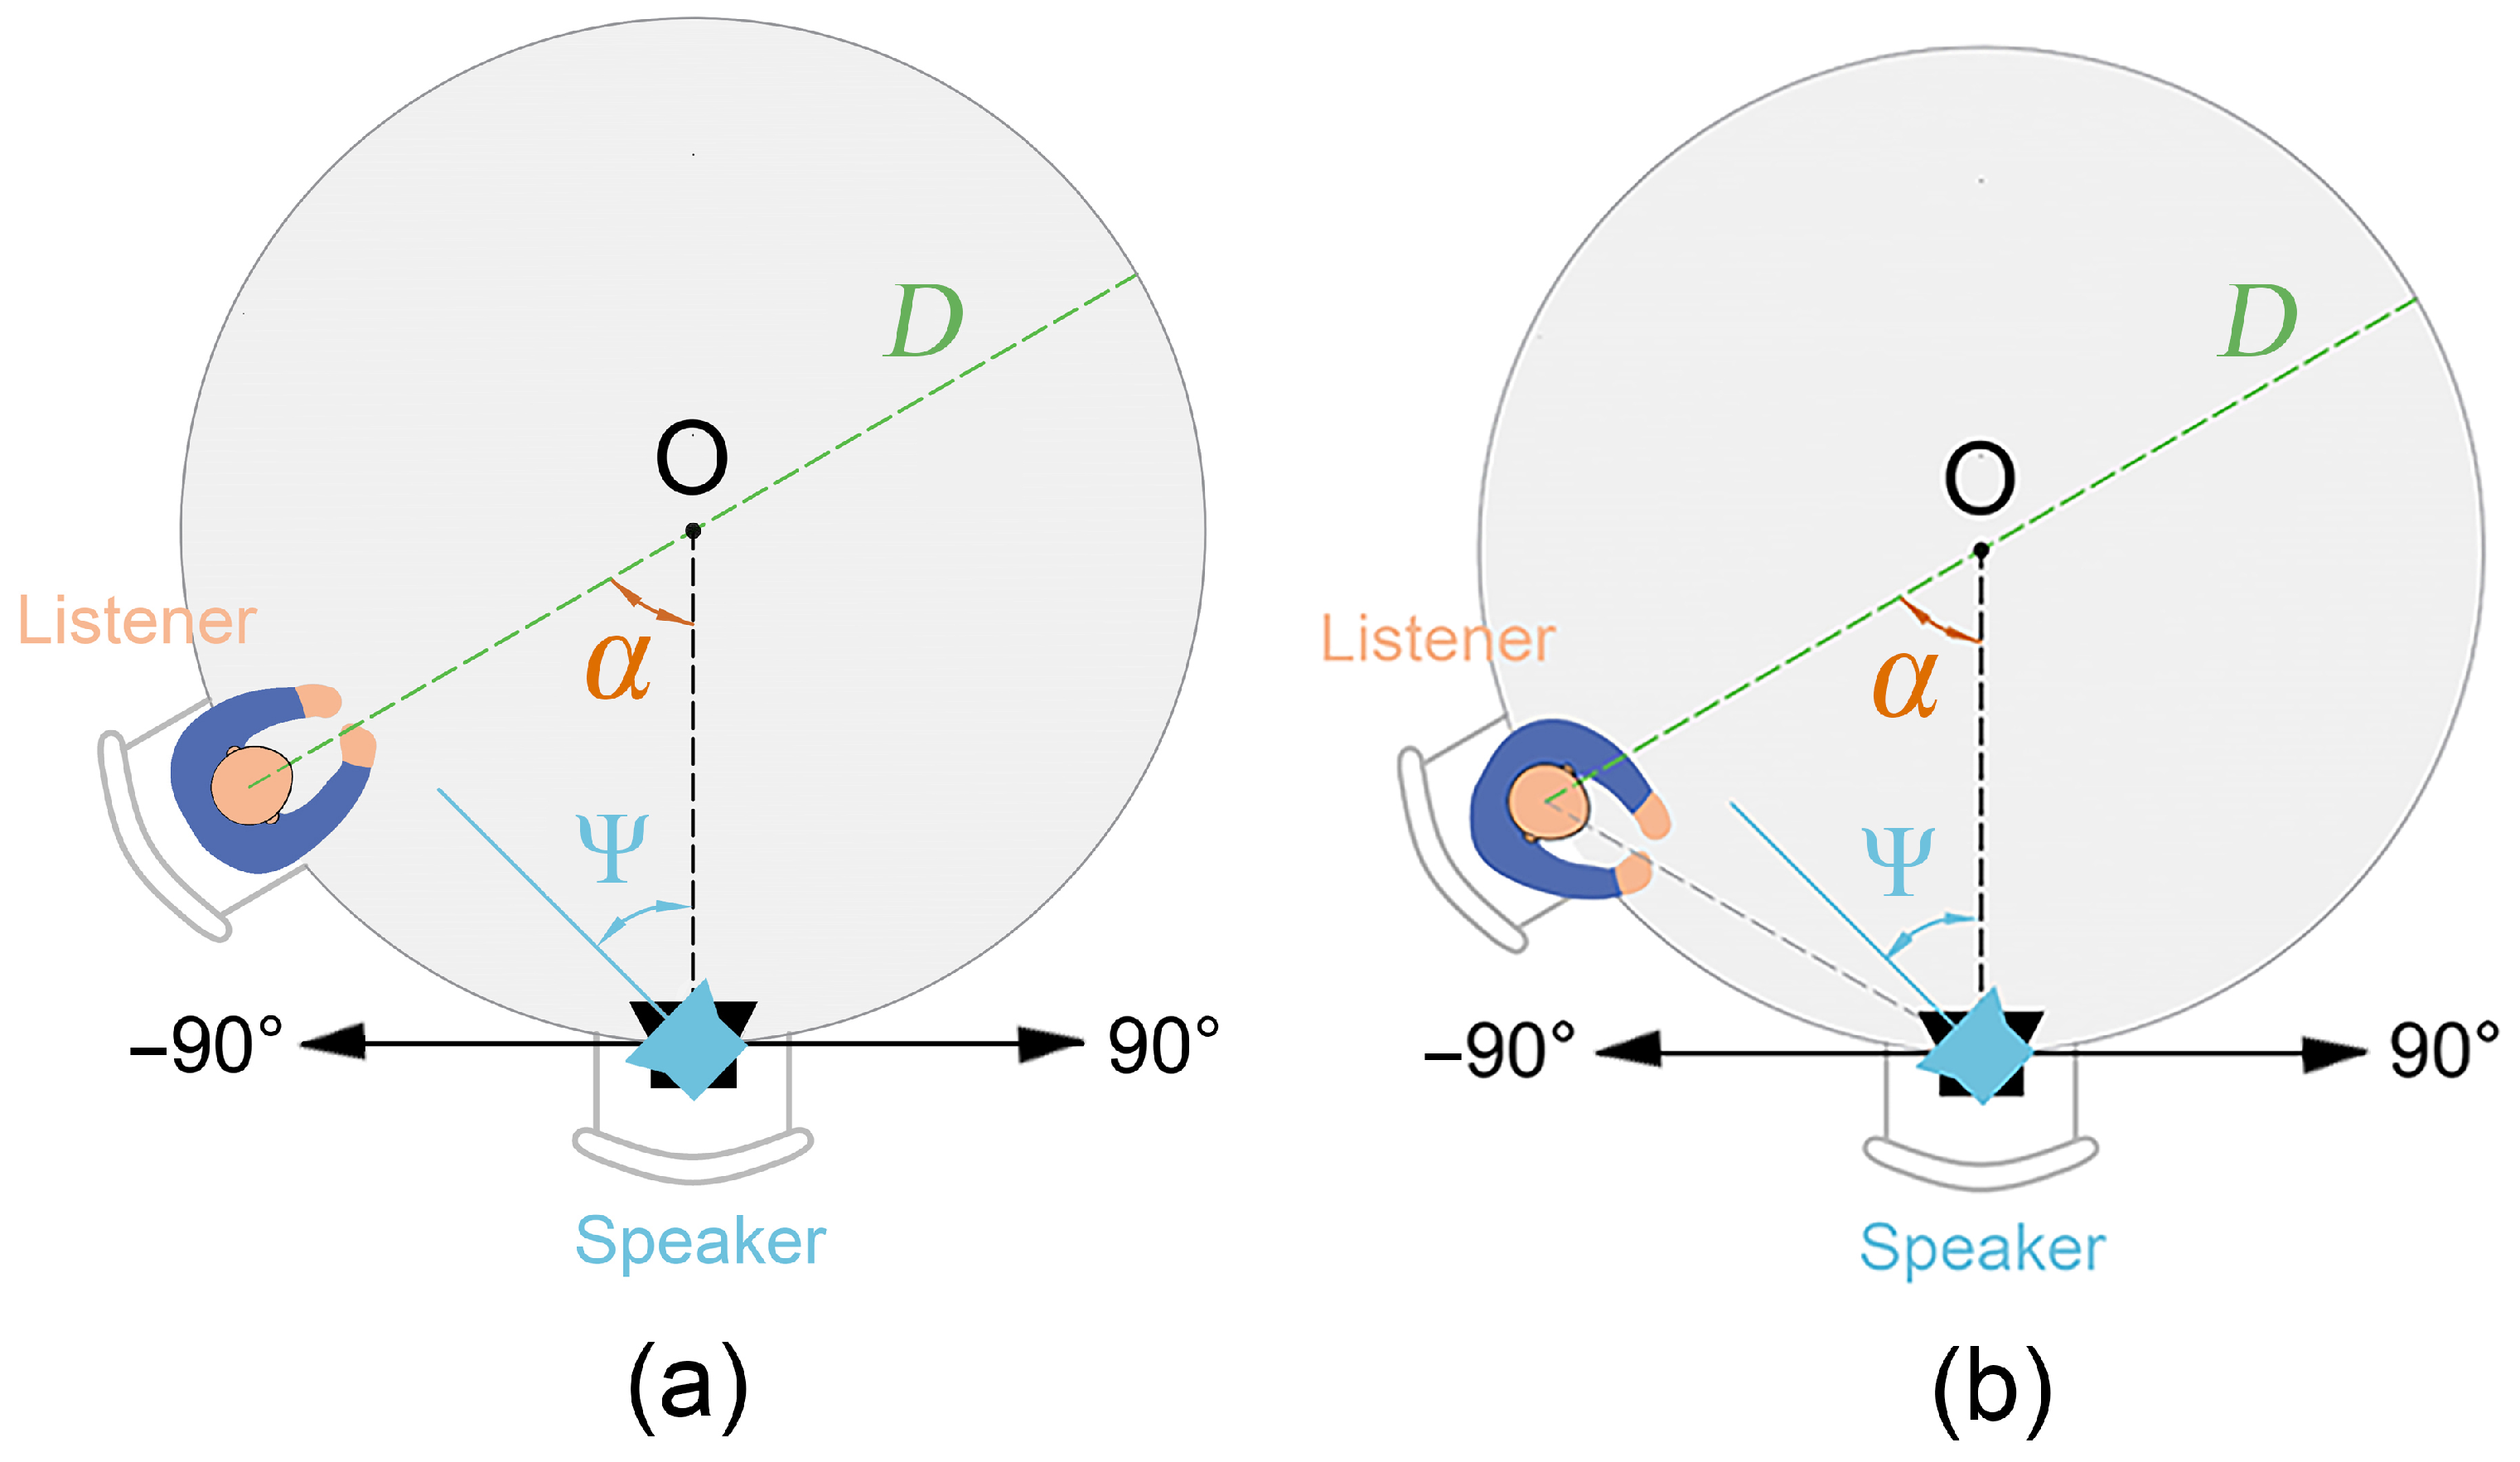
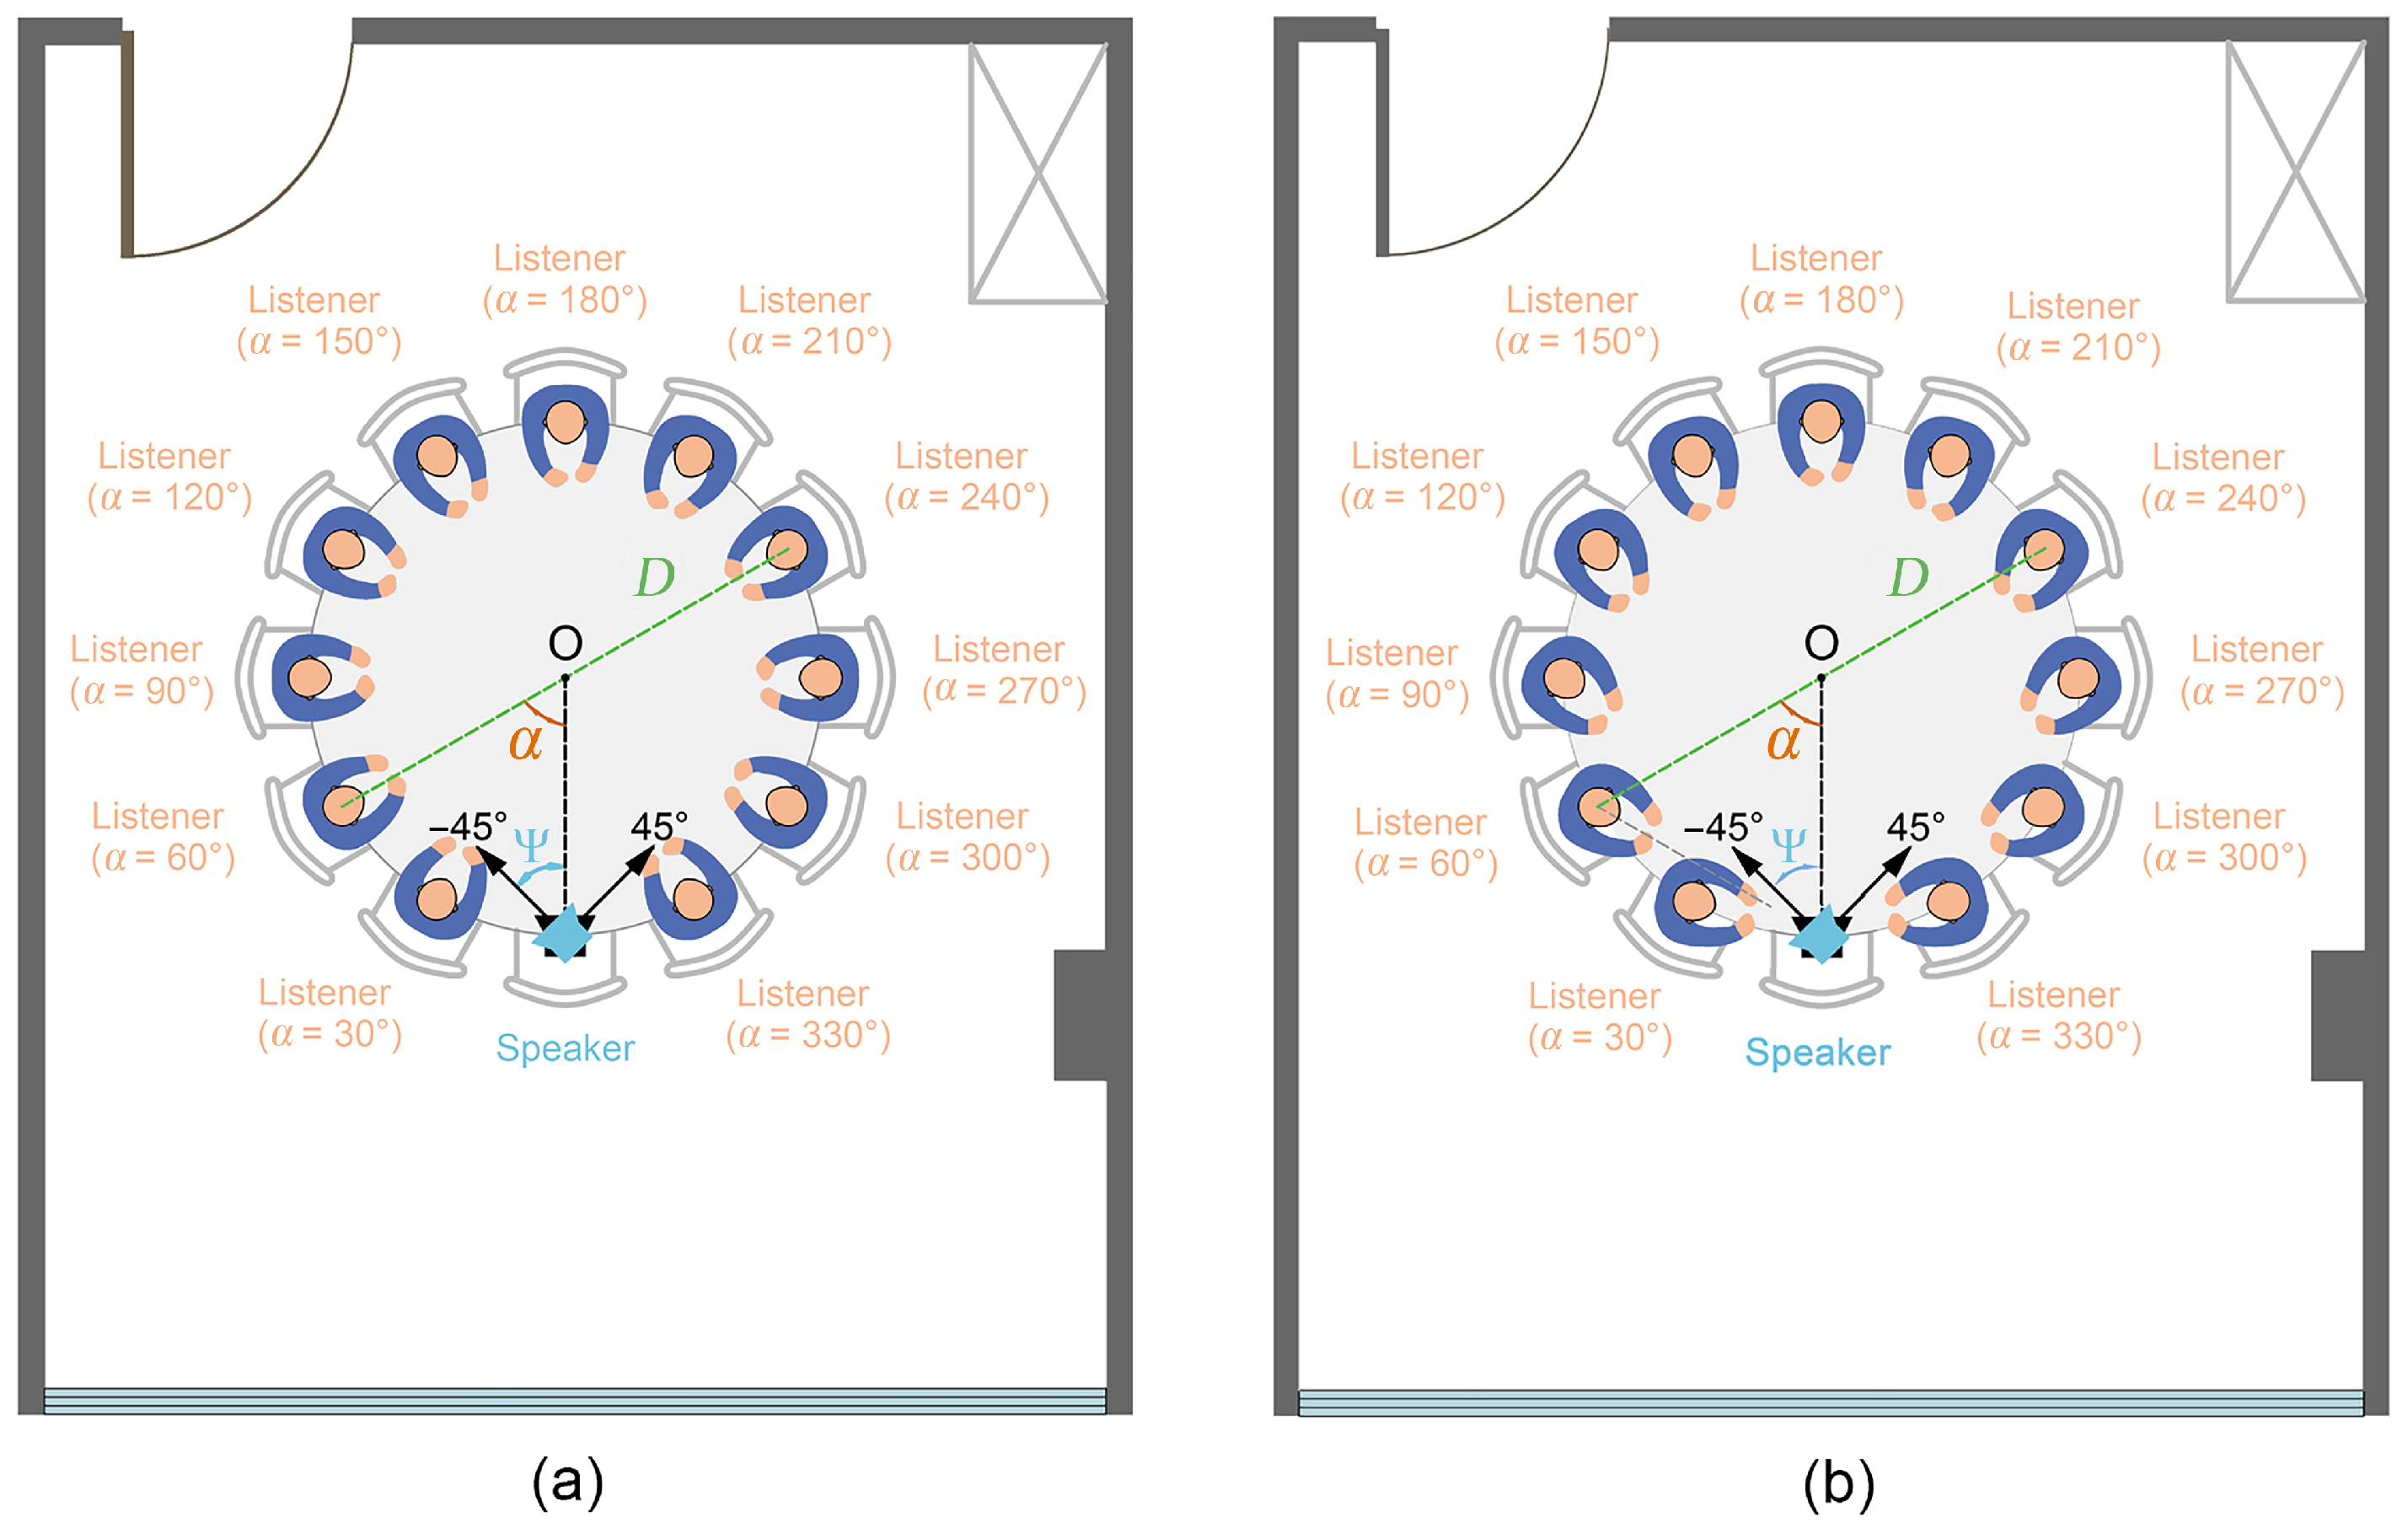
In various conversational contexts, two speech communication conditions were identified (see Figure 1): listeners facing the table and listeners facing the speaker. In the first condition, facing the table implies engagement in activities such as eating or taking notes. Conversely, the second condition, facing the speaker, signifies active involvement in the conversation and focused attention on the speaker.
In the experimental setup, the table’s diameter is represented by D. The speaker is situated at a designated point on the table perimeter, with listeners occupying the other seats. To describe the spatial arrangement of listeners relative to the speaker, the central angle α is used. α has the table’s center as its vertex and is formed between the lines from the center to the speaker and listener. The speaker is located at α = 0 ° , with α increasing clockwise from the speaker’s left. Due to the 2 m diameter of the round table, the straight-line distance corresponding to a 30° interval is approximately 0.5 m, which satisfies a reasonable social distance between participants. A smaller central angle interval will lead to overly close spacing and impractical seating arrangements, especially for smaller round tables. Therefore, α is restricted to the range of 30–330° with 30° increments. The speaker orientation angle Ψ is calculated in a clockwise system, with Ψ = 0 ° indicating that the speaker faces forwards; the left turns are negative, and the right turns are positive (see Figure 1).

2.2. Free-Field Numerical Simulations

The head-related transfer function (HRTF) describes how sound waves travel from a source to the ears, illustrating the filtering impact of human anatomical features such as the head, ears, and torso [5,29]. The HRTFs for virtual positions around a circular table were computed using Mesh2HRTF v1.1.1 software package which was developed by the Acoustics Research Institute of the Austrian Academy of Sciences and the Audio Communications Group at the Technical University of Berlin. This tool simulates sound fields by integrating the boundary element method with the fast multipole method [30], calculating HRTFs across all audible frequencies and saving them in the SOFA file format [31]. The simulation used a KEMAR model, assuming rigid boundaries. HRTFs were calculated using the closed ear canal method, with receiving points at the ear canal entrances, covering frequencies ranging from 50 Hz to 20 kHz. For a point sound source in the free field, two scenarios were examined: listeners facing the table and listeners facing the speaker. These scenarios featured different speaker–listener positions corresponding to specific azimuth angles per HRTF convention [5]. The azimuth angles of 0 ° , 90 ° , 180 ° , and 270 ° indicate the sound sources positioned directly in front, to the right, behind, and to the left, respectively. The scenario with listeners facing the table involved both azimuth and distance changes, whereas the other scenario varied only in distance, as listeners always faced the speaker (at the 0 ° azimuth).
In order to better utilize the advantages of free-field simulation, a 5 ° increment of α is adopted to capture the continuous and fine-grained spatial distribution of SI, and the positions corresponding to the 30° interval in the actual measurement can still be extracted for direct comparison. Furthermore, four typical round-table diameters (1, 2, 3, and 4 m) were selected and analyzed. For each diameter, 61 central angles were selected at 5 ° increments from 30 ° to 330 ° to cover possible listener positions around the table. The experiments employed central angles to represent speaker–listener positioning relative to the table center, unlike traditional speaker azimuth angles. Table 1 shows how listener central angles are related to azimuth angles for the different table sizes. By evaluating two conversation scenarios, four table diameters, and 61 listener central angles, we computed 488 sets of horizontal-plane HRTFs. Fourier transforms were applied to convert these frequency-domain HRTFs into time-domain head-related impulse responses (HRIRs), resulting in 488 HRIRs for STI computations. An orientation correction function [32] was applied using these HRIRs to adjust for speaker orientation effects on SI, considering head rotation limits from − 90 ° to 90 ° .

2.3. Experimental Measurements in an Actual Room

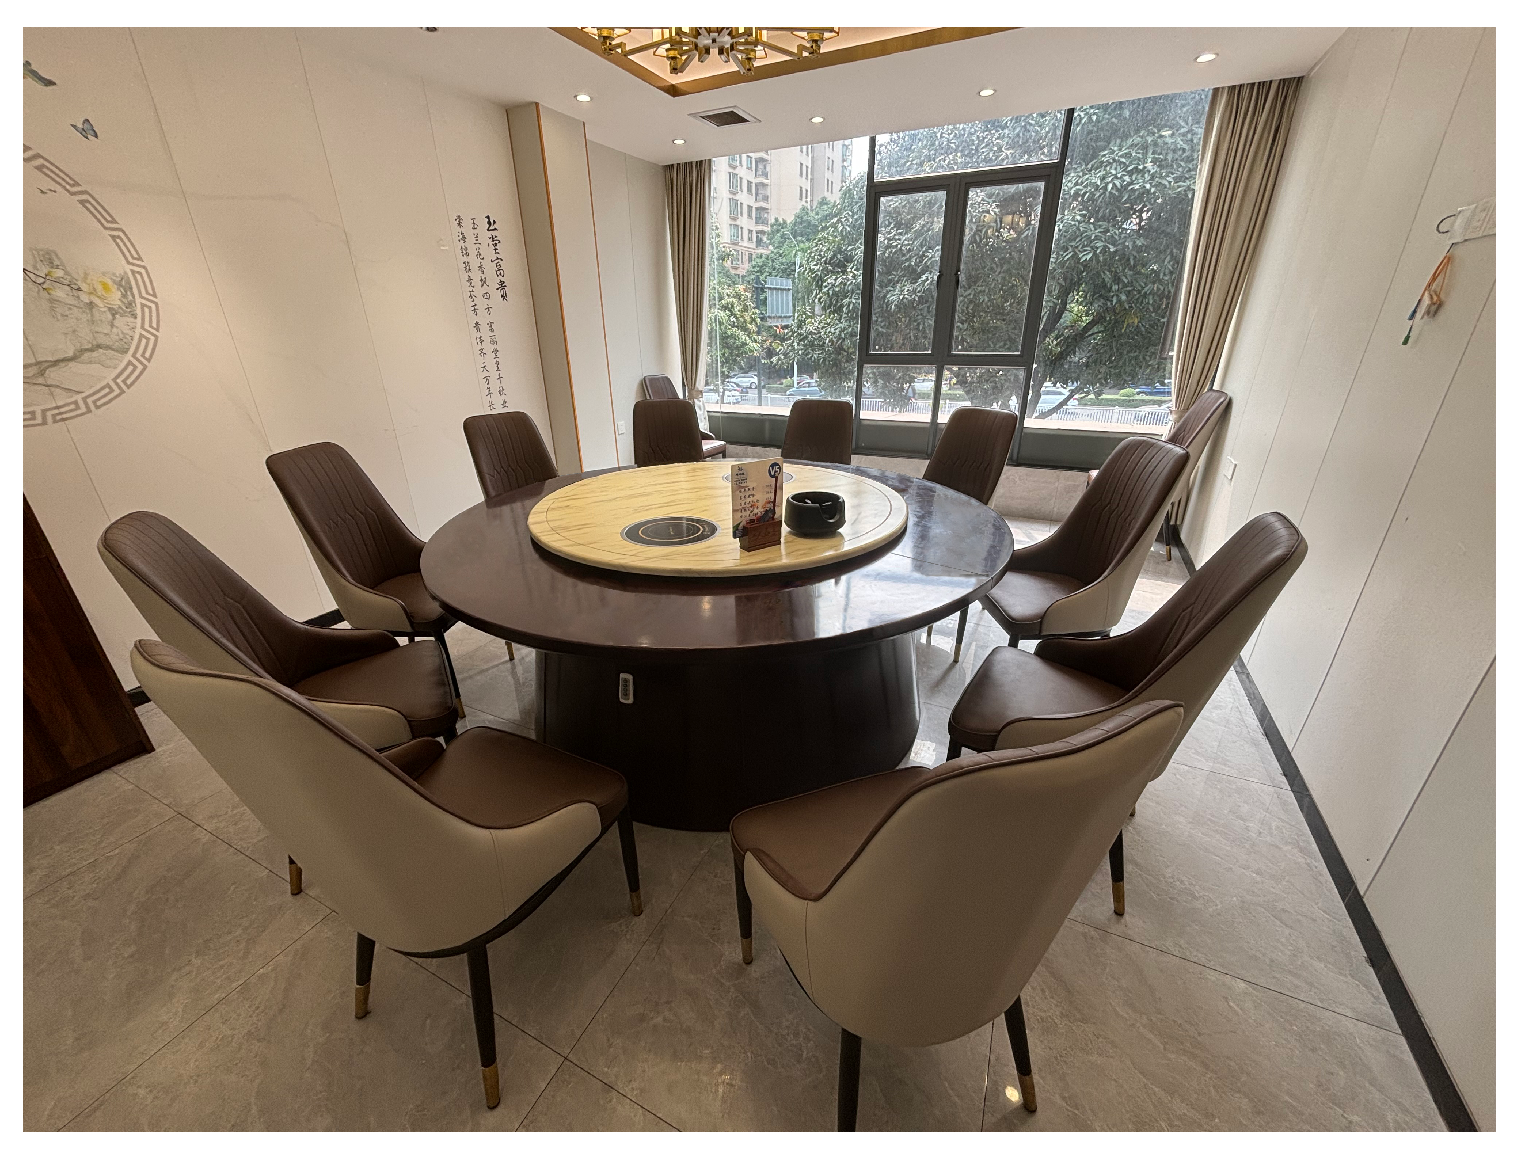
Considering the extensive diversity in the shapes and sizes of indoor spaces hosting round-table discussions, along with significant disparities in interior layouts driven by functional needs, the results from acoustic measurements show corresponding variability, rendering exhaustive measurement of every potential real-room configuration impractical. To balance these considerations, the experiments were conducted in the private dining room of a restaurant. This setting serves as a representative in situ measurement environment, allowing for a meaningful assessment of the effects of reflected sound on SI while ensuring practical feasibility. For practical measurements, a standard private room in a local restaurant in Nanning, China, was selected. The room measured 5.22 m (length) × 4.12 m (width) × 2.80 m (height), and its rectangular shape simplified the sound reflection paths, easing the acoustic measurement complexity. Figure 2 shows a photograph of the restaurant’s private dining room. A round table with a diameter of 2 m, commonly seen in such settings, was present in the room, accommodating 8–12 diners, thus supporting various groups efficiently. This table size is economically efficient and broadly applicable, serving as a suitable reference for studying the impact of the sound source direction and distance on SI under near-field conditions. For the enclosure structures of the room, most components provide negligible sound absorption, including the smooth panel walls, glass windows, wooden doors, tiled floors, and gypsum board ceilings. As for the furniture, the round table has a smooth painted wooden surface with a partial rigid stone surface; both surfaces are highly reflective and exhibit low sound absorption coefficients. The leather–wood chair offers weak sound absorption, mainly in the mid–high frequencies. No additional sound absorption or insulation treatments were installed in the room. The sound absorption coefficients of the various materials are presented in Table 2.
During the formal measurements, the background noise level in the private dining room remained below 35 dB(A). The RT inside the private room was assessed using the impulse response approach [33]. A maximum length sequence (MLS) signal served as the sound source, amplified by a BSWA PA700 power amplifier (manufactured by BSWA Technology Co., Ltd., Beijing, China) and projected by a BSWA OS003 dodecahedron loudspeaker (manufactured by BSWA Technology Co., Ltd., Beijing, China). BRIRs were recorded, and Dirac v3.0 software was used to calculate RTs at different frequencies. Measurements were taken with all doors, windows, and air conditioning shut. Table 3 shows that the mean T 30 value from 125 Hz to 4000 Hz was 0.43 s, which is consistent with the recommended restaurant RT range of 0.5–0.6 s [34], suggesting that the room’s acoustic properties were representative. The C 50 values indicate high clarity for mid-frequencies, with a notable amount of direct sound and early reflections and fewer late reflections and reverberation.
Considering the limitations imposed by a 2-m diameter round dining table, 11 listener angles were identified, as shown in Figure 3, spaced in 30 ° increments from 30 ° to 330 ° . In authentic multipartite conversations around such tables, speakers often make slight head turns. Thus, during the real-room experiments, the speaker’s orientation was adjusted in 45 ° increments from − 45 ° (left) to 45 ° (right) to mimic natural head movements.
Table 2. Sound absorption coefficients of facilities and furnishings in private dining rooms.
Furniture & FacilitiesMaterialSound Absorption Coefficient
125 Hz 250 Hz 500 Hz 1000 Hz 2000 Hz 4000 Hz
Panel WallPolyvinyl Chloride0.010.010.020.020.030.03
CeilingGypsum Board0.260.130.080.060.060.06
Light Fixture-0.100.150.200.220.250.30
FloorMarble Tile0.010.010.020.020.020.03
DoorWood0.020.020.020.040.040.03
WindowGlass0.180.060.040.030.020.02
Round TableWood0.020.020.020.040.040.03
Marble0.010.010.020.020.020.03
ChairWood0.020.020.020.040.040.03
Leather0.040.130.220.170.160.11
Note: All sound absorption coefficients are quoted from Liu [35].
Table 3. Measured T 30 and C 50 values inside the restaurant’s private dining room.
Frequency (Hz)125250500100020004000
T 30 (s)0.590.350.320.430.480.45
C 50 (dB)11.7514.0023.6617.9214.2315.08
The influence of speaker directivity on SI in the actual room was examined using a GRAS 44AB artificial mouth (manufactured by GRAS Sound & Vibration, Holte, Denmark) to emulate a typical human mouth’s directivity and radiation pattern. Concurrently, binaural recordings utilized a Chinese dummy head with a statistical shape model [36], featuring DPA 4060 miniature microphones (manufactured by DPA Microphones A/S, Kokkedal, Denmark) at its ear canal entrances. A 44.1 kHz MLS signal, lasting 6 s, covering 20 Hz to 20 kHz and with 24-bit resolution, served as the excitation signal [37]. This signal was generated on a computer, passed through a Roland Studio Capture 1610 sound card for digital-to-analogue conversion, and transmitted to the artificial mouth mounted at a table height of 1.2 m to align its center with the dummy head’s ear canals. The measurements involved 2 listener head orientations, 3 speaker orientations, and 11 listener positions, resulting in 66 BRIRs.

2.4. STI Calculations Based on Binaural Impulse Responses

Compared with single-path reception, binaural listening typically yields superior SI, a phenomenon attributed to the intricate neural and physiological perceptual mechanisms of the human auditory system. Within the framework of existing binaural STI models, the ‘better-ear’ STI has emerged as the most efficacious metric [38]. Consequently, the IEC 60268-16 standard [39] recommends optimizing STI results based on the ‘better-ear’ principle when conducting binaural measurements using artificial heads. In line with this recommendation, the subsequent analysis employs an indirect method [40] rooted in impulse responses to determine the modulation transfer function for STI computation, drawing on the methodological insights from Liang et al.’s approach [41] to obtain the better-ear STI values across various listener positions, listener head orientations and speaker orientations.
In indirect approaches, the STI is determined using the impulse response and SNR (i.e., the sound pressure level (SPL) of speech and background noise). The core objective of this research is to explore the distribution and determinants of SI in round-table situations given a constant noise level. It should be noted that in real indoor environments, background noise is usually time-varying and exhibits non-uniform spectral characteristics. Such fluctuating anthropogenic noise can disrupt SNR stability and distort speech perception by introducing confounding factors such as temporal fluctuations and spatial cues [42], thereby leading to biased SRTs. To avoid these confounding effects, this study adopted a constant 60 dB(A) pink noise as the interfering background noise [39], as it is commonly employed in physics and acoustics owing to its uniform SPL across all frequency bands. This noise was uniformly delivered to each ear to eliminate disturbances from fluctuating noise levels and isolate key variables, thereby independently analyzing the effects of spatial factors on SI.
The monaural speech signal was produced using pink noise and subsequently filtered and modified in accordance with the Chinese standard spectrum, as specified in GB/T 7347-1987 [43]. Binaural speech signals were then created by convolving this monaural signal with appropriate HRIRs or BRIRs. Using signal processing, the relative SPLs of both the speech and noise signals at the receiver’s position were determined. This facilitated the calculation of binaural SNRs across seven octave bands under various conditions. As both the speech and noise signals were virtually synthesized, the SNRs obtained in this study are relative measures. This computational approach eliminated the need for conventional SPL measurement and source intensity calibration, thereby streamlining parameter adjustments and allowing for independent analysis of individual factors influencing SI, conferring important methodological advantages.
For every condition, a 7 × 14 matrix was generated for the modulation transfer function, which was subsequently transformed into the apparent SNR. This apparent SNR was confined within a range of − 15 dB to 15 dB and was linearly mapped to the STI values between 0 and 1, representing the transmission index. Thus, the modulation transfer index at each octave was derived by averaging the transmission indices across 14 modulation frequencies. This information was then used to compute the STIs. The STI was determined as a weighted aggregate of the modulation transfer indices, following the weighting coefficients specified in the IEC 60268-16 standard [39].
In free-field simulations, an omnidirectional point source is employed, inherently neglecting the influence of speaker directivity. Liang and Yu [32] highlighted the significant impact of sound source directivity and frequency response characteristics on the STI and proposed corresponding correction functions to increase the accuracy of STI calculations. To address this, a correction constant δ correct is introduced to account for STI variations arising from deviations in speaker orientation from the frontal axis based on the initial free-field simulation results. This adjustment yields the STI for the specific speaker orientation. The correction factor, δ , can be described as:
δ correct = − 0.06 + 0.03 φ − 0.14 φ 2 + 0.03 φ 3 .
Note that φ represents the angular deviation between the sound source’s axial direction and the listener’s orientation, and it is interchangeable with the speaker orientation Ψ defined in the experiments.

2.5. Subjective Experiment

The current binaural STI methodology utilizes the better-ear results, potentially underestimating the binaural advantage impact on SI. To mitigate this limitation, subjective experiments were performed to examine closely how listener position and head orientation affect SI within round-table discussion settings. The subjective listening assessments measured the SRTs [44] across various conditions, specified as the SNR necessary to reach a 50% SI score. Owing to experimental constraints and practical limitations, this research focused on round-table conversations conducted in real-world room settings. A total of 30 conditions were assessed, involving 5 listener positions (with central angles α of 60 ° , 120 ° , 180 ° , 240 ° , and 300 ° ), 3 speaker orientations ( Ψ = − 45 ° , 0 ° , and 45 ° ), and 2 listener head orientations (facing either the table or the speaker).
The experiment was conducted based on practically measured binaural impulse responses, with further simulation of Mandarin SI assessment using auralization technology. First, ten graduate students (aged 23–27 years, average 25 ± 2 years, five males and five females) were recruited as listeners. The hearing thresholds of the participants were screened prior to the experiment to ensure normal hearing levels. In fact, although the experiment involved only ten participants, all the participants were native Mandarin-speaking adults with normal hearing and high language proficiency. To ensure reliability, each participant underwent two repeated SRT measurements under every experimental condition, confirming the robustness of the collected data.
Standardized Mandarin matrix sentence test materials [45] featuring fixed syntactic structures composed of five-word sequences (name, verb, quantity, adjective, object) were employed in the experiment. These semantically unpredictable but grammatically correct sentences were extracted from a corpus containing 40 predefined matrices, with each test list comprising 20 sentences. Both the presentation order and matrix selection were fully randomized across trials to eliminate potential ordering effects.
The formal experiment was conducted in a listening room with ambient noise below 30 dB, and headphones (Sennheiser HD650, manufactured by Sennheiser electronic GmbH & Co. KG, Wedemark, Germany) were used to reproduce the test signals. The interfering noise was monaural pink noise. If the monaural noise signal is presented to both ears simultaneously, it results in either in-head localization or the perception of sound originating from the front. However, introducing spatial cues to background noise could lead to spatial unmasking effects, which would be unfavourable for investigating SI under different source azimuths. Therefore, to focus on the influence of the binaural effect and source directivity, a decorrelation method [46] was employed to eliminate the spatial information of the binaural noise signals, ensuring that the background noise remained devoid of spatial cues during the subjective experiments. Because the actual BRIRs were recorded at the entrance of the ear canal, headphone equalization was applied prior to playback to eliminate the influence of the outer ear’s transfer characteristics. The monaural target test signals were convolved with headphone-equalized BRIRs to generate binaural target test signals. The binaural target test signals were subsequently mixed with the decorrelated binaural noise signals at specific SNRs and presented to the participants via headphones for listening.
Throughout the entire experimental process, to ensure a comfortable listening level, the SPL of the interfering noise in both ears was fixed at 60 dB(A), whereas the SNR was adjusted by varying the level of the test signal. The initial SNR of the test signal was set to 10 dB, and the participants provided feedback on the sentences they heard via MATLAB R2023a. If the participant correctly identified more than 50% of the words in a sentence, the SNR for the next sentence was decreased; if the accuracy was less than 50%, the SNR was increased. A one-up-one-down adaptive method [47] was used in the procedure, with the step size for SNR changes depending on prior responses. In accordance with the above steps, each independent SRT test involved presenting 20 different sentence lists, which led to a converged SRT value. Notably, the SNR defined in this experiment was calculated as the difference in the root-mean-square SPL between the test signal before convolution and the noise signal. Because the measured impulse responses were typically represented in relative amplitude, the SNR was also relative, serving solely to compare differences and trends in SI across different conditions.
Given that the total experimental duration was 5 h, each participant’s session was divided into two segments, which were conducted in two separate 2.5 h blocks with no more than three days between segments. Prior to each segment, the participants underwent a training phase to minimize potential errors due to insufficient familiarization with the task. To mitigate the impact of listener fatigue on experimental outcomes, a mandatory 10 min break was enforced after every 10 SRT trials.
Owing to the SRT experiment consisting of 30 conditions, each condition was repeated twice, and each participant needed to undergo 60 separate SRT measurements. The average of the results of two repeated measurements was the final SRT result for each condition.

3. Results

3.1. Numerical Simulation Results Under Free-Field Conditions

3.1.1. STI Derived from Numerical Simulations Using a Point Source

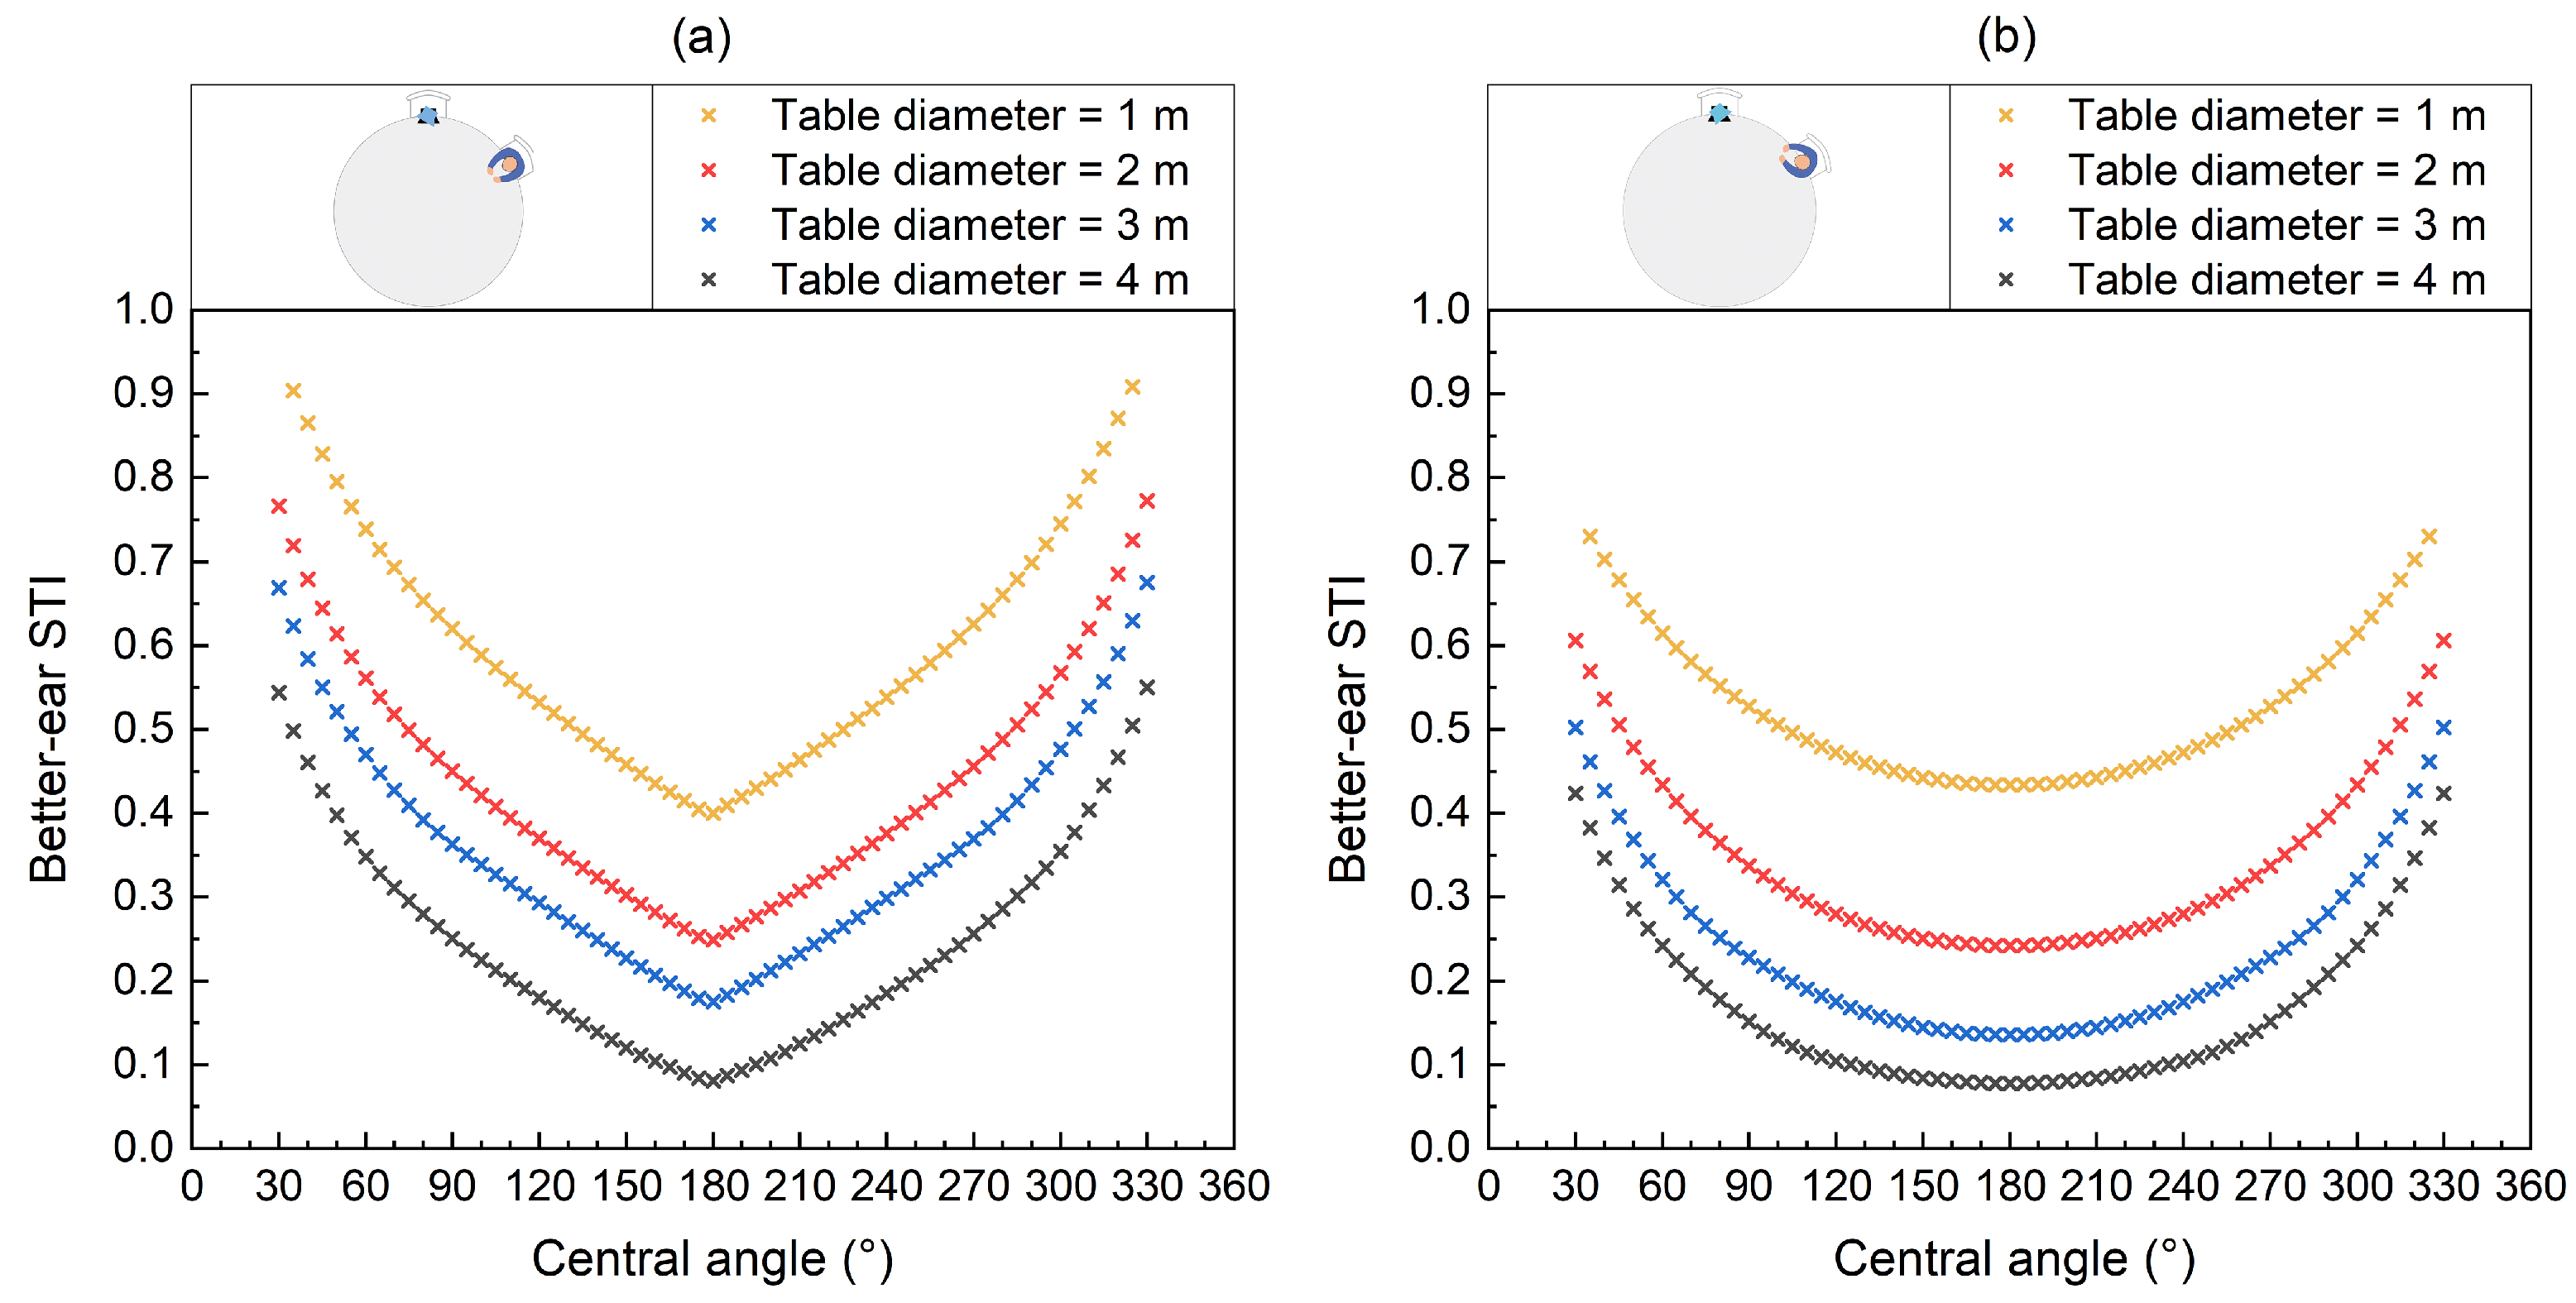
Employing the better-ear principle, the binaural STI for round table listeners was ascertained by choosing the superior STI from each ear pair in a free-field setting with an omnidirectional source. The better-ear STI values are shown in Figure 4.
Figure 4 demonstrates that the STI peaks when the listener is at α = 30 ° or α = 330 ° . As the listener moves from these positions to α = 180 ° , the STI decreases gradually. The STI curve displays clear left-right symmetry at α = 180 ° . When listeners face the table, the STI variation among positions can reach 0.52, whereas facing the speaker results in the greatest difference of 0.37. For lateral listeners close to the speaker ( α < 90 ° and α > 240 ° ), the STI fluctuation with position changes is more significant than for those directly in front ( 90 ° < α < 240 ° ), leading to a U-shaped pattern in spatial distribution. This is due to the relative position between the listener and the sound source, which affects the STI correlation with distance and the differential distance caused by changes in the listener’s position (central angle).
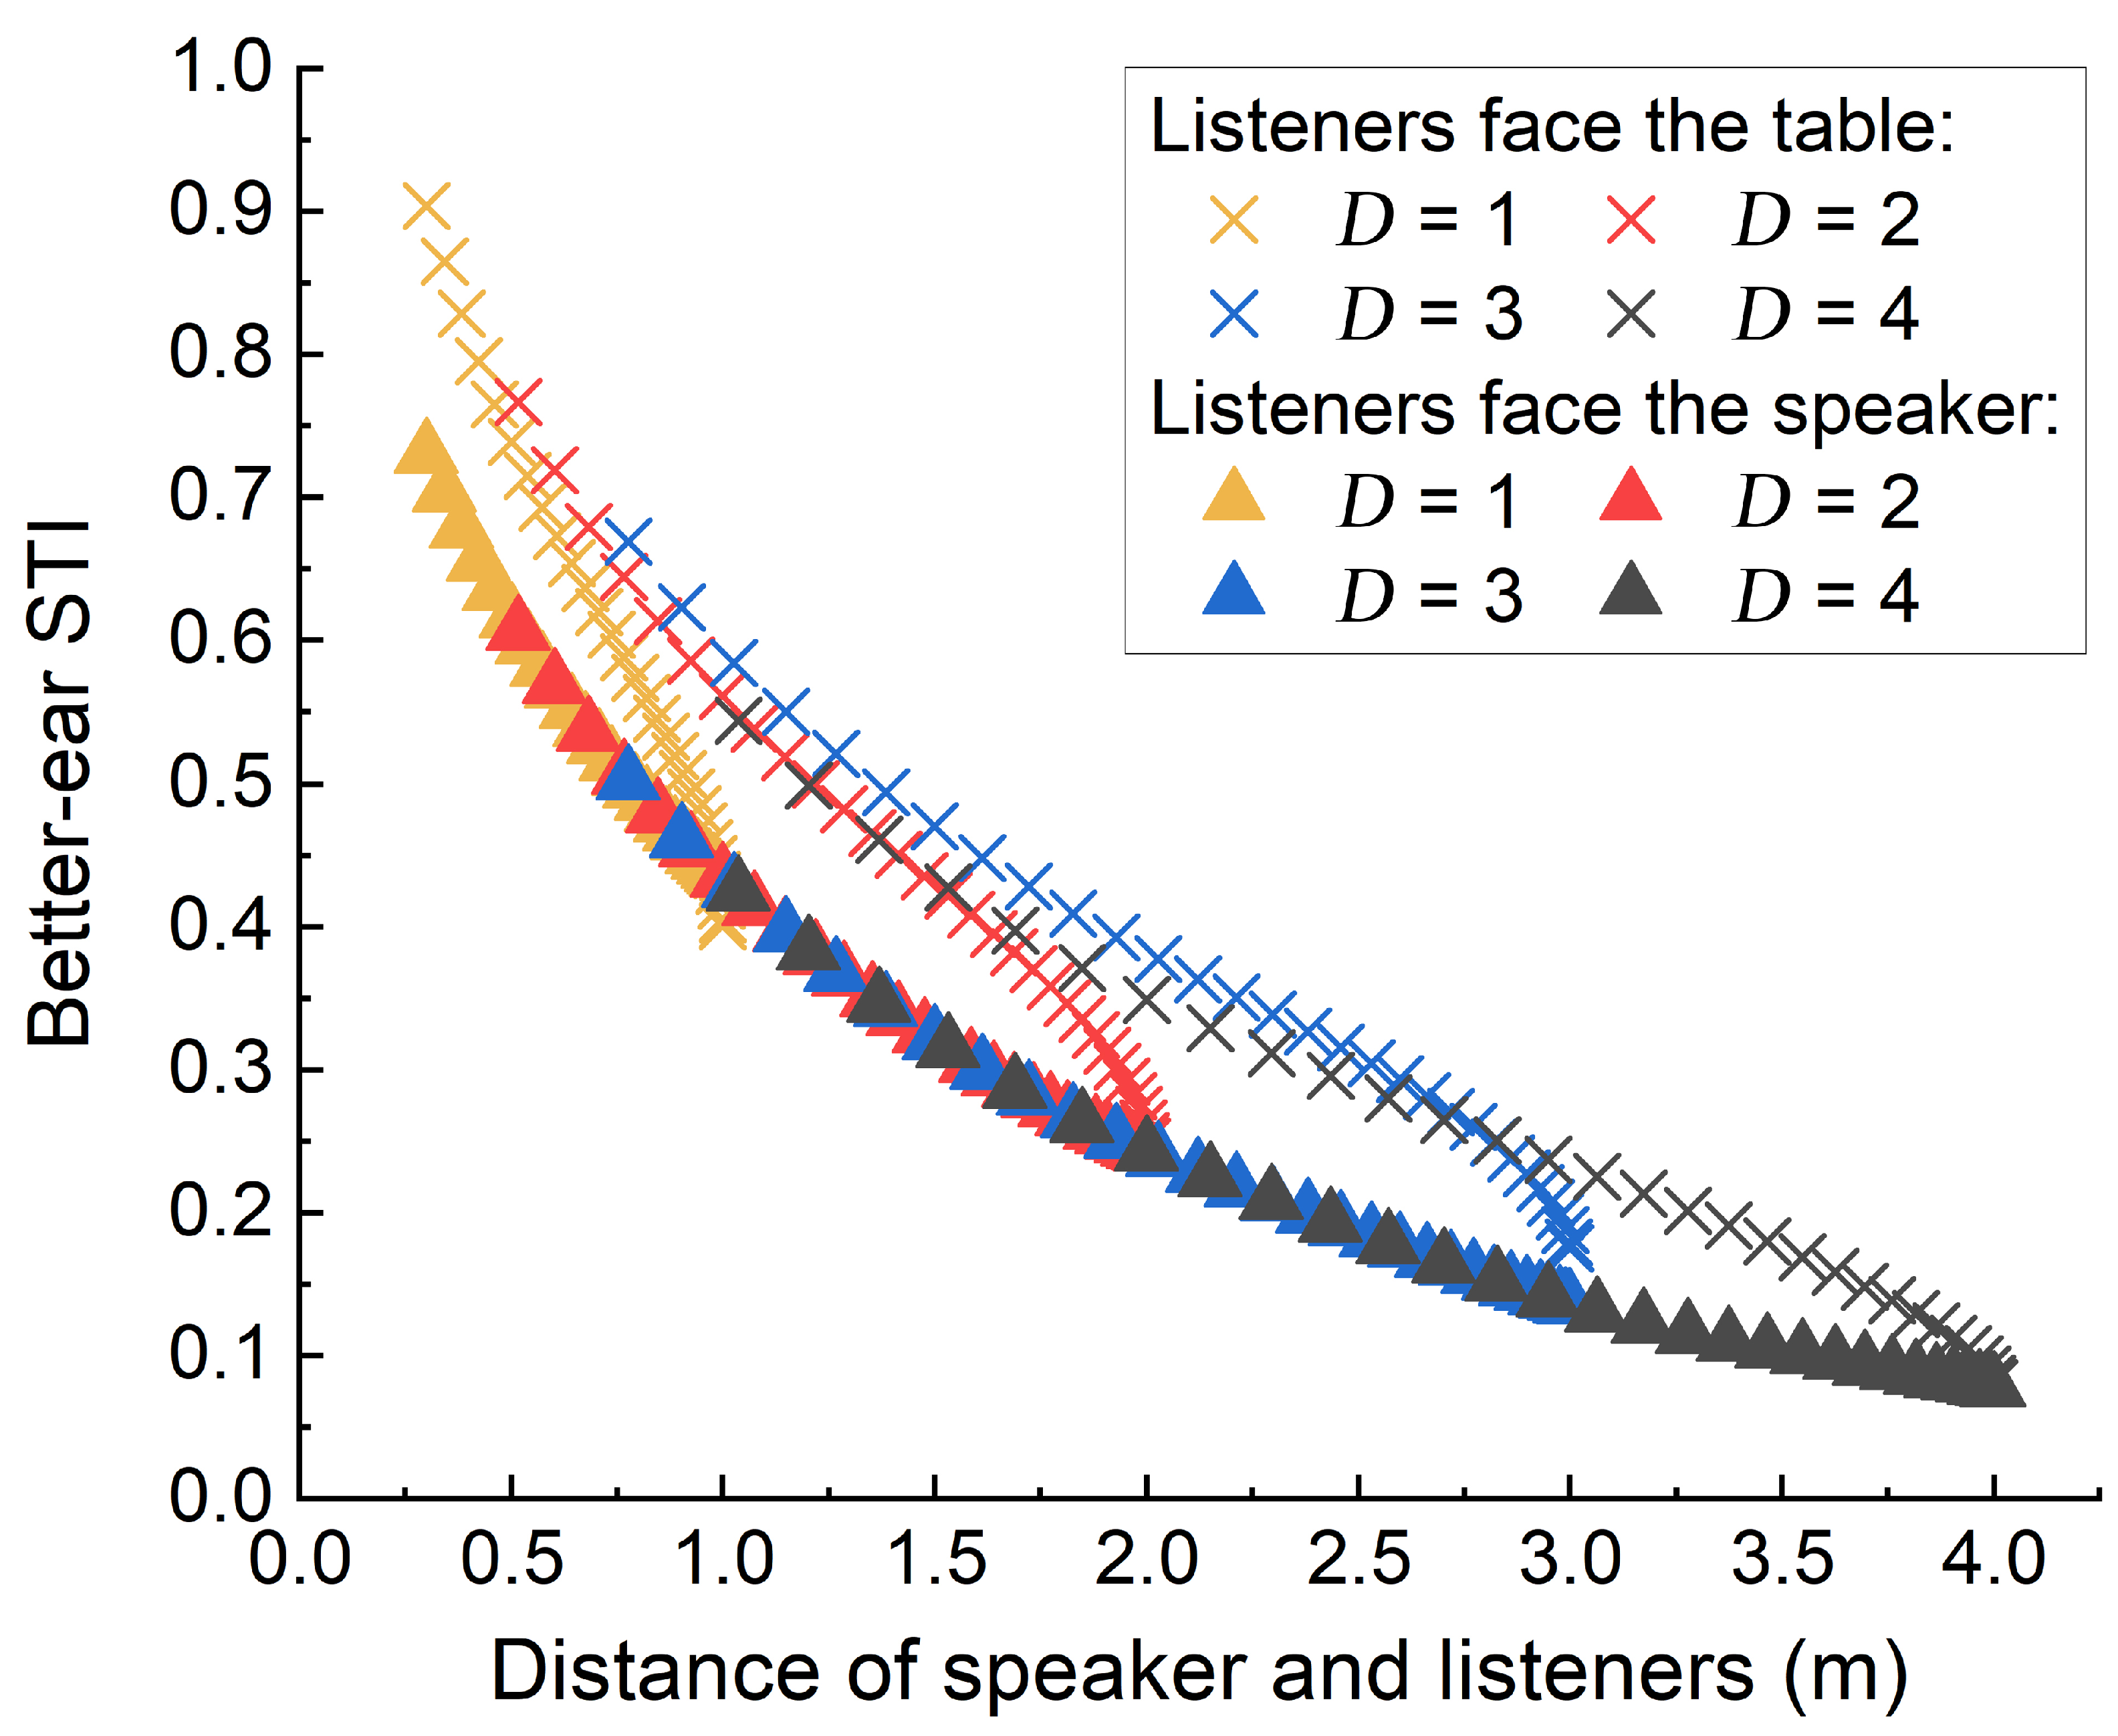
Figure 5 shows the STI relative to the distance between the sound source and listener for various round table sizes and two listener head orientations. The STI decreases as the distance increases, with diminishing rates of change. This decline is linked to the distance relationship of the HRTF magnitude spectrum, which is especially pronounced when the sound source is lateral to the listener [6]. Thus, listeners nearer the source obtain higher and more variable STI values. In the near field, STI variations across distances are more pronounced than those in the far field (distances > 1 m), as depicted by STI changes for different table sizes.
Listener head orientation notably affects STI levels and fluctuations. At α = 180 ° , the STI for listeners facing the table matches those facing the speaker; at other angles, it is greater for the former (see Figure 5). Generally, the STI slope is steeper for those facing the table due to direct sound paths, except at α = 180 ° , compared with head shadow effects when the speaker is frontal. This finding supports findings of greater SI for lateral versus frontal sources at equal distances [6]. The STI distance correlation is stronger for lateral (facing table) sources than for frontal (facing speaker) sources, as shown in Figure 5.
Figure 5 also depicts STI variations with the round table diameter. For listeners facing the table, the maximum STI differences for the tables with 1, 2, 3, and 4 m diameters are 0.51, 0.52, 0.5, and 0.47, respectively. For the speaker, the differences are 0.3, 0.36, 0.36, and 0.35. Despite the table size changes, the STI variations remain stable, with the curve shifting uniformly. As the table size increases (constant listener–source angle), the source–listener distance increases, causing a downwards shift in the STI curve, suggesting reduced STI values for larger tables.

3.1.2. STI Results in Free-Field Simulations with Speaker Orientation Adjustment

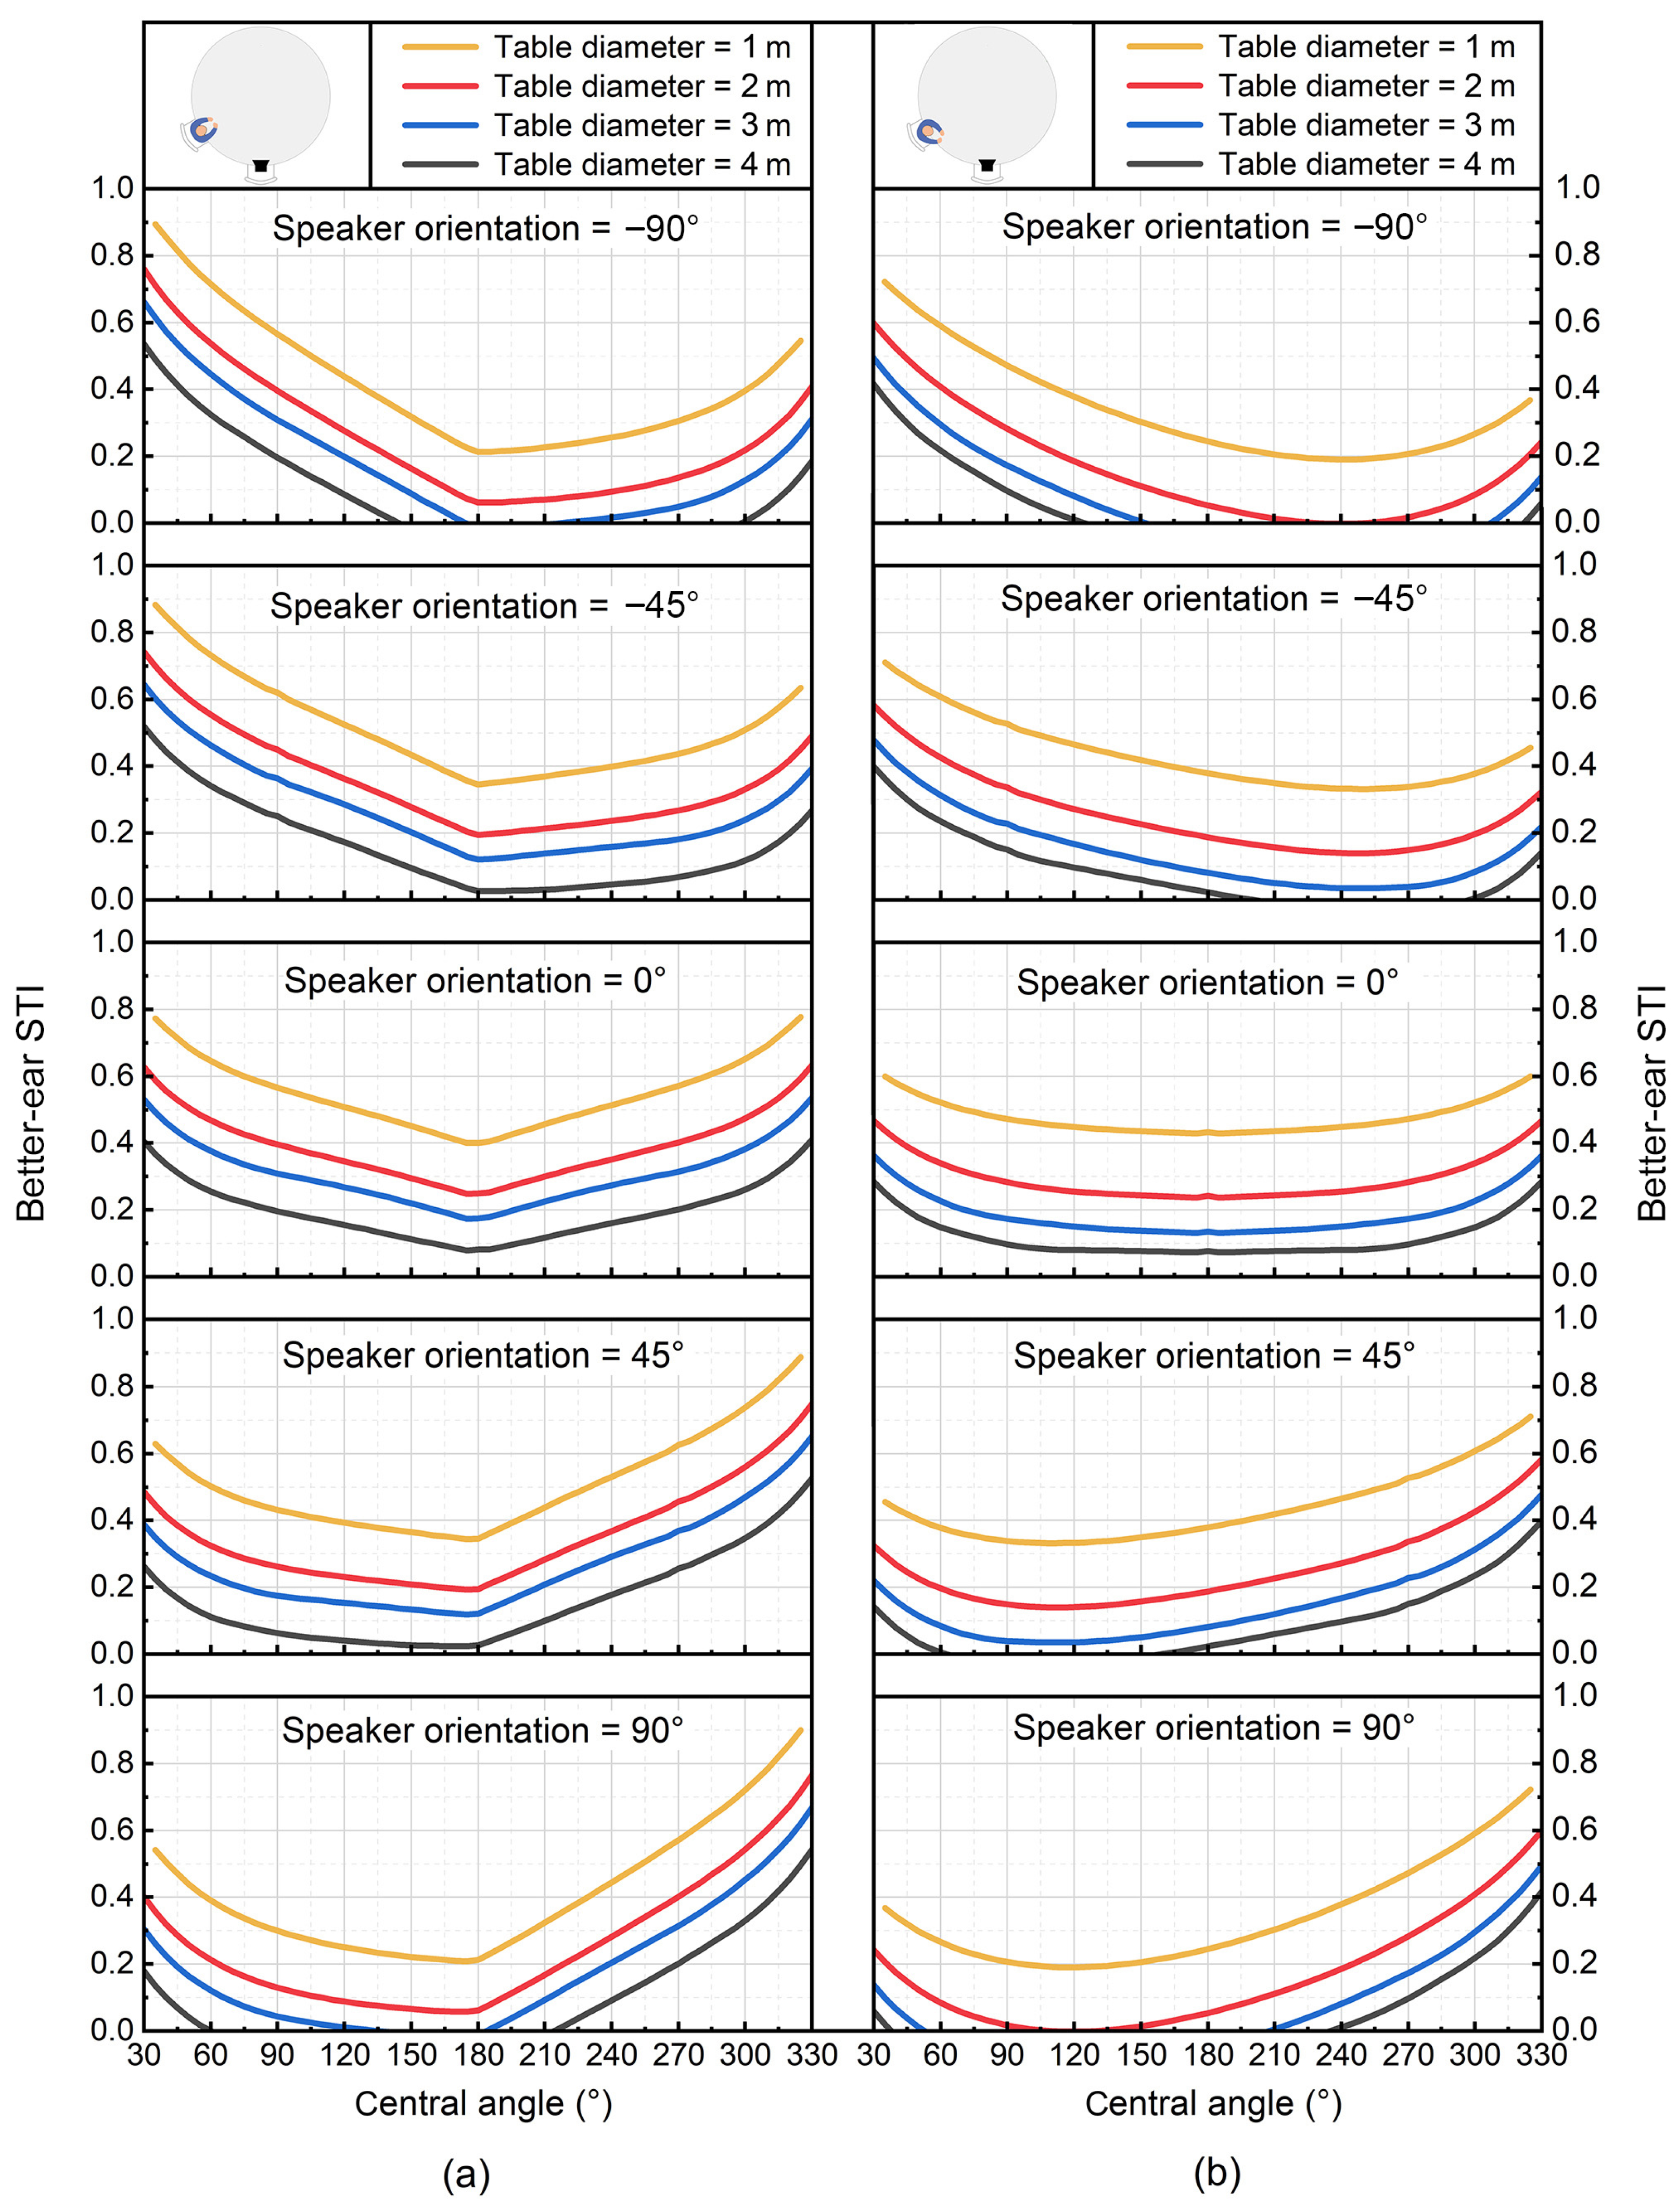
This section explores how STI values change with speaker orientation, following an analysis of listener STI for an omnidirectional point source in the free field. Figure 6 depicts the STI value ranges for various listener central angles ( α ), speaker orientations ( Ψ ), listener head orientations, and table diameters.
Speaker orientation affects STI such that at Ψ = 0 ° , lateral listeners experience reduced STI compared with a nondirectional setup because less sound energy radiates laterally in directional modes. When the speaker deviates from the frontal direction, the STI increases for listeners on the speaker-oriented side and decreases for those on the opposite side. The highest STI is consistently observed for the listener closer to the oriented side ( α = 30 ° for the left and α = 330 ° for the right), as shown in Figure 6. Thus, listeners nearest to the speaker orientation gain the maximum STI, with greater deviations enhancing STI variation. The influence of speaker orientation on listener STI can reach 0.36, independent of speaker orientation towards either the table or the speaker.
For listeners oriented towards the table, Figure 6a shows a consistent trend: the STI decreases as α increases for those to the left of the source ( α < 180 ° ), with a decreasing slope, whereas it increases for those on the right ( α > 180 ° ), with an increasing slope. The difference in the STI by listener position can reach 0.68, underscoring the strong link between the STI and the relative source–listener position when speaker directivity is not predominant. Conversely, for listeners facing the speaker (Figure 6b), the STI behavior at Ψ = 0 ° is similar to that of listeners facing the table. However, as the orientation diverges, the STI does not hit a minimum at α = 180 ° ; instead, it continues to drop until α is approximately 60 ° to 75 ° off-center before rising again. The positional STI variation is 0.53, which is less than that when facing the table, indicating that speaker directivity affects STI more than distance does. Comparative results of the STI under the two scenarios reveal that listener head orientation alters the STI by up to 0.18, highlighting head shadow effects on near-field SI.
Even with speaker orientation, the STI variation relative to the round-table diameter aligns with the nondirectional scenario. For various speaker orientations, the STI curves for different table diameters shift almost vertically, preserving consistent differences. Compared with the STI across table sizes, the maximum reductions in the STI are 0.19 as the diameter increases from D = 1 m to D = 2 m, 0.11 from D = 2 m to D = 3 m, and 0.12 from D = 3 m to D = 4 m (Figure 6). The STI change for a listener at the same location with each additional 1 m in table diameter remains below 0.2.

3.2. Experimental Results from Field Measurements in an Actual Room

3.2.1. Overall SNR Result

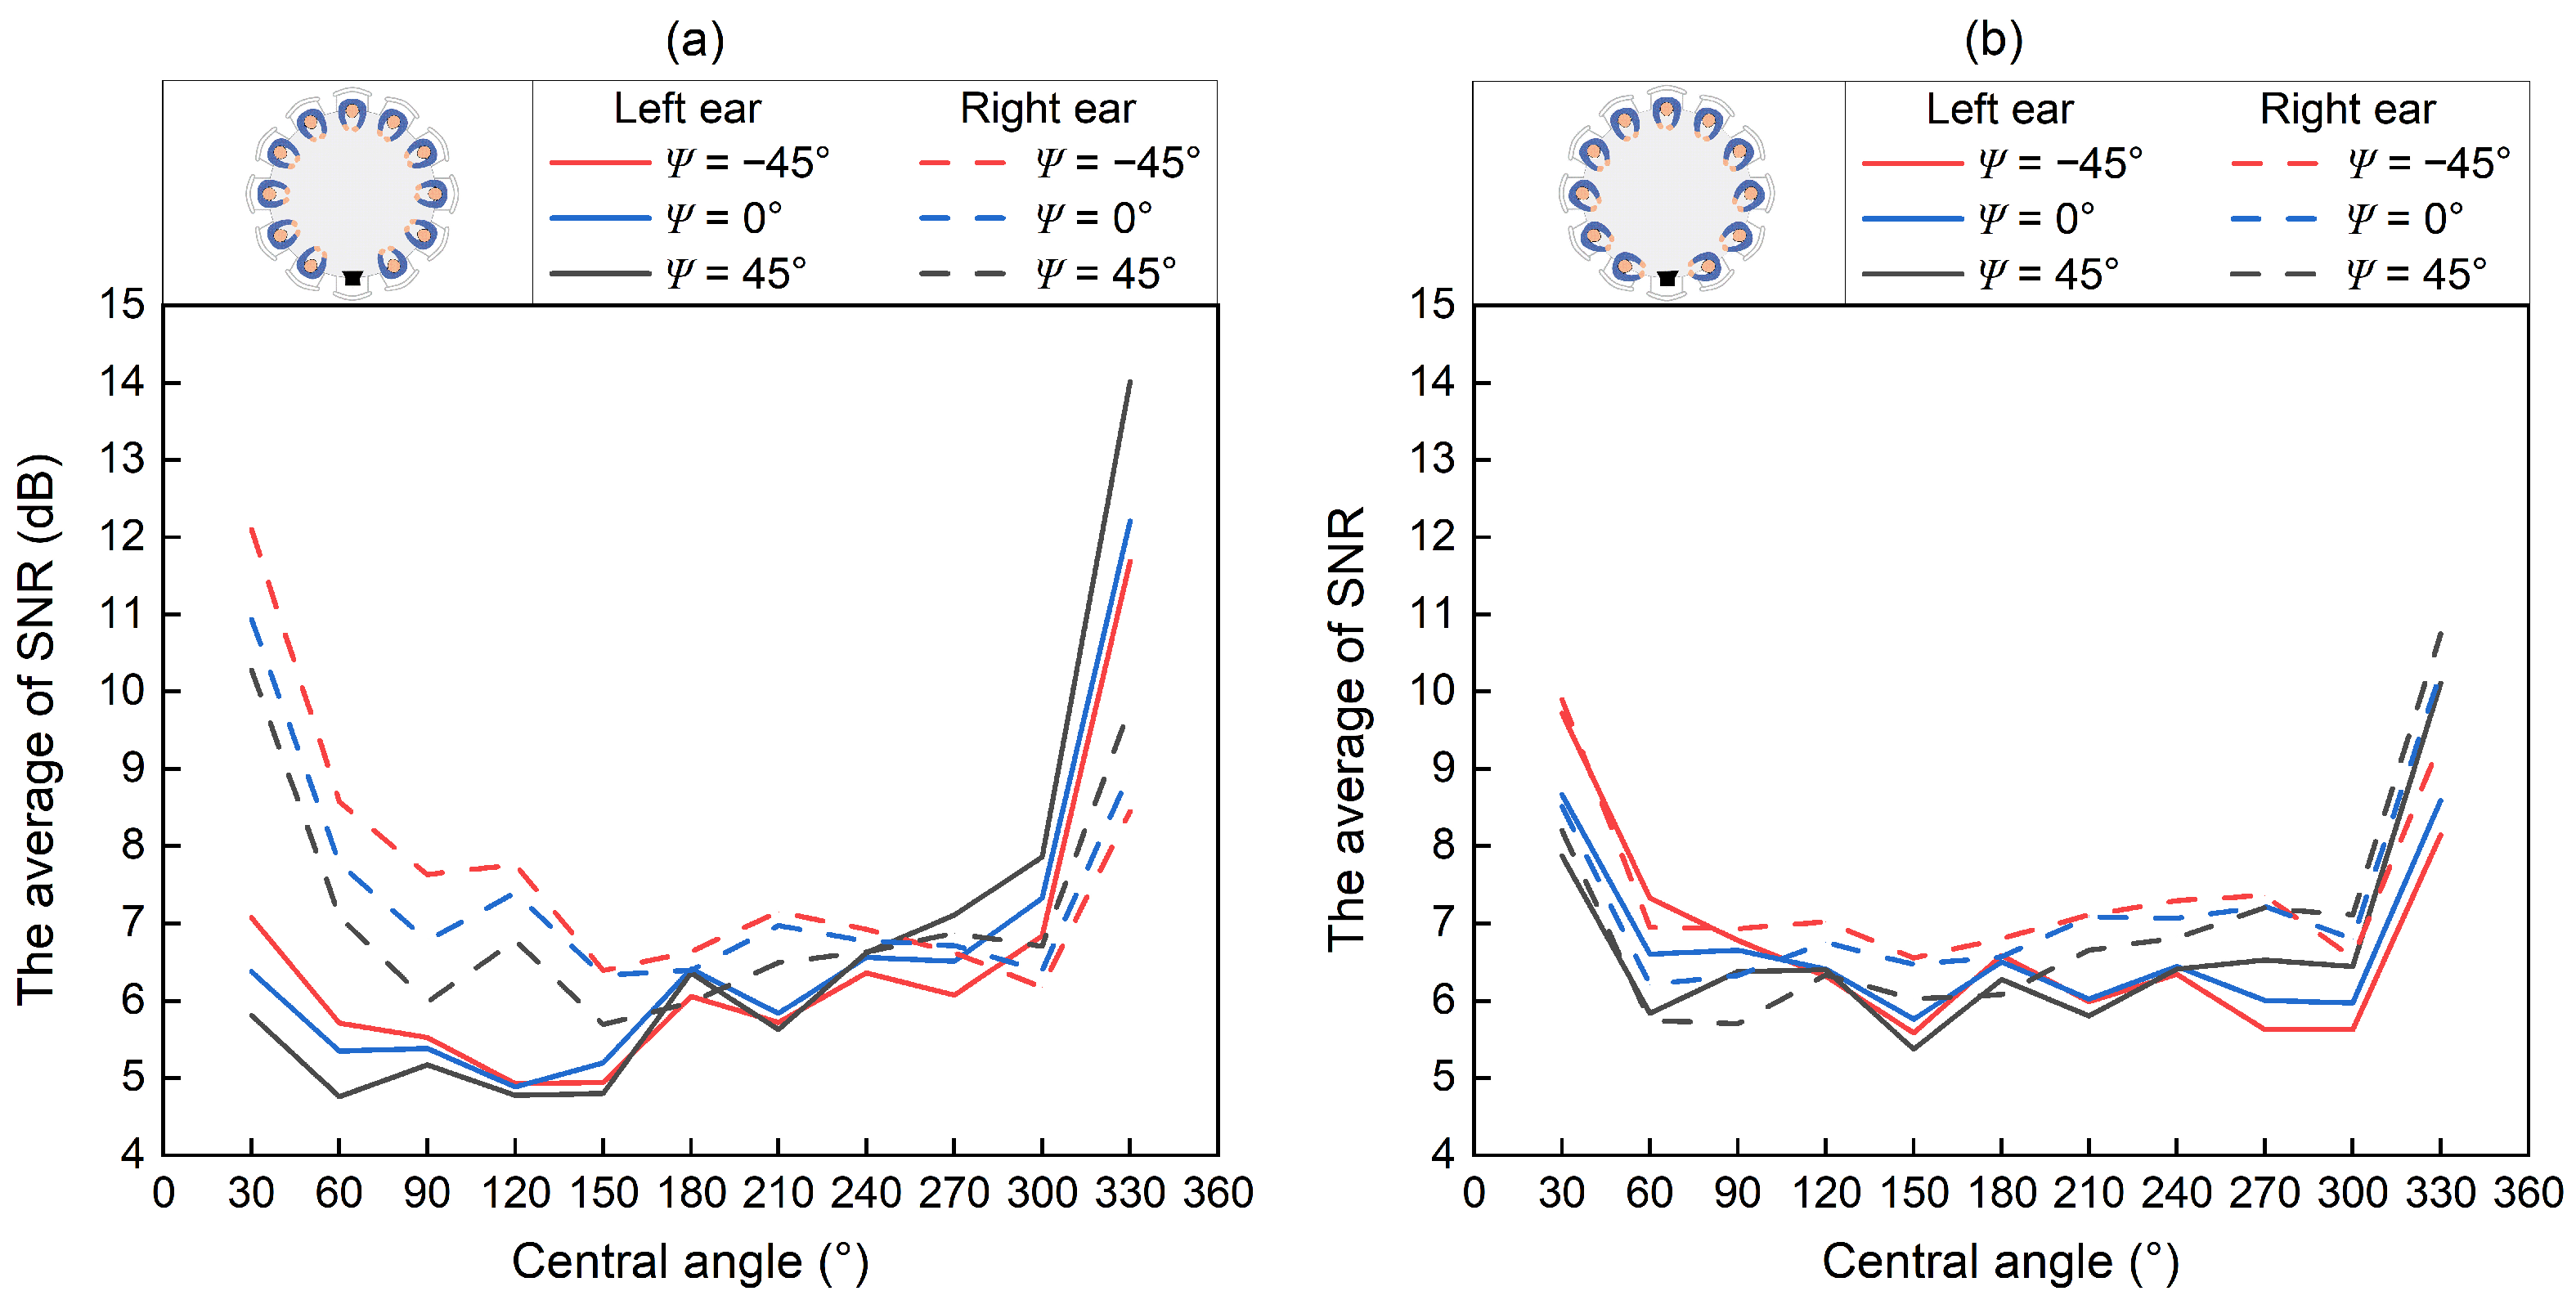
Figure 7 illustrates the SNR distribution for both ears across different listener positions and head orientations, as well as speaker orientations. Notably, owing to the circular symmetry of the round table, the spatial variation of SNR is reinforced, and the binaural SNRs essentially exhibit a left-right symmetric pattern centered at α = 180 ° . These SNR variations are highly sensitive to social interaction modes, reflecting the unique characteristics of round-table conversations.
The binaural effect results in a greater SNR for the ipsilateral ear than for the contralateral ear (Figure 7a). As the listener moves away from the speaker, the SNR of the ipsilateral ear decreases gradually. Facing the table causes noticeable left-right ear SNR discrepancies (Figure 7a), which are sensitive to position changes. When facing the speaker, such differences persist (Figure 7b). From a numerical perspective, facing the table, the SNR differences between ears can reach 5 dB, whereas for those facing the speaker, they peak at 1.7 dB, which is attributed significantly to the near-field head shadow effect [5,6,38,48].
Differences in the SNRs are evident at various listener positions (Figure 7). When listeners face the table, the SNR differences can reach 9.3 dB. Conversely, facing the speaker yields smaller SNR variations, up to 5.0 dB across listener positions. Within the same position, the SNR changes because the speaker orientation rarely exceeds 2.5 dB, which is significantly lower than the changes resulting from positional differences. When the two orientations are compared, listeners facing the table usually achieve a higher SNR, with decrease from 0 to 3.9 dB when facing the speaker (Figure 7).
Given that the BSTI varies linearly with the SNR, an SNR range of − 15 dB to 15 dB corresponds linearly to a BSTI range of 0 to 1. Accordingly, one just-noticeable difference (JND) of the BSTI (i.e., 0.03 ) corresponds to an SNR variation of 0.9 dB . On this basis, the corresponding BSTI differences ( Δ BSTI ) can be inferred from the measured SNR variations: the Δ BSTI across different listener positions is maximal but does not exceed 0.3 when facing the table, and up to 0.17 when facing the speaker. The Δ BSTI values associated with different head orientations of the speaker or listener are smaller than those caused by positional changes, yet all exceed 1 JND . The above indicates that the investigated factors, including spatial position and head orientation, can induce perceptibly different auditory perception. Among these factors, listener position exerts the most significant influence on SI.

3.2.2. STI Results

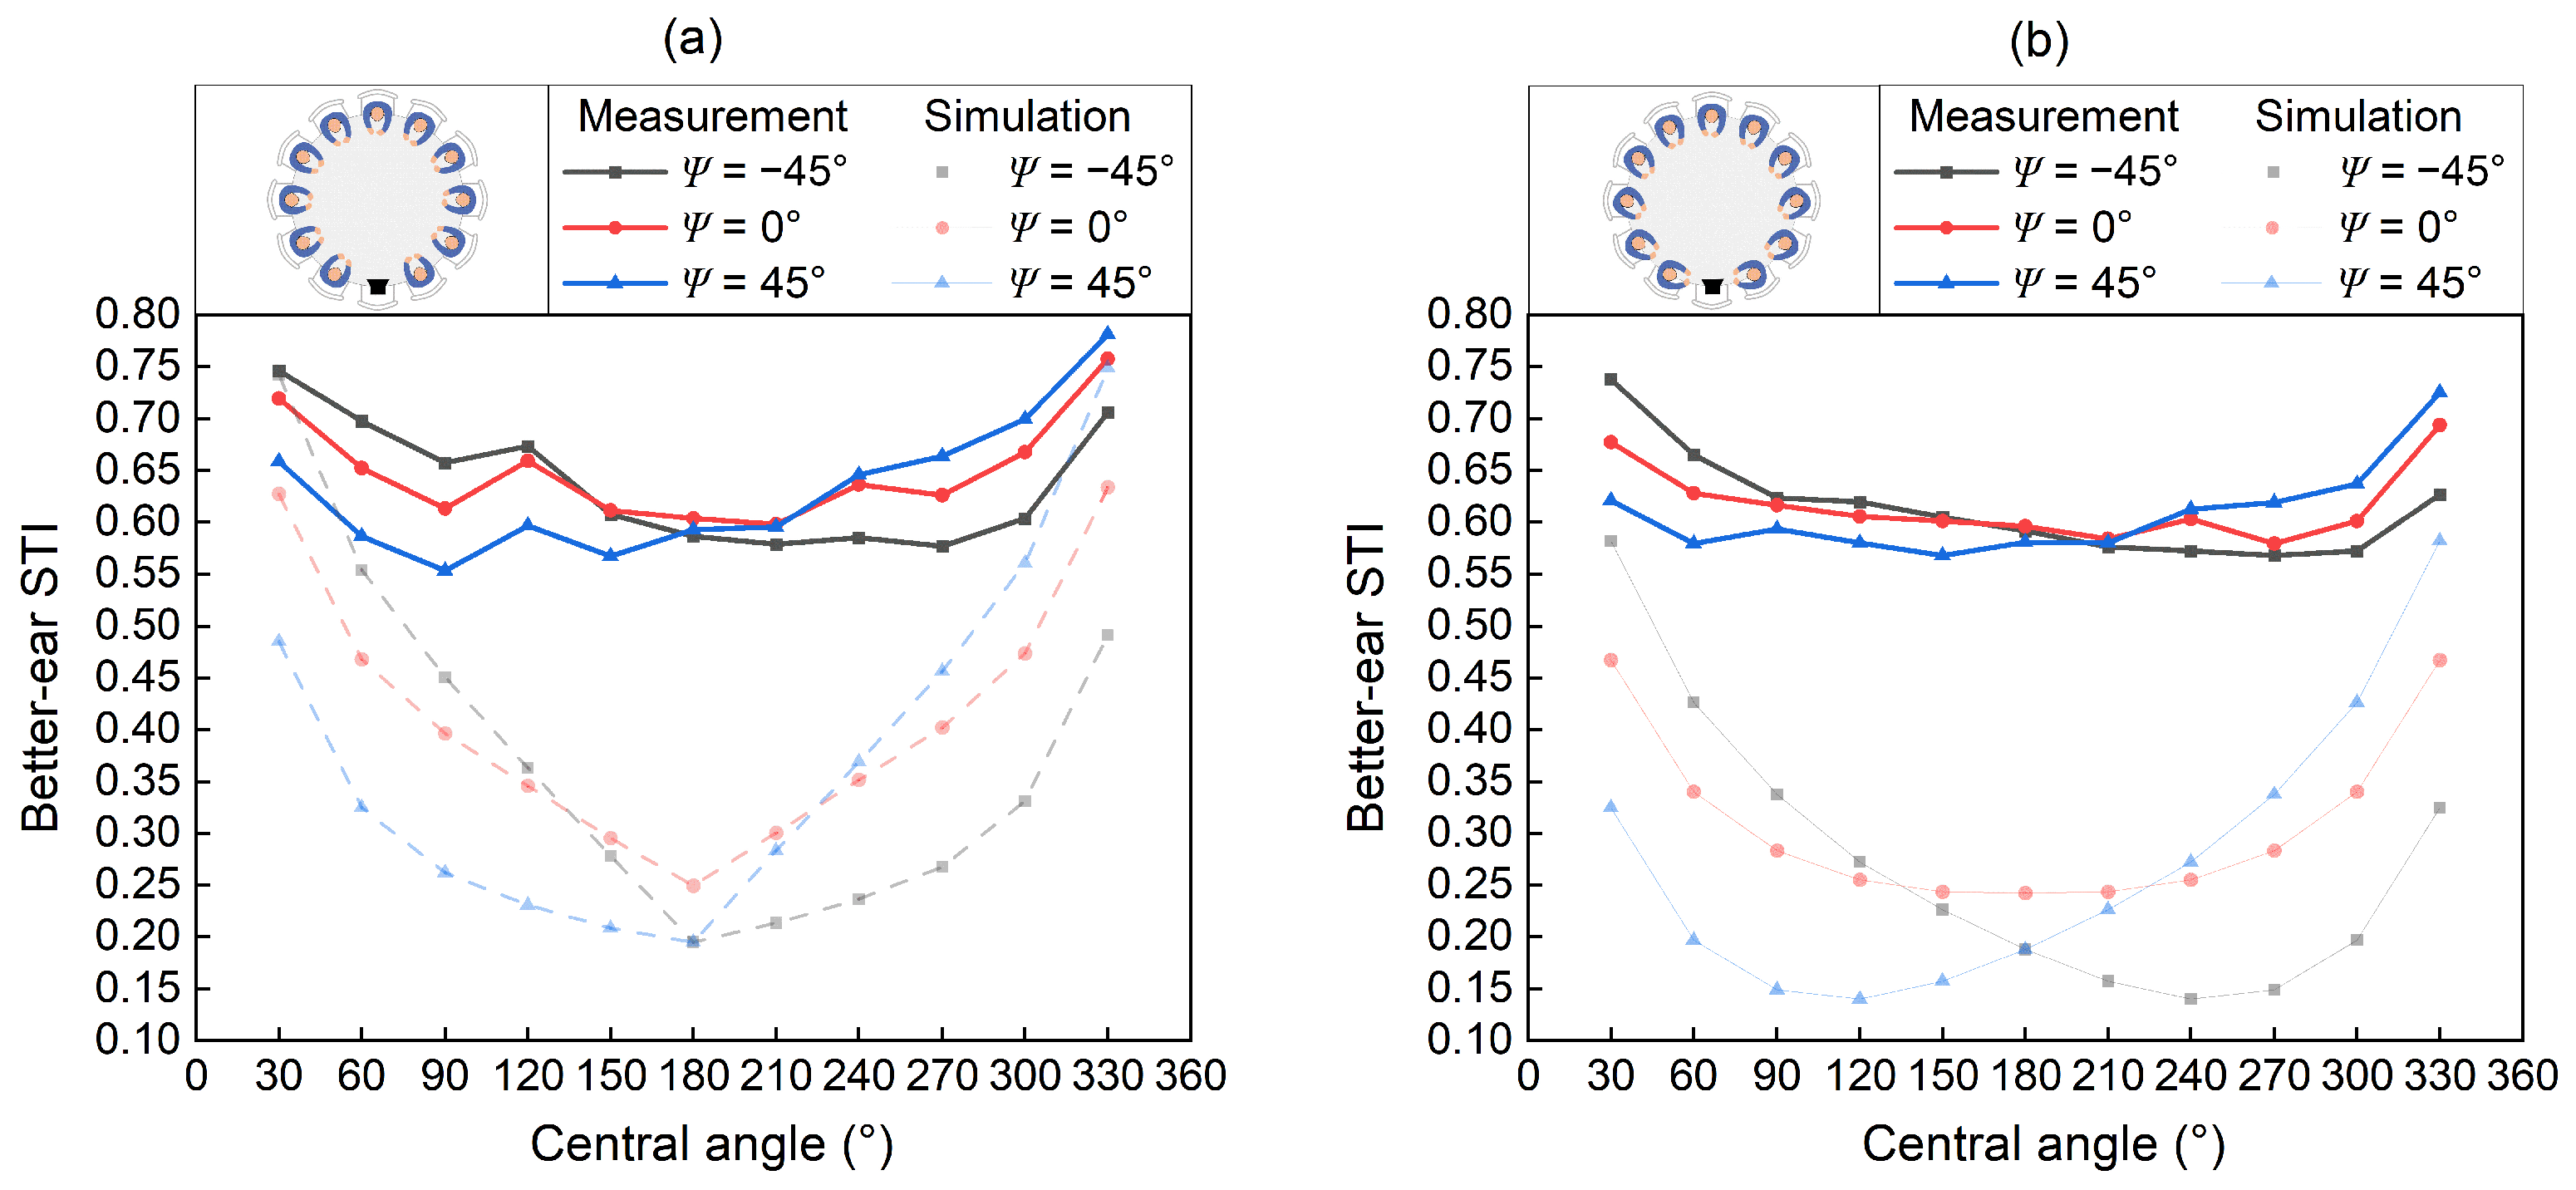
Figure 8 depicts the changes in the STI when the listener faces the table or speaker. At Ψ = − 45 ° , the STI peaks at α = 30 ° , decreases as α advances to a minimum at α = 270 ° , and then increases as proximity to the speaker decreases. At Ψ = 45 ° , the trend inversely mirrors that at Ψ = − 45 ° ; the STI maximizes at α = 330 ° , diminishes as α decreases, reaching a low value at α = 60 ° or 90 ° , and then increases with decreasing distance to the speaker. For Ψ = 0 ° , the STI decreases with increasing α for listeners on the speaker’s left and increases with α on the right. The irregular indoor sound field causes nonuniform STI curves, including some anomalies. Listeners to the side of the speaker generally experience higher STI than those directly in front, with lateral listeners showing more distinct STI variations with distance than frontal listeners. In essence, STI variations with listener positions in the actual room resemble those observed in free-field conditions.
For listeners positioned at the same central angle, those on the speaker’s left ( α < 180 ° ) experience a higher STI as Ψ decreases, whereas those on the right ( α > 180 ° ) experience an STI increase with increasing Ψ (Figure 8). When the speaker faces left, the listener at α = 30 ° has the peak STI; when the speaker turns right, this maximum shifts to α = 330 ° . Aligning with free-field observations, the listener on the side towards which the speaker faces has the better STI, diminishing with increasing angle disparity between the listener’s position and the speaker’s orientation. Moreover, STI variability intensifies as the speaker deviates more from facing forwards.
For speaker orientations Ψ between − 45 ° and 45 ° , the maximum STI variations caused by positional changes are 0.17, 0.16, and 0.23 for listeners oriented towards the round table, whereas the maximum STI differences for listeners facing the speaker are 0.17, 0.11, and 0.16, respectively, as shown in Figure 8. This indicates a more pronounced STI and distance correlation for those facing the round table than for those facing the speaker.
Table 4 shows the STI variations from different listener positions under two conditions. At Ψ = 0 ° , the actual room has a maximum STI difference of 0.16 (5.3 just noticeable differences, JNDs) [49] among different listener positions, whereas it is 0.38 (12.7 JNDs) in the free field. When the speaker deviates from the frontal direction, the maximum differences reach 0.17 (5.7 JNDs) in the actual room and 0.55 (18.3 JNDs) in the free field. These findings indicate that variations in the actual room are notably less than those in the free field, with differences increasing as speaker orientation diverges from the frontal.
According to the studies by Peng [50,51], there is a strong correlation between Mandarin SI scores and the STI, with the scores exhibiting an increasing trend as STI values rise. When the STI values are low (below 0.3), SI scores are also low (less than 50%), indicating that speech is difficult to comprehend. As the STI value reaches approximately 0.5, the SI score improves significantly to nearly 80%. When the STI value reaches 0.8 or higher, the SI score approaches 100%, indicating that speech is highly intelligible. Therefore, even minor variations in the STI can still have a certain effect on SI. As shown in Table 5 and Table 6, it is evident that the maximum differences in STI caused by various influencing factors far exceed those of the JND, with some differences even exceeding 0.3. These variations can have non-negligible effects on realistic communication.
The significance of reflected sound in the actual room is a key factor influencing the differences between free-field and real-room STI measurements. In practical scenarios, listeners across the table or at angles to the speaker’s orientation show significant STI improvement compared with free-field settings. First, listeners on the opposite side of the table far from the speaker receive relatively less direct sound. The addition of reflected sound therefore leads to better integration and enhancement of the direct sound. Second, STI has been improved for certain listener positions that deviate from the speaker’s head orientation. This improvement occurs because reflections from the room’s surface allow sound waves to reach both ears, especially the contralateral ear’s reception in the head shadow area. Numerous early reflections help compensate for the SNR at the contralateral ear, resulting in less variation in STI measurements based on listener location and head orientation.

3.3. SRT Results Based on the Subjective Experiment

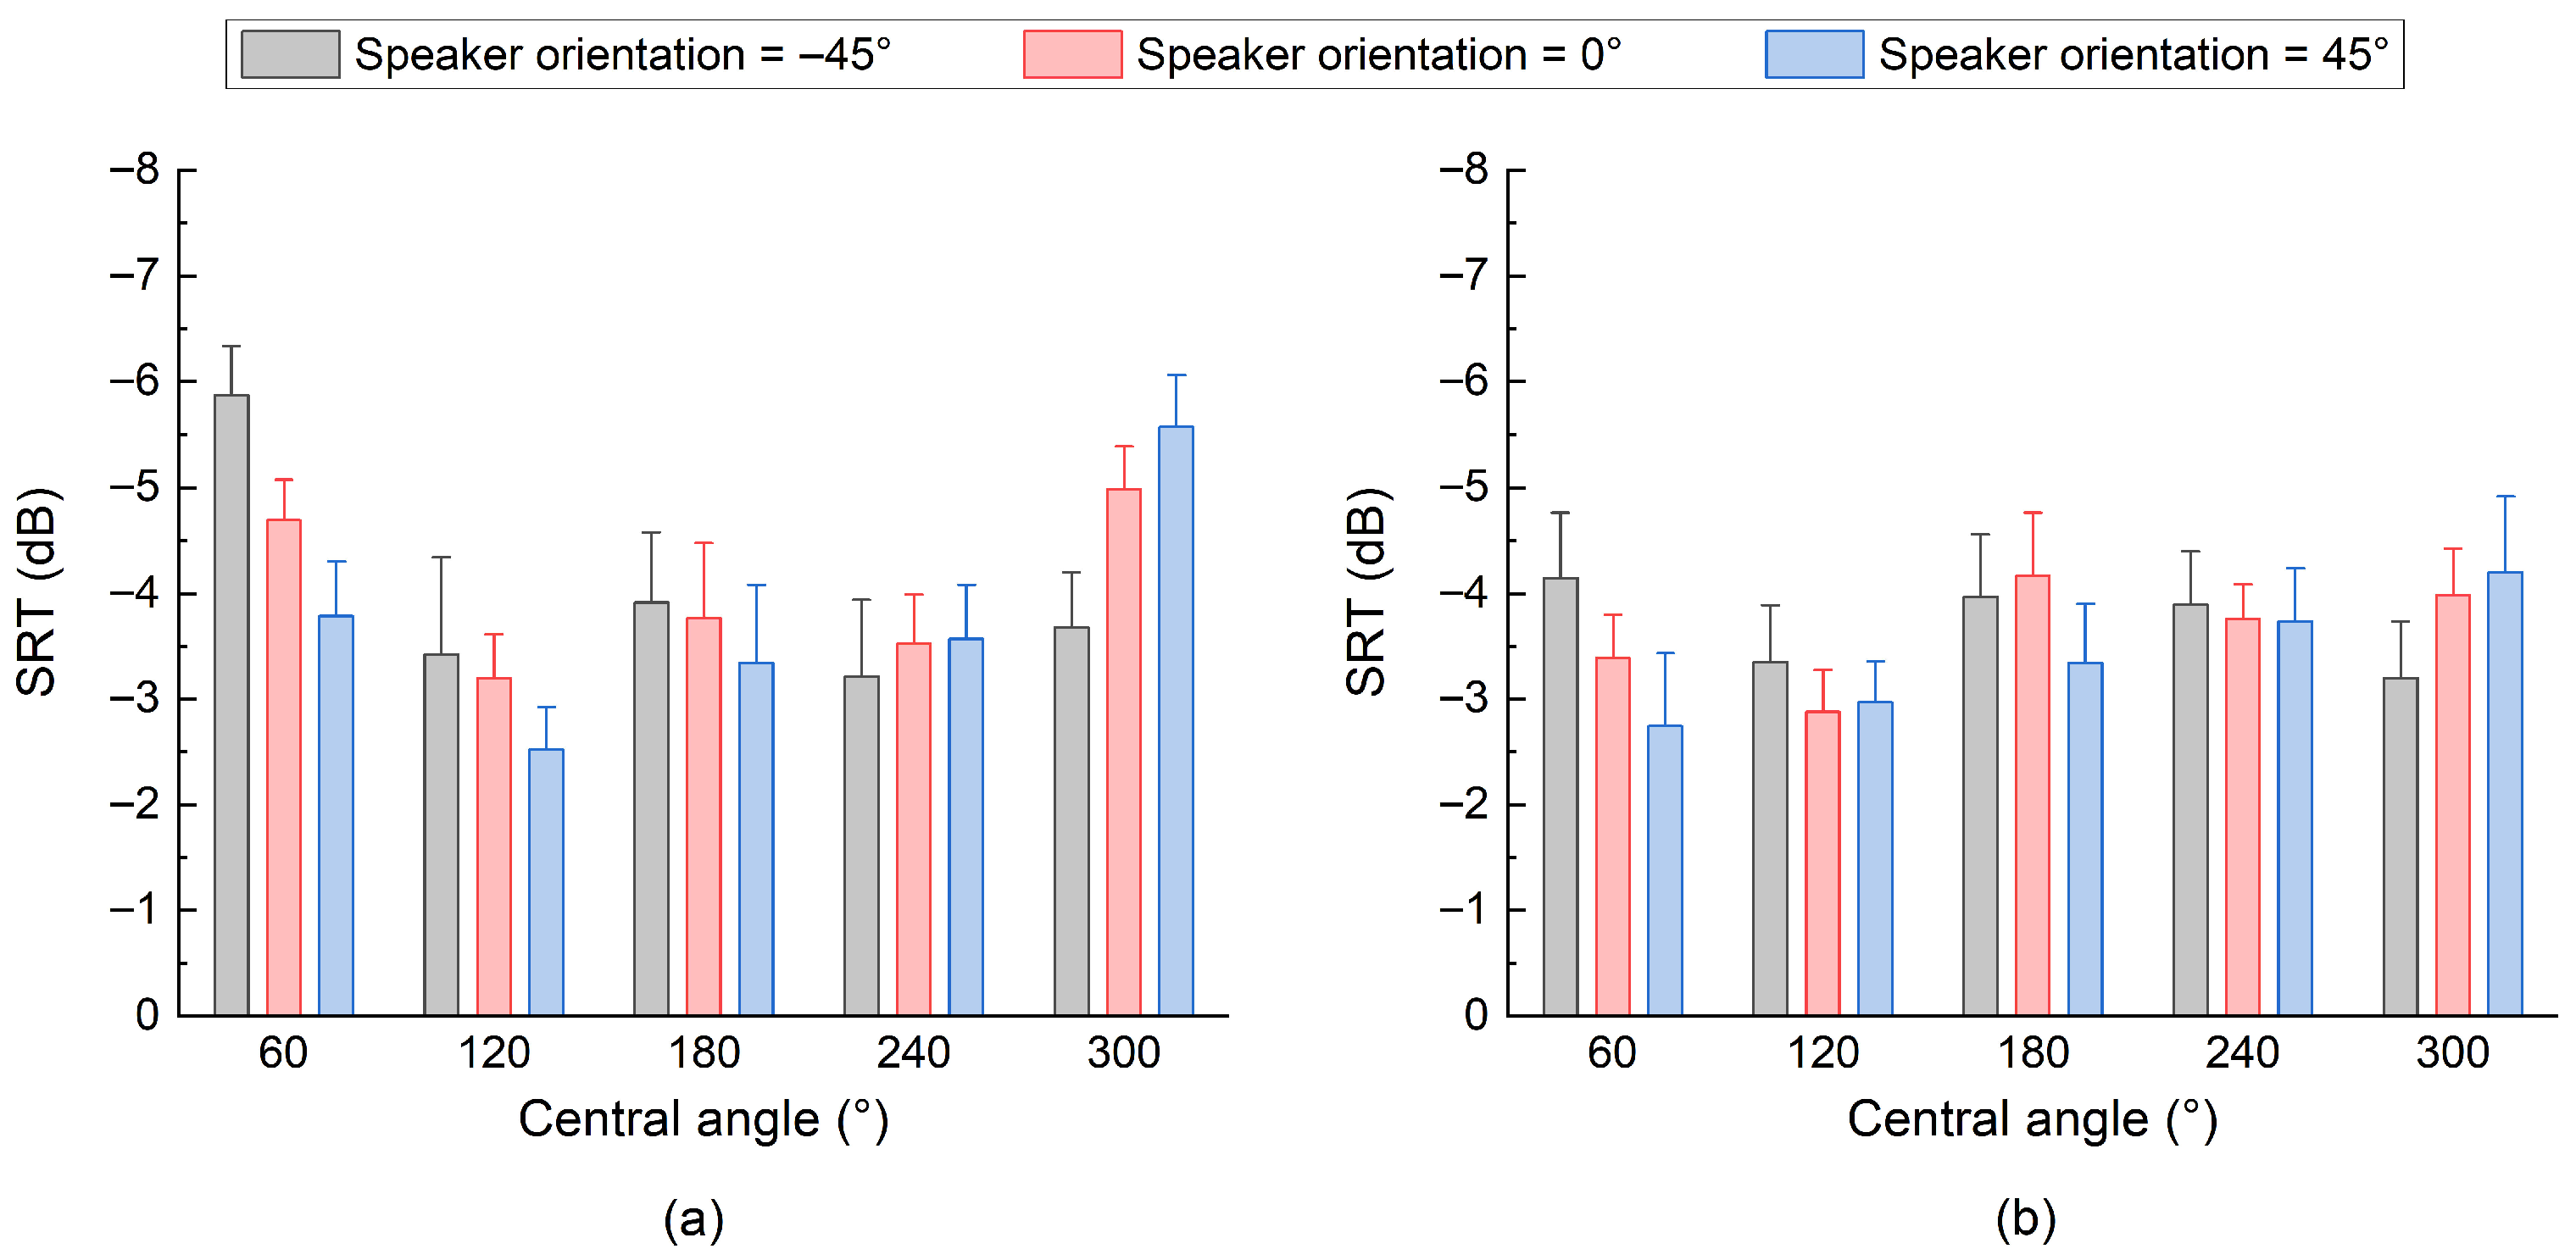
Figure 9 depicts the mean SRT values with 95% confidence intervals in the actual room, considering listeners facing the table or the speaker. Lower SRT values correspond to enhanced intelligibility. For comparison with earlier STI findings, SRT values are shown in inverse coordinates.
When listeners face the round table at Ψ = 0 ° (red bar), the SRTs for α = 60 ° and 300 ° are − 4.7 dB and − 5.0 dB, respectively, which are comparatively low (Figure 9a). In contrast, the SRTs are greater for α = 120 ° and 240 ° at − 3.2 dB and − 3.5 dB. The maximum variation in SRT across different listener positions reaches 1.8 dB, indicating a strong relationship with the spatial configuration of the speaker and listener. When facing the speaker, SRTs rise for α = 180 ° to 300 ° , obtaining a valley value at − 4.2 dB for α = 180 ° (Figure 9b). Higher SRTs not exceeding − 3.4 dB are recorded for α = 60 ° and 120 ° , with a reduced maximal SRT disparity of 1.3 dB, indicating less variation than facing the round table. In this scenario, distance variation is no longer the dominant factor affecting SRT values.
For Ψ = − 45 ° (gray bar), the SRT reaches a minimum at α = 60 ° for listeners facing the round table ( − 5.9 dB) or the speaker ( − 4.2 dB). The SRT variability for those facing the round table shows significant positional differences, with peaks at 2.7 dB (Figure 9a), which are greater than those at Ψ = 0 ° , highlighting the impact of speaker orientation on the fluctuation in the SRT. In contrast, listeners who face the speaker experience variability in SRT of less than 1 dB in position (Figure 9b). This variability shows less fluctuation than that at Ψ = 0 ° because of a notably low SRT of − 4.2 dB at Ψ = 0 ° for α = 180 ° . At Ψ = 45 ° (blue bars), minimum SRTs occur at α = 300 ° , with values of − 5.6 dB for listeners facing the round table and − 4.2 dB for listeners facing the speaker. The positional SRT differences reach 3.1 dB and 1.5 dB, respectively, exceeding those at Ψ = 0 ° .
Varying the speaker orientation revealed that the SRTs were consistently lower for listeners located on the side closest to the speaker. Specifically, listeners at α = 60 ° or 300 ° recorded the lowest SRT values, whereas those positioned away from the speaker’s direction presented higher SRTs (Figure 9). At these central angles, the SRT differences were 2.1 dB for listeners facing the round table and 1.4 dB for listeners facing the speaker in different head orientations. For listeners positioned from α = 120 ° to 240 ° , the SRT variations remained below 0.9 dB and 0.6 dB for the two listener orientations under different speaker orientations, respectively. These findings indicate that a reduced distance between the listener and speaker accentuates SRT disparities, particularly for round-table-oriented listeners, because of increased direct sound. The head shadow effect causes these listeners to be more affected by the speaker’s directivity, unlike those facing the speaker.
An analysis of the data in Figure 9a,b clearly reveals that the listener head orientation significantly affects the SRT, especially for those positioned laterally near the speaker. The SRT varies by up to 1.7 dB at α = 60 ° and 1.4 dB at 330 ° . For other listeners, orientation-induced SRT differences remain below 0.7 dB, largely due to head shadow effects.
The SRT variation trends across different listener positions and head orientations are consistent with the STI measurements in free-field and real-room settings (see Figure 8). A significant SRT reduction is noted at α = 180 ° , where the listener faces the speaker, contrary to the anticipated impact of the listener position on SI from prior STI data. This inconsistency occurs because the STI selects only the better ear and does not consider the full benefits of binaural listening [38,44].
A repeated-measures analysis of variance (rm-ANOVA) test (95% confidence level) was applied to SRT values considering varying listener positions, speaker orientations, and listener head orientations, as detailed in Table 7. The findings show significant effects on SRT from the listener position ( F ( 4 , 36 ) = 14.73 , p < 0.001 ), speaker orientation ( F ( 2 , 18 ) = 4.67 , p = 0.023 ), and listener head orientation ( F ( 1 , 9 ) = 11.60 , p < 0.008 ). The interactions between listener position and speaker orientation ( F ( 8 , 72 ) = 22.81 , p < 0.001 ), listener position and listener head orientation ( F ( 4 , 36 ) = 29.97 , p < 0.001 ), and all three factors combined ( F ( 8 , 72 ) = 3.30 , p = 0.003 ) are significant. Conversely, the interaction between speaker orientation and listener head orientation is not substantial for SRT ( F ( 2 , 18 ) = 0.22 , p = 0.80 ).
Subsequent post hoc pairwise comparisons applying the Bonferroni correction were carried out to analyze differences among distinct listener positions. Initially, consider the case where the listener is oriented towards the table. For Ψ = − 45 ° , the SRT at α = 60 ° was notably different with respect to other positions ( p < 0.01 ), whereas no significant disparities were detected among the remaining positions. Similarly, for Ψ = 45 ° , there was a significant difference in the SRT at α = 300 ° compared with the other orientations ( p < 0.01 ), and the SRT at α = 120 ° was also significantly distinct from that at α = 60 ° , 240 ° , and 300 ° ( p < 0.03 ). For Ψ = 0 ° , significant differences in SRTs were present between the listener at α = 60 ° or 300 ° and those at α = 120 ° or 240 ° ( p < 0.001 ). Moreover, significant differences were noted between the SRT at α = 300 ° and the SRT at α = 120 ° or 240 ° ( p < 0.001 ). Conversely, the outcomes when listeners faced the speaker diverged from the previous findings. With Ψ = − 45 ° , the SRT at α = 120 ° was significantly different from all other positions except α = 300 ° ( p < 0.05 ), and conversely, the SRT at α = 300 ° was significantly distinct from all other positions except α = 120 ° ( p < 0.05 ). For Ψ = 45 ° , the SRT at α = 60 ° significantly differed from the SRTs at α = 240 ° and 300 ° ( p = 0.001 ), and the SRT at α = 120 ° was notably different from the SRTs at other positions except α = 60 ° ( p < 0.05 ). At Ψ = 0 ° , the SRT at α = 60 ° differed significantly from all other positions apart from α = 240 ° ( p < 0.05 ). The SRT at α = 120 ° was significantly distinct from those at the other positions ( p < 0.005 ), with no significant difference among the remaining positions.
Pairwise comparisons were also conducted to evaluate variations in SRT across different speaker orientations. In the case where listeners are oriented towards the table, significant SRT discrepancies were found for α = 60 ° across all speaker orientations ( p < 0.03 ). When α = 180 ° , a notable difference in SRT was present between Ψ = − 45 ° and Ψ = 45 ° ( p < 0.001 ). For α = 300 ° , there were significant SRT distinctions between Ψ = − 45 ° and both Ψ = 0 ° and Ψ = 45 ° ( p < 0.01 ). However, no significant SRT differences were detected at α = 120 ° or α = 240 ° ( p > 0.05 ). In situations where the listener directly faced the speaker, for α = 180 ° , significant discrepancies in SRT were observed between Ψ = 45 ° and both Ψ = − 45 ° and Ψ = 0 ° ( p = 0.003 ). In addition, substantial variations in SRTs were observed across different listener head orientations when the central angle α was 60 ° , 240 ° , or 300 ° ( p < 0.05 ). Other comparisons followed a pattern consistent with listeners facing the table.

4. Discussion

This study examines the distribution patterns and variations in SI during round-table conversations. The results indicate that factors such as the listener position, speaker orientation, and listener head orientation significantly affect SI for listeners sitting around a round table, regardless of whether it is in a free-field or an actual room environment. The results offer a theoretical framework for comprehending both the variations in speech communication quality during round-table discussions and the impacts of critical influencing factors, thereby providing scientific evidence for the acoustic optimization of multiperson communication environments.
In round-table conversation scenarios, the listener position significantly influences SI in both free-field and actual room environments. Under free-field conditions, the variations in STIs can reach 0.55 (18.3 JNDs), whereas in the actual room, the STI differences may still reach 0.23 (7.6 JNDs), and an SRT difference of 3.1 dB is noted. These differences are linked to the spatial relationships (distance and direction) between the listener and the speaker. For example, in comparison with listeners seated directly in front of the speaker (i.e., across the table), those positioned laterally or closer to the speaker have significantly higher SI values (see Figure 8 and Figure 9).
Moreover, the SI of lateral listeners is more sensitive to positional (distance) variations. This phenomenon aligns with the physical characteristics of the HRTF, where under near-field conditions, the binaural effect leads to more pronounced magnitude fluctuations across different sound source distances [6]. Thus, listeners nearer the source obtain higher and more variable SI values. These results indicate that although a round-table setup encourages an egalitarian and harmonious social atmosphere by eliminating hierarchical seating, notable differences in SI persist among listeners located in various positions.
The orientation of the listener’s head significantly changes their SI level and the distribution pattern along the round table. Compared with those facing the speaker, listeners facing the table generally exhibit greater SI, with a free-field STI increase of up to 0.17 (5.6 JNDs) and a perceptible increment of 0.08 (2.6 JNDs) in the actual room, alongside an SRT disparity of up to 1.7 dB under real-room conditions. Essentially, SI is greater for lateral sources (when listeners face the table) than for frontal (when listeners face the speaker) sources. This result is in line with the findings of Liang and Yu [6], which can be attributed significantly to the near-field head shadow effect [5,6,38,48]. The above findings are also consistent with studies by Lokki [52] and Padilla Ortiz [53], which demonstrate that lateralization of the speaker generally enhances binaural intelligibility under varying reverberation conditions. As Padilla Ortiz [54] revealed through subjective SI tests, under conditions of interaural decorrelated noise, SI slightly improves when the listener does not directly face the speaker.
Furthermore, when listeners face the table, SI shows greater sensitivity to positional changes (i.e., a stronger correlation with distance). In the free field, the STI differences ranged from 0.38 to 0.55 for listeners facing the round table and from 0.22 to 0.44 for those facing the speaker. In private rooms, the STI varies from 0.16 to 0.23 in the former scenario and 0.11 to 0.17 in the latter. This decline is linked to the distance relationship of the HRTF magnitude spectrum, which is especially pronounced when the sound source is lateral to the listener [6].
The variation in speaker orientation also alters the radiation characteristics of the sound source, thereby affecting SI in round-table conversation scenarios. As expected, SI improves when the speaker is facing listeners and decreases when the speaker is facing away. Adjacent listeners are more affected by speaker orientation changes, whereas opposite listeners see minimal changes. The observed variation in speaker orientation aligns with and extends findings of Steffens [55], confirming that human vocal radiation exhibits a spatial directivity pattern governing the sound energy distribution. Specifically, under free-field conditions, when the speaker orientation shifts from − 45 ° to 45 ° , the STI difference ranges from 0.1 ( α = 180 ° ) to 0.25 ( α = 30 ° ). In the actual room, the STI difference varies from 0.01 ( α = 180 ° ) to 0.12 ( α = 30 ° ), and the SRT difference can still reach 2.1 dB. According to Liang and Yu [32], owing to the directivity of the sound source, the STI in an anechoic chamber decreases sharply with increasing sound source radiation angle, with a maximum variation of up to 0.3. The STI variations in this study, induced by speaker orientation in free-field conditions, align with the reference ranges from prior studies. However, the STI changes caused by speaker orientation in the actual room are considerably smaller than those in the free field and may even be negligible at certain listener positions. As established by Stewart [56], reverberant sound fields and background noise can reduce STI sensitivity to variations in speaker orientation. In the small indoor space measured in this study, the presence of reflected and reverberant sounds which combine with the direct sound partially compensates for the loss of direct sound even when the speaker orientation changes, thereby mitigating the impact of speaker orientation on STI. Nevertheless, speakers should still be encouraged to adjust their head orientation flexibly during communication to optimize auditory intelligibility.
This study also simulated the effect of the round table size on SI distribution in a free-field environment. The results indicate that expanding the table’s diameter while the listener’s central angle remains constant merely changes the distance between the speaker and listener, causing the STI curve to drop. Under free-field conditions, substantial variations in the STI with a 1-m diameter remain under 0.2. Therefore, for round-table conversations with 10 or fewer participants, the table diameter is recommended to be controlled within 2.0 m. Under free-field conditions, this range ensures basically audible SI for most listener positions. In typical indoor spaces with moderate reverberation and minimal sound absorption, this size range guarantees stable and even favorable SI for most seats across different speaker orientations. If a larger table is required, a 1.0 m diameter increment should be used as a design threshold, and corresponding active or passive acoustic measures should be implemented. These include floor carpeting, wall sound absorption treatments, table-edge sound-absorbing borders, and sound reinforcement systems to compensate for the loss of SI caused by larger table sizes.
Findings across environments with and without reflected sound demonstrate that while the SI variation patterns in actual rooms were largely consistent with those in free-field simulations, the changes in STI caused by different listener positions, speaker orientations, and listener head orientations in real rooms were less pronounced. This reduction is attributed mainly to early reflections compensating for listeners in less optimal positions. In the smaller rooms examined, early reflected sounds still exert a measurable effect. In anticipation of similar effects in larger rooms, the results imply that round table communication efficiency within the reverberation radius is similarly influenced by these factors.
In summary, in round-table conversation scenarios, optimization based on key factors including listener position, listener head orientation, speaker orientation, and table diameter can naturally and cost-effectively improve verbal communication efficiency.
With respect to the experimental design, this study emphasized the spatial distribution of SI and its influencing elements. Consequently, variables such as the Lombard effect and vocal adjustments were excluded. In practice, the Lombard effect only changes the relative magnitude of SI and minimally affects the experimental conclusions about variation patterns under different conditions in this study. Nonetheless, these factors are crucial in speech perception in multitalker scenarios. Further research is needed to explore their roles and effects in round-table conversation settings. Additionally, while the single room employed in this study offers a targeted acoustic environment for investigation, this aspect highlights the need for future work to extend measurements to multiple rooms with diverse acoustic conditions to further enrich existing conclusions.

5. Conclusions

This study systematically investigated the distribution of SI and the mechanisms of key influencing factors in round-table conversation scenarios. The study results reveal that in round-table settings, SI varies greatly based on the listener position, with the degree of these variations exceeding what was anticipated. Individuals situated closer to the speaker experience a significantly greater SI than those positioned across the table, with the STI variation reaching 0.55 in the free field and 0.23 in the real room, whereas the SRT variation reached 3.1 dB in the latter environment. When listeners face the speaker rather than the table’s center, the spatial variability in SI is reduced, although this change detrimentally impacts most listeners’ SI. Furthermore, the speaker orientation influences SI; when the speaker’s main axis shifts away from the listeners, their SI is diminished, particularly for those in closest proximity to the speaker. Unlike the previously mentioned factors, changing the table diameter does not alter the spatial arrangement pattern of SI. However, the overall STI among listeners decreases by at most 0.2 for each meter added to the diameter. In general, the pattern of SI variation in the real room is largely similar to that in the free field. Nevertheless, reflections significantly enhance SI for listeners in less advantageous positions, thereby reducing SI disparities among them.
This research examines how various factors, including the spatial positions of speakers and listeners, their head orientations, the dimensions of the table, and the surrounding acoustic environment, affect SI in round-table discussions. By analyzing the interaction of these diverse elements, a comprehensive understanding of speech communication quality in complex scenarios can be achieved, thus addressing the current research gap. This study broadens the understanding of the relationship between social behavior and verbal communication quality, providing theoretical foundations for enhancing acoustic design and communication efficiency in intricate social settings.

Author Contributions

Conceptualization, L.L. (Linda Liang) and L.L. (Lingling Liu); methodology, L.L. (Lingling Liu) and M.R.; software, L.L. (Lingling Liu); validation, L.L. (Linda Liang) and Y.S.; formal analysis, L.L. (Lingling Liu) and K.H.; investigation, L.L. (Lingling Liu) and M.R.; resources, L.L. (Linda Liang); data curation, L.L. (Lingling Liu); writing—original draft preparation, L.L. (Lingling Liu); writing—review and editing, L.L. (Linda Liang) and Y.S.; visualization, L.L. (Lingling Liu) and K.H.; supervision, L.L. (Linda Liang) and Y.S.; project administration, L.L. (Linda Liang); funding acquisition, L.L. (Linda Liang). All authors have read and agreed to the published version of the manuscript.

Funding

This work was supported by the Middle-aged and Young Teachers Basic Ability Promotion Project of Guangxi (Grant No. 2024KY0028) and the Research Start-up Funding for Inclusive Support Policies for Young Talents (ZX02080030324022).

Institutional Review Board Statement

The study was conducted in accordance with the Declaration of Helsinki, and approved by the Institutional Review Board (or Ethics Committee) of Guangxi University (protocol code GXU2024012 and date of approval: 15 January 2024).

Informed Consent Statement

Informed consent was obtained from all subjects involved in the study.

Data Availability Statement

The data presented in this study are available on request from the corresponding author. The data are not publicly available due to privacy restrictions.

Conflicts of Interest

The authors declare no conflicts of interest.

References

  1. Bae, K. Around the globe: The material culture of cantonese round tables in high-qing china. In Eurasian Matters: China, Europe, and the Transcultural Object, 1600–1800; Springer International Publishing: Cham, Switzerland, 2018; pp. 37–55. [Google Scholar]
  2. Li, Q.; Li, N.; Wang, Y.; Li, Z.; Tian, M.; Zhang, Y. Assessing acoustic conditions in hybrid classrooms for Chinese speech intelligibility at the remote end. Buildings 2025, 15, 1909. [Google Scholar] [CrossRef] [Scilit]
  3. Gao, S.H.; Ma, E.P.M. The relationship between voice parameters and speech intelligibility: A scoping review. J. Voice 2024, in press. [Google Scholar] [CrossRef] [Scilit]
  4. Kuttruff, H. Room Acoustics, 5th ed.; CRC Press, Taylor & Francis Group: Boca Raton, FL, USA, 2009. [Google Scholar]
  5. Xie, B.S. Head–Related Transfer Function and Virtual Auditory Display; J. Ross Publishing: Fort Lauderdale, FL, USA, 2013. [Google Scholar]
  6. Liang, L.D.; Yu, G.Z. Binaural speech transmission index with spatialized virtual speaker in near field: Distance and direction dependence. J. Acoust. Soc. Am. 2020, 148, EL202–EL207. [Google Scholar] [CrossRef] [Scilit]
  7. Peng, J.X.; Wang, T.; Wu, S.X. Investigation on the effects of source directivity of chinese speech intelligibility in real and virtual rooms. Appl. Acoust. 2013, 74, 1037–1043. [Google Scholar] [CrossRef] [Scilit]
  8. Bronkhorst, A.W.; Plomp, R. The effect of head-induced interaural time and level differences on speech intelligibility in noise. J. Acoust. Soc. Am. 1988, 83, 1508–1516. [Google Scholar] [CrossRef] [Scilit]
  9. Orduña-Bustamante, F.; Padilla-Ortíz, A.; Torres-Gallegos, E. Binaural speech intelligibility through personal and non-personal hrtf via headphones, with added artificial noise and reverberation. Speech Commun. 2019, 105, 53–61. [Google Scholar] [CrossRef] [Scilit]
  10. Durlach, N.I. Equalization and cancellation theory of binaural masking-level differences. J. Acoust. Soc. Am. 1963, 35, 1206–1218. [Google Scholar] [CrossRef] [Scilit]
  11. Peng, J.X.; Wu, S. Chinese speech intelligibility of children in noisy and reverberant environments. Indoor Built Environ. 2018, 27, 1357–1363. [Google Scholar] [CrossRef] [Scilit]
  12. Higgins, N.C.; Pupo, D.A.; Ozmeral, E.J.; Eddins, D.A. Head movement and its relation to hearing. Front. Psychol. 2023, 14, 1183303. [Google Scholar] [CrossRef] [Scilit] [PubMed]
  13. Valzolgher, C. Motor strategies: The role of active behavior in spatial hearing research. Psychol. Rep. 2024, 129, 981–1003. [Google Scholar] [CrossRef] [Scilit] [PubMed]
  14. Liang, L.D.; Ren, M. The effect of listener head orientation on front-to-rear speech intelligibility in an automotive cabin. Appl. Acoust. 2023, 211, 109517. [Google Scholar] [CrossRef] [Scilit]
  15. Otondo, F.; Rindel, J.H. The influence of the directivity of musical instruments in a room. Acta Acust. United Acust. 2004, 90, 1178–1184. [Google Scholar]
  16. Zhu, P.S.; Mo, F.S.; Kang, J. Influence of sound source characteristics in determining objective speech intelligibility metrics. Appl. Acoust. 2015, 89, 188–198. [Google Scholar] [CrossRef] [Scilit]
  17. Nicoletti, F.; Cristaudo, A.; Bruno, R.; Iorio, D.; Ferraro, V.; Kaliakatsos, D. Measurement and prediction of airborne sound insulation performance of different vertical partition walls in indoor environments: A case study. Buildings 2025, 15, 3753. [Google Scholar] [CrossRef] [Scilit]
  18. Qu, T.; Wang, B.; Min, H. Lightweight composite partitions with high sound insulation in hotel interior spaces: Design and application. Buildings 2022, 12, 2184. [Google Scholar] [CrossRef] [Scilit]
  19. Caniato, M.; Bettarello, F.; Schmid, C.; Fausti, P. The use of numerical models on service equipment noise prediction in heavyweight and lightweight timber buildings. Build. Acoust. 2018, 26, 35–55. [Google Scholar] [CrossRef] [Scilit]
  20. Ilgın, H.E.; Lietzén, J.; Karjalainen, M. An experimental comparison of airborne sound insulation between dovetail massive wooden board and cross-laminated timber elements. Buildings 2023, 13, 2809. [Google Scholar] [CrossRef] [Scilit]
  21. Năstase, G.; Doboși, I.S.; Brezeanu, A.I.; Taus, D.; Tăbăcaru, M.B.; Vuțoiu, B.G.; Rusu, D.; Bulmez, A.M.; Iordan, N.F. Experimental heat transfer, sound insulation and interior comfort parameters assessment on a box double-skin façade. Buildings 2022, 12, 730. [Google Scholar] [CrossRef] [Scilit]
  22. Lochner, J.P.A.; Burger, J.F. The influence of reflections on auditorium acoustics. J. Sound Vib. 1964, 1, 426–454. [Google Scholar] [CrossRef] [Scilit]
  23. Nábělek, A.K.; Robinette, L. Influence of the precedence effect on word identification by normally hearing and hearing-impaired subjects. J. Acoust. Soc. Am. 1978, 63, 187–194. [Google Scholar] [CrossRef] [Scilit] [PubMed]
  24. Nakajima, T.; Ando, Y. Effects of a single reflection with varied horizontal angle and time delay on speech intelligibility. J. Acoust. Soc. Am. 1991, 90, 3173–3179. [Google Scholar] [CrossRef] [Scilit] [PubMed]
  25. Arweiler, I.; Buchholz, J.M. The influence of spectral characteristics of early reflections on speech intelligibility. J. Acoust. Soc. Am. 2011, 130, 996–1005. [Google Scholar] [CrossRef] [Scilit] [PubMed]
  26. Warzybok, A.; Rennies, J.; Brand, T.; Doclo, S.; Kollmeier, B. Effects of spatial and temporal integration of a single early reflection on speech intelligibility. J. Acoust. Soc. Am. 2013, 133, 269–282. [Google Scholar] [CrossRef] [Scilit] [PubMed]
  27. Bradley, J.; Sato, H.; Picard, M. On the importance of early reflections for speech in rooms. J. Acoust. Soc. Am. 2003, 113, 3233–3244. [Google Scholar] [CrossRef] [Scilit]
  28. Puyana-Romero, V.; Díaz-Márquez, A.M.; Garzón, C.; Ciaburro, G. The domestic acoustic environment in online education—Part 2: Different interference perception of sound sources and while conducting academic tasks. Buildings 2025, 15, 93. [Google Scholar] [CrossRef] [Scilit]
  29. Møller, H.; Hammershoi, D.; Jensen, C.B. Head–related transfer functions of human subjects. J. Audio Eng. Soc. 1995, 43, 300–321. [Google Scholar]
  30. Ziegelwanger, H.; Kreuzer, W.; Majdak, P. MESH2HRTF: An open–source software package for the numerical calculation of head–related transfer functions. In Proceedings of the 22nd International Congress on Sound and Vibration, Florence, Italy, 12–16 July 2015. [Google Scholar]
  31. Audio Engineering Society. AES Standard for File Exchange-Spatial Acoustic Data File Format; Audio Engineering Society: New York, NY, USA, 2015. [Google Scholar]
  32. Liang, L.D.; Yu, G.Z. The combined effect of source directivity and binaural listening on near-field binaural speech transmission index evaluation. Appl. Acoust. 2023, 203, 109198. [Google Scholar] [CrossRef] [Scilit]
  33. ISO 3382-2:2008; Acoustics—Measurement of Room Acoustic Parameters—Part 2: Reverberation Time in Ordinary Rooms. International Organization for Standardization: Geneva, Switzerland, 2008.
  34. Astolfi, A.; Filippi, M. Good acoustical quality in restaurants: A compromise between speech intelligibility and privacy. J. Acoust. Soc. Am. 2003, 89, 4401. [Google Scholar]
  35. Liu, J.P. Architectural Physics, 4th ed.; Xi’an University of Architecture and Technology Press: Xi’an, China, 2021; pp. 540–544. [Google Scholar]
  36. Wang, Y.W.; Yu, G.Z. Typicality analysis on statistical shape model-based average head and its head-related transfer functions. J. Acoust. Soc. Am. 2024, 156, 3798. [Google Scholar] [CrossRef] [Scilit]
  37. Rife, D.D.; Vanderkooy, J. Transfer–function measurement with maximum–length sequences. J. Audio Eng. Soc. 1989, 37, 419–444. [Google Scholar]
  38. van Wijngaarden, S.J.; Drullman, R. Binaural intelligibility prediction based on the speech transmission index. J. Acoust. Soc. Am. 2008, 123, 4514–4523. [Google Scholar] [CrossRef] [Scilit]
  39. IEC 60268-16:2020; Sound System Equipment. Part 16: Objective Rating of Speech Intelligibility by Speech Transmission Index. International Electrotechnical Commission: Geneva, Switzerland, 2020.
  40. Schroeder, M.R. Modulation transfer functions: Definition and measurement. Acta Acust. United Acust. 1981, 49, 179–182. [Google Scholar]
  41. Liang, L.D.; Yu, L.; Zhao, T.; Meng, Q.; Yu, G. Speech intelligibility for various head orientations of a listener in an automobile using the speech transmission index. J. Acoust. Soc. Am. 2021, 149, 2686–2897. [Google Scholar] [CrossRef] [Scilit] [PubMed]
  42. Festen, J.M.; Plomp, R. Effects of fluctuating noise and interfering speech on the speech-reception threshold for impaired and normal hearing. J. Acoust. Soc. Am. 1990, 88, 1725–1736. [Google Scholar] [CrossRef] [Scilit] [PubMed]
  43. GB/T 7347-1987; The Standard Spectrum of Chinese Speech. Standardization Administration of China: Beijing, China, 1987.
  44. Samardzic, N.; Moore, B.C.J. Binaural speech-to-noise loudness ratio at the speech reception threshold in vehicles. Noise Control Eng. J. 2021, 69, 173–179. [Google Scholar] [CrossRef] [Scilit]
  45. Hu, H.; Xi, X.; Wong, L.L.; Hochmuth, S.; Warzybok, A.; Kollmeier, B. Construction and evaluation of the Mandarin Chinese matrix (CMNmatrix) sentence test for the assessment of speech recognition in noise. Int. J. Audiol. 2018, 57, 838–850. [Google Scholar] [CrossRef] [Scilit] [PubMed]
  46. Xie, B.; Shi, B.; Xiang, N. Audio signal decorrelation based on reciprocal-maximal length sequence filters and its applications to spatial sound. In AES Convention 133; Audio Engineering Society: New York, NY, USA, 2012. [Google Scholar]
  47. Brand, T.; Kollmeier, B. Efficient adaptive procedures for threshold and concurrent slope estimates for psychophysics and speech intelligibility tests. J. Acoust. Soc. Am. 2002, 111, 2801–2810. [Google Scholar] [CrossRef] [Scilit]
  48. Yu, G.Z.; Wu, R.X.; Liu, Y.; Xie, B. Near-field head-related transfer-function measurement and database of human subjects. J. Acoust. Soc. Am. 2018, 143, EL194–EL198. [Google Scholar] [CrossRef] [Scilit]
  49. Bradley, J.S.; Reich, R.; Norcross, S.G. A just noticeable difference in C50 for speech. Appl. Acoust. 1999, 58, 99–108. [Google Scholar]
  50. Peng, J.X. Relationship between chinese speech intelligibility and speech transmission index using diotic listening. Speech Commun. 2007, 49, 933–936. [Google Scholar] [CrossRef] [Scilit]
  51. Peng, J.X.; Bei, C.S.; Sun, H.T. Relationship between chinese speech intelligibility and speech transmission index in rooms based on auralization. Speech Commun. 2011, 53, 986–990. [Google Scholar] [CrossRef] [Scilit]
  52. Lokki, T.; Pätynen, J. Lateral reflections are favorable in concert halls due to binaural loudness. J. Acoust. Soc. Am. 2011, 130, EL134–EL135. [Google Scholar] [CrossRef] [Scilit]
  53. Padilla-Ortíz, A.L.; Orduña-Bustamante, F. Binaural speech intelligibility as a function of speaker angle and interaural cross-correlation of disturbing noise and reverberation. J. Acoust. Soc. Am. 2020, 128, 2319. [Google Scholar] [CrossRef] [Scilit]
  54. Padilla-Ortíz, A.L.; Orduña-Bustamante, F. Improving speech intelligibility for binaural voice transmission under disturbing noise and reverberation using virtual speaker lateralization. J. Appl. Res. Technol. 2015, 13, 351–358. [Google Scholar] [CrossRef] [Scilit]
  55. Steffens, H.; van de Par, S.; Ewert, S.D. The role of early and late reflections on perception of source orientation. J. Acoust. Soc. Am. 2021, 149, 2255–2269. [Google Scholar] [CrossRef] [Scilit] [PubMed]
  56. Stewart, K.; Cabrera, D. Effect of acoustic environment on the sensitivity of speech transmission index to source directivity. Archit. Sci. Rev. 2009, 52, 71–89. [Google Scholar] [CrossRef] [Scilit]
Figure 1. Round-table conversation scenarios with varying listener head orientations: (a) Listener facing the table; (b) Listener facing the speaker.
Buildings 16 01258 g001
Figure 2. Photograph of the restaurant’s private dining room for field measurement.
Buildings 16 01258 g002
Figure 3. Conversational scenarios at a round table in an actual room: (a) Listeners facing the table; (b) Listeners facing the speaker.
Buildings 16 01258 g003
Figure 4. Better-ear STI results for listeners in a free field with an omnidirectional source: (a) Listeners facing the table; (b) Listeners facing the speaker.
Buildings 16 01258 g004
Figure 5. Variation in the STI with distance between the source and listener in a free field when an omnidirectional point source is used.
Buildings 16 01258 g005
Figure 6. STI at different listener positions after speaker orientation correction: (a) Listener facing the table; (b) Listener facing the speaker.
Buildings 16 01258 g006
Figure 7. Measured SNRs at both ears of the listener in an actual room: (a) Listener facing the table; (b) Listener facing the speaker.
Buildings 16 01258 g007
Figure 8. Better-ear STI measured in an actual room: (a) Listener facing the table; (b) Listener facing the speaker.
Buildings 16 01258 g008
Figure 9. Mean SRT values with 95% confidence intervals in the actual room: (a) Listener facing the table; (b) Listener facing the speaker.
Buildings 16 01258 g009
Table 1. Relationship between the central angle of the listener and the speaker’s azimuth relative to the listener, across different table diameters.
Table
Diameter (m)
Central
Angle (°)
Listener Facing the TableListener Facing the Speaker
Azimuth (°) Distance (m) Azimuth (°) Distance (m)
D = 1 m 30∼18075∼00.26∼1.0000.26∼1.00
180∼3300∼−75 (285)1.00∼0.2601.00∼0.26
D = 2 m 30∼18075∼00.52∼2.0000.52∼2.00
180∼3300∼−75 (285)2.00∼0.5202.00∼0.52
D = 3 m 30∼18075∼00.78∼3.0000.78∼3.00
180∼3300∼−75 (285)3.00∼0.7803.00∼0.78
D = 4 m 30∼18075∼01.04∼4.0001.04∼4.00
180∼3300∼−75 (285)4.00∼1.0404.00∼1.04
Table 4. Statistical results of STI for different listener locations in both the simulated free field and the actual room.
MethodListener Head OrientationSpeaker Orientation (°)MaxMinRangeSD
Free-field
Simulation
Facing
the table
−450.740.200.540.17
00.630.250.380.13
450.750.200.550.17
Facing
the speaker
−450.580.140.440.14
00.470.230.220.08
450.580.140.440.14
Actual
Measurement
Facing
the table
−450.750.580.170.06
00.750.590.160.05
450.780.550.230.07
Facing
the speaker
−450.740.570.170.05
00.700.580.120.04
450.730.570.160.04
Table 5. Variations in STI due to alterations in speaker orientation in both the free field and the actual room. Values exceeding 1 JND (±0.03) are highlighted in bold. The change in STI for a speaker orientation from −45° to 45° is calculated as the combined absolute value of changes in speaker orientation from 0° to −45° and from 0° to 45°, respectively.
MethodListener Orient.Orient. Change30°60°90°120°150°180°210°240°270°300°330°
Free-
field
Simu-
lation
Facing
the table
0 to −450.110.090.050.02−0.02−0.05−0.09−0.11−0.13−0.14−0.14
0 to 45−0.14−0.14−0.13−0.11−0.09−0.05−0.020.020.050.090.11
−45 to 450.250.230.180.130.110.100.110.130.180.230.25
Facing
the speaker
0 to −450.110.090.050.02−0.02−0.05−0.09−0.11−0.13−0.14−0.14
0 to 45−0.14−0.14−0.13−0.11−0.09−0.05−0.020.020.050.090.11
−45 to 450.250.230.180.130.110.100.110.130.180.230.25
Actual
Measu-
rement
Facing
the table
0 to −450.030.050.040.010.00−0.02−0.02−0.05−0.05−0.06−0.05
0 to 45−0.06−0.06−0.06−0.06−0.04−0.010.000.010.040.030.02
−45 to 450.080.110.100.070.040.030.020.060.090.090.07
Facing
the speaker
0 to −450.060.040.010.020.010.00−0.01−0.03−0.01−0.03−0.06
0 to 45−0.06−0.05−0.02−0.03−0.03−0.020.000.010.040.040.03
−45 to 450.120.090.030.050.040.020.010.040.050.070.09
Table 6. Variations in STI due to alterations in listener head orientation in both the free field and actual room. Differences exceeding 1 JND (±0.03) are highlighted in bold.
MethodSpeaker Orientation (°)30°60°90°120°150°180°210°240°270°300°330°
Free-field
Simulation
−450.160.130.110.090.050.010.060.100.120.130.17
00.160.130.110.090.050.010.060.100.120.130.17
450.160.130.110.090.050.010.060.100.120.130.17
Actual
Measurement
−450.010.030.030.050.000.010.000.010.010.030.08
00.040.020.000.050.010.010.010.030.050.070.06
450.040.010.040.020.000.010.020.030.050.060.06
Table 7. Results from a three-factor repeated measures ANOVA evaluating the influences of listener position (central angle), speaker orientation, listener head orientation, and their interactions on SRT. Significance is denoted by *, **, and *** for p-values of 0.05, 0.01, and 0.001, respectively.
FactorSSDfMSFpError
SS MS
Listener Position (LP)53.55413.3914.73<0.001 ***32.730.91
Speaker Orientation (SO)5.0022.504.670.023 *9.620.54
Listener Head Orientation (LHO)9.4419.4411.600.008 **7.320.81
LP × SO57.2687.1622.81<0.001 ***22.60.31
LP × LHO34.1148.5329.97<0.001 **10.240.29
SO × LHO0.1020.050.220.8044.130.23
LP × SO × LHO5.9580.743.300.003 **16.240.23
Disclaimer/Publisher’s Note: The statements, opinions and data contained in all publications are solely those of the individual author(s) and contributor(s) and not of MDPI and/or the editor(s). MDPI and/or the editor(s) disclaim responsibility for any injury to people or property resulting from any ideas, methods, instructions or products referred to in the content.