Article

Failure Mechanism Analysis of Reactive Powder Concrete Under Diverse Loading Conditions Based on Acoustic Emission and IVY-Optimized Machine Learning

1
School of Civil Engineering, Chongqing Jiaotong University, Chongqing 400074, China
2
Poly Changda Engineering Co., Ltd., Guangzhou 510620, China
3
Institute of Future Civil Engineering Science and Technology, Chongqing Jiaotong University, Chongqing 400074, China
*
Author to whom correspondence should be addressed.
Buildings 2026, 16(5), 932; https://doi.org/10.3390/buildings16050932
Submission received: 22 December 2025 / Revised: 31 January 2026 / Accepted: 11 February 2026 / Published: 26 February 2026

Abstract

Reactive Powder Concrete (RPC) exhibits mechanical failure behaviors distinct from those of ordinary concrete. To investigate the mechanical properties and damage evolution characteristics of RPC during failure, uniaxial compression, axial compression, splitting tensile, and four-point bending tests were performed on RPC specimens integrated with Acoustic Emission (AE) technology. Subsequently, damage stage identification models were established using Random Forest (RF) and Extreme Gradient Boosting (XGBoost) algorithms coupled with AE parameters—including ringing count (RC), energy, peak frequency, RA, and AF—and were optimized via the Ivy algorithm (IVY). Results indicate that RPC demonstrated the highest ductility and resistance to failure under four-point bending, compared to its weakest performance under axial compression. By integrating the evolution of AE ringing counts and energy, the damage process was divided into three stages: compaction-elastic, crack propagation, and failure. Under axial compression, AE activity peaked before reaching the peak stress, whereas splitting tension exhibited concentrated signal bursts during crack propagation, and bending failure was characterized by a sustained signal escalation. The proportion of high-frequency signals was highest in cubic compression specimens, while splitting tension was dominated by low-frequency signals. The RA-AF distribution revealed that steel fibers inhibited through-thickness tensile cracks, and a decrease in the b-value served as a precursor to unstable failure. Notably, the IVY-optimized XGBoost model achieved the best performance, with an accuracy improvement of 26%. Under compressive stress, AF was identified as the primary parameter, whereas peak frequency became critical under tensile-bending conditions, reflecting the distinct damage mechanisms associated with different loading modes. These findings provide a scientific basis for damage assessment and early warning strategies in RPC structures.

1. Introduction

Reactive Powder Concrete (RPC) constitutes a cement-based composite characterized by ultra-high strength, high toughness, and superior durability. It is fabricated by eliminating coarse aggregates and incorporating ultrafine mineral admixtures and steel fibers. Consequently, RPC demonstrates significant potential for application in underground load-bearing structures, key components of long-span bridges, and explosion-proof engineering [1,2,3,4,5,6,7]. However, the damage characteristics of RPC under various loading conditions (e.g., compression, tension, and bending) differ significantly from those of ordinary concrete. Its catastrophic failure exhibits pronounced size effects and uncertainty. Currently, existing studies are largely confined to single mechanical properties of RPC. Therefore, an in-depth investigation into the damage evolution mechanisms of RPC under different loading conditions provides essential theoretical support for damage early warning and safety assessment of RPC structures in practical engineering.
The performance of RPC depends on material components, mix proportions, and curing processes. The use of high-quality fine aggregates instead of coarse aggregates enhances the homogeneity of the matrix structure. The incorporation of reactive powders and steel fibers not only forms a dense cementitious system but also improves ductility through fiber bridging effects. Furthermore, heat or steam curing effectively activates the hydration reaction of cementitious materials, optimizes the microstructure, and further enhances strength [8]. Consequently, numerous scholars have conducted comprehensive studies on the physical and mechanical properties of RPC based on its fabrication principles. Bonneau et al. [9] systematically investigated the mechanical response characteristics of RPC under static loads, revealing its advantages in compressive strength and ultimate strain. Cheyrezy et al. [10] verified the durability of RPC in harsh environments through permeability tests. Regarding dynamic mechanical behavior, Tai et al. [11] utilized a Split Hopkinson Pressure Bar (SHPB) to reveal the strain-rate sensitivity of RPC, providing a theoretical basis for blast-resistant design. In terms of structural modification, Heidari et al. [12] improved the microstructural characteristics of RPC by partially substituting silica sand. Chan et al. [13] quantified the influence of reactive powder on bond performance through fiber pull-out tests, finding significant enhancement in fiber-matrix interface properties. After introducing basalt fibers, Abed et al. [14] observed a transition in the RPC damage mode from brittle to ductile failure. Addressing large-scale component applications, Liu et al. [15] developed RPC containing coarse aggregates, which exhibited excellent structural performance in precast slab bending tests, thereby expanding its engineering adaptability in large infrastructure. Yazıcı et al. [16] systematically studied the effects of different curing regimes, providing key process parameters for industrial production.
Most of the aforementioned studies focus on the macroscopic mechanical properties of RPC, but material damage and failure are often accompanied by complex energy release and sudden catastrophic mechanisms [17,18]. However, traditional damage assessment methods based on mechanical parameters have significant limitations regarding “real-time,” “non-destructive,” and “refined” monitoring. Acoustic Emission (AE) technology, as a highly sensitive non-destructive monitoring method, relies on the dynamic response to microscopic defect activities within the material. It enables dynamic tracking of the entire damage process by capturing elastic wave signals [19,20,21,22,23,24]. This technology has established a mature application system in damage monitoring for coal, rock masses, wood materials, and steel structures [25,26,27,28,29,30,31,32], and has extended to cement-based structures’ health monitoring in civil engineering [33,34,35,36,37]. Calabrese et al. [38] successfully identified the crack initiation, propagation, and critical failure stages of prestressed concrete beams using AE technology. Ohtsu et al. [39] proposed an innovative AE parameter system, including load ratio and calm ratio, constructing a new paradigm for structural damage determination. Sikdar et al. [40] further verified the reliability of AE in source localization and developed a real-time health monitoring framework for advanced sandwich composite structures. Siracusano et al. [41] constructed a concrete damage assessment system based on AE data, confirming the engineering value of AE technology in monitoring infrastructure service status. Regarding RPC and fiber-reinforced concrete systems, Ali et al. [42] verified the effectiveness of AE in damage determination through bending tests of carbon fiber-reinforced composites combined with Scanning Electron Microscopy (SEM). Sagar et al. [43] analyzed AE data using the b-value method based on the Gutenberg-Richter law, confirming its effectiveness in characterizing concrete failure scales. Liu et al. [44] systematically investigated the fracture process of RPC specimens and crack propagation laws in RPC beams, revealing the correlations between damage modes and parameters such as ringing count, energy characteristics, amplitude distribution, and frequency. However, current AE technology typically analyzes individual parameters in isolation, while comprehensive analysis of all parameters remains limited. Advanced algorithms and machine learning (ML) techniques allow for more effective processing of complex AE data, enhancing both processing speed and accuracy [45]. Guan et al. [46] proposed a fault diagnosis model using Wavelet Mutation Particle Swarm Optimization Least Squares Support Vector Machine (WMPSO-LSSVM), which improved fault classification performance. Sun et al. [47] extracted and classified key AE signals of granite, achieving the identification of failure precursors through Decision Trees and Convolutional Neural Networks.
In summary, existing RPC research focuses predominantly on mechanical response characterization under single loading modes; however, RPC structures in practical engineering often face complex loading environments. Furthermore, traditional damage assessment methods based on mechanical parameters struggle to achieve dynamic capture and precise characterization of internal damage evolution. Based on these considerations, this study employs AE monitoring to investigate mechanical behavior and AE signal evolution in RPC specimens under uniaxial compression, axial compression, splitting tension, and four-point bending. A damage stage identification model is established by integrating the Ivy (IVY) algorithm with random forest (RF) and extreme gradient boosting (XGBoost) techniques, enabling classification and prediction of RPC damage under diverse loading conditions. These findings aim to provide scientific foundations for damage assessment and failure prediction in RPC structures within real-world engineering applications.

2. Materials and Methods

2.1. Raw Materials

2.1.1. Binding Material

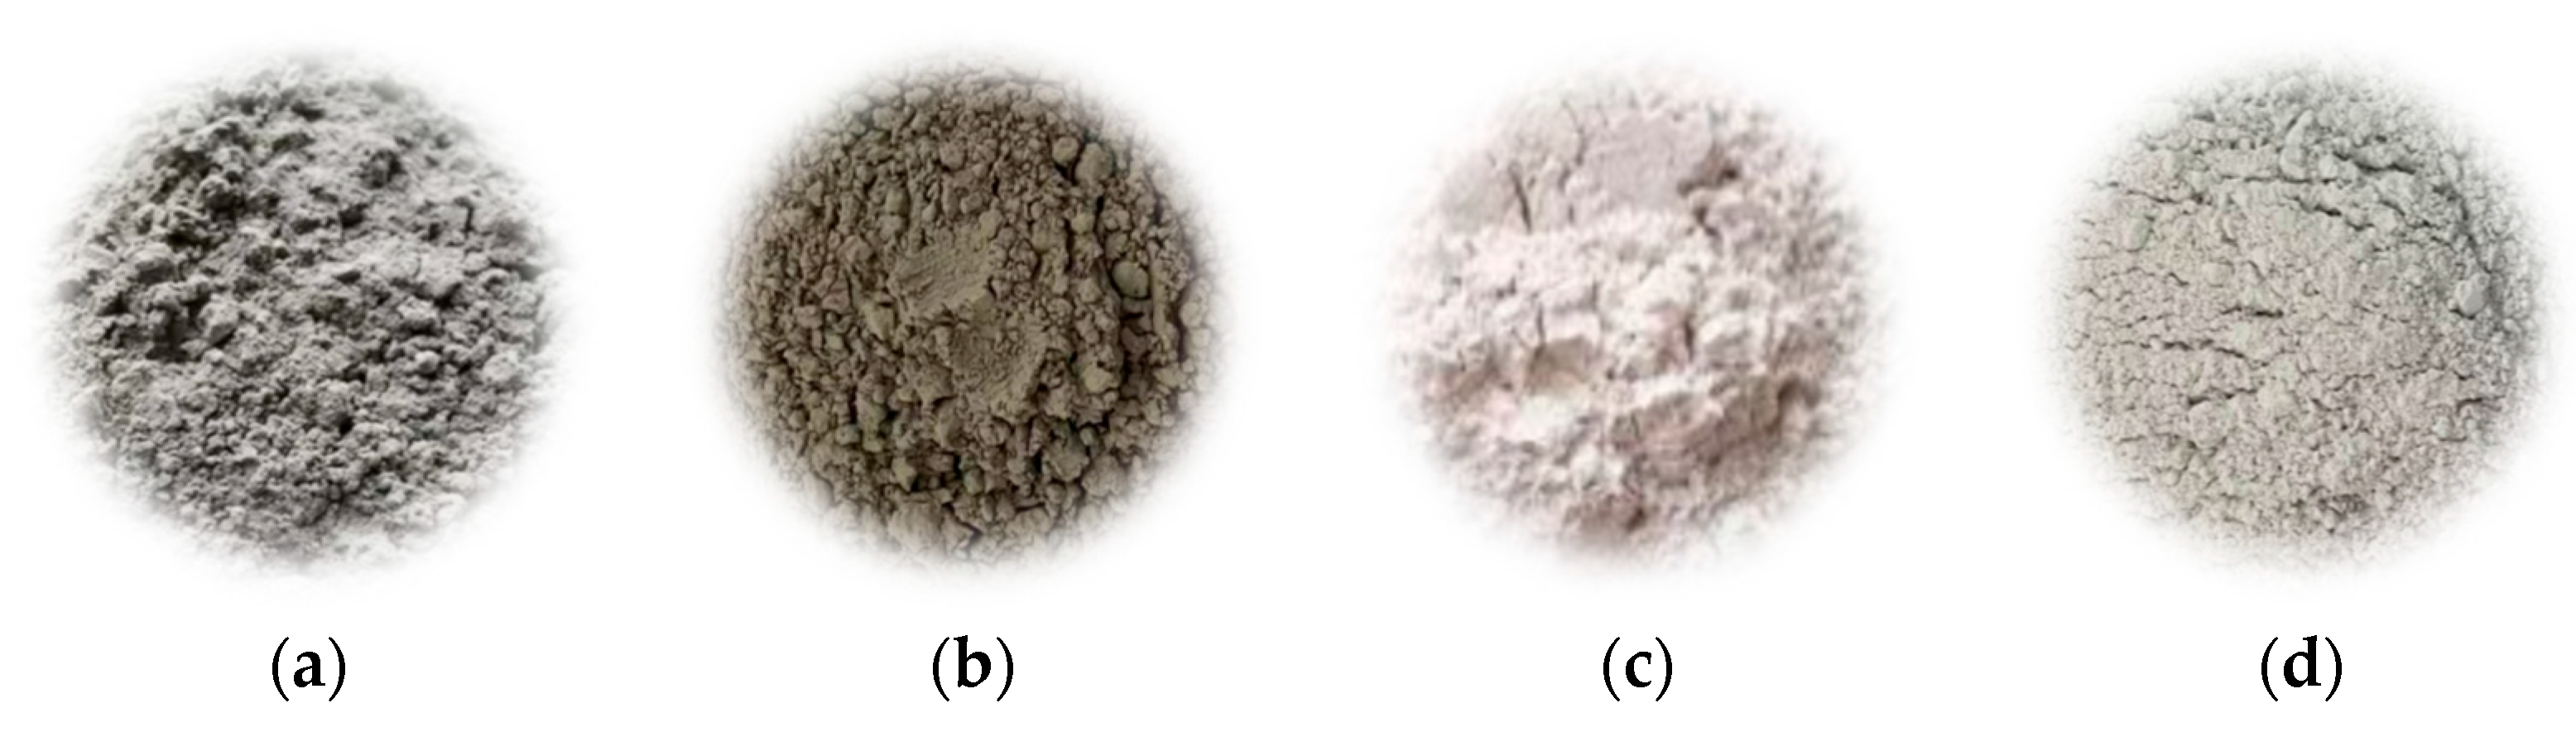
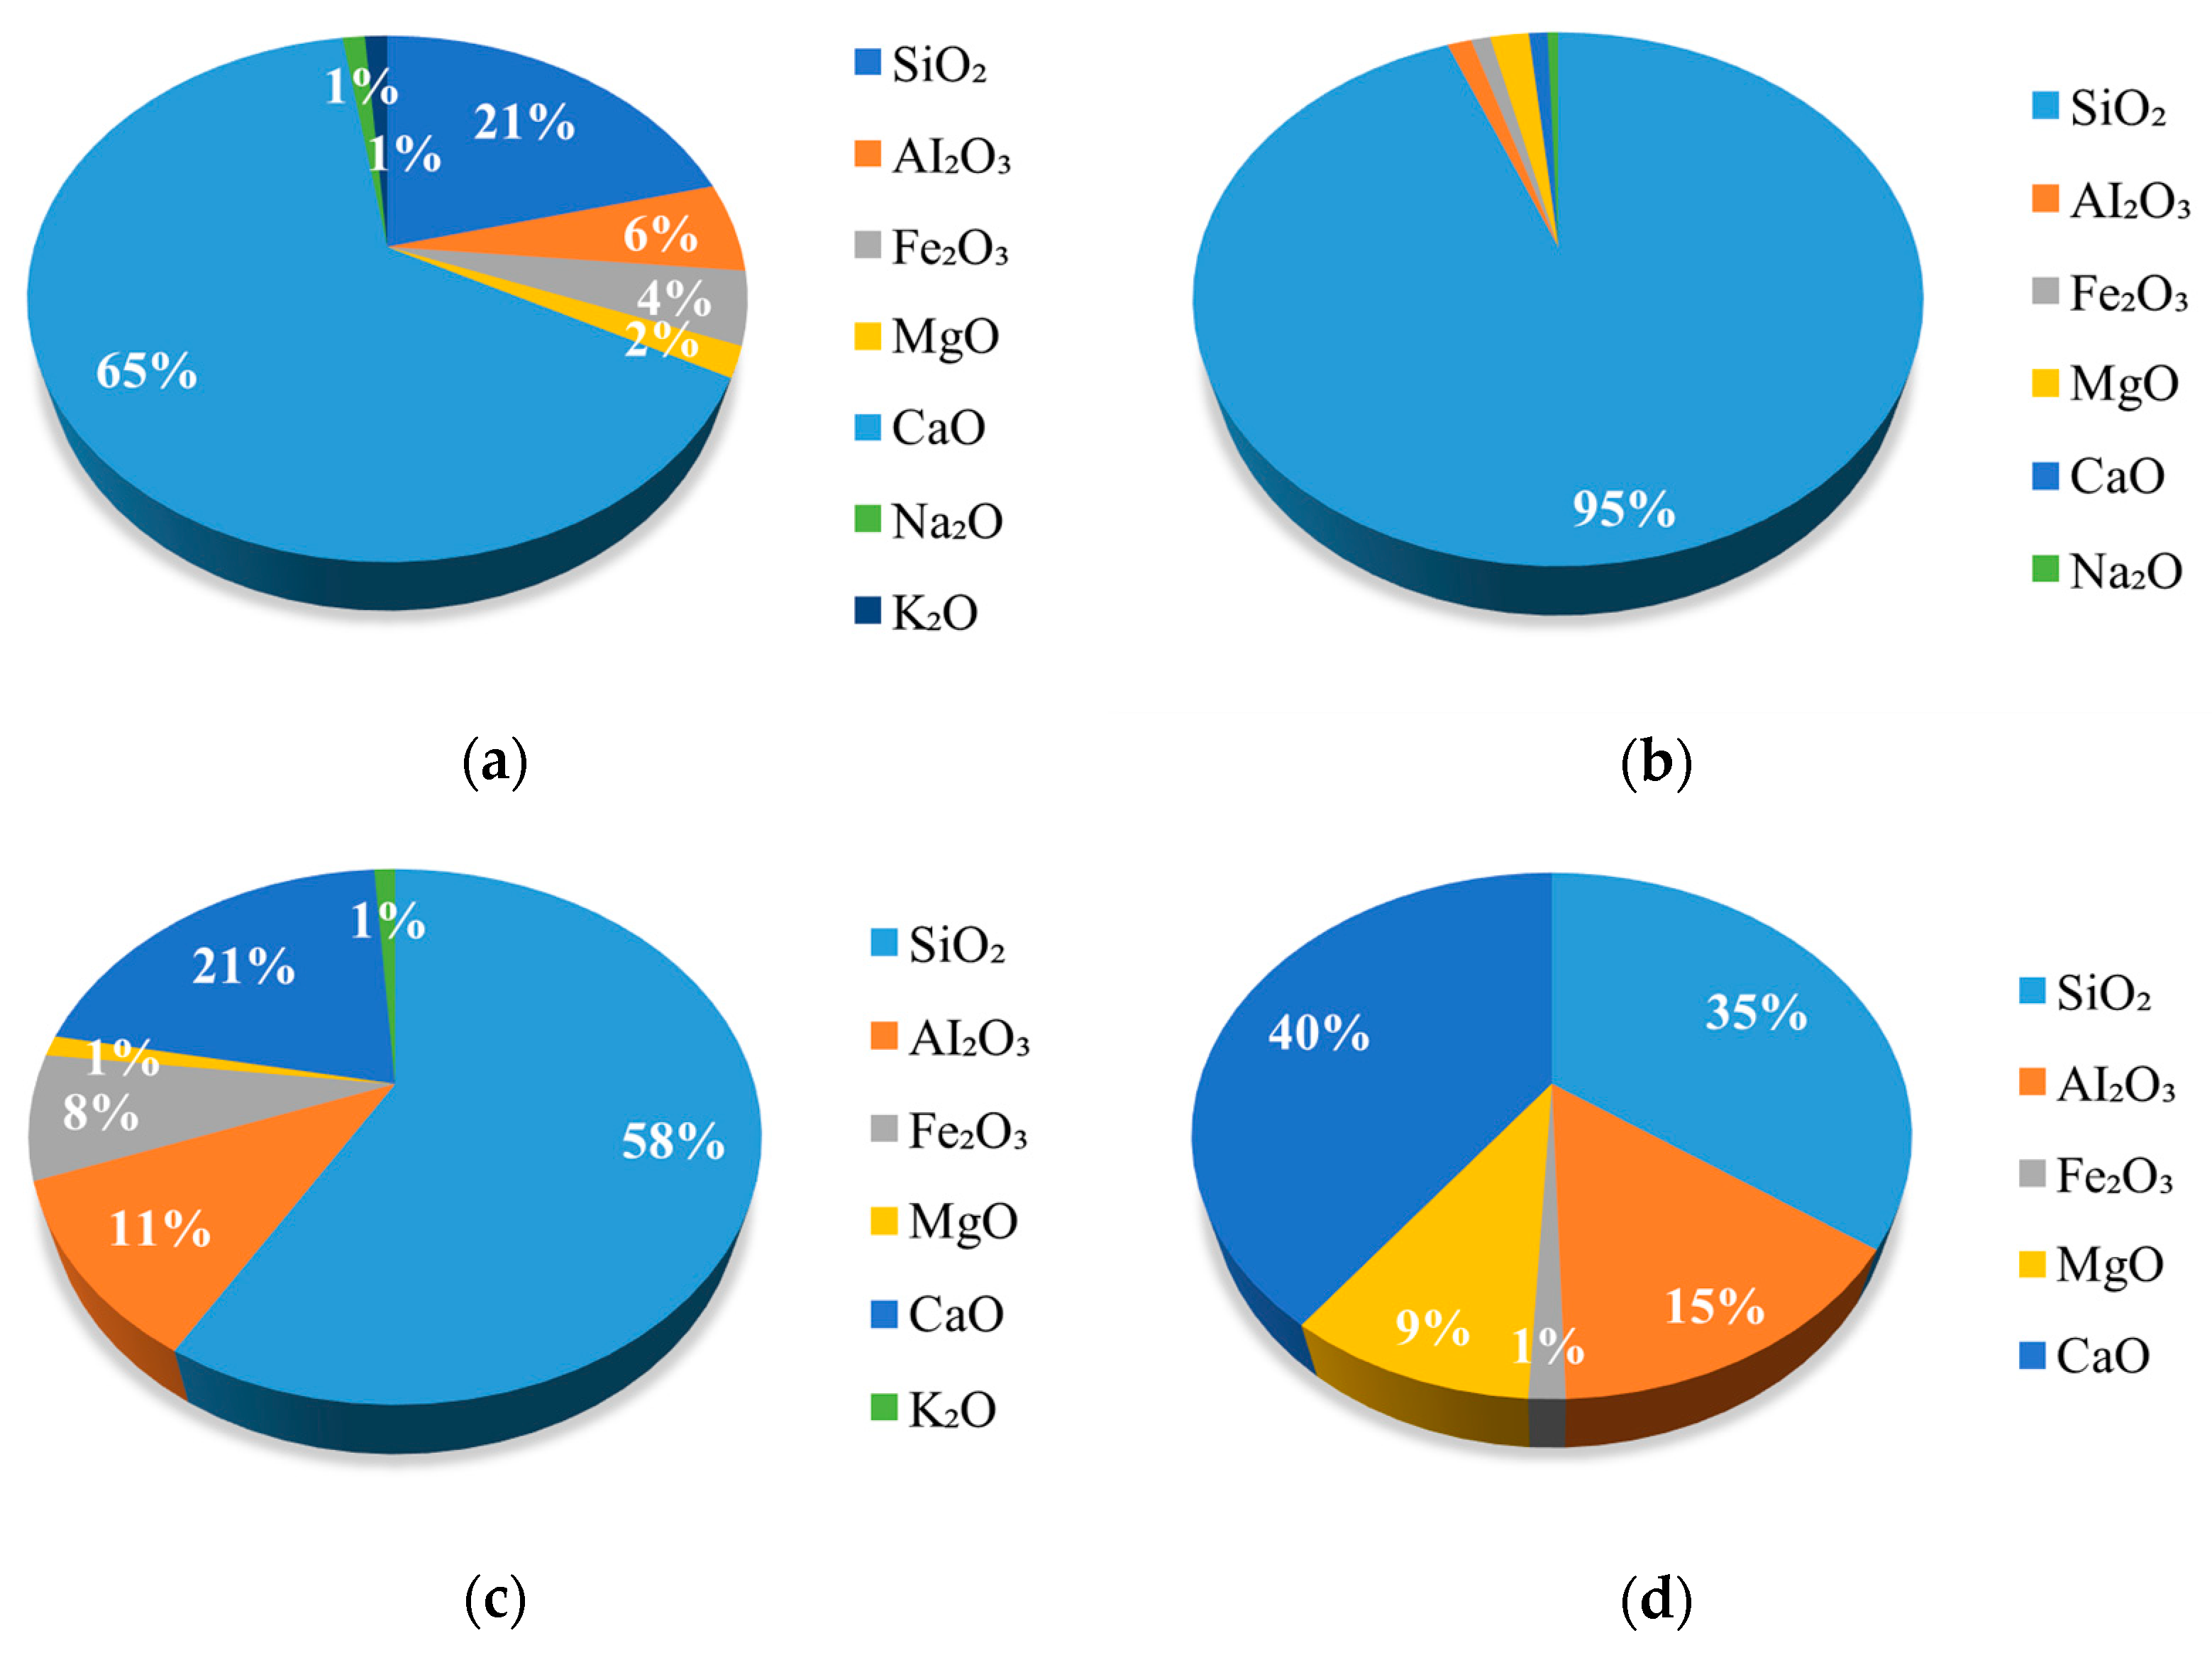
P·O 42.5 Portland cement was employed as the primary binding material for the RPC specimens; its physical and mechanical properties are detailed in Table 1. To construct a dense cementitious system, silica fume, fly ash, and slag powder were introduced as supplementary cementitious materials. High-activity silica fume was used to effectively fill pores and optimize the matrix microstructure. Grade I ultrafine fly ash was selected to improve the workability of the paste while reducing the water demand of the system. S105 slag powder was added to enhance the later-stage strength of the system through secondary hydration reactions. The physical morphology of each component is shown in Figure 1, and the chemical composition results are presented in Figure 2.

2.1.2. Fine Aggregate

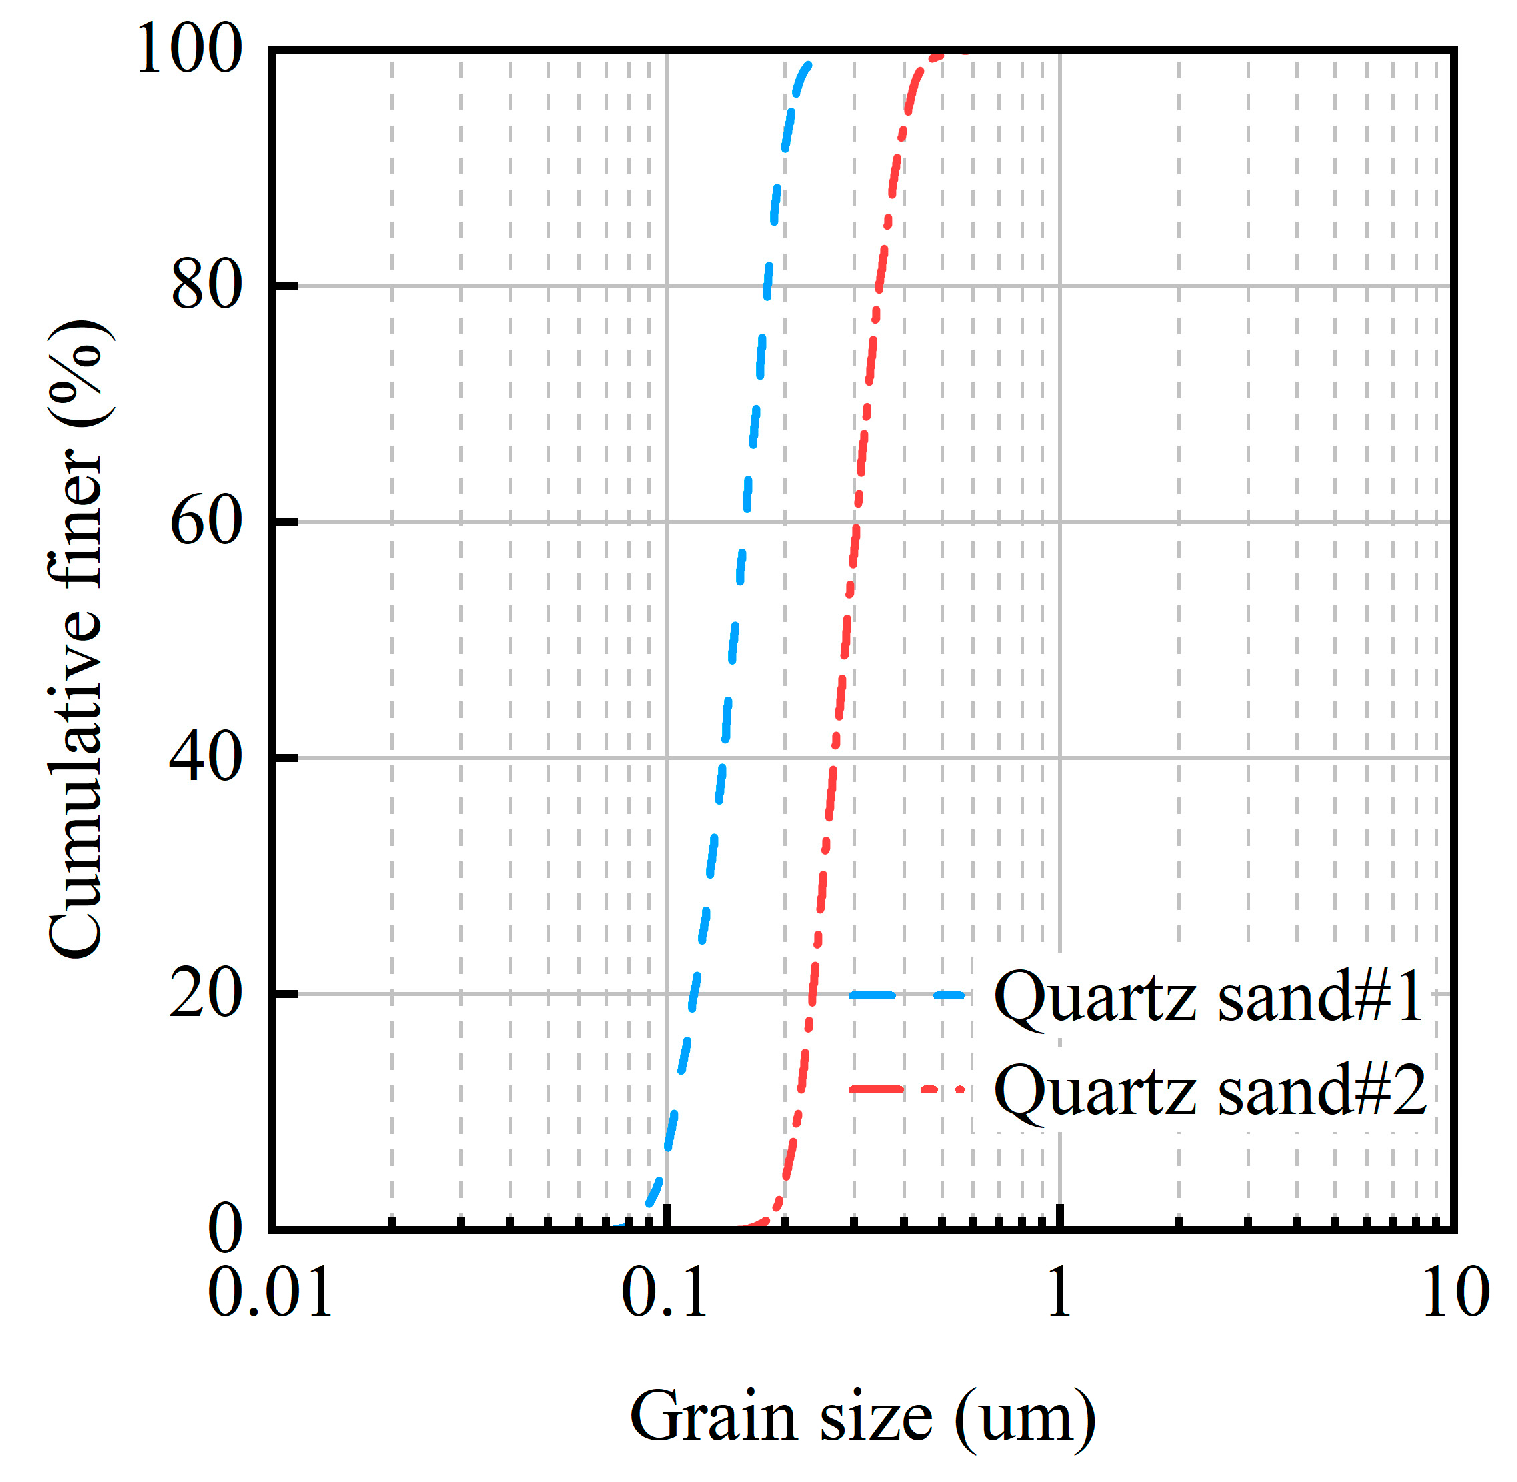
Quartz sands with particle sizes of 0.106–0.212 mm and 0.212–0.425 mm are mixed in equal volume proportions to serve as fine aggregates. This gradation effectively suppresses volumetric shrinkage during RPC hardening, reduces microcrack initiation propensity, and enhances long-term stability. The particle size distribution of quartz sand is shown in Figure 3, and its physical properties are summarized in Table 2.

2.1.3. Steel Fiber

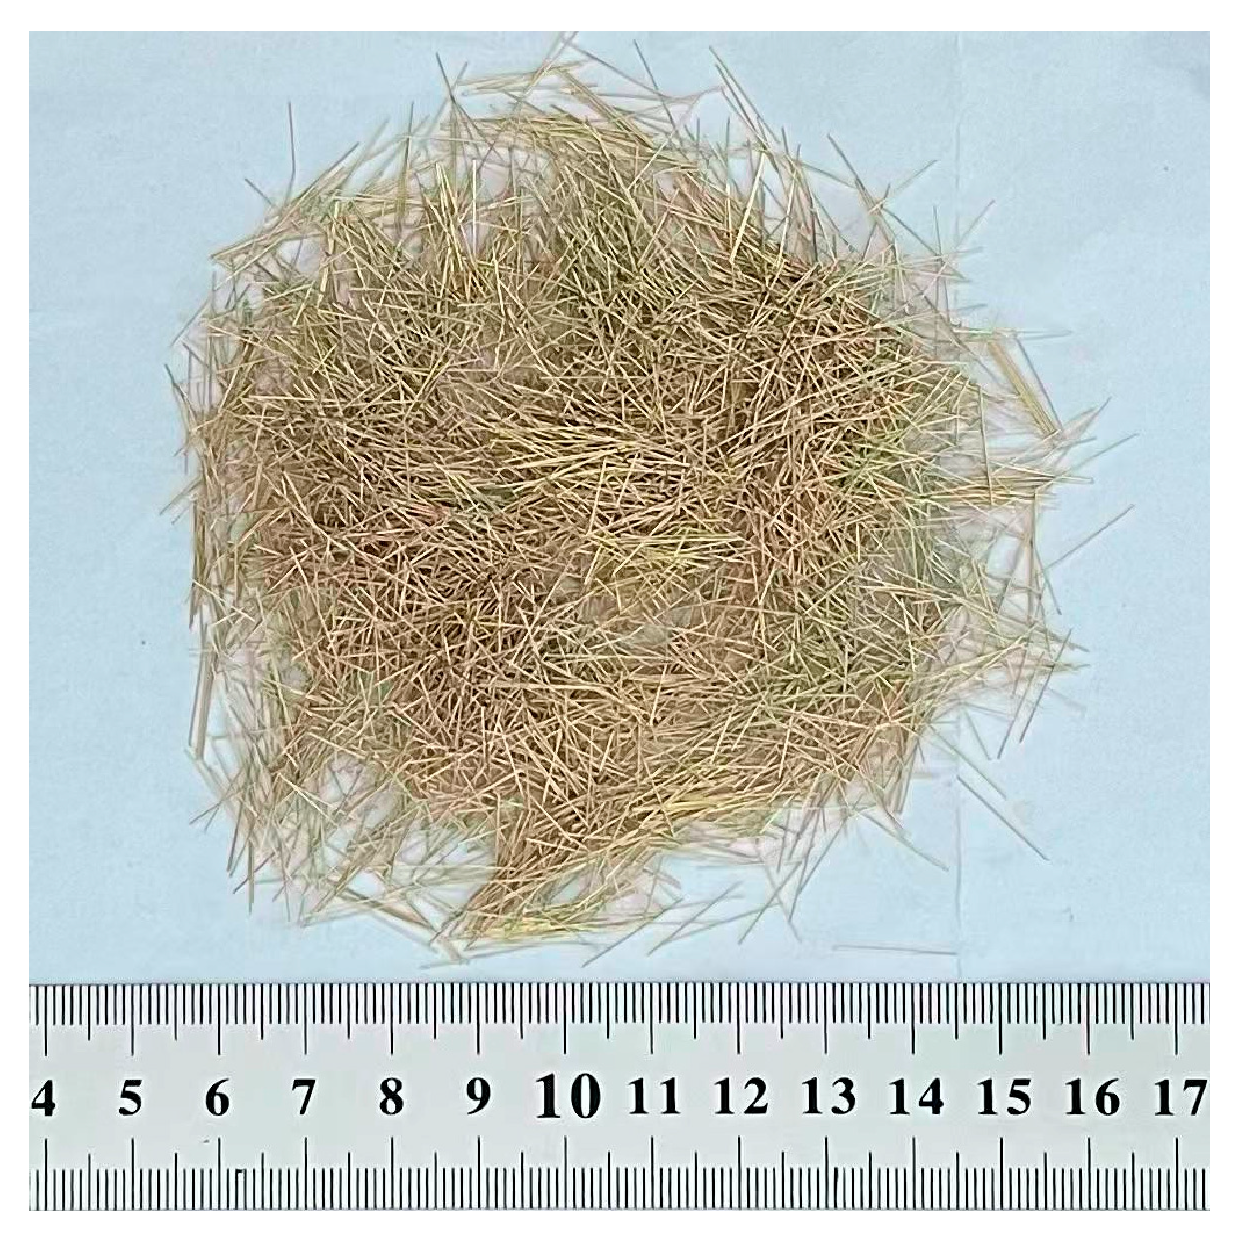
Copper-coated steel fibers were selected as the reinforcement material. Their relatively short and ultra-fine characteristics facilitated uniform dispersion within the RPC specimens. Furthermore, the copper coating formed on the steel fiber surface via electroplating established a physical barrier, significantly enhancing the corrosion resistance and thermal stability of the fiber-matrix interface. This coating improved the bond strength with the concrete, thereby potentially increasing the durability and crack resistance of the material. The morphology and key physical and mechanical parameters of the steel fibers are shown in Figure 4 and Table 3, respectively.

2.1.4. Water and Admixture

Ordinary tap water was used as the mixing water. A high-efficiency water reducer (superplasticizer) with a water-reduction rate of up to 45% was utilized to effectively decrease the mixing water consumption. This further reduced the water-binder ratio and internal porosity, thereby enhancing the mechanical strength of the RPC specimens.

2.2. Specimen Preparation

The RPC specimens were designed to balance high strength, high toughness, and good stability. Based on the GB/T 31387-2015 standard [48] and existing research findings [49,50], the mix proportion per cubic meter was determined, as shown in Table 4. The preparation process adopted a multi-stage feeding and mixing strategy, detailed as follows: (1) Pre-mixing stage: Quartz sand and steel fibers were pre-mixed by volume and stirred at low speed (5 min) to achieve preliminary fiber dispersion. (2) Dry mixing stage: Cement, silica fume, slag powder, and fly ash were added sequentially and dry-mixed (5 min) to ensure uniform dispersion of the powder materials. (3) Wet mixing stage: The pre-mixed superplasticizer solution was added to the system in fractions, followed by high-speed stirring (15 min) to allow for the full hydration of the paste and coating of the aggregates. (4) Molding stage: A high-frequency vibration table was used (15 s) to eliminate air bubbles and prevent fiber settlement. Subsequently, the specimens were left to set at room temperature for 12 h before proceeding to the curing process.
High-temperature and high-humidity environments promote the hydration reaction of RPC, strengthening its early strength and durability. The solidified specimens were placed in an environmental chamber for high-temperature curing. The specific heating regime was as follows: (1) a segmented heating program (10–12 °C/h) was adopted to smoothly raise the system temperature to a threshold of 90 °C, effectively avoiding micro-crack initiation caused by excessive temperature gradients; (2) continuous curing was maintained at a constant temperature of 90 °C for 72 h, ensuring consistent internal and external temperatures to avoid significant temperature differences and reduce damage from local thermal shock; (3) upon completion of curing, the temperature was lowered to 15 °C at a cooling rate of 10–12 °C/h.

2.3. Mechanical Property Test

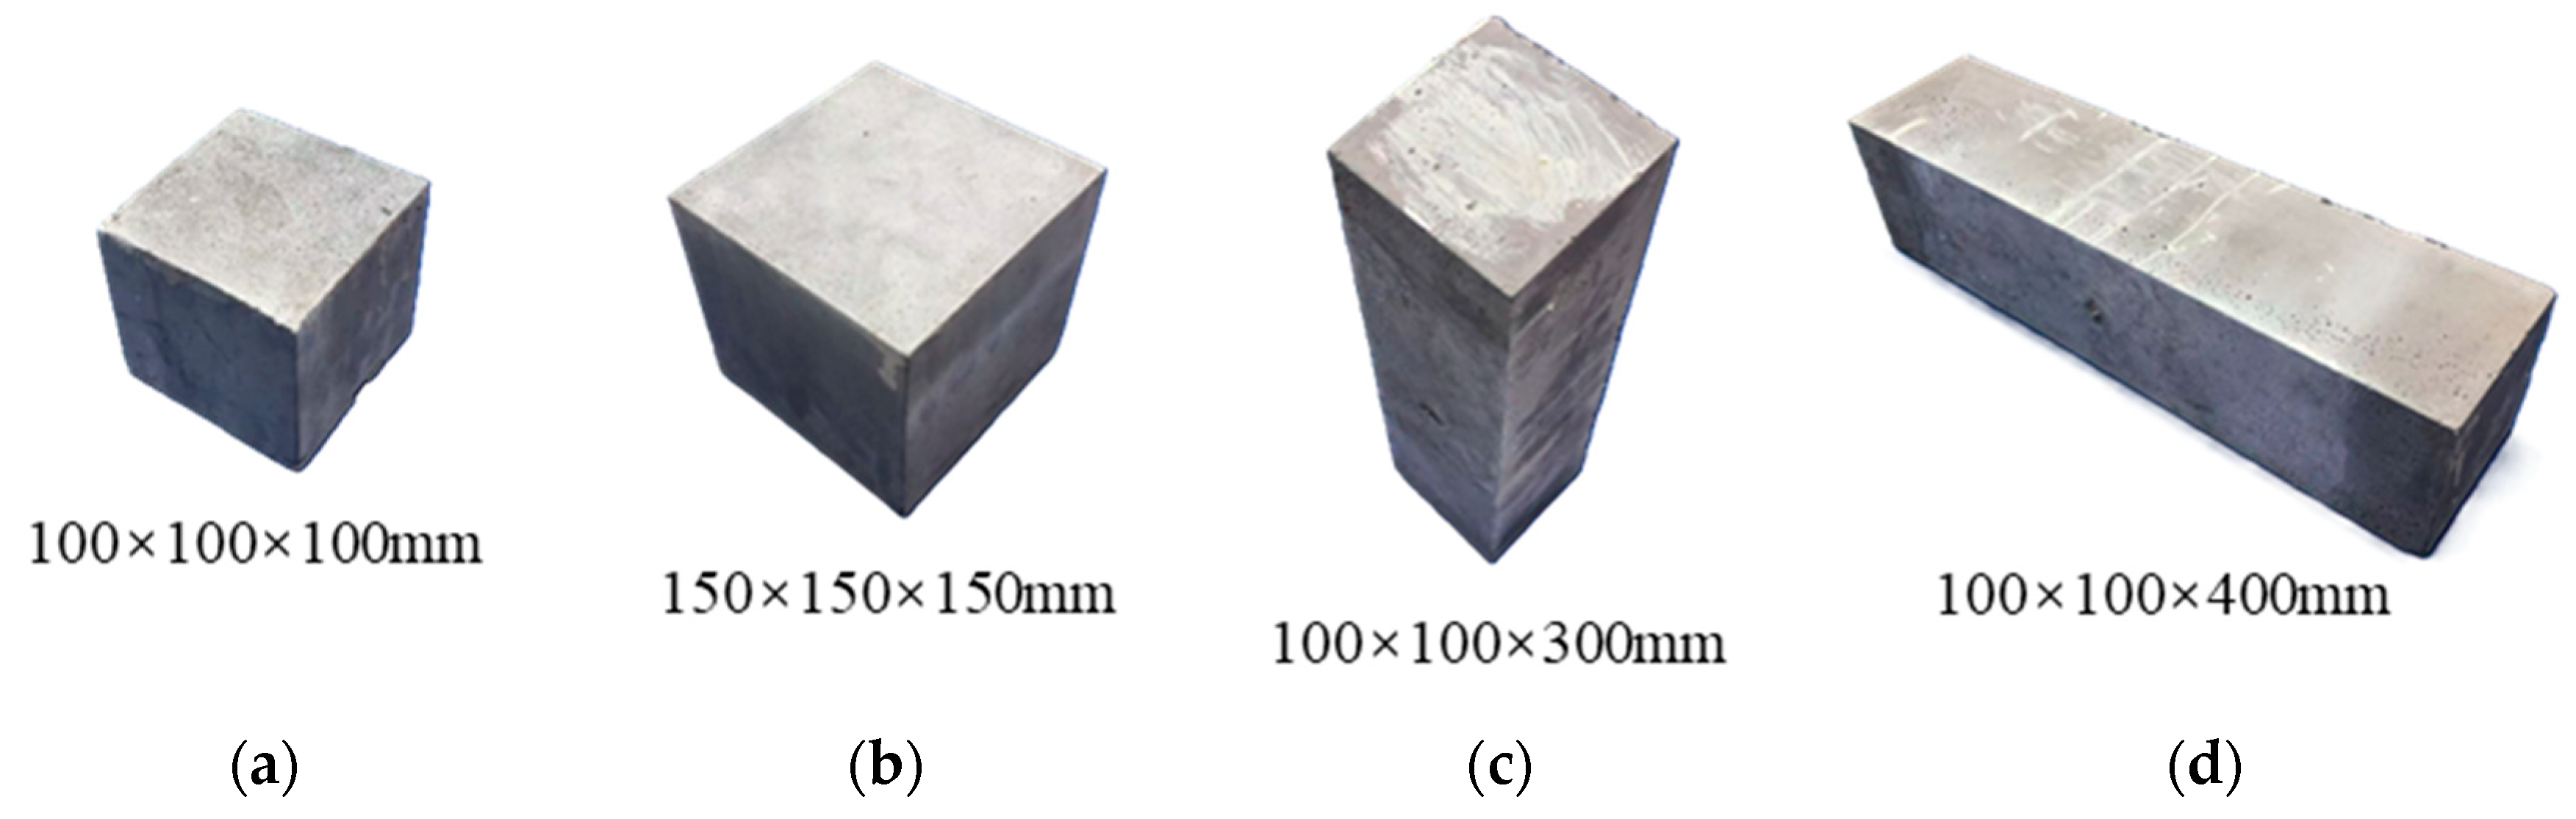
To evaluate the mechanical response characteristics of RPC specimens under different loading modes, four typical mechanical performance test schemes were designed in accordance with the TCECS 864-2021 standard [51] (specimen dimensions are detailed in Figure 5). Three parallel specimens were prepared for each loading condition, and all specimens had identical raw materials, mix proportions, and curing processes to ensure the reliability and repeatability of the test results. Among them, both the cubic compression specimens (100 × 100 × 100 mm) and splitting tensile specimens (150 × 150 × 150 mm) are standard specimen dimensions for RPC to ensure the comparability and consistency of test results among different projects and laboratories, which makes the tests of great significance. The axial compression specimens (100 × 100 × 300 mm) are closer to RPC long columns and other components in engineering, while the four-point bending specimens (100 × 100 × 400 mm) can simulate RPC bridge girders, precast slabs and other flexural members, and their loading behavior can effectively reflect the mechanical performance of the components. A displacement-controlled loading mode (0.02 mm/min) was adopted in the test to reflect the slow loading process of actual structures.
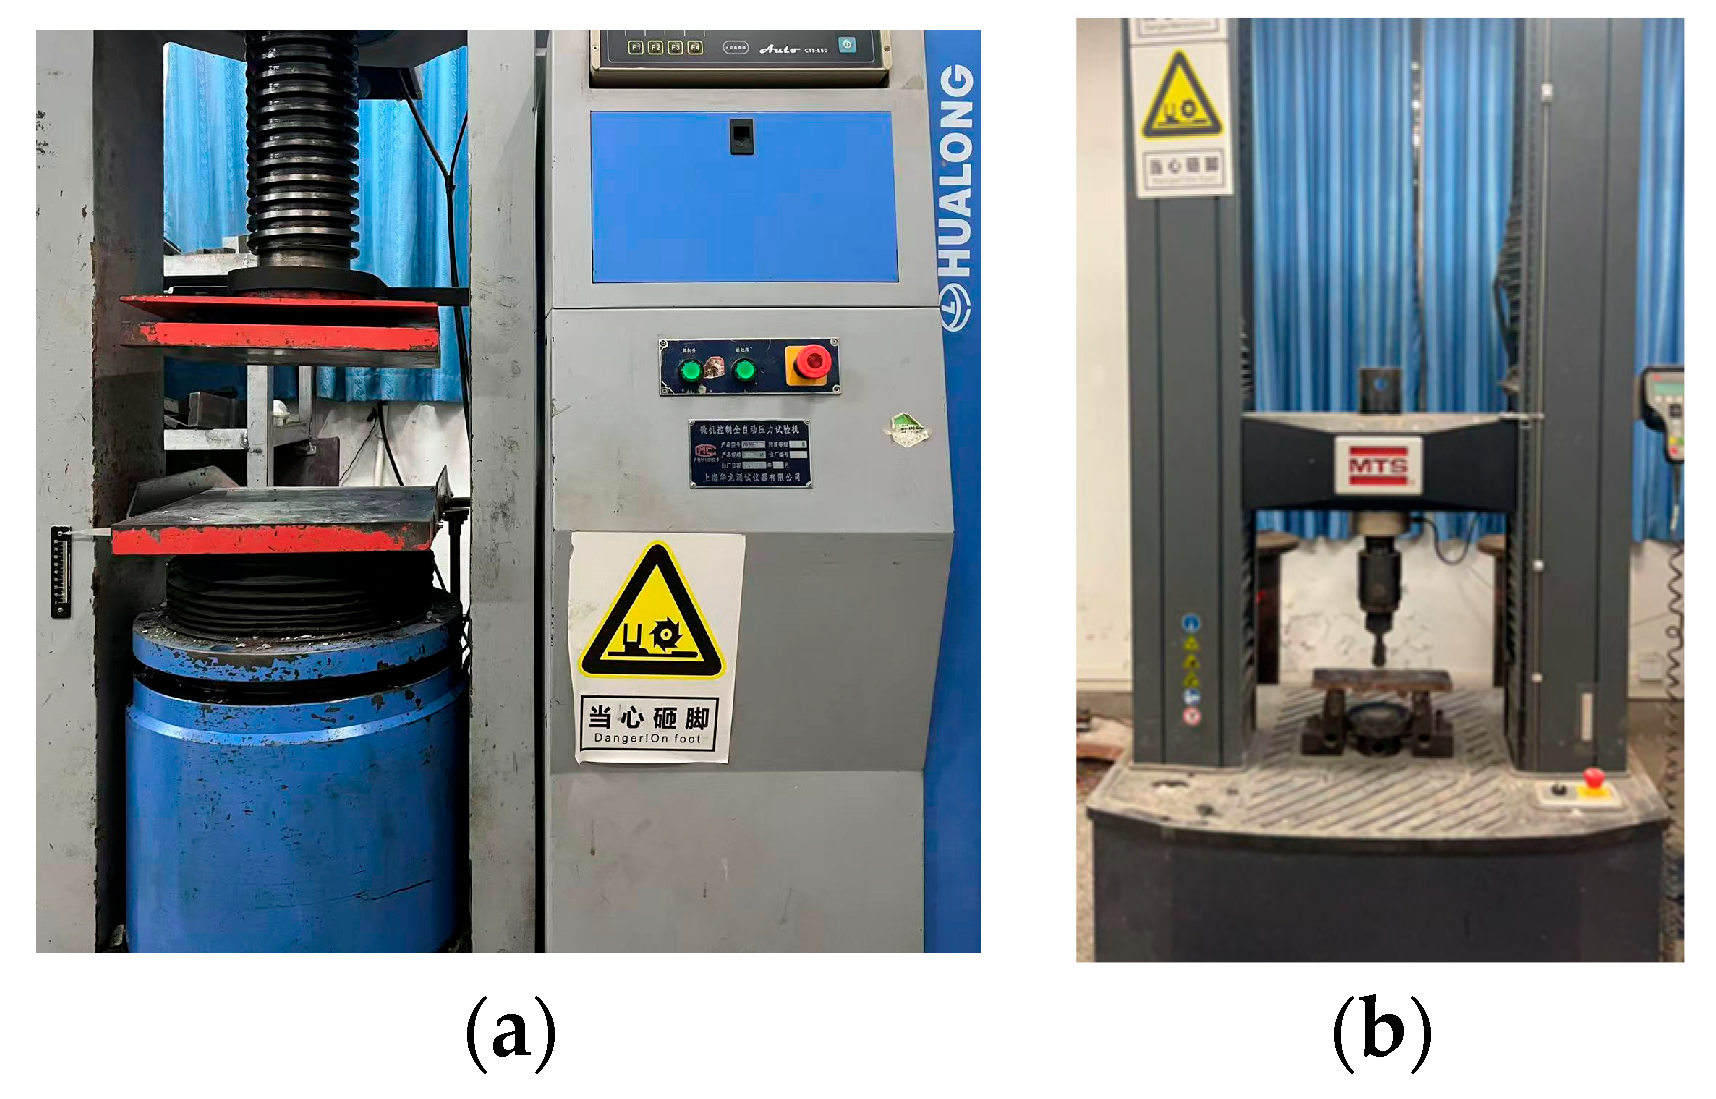
The cubic compression and axial compression tests were performed on a 3000 kN electro-hydraulic servo pressure testing machine (Figure 6a), while the splitting tensile and four-point bending tests were completed on a 200 kN MTS universal testing machine (Figure 6b). To avoid uneven stress distribution caused by end effects, the surfaces of the specimens, as well as the upper and lower bearing plates and support surfaces, were wiped clean before loading, and the specimen center was aligned with the testing machine center.
The strength for each test is calculated according to Equation (1)
f = F A f TS = 2 F π A f w = F L b h 2
where f is the cubic compressive and axial compressive strength of the specimen (MPa); fTS is the splitting tensile strength of the specimen (MPa); fW is the flexural strength of the specimen (MPa); A is the bearing area of the specimen (mm2); L is the span between the supports of the test beam (mm); b is the width of the specimen section (mm); and h is the height of the specimen section (mm).

2.4. Acoustic Emission System and Evaluation Method

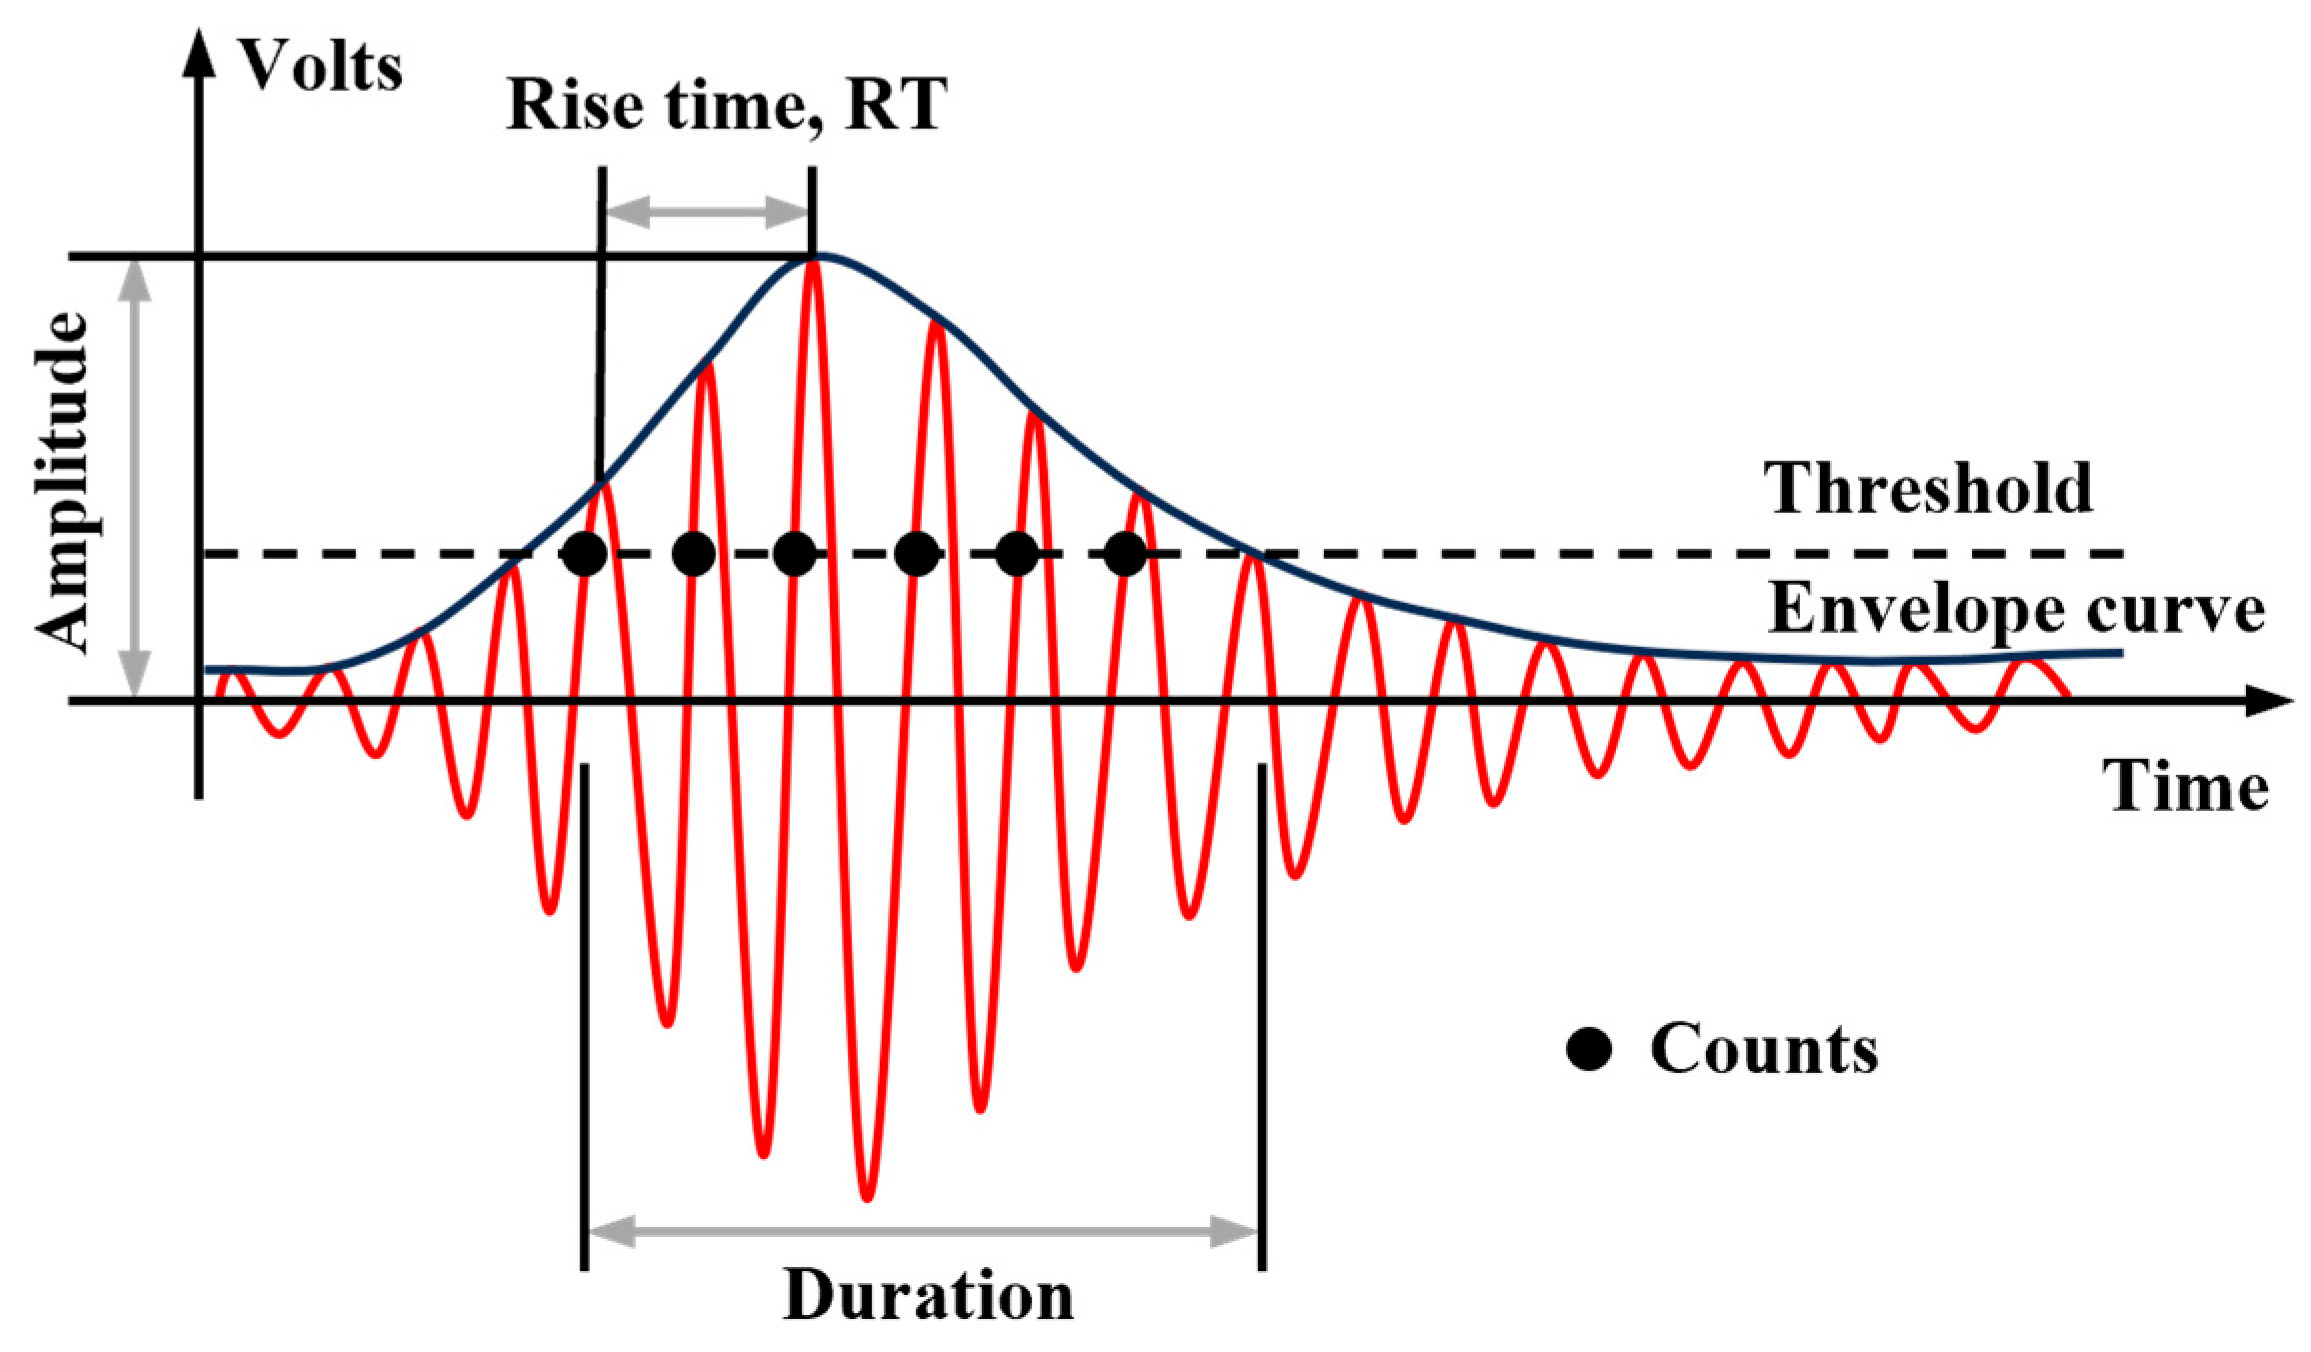
The Acoustic Emission (AE) monitoring system was constructed using an SAEU3H dynamic and static AE integrated machine (Guangzhou Qingcheng Co., Ltd., Guangzhou, China), comprising an AE acquisition instrument, pre-amplifiers, and sensor probes. The system provides real-time signal analysis and automatically extracts key parameters, including ringing count, energy characteristics, amplitude, duration, and rise time. Typical waveform characteristics are shown in Figure 7. According to the AE testing standard ASTM E976-15 (2021) [53], laboratory noise levels, and previous relevant studies, the gain of the pre-amplifier between the AE system and the sensor was set to 40 dB, and the detection threshold was set to 45 dB. The main parameters of the AE test system are presented in Table 5.

2.4.1. RA-AF Analysis

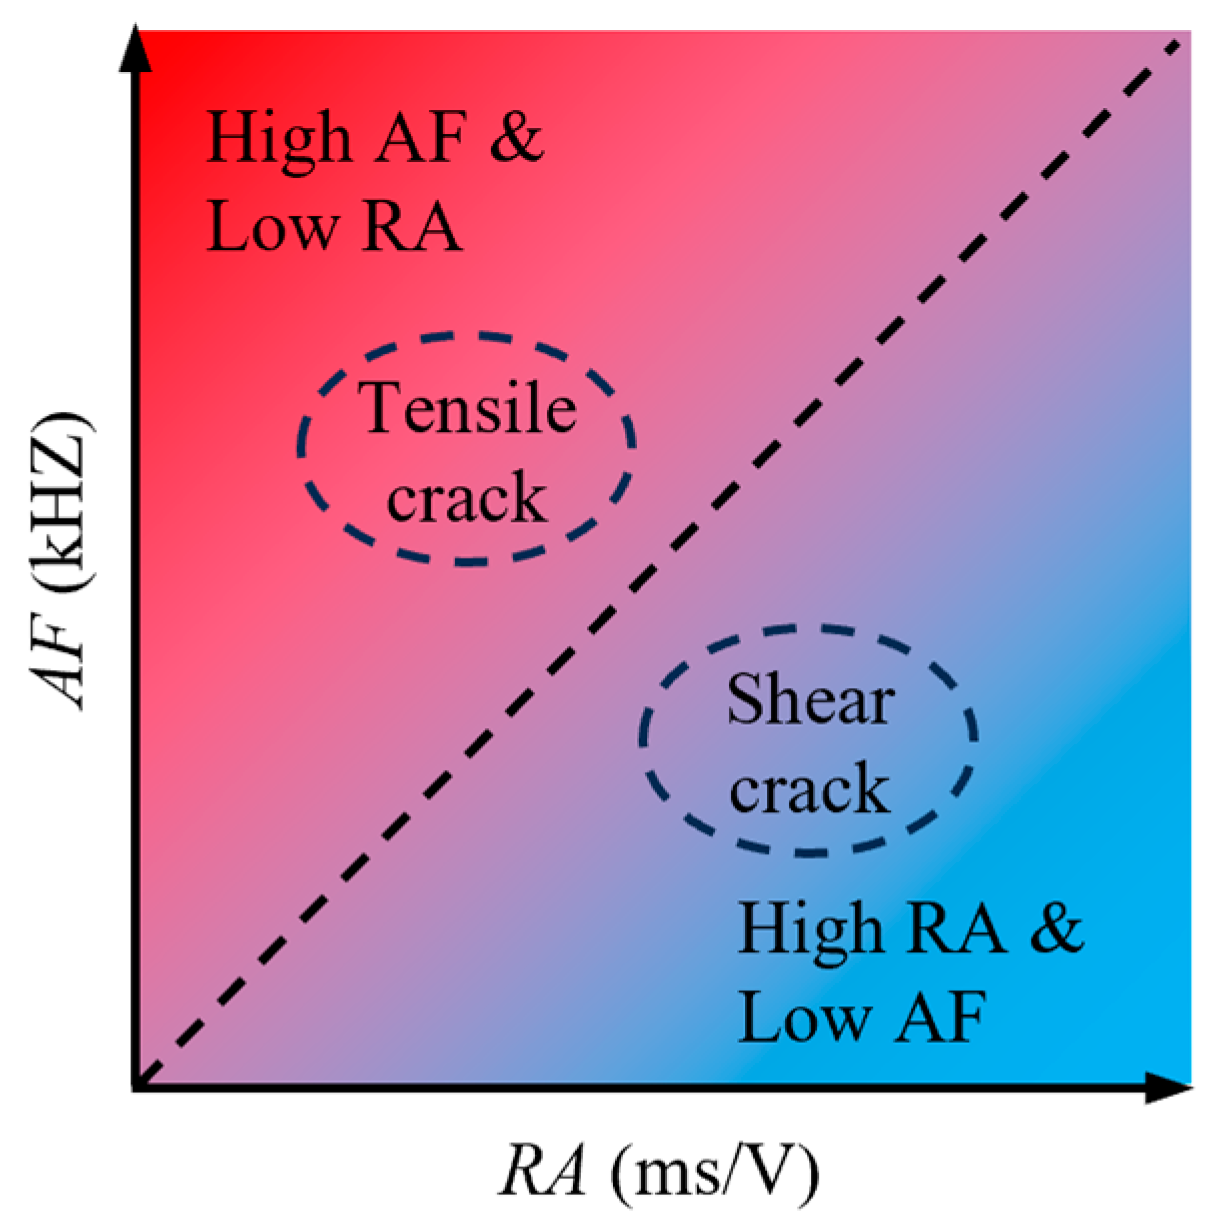
Concrete primarily exhibits two typical failure modes during loading: tensile failure and shear failure. Based on the standardized discrimination system for AE characteristic parameters RA (Rise Angle) and AF (Average Frequency) [44], crack types can be precisely identified. The calculation process is shown in Equations (2) and (3).
R A   value = Rise   time Amplitude ,   ( ms / V )
A F   value = Counts Duration ,   ( kHZ )
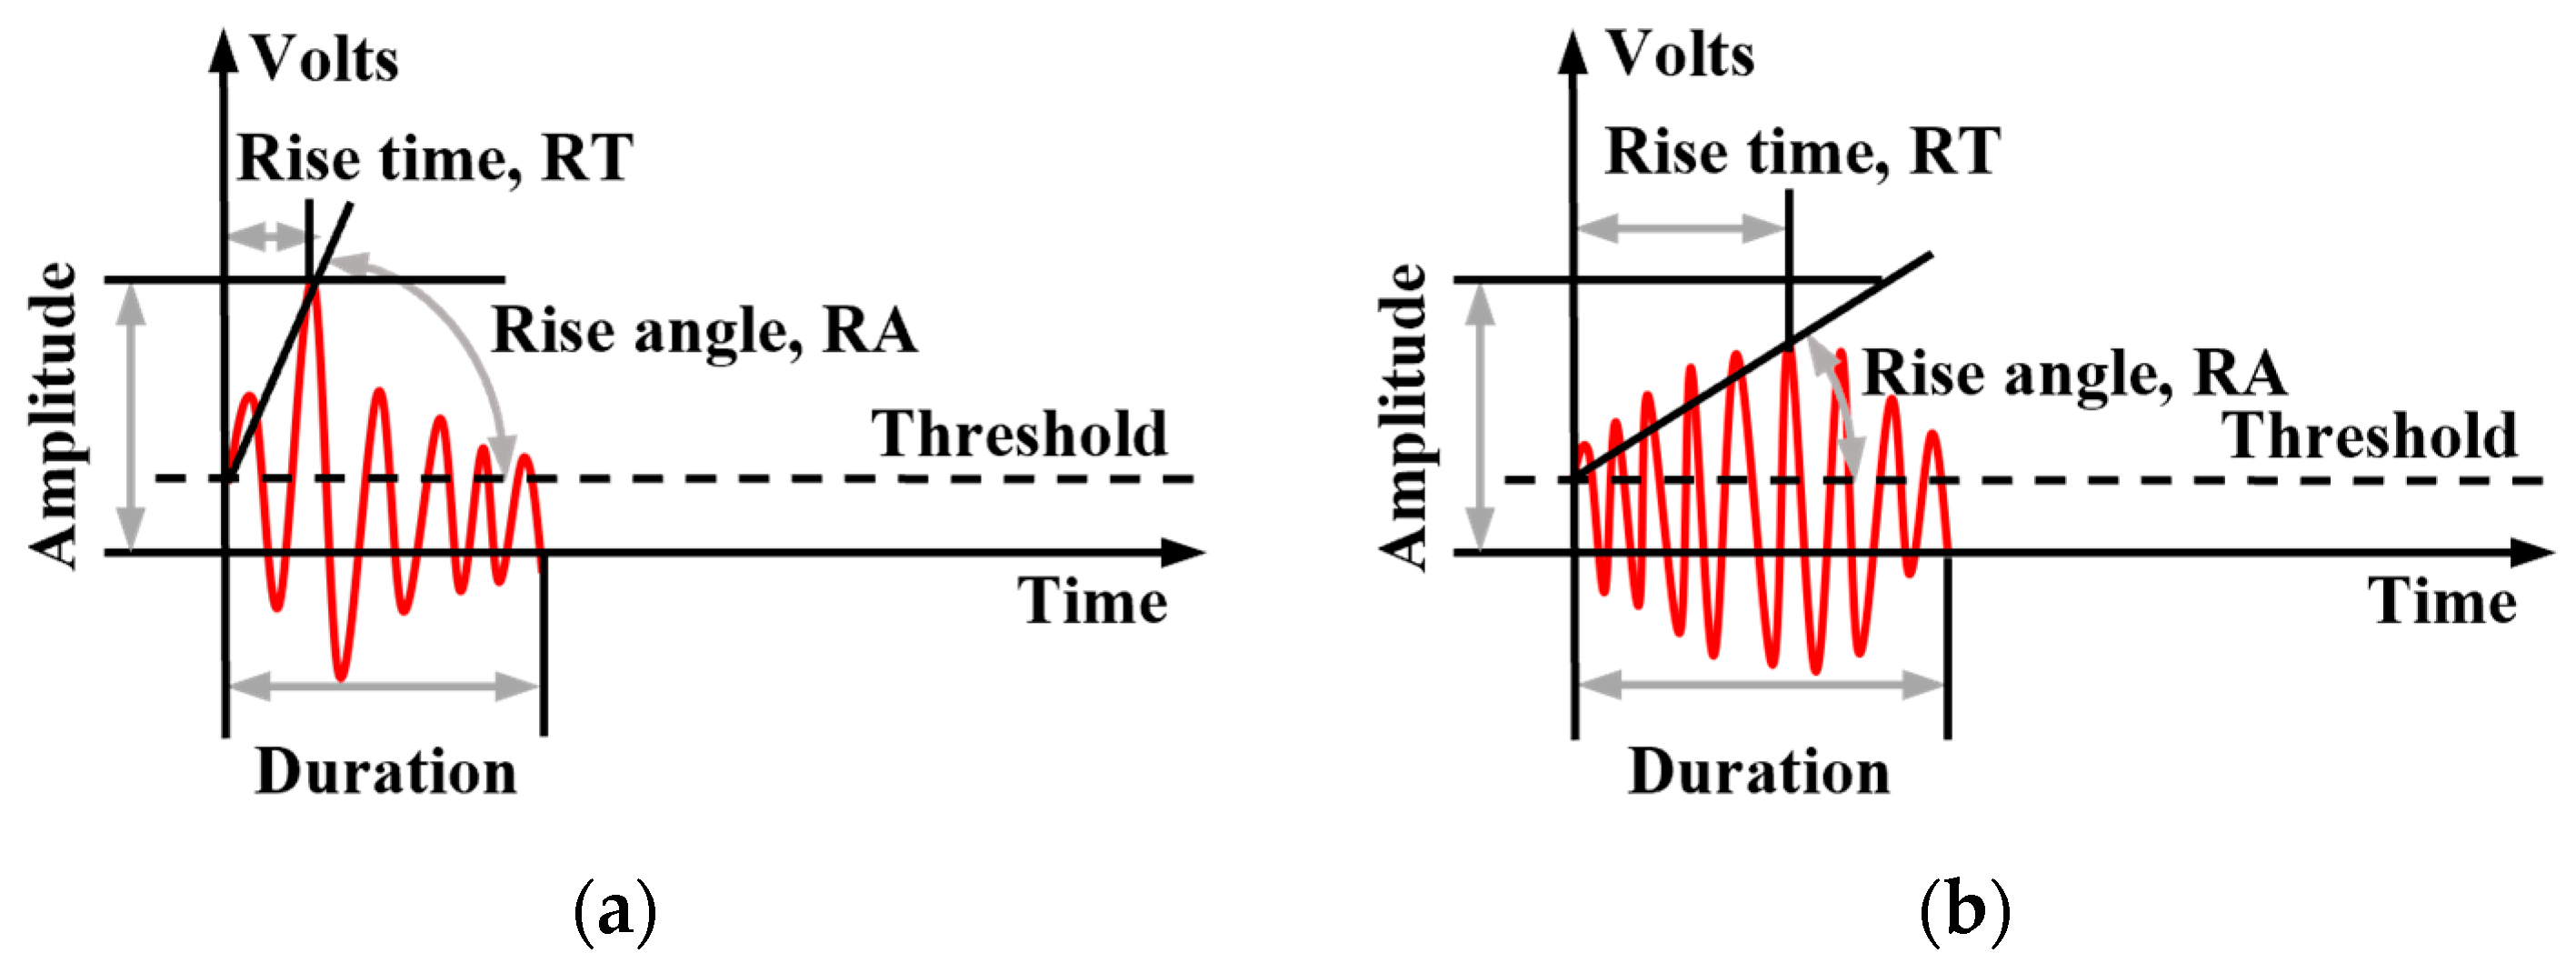
When local deformation of the material induces stress waves, tensile waves are characterized by high propagation velocity, large amplitude, and short rise time, corresponding to high AF values and low RA values (Figure 8a). Conversely, shear waves propagate more slowly, accompanied by extended rise times and durations, corresponding to low AF values and high RA values (Figure 8b). In this study, the JCMS-III B5706 code was adopted, using the diagonal line of the RA-AF distribution plot as the dividing line for tensile-shear crack discrimination (Figure 9) [54], providing a standardized methodological basis for the dynamic classification of the RPC damage evolution process.
To improve the accuracy of crack classification, pencil snap tests were conducted near the sensors before the experiment to ensure the signal capture sensitivity of each channel. In addition, for the sensitivity analysis of the boundary line, partial initial signals from splitting tensile tests (generally recognized as tensile crack-dominated) and local friction signals from the later stage of uniaxial compression tests (with obvious shear characteristics) were selected for comparison. It was found that this boundary line can effectively distinguish these two types of cracks, indicating the validity of the boundary line for the conclusions of this study.

2.4.2. b-Value

The concept of the b-value theory originally stemmed from seismology research, where Gutenberg and Richter first proposed the statistical relationship between earthquake frequency and magnitude in the 1940s [55]:
lg N = a b M
where M is the earthquake magnitude; N is the corresponding earthquake frequency; and a and b are constants.
In the field of AE technology, numerous studies have found significant similarities between the distribution characteristics of AE events during material failure and earthquake evolution mechanisms. Consequently, the b-value theory from seismology was introduced into material damage analysis by replacing the concept of “magnitude” in earthquakes with the “amplitude” of AE signals, thereby establishing the relationship between the amplitude distribution of AE events and the b-value:
lg N = a b ( A dB 20 )
where AdB is the amplitude of the AE event, and N is the number of AE events with amplitude greater than AdB.

2.4.3. Ivy Algorithm

AE parameter analysis provided a multi-modal feature input basis for machine learning model construction. On one hand, AE parameters such as ringing count, energy distribution, and frequency characteristics served as quantitative representations of material damage evolution; on the other hand, the non-linear correlations among these parameters provided key input features for establishing damage prediction models. Machine learning models are capable of predicting future damage behavior based on historical data, which is critical for safety monitoring and maintenance management of engineering structures. Therefore, machine learning was employed to analyze AE parameters, and the Ivy algorithm (IVY) was established to optimize the XGBoost and Random Forest models, respectively, to identify the actual damage stages of RPC specimens under different loading conditions.
The IVY is a powerful and novel bionic algorithm variant inspired by the growth pattern of ivy plants [56]. The algorithm consists of four stages: growth, propagation, evolution, and survivor selection. The IVY features a simple structure and ease of implementation, and its robust optimization capability has been verified in multiple test functions and engineering applications [57].
The IVY first randomly generates a set of ivy plant individuals in the search space according to Equation (6). When optimizing a machine learning model, the position of each ivy plant individual represents a combination of hyperparameters.
I i = I min + r a n d ( 1 , D ) ( I max I min )
where Ii is an independent ivy plant individual, i 1 , N p o p , is the total number of individuals; rand(1, D) represents a randomly generated D-dimensional vector where each component of the vector is in the range [0, 1]; and represents the element-wise product.
Assuming the ivy growth velocity is Gv, it can be given by Equation (7).
d G v ( t ) d t = ψ G v ( t ) φ ( G v ( t ) )
where Gv(t) is the growth velocity; ψ is the growth rate constant; and φ is the correction factor. After extensive testing and simulation, Equation (8) can be obtained to describe the individual’s growth velocity. When optimizing a machine learning model, the growth velocity of the ivy plant determines the speed at which the hyperparameters are updated.
Δ G v i ( t + 1 ) = r a n d 2 ( N ( 1 , D ) Δ G v i ( t ) )
where Δ G v i ( t + 1 ) and Δ G v i ( t ) are the growth velocities of individual I at time t + 1 and t, respectively; rand2 is a random variable with a probability density of 1 / ( 2 x ) ; and N(1,D) is a D-dimensional standard Gaussian distribution random number.
Individuals in the ivy population select the closest and strongest neighboring individual as the target for self-improvement. Equations (9) and (10) describe the process by which an ivy individual grows reasonably toward the light source by utilizing a neighboring individual. When optimizing a machine learning model, the process of the ivy plant climbing toward the light source by utilizing its strongest neighbor is essentially the process where the hyperparameters move closer to the global optimal hyperparameters by leveraging the adjacent best hyperparameters.
I i n e w = I i + N ( 1 , D ) ( I i i I i ) + N ( 1 , D ) Δ G v i
Δ G v = I i I max I min , I t e r = 1 r a n d 2 ( N ( 1 , D ) Δ G v i ) , I t e r > 1
where I i n e w is the new individual generated by Ii; Iii is the strongest neighbor of Ii; Δ G v i is the velocity of Ii; and Iter is the number of iterations.
After Ii grows by utilizing its strongest neighbor Iii, this individual also attempts to grow by leveraging the strongest individual in the entire population. Equations (11) and (12) describe this process. When optimizing a machine learning model, the process of the ivy plant growing by utilizing the strongest individual is the process where the hyperparameters continue to update by leveraging the current optimal hyperparameter combination.
I i n e w = I best ( ( r a n d ( 1 , D ) ) + N ( 1 , D ) G v i )
Δ G v i n e w = I i n e w I max I min
where Ibest is the strongest individual in the entire population; Δ G v i n e w is the new growth velocity of the new individual.
The workflow of the IVY-optimized machine learning is illustrated in Figure 10. The IVY first generated an initial solution set through random sampling in the parameter space to ensure uniform coverage. The machine learning model completed the full training-validation-testing process based on the current hyperparameter combination, and the output evaluation metrics (such as accuracy) were passed as fitness values to the initial population. The initial population eliminated individuals with low fitness based on the crowding distance metric, followed by crossover and mutation operations on high-quality individuals to complete population updates. The machine learning model was then retrained, tested, and evaluated based on the optimized hyperparameter combinations. This process was repeated until the maximum number of iterations was reached. The position of the individual with the maximum fitness produced during the entire process represented the optimal hyperparameter combination.

3. Results

3.1. Stress–Strain Curve and Mechanical Properties

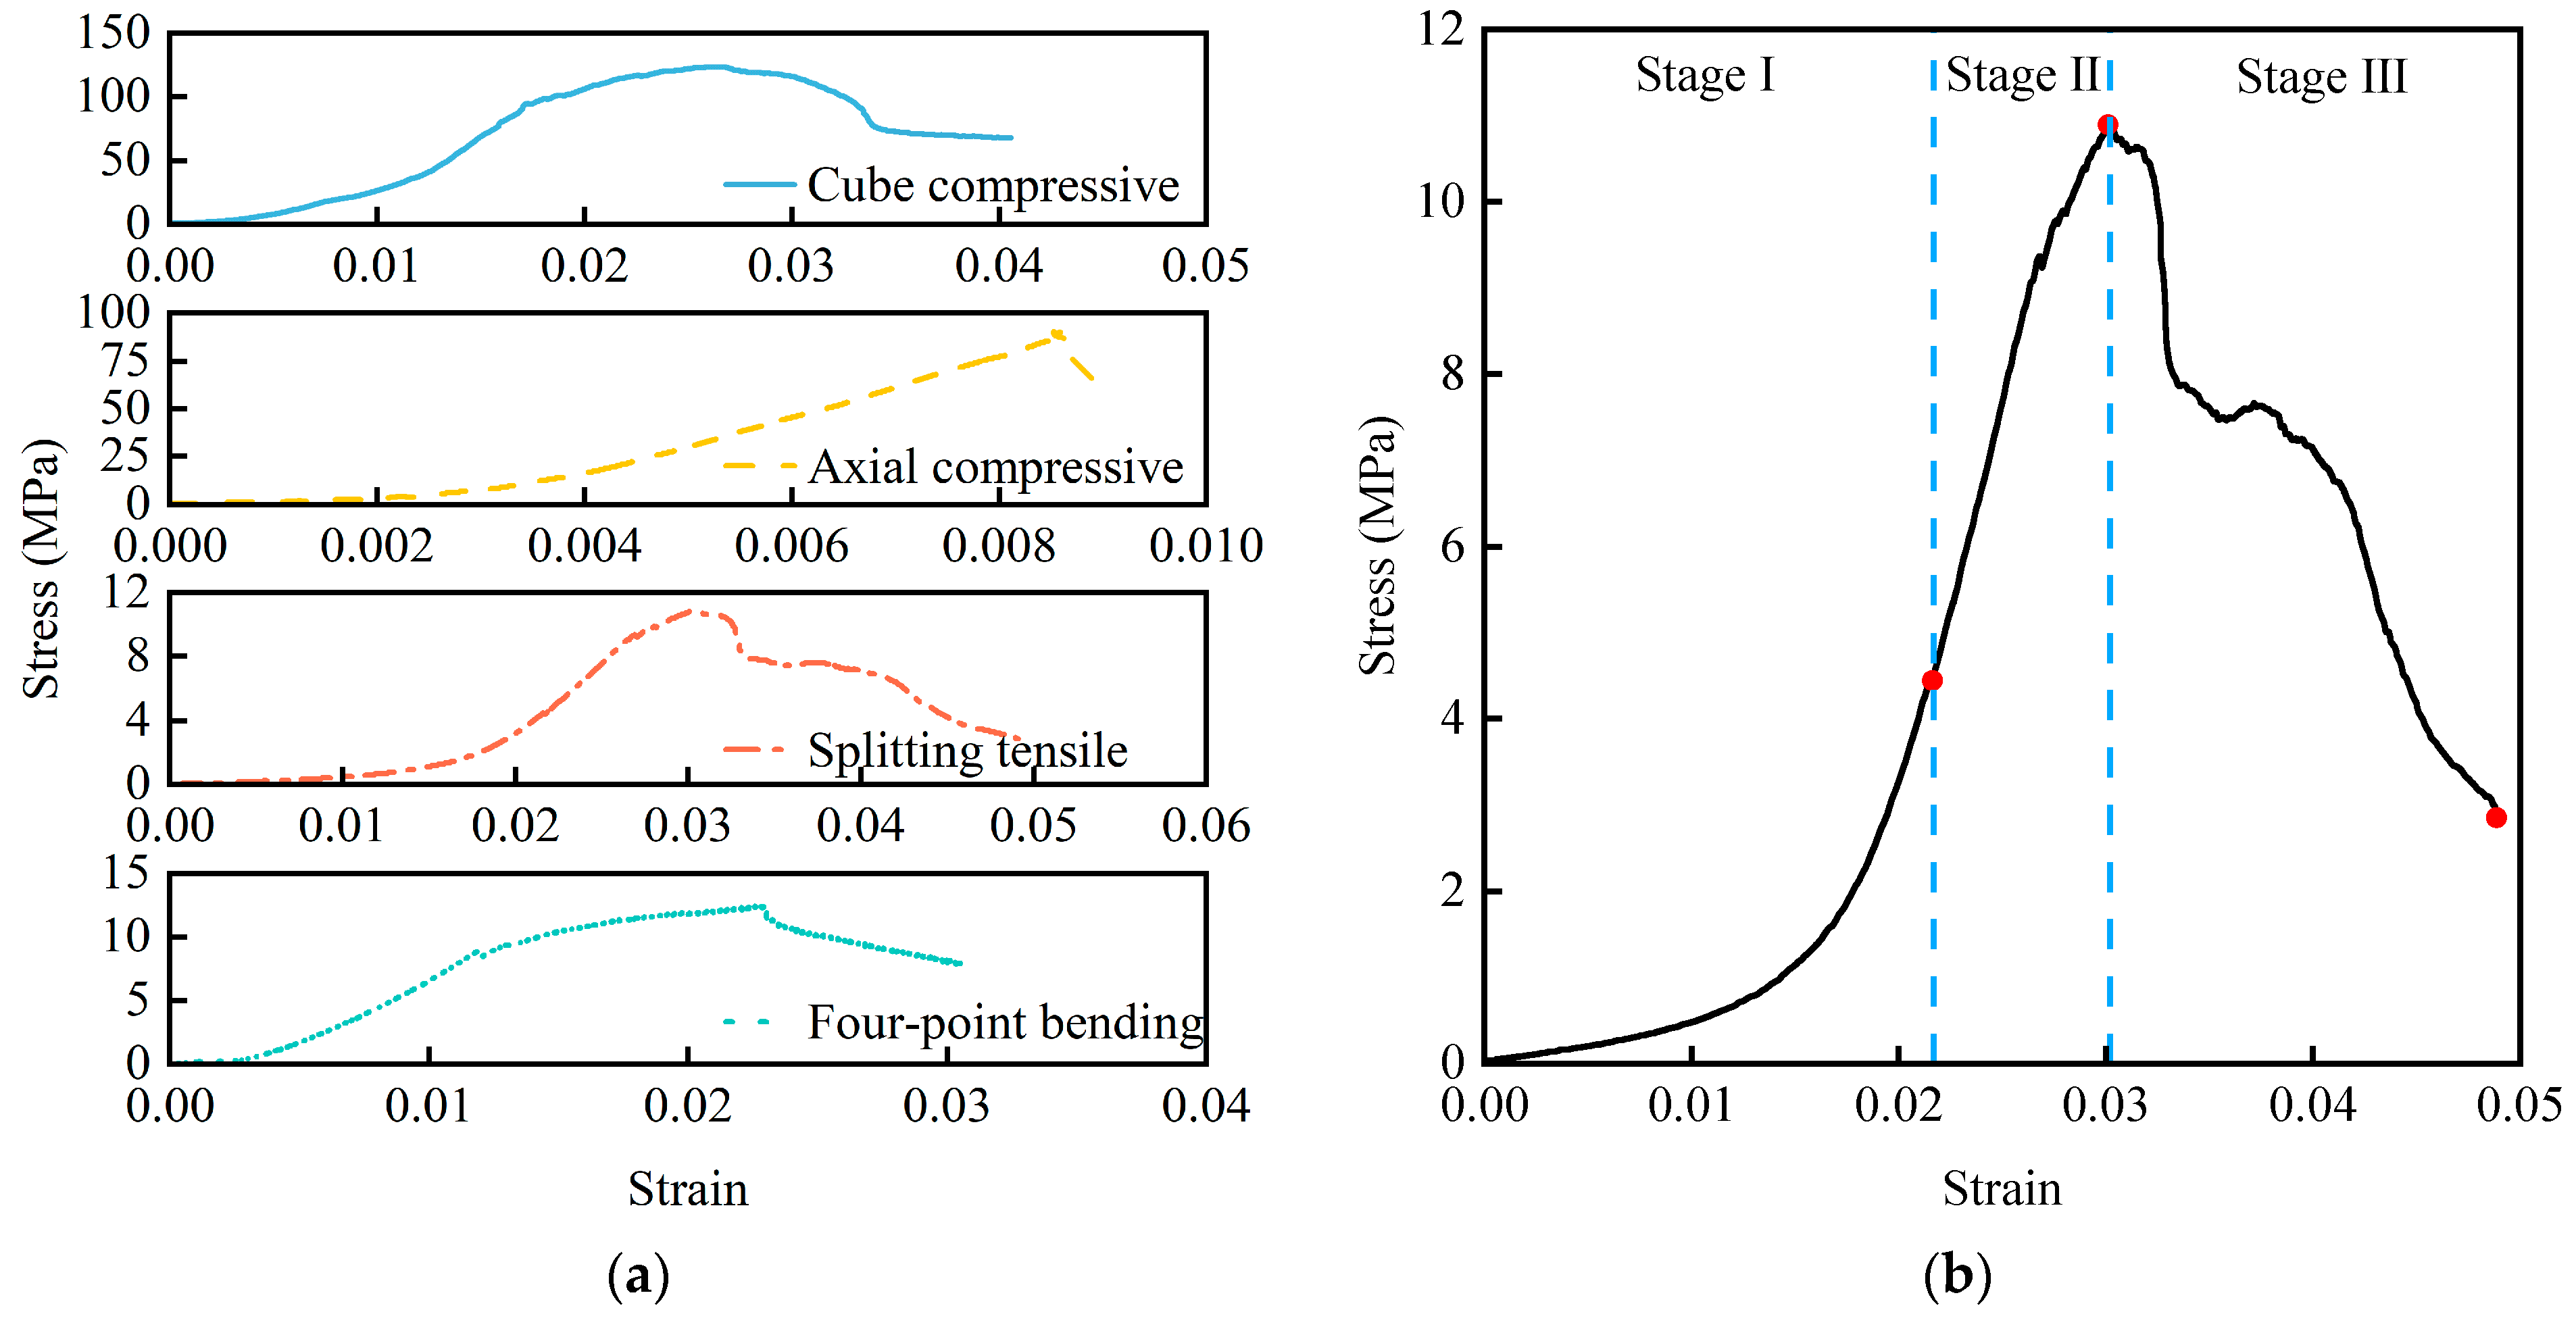
Figure 11a illustrates the stress–strain curves of RPC specimens under various loading conditions. As shown in the figure, the loading conditions significantly influenced the mechanical and deformation capacities of the specimens. Under cubic compression, splitting tensile, and four-point bending stress states, the specimens exhibited typical ductile characteristics, generally showing a stress drop phenomenon before reaching the peak stress. In contrast, under axial compression, the stress–strain curve displayed a sharper peak, indicating a more pronounced brittle failure. By analyzing the stress–strain curves of each specimen, the loading process was roughly divided into three distinct stages. Taking the splitting tensile condition as a typical representative, Figure 11b shows the following: In the compaction and elastic deformation stage (Stage I), the initial loading exhibited non-linear compaction characteristics, where the curve showed a concave shape. This stage primarily completed the closure of initial pores and the compaction of micro-cracks, followed by the linear elastic deformation stage, where the stress–strain curve demonstrated a good linear relationship and rapid ascent. In the crack extension stage (Stage II), micro-cracks began to initiate and continuously propagate within the matrix after the elastic deformation concluded. The stress–strain curve in this stage showed a fluctuating upward trend until the peak stress was reached. In the unstable failure stage (Stage III), after reaching the peak, the continuous penetration of main cracks within the core concrete led to a stress reduction, indicating that the specimen had undergone ultimate failure.
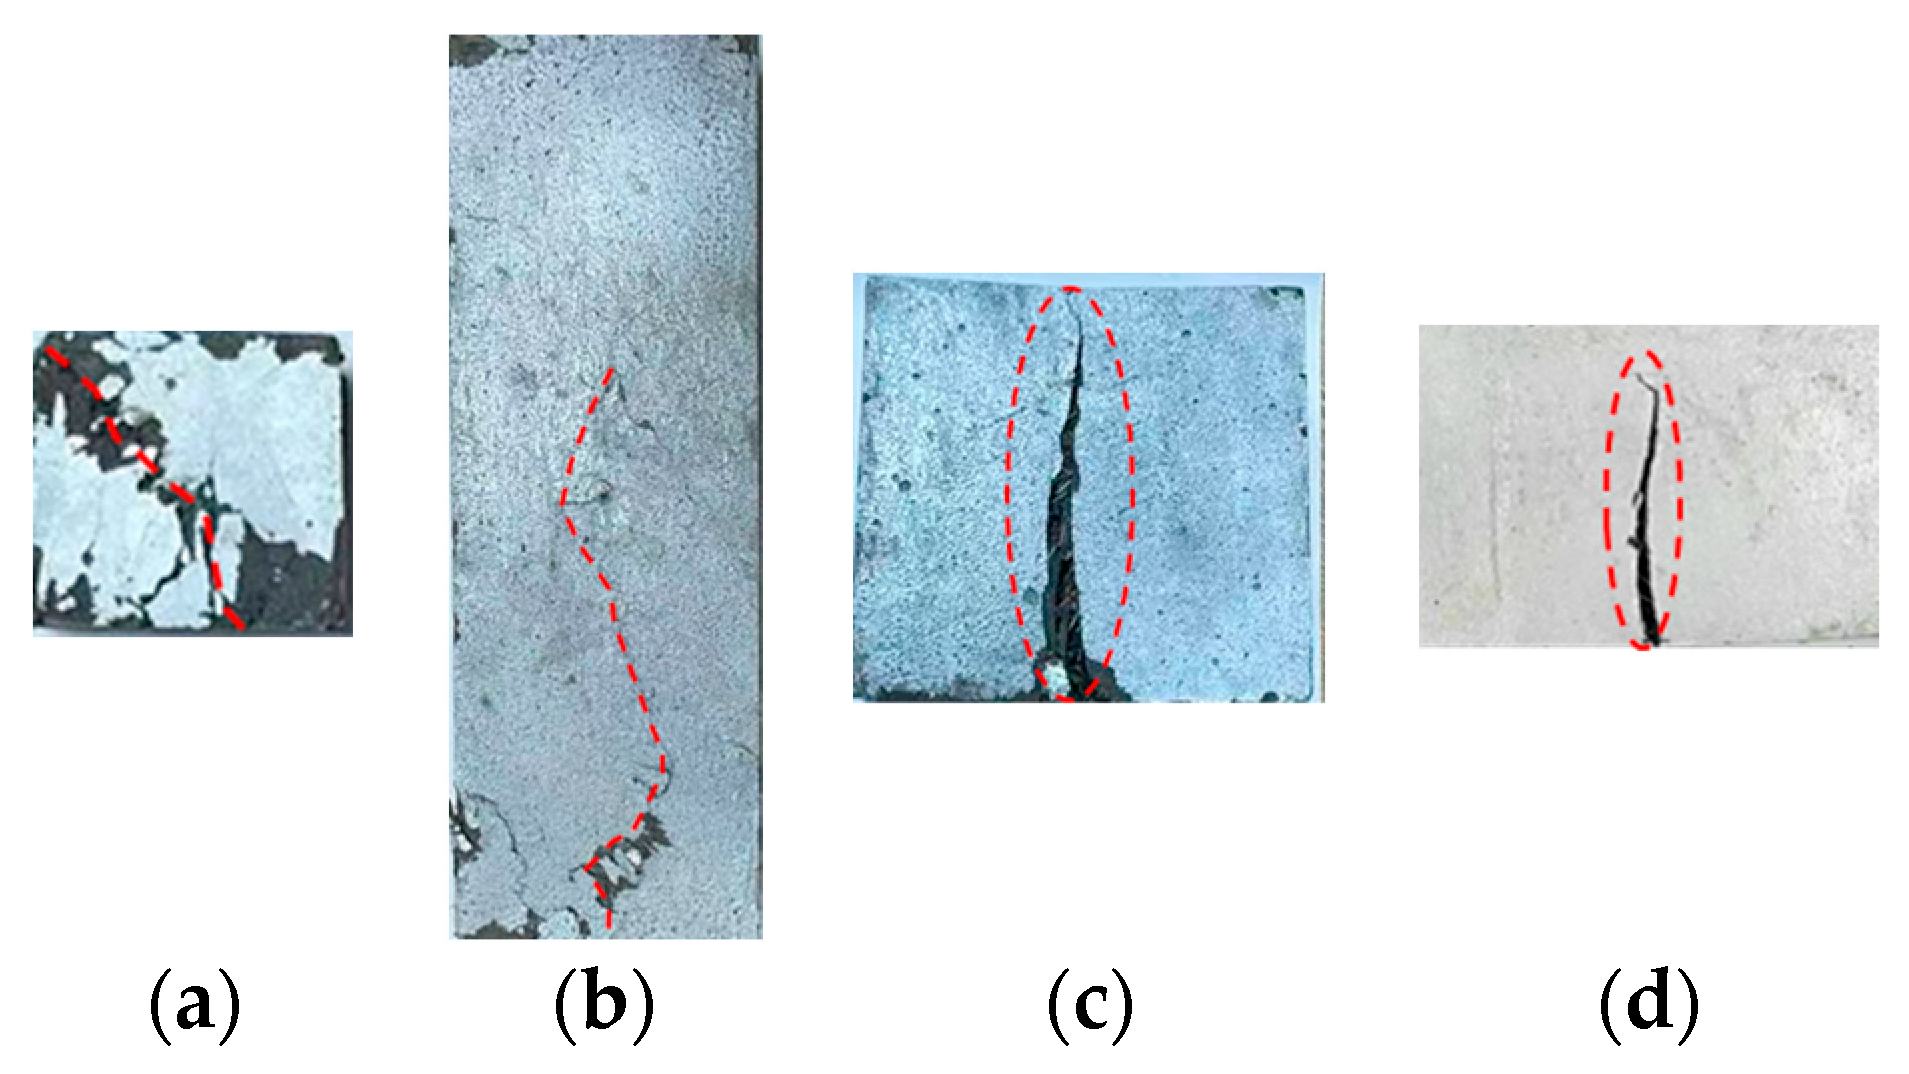
Figure 12 exhibits the typical failure patterns of the RPC specimens. Under cubic compression, diagonal cracks formed without the fragmented spalling commonly seen in conventional concrete. The axially compressed specimens formed longitudinal splitting vertical cracks in the central region, and the failure process was accompanied by an abrupt stress drop. The failure modes under splitting tensile and four-point bending loading were similar, forming a single main crack propagation path during the failure process. The crack propagation rate was significantly lower than that in the axial compression condition, and the failure surface presented a “spiderweb-like” pattern due to the distribution of steel fibers, fully reflecting the ductile contribution of the steel fibers.
To further quantify the mechanical deformation characteristics of RPC specimens under different loading conditions, the damage strain (εcd), peak strain (εc), peak stress (fc), and residual stress (fr) were extracted from the stress–strain curves. εcd is defined as the strain value corresponding to the end of elastic deformation. Additionally, the displacement ductility coefficient α and the residual strength ratio β were calculated as the main mechanical performance indices. α is defined as the ratio of peak strain to damage strain (α = εc/εcd), and β is defined as the ratio of residual stress to peak stress (β = fr/fc). A larger α value indicates more significant ductile deformation of the specimen, while a larger β value suggests stronger resistance to failure. The specific values of these parameters are summarized in Table 6, which shows that the specimens exhibited the strongest ductility and failure resistance under four-point bending, and the weakest under axial compression.
The observed performance differences stem from the regulating effect of steel fiber orientation under different loading conditions. Under bending conditions, steel fibers form continuous stress transfer paths along the loading direction, which effectively restricts the rapid expansion of concrete cracks, thereby maximizing the specimen’s resistance to failure and deformation. In contrast, under axial compression, the random distribution of steel fibers struggles to effectively restrain longitudinal splitting. It is noteworthy that, even in the brittle failure-dominated axial compression condition, the strong bond between the steel fibers and the matrix interface still limited the crack propagation scale, allowing the specimen to maintain its basic geometric integrity after failure.

3.2. AE Count and Energy Characteristic Analysis

AE signal characteristic parameters are closely related to the internal damage evolution process of the material, essentially stemming from the dynamic response of micro-crack formation and propagation. Commonly used AE evolution parameters include energy and ringing count. The ringing count refers to the number of oscillating pulses of the AE signal waveform that exceed a preset threshold. This parameter is positively correlated with the instantaneous rupture rate and fracture scale inside the material, and is often used to quantify the cumulative frequency of damage events [58]. Energy, on the other hand, is the integral value of the voltage-time curve envelope of a single AE event signal waveform, representing the energy released during the AE event. This parameter directly reflects the magnitude of elastic strain energy released by crack propagation; higher energy values indicate more severe crack propagation [59]. Based on these AE signal features, the AE ringing count can characterize the material’s damage activity, while AE energy, by directly quantifying the total elastic strain energy released by crack propagation, more sensitively reflects the severity of macroscopic damage and its strong correlation with mechanical properties.
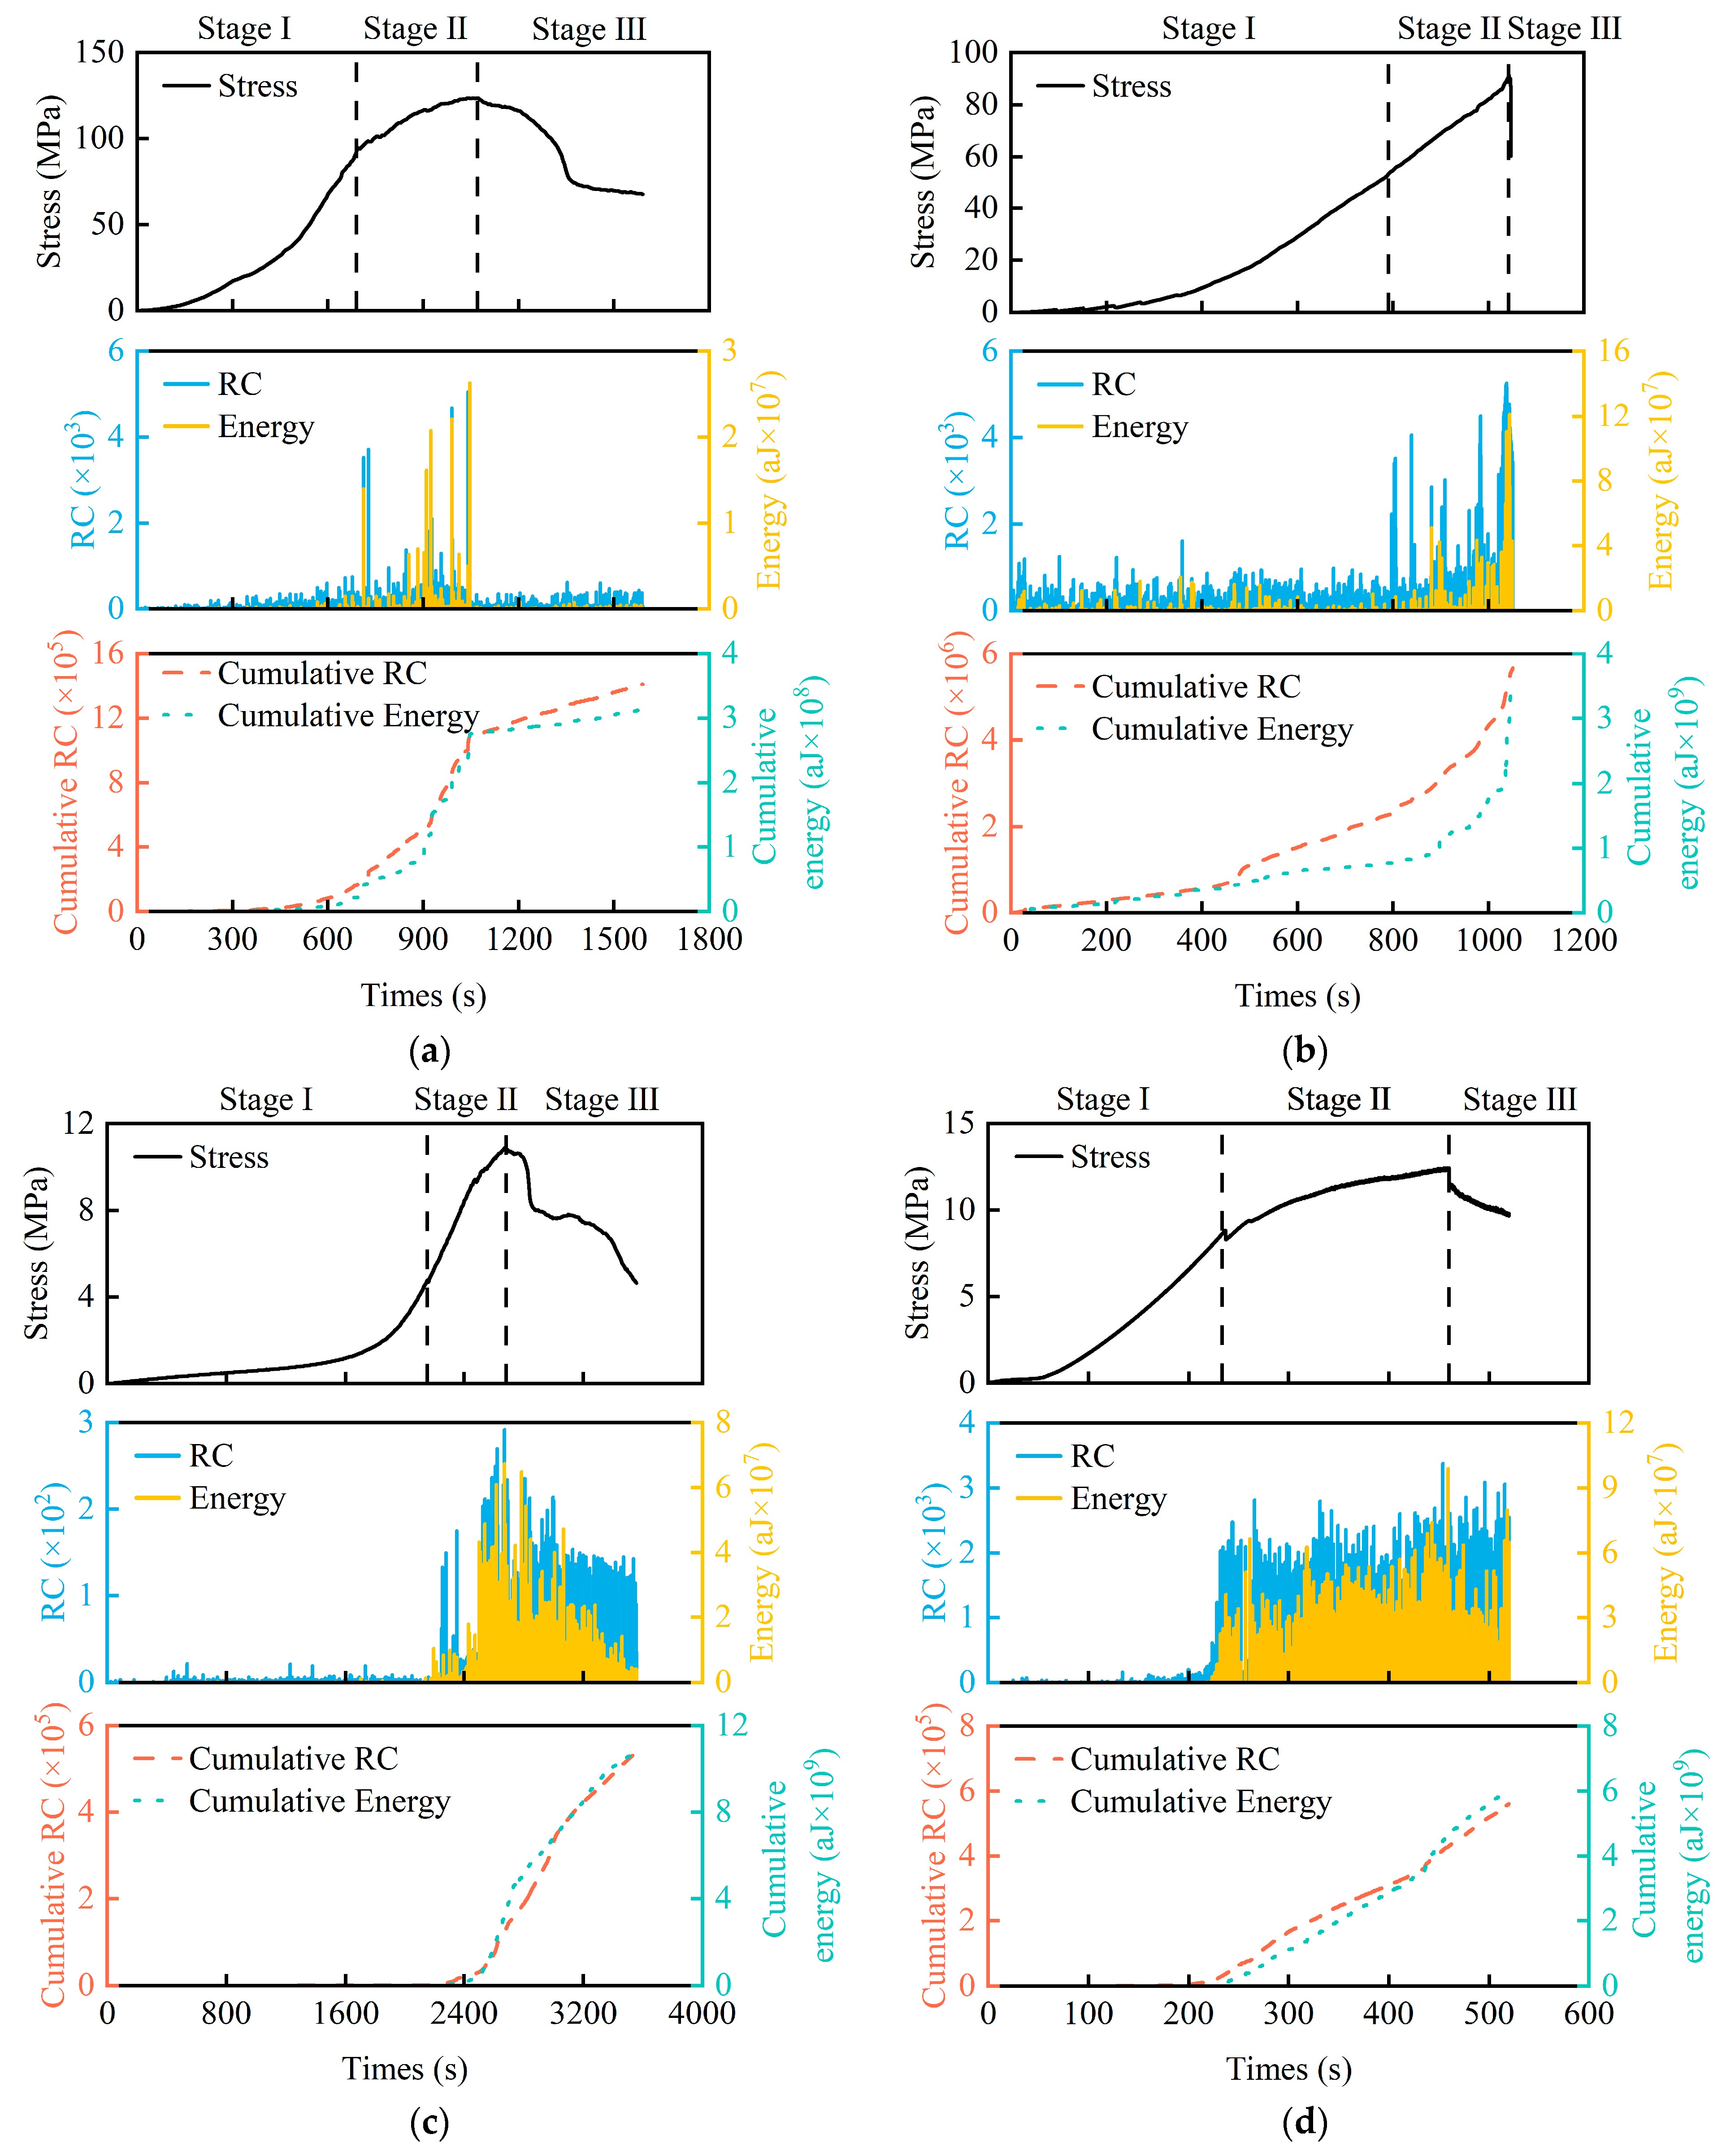
Figure 13 presents the evolution curves of stress, AE ringing count, and energy parameters over time for each specimen. Figure 13a shows that, in the cubic compression condition, the compaction and elastic deformation stages were mainly characterized by low-energy AE signals, the features of which originated from weak damage activities during initial pore closure and elastic deformation. After entering the crack extension stage, the continuous expansion and penetration of matrix cracks led to a significant increase in the AE signal; the ringing count and energy values increased abruptly upon the formation of the main crack. The failure stage showed high-frequency and low-energy characteristics due to the steel fiber bridging effect, which inhibited specimen separation, meaning the frequency of ringing counts increased while the energy significantly decreased.
Relative to cubic compression, Figure 13b shows that during axial compression failure, the ringing count in the compaction stage was higher than that in cubic compression, and the energy release was more intense, reflecting the accelerating effect of the slenderness ratio on micro-crack initiation. Although the crack extension stage had a similar signal growth trend to cubic compression, the energy peak value at the penetration of the main crack was higher. Furthermore, the catastrophic fracture characteristics exhibited during the failure stage caused the AE signal, accompanied by an abrupt stress drop, to briefly surge and then rapidly decay, typically reflecting the transient response characteristic of brittle failure. Under splitting tensile (Figure 13c) and bending (Figure 13d) loading, the compaction stage consistently exhibited extremely low AE event rates, with energy approaching the detection limit, indicating no significant squeezing or rupture behavior occurred in this stage. After entering the crack extension stage, the sudden fracture of fibers, triggered by fiber-matrix interface debonding in the splitting tensile specimen, caused a sharp rise in the ringing count and a simultaneous steep increase in energy. In contrast, for the bending specimen, the fiber bridging effect continuously resisted crack expansion after the main crack formed, and the AE signal showed a progressive increase trend. The acoustic emission characteristics in the failure stage exhibited significant differences: the continuous widening of the main crack in the splitting tensile specimen led to continuous fiber pull-out events, characterized by sustained high ringing counts and gradually decaying energy; the bending specimen, due to the non-single-burst nature of fiber pull-out, showed a sustained increase in ringing count and fluctuating energy release, reflecting the progressive and multi-stage failure characteristics of crack expansion.
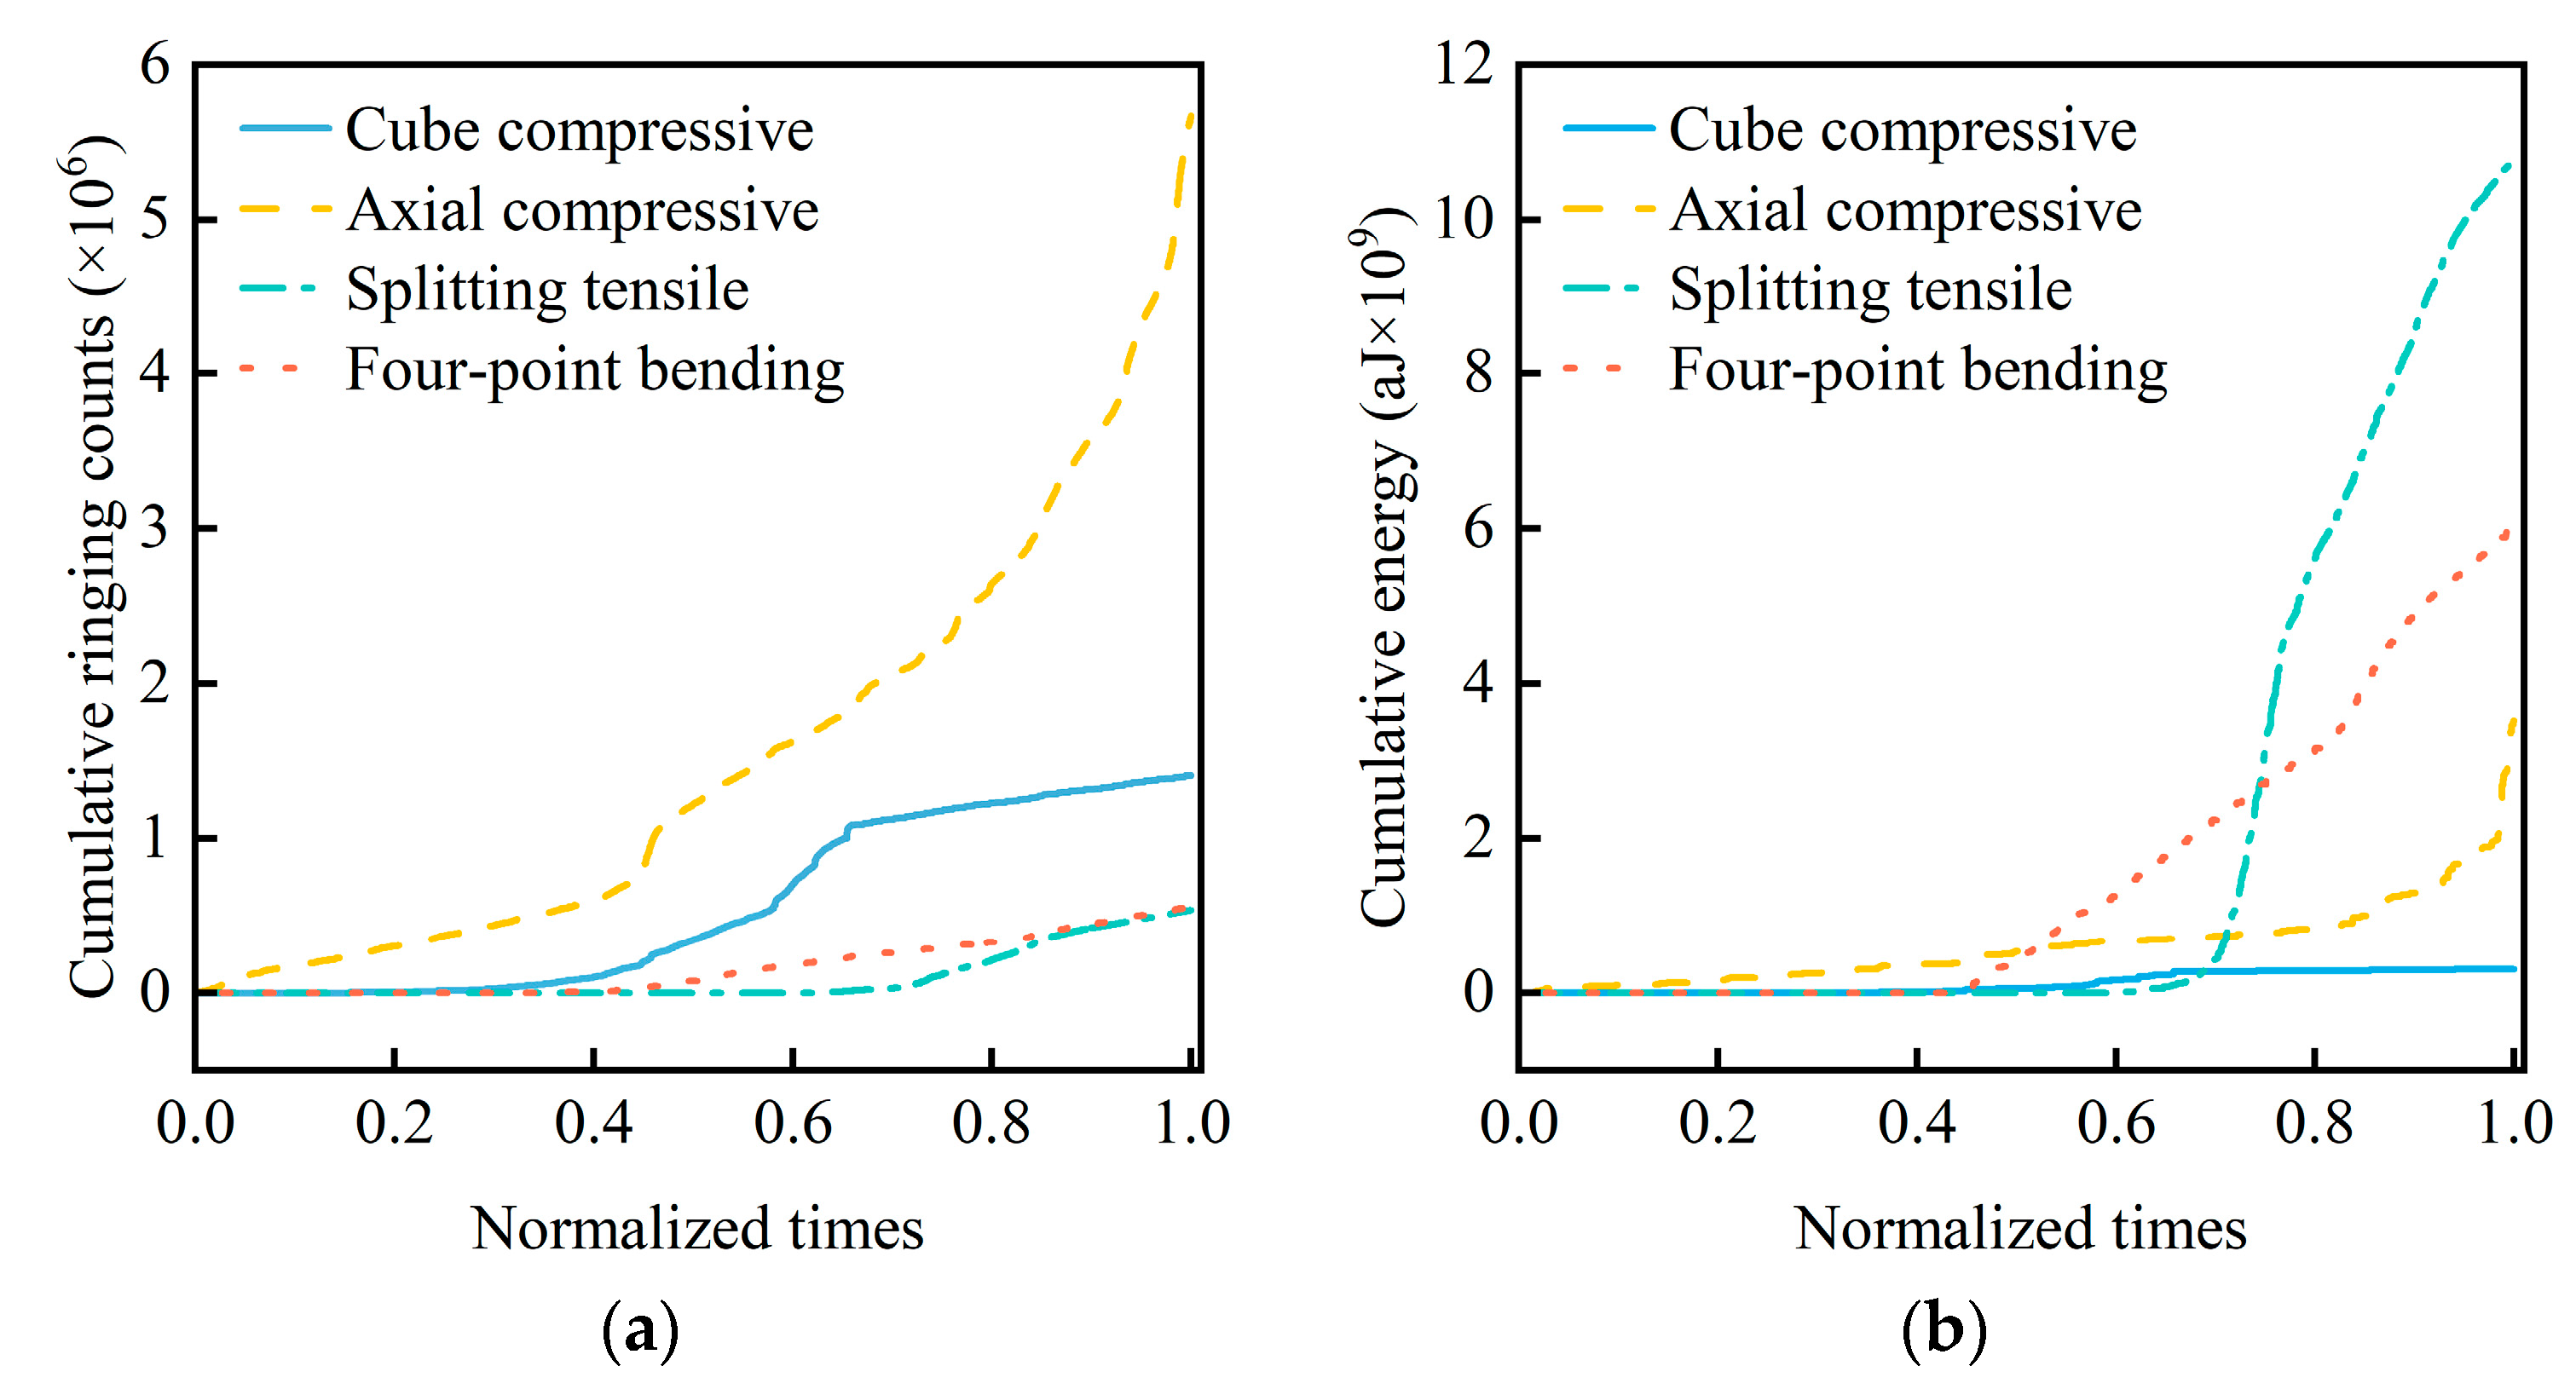
Figure 14 reveals the cumulative ringing count and energy release characteristics of RPC specimens under different loading conditions, normalized by loading time. In the compression conditions (Figure 14a), the cumulative ringing count for axial compression was significantly higher than that for cubic compression, reflecting the persistence of defect activity frequency. In comparison, splitting tensile and four-point bending conditions consistently showed extremely low defect activity characteristics in Stage I, with concentrated events only occurring in the crack extension or failure stages, resulting in their cumulative ringing count curves remaining at the lowest level. However, the energy release pattern (Figure 14b) exhibits a significant difference: the cumulative energy release in the splitting tensile condition was the highest, with energy concentrated in the later stage. This phenomenon stems from the fiber pull-out and fracture behavior dominated by tensile stress, as well as the concentrated micro-crack expansion process, whose energy release intensity far exceeds the crack expansion caused by pore closure and squeezing during compression. Four-point bending and splitting tensile share similar damage mechanisms, but the stress distribution in bending is primarily concentrated in the bending region, leading to a progressive development of damage evolution. This progressive failure characteristic causes the energy release process to lack abruptness, and the overall release intensity is relatively low.

3.3. Frequency–Amplitude Characteristics Analysis

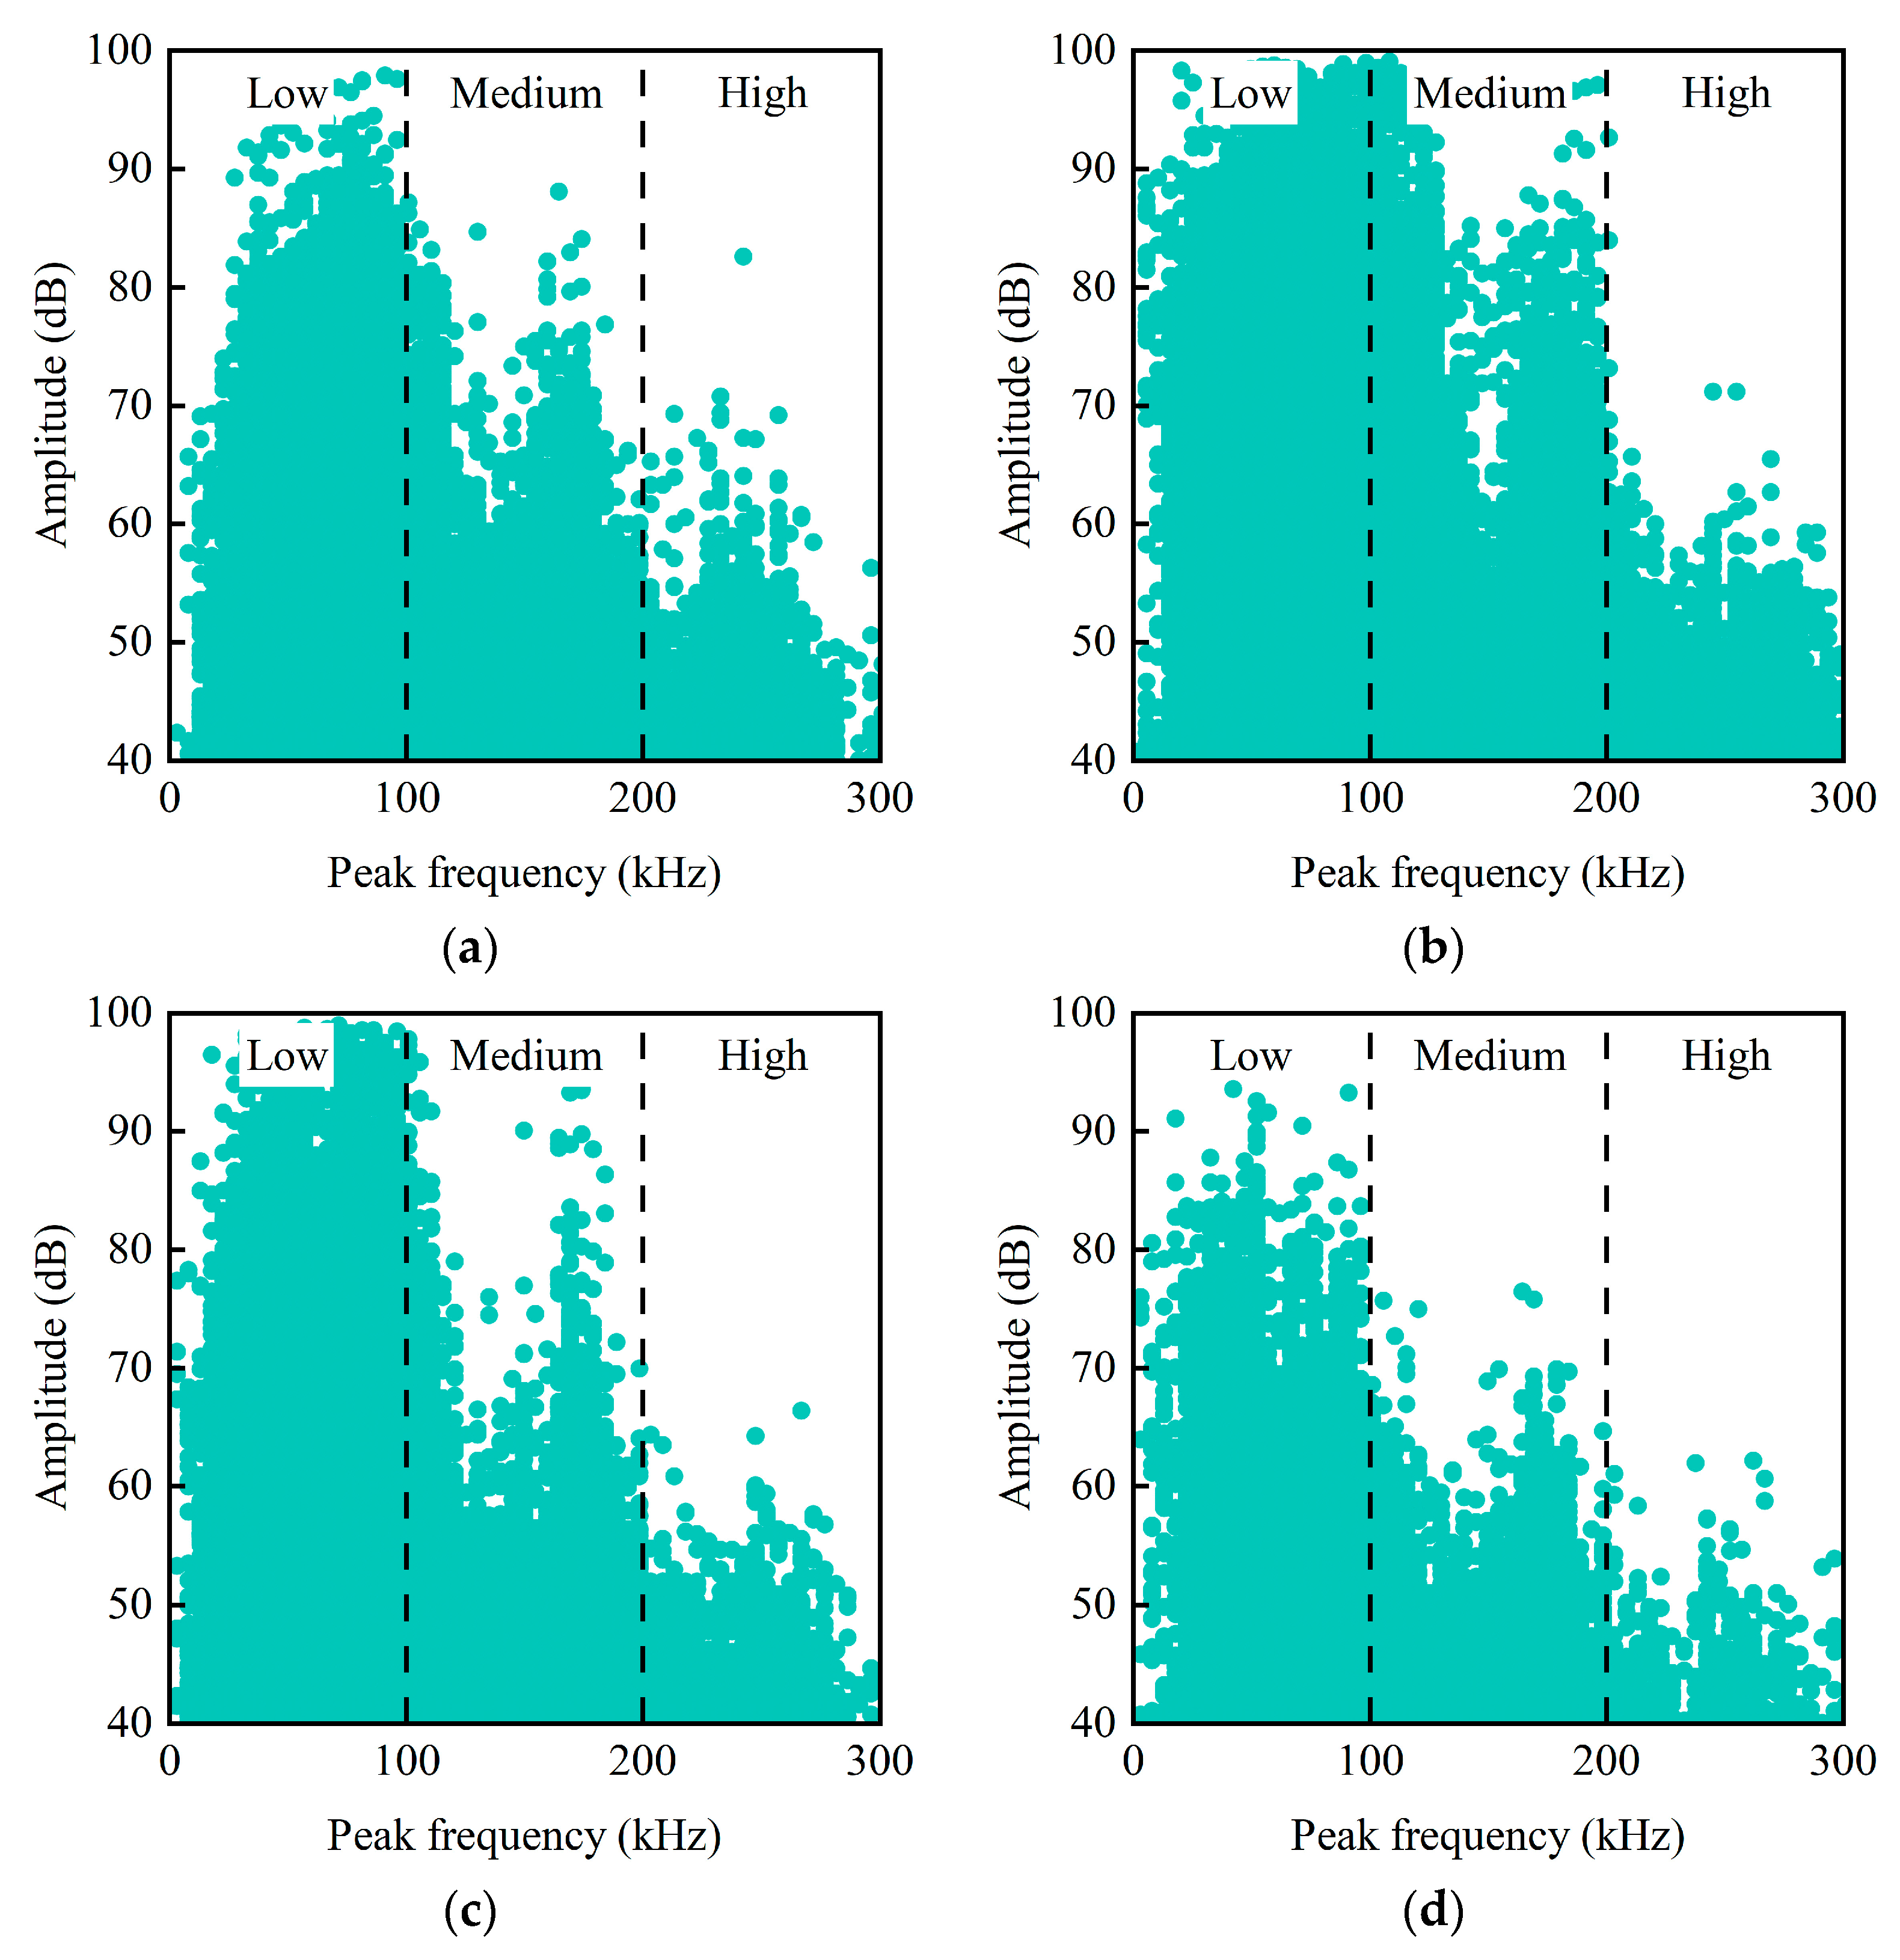
Peak frequency, as a key parameter in AE frequency domain analysis, can be used to characterize the scale features of crack expansion during material damage. Generally, low-frequency signals primarily correspond to macroscopic damage behaviors such as large-scale crack expansion or fiber-matrix interface debonding, while high-frequency signals reflect microscopic damage mechanisms like micro-crack initiation. To analyze the peak frequency characteristics of RPC specimens under different stress conditions, the AE signals were first subjected to denoising, and then the Fast Fourier Transform (FFT) was used to extract the peak frequency for each specimen. Figure 15 intuitively presents the peak frequency–amplitude distribution relationship of the RPC specimens during the loading process. From the spectral features, it is observed that high-amplitude AE events are primarily concentrated in the low-frequency region, while the signal amplitudes in the high-frequency region are generally low. This phenomenon validates the correspondence between damage scale and frequency distribution—low-frequency signals generated by large-scale crack expansion have higher oscillation amplitudes, while high-frequency signals induced by small-scale damage show dispersed amplitude characteristics. Based on this distribution pattern, this paper divides the peak frequency into three regions: low-frequency (0–100 kHz), medium-frequency (100–200 kHz), and high-frequency (200–300 kHz).
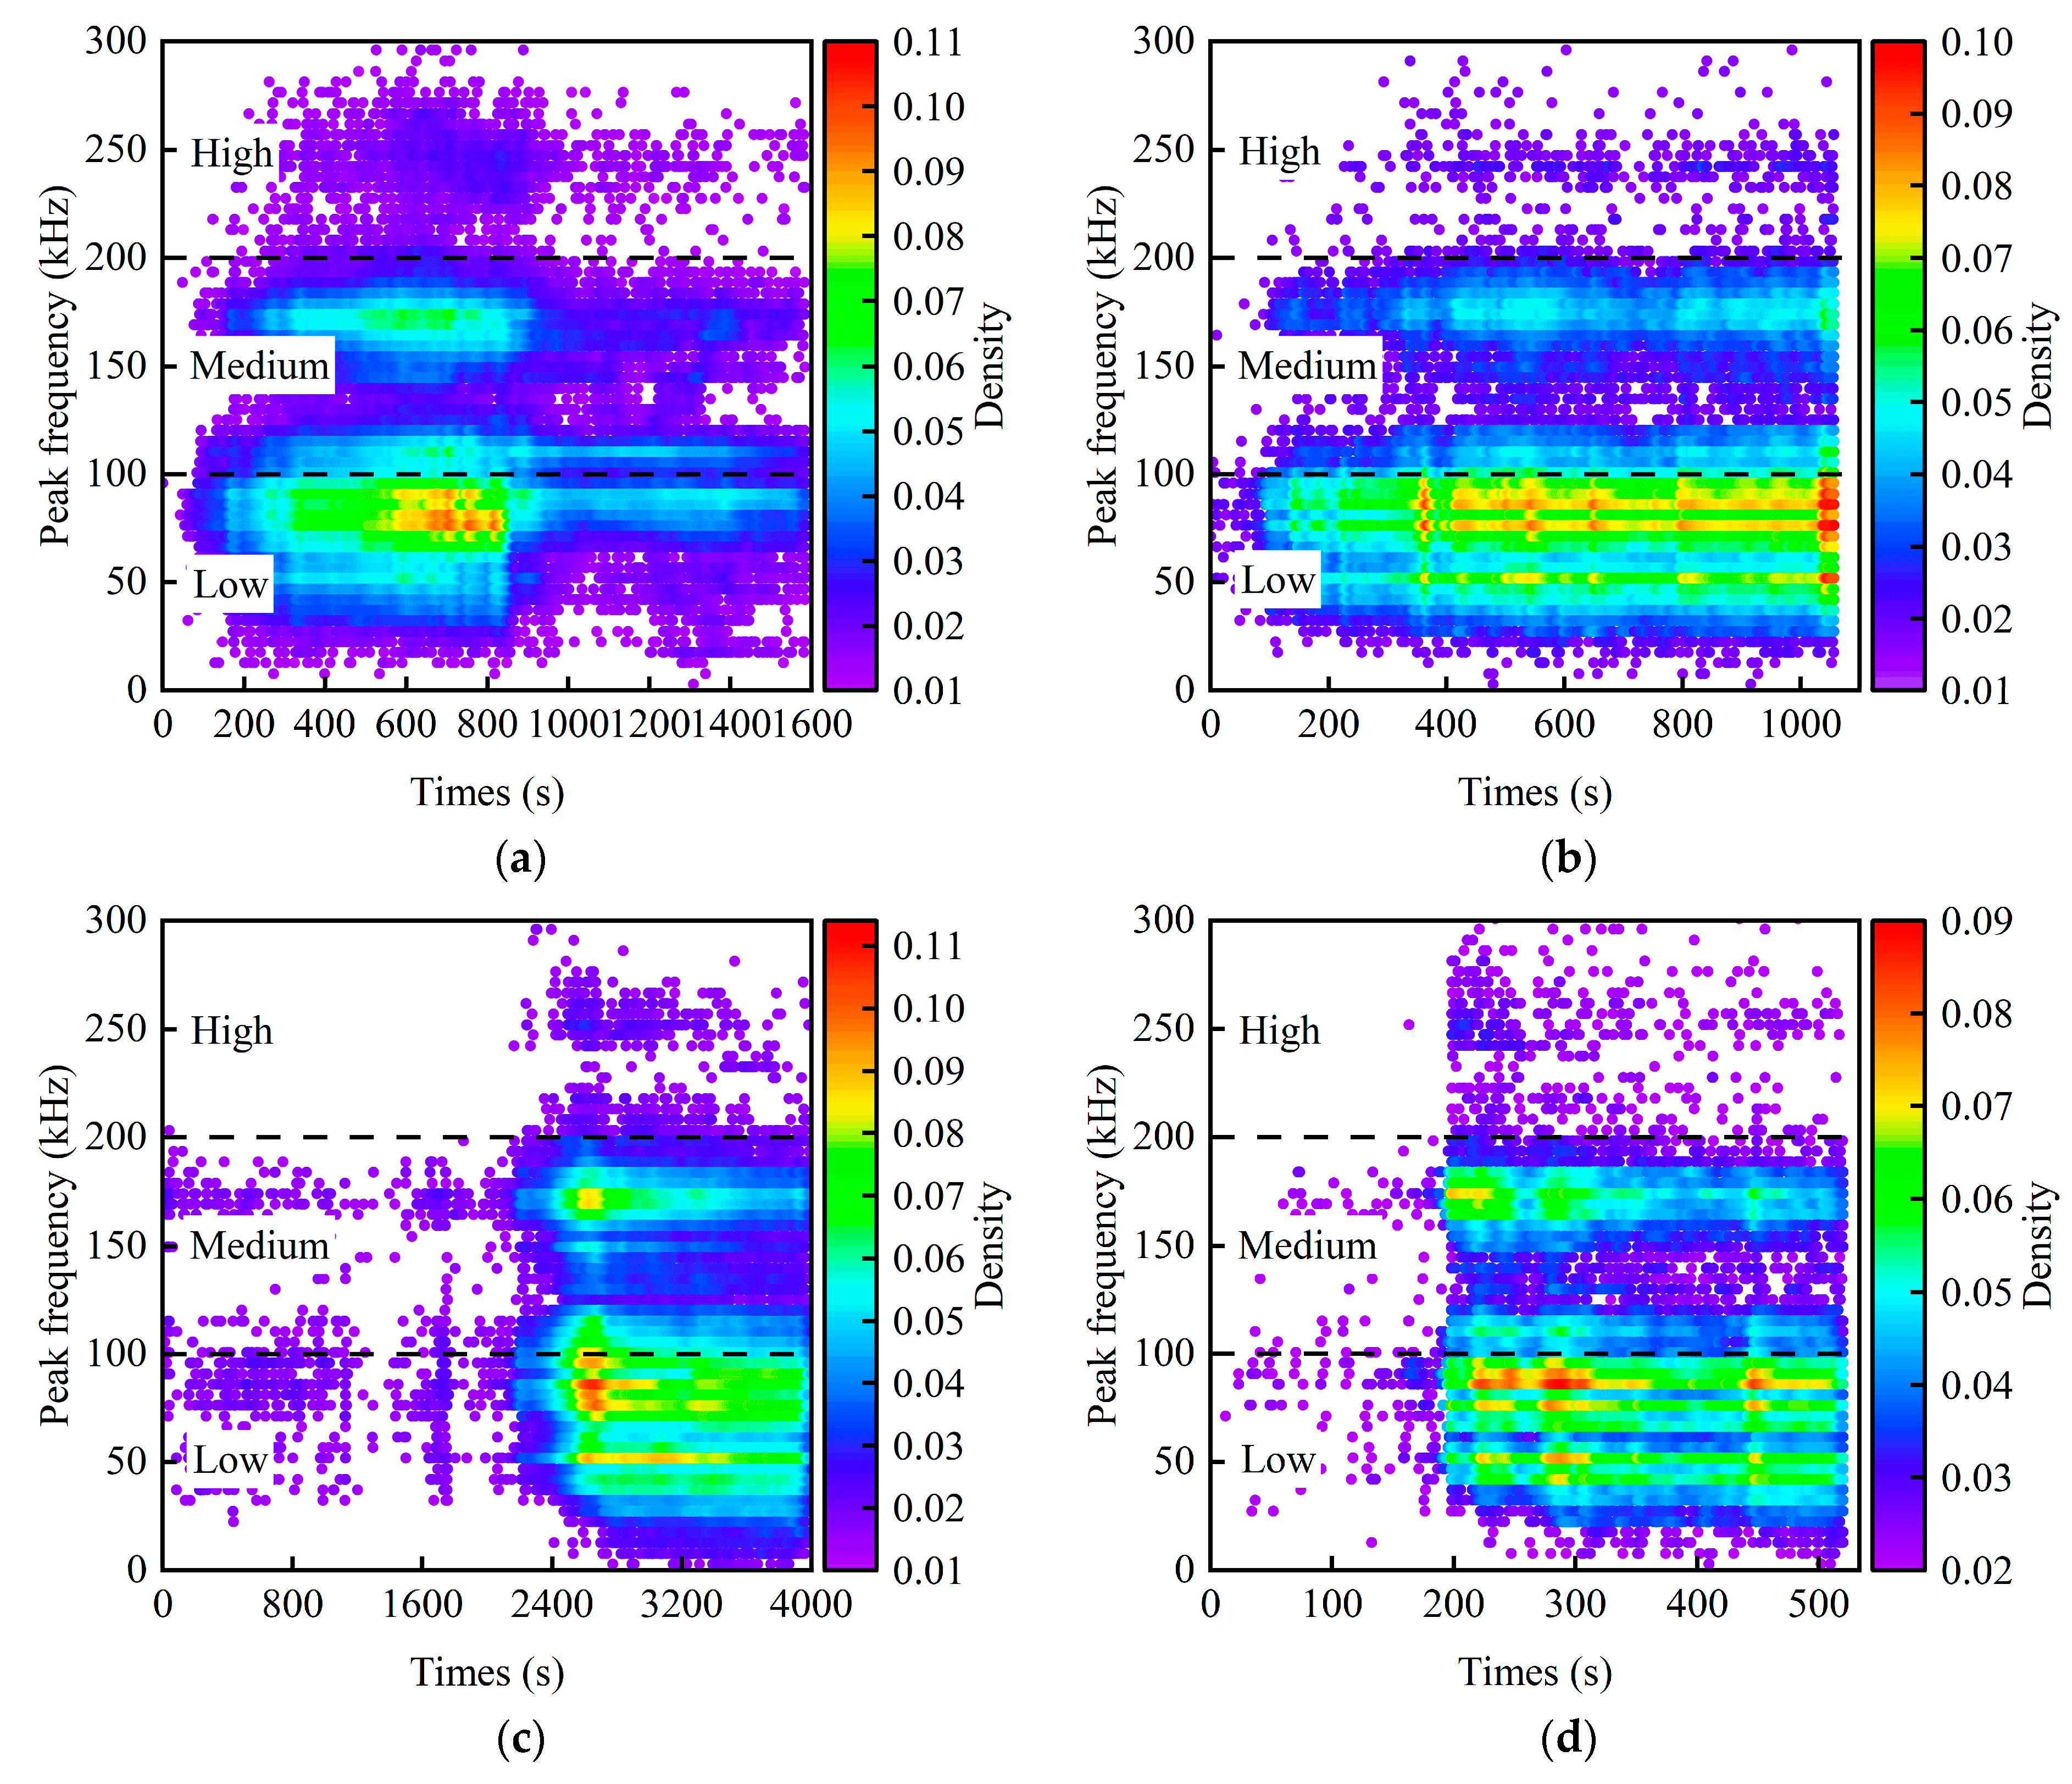
To more clearly reflect the damage severity and form of each specimen during the failure process, Figure 16 plots the density distribution of the peak frequency over time. From the event characteristics, it is observed that the cubic compression specimen showed concentrated event bursts in the crack extension stage, the axial compression specimen exhibited continuous damage activity throughout the entire loading process, the splitting tensile specimen’s events were concentrated near the peak stress, and the bending specimen continued to generate damage events after crack initiation. This event burst pattern is consistent with the previously described concentrated increase stages of ringing count and energy, indicating that the AE characteristics during the damage active period have multi-parameter consistency. In terms of frequency domain characterization of the damage mechanism, the cubic compression specimens exhibited a relatively higher proportion of high-frequency signals (>200 kHz), which is statistically associated with the micro-crack initiation and development stages prior to failure. In contrast, the splitting tensile specimens showed a concentration of low-frequency signals (<100 kHz), potentially reflecting macroscopic damage characteristics such as steel fiber-matrix interface debonding and matrix fracture. Furthermore, the axial compression specimens demonstrated a notable increase in the 50–100 kHz frequency band; this phenomenon is likely linked to the complex failure processes involving steel fiber interactions, which may be influenced by the reduced lateral constraint inherent to the specimen’s slenderness ratio. Notably, the persistence of low-frequency signals in the bending specimen indicates its progressive damage evolution characteristic, where the composite failure mode of macroscopic matrix spalling and steel fiber fracture leads to the prolonged continuation of damage events. The correlation between these frequency domain features and mechanical response validates the effectiveness of AE parameters in damage mechanism identification, providing key spectral evidence for the failure mode analysis of RPC material.
It should be noted that due to the complexity of the internal structure of RPC and the attenuation and reflection of acoustic emission waves during propagation, the peak frequency does not completely correspond to the physical damage mechanism. The correlation obtained in the above study is a statistical trend based on a large amount of experimental data.

3.4. RA–AF Distribution Analysis

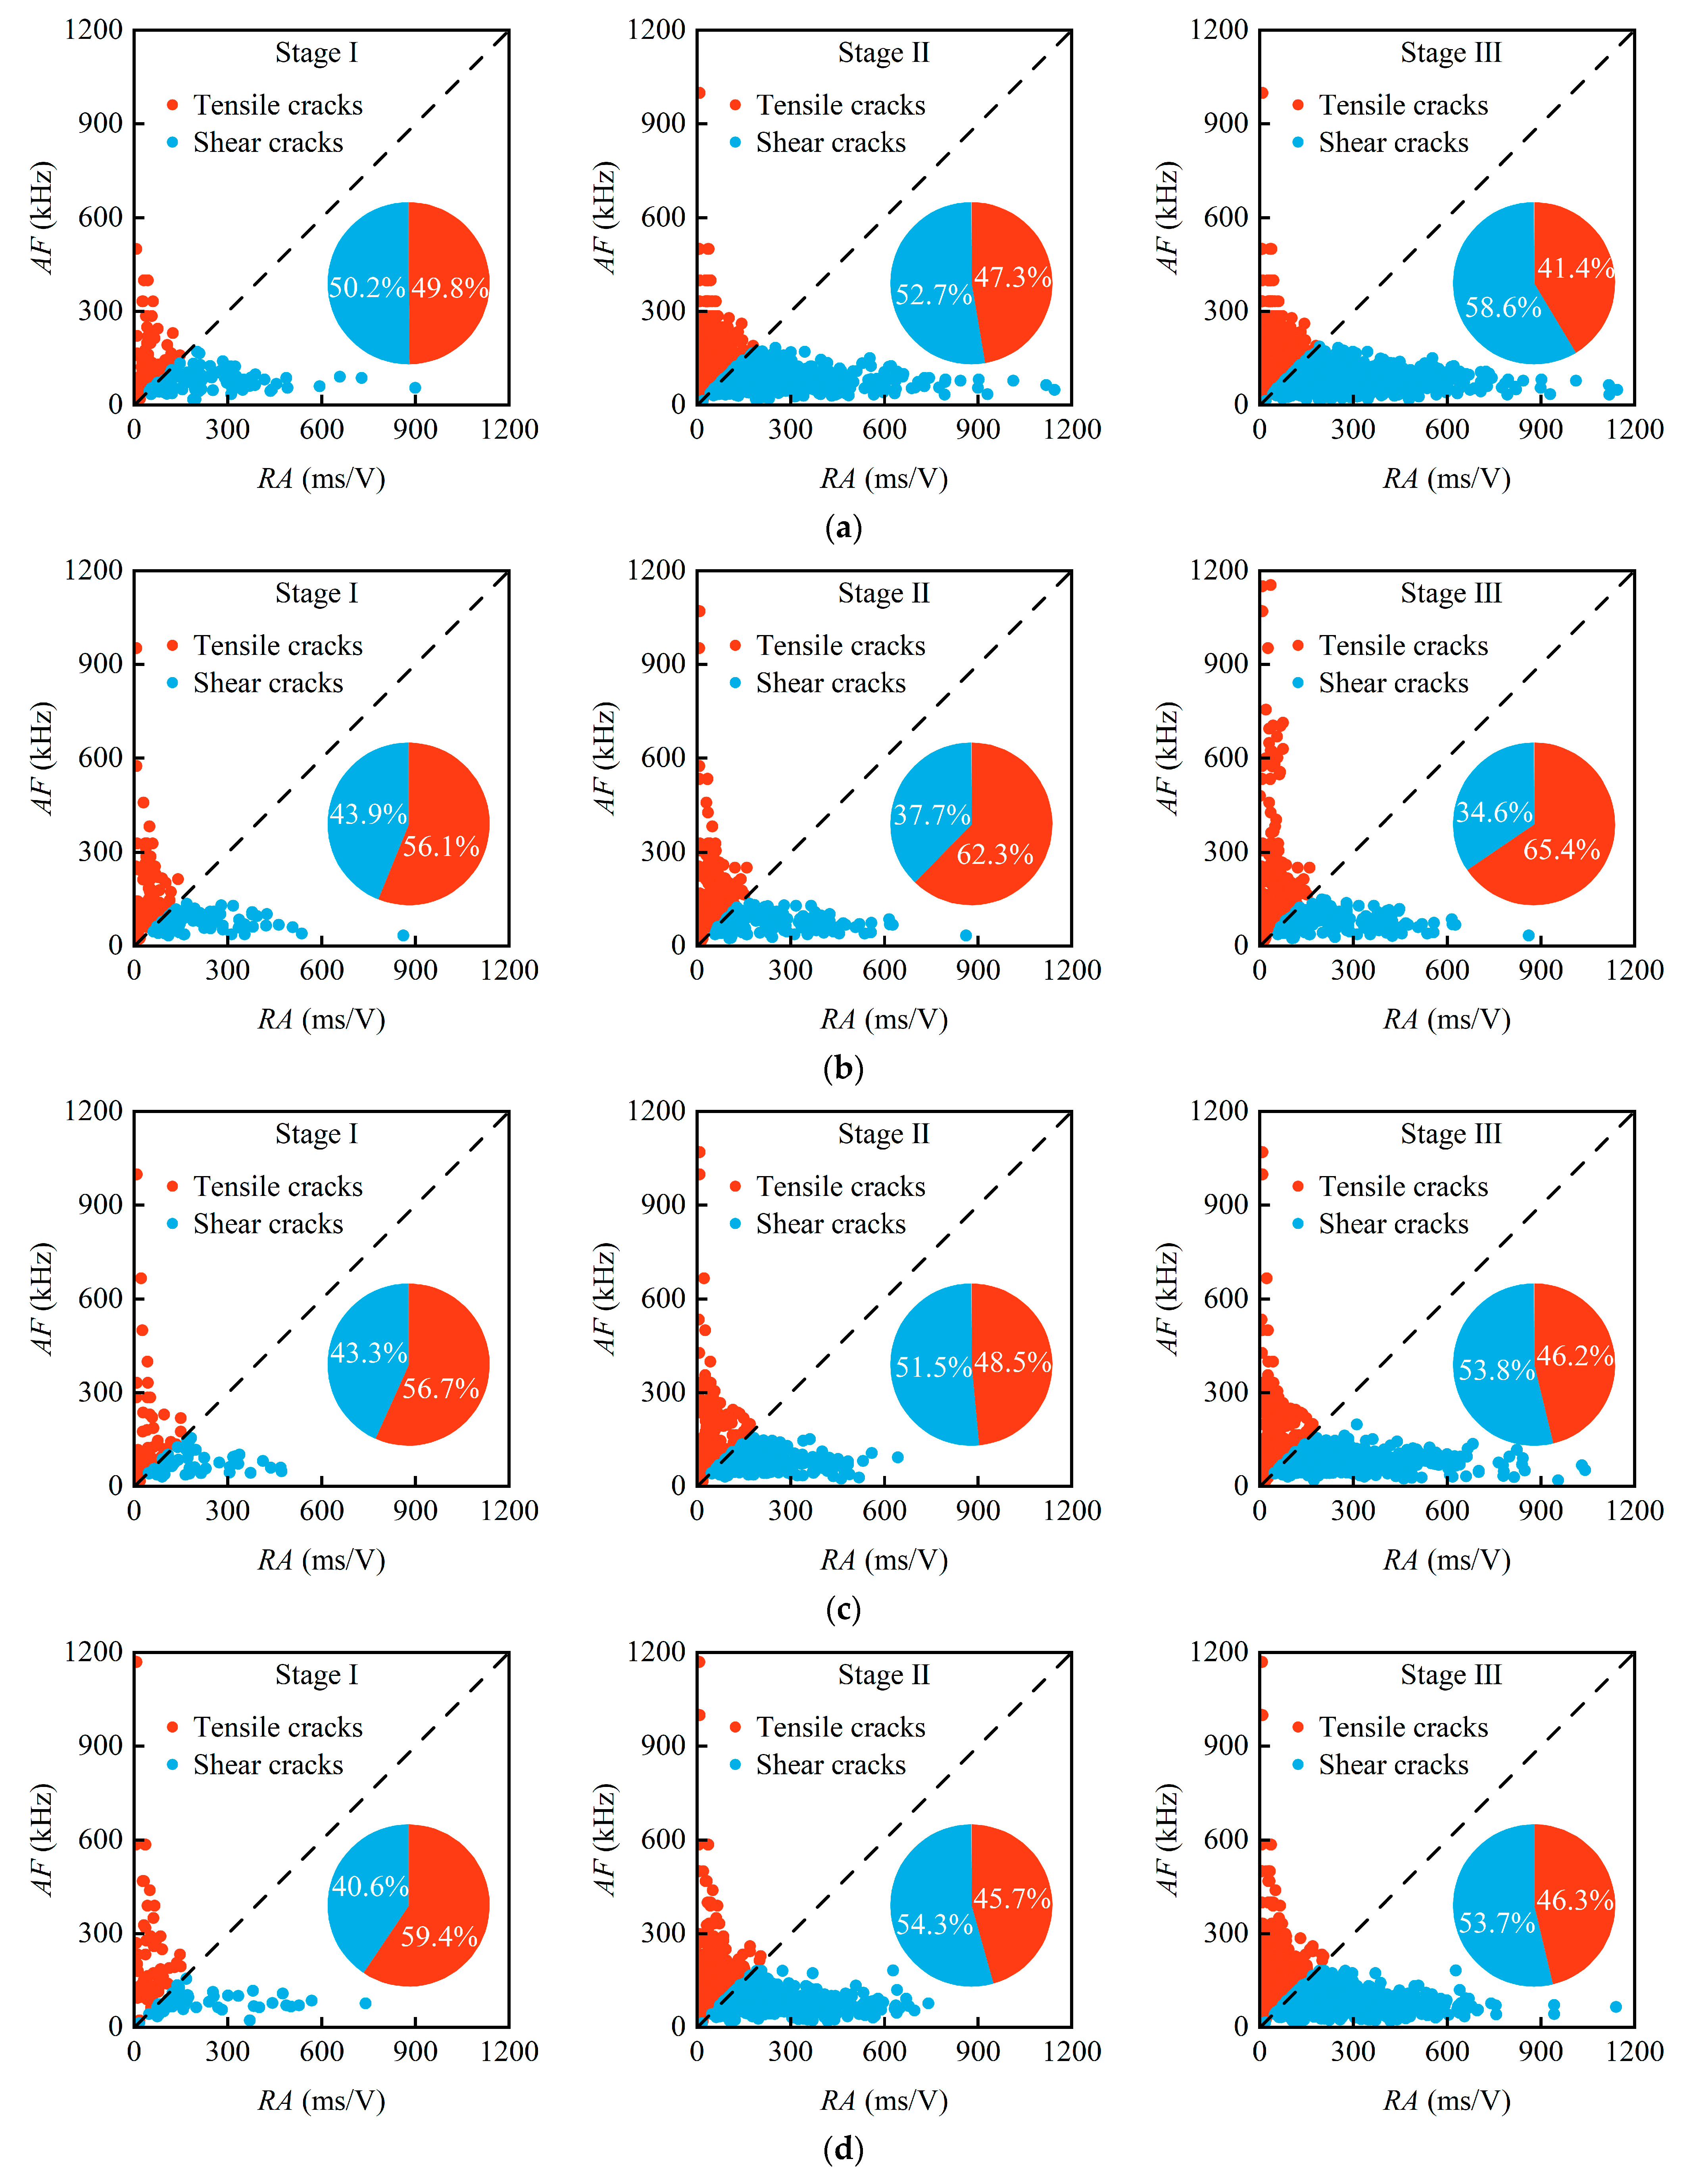
Figure 17 shows the RA-AF distribution plots for each RPC specimen at different damage stages and displays the crack proportion during the damage process. Analyzing both together provides a good reflection of the crack evolution within the core concrete. From Figure 17a, it is observed that, under cubic compression, the RA-AF distribution in Stage I presented uniform characteristics, with a balanced proportion of shear and tensile cracks, reflecting uniform and stable crack development in the material during this stage. Upon entering Stage II, as a large number of cracks initiated, the RA-AF distribution density significantly increased; low AF and high RA signals increased simultaneously, indicating that a large number of internal cracks began to generate in the specimen, and tensile cracks started to transition towards shear cracks. Finally, in Stage III, the proportion of shear cracks increased sharply and became dominant, causing the specimen to end in a shear failure mode. This evolution pattern is closely related to the unique spatial constraint conditions of cubic compression. In comparison, the damage process in the axial compression condition was consistently dominated by tensile cracks (Figure 17b), which reflects its suddenness and instability of failure. In the splitting tensile and four-point bending conditions (Figure 17c,d), the damage evolution exhibited similar stage characteristics. In Stage I, the matrix was primarily influenced by bending tension, and its damage was dominated by tensile cracks. In the subsequent failure stages (Stage II and Stage III), the steel fibers began to bear the load, and shear failure behaviors began to increase continuously.
Based on the analysis above, the incorporation of steel fibers effectively altered the material’s failure mechanism. Although crack initiation was dominated by tensile stress in all cases, the bridging action of steel fibers changed the stress field distribution at the crack tip after being loaded. The interface debonding and pull-out processes between fibers and the matrix can cause stress concentration and frictional resistance on the contact surface, transferring local tensile stress to shear-dominated stress paths and inducing local shear deformation, thereby increasing the proportion of shear cracks [60,61]. At the same time, steel fibers absorb energy through their own tensile deformation under loading to limit the expansion of crack width, effectively inhibiting the formation of a single penetrating tensile crack [62,63], a phenomenon that has been verified [64]. Therefore, although tensile failure predominated in the RPC specimen under axial compression due to the weakening of lateral constraint, the specimen still remained intact without complete fracture.

3.5. b-Value Analysis

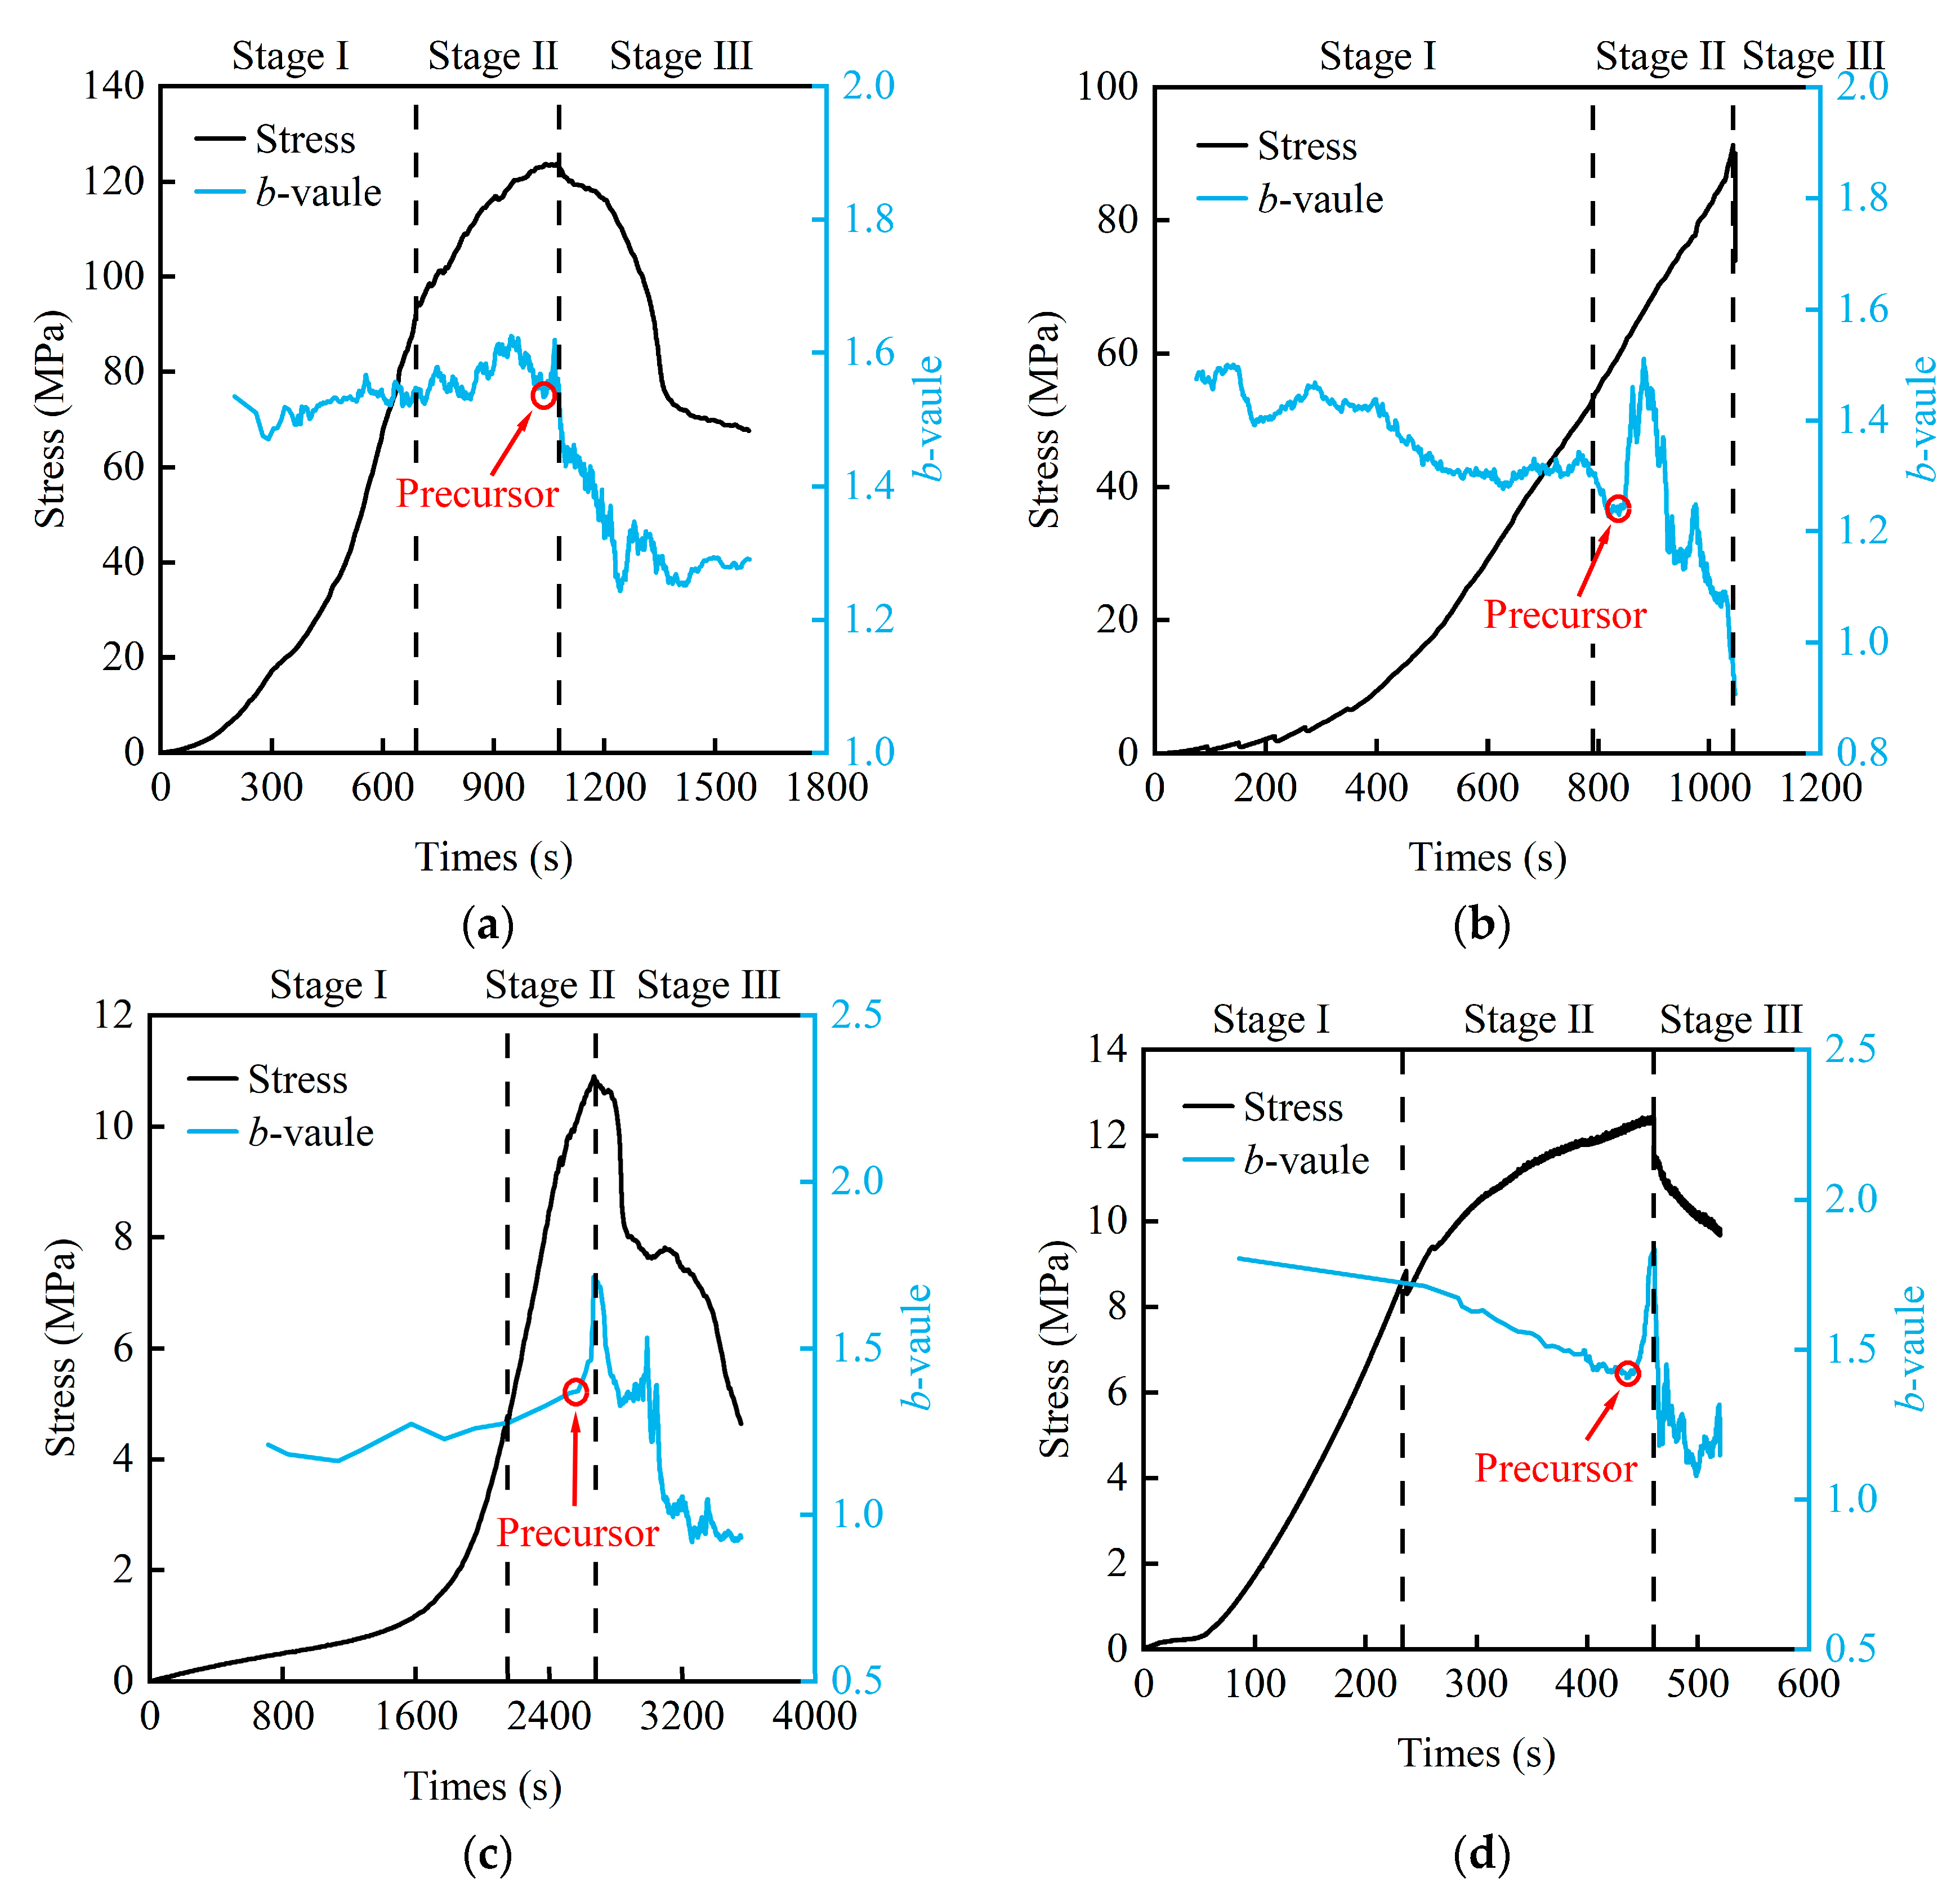
The AE b-value can be used to analyze the scale distribution ratio of AE event magnitudes, measuring the relative number of rupture events of different magnitudes during the internal damage process of the material. It is an effective tool for analyzing and judging material failure precursor information. When the b-value increases, it indicates that small-scale rupture events are dominant; a decrease in the b-value reflects the accumulation of large-scale rupture; and small fluctuations in the b-value usually correspond to the progressive and stable failure process of the material, while its abrupt drop precedes the occurrence of sudden, unstable failure.
Figure 18 shows the evolution characteristics of the AE b-value over time. In the cubic compression condition, the b-value remained stable and showed a slow upward trend in Stage I, where the specimen was dominated by elastic deformation. When the damage entered Stage II, the b-value began to show fluctuating changes, marking the initiation of unstable rupture damage inside the specimen. Subsequently, a sudden sharp increase followed by a rapid drop in the b-value occurred just before the peak; this turning point (the precursor point) marked the initiation of irreversible failure. Finally, in Stage III, the b-value decreased rapidly and appeared densely, indicating that the micro-cracks generated earlier had continuously developed and accumulated, forming large-scale macroscopic fracture surfaces, and the specimen was completely in an unstable failure state. For the axial compression condition, the b-value maintained a higher value in Stage I but then showed a continuous downward trend, reflecting the accumulation of small-scale rupture events dominated by crack expansion. The precursor point appeared early in Stage II, and the sharp increase in failure scale led to a rapid drop in the b-value, resulting in sudden failure of the specimen. The splitting tensile and bending specimens showed stable behavior with fewer data points in Stage I. In Stage II, the splitting tensile specimen’s b-value first increased and then dropped abruptly, corresponding to the occurrence of instantaneous failure; the bending specimen’s b-value continuously decreased, indicating that the main damage was concentrated in this stage. Upon entering Stage III, the splitting tensile specimen’s b-value dropped significantly and fluctuated violently, reflecting the uncontrollability of the failure process; the bending specimen maintained smaller fluctuations, and its progressive failure characteristic was more apparent.
In summary, the evolution characteristics of the b-value can effectively reflect the damage process of the four groups of specimens. The decreasing trend of the b-value in the crack extension stage can serve as an important precursor information for the unstable failure of the specimen. Based on the above results, it is found that the occurrence law of the precursor points of specimen failure under various loading conditions is consistent. Under cubic compression, the b-value of the specimen shows the smallest fluctuation in Stage II, and it increases by 7% to reach the maximum value after five windows from the precursor point, followed by a sharp drop. The increase in the b-value under cubic compression after the precursor point is the smallest. Therefore, when the increase amplitude of the b-value exceeds 7% within five consecutive windows, it can be determined that the specimen has experienced macroscopic unstable failure during this period.

3.6. AE Multivariate Parameters Stage Feature Identification

Based on the Python language, the IVY was employed to optimize two supervised machine learning algorithms, Random Forest (RF) and Extreme Gradient Boosting (XGBoost), respectively, to construct the AE parameter stage feature identification model. The parameter setting ranges for the RF and XGBoost identification models are provided in Table 7. Since the b-value cannot correspond precisely to every moment, the AE parameters—ringing count, energy, peak frequency, RA, and AF—were used as input parameters (Randomly select 2500 sets of data). The compaction and elastic stage (Stage I), crack extension stage (Stage II), and failure stage (Stage III) were set as classification categories, represented by 1, 2, and 3, respectively, in the algorithm. Among them, the setting of labels for each stage comprehensively considers the stress–strain relationship and the thresholds of AE parameters (ringing count and energy). Specifically, when the real-time stiffness of the specimen in the linear elastic stage decreases by more than 5% of the initial stiffness, or the acoustic emission ringing count and energy show an exponential surge, it is considered that the internal microcracks of the specimen start to propagate unstably, entering Stage II. The peak strength of the stress is taken as the boundary; once exceeded, the specimen enters Stage III. This setting combining mechanical and acoustic characteristics reduces errors caused by a single mechanical index or environmental factors, and improves the accuracy of model recognition.
After completing the label setting, the labels were combined with feature values to form the sample dataset. The commonly used ratio of training set to test set ranges between 7:3 and 8:2 [65]; therefore, 80% of the experimental data was randomly selected as the training set, and the remaining 20% as the test set. In addition, considering the relatively limited number of samples and the high dimensionality of acoustic emission (AE) features, the algorithm model is highly prone to overfitting to the training data, which is manifested by extremely low training error but significantly increased generalization error, leading to certain limitations in the analysis results [66]. Conducting 5-fold cross-validation can avoid the overfitting problem of the training set caused by unreasonable dataset division. The optimal parameters were then sought using the IVY algorithm, and finally, classification was performed using the RF and XGBoost models.
To verify the advancement of the IVY algorithm in hyperparameter optimization, its performance was further compared to that of other commonly used optimization algorithms, as shown in Table 8. It can be observed that the IVY optimization algorithm exhibits significant advantages in both computational efficiency and prediction accuracy.
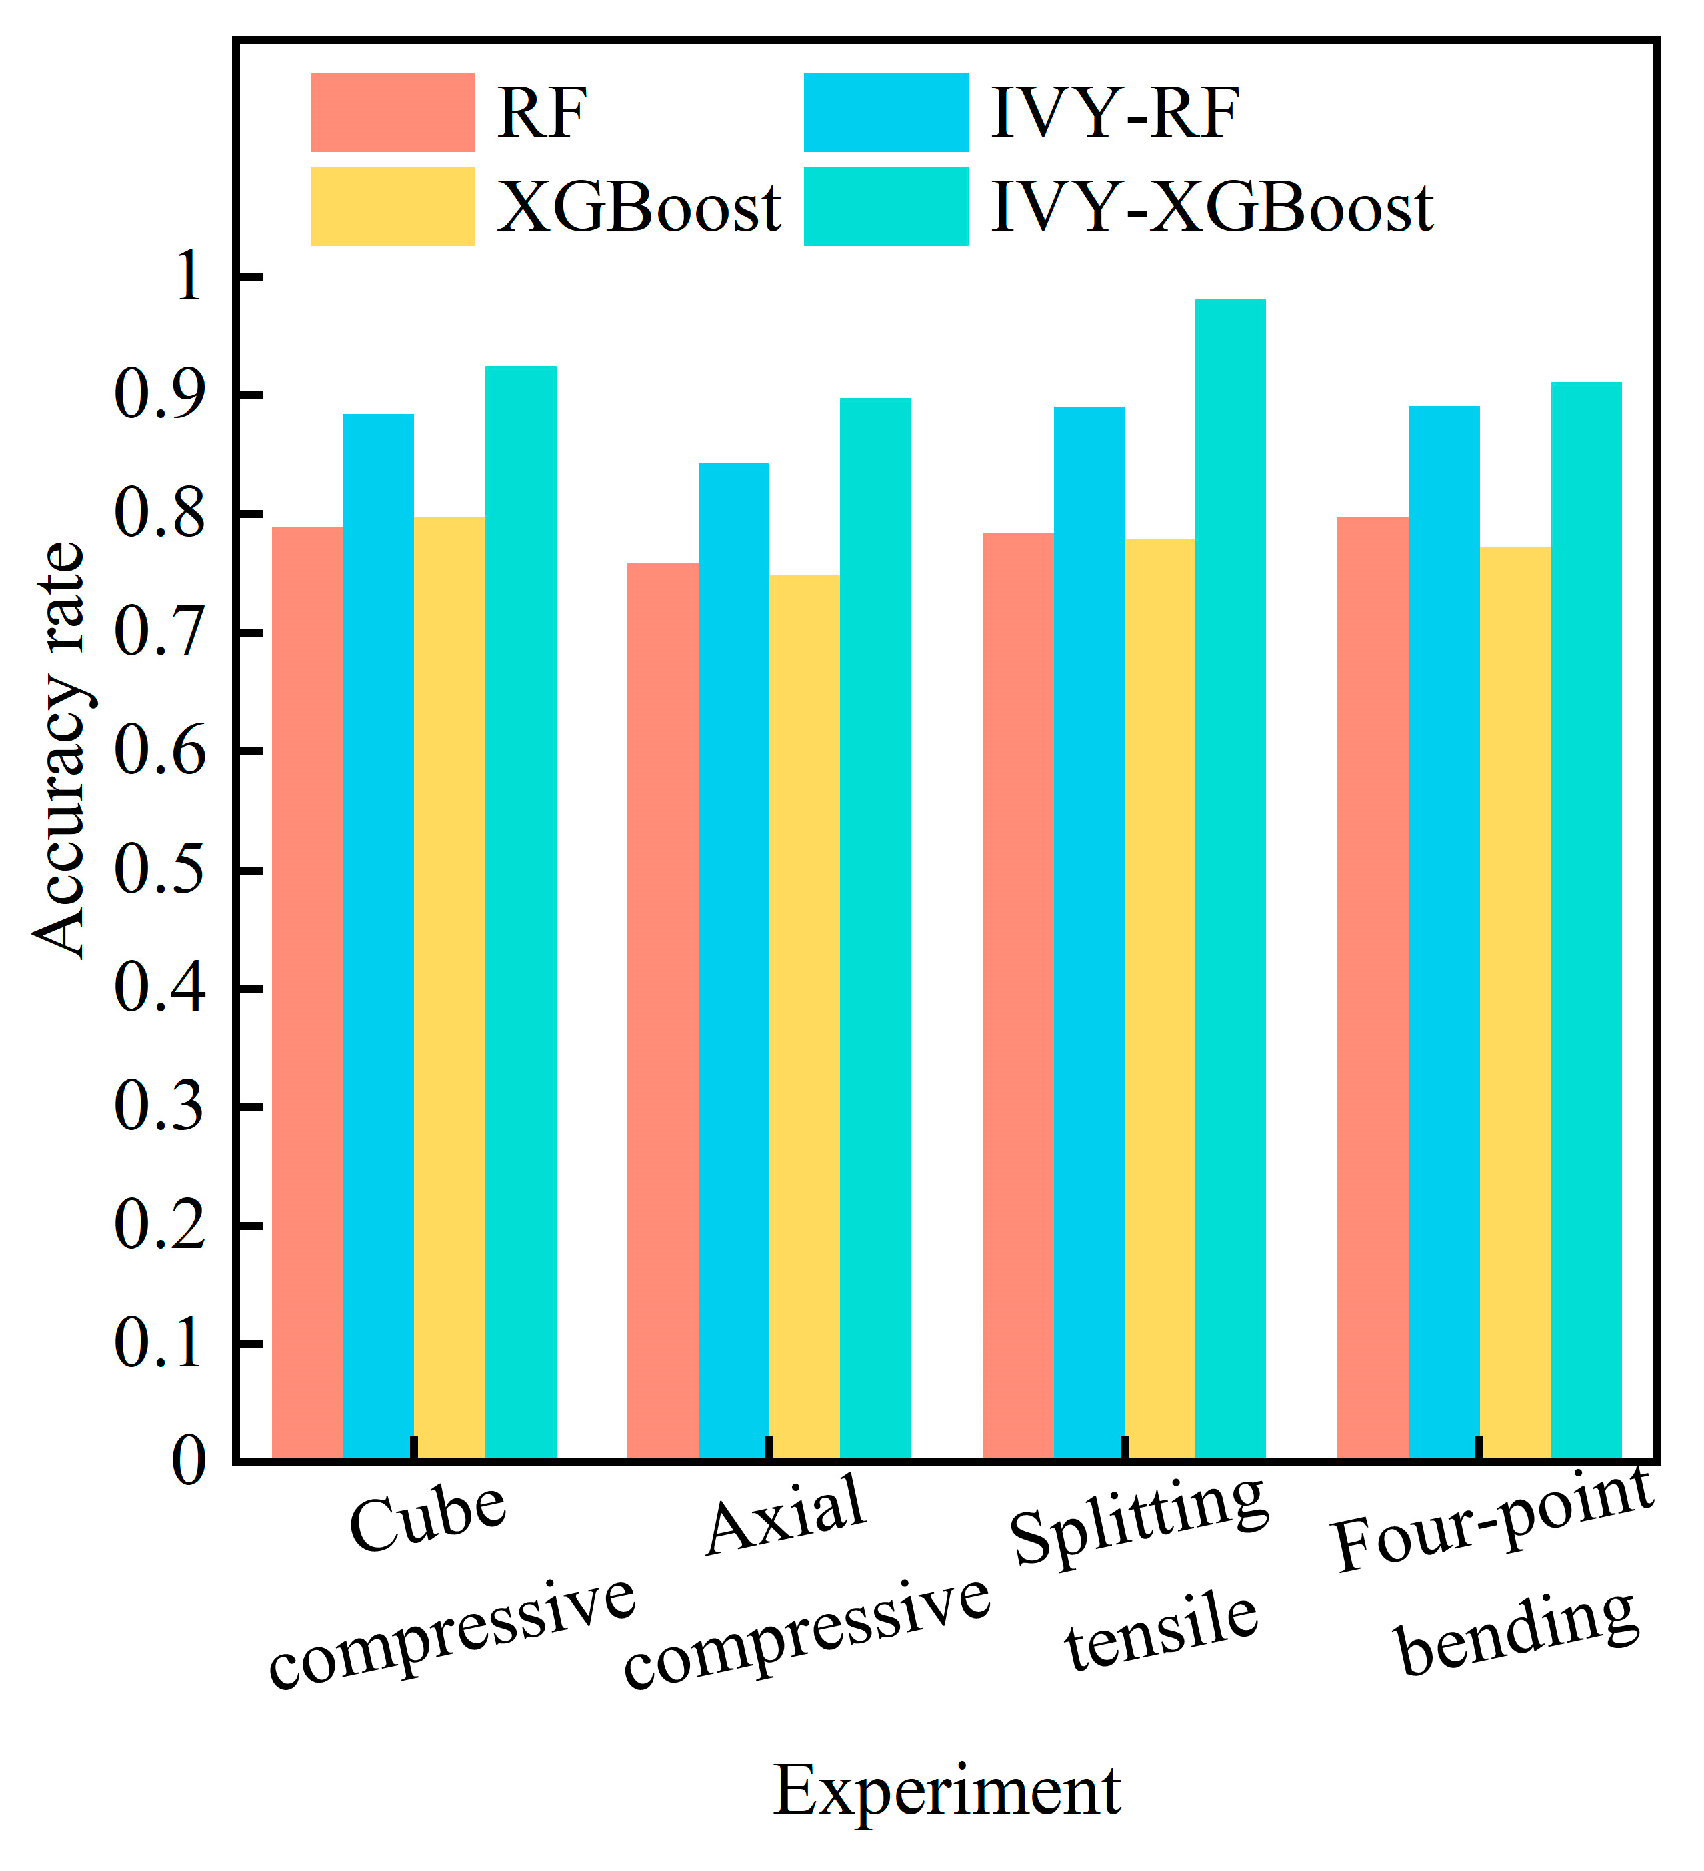
The IVY-optimized RF and XGBoost algorithm models were used to perform stage classification on the dataset composed of AE parameters. By comparing the results with the actual AE parameter labels, relevant model evaluation metrics were obtained. Figure 19 shows the classification accuracy of the optimized and unoptimized models for RPC specimens under different loading conditions. The results indicate that the accuracy of all models exceeded 75%, and the model recognition accuracy improved significantly after optimization by the IVY algorithm, with the highest increase reaching 26%.
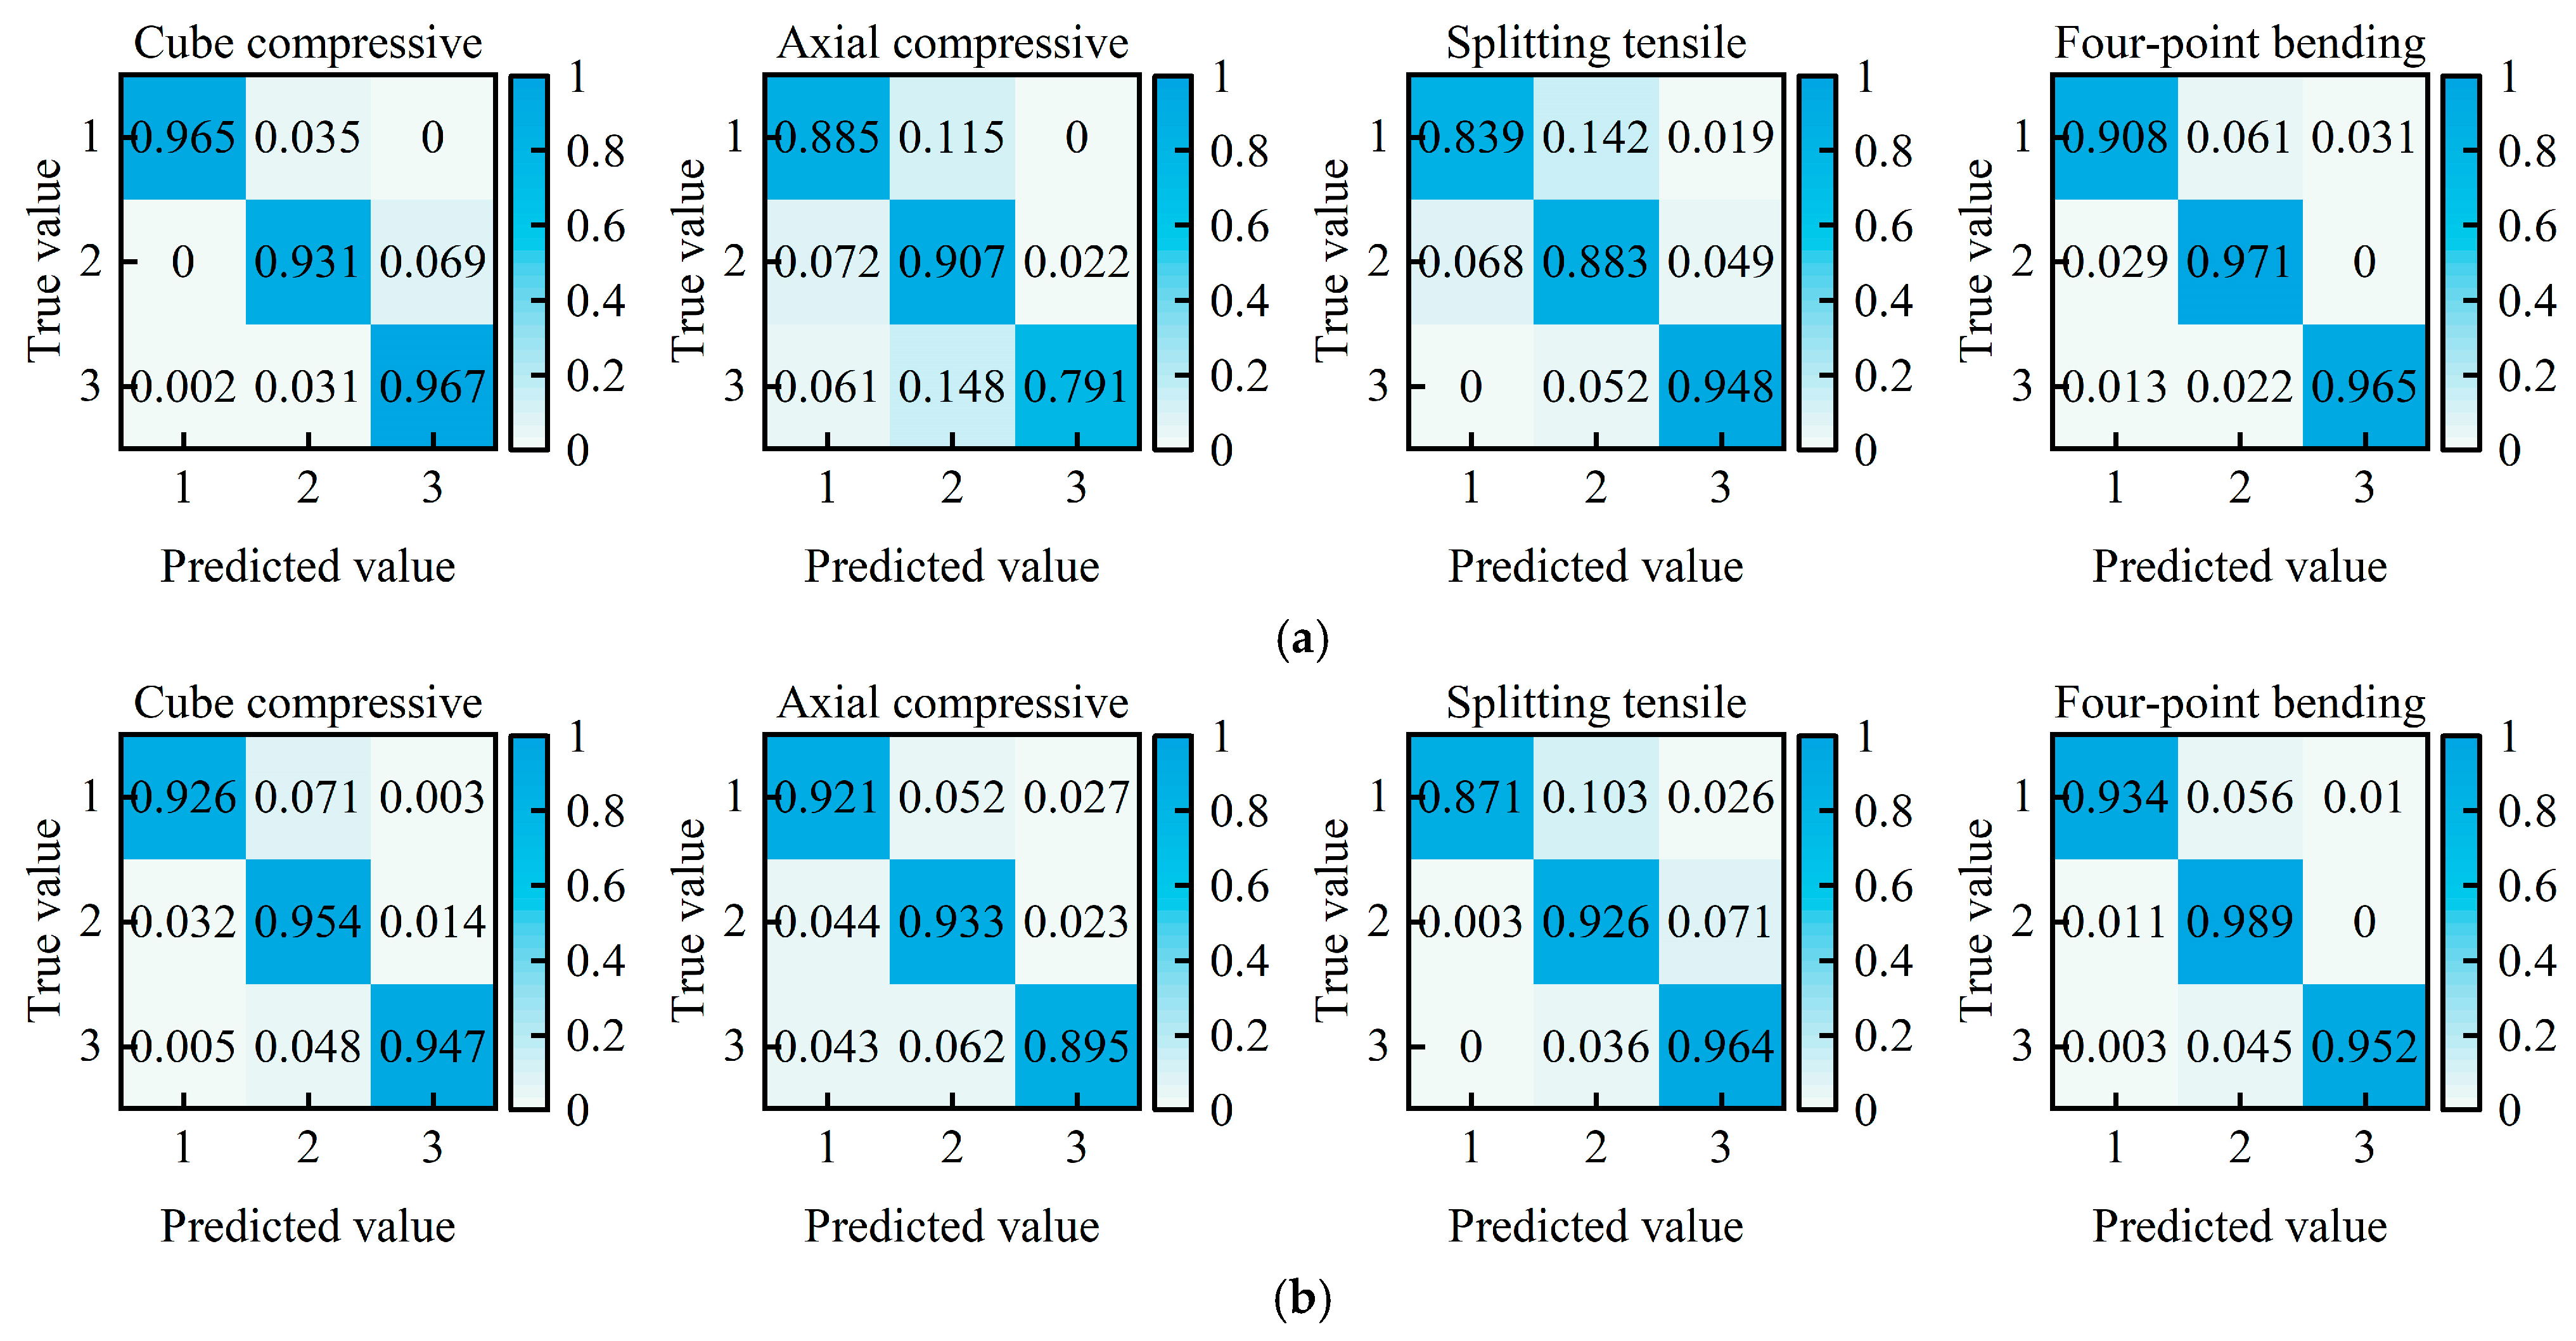
To further analyze the classification performance of the model, Figure 20 provides the confusion matrices for the two optimized models. The results show that, under axial compression, the model’s identification performance for the compaction and elastic deformation stage (Stage I) was superior to the failure stage (Stage III). In contrast, under splitting tensile and four-point bending conditions, the recognition accuracy of Stage I was relatively low, while the identification performance for Stage II and Stage III was better. This difference primarily stems from the overlap in AE characteristic parameters between Stage I and the other stages, which leads to potential confusion during model judgment in this stage. Overall, the IVY-XGBoost model’s overall recognition performance is superior to the IVY-RF model. These results validate that the constructed IVY-XGBoost stage feature identification model can effectively distinguish the damage evolution stages of RPC specimens under different loading modes, possessing good classification accuracy and potential engineering applicability.
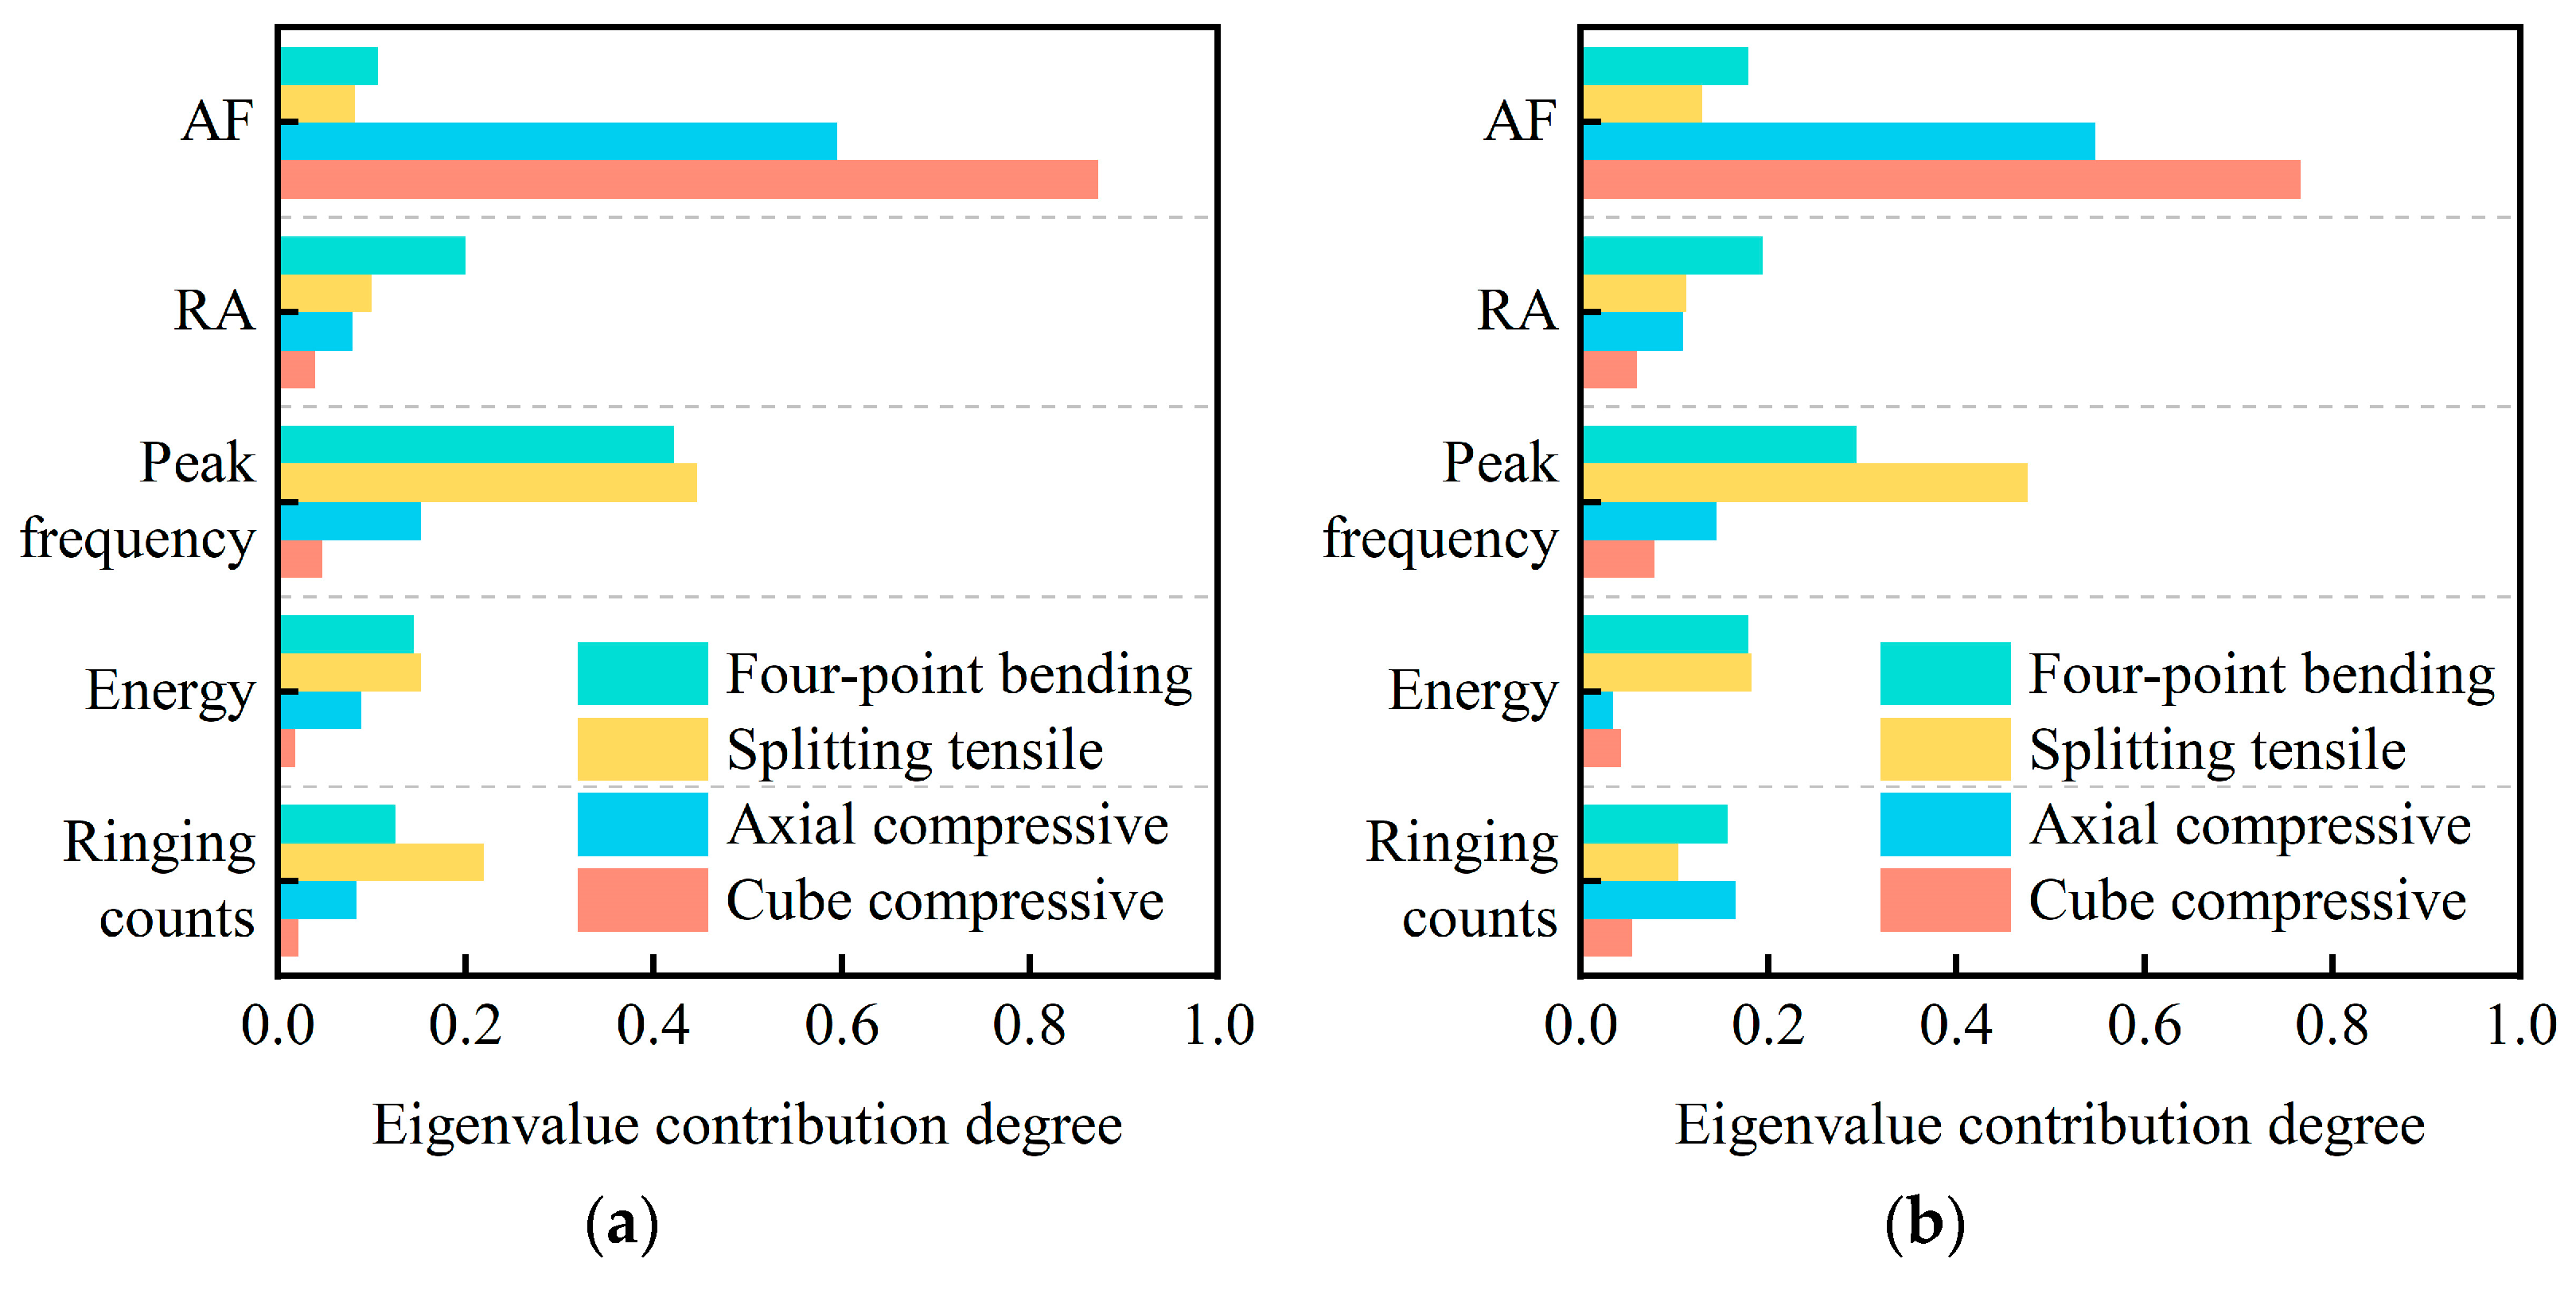
As shown in Figure 21, the importance distribution of characteristic values was consistent in both optimized models. Under cubic compression and axial compression, AF (Average Frequency) contributed the most significantly to the identification of damage stages, with importance reaching 87.3% and 59.5%, respectively. Under splitting tension and four-point bending, peak frequency became the dominant feature, accounting for 42.2% and 47.6% of the importance, respectively. This difference reveals the significant differences in damage evolution mechanisms under different stress modes: during the compression of RPC, the slip between steel fibers and the matrix as well as the shear failure of the matrix generate a large number of continuous signals, leading to an increase in the Average Frequency (AF). In contrast, under tension and bending, cracks expand rapidly, producing sudden signals mostly caused by matrix fracture. The damage characteristics are more reflected in the natural frequency attributes of the vibration signals—specifically, the Peak Frequency can better characterize the signal spectrum features excited by large-scale failure behaviors such as fiber fracture and interface debonding.

4. Conclusions

RPC is a highly promising engineering material, with significantly different failure scale and uncertainty compared to ordinary concrete. Its catastrophic failure has a significant impact on the safe operation of engineering projects. Based on this, AE monitoring tests were conducted on RPC specimens under uniaxial compression, axial compression, splitting tension, and four-point bending conditions. The evolutionary laws of AE signals during the failure process were statistically analyzed, and damage stage identification models optimized by the IVY for RF and XGBoost were established. The main conclusions are as follows:
(1)
Under cubic compression, splitting tension, and four-point bending conditions, stress drop phenomena occur in the stress–strain curves before the peak, which can effectively delay the occurrence of ultimate failure. In contrast, under axial compression, the curves show sharper peak points, with more significant brittle failure. RPC exhibits the highest ductility and damage resistance under four-point bending, and the weakest under axial compression.
(2)
Based on the stress–strain curve, as well as the evolution of AE energy and ringing count, the damage process of RPC specimens can be divided into three stages: compaction and elasticity, crack propagation, and failure. In the pre-peak stage, signal release under axial compression is more significant than that under cubic compression. For splitting tension, the ringing count and energy concentrate in the crack propagation stage; under bending conditions, the ringing count and energy continue to rise in the failure stage.
(3)
Cubic compression specimens have the highest proportion of high-frequency signals (>200 kHz), corresponding to microcrack initiation before failure. Splitting tension specimens have the most concentrated low-frequency signals (<100 kHz), reflecting the large-scale damage characteristics of steel fiber fracture and matrix interface debonding. The RA-AF distribution indicates that the incorporation of steel fibers effectively inhibits the formation of a single through-type tensile crack. The downward trend of the b-value can serve as important precursor information for the rupture and instability of specimens. When the b-value reaches the minimum and tends to stabilize, the specimens undergo ultimate failure.
(4)
The accuracy of the XGBoost model optimized by the IVY is improved by 26%, showing the best performance, which can effectively identify the damage evolution stages of RPC specimens under different loading modes. The dominant characteristic parameters vary under different loading conditions: under compression-dominated stress, AF contributes significantly to the identification of damage stages; under tension-bending dominated stress, peak frequency becomes the dominant feature. This reflects the significant differences in the mechanisms of damage evolution under different stress modes.
In future practical engineering, for the acoustic emission monitoring of RPC structures, it is recommended to adopt a grid-based arrangement of sensors to cover key stress-bearing and crack-prone areas. Meanwhile, the efficient machine learning model proposed in this study can be utilized to achieve real-time monitoring and early warning of the damage state of large-scale structures. Although there are differences in size between actual engineering structures and laboratory specimens, the physical evolution law of material failure is consistent. By optimizing the model parameters for specific engineering environments, technical support can be provided for the long-term safe operation of RPC structures.


Author Contributions

Conceptualization, S.L.; methodology, D.X. and S.L.; software, D.X. and S.L.; validation, B.L. and X.Z.; formal analysis, W.X.; resources, S.L.; writing—original draft preparation, D.X.; writing—review and editing, S.L.; funding acquisition, S.L. All authors have read and agreed to the published version of the manuscript.

Funding

This research was funded by the General Project of Chongqing Natural Science Foundation (CSTB2024NSCQ-MSX0749); and the Research and Innovation Program for Graduate Students in Chongqing (CYB25276).

Institutional Review Board Statement

Not applicable.

Informed Consent Statement

Not applicable.

Data Availability Statement

The original contributions presented in this study are included in the article. Further inquiries can be directed to the corresponding author.

Acknowledgments

The authors would like to acknowledge the financial support from the General Project of Chongqing Natural Science Foundation (CSTB2024NSCQ-MSX0749); and the Research and Innovation Program for Graduate Students in Chongqing (CYB25276).

Conflicts of Interest

Authors Benhua Liu, Wei Xu, and Xuefeng Zhang were employed by the company Poly Changda Engineering Co., Ltd., Guangzhou 510620, China. The remaining authors declare that the research was conducted in the absence of any commercial or financial relationships that could be construed as a potential conflict of interest.

References

  1. Zhang, Y.; Sun, W.; Liu, S.; Jiao, C.; Lai, J. Preparation of C200 green reactive powder concrete and its static–dynamic behaviors. Cem. Concr. Compos. 2008, 30, 831–838. [Google Scholar] [CrossRef]
  2. Wille, K.; Naaman, A.E.; Parra-Montesinos, G. Ultra-high performance concrete with compressive strength exceeding 150 MPa (22 ksi): A simpler way. ACI Mater. J. 2011, 108, 46–54. [Google Scholar] [CrossRef]
  3. Sanchayan, S.; Foster, S.J. High temperature behaviour of hybrid steel–PVA fibre reinforced reactive powder concrete. Mater. Struct. 2016, 49, 769–782. [Google Scholar] [CrossRef]
  4. Tayeh, B.A.; Aadi, A.S.; Hilal, N.N.; Bakar, B.A.; Al-Tayeb, M.M.; Mansour, W.N. Properties of ultra-high-performance fiber-reinforced concrete (UHPFRC)—A review paper. In AIP Conference Proceedings; AIP Publishing LLC: Melville, NY, USA, 2019; p. 020040. [Google Scholar]
  5. Ju, Y.; Jia, Y.; Liu, H.; Chen, J. Mesomechanism of steel fiber reinforcement and toughening of reactive powder concrete. Sci. China Ser. E Technol. Sci. 2007, 50, 815–832. [Google Scholar] [CrossRef]
  6. Yermak, N.; Pliya, P.; Beaucour, A.-L.; Simon, A.; Noumowé, A. Influence of steel and/or polypropylene fibres on the behaviour of concrete at high temperature: Spalling, transfer and mechanical properties. Constr. Build. Mater. 2017, 132, 240–250. [Google Scholar] [CrossRef]
  7. Mestrovic, D.; Cizmar, D.; Stanilovic, V. Reactive powder concrete: Material for the 21st century. WIT Trans. Eng. Sci. 2007, 57, 7. [Google Scholar] [CrossRef]
  8. Richard, P.; Cheyrezy, M. Composition of reactive powder concretes. Cem. Concr. Res. 1995, 25, 1501–1511. [Google Scholar] [CrossRef]
  9. Bonneau, O.; Lachemi, M.; Dallaire, E.; Dugat, J.; Aitcin, P.-C. Mechanical properties and durability of two industrial reactive powder concretes. Mater. J. 1997, 94, 286–290. [Google Scholar]
  10. Cheyrezy, M.; Maret, V.; Frouin, L. Microstructural analysis of RPC (reactive powder concrete). Cem. Concr. Res. 1995, 25, 1491–1500. [Google Scholar] [CrossRef]
  11. Tai, Y. Uniaxial compression tests at various loading rates for reactive powder concrete. Theor. Appl. Fract. Mech. 2009, 52, 14–21. [Google Scholar] [CrossRef]
  12. Heidari, A.; Shourabi, F.N. Mechanical properties of ultra-high performance concrete based on reactive powder concrete: Effect of sand-to-cement ratio, adding glass fiber and calcium carbonate. Constr. Build. Mater. 2023, 368, 130108. [Google Scholar] [CrossRef]
  13. Chan, Y.-W.; Chu, S.-H. Effect of silica fume on steel fiber bond characteristics in reactive powder concrete. Cem. Concr. Res. 2004, 34, 1167–1172. [Google Scholar] [CrossRef]
  14. Abed, F.; Alhafiz, A.R. Effect of basalt fibers on the flexural behavior of concrete beams reinforced with BFRP bars. Compos. Struct. 2019, 215, 23–34. [Google Scholar] [CrossRef]
  15. Liu, Z.; Alsomiri, M.; Li, M.; Chen, X.; Meng, J. Experimental investigation on the flexural behavior of coarse aggregate reactive powder concrete (CA-RPC) bridge deck. Eng. Struct. 2022, 271, 114951. [Google Scholar] [CrossRef]
  16. Yazıcı, H.; Yardımcı, M.Y.; Aydın, S.; Karabulut, A.Ş. Mechanical properties of reactive powder concrete containing mineral admixtures under different curing regimes. Constr. Build. Mater. 2009, 23, 1223–1231. [Google Scholar] [CrossRef]
  17. Lin, H.; Zhang, W.; Guo, S.; Zhang, X.; Wang, L.; Zhang, J. Study on the energy evolution mechanism and fractal characteristics of coal failure under dynamic loading. ACS Omega 2025, 10, 54710–54719. [Google Scholar] [CrossRef]
  18. Cao, Z.; Zhang, S.; Xue, Y.; Wang, Z.; Du, F.; Li, Z.; Huang, C.; Wang, S.; Yu, Y.; Wang, W. Disaster-causing mechanism of spalling rock burst based on folding catastrophe model in coal mine. Rock Mech. Rock Eng. 2025, 58, 7591–7604. [Google Scholar] [CrossRef]
  19. Nair, A.; Cai, C. Acoustic emission monitoring of bridges: Review and case studies. Eng. Struct. 2010, 32, 1704–1714. [Google Scholar] [CrossRef]
  20. Dong, F.; Li, Y.; Li, B. A new damage model for real-time lifetime prediction of composite laminates based on acoustic emission monitoring. Int. J. Fatigue 2025, 203, 109284. [Google Scholar] [CrossRef]
  21. Zheng, D.; Wang, X.; Yang, L.; Li, Y.; Xia, H.; Zhang, H.; Xiang, X. Review of Acoustic Emission Detection Technology for Valve Internal Leakage: Mechanisms, Methods, Challenges, and Application Prospects. Sensors 2025, 25, 4487. [Google Scholar] [CrossRef]
  22. Fernández-Osete, I.; Bermejo, D.; Ayneto-Gubert, X.; Escaler, X. Review of the uses of acoustic emissions in monitoring cavitation erosion and crack propagation. Foundations 2024, 4, 114–133. [Google Scholar] [CrossRef]
  23. Zhao, S.; Li, G.; Wang, C. Bridge cable damage identification based on acoustic emission technology: A comprehensive review. Measurement 2024, 237, 115195. [Google Scholar] [CrossRef]
  24. Verstrynge, E.; Lacidogna, G.; Accornero, F.; Tomor, A. A review on acoustic emission monitoring for damage detection in masonry structures. Constr. Build. Mater. 2021, 268, 121089. [Google Scholar] [CrossRef]
  25. Ran, Q.; Liang, Y.; Ye, C.; Ning, Y.; Ma, T.; Kong, F. Failure analysis of overlying strata during inclined coal seam mining: Insights from acoustic emission monitoring. Eng. Fail. Anal. 2025, 182, 110023. [Google Scholar] [CrossRef]
  26. Chen, M.; Zhao, Y.; Xiao, T.; Jiang, X.; Qin, B. Acoustic emission statistical characteristics of composite coal rock and precursor warning based on k-means clustering. Bull. Eng. Geol. Environ. 2025, 84, 547. [Google Scholar] [CrossRef]
  27. Shi, H.; Liu, J.; Sun, Y.; Wang, X.; Li, F. Study on the temporal–spatial evolution characteristics of micro-cracks during fault slip based on acoustic emission monitoring. Rock Mech. Rock Eng. 2025, 58, 3417–3435. [Google Scholar] [CrossRef]
  28. Zhang, Q.; Pei, J.; Liu, Y.; Li, X.; Nie, B.; Zhang, J.; Liu, H. Study on the Prediction Method for Coal and Rock Mass Fracture Process Based on Time Series Acoustic Emission Statistical Model. Rock Mech. Rock Eng. 2025, 58, 7631–7647. [Google Scholar] [CrossRef]
  29. Liu, J.; Wu, Y.; Liu, J.; He, Y.; Shen, X.; Du, Y.; Sun, B. Acoustic emission evolution and fracture mechanism of rock for direct tensile failure. Int. J. Rock Mech. Min. Sci. 2025, 185, 105974. [Google Scholar] [CrossRef]
  30. Jia, X.; Li, J.; Zhang, Q.; Zhang, M.; Jin, Y.; Ding, Y. Analysis of critical states based on acoustic emission signals during progressive failure of wood. PLoS ONE 2024, 19, e0302528. [Google Scholar] [CrossRef]
  31. Riccioli, F.; Alkhateeb, S.; Mol, A.; Pahlavan, L. Feasibility assessment of non-contact acoustic emission monitoring of corrosion-fatigue damage in submerged steel structures. Ocean Eng. 2024, 312, 119296. [Google Scholar] [CrossRef]
  32. Van de Velde, M.; Vandecruys, E.; Verstrynge, E.; Reynders, E.; Lombaert, G. Vibration monitoring and acoustic emission sensing during progressive load tests of corroded reinforced concrete beams. Eng. Struct. 2024, 306, 117851. [Google Scholar] [CrossRef]
  33. Li, S.; Gou, W.; Tan, Z.; Hedayat, M.; Sun, W.; Guo, P. Ductility and cracking behavior of UHPC-RC composite beam under bending test based on acoustic emission parameters. Structures 2024, 70, 107624. [Google Scholar] [CrossRef]
  34. Jiao, Y.; Chen, Y.; Yang, H.; Wang, C.J.T.; Mechanics, A.F. Experimental characterization on fracture behavior of UHPMC under small-scale sample tensile testing: Acoustic emission monitoring and digital image correlation. Theor. Appl. Fract. Mech. 2024, 130, 104342. [Google Scholar] [CrossRef]
  35. Chen, R.; Jiao, Y.; Xiao, M.; Yang, H.; Wang, C. Effect of Composition Characteristics on Mechanical Properties of UHPMC Based on Response Surface Methodology and Acoustic Emission Monitoring. Materials 2024, 17, 2714. [Google Scholar] [CrossRef]
  36. Guo, R.; Zhang, X.; Lin, X.; Huang, S. Active and passive monitoring of corrosion state of reinforced concrete based on embedded cement-based acoustic emission sensor. J. Build. Eng. 2024, 89, 109276. [Google Scholar] [CrossRef]
  37. Yang, H.; Han, X.; Wu, Q.; Jiao, Y. Accelerated corrosion assessment of reinforcement in manufactured sand concrete: Electrochemical analysis and acoustic emission monitoring. Constr. Build. Mater. 2025, 493, 143301. [Google Scholar] [CrossRef]
  38. Calabrese, L.; Campanella, G.; Proverbio, E. Identification of corrosion mechanisms by univariate and multivariate statistical analysis during long term acoustic emission monitoring on a pre-stressed concrete beam. Corros. Sci. 2013, 73, 161–171. [Google Scholar] [CrossRef]
  39. Ohtsu, M.; Uchida, M.; Okamoto, T.; Yuyama, S. Damage assessment of reinforced concrete beams qualified by acoustic emission. Struct. J. 2002, 99, 411–417. [Google Scholar]
  40. Sikdar, S.; Ostachowicz, W.; Pal, J. Damage-induced acoustic emission source identification in an advanced sandwich composite structure. Compos. Struct. 2018, 202, 860–866. [Google Scholar] [CrossRef]
  41. Siracusano, G.; Lamonaca, F.; Tomasello, R.; Garescì, F.; La Corte, A.; Carnì, D.L.; Carpentieri, M.; Grimaldi, D.; Finocchio, G. A framework for the damage evaluation of acoustic emission signals through Hilbert–Huang transform. Mech. Syst. Sig. Process. 2016, 75, 109–122. [Google Scholar] [CrossRef]
  42. Ali, H.Q.; Tabrizi, I.E.; Khan, R.M.A.; Tufani, A.; Yildiz, M. Microscopic analysis of failure in woven carbon fabric laminates coupled with digital image correlation and acoustic emission. Compos. Struct. 2019, 230, 111515. [Google Scholar] [CrossRef]
  43. Sagar, R.V. A parallel between earthquake sequences and acoustic emissions released during fracture process in reinforced concrete structures under flexural loading. Constr. Build. Mater. 2016, 114, 772–793. [Google Scholar] [CrossRef]
  44. Liu, H.; Lyu, X.; Zhang, Y.; Luo, G.; Li, W. Bending resistance and failure type evaluation of basalt fiber RPC beam affected by notch and interfacial damage using acoustic emission. Appl. Sci. 2020, 10, 1138. [Google Scholar] [CrossRef]
  45. Ciaburro, G.; Iannace, G. Machine-learning-based methods for acoustic emission testing: A review. Appl. Sci. 2022, 12, 10476. [Google Scholar] [CrossRef]
  46. Guan, S.; Huang, D.; Guo, S.; Zhao, L.; Chen, H. An improved fault diagnosis approach using LSSVM for complex industrial systems. Machines 2022, 10, 443. [Google Scholar] [CrossRef]
  47. Sun, L.; Lin, L.; Yao, X.; Zhang, Y.; Tao, Z.; Ling, P. Real-time recognition method for key signals of rock fracture acoustic emissions based on deep learning. Sensors 2023, 23, 8513. [Google Scholar] [CrossRef]
  48. GB/T 31387-2015; Reactive Powder Concrete. China Standard Press: Beijing, China, 2015.
  49. Ge, L.; Zhang, Y.; Feng, Z.; Li, H. Performance and microscopic study of various mineral admixtures on reactive powder concrete. Mater. Lett. 2023, 350, 134902. [Google Scholar] [CrossRef]
  50. Mao, Z.; Zhang, J.; Ma, Q.; Du, G.; Li, Y. Performance evaluation of fiber-reinforced reactive powder concrete exposed to high temperature combining nondestructive test. J. Build. Eng. 2022, 61, 105266. [Google Scholar] [CrossRef]
  51. T/CECS 864-2021; Standard for Test Method of Ultra-High Performance Concrete. Shanghai Research Institute of Building Science Co., Ltd.: Shanghai, China, 2021.
  52. Xiao, D.; Xu, K.; Liu, B.; Zhang, X.; Xu, W.; Zhai, L.; Li, X. Mechanical properties and avalanche characteristics of reactive powder concrete under different loading conditions by acoustic emission techniques. AIP Adv. 2025, 15, 115323. [Google Scholar] [CrossRef]

  53. ASTM E976-15(2021); Standard Guide for Determining the Reproducibility of Acoustic Emission Sensor Response. ASTM: West Conshohocken, PA, USA, 2021.
  54. Ohno, K.; Ohtsu, M. Crack classification in concrete based on acoustic emission. Constr. Build. Mater. 2010, 24, 2339–2346. [Google Scholar] [CrossRef]
  55. Xiao, W.; Wan, H.; Zhang, D.; Huang, Y.; Li, S. Study on the failure process of surrounding rock of arch roadway after high temperatures: Insights from surrounding rock fracture and the corresponding acoustic response. Tunn. Undergr. Space Technol. 2025, 162, 106616. [Google Scholar] [CrossRef]
  56. Zhang, C.; Lin, W.; Hu, G. An enhanced ivy algorithm fusing multiple strategies for global optimization problems. Adv. Eng. Softw. 2025, 203, 103862. [Google Scholar] [CrossRef]
  57. Ghasemi, M.; Zare, M.; Trojovský, P.; Rao, R.V.; Trojovská, E.; Kandasamy, V. Optimization based on the smart behavior of plants with its engineering applications: Ivy algorithm. Knowl.-Based Syst. 2024, 295, 111850. [Google Scholar] [CrossRef]
  58. Su, G.; Huang, L.; Qin, Y.; Yan, X. Experimental study of the “AE quiet period” on the eve of brittle failure in hard rock. Eng. Fail. Anal. 2024, 162, 108391. [Google Scholar] [CrossRef]
  59. Li, K.-S.; Luan, Y.-Q.; Zhang, J.-P.; Liu, C.-X. Experimental study on mechanical behavior, AE response and energy evolution of fissure-filled sandstone from mine roadway under conventional triaxial compression. Theor. Appl. Fract. Mech. 2024, 130, 104334. [Google Scholar] [CrossRef]
  60. Du, J.; Zhang, F.; Xiao, H.; Liu, M.; Zhang, C. Combining DIC and AE to investigate the influence of steel fiber content on the flexural performance of UHPC. J. Build. Eng. 2025, 114, 114335. [Google Scholar] [CrossRef]
  61. Zhou, S.; Jiang, Z.; Ou, Q.; Liu, J.; Wang, C. Analysis on flexural toughness of steel fiber reinforced concrete based on acoustic emission and digital image correlation techniques. Constr. Build. Mater. 2025, 492, 143039. [Google Scholar] [CrossRef]
  62. Wang, C.; Guo, T.; Liu, L.; Cheng, Z.; Zhang, H.; Huang, Y.; Xu, Y.; Wang, Z.; Cheng, Z. Fracture properties and reinforcement mechanisms of multi-scale hybrid fiber reinforced ultra-high performance concrete. J. Build. Eng. 2025, 111, 113436. [Google Scholar] [CrossRef]
  63. Popa, M.-M.; Leuteritz, A.; Stommel, M.; Kühnert, I.; Mechtcherine, V.; Scheffler, C. Micromechanical study on polypropylene-bicomponent fibers to improve mechanical interlocking for application in strain-hardening cement-based composites. Cem. Concr. Compos. 2023, 142, 105181. [Google Scholar] [CrossRef]
  64. Che, C.-Y.; Cao, S.-G.; Zhang, Y.; Liu, Y.; Zhao, C.-Z.; Du, S.-Y.; Li, J.; Shan, C.-H. Mechanical properties and damage evolution law of cemented-gangue–fly-ash backfill modified with different contents of recycled steel fibers. J. Cent. South Univ. 2025, 32, 2661–2678. [Google Scholar] [CrossRef]
  65. Luo, H.; Han, F.; Liu, F.; Yu, W.; Liang, T.; Wang, S. Interpretable Machine Learning for Thermomechanical Property Prediction of Geopolymer-Solidified Soils under Subzero Curing Conditions. J. Cold Reg. Eng. 2026, 40, 04025048. [Google Scholar] [CrossRef]
  66. Çiftçioğlu, A.Ö.; Kazemi, F.; Shafighfard, T. Grey wolf optimizer integrated within boosting algorithm: Application in mechanical properties prediction of ultra high-performance concrete including carbon nanotubes. Appl. Mater. Today 2025, 42, 102601. [Google Scholar] [CrossRef]
Figure 1. Physical morphology: (a) cement; (b) silica fume; (c) fly ash; and (d) slag powder.
Buildings 16 00932 g001
Figure 2. Chemical composition: (a) cement; (b) silica fume; (c) fly ash; and (d) slag powder.
Buildings 16 00932 g002
Figure 3. Particle size distribution of quartz sand.
Buildings 16 00932 g003
Figure 4. Copper-coated steel fibers.
Buildings 16 00932 g004
Figure 5. Loading test specimens: (a) cube compressive; (b) axial compressive; (c) splitting tensile; and (d) four-point bending.
Buildings 16 00932 g005
Figure 6. Loading test system: (a) cube and axial compression test; (b) splitting tensile and four-point bending test [52].
Buildings 16 00932 g006
Figure 7. Signal parameters in AE test.
Buildings 16 00932 g007
Figure 8. Acoustic emission (AE) signals of different fracture modes: (a) tensile mode; and (b) shear mode.
Buildings 16 00932 g008
Figure 9. Failures were classified according to AF and RA values.
Buildings 16 00932 g009
Figure 10. Ivy algorithm (IVY) flowchart.
Buildings 16 00932 g010
Figure 11. Stress–strain curve: (a) group specimens; (b) splitting tensile specimen.
Buildings 16 00932 g011
Figure 12. Typical failure patterns of the representative specimens: (a) cube compressive; (b) axial compressive; (c) splitting tensile; and (d) four-point bending.
Buildings 16 00932 g012
Figure 13. Evolution characteristics of AE ringing counts and energy distribution over time: (a) cube compressive; (b) axial compressive; (c) splitting tensile; and (d) four-point bending.
Buildings 16 00932 g013
Figure 14. The variation characteristics of cumulative ringing count and energy: (a) cumulative ringing count; (b) cumulative energy.
Buildings 16 00932 g014
Figure 15. Peak frequency distribution of the representative specimens: (a) cube compressive; (b) axial compressive; (c) splitting tensile; and (d) four-point bending.
Buildings 16 00932 g015
Figure 16. Density distribution of the peak frequency over time: (a) cube compressive; (b) axial compressive; (c) splitting tensile; and (d) four-point bending.
Buildings 16 00932 g016
Figure 17. RA-AF distribution characteristics of the representative specimens: (a) cube compressive; (b) axial compressive; (c) splitting tensile; and (d) four-point bending.
Buildings 16 00932 g017
Figure 18. Evolution characteristics of b-value: (a) cube compressive; (b) axial compressive; (c) splitting tensile; and (d) four-point bending.
Buildings 16 00932 g018
Figure 19. Accuracy of the optimized and unoptimized models.
Buildings 16 00932 g019
Figure 20. Confusion matrix of classification results: (a) IVY-RF; (b) IVY-XGBoost.
Buildings 16 00932 g020
Figure 21. The importance of characteristic value: (a) IVY-RF; (b) IVY-XGBoost.
Buildings 16 00932 g021
Table 1. Physical and mechanical properties of 42.5-grade ordinary Portland cement.
Density (g/cm3)Specific Surface (m2/kg)Volume StabilityStandard Consistency Water Consumption (%)Setting Time (min)Compressive Strength (MPa)Rupture Strength (MPa)
3.08346Conformity26.6Initial setInitial set3 d28 d3 d28 d
20527822.648.94.88.6
Table 2. Performance parameters of quartz sand.
Grain Size (mm)Chemical CompositionCrushing Rate (%)Mud Content (%)Refractory Temperature (°C)
SiO2Fe2O3
0.106~0.21299.850.020.150.06>1750
0.212~0.425
Table 3. Physical mechanical performance index of steel fiber.
Fiber TypeLength (mm)Diameter (mm)Aspect RatioTensile Strength (MPa)
Copper-plated steel fiber130.22302869
Table 4. Mixture proportions per cubic meter of RPC (Kg).
MaterialsContent (Kg/m3)Detail
Cement700Chinese standard 42.5 Portland cement
Silica fume180-
Fly ash150-
Slag100-
Quartz sand1004Mix the particle sizes of 0.106 to 0.212 mm and 0.212 to 0.425 mm in equal volumes.
Steel fiber117Length = 13 mm; Diameter = 0.22 mm; Tensile strength > 2850 MPa; Density = 7.8 g·m−3
Water179-
Admixture29.4Polycarboxylate superplasticizer with a water-reducing rate of 45%
Table 5. Parameters of AE Test System.
Test ParameterSet Value
Amplifier gain40 dB
Threshold for detection45 dB
Peak definition time (PDT)35 μs
Hit definition time (HDT)150 μs
Hit lockout time (HLT)300 μs
Table 6. Results of the mechanical property values under different loading conditions.
Experimentεcdεcαfc (MPa)fr (MPa)β
Cube compressive0.0170.0271.59123.7167.700.55
Axial compressive0.00650.00861.3290.42--
Splitting tensile0.0220.0301.3610.904.650.43
Four-point bending0.0120.0231.9212.449.690.78
Note: In the axial compression test, a sudden stress drop occurred after the specimen reached the peak strength (fc). To avoid damage to the sensors caused by specimen fragmentation, the loading program automatically terminated. Therefore, the residual strength (fr) in the table is none.
Table 7. Parameter setting of the acoustic emission feature recognition model.
RFXGboost
Parameter nameRange settingOptimal parameter valuesParameter nameRange settingOptimal parameter values
Number of decision trees[10, 500]190Learning rate[0.001, 0.3]0.2
Decision tree maximum depth[5, 30]24Number of trees [50, 2000] 900
Minimum leaf node[1, 10]1Maximum depth[3, 10]8
Minimum split samples[2, 20]2L1/L2[0, 10]1
Random sampling[Ture, False]False
Node splitting criterionginigini
Table 8. The results of predicting cube compressive strength dataset using XGBoost under different algorithm optimizations.
PerformanceIVY-XGBoostRS-XGBoostRS-XGBoostPSO-XGBoost
Computational time (s)5423026761
Accuracy rate0.9140.8510.9070.892
Disclaimer/Publisher’s Note: The statements, opinions and data contained in all publications are solely those of the individual author(s) and contributor(s) and not of MDPI and/or the editor(s). MDPI and/or the editor(s) disclaim responsibility for any injury to people or property resulting from any ideas, methods, instructions or products referred to in the content.