Article

Test and Theoretical Study on Mechanical Properties of Steel Fiber-Reinforced Bamboo-Reinforced Concrete Slab

1
Department of Civil Engineering, Sichuan College of Architectural Technology, Deyang 618000, China
2
State Key Laboratory of Geohazard Prevention and Geoenvironment Protection, Chengdu 610059, China
3
SC-CQ Joint Lab of Advanced Eco-Materials with Safty and Energy Effciency for Civil Engineering, Chengdu 610059, China
*
Author to whom correspondence should be addressed.
Buildings 2026, 16(5), 1046; https://doi.org/10.3390/buildings16051046
Submission received: 30 December 2025 / Revised: 22 February 2026 / Accepted: 4 March 2026 / Published: 6 March 2026

Abstract

To enhance the mechanical properties of bamboo-reinforced concrete slabs, 1%, 1.5%, and 2% of steel fibers (SF) were added to C30 bamboo-reinforced concrete slabs to produce two test groups, each containing 12 slabs. One group was tested under static loads, and the other under impact loads. In each group, the slab thickness was set to 50 mm, 65 mm, and 80 mm, and the steel fiber dosages were 0%, 1%, 1.5%, and 2%. While existing studies on bamboo-reinforced concrete slabs (BRCS) have primarily focused on static flexural behavior, and research on steel fiber-reinforced concrete (SFRC) has mainly addressed fiber network effects in plain or steel-reinforced matrices, the synergistic mechanism between bamboo and SF in steel fiber-reinforced bamboo-reinforced concrete slabs (SFRBCS) under dynamic impact loading remains unexplored. This study innovatively combines bamboo’s elastic energy absorption with SF’s plastic energy dissipation. Static load and drop hammer impact tests were carried out in each group to study the mechanical properties of SFRBCS under static and dynamic loads. The test results show that: under static load, adding SF transforms the failure mode of the slab from brittle shear failure to ductile bending failure, increases the ultimate load, and delays the development of the main crack. Under the action of impact loads, bamboo absorbs impact energy through elastic deformation, while SF dissipates energy through plastic deformation. The combined effect of the two significantly slows down the development speed of cracks. The slab with 80 mm thick and 2% SF dosage exhibits excellent impact ductility. Based on theoretical analysis and tests, the corresponding correction coefficients are introduced to establish the bearing capacity calculation model of SFRBCS under uniformly distributed loads, considering the synergistic effect of the mechanical properties of bamboo and the reinforcing effect of SF. The combination of 1.5% SF dosage and 80 mm slab thickness can effectively enhance the material utilization rate (defined as the ratio of the increment in ultimate bearing capacity to the increment in steel fiber dosage). Test and calculation models provide a theoretical basis for the design and application of SFRBCS, which is applicable to engineering fields such as low-rise buildings and temporary structures.

1. Introduction

Since the 21st century, concrete slabs have been extensively used in low-rise residential buildings, temporary construction platforms, and rural infrastructure due to their cost-effectiveness and ease of construction [1,2]. However, normal reinforced concrete slabs face two critical challenges in these scenarios: steel bars, the primary tensile reinforcement, are prone to corrosion in humid or corrosive environments, requiring additional anti-rust treatments that increase maintenance costs by 20–30% [3,4,5]; the high self-weight of concrete slabs limits their application in lightweight structures, where load-bearing capacity and weight reduction need to be balanced. While bamboo is a lighter alternative to steel, replacing steel bars with bamboo alone cannot fundamentally solve the lightweight problem of the slab without the use of lightweight aggregate concrete. Therefore, in this study, bamboo is primarily introduced to address the corrosion issue and provide a green reinforcement option.
To address these challenges, researchers have turned to alternative reinforcing materials. Bamboo, as a renewable green resource, exhibits high tensile strength and low density, making it a promising substitute for steel [6,7]. Existing studies have confirmed that bamboo-reinforced concrete slabs (BRCS) can meet the mechanical requirements of specific scenarios [8,9,10,11]. The studies [12,13] demonstrated that BRCS flexural strength exceeds plain concrete by 15–20%. Nevertheless, BRCS has inherent drawbacks: under static loads, weak interfacial bonding between bamboo and concrete often causes bamboo pull-out, leading to brittle failure; under dynamic impacts, BRCS shows poor energy dissipation capacity, with first cracks appearing after only 1–2 impacts and complete failure within three impacts [11], failing to meet safety demands. At the same time, the fire resistance of such structures also needs to be considered [14].
Bamboo, as a natural composite material, offers a low-carbon and sustainable alternative with a high specific strength. However, bamboo-reinforced concrete suffers from low stiffness and brittle failure. To address these mechanical deficits while maintaining environmental benefits, steel fibers (SF) are introduced as a hybrid reinforcement strategy to enhance toughness and crack resistance.
Steel fibers (SF), on the other hand, are well-documented to enhance concrete ductility and crack resistance. By forming a three-dimensional network in the matrix, SF bridges micro-cracks and dissipates energy through plastic deformation [15,16]. The study found that replacing 50% of normal concrete with steel fiber-reinforced concrete (SFRC) in multi-layered slabs increased the ultimate load by 56.5%, while another study [17] reported that SFRC slabs under contact explosion exhibited 40% less spalling damage than plain concrete. Despite these advantages, SFRC has limitations: fiber agglomeration at dosages >2% reduces workability and energy absorption by 25% [18], and the absence of a primary tensile skeleton leads to 30–40% higher long-term deflection than steel-reinforced concrete [19], restricting its application in slabs with strict deflection control.
Recent extensive studies on high-performance SFRC have focused on optimizing the fresh mix properties, such as high flowability and self-compaction, to facilitate casting. Ensuring a uniform distribution of steel fibers through proper mix design and casting procedures is critical, as it has been well-established that fiber distribution has a direct and significant correlation with the mechanical performance of the hardened concrete, particularly regarding its toughness and tensile strength. Poor fiber distribution or agglomeration can lead to stress concentrations and significantly reduce the reinforcing efficiency of the fibers.
Recent attempts at composite reinforcement have focused on fiber–fiber combinations [20,21,22,23,24] or plant–fiber [25,26,27,28,29], while bamboo–SF composite systems have received little attention. The few relevant studies are limited: one study compared bamboo-reinforced concrete with and without 1% steel fibers, but only tested static flexural performance, ignoring dynamic behavior; others studied the effect of bamboo coating on composite performance, but did not quantify the synergistic contribution of bamboo and steel fibers. Three critical research gaps persist: (1) the synergistic mechanism between bamboo’s elastic energy absorption and SF’s plastic energy dissipation under static or dynamic loads is unclear; (2) systematic data on how key parameters affect composite slab performance is lacking; (3) traditional bearing capacity models do not account for bamboo–SF synergy, leading to calculation errors > 25% for composite systems.
To fill these gaps, this study focuses on steel fiber-reinforced bamboo-reinforced concrete slabs (SFRBCS). Specifically, the three gaps are addressed as follows: (1) the synergistic mechanism between bamboo and SF is investigated through static and impact tests in Section 3.1.1 and Section 3.2.1, revealing that bamboo absorbs energy elastically while SF dissipates it plastically; (2) systematic data on the effects of SF dosage and slab thickness are presented in Section 3.1.2 and Section 3.2.2, identifying the optimal parameter combination; and (3) a bearing capacity calculation model incorporating correction coefficients for the synergistic effect is established in Section 4, which successfully reduces calculation errors from >25% to within ±2%. This research provides experimental data and theoretical support for optimizing green concrete slab material ratios and structural design, while expanding the application of bamboo and SF in composite reinforcement—particularly for low-rise buildings and temporary structures.

2. Materials and Test

2.1. Materials and Slabs

2.1.1. Raw Materials

(1) Cement: P.C 42.5R early-strength composite Portland cement (a company in Chengdu, China) was used, which has excellent early-strength performance and good stability. The indices of cement performance are shown in Table 1.
(2) Aggregates: Fine aggregates (FA) are made of a continuous gradation of natural sand to ensure that the concrete mixtures have good workability and density. Coarse aggregates (CA) are ordinary crushed stones with particle sizes ranging from 5 to 25 mm, with continuous gradation to enhance the stability and mechanical properties.
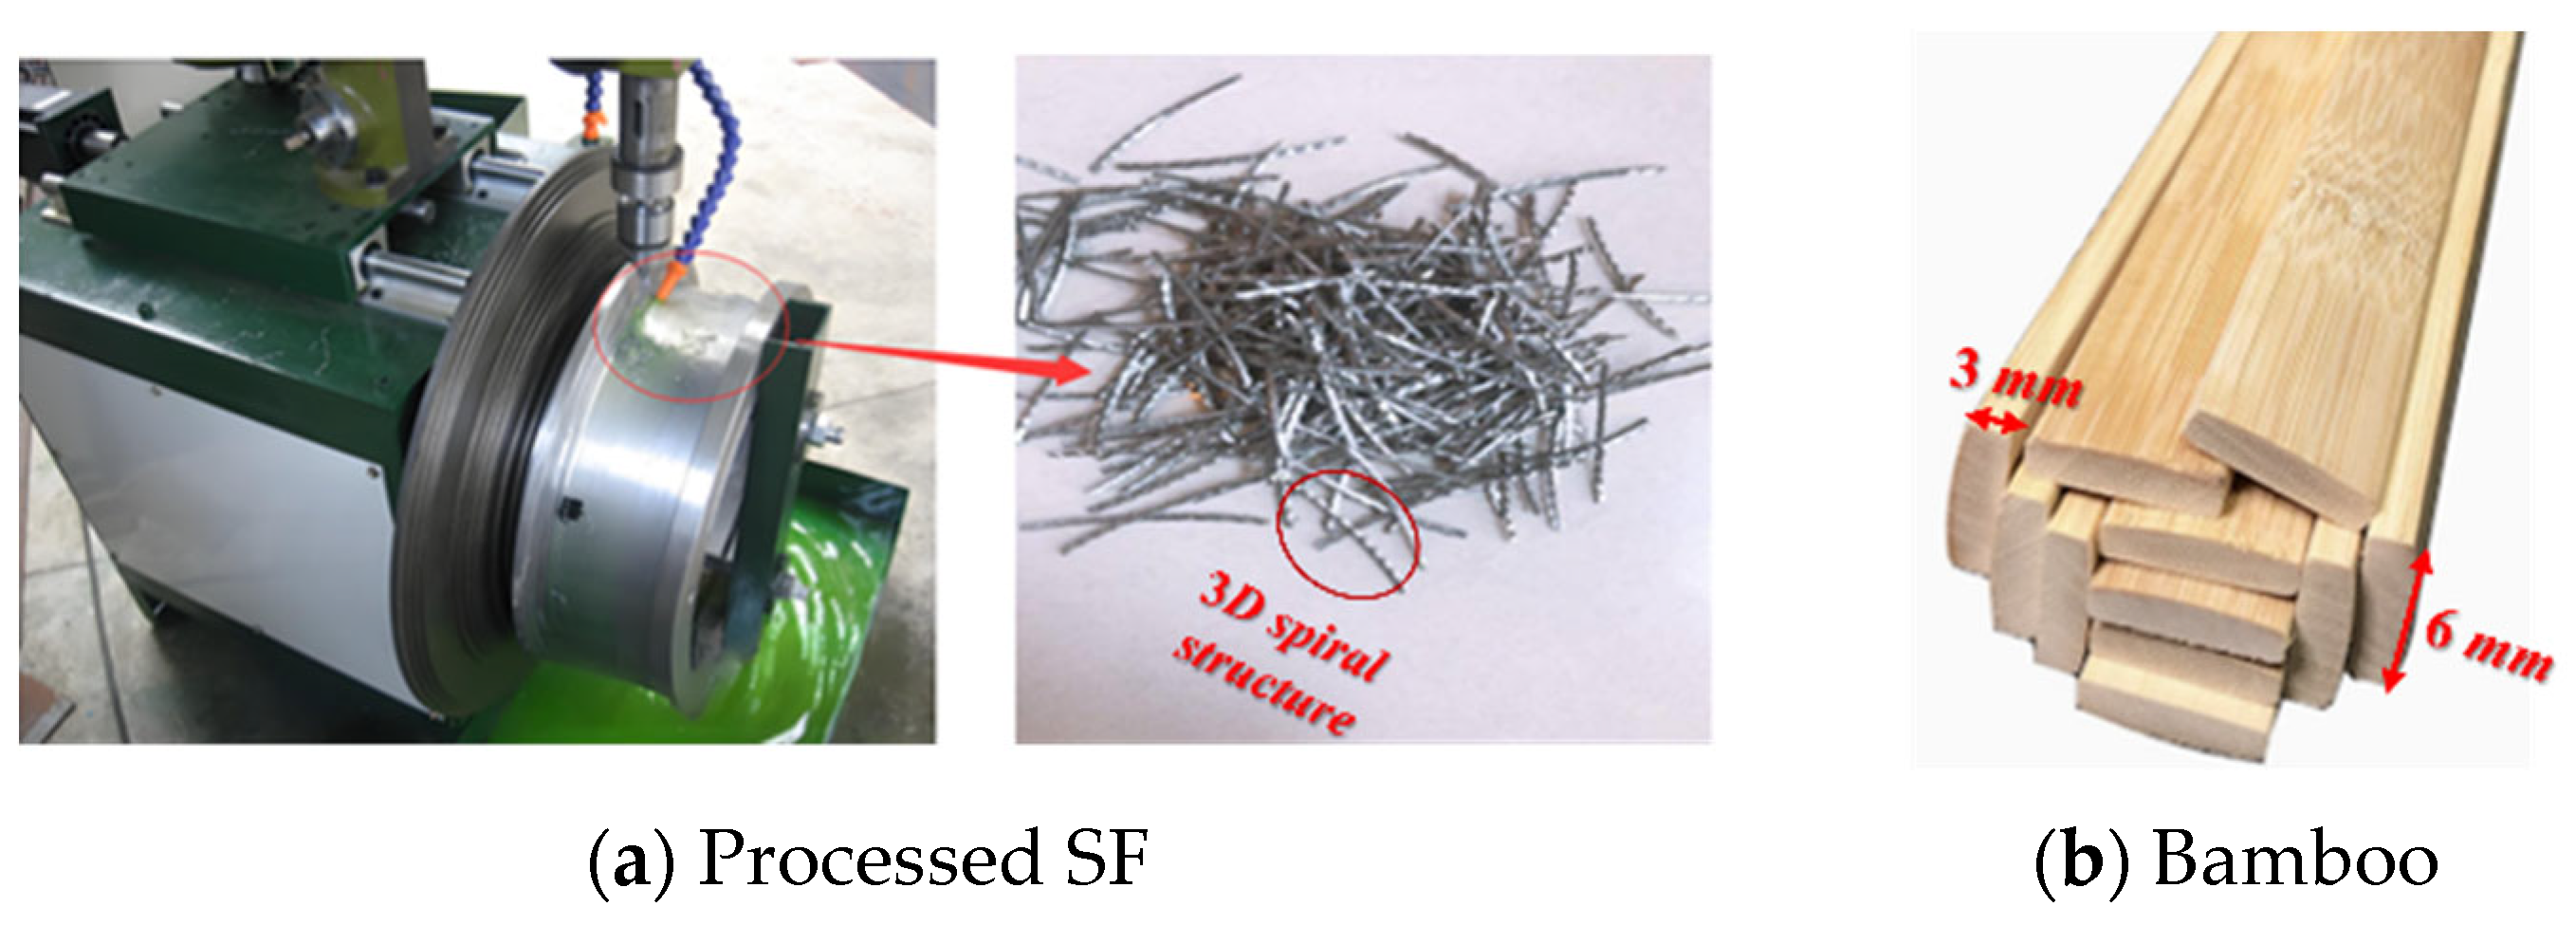
(3) Steel fibers (SF): SF are discarded materials from processing plants, presenting a 3D spiral structure. After processing (Figure 1a), the fibers were screened and sorted to control geometric variability. Only fibers meeting the dimensional requirements were used to ensure test repeatability. The selected material exhibits the following properties: an average length ranging from 15 to 25 mm, an average width of no more than 35 mm, an average tensile strength of at least 380 MPa, an elastic modulus of 2.05 × 10⁵ MPa, and a bulk density of 7850 kg/m3.
(4) Bamboo: Bamboo with uniform spacing and dense fibers was selected. After mechanical processing, the bamboo was formed into rectangular thin strips with a cross-section of 3 mm × 6 mm. Tensile tests were conducted on 20 specimens, yielding an average tensile strength of 320 MPa and an average elastic modulus of 15 GPa. The surfaces were polished and deburred, as shown in Figure 1b.
(5) Water and water reducer (Wr): Water employed in the study was ordinary tap water. The Wr adopted was a DFTR-PCE-type polycarboxylate-based high-performance water reducer, with its dosage controlled within the range from 0.3% to 0.5% relative to the total mass of cement or cementitious materials.

2.1.2. Slab Preparation and Curing

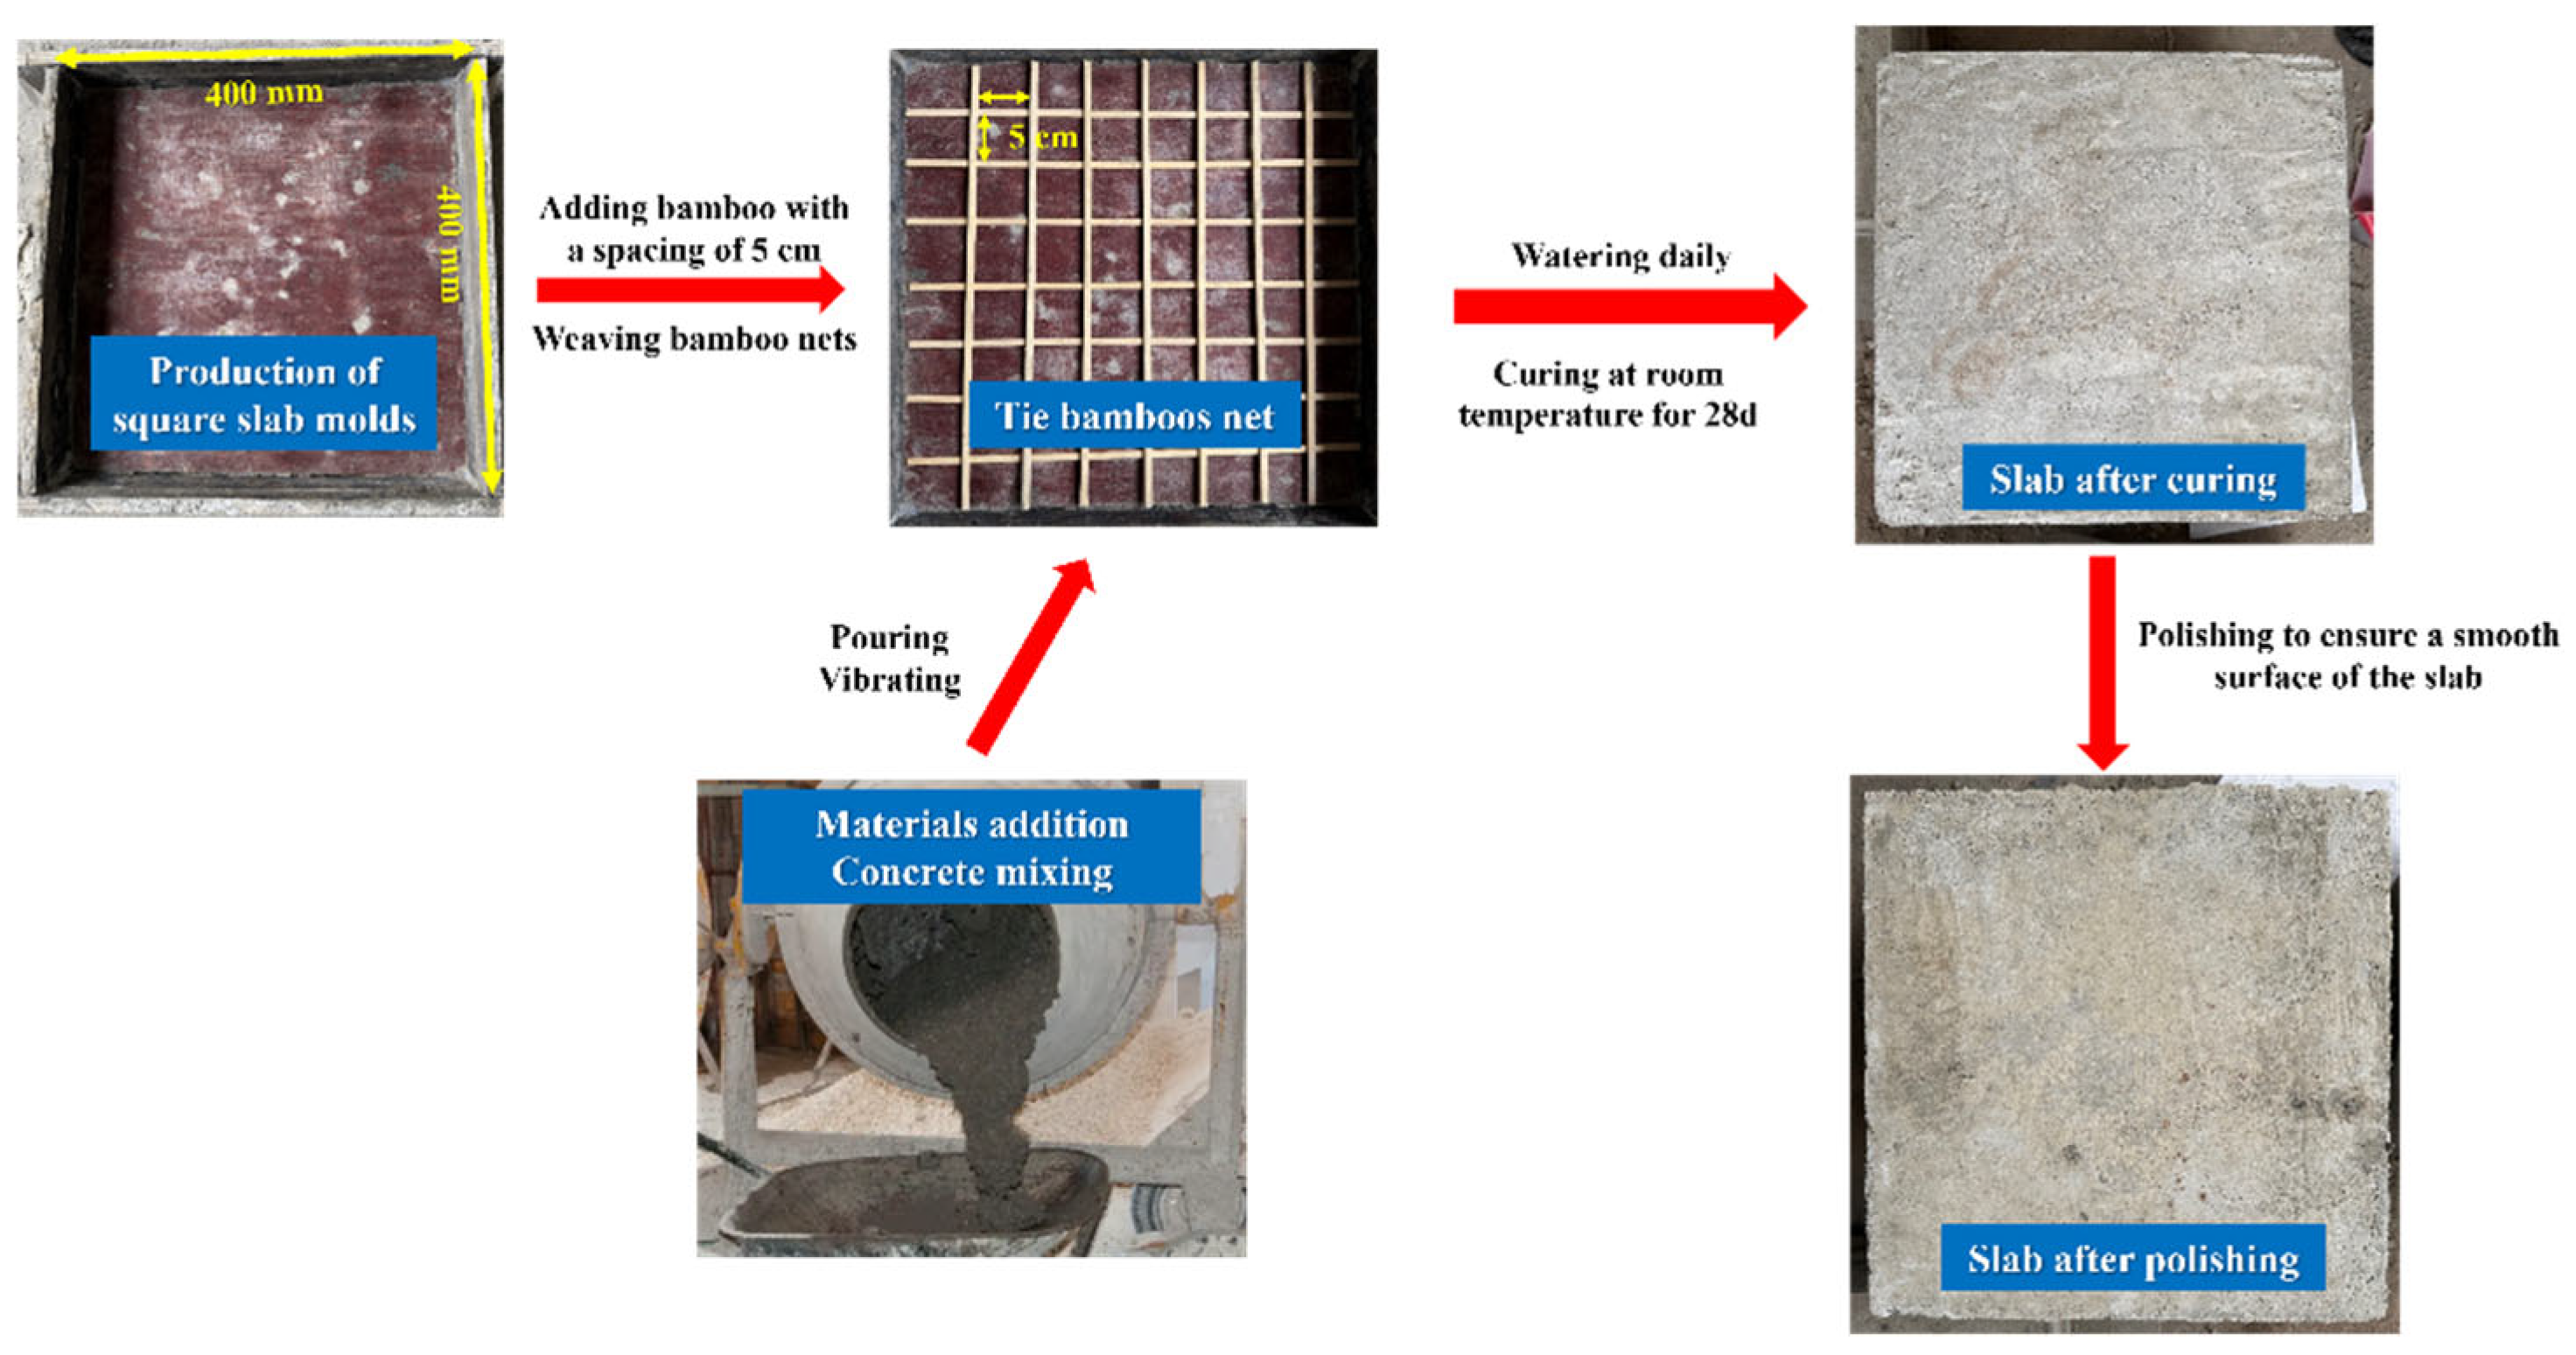
Taking C30 strength concrete as the matrix concrete, bamboo-reinforced concrete slabs with SF volume fractions of 0%, 1%, 1.5% and 2% were designed. Based on the bulk density of the steel fibers (7850 kg/m3), the corresponding mass dosages per cubic meter were calculated as 0, 78.5, 117.75, and 157 kg, respectively. These mixtures are referred to as steel fiber-reinforced bamboo-reinforced concrete slabs (SFRBCS), and the mixing ratio is shown in Table 2. In the study, a multi-functional forced mixer was used to complete the concrete mixing. The process of slab preparation and curing is shown in Figure 2. During the slab preparation process, due to the fact that the spiral SF are prone to “agglomeration”, which affects the workability and performance of the concrete, SF were added in batches when mixing the concrete.
To ensure the compaction quality and uniform distribution of steel fibers, the workability of the fresh SFRBCS mixtures was monitored to ensure adequate flowability. The test results showed that the slump values decreased with increasing SF dosage: 180 mm for 0%, 150 mm for 1%, 120 mm for 1.5%, and 80 mm for 2%. Despite the reduction in workability caused by fiber agglomeration at higher dosages, the measured values remained within an acceptable range for proper compaction. The slabs were cast in layers, and each layer was compacted using a poker vibrator to eliminate voids and prevent fiber settlement or agglomeration. This process was crucial to achieving a dense and homogeneous matrix.
To accurately characterize the material properties of the matrix and provide input parameters for theoretical calculations, the basic mechanical properties of the steel fiber-reinforced concrete (SFRC) with different dosages were tested. The results of the compressive strength (fc), splitting tensile strength (ft), and elastic modulus (Ec) are listed in Table 3. In addition, the complete compressive stress–strain curves of SFRC were recorded to calibrate the constitutive parameters for the theoretical analysis.
The distribution of steel fibers within the matrix plays a pivotal role in the performance of SFRBCS. A uniform dispersion, achieved through the controlled casting and vibration methods described above, facilitates the formation of an effective three-dimensional fiber network. This network is essential for bridging micro-cracks, thereby enhancing the slab’s ductility and energy dissipation capacity under both static and impact loads.

2.2. Test Design and Procedure

2.2.1. Test Design

In the test, 4 SF dosages (0%, 1%, 1.5% and 2%) were added. Similarly, the drop hammer impact test group also consisted of 12 slabs. The slab thickness was set in three types—50 mm, 65 mm, and 80 mm—for both the static load and drop hammer impact tests. The specific information on slabs is shown in Table 4. To cover the wide range of parameters (3 thicknesses × 4 SF dosages = 12 combinations) within the experimental budget and timeframe, one slab was fabricated for each specific combination of thickness and SF dosage. While the sample size is limited, the distinct failure modes and load–displacement trends observed were consistent and sufficient for revealing the synergistic mechanism and validating the theoretical model.

2.2.2. Static Load Test

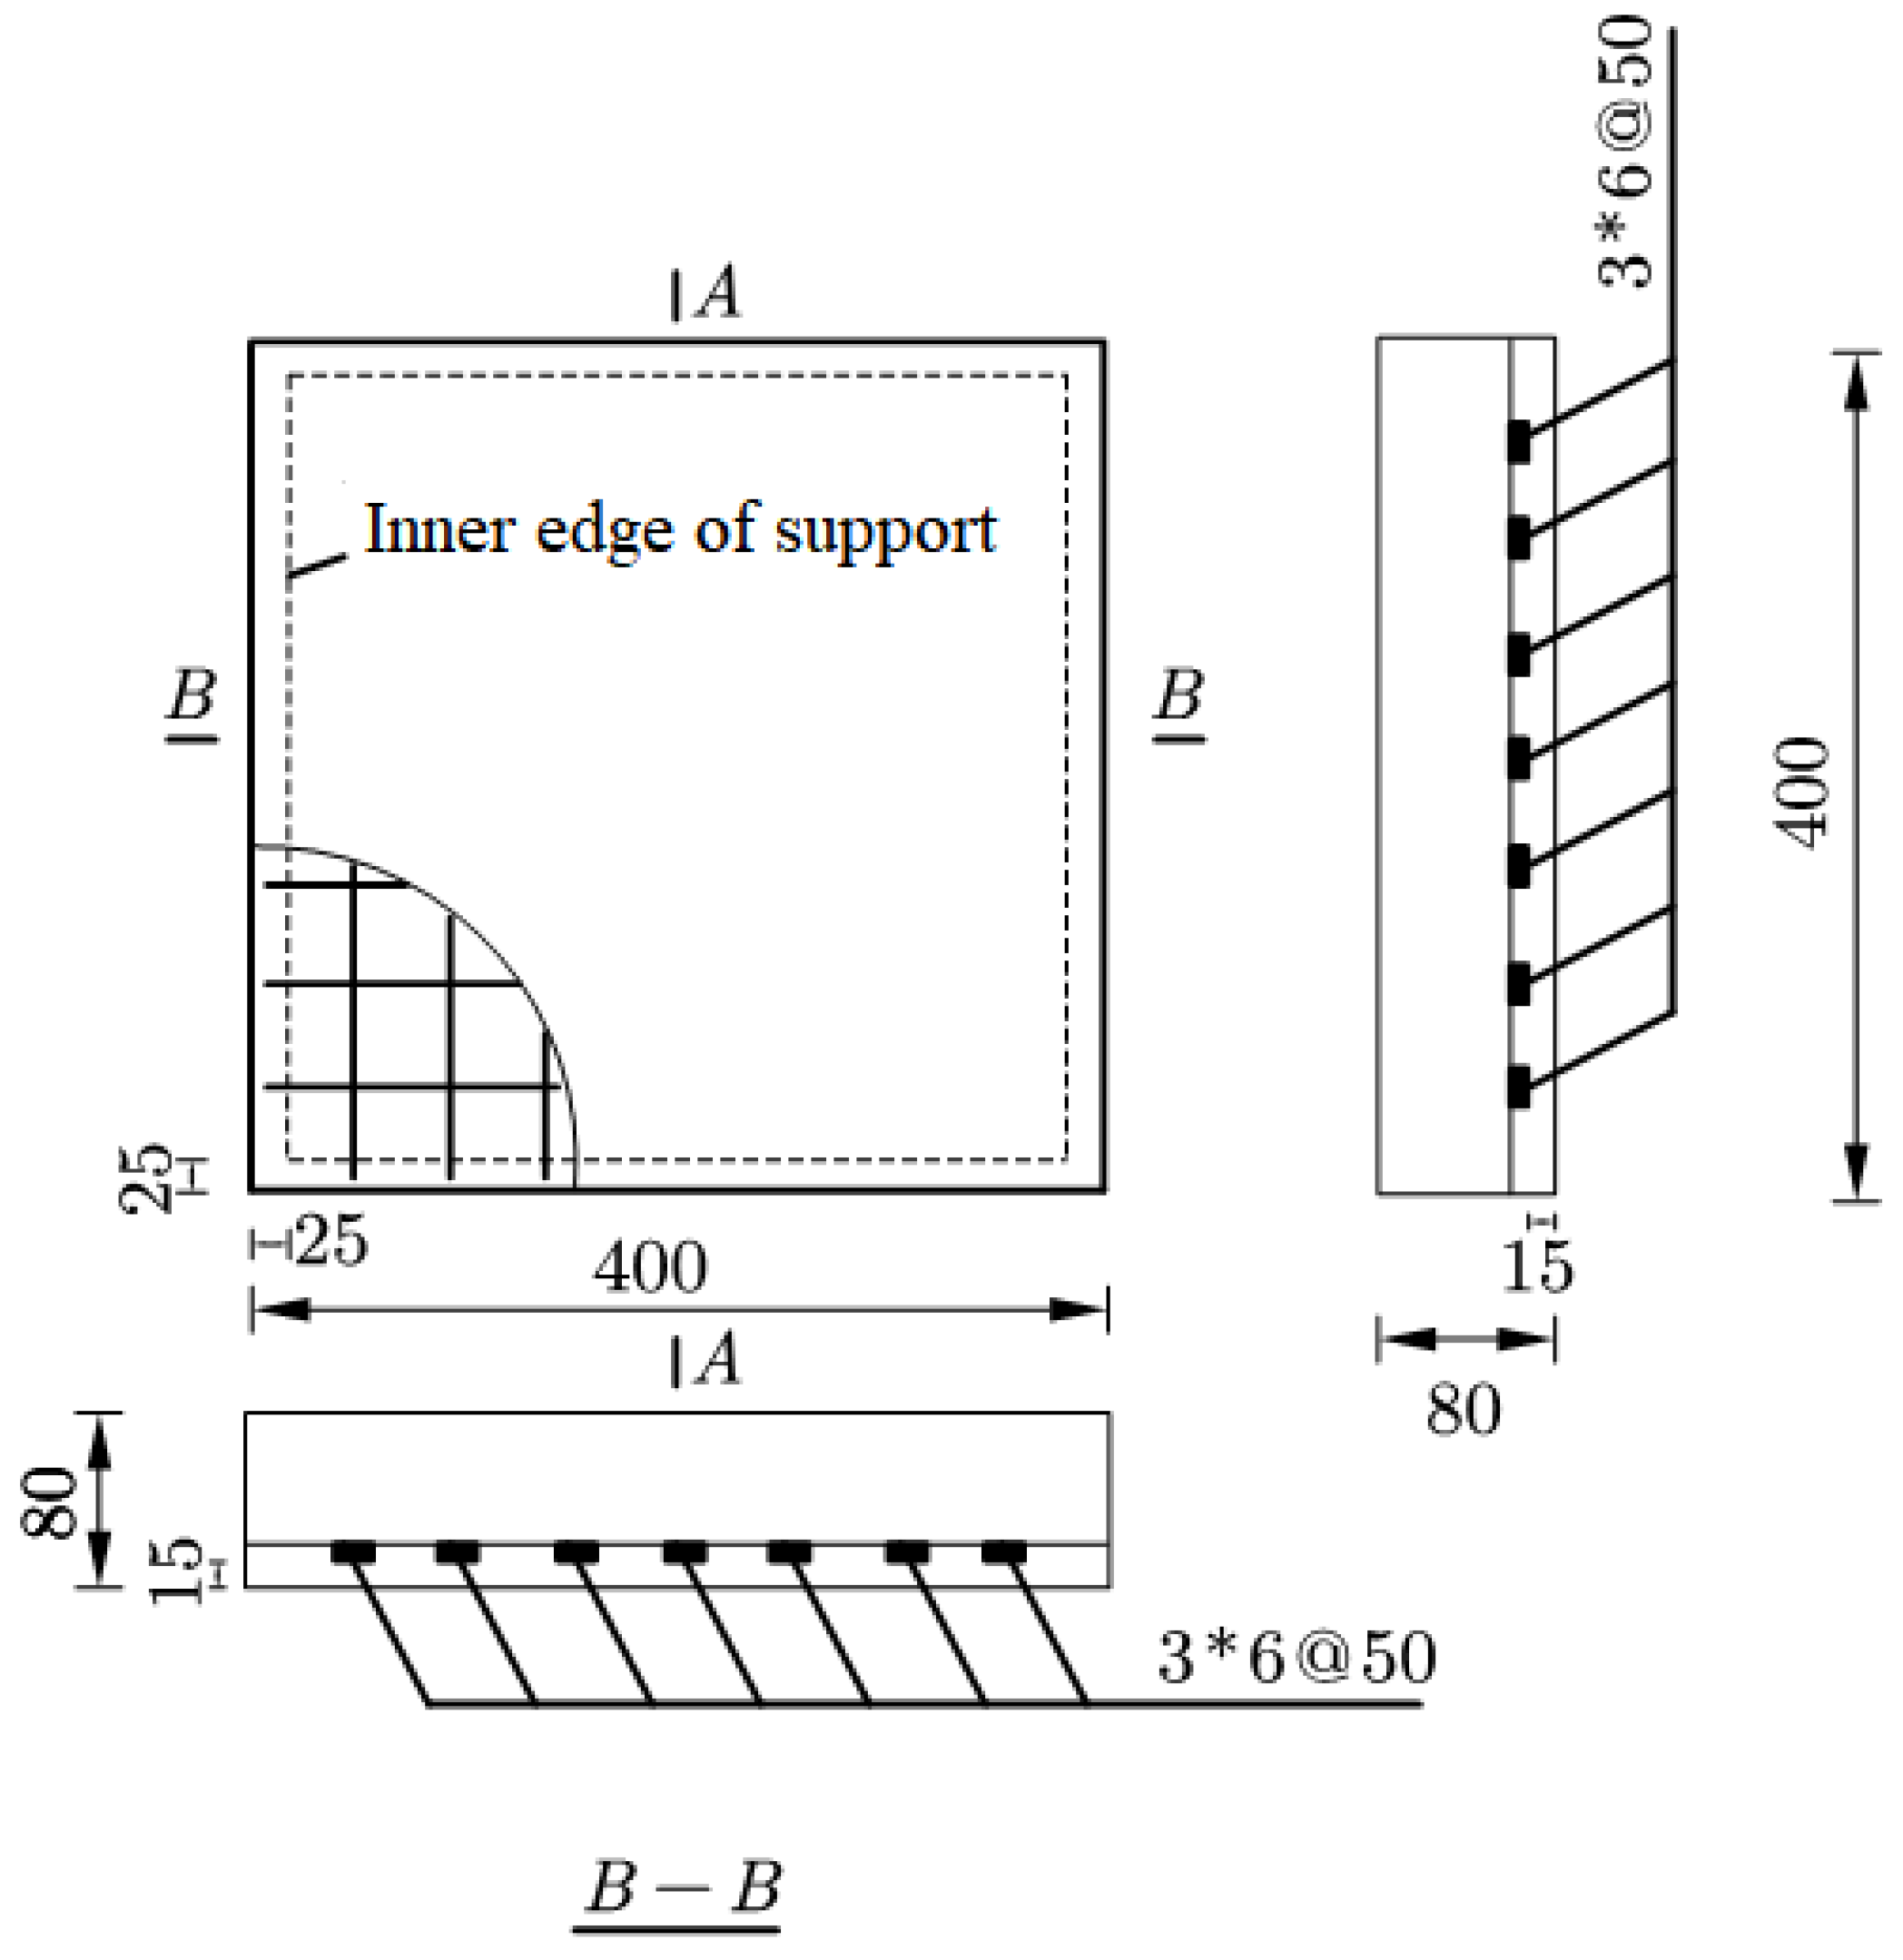
A total of 12 bidirectional bending slabs were designed for the static load test group. Given the square geometry (400 mm × 400 mm) with an aspect ratio of 1:1, the slabs were classified as two-way slabs. The bottom of each slab was equipped with a single-layer bidirectional bamboo net to resist the bending moments generated in both orthogonal directions (X and Y axes) under the central loading condition, and the thickness of the concrete protective layer was 10 mm. The loading mode is local uniform loading. The parameters of slabs are shown in Table 5, and the structure and reinforcement of the slab are illustrated in Figure 3.
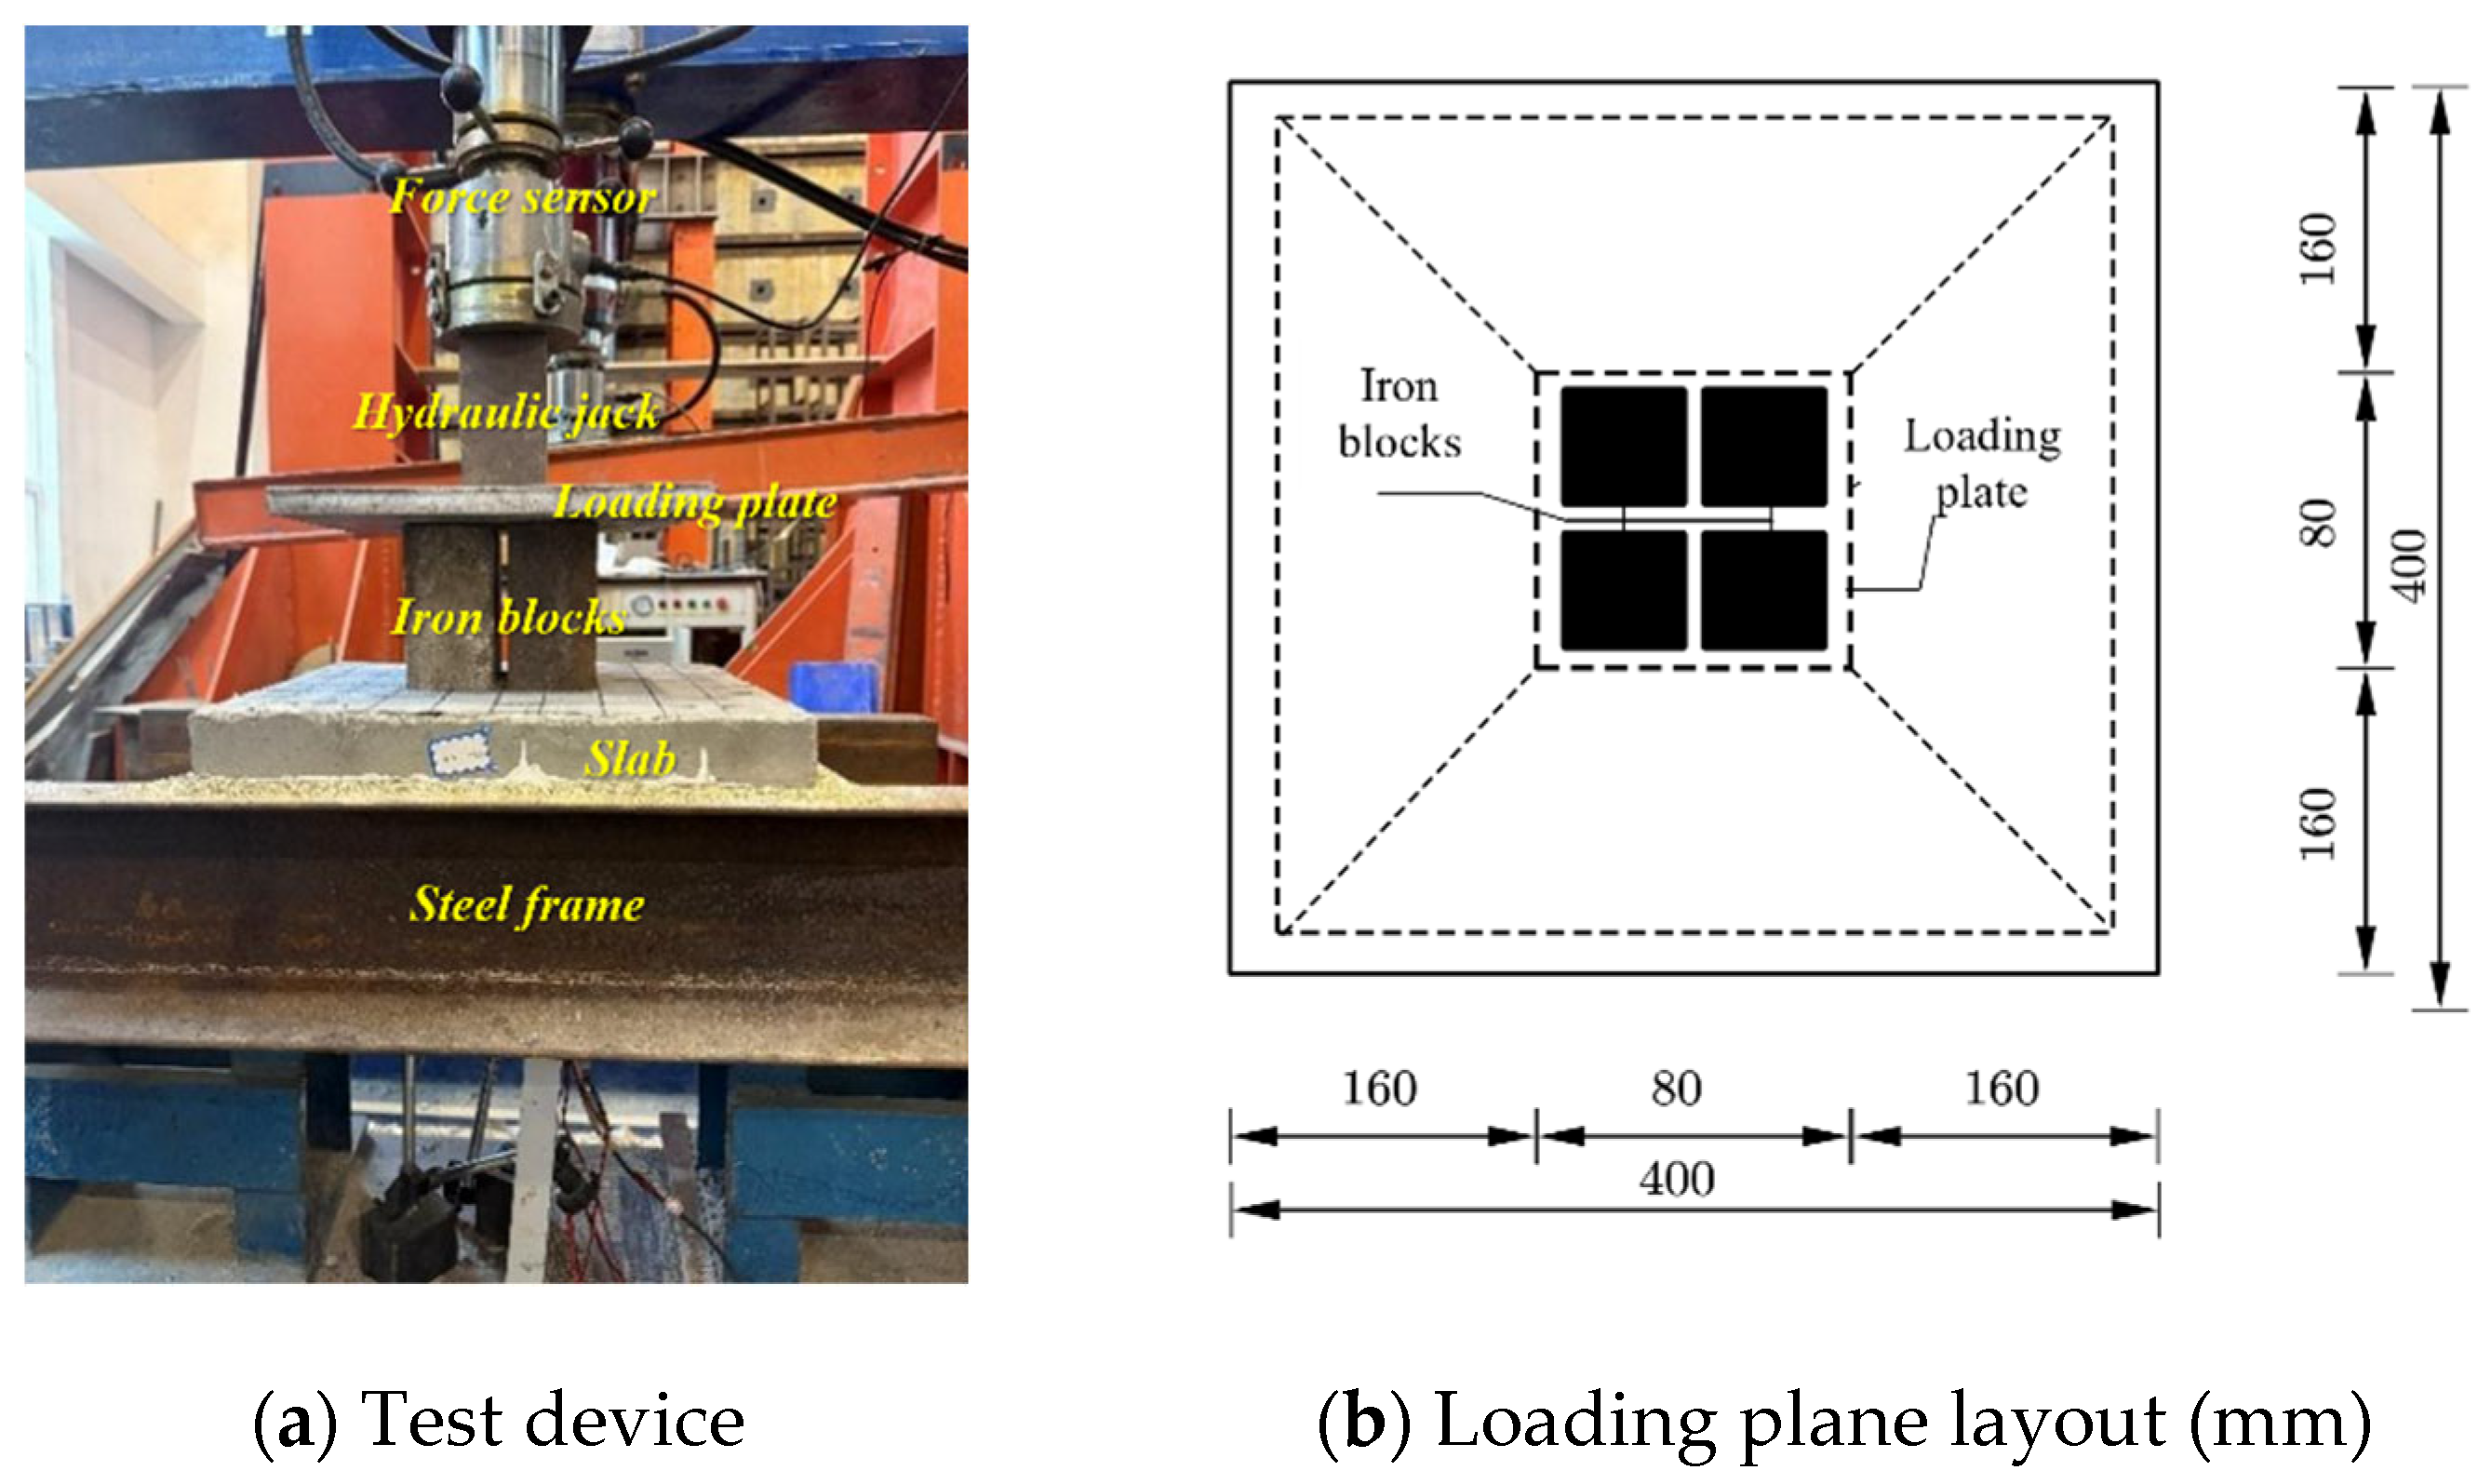
The experimental loading device is shown in Figure 4. The test load was applied by a hydraulic jack, and the magnitude of the load was measured by a resistive pressure sensor. Due to the small size and span of the slabs, they were directly placed on a specially designed steel frame for loading in this test. A four-point distribution loading setup was adopted to simulate local uniform loading on the slab center. This configuration mimics realistic loading conditions where concentrated loads, such as heavy equipment or stacked materials, are applied to a specific area of the slab. Using four iron blocks distributes the applied force, preventing local crushing of the concrete under the hydraulic jack and ensuring the load is transferred to the slab as a distributed patch load rather than a single point load. The loading plate was placed on top of the iron blocks to ensure uniform force distribution among the blocks.
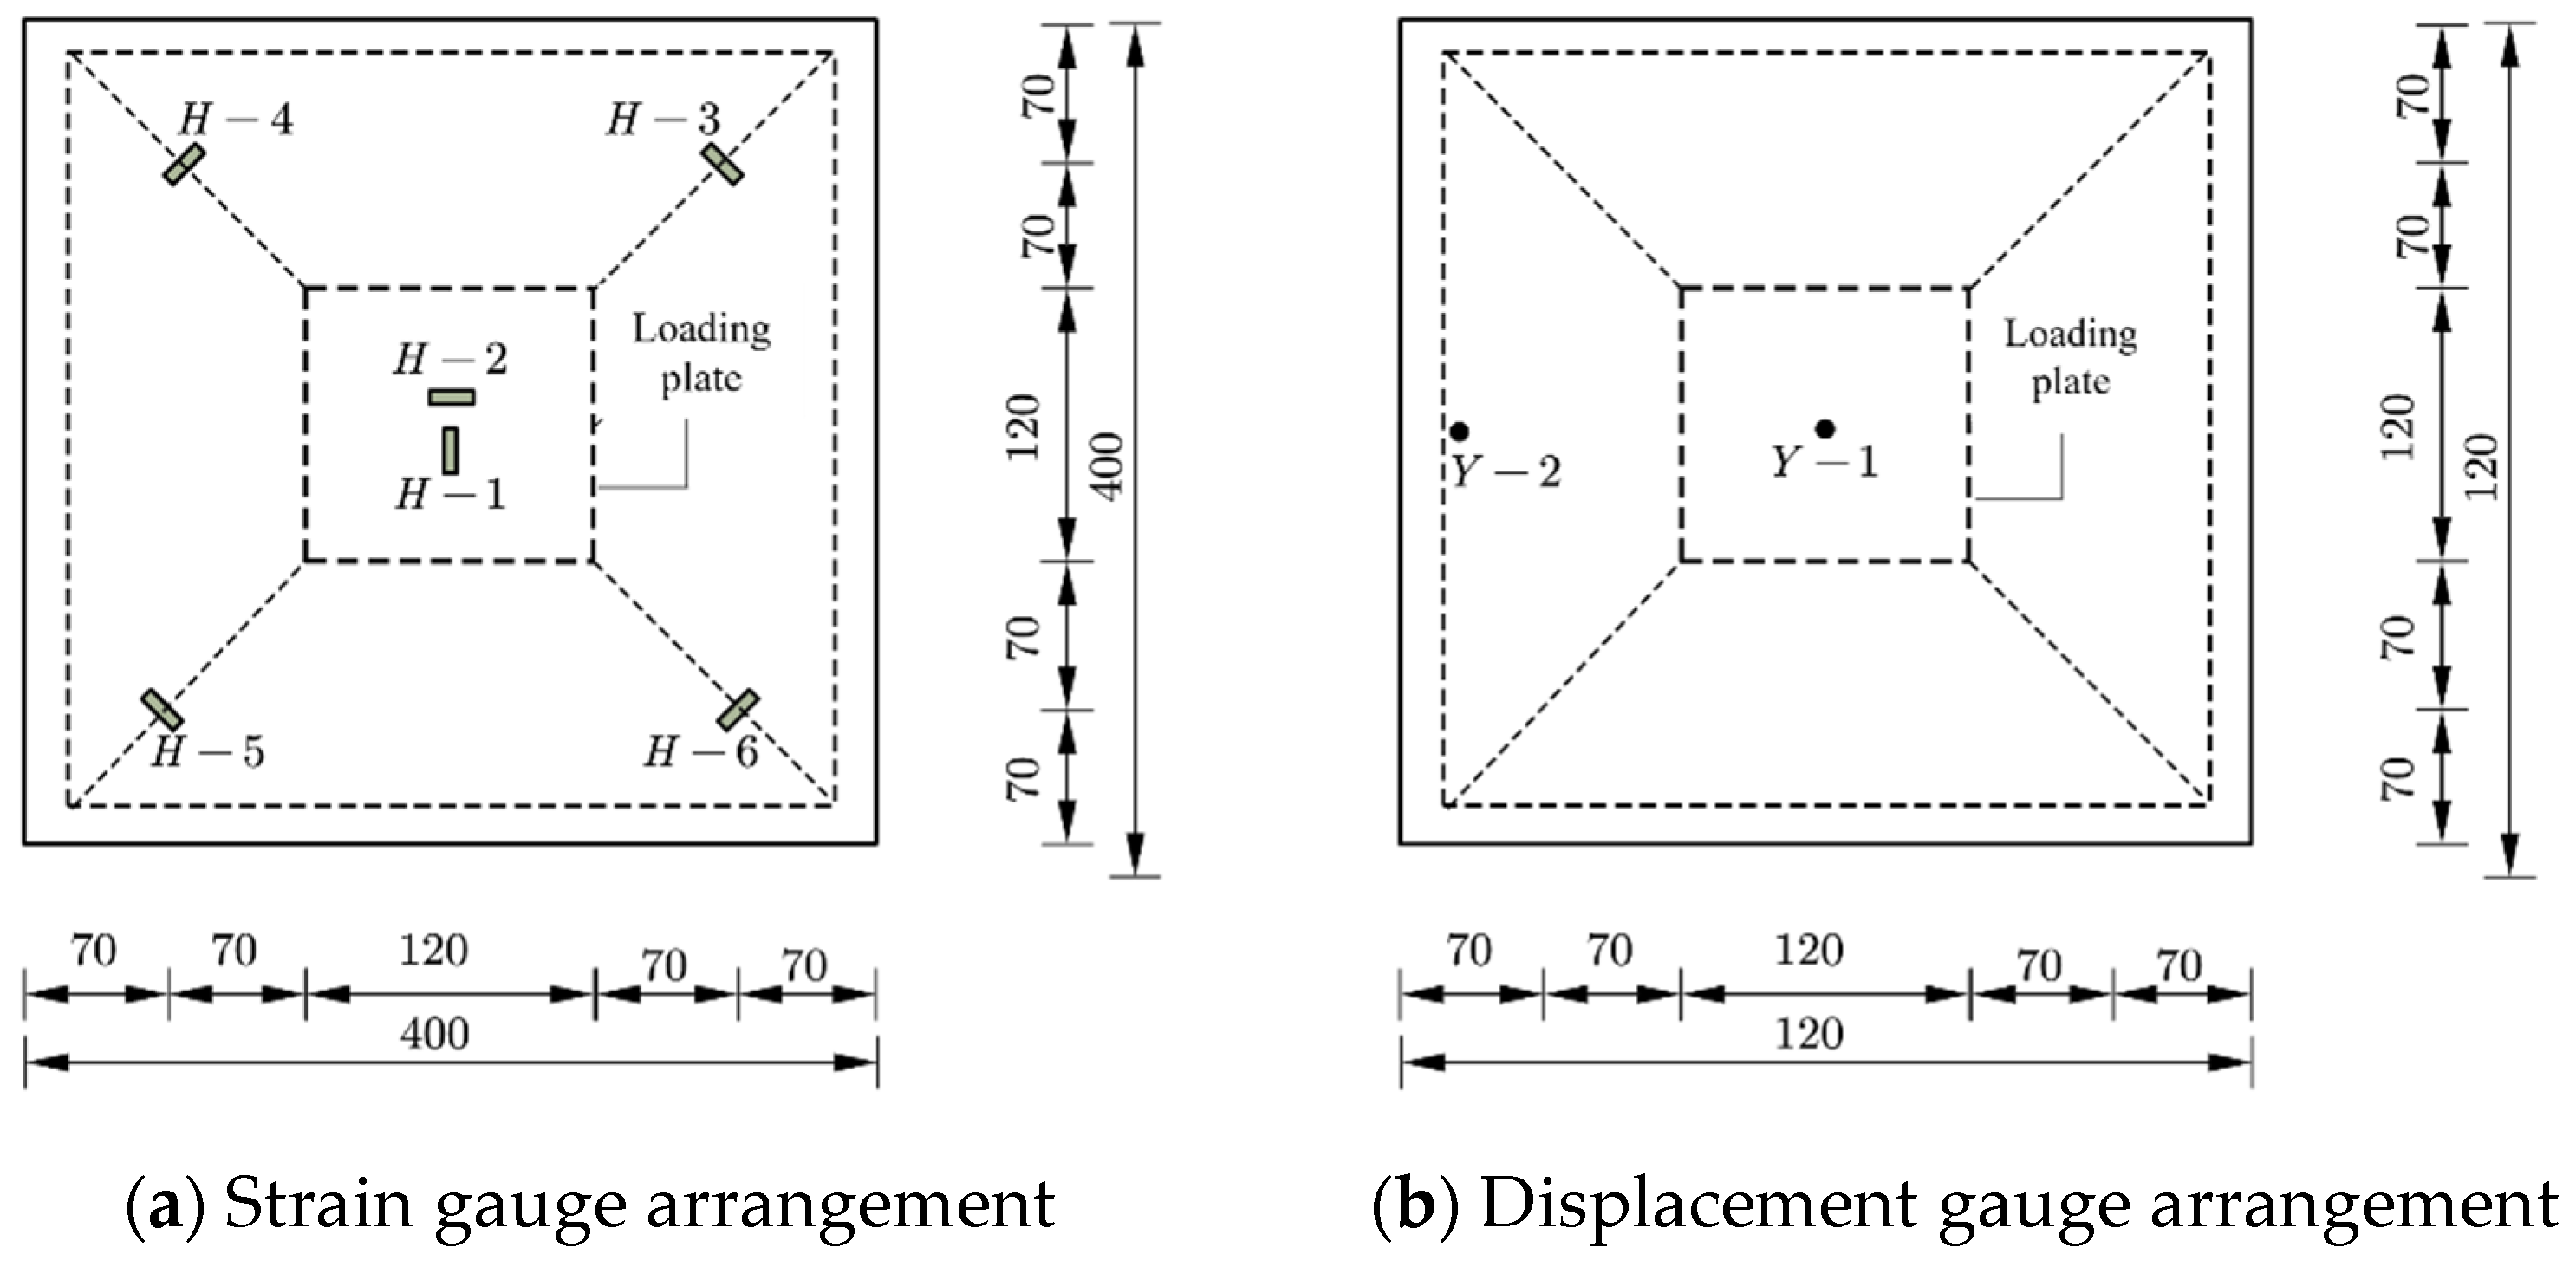
In the test, only strain gauges (5 × 20 mm) were arranged at the bottom of the slab. The arrangement of the strain gauges on the slab is shown in Figure 5a. Among them, H-1 and H-2 are the transverse and longitudinal concrete strain gauges in the middle of the bottom surface of the slab. H-3 to H-6 are corner concrete strain gauges. Since the slab is a square and the loading mode is center-symmetric, only two displacement measurement points are arranged to measure the vertical displacement of the center and the edge. In addition, the crack widths on the slab surface were measured manually using a digital caliper with an accuracy of 0.01 mm, as shown in Figure 5b.

2.2.3. Drop Hammer Impact Test

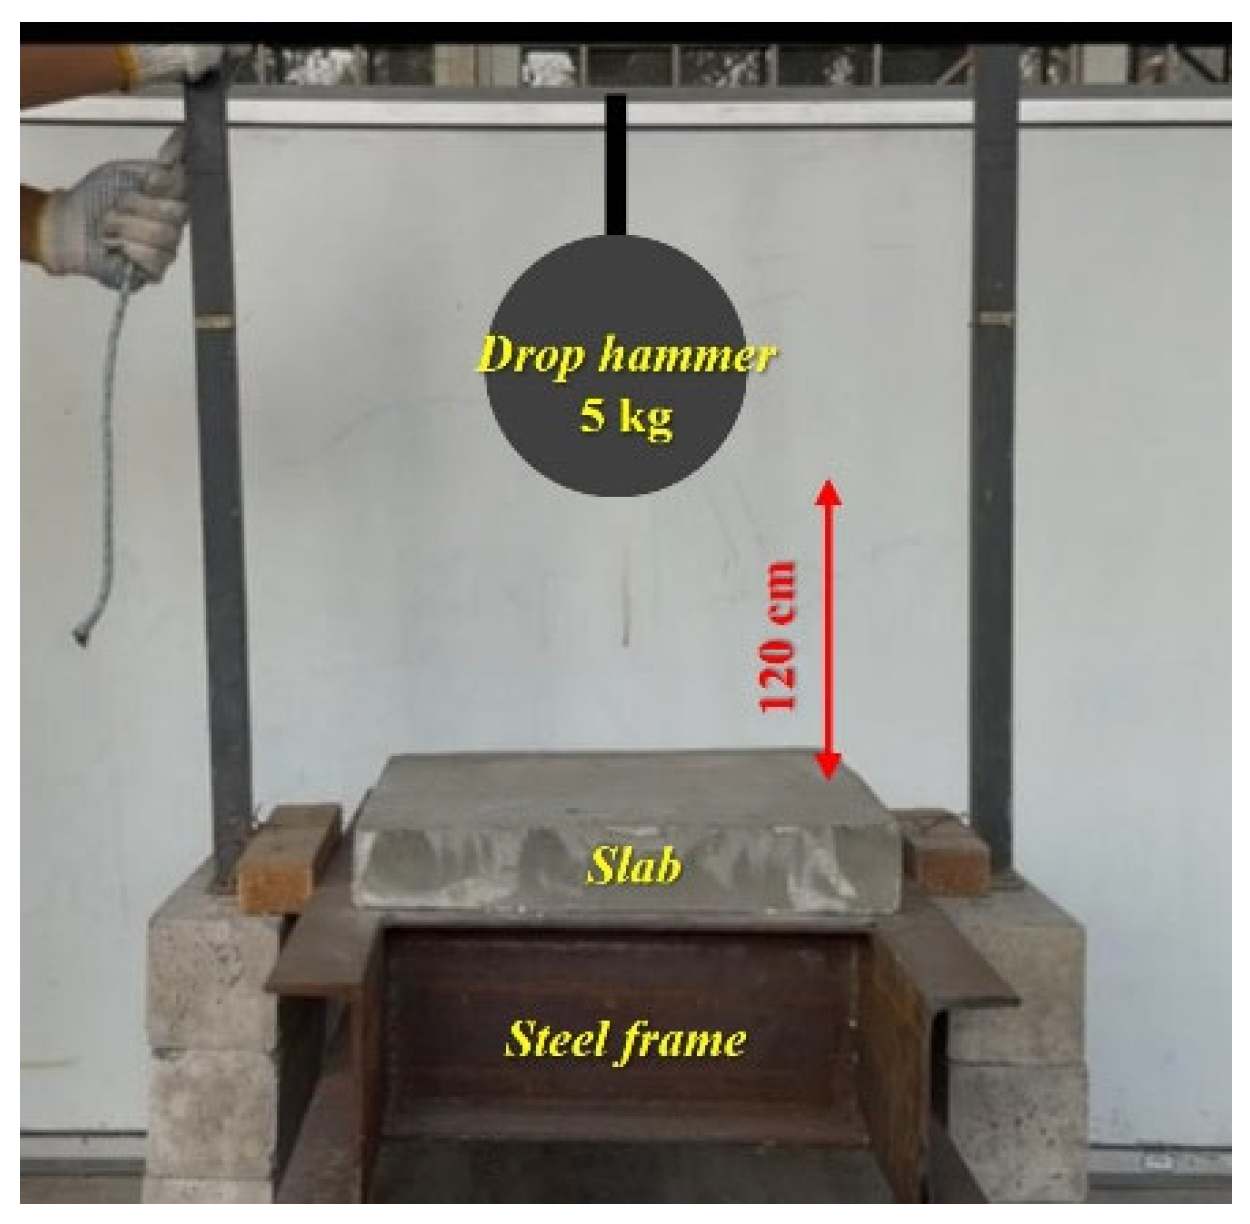
According to the requirements of the drop hammer impact test in the specification and taking into account the actual on-site test conditions [30], an impact test device was self-made, as shown in Figure 6. A steel frame was used to support the slab, so that the four sides were in a simply supported state. The drop hammer (5 kg) was raised to the height position (120 cm), ensuring that the position of the drop hammer was stable and the center of the drop hammer was aligned with the geometric center of the slab. The drop hammer falls freely and impacts the central area of the slab. Record the first crack impact times (N1) when the first crack appears on the slab, and the failure impact times (N2) when the slab is completely damaged.

3. Results and Discussion

3.1. Analysis of Static Load Test Results

3.1.1. Analysis of Failure Modes

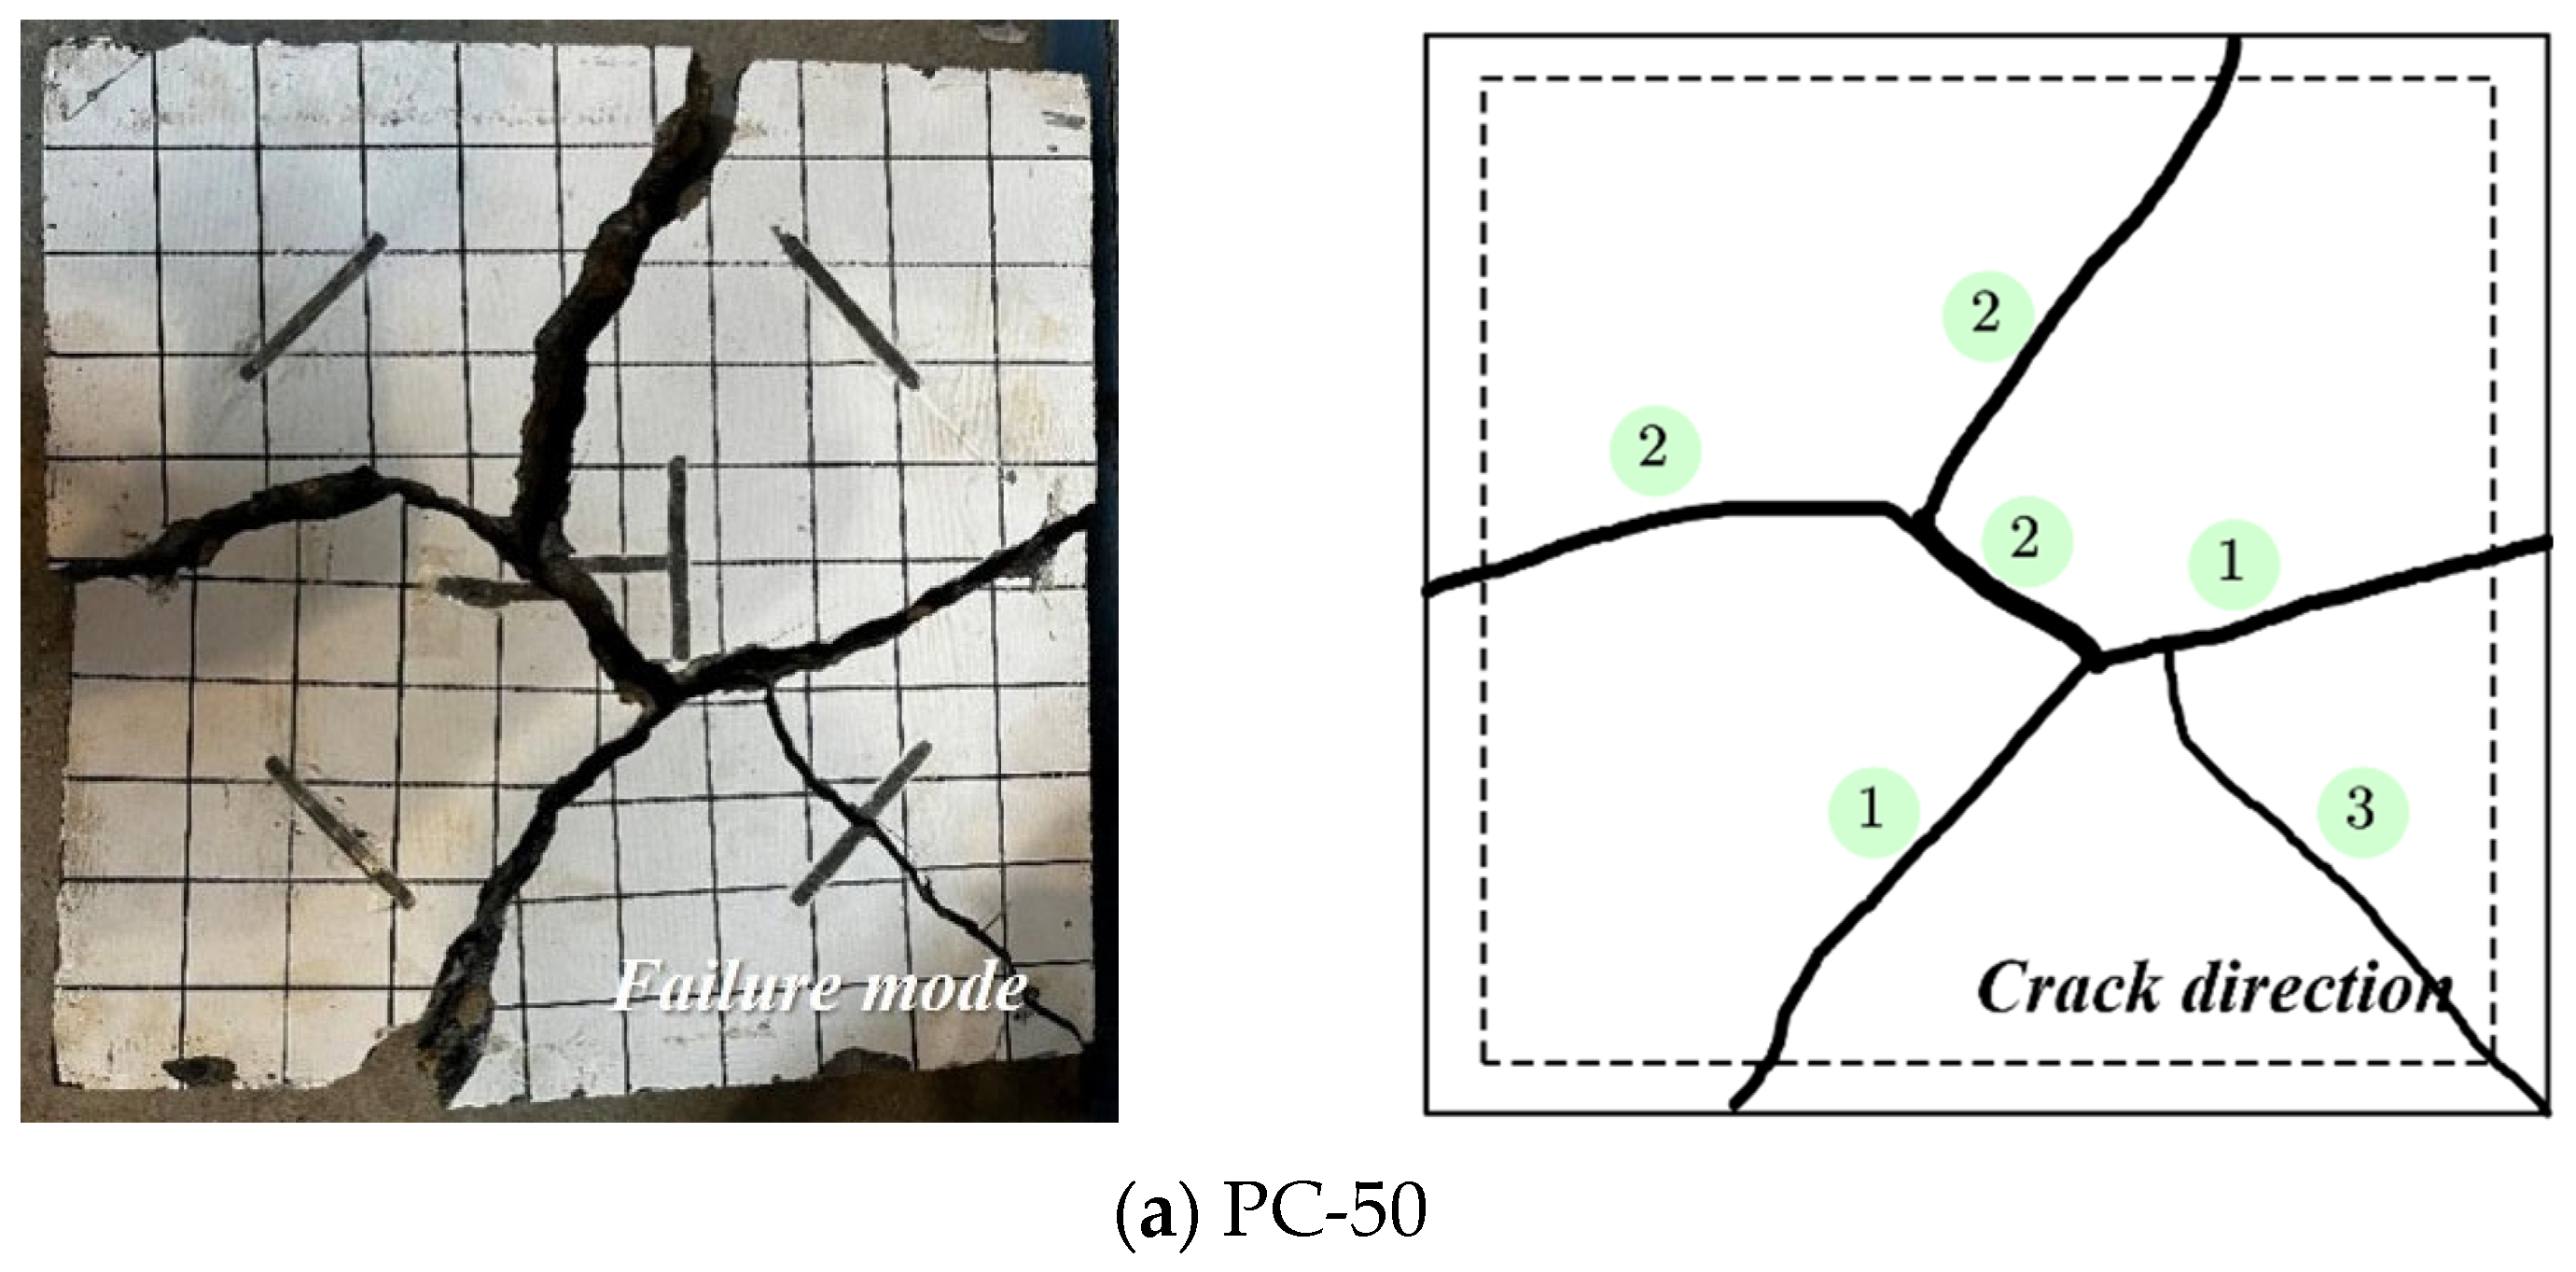
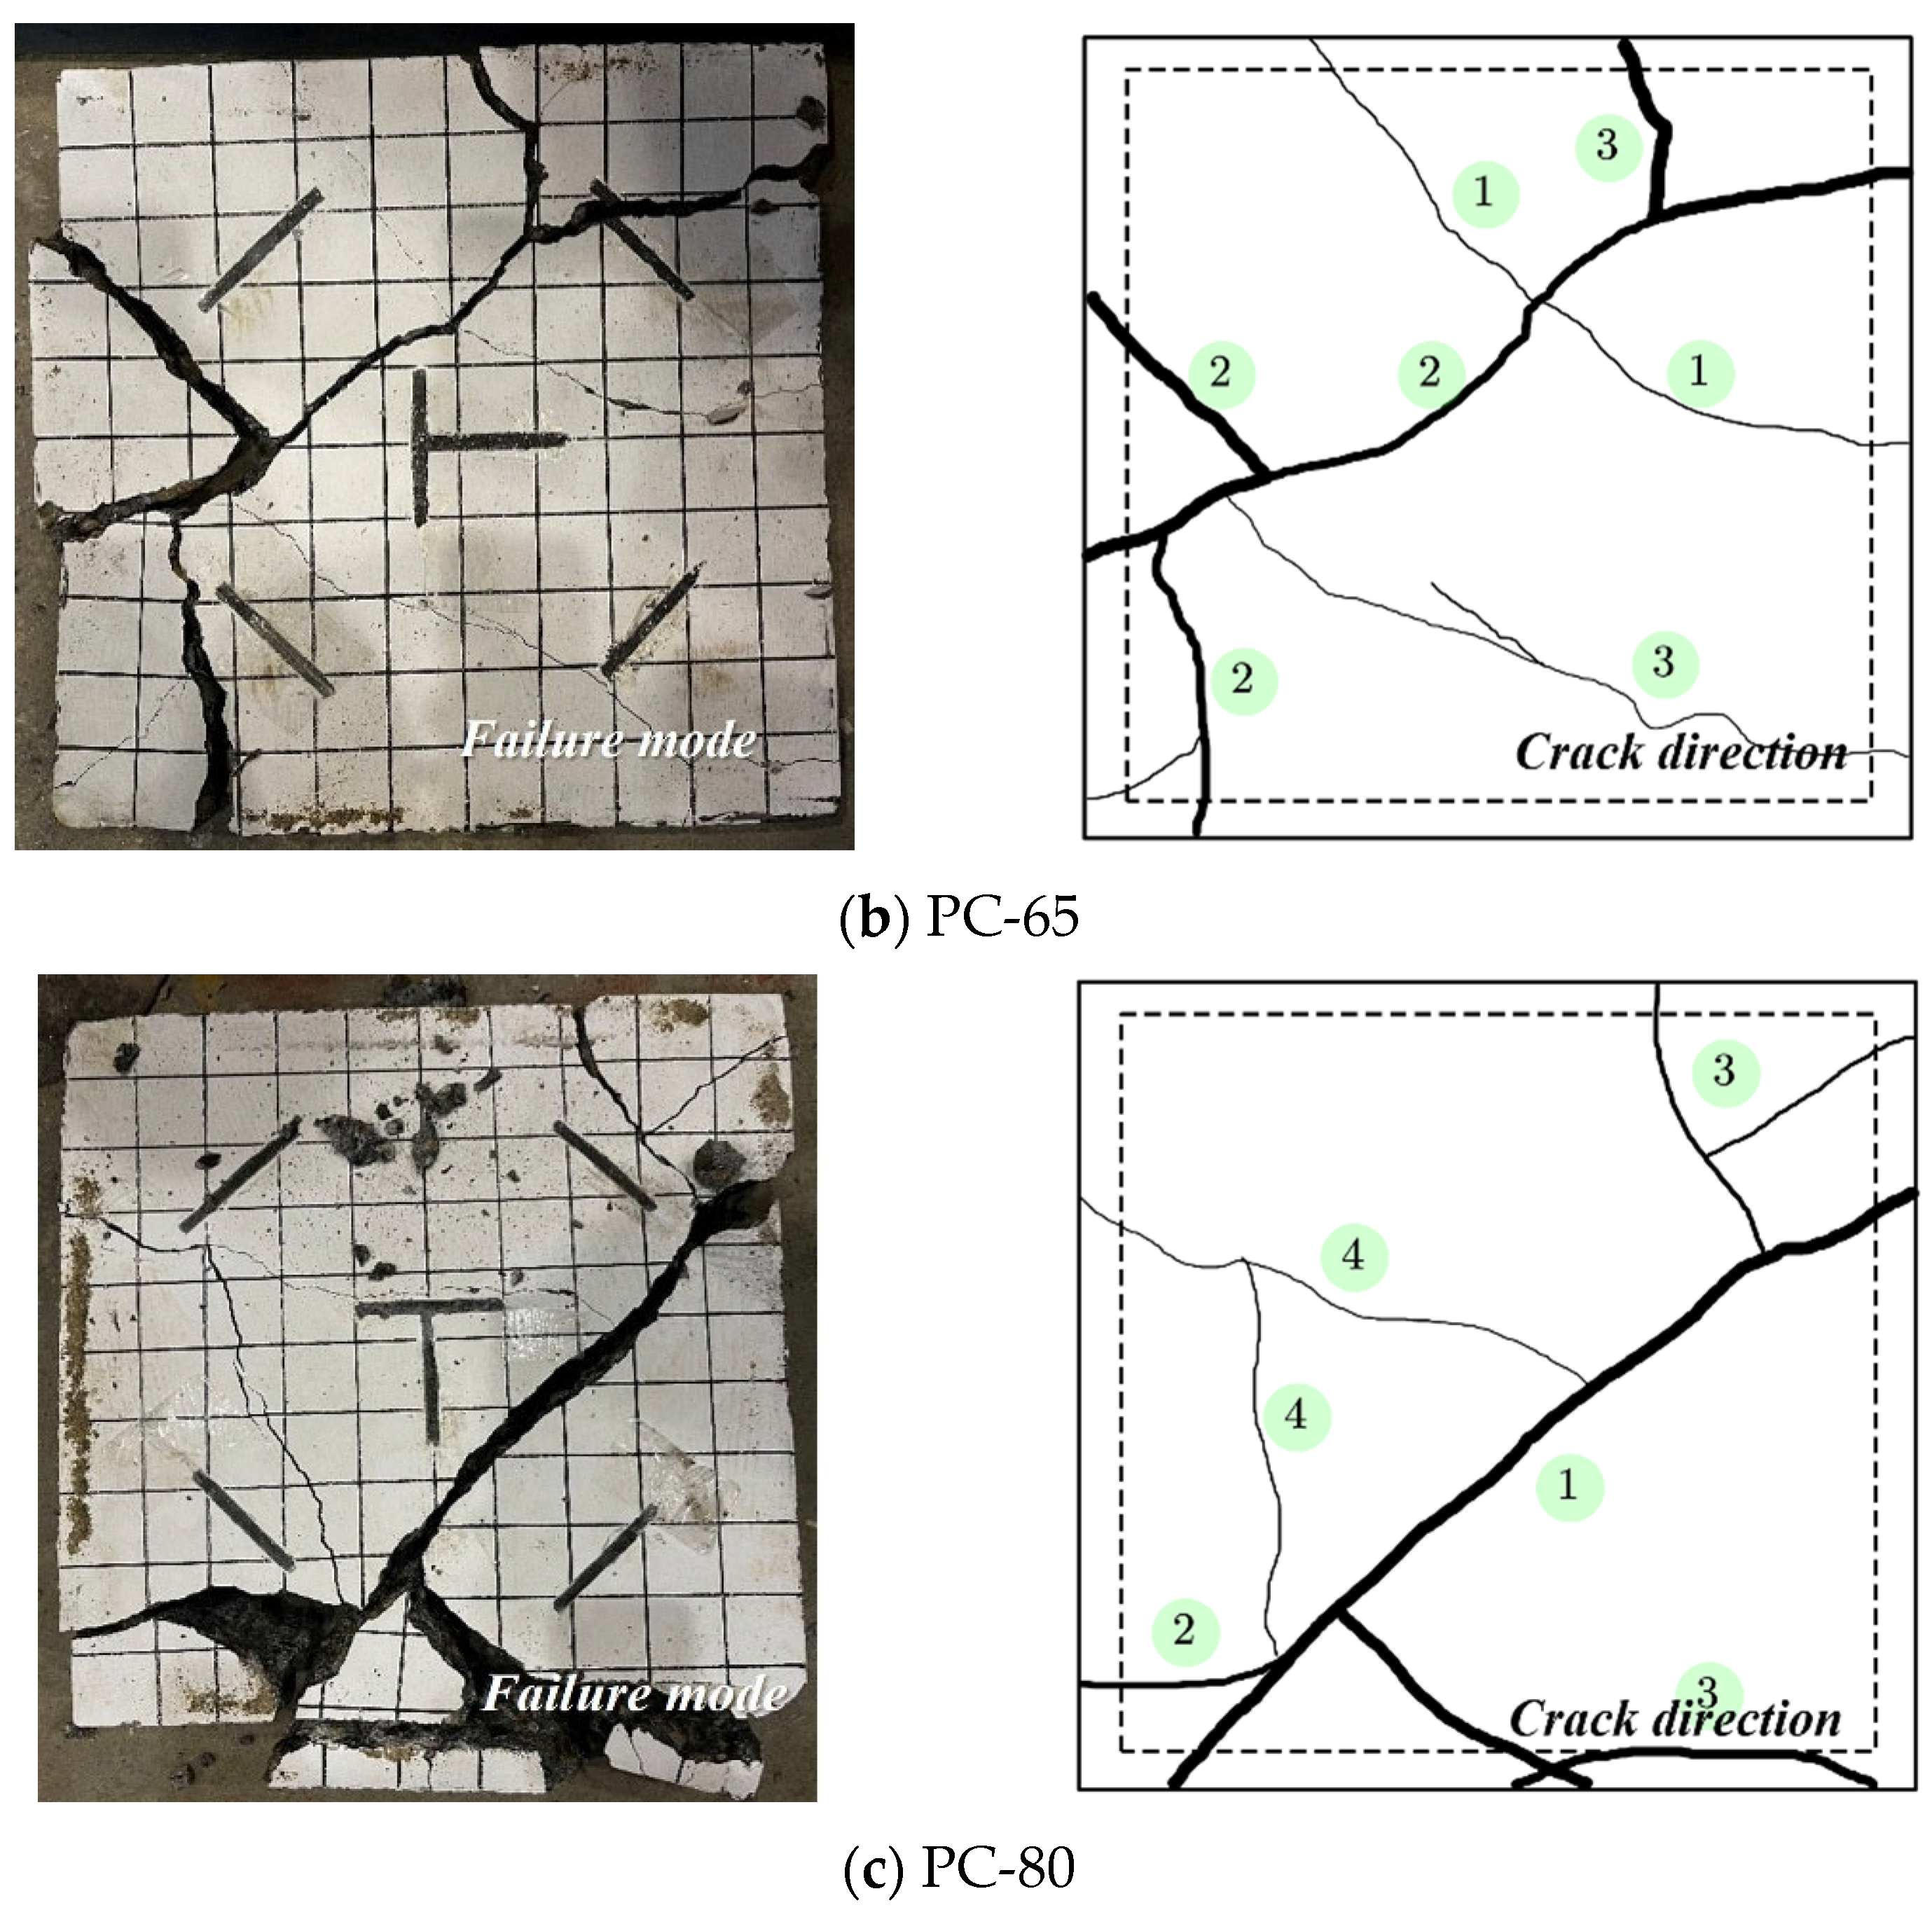
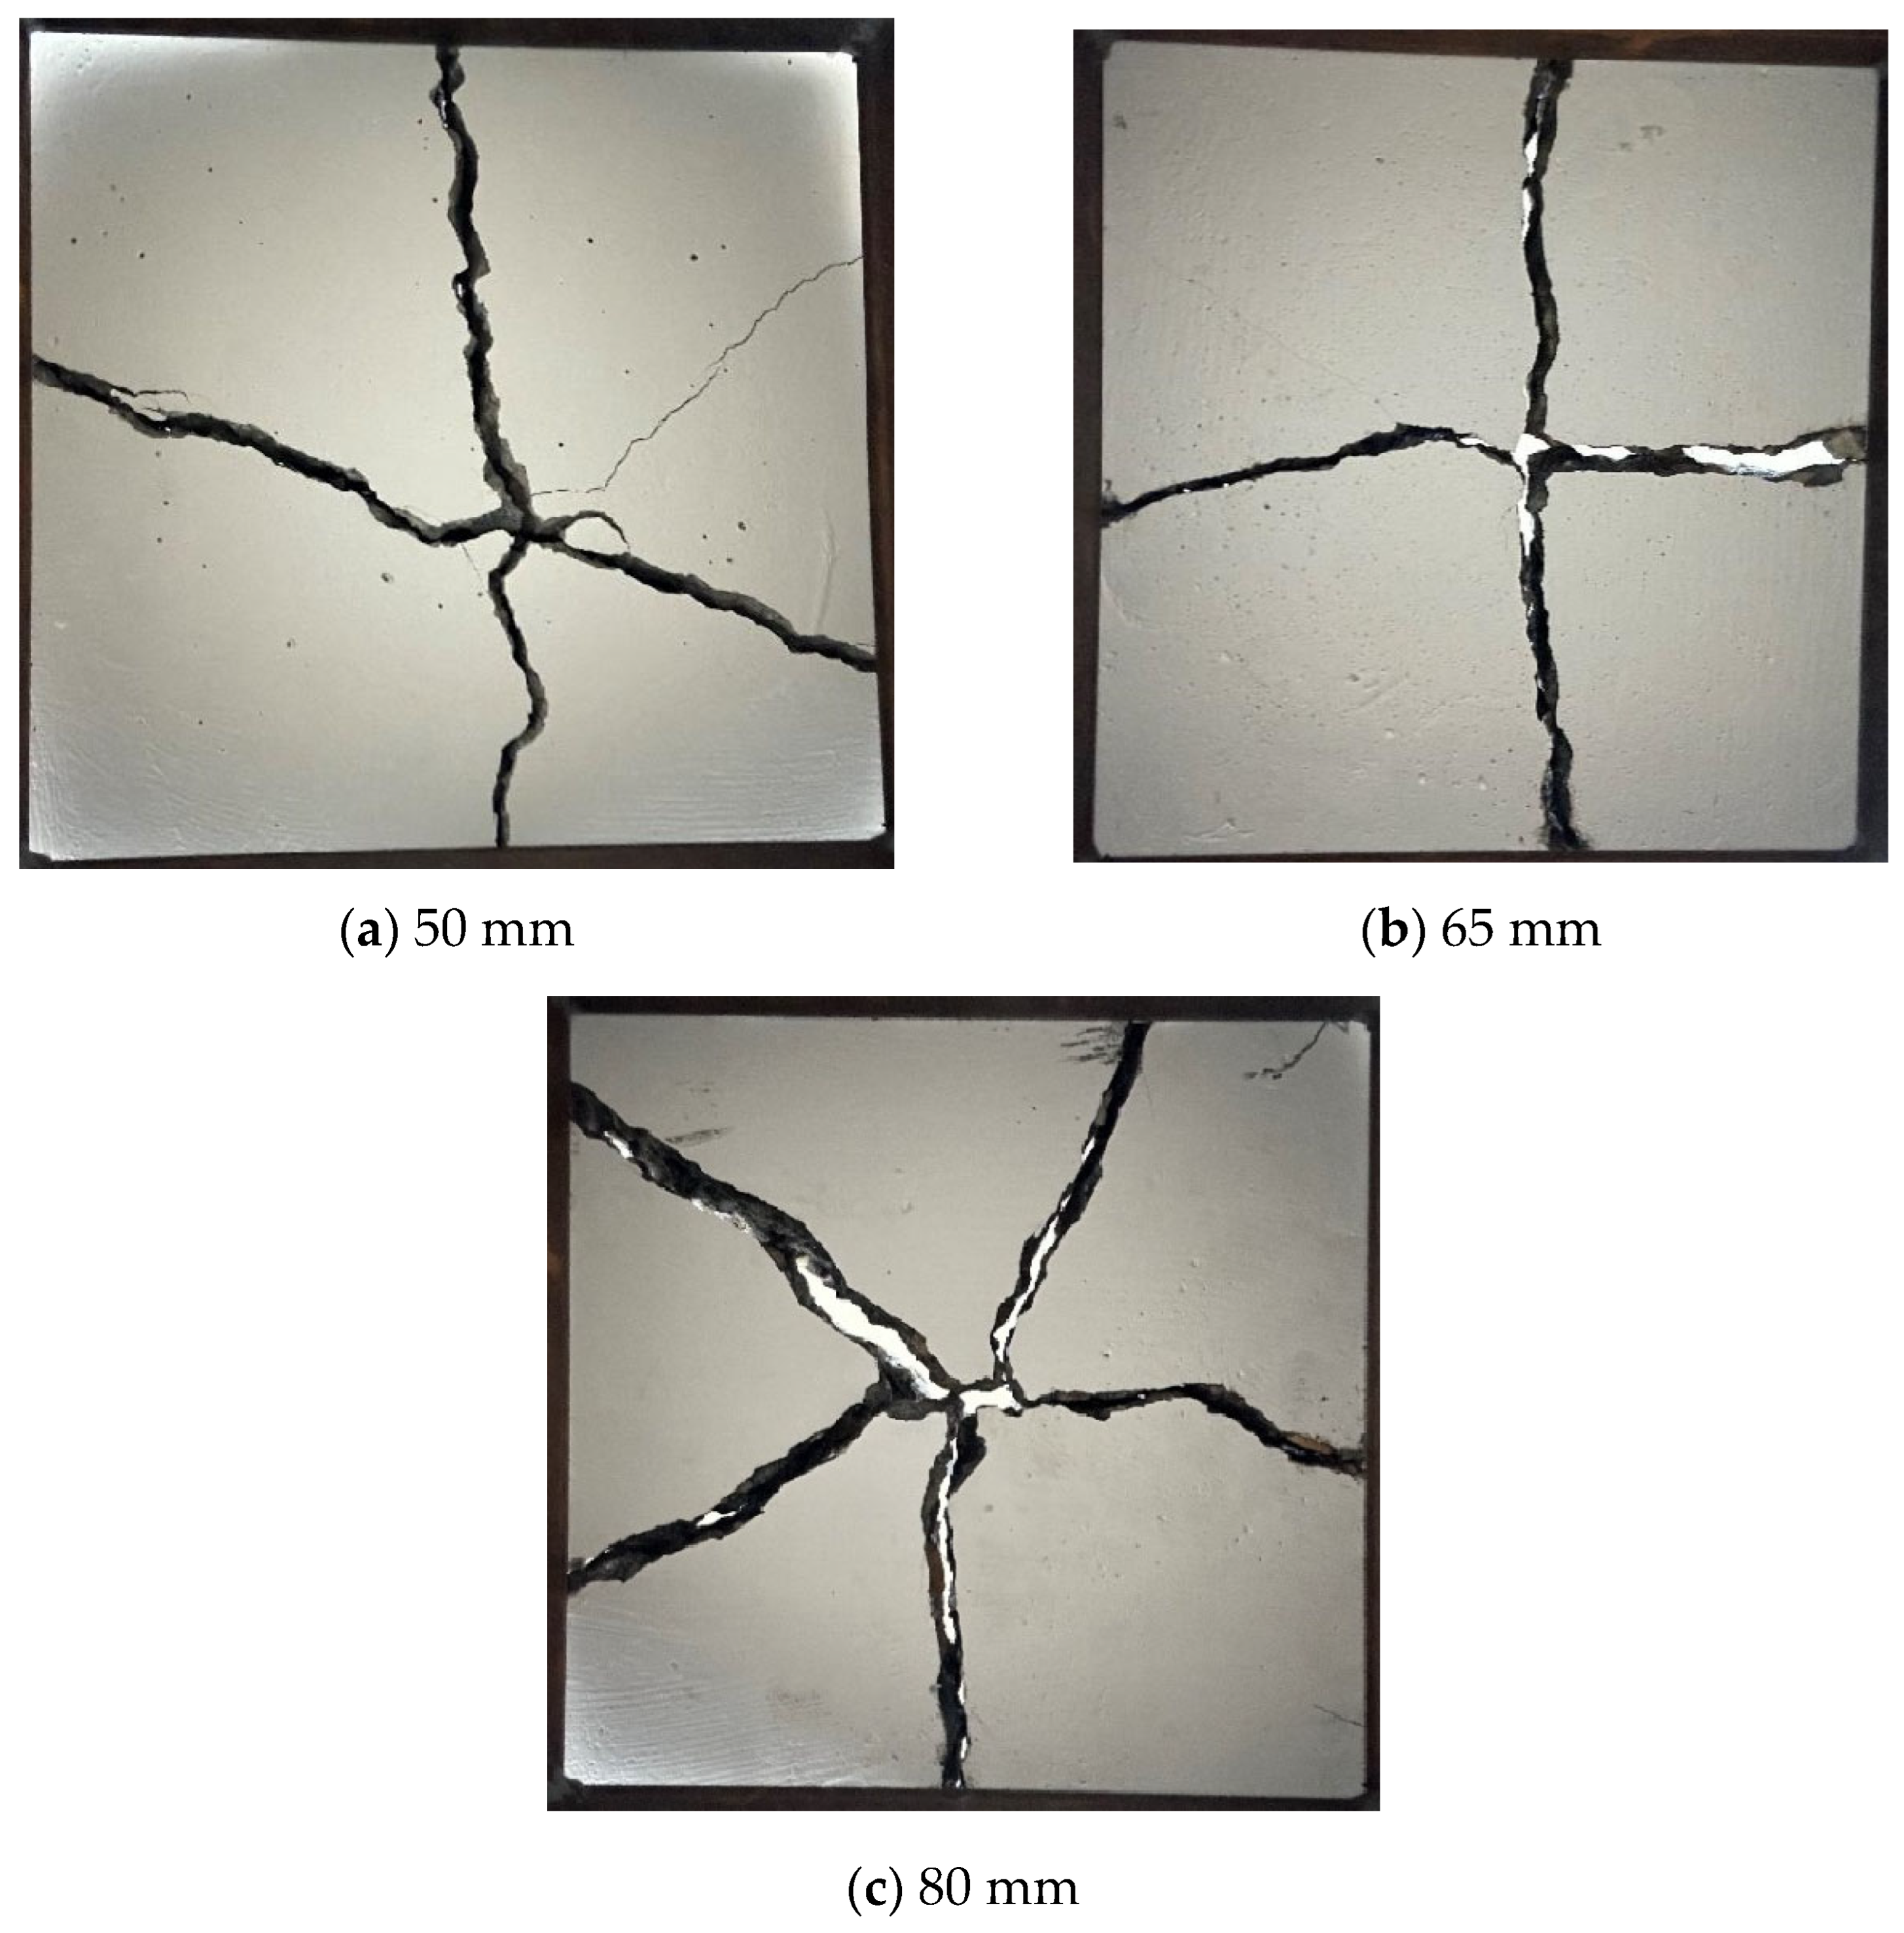
Three types of PC slabs (50/65/80 mm) exhibited shear failure, and their failure modes and crack directions are shown in Figure 7. With the increase in the thickness of slabs, the failure modes have been significantly improved. For PC-50, due to its relatively small thickness, the stress distribution was relatively uniform. Notably, in the final failure state, the main crack at the mid-span of PC-50 reached a width of 30 mm, with a few crack bifurcations observed. For PC-65 and PC-80 slabs, stress concentration initiated from the edge, and failure onset occurred along a main crack. In contrast, the PC-65 slab showed an increased number of cracks, with the emergence of minor cracks; the maximum opening width of its main crack at failure reduced to 12 mm and displayed a diagonal propagation trend. However, the PC-80 slab featured sparse crack distribution. Its main crack width was only 8 mm and extended almost linearly along the direction of the major principal stress.
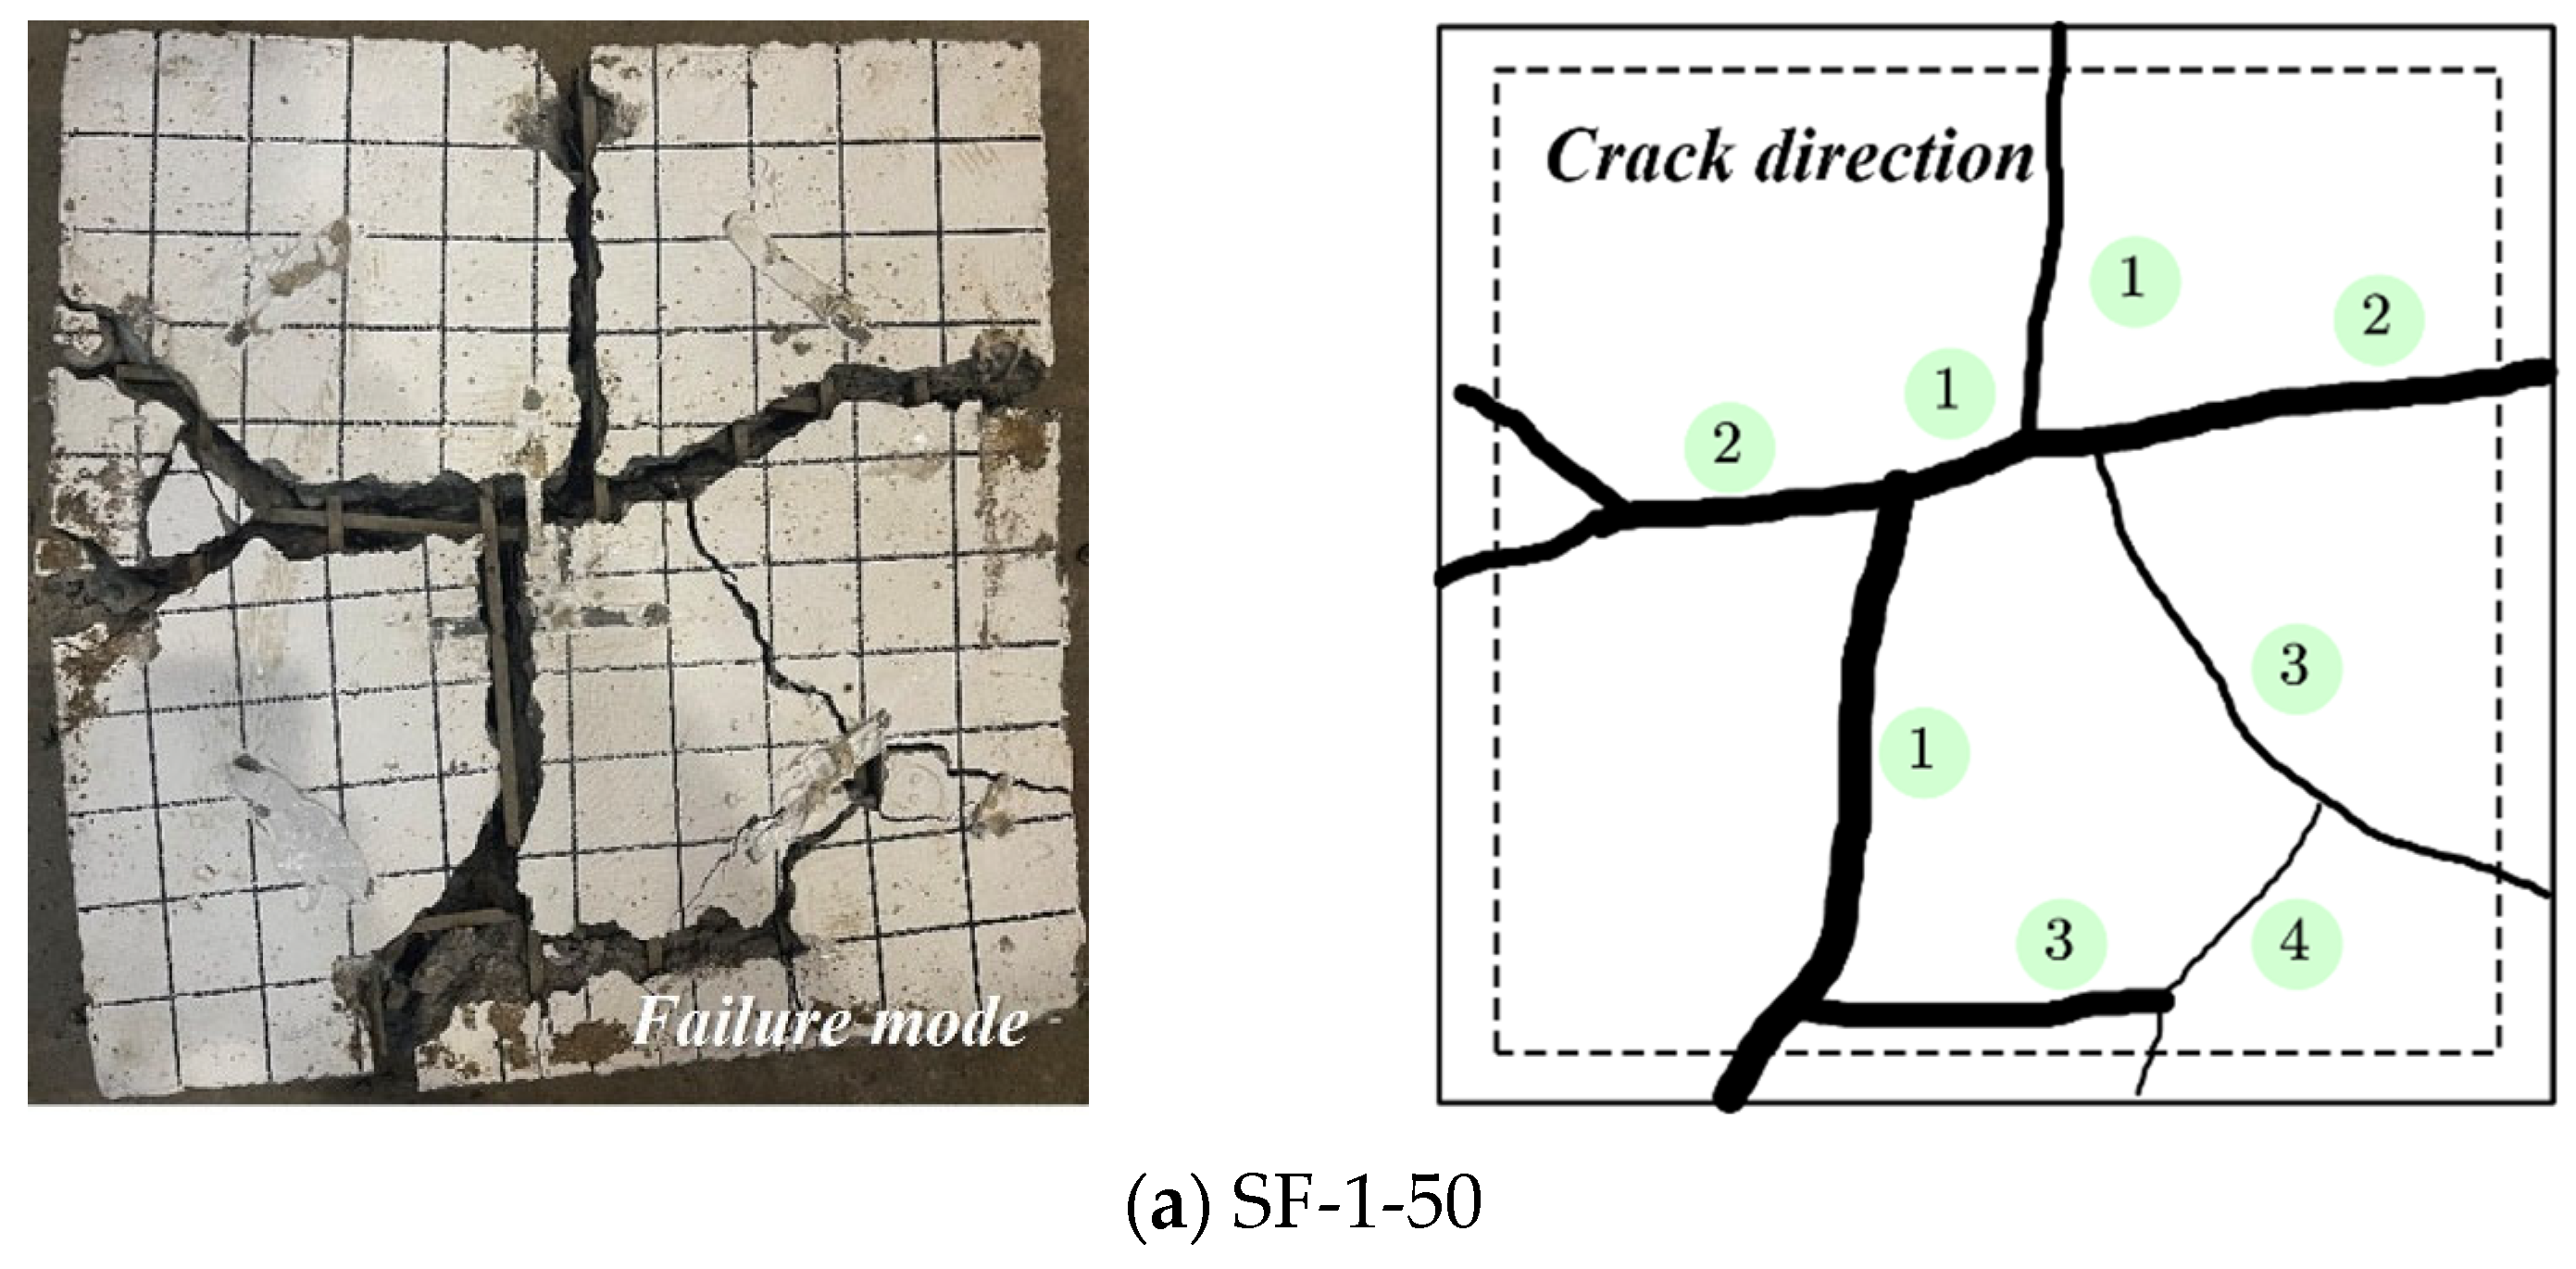
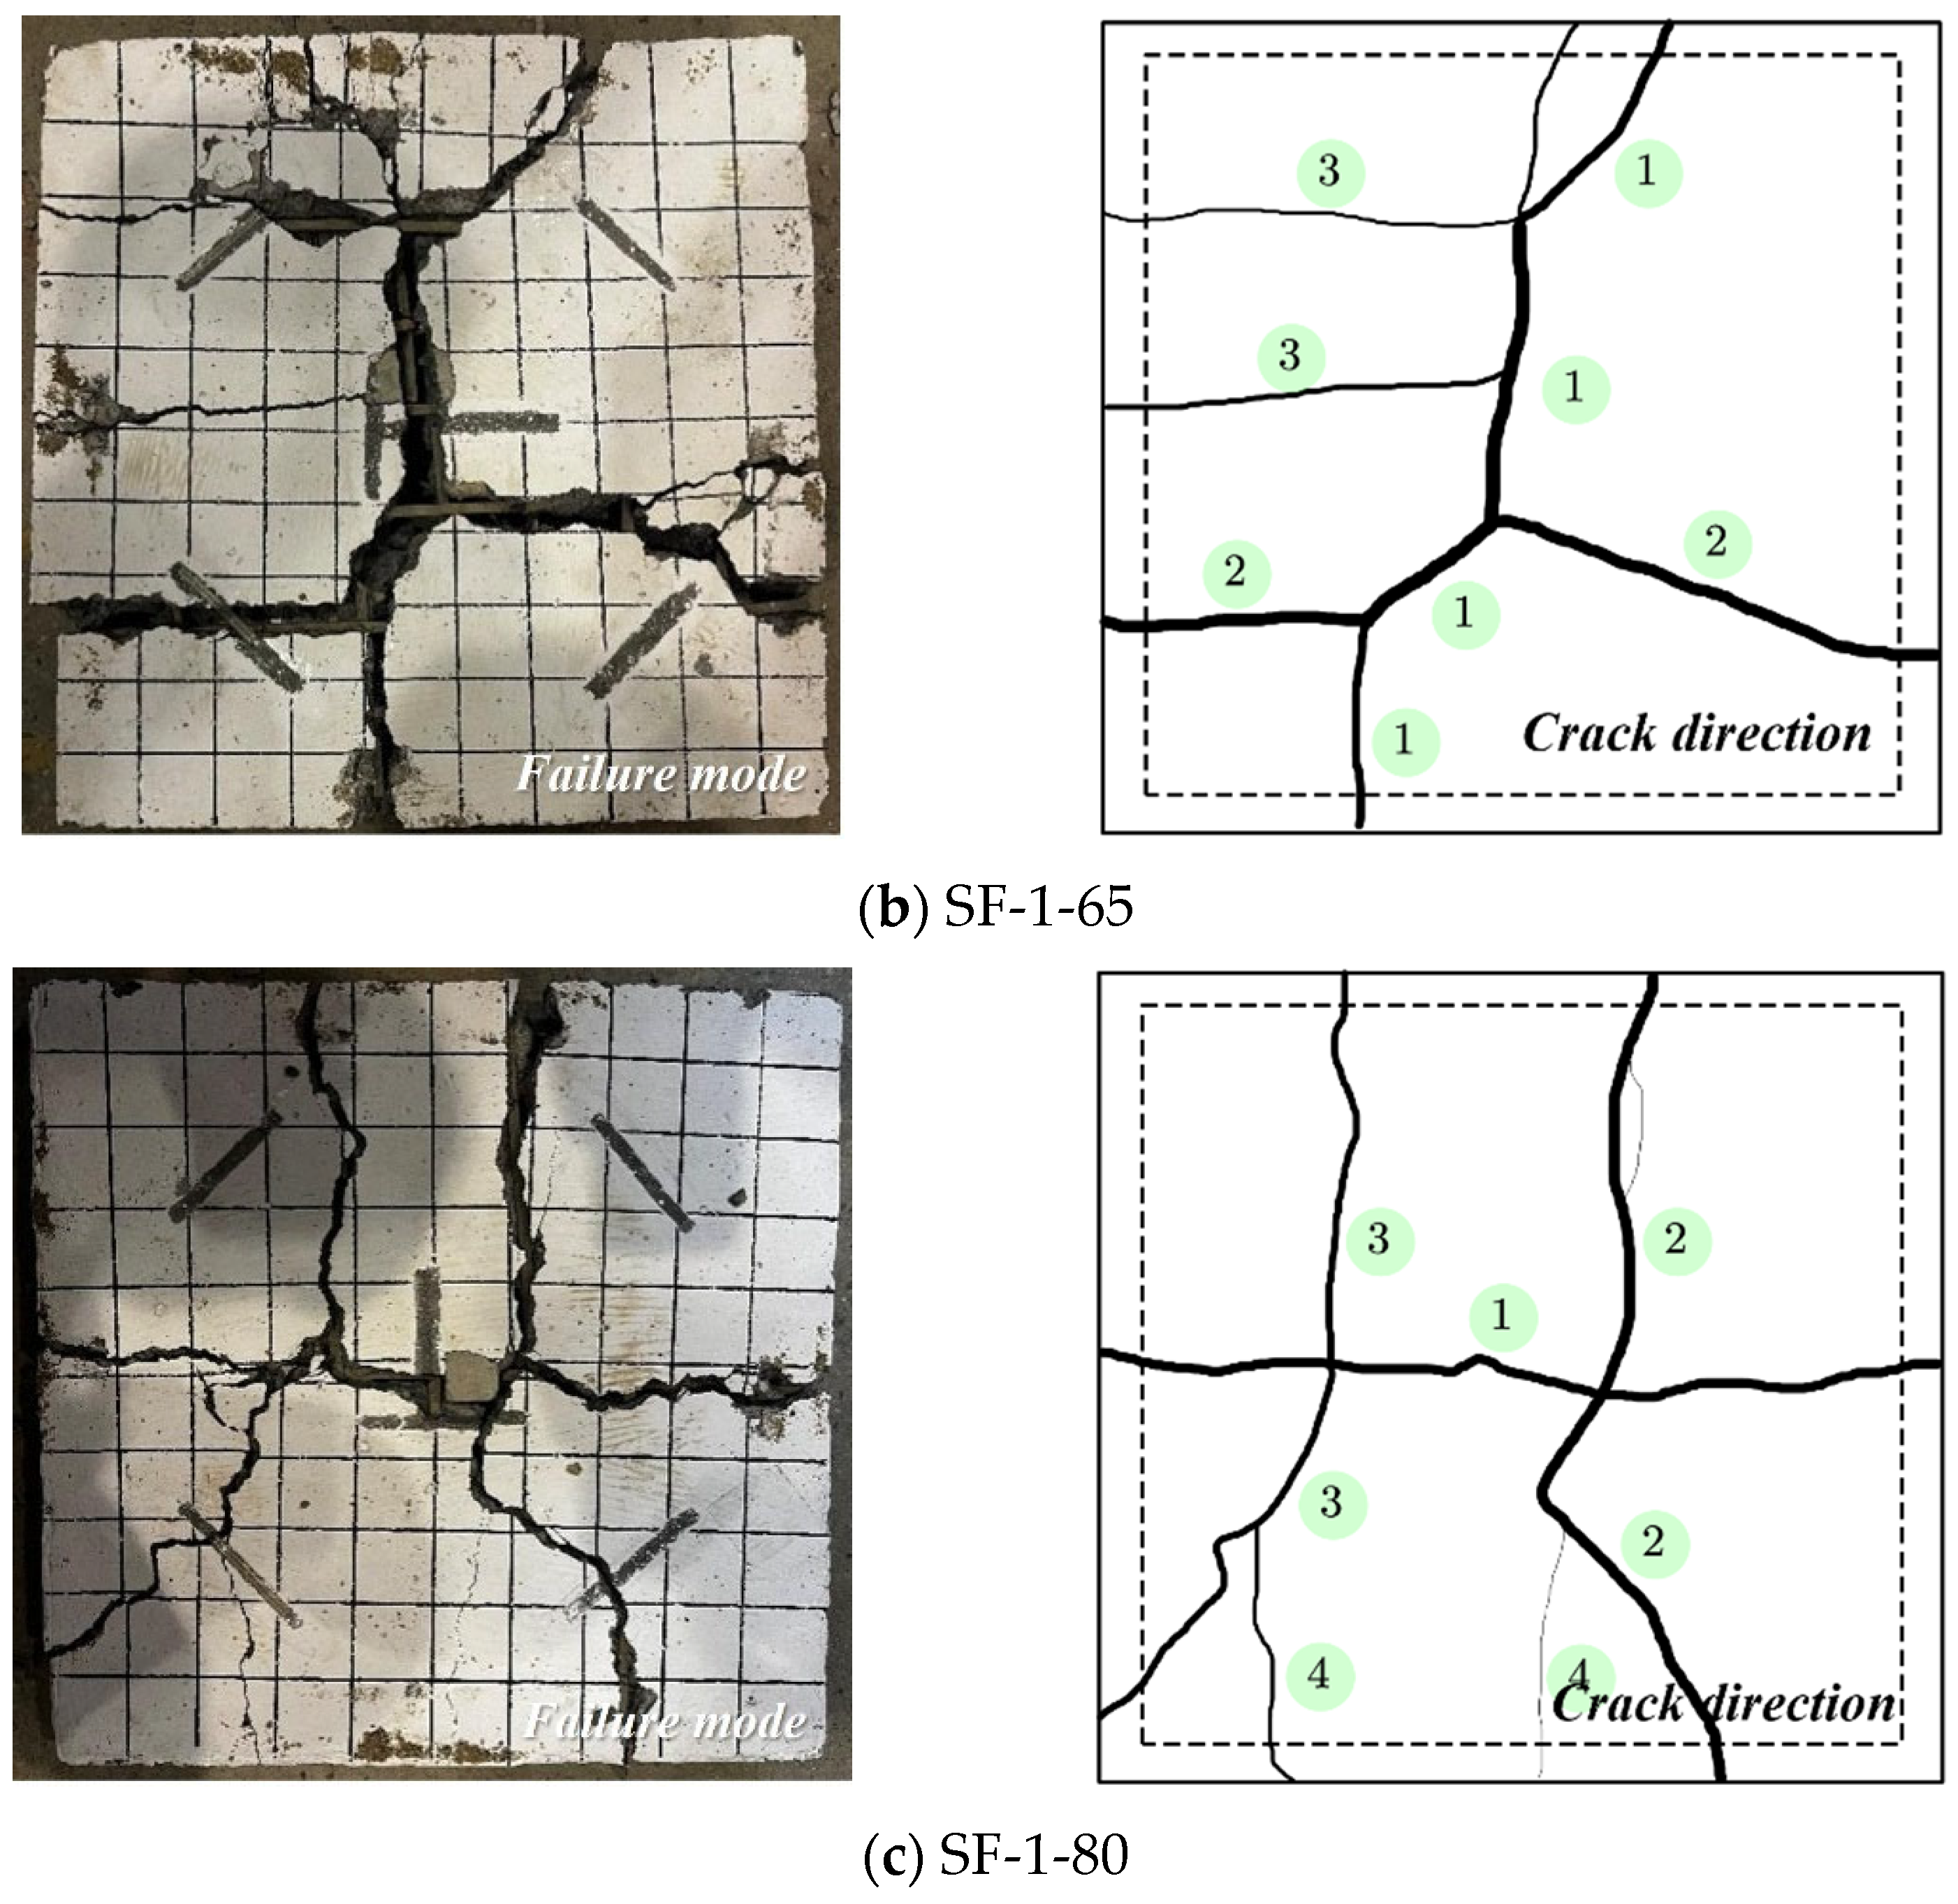
Slabs with 1% SF dosage exhibited bending failure, and their failure modes and crack directions are shown in Figure 8. Cracks were concentrated near the loading point, displaying a radial distribution with particular prominence in the middle. For SF-1-50, due to insufficient slab thickness, concentrated cracking tended to occur around the loading point. In this case, the crack resistance effect of SF was not obvious, with cracks characterized by large widths and disordered directions. For SF-1-65, the crack distribution tended to be uniform; the bridging effect of SF was enhanced, and the crack width was slightly reduced. Meanwhile, the crack directions showed a tendency to be parallel to one another, with not only uniform distribution but also improved symmetry. With increasing slab thickness, SF exhibits a bridging effect, and bamboo exerts tensile action, resulting in narrower cracks. However, the fiber constraint on longitudinal expansion remains limited, with through cracks still present in some areas. SF-1-80 shows the best crack resistance: SF effectively restrains crack propagation, leading to slower, more uniform crack development that forms a reticular distribution.
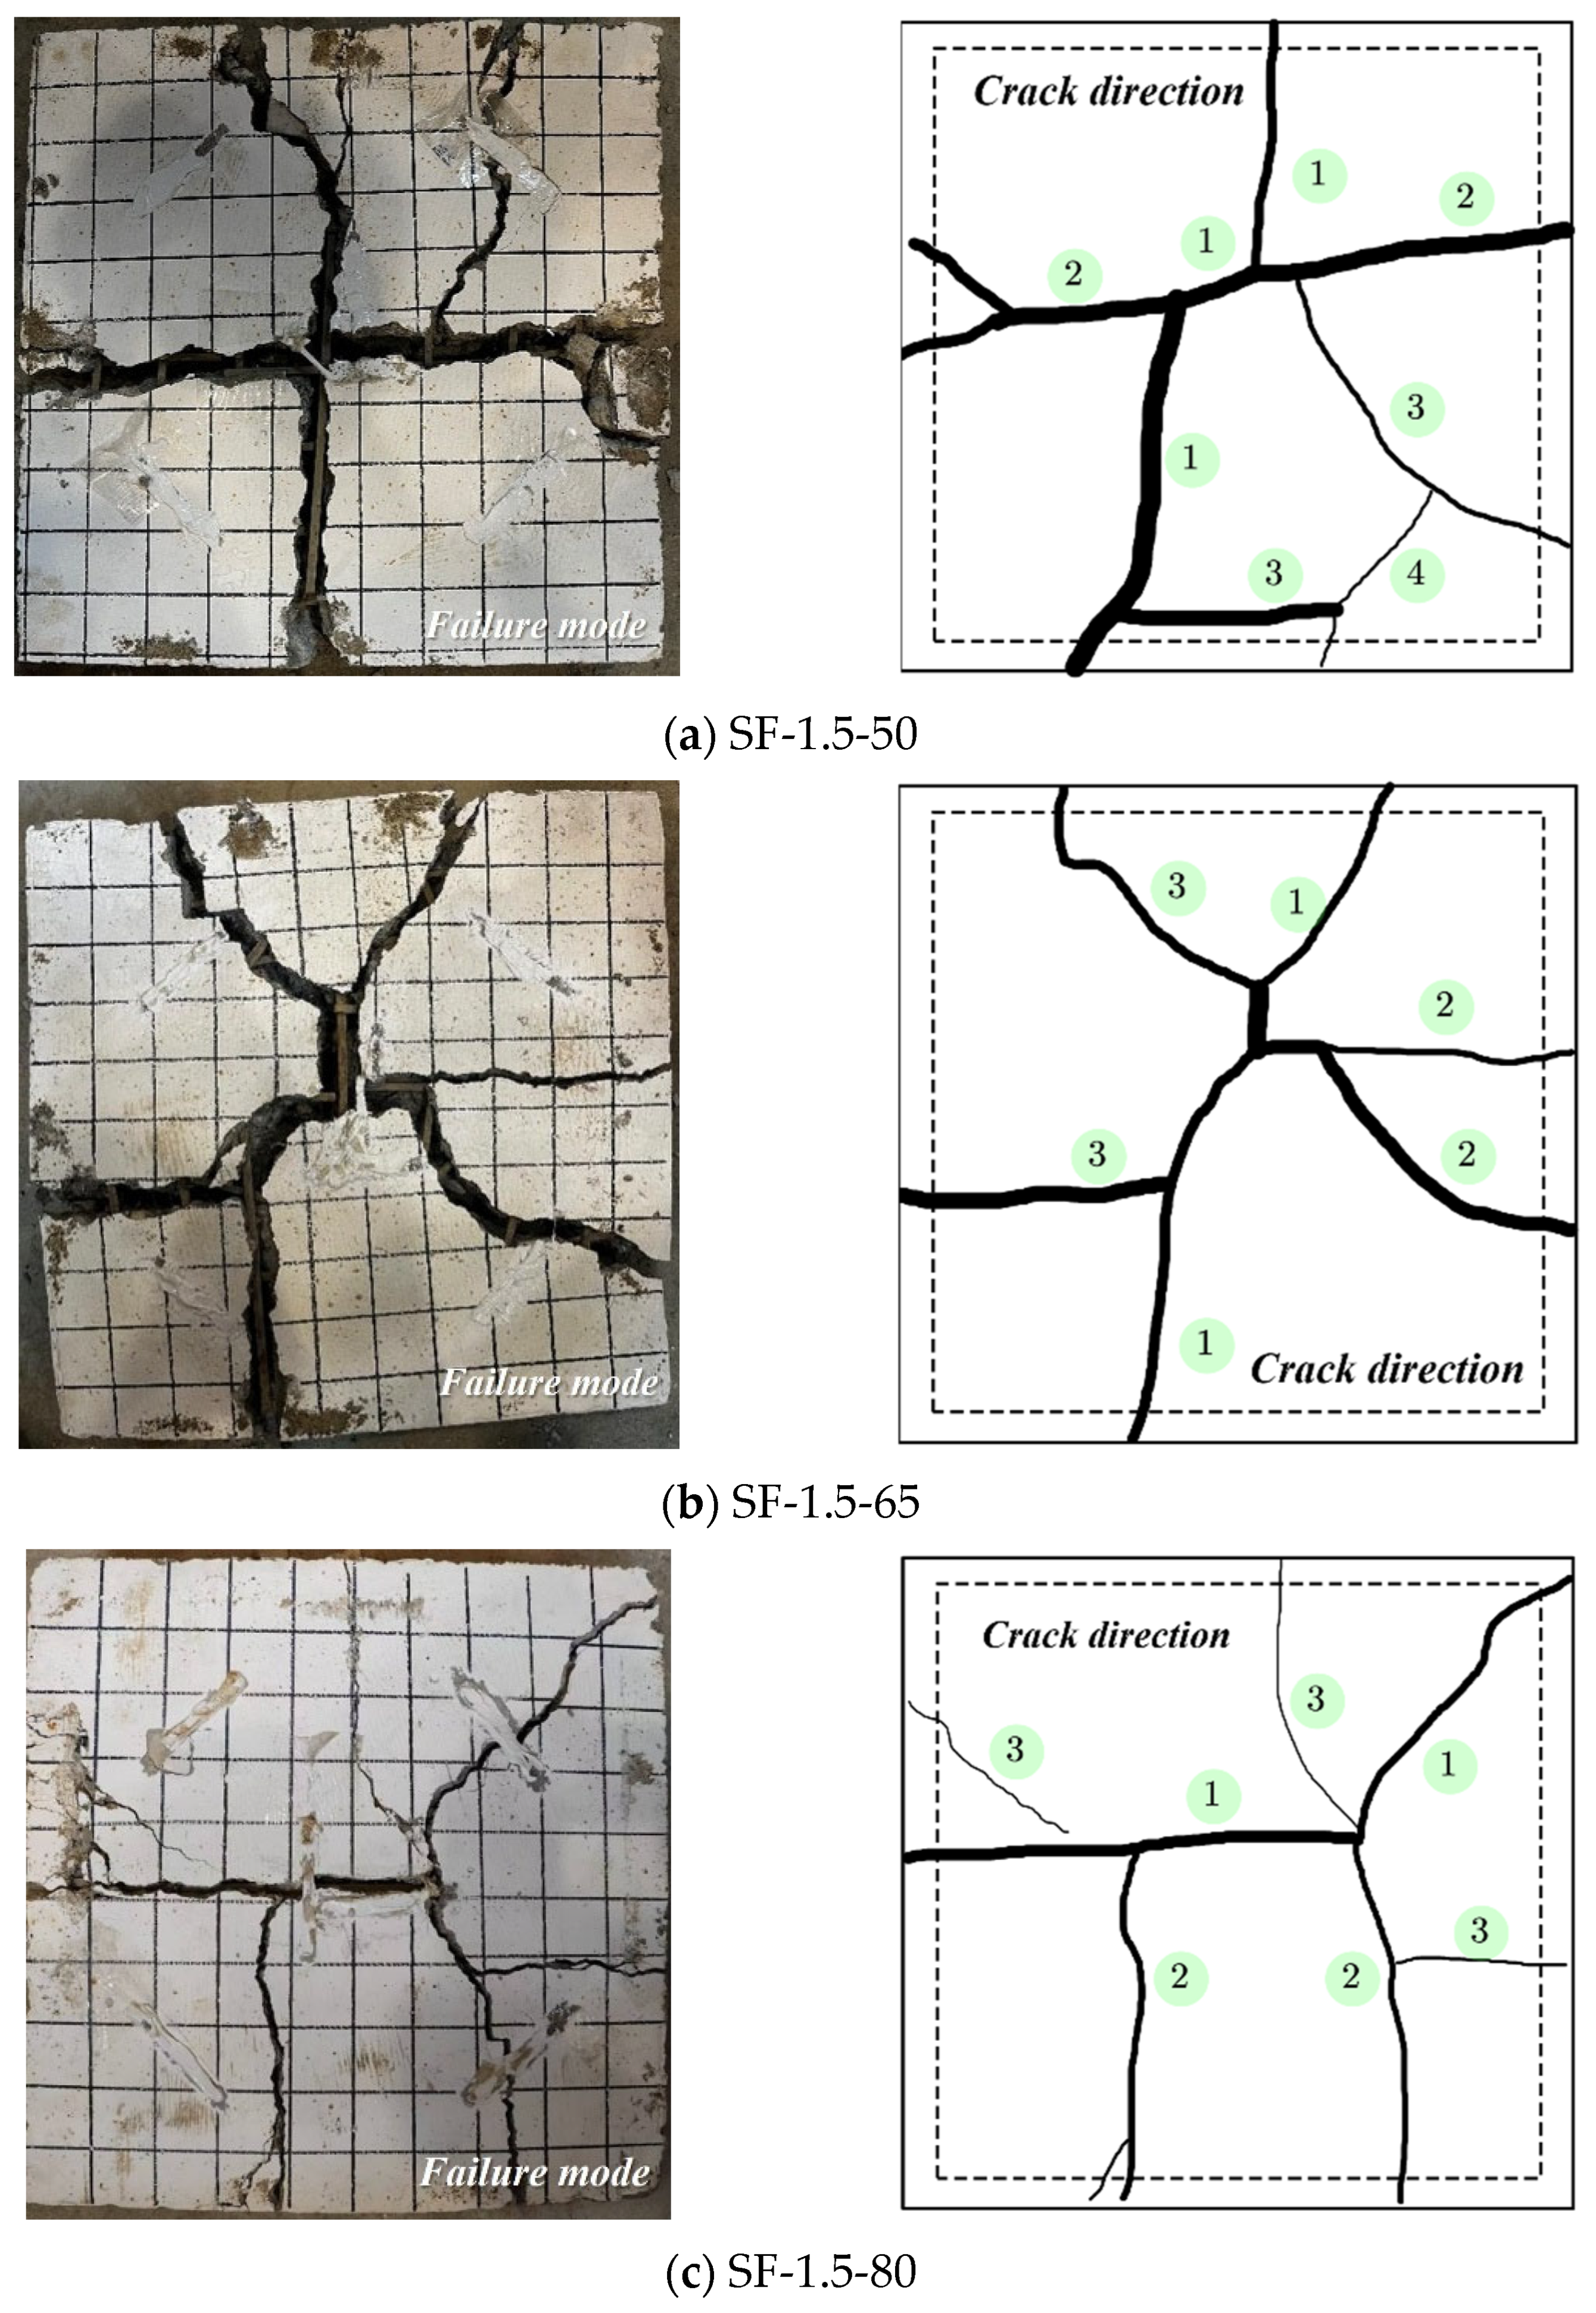
Slabs with 1.5% SF dosage suffered bending failure, and their failure modes and crack directions are shown in Figure 9. SF-1.5-50 exhibits wide, sparse cracks: the first crack appears nearly horizontal, followed by a vertical second crack, forming a cross-shaped distribution. Due to its small thickness and limited stiffness, the crack-inhibiting effect of SF is insufficient to prevent crack penetration. For SF-1.5-65, the number of cracks increases: the first crack appears approximately along the diagonal, and the second crack intersects the first at a regular direction, resulting in a radial crack pattern. With increased slab thickness enhancing stiffness, the synergistic effect of SF and concrete in inhibiting cracks is further improved. For SF-1.5-80, the number of cracks increases: the first crack extends along one diagonal to the midpoint of the opposite edge, the second is perpendicular to the first, and subsequent cracks are associated with these two. Crack width is significantly reduced, with main cracks featuring small widths and tight spacing. Due to greatly enhanced stiffness from increased slab thickness, crack development is effectively controlled; the combined action of SF and bamboo further enables the slab to withstand higher loads.
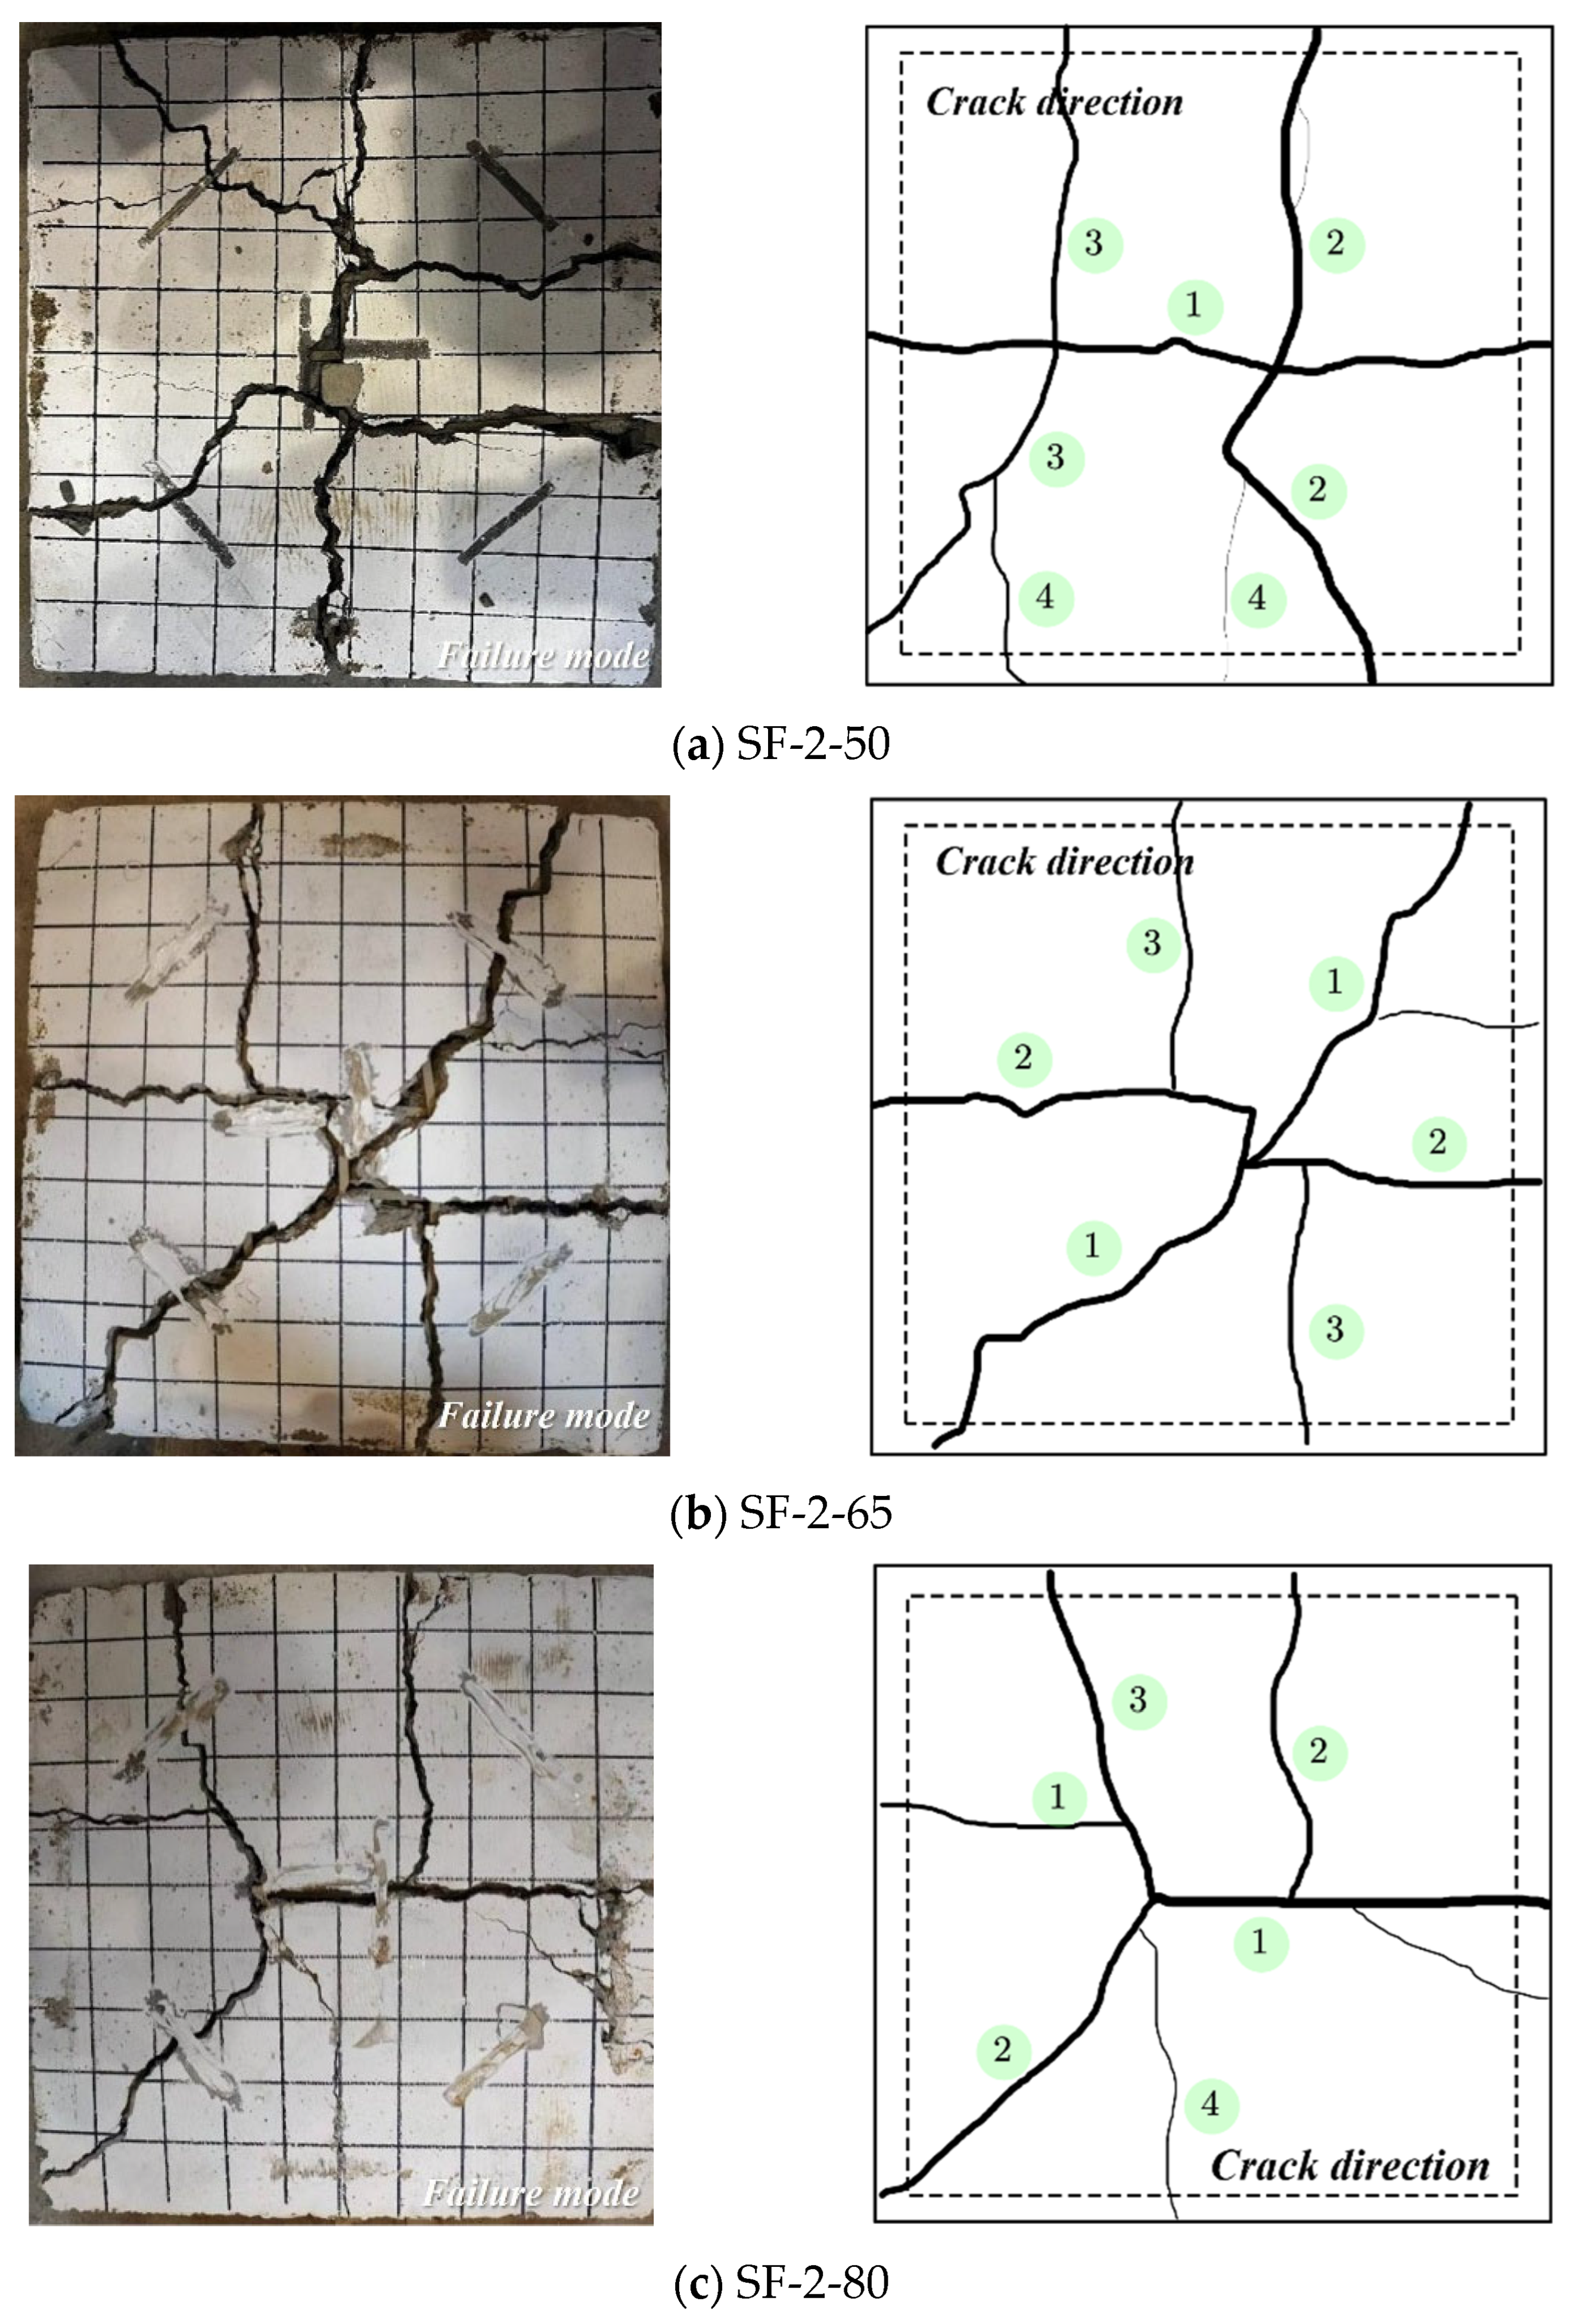
Slabs with 2% SF dosage exhibited bending failure, similar to those with 1.5% SF dosage; their failure modes and crack directions are illustrated in Figure 10. Slabs with three thicknesses exhibited essentially consistent failure modes: crack width decreased with increasing slab thickness, while load-bearing capacity improved significantly. Bamboo at the cracks was not fully fractured but showed obvious pull-out traces, and SF at the fracture surfaces were mutually entangled under tension. It is evident that increased slab thickness substantially enhances load-bearing and damage-resistance capacities, alongside a more uniform stress distribution.
Comparing the failure modes of PC slabs with those reinforced with SF, significant differences are observed, illustrating the toughening effect of the fibers. PC slabs exhibited brittle shear failure characterized by wide, linear main cracks (up to 30 mm) with few bifurcations, resulting in large fragments and a sudden loss of bearing capacity. In contrast, the addition of SF transformed the failure mode into ductile bending failure. The three-dimensional network formed by SF effectively bridged micro-cracks, dissipating energy through plastic deformation and delaying crack propagation. This mechanism shifted the failure from a sudden shear fracture to a gradual bending one, resulting in the formation of fine, reticular (mesh-like) cracks and a significantly reduced main crack width (as low as 8 mm for PC-80 vs. finer cracks for SF slabs). Furthermore, the synergistic effect of SF and bamboo allowed the slabs to sustain larger deformations, with the crack distribution becoming more uniform as the SF dosage increased. Thus, the inclusion of SF fundamentally altered the failure mechanism from a brittle, localized fracture to a ductile, distributed damage pattern.
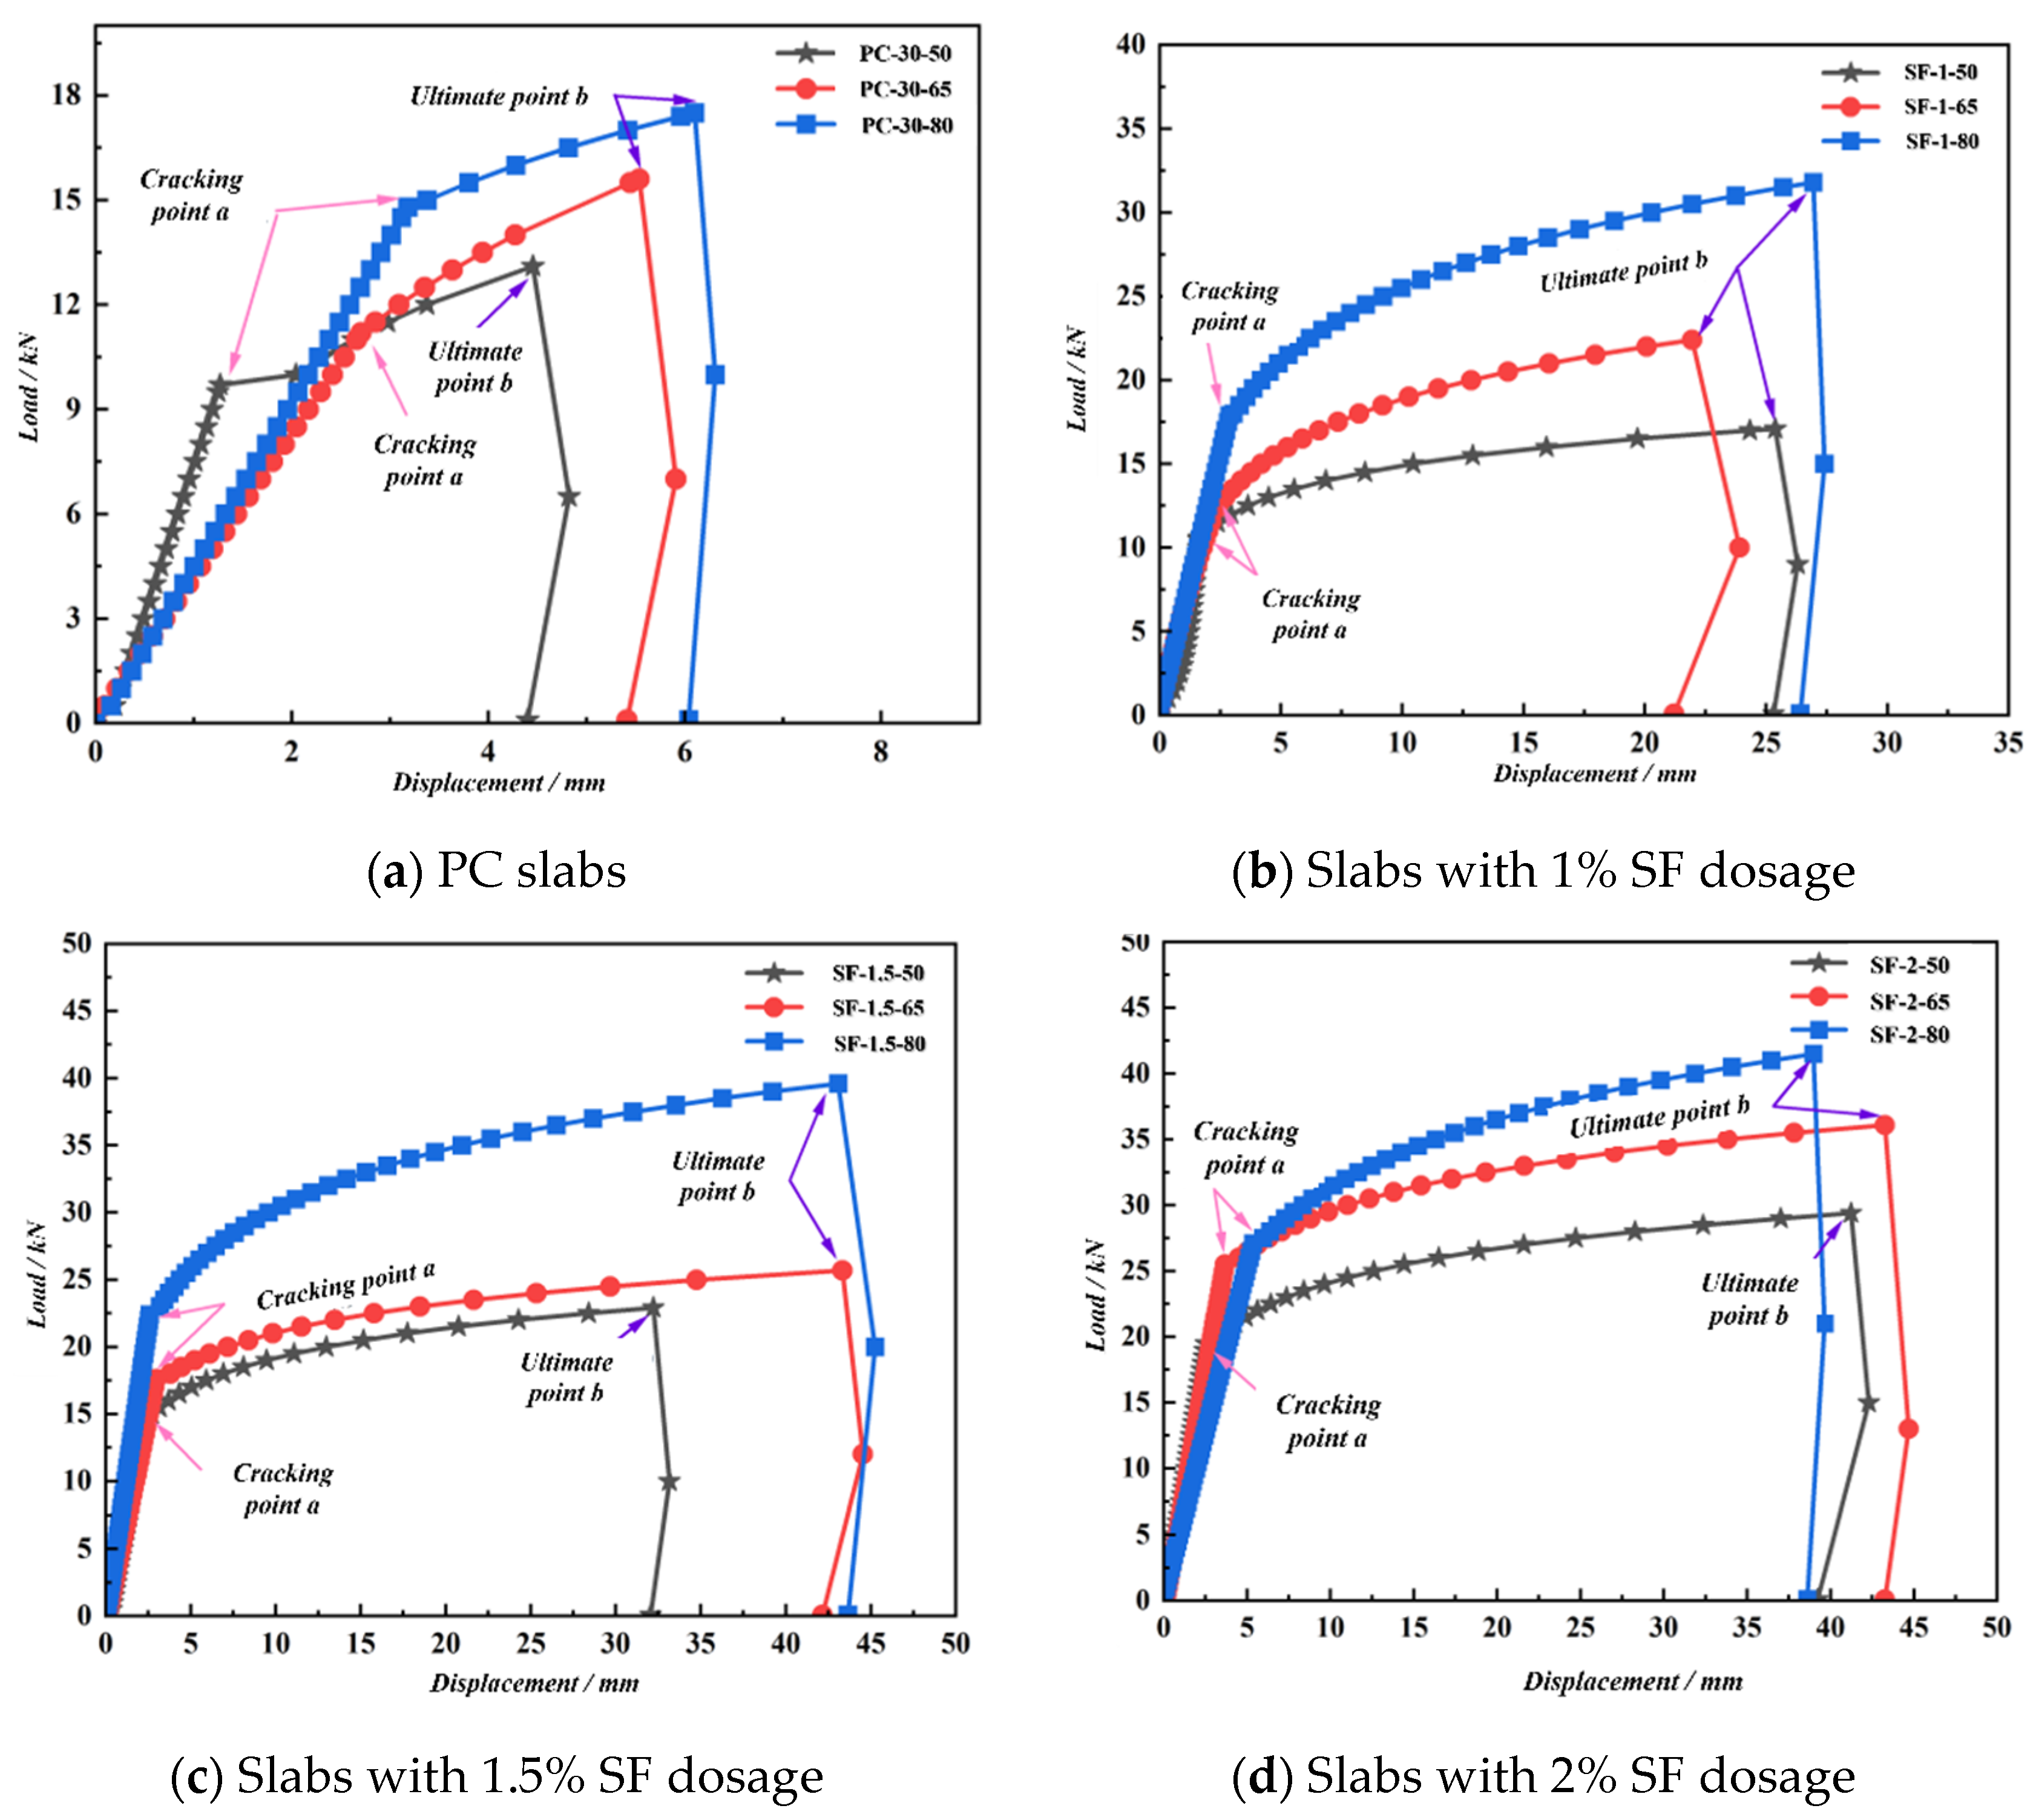
Shear failure is characterized by the formation of a single, wide linear main crack (e.g., 30 mm width in PC-50) with few bifurcations, often propagating diagonally or directly from the supports to the loading point, resulting in large fragments. Bending failure is characterized by a reticular (mesh-like) distribution of fine cracks, where multiple cracks form a radial pattern, and the main crack width remains significantly smaller. Shear failure exhibits a sudden and catastrophic drop in load-bearing capacity immediately after the peak load (brittle behavior), as observed in the load–displacement curves of PC slabs (Figure 11a). Bending failure exhibits a gradual descent in the curve with sustained deformation capacity and significant residual strength (ductile behavior), as seen in the SF-reinforced slabs (Figure 11b–d).

3.1.2. Analysis of Load–Displacement Curves

Figure 11 presents the load–displacement curves of concrete slabs with different SF dosages, as influenced by varying slab thicknesses under uniformly distributed loading. As indicated by the curves, the slabs undergo three stages: elastic stage, cracking stage, and failure stage. Among these, point a represents the cracking point, corresponding to the cracking load Pcr and the cracking displacement c r . The cracking point was identified objectively as the point where the load–displacement curve first deviated significantly from the initial linear elastic segment (the end of the proportional limit), indicating the onset of matrix cracking. With continued load increase, a relatively stable segment appears in the curves. After the curves rise to the limit, they drop sharply; Point b denotes the ultimate point, at which the load and displacement are the ultimate load Pu and ultimate displacement u , respectively. The ultimate point was determined as the peak load value recorded during the test. These criteria were applied consistently across all specimens.
In the elastic stage, slabs with different SF dosages exhibit a clear linear load–displacement relationship, following Hooke′s Law. For PC slabs, increasing thickness from 50 mm to 65 mm and 80 mm raises the cracking load from 9.7 kN to 11.2 kN and 14.8 kN, representing increases of 15% and 53%, respectively, indicating that thicker slabs have significantly higher cracking loads. Table 6 and Table 7 summarize the test results and the percentage increases in cracking load and displacement for different thicknesses and SF dosages. Table 6 shows that increasing SF dosage raises the cracking load for all thicknesses and changes the cracking displacement, mainly due to improved initial cracking tensile strength. In contrast, thickness has a smaller effect on cracking load at a given SF dosage.
In the cracking stage, the load–displacement curve exhibits a nonlinear trend. As cracks develop, the internal stress distribution changes, material properties gradually alter, and slab stiffness degrades. When the load reaches the ultimate load, continued crack expansion leads to a decline in bearing capacity and eventual structural failure. For slabs of different thicknesses, increasing SF dosage raises both the ultimate load and displacement, as more fibers span the cracks to sustain higher loads and accommodate greater displacement. Thus, SF-reinforced slabs demonstrate superior bearing capacity compared with PC slabs.
It is noteworthy that the ultimate displacements (δu) of SF-reinforced slabs are significantly higher (by nearly an order of magnitude) than those of PC slabs. This drastic increase is not a measurement or unit error, but a direct result of the fundamental shift in failure mechanisms. PC slabs failed in a brittle shear mode with sudden structural collapse, allowing minimal deformation before failure. In contrast, the inclusion of SF enabled a ductile bending failure mode. The fibers bridged the cracks, allowing the slabs to sustain large deformations through crack widening and fiber pull-out processes without immediate collapse, thereby exhibiting exceptional ductility.
In this study, the material utilization rate is evaluated based on the principle of reinforcement efficiency, defined as the ratio of the increment in ultimate bearing capacity to the increment in steel fiber dosage. As shown in Table 5, increasing the SF dosage from 1% to 1.5% results in a significant increase in load-bearing capacity. However, when the dosage is further increased from 1.5% to 2%, the increase in load-bearing capacity becomes marginal (from 39.6 kN to 41.5 kN for the 80 mm slab). This indicates that the efficiency of the added material decreases beyond 1.5%, making the 1.5% dosage the optimal choice for maximizing material utilization.

3.2. Analysis of Dynamic Mechanical Properties Under Drop Hammer Impact

3.2.1. Analysis of Failure Mode

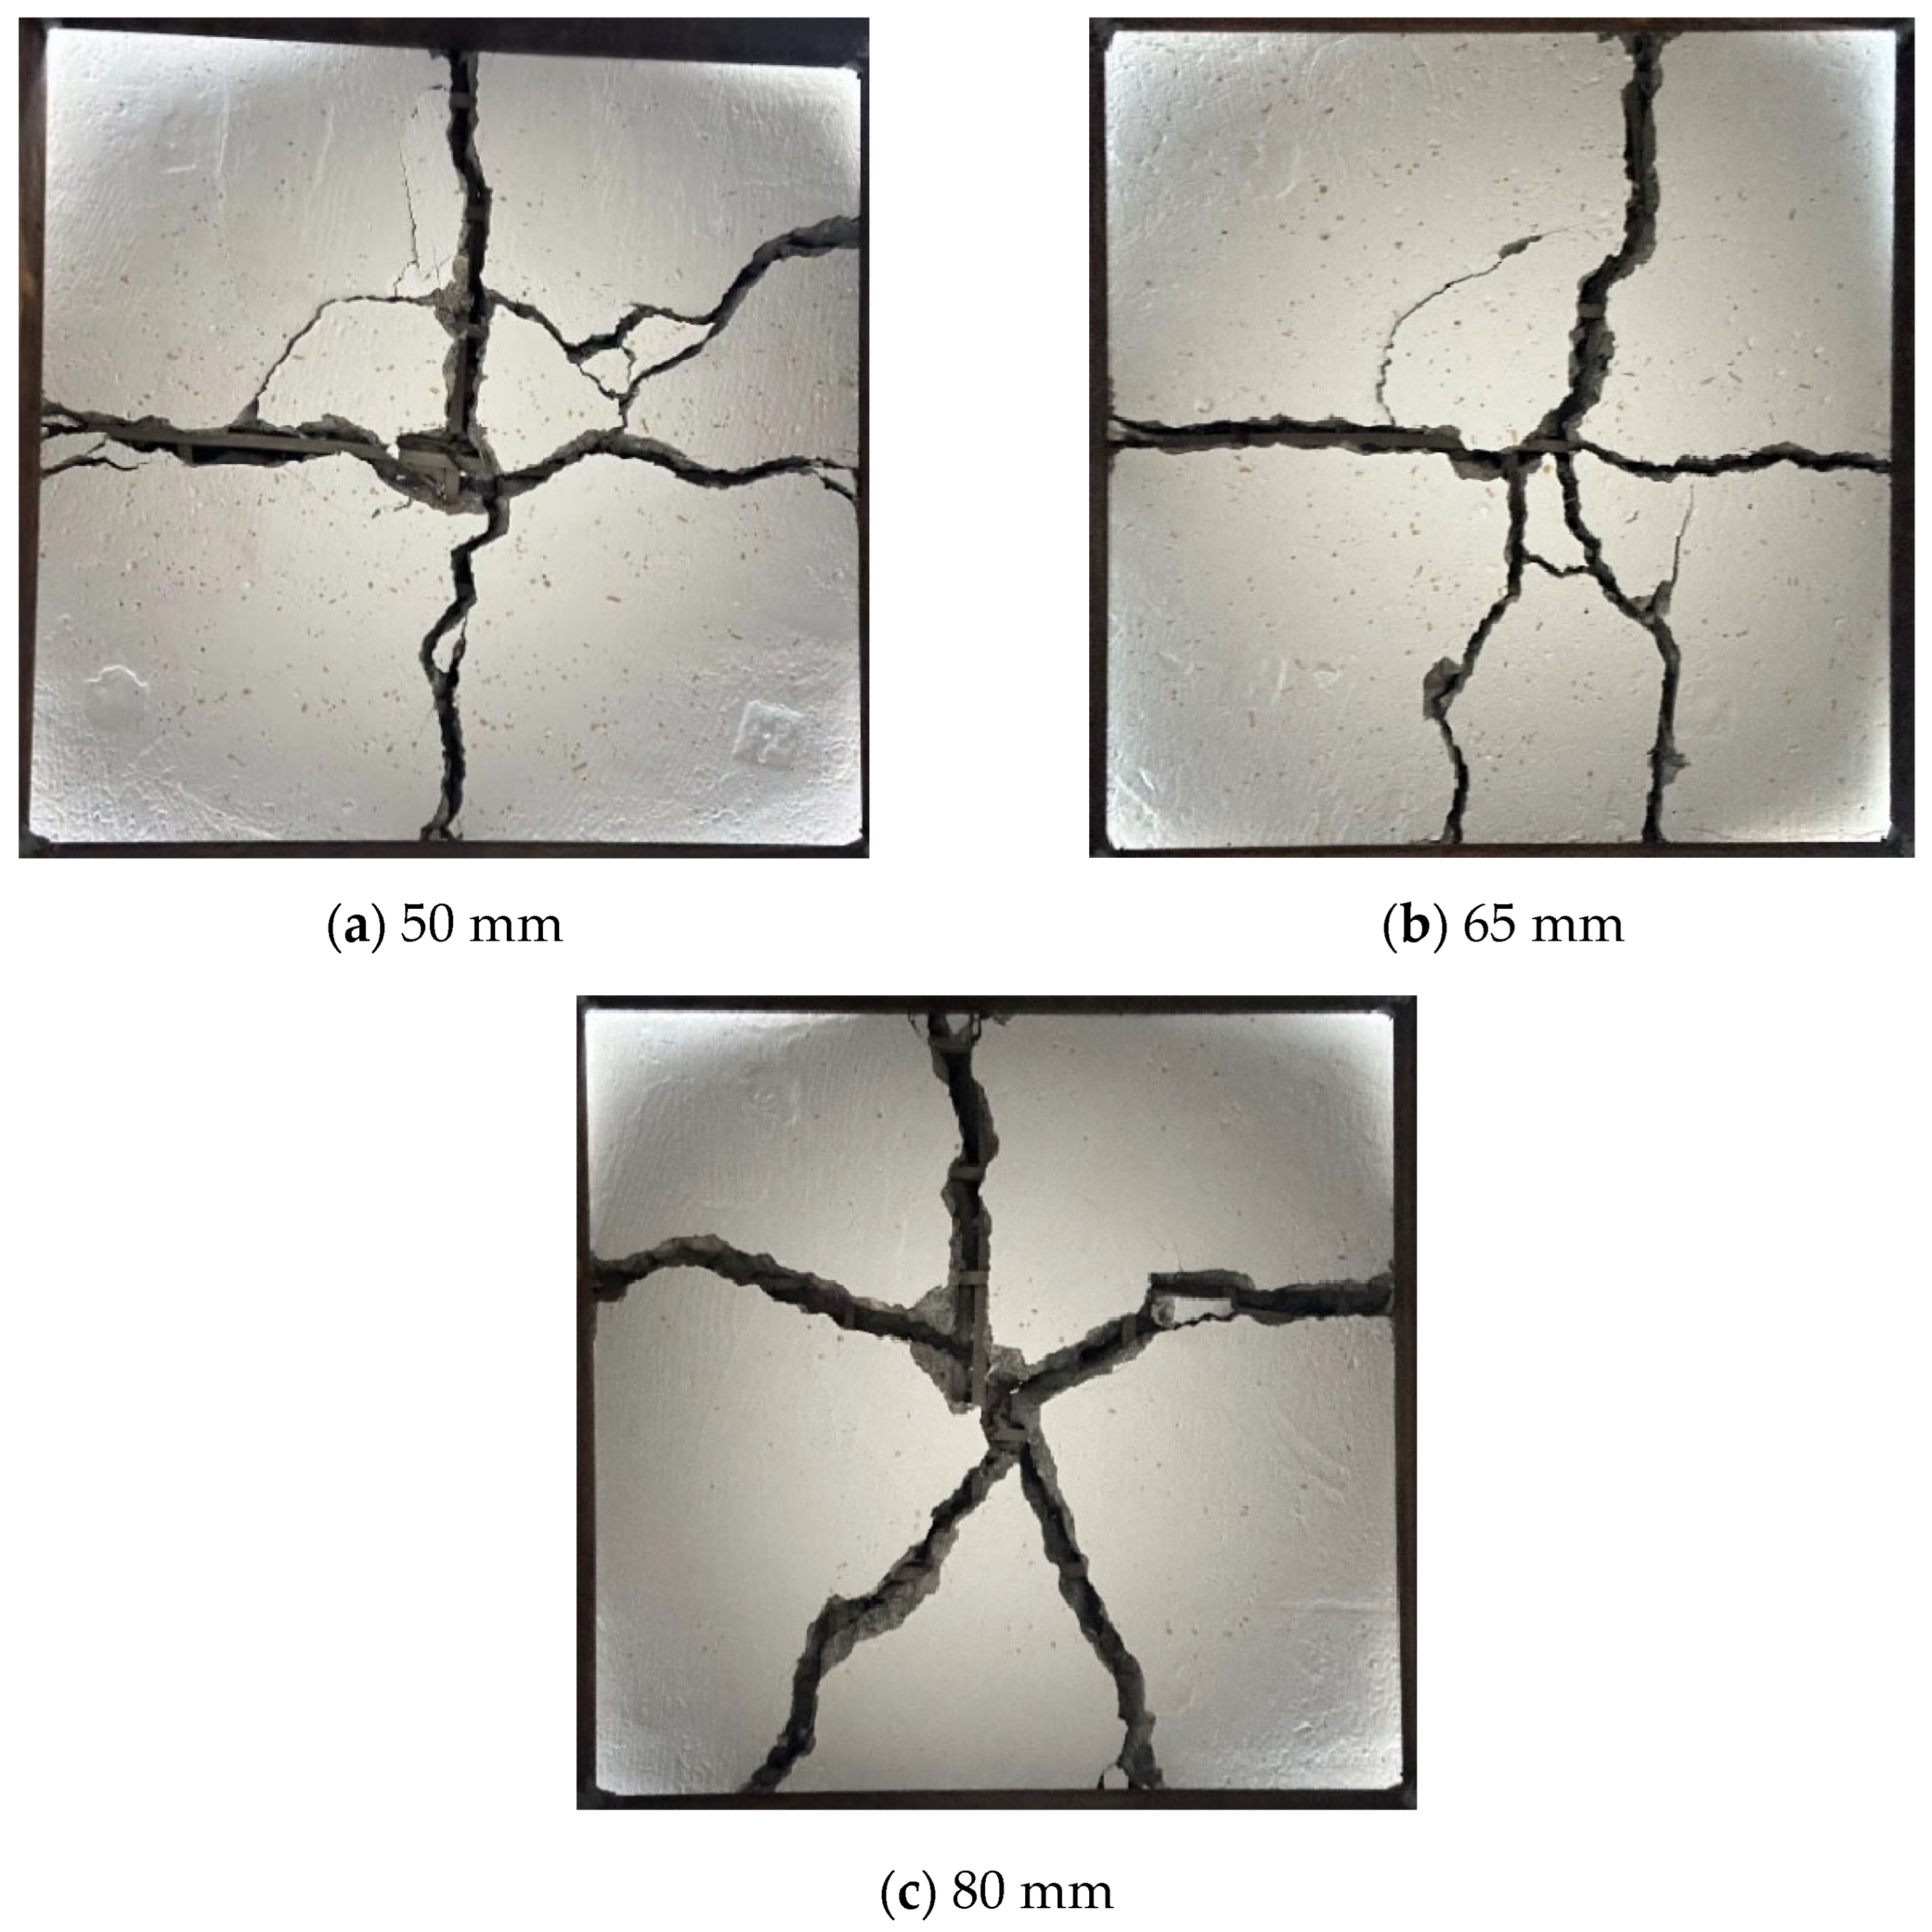
PC slabs and slabs with different dosages of SF show different failure modes, and the cracks are “+” types or “*” types. Figure 12 shows the failure mode of PC slabs subjected to impact load. The cracks expand in a “+” shape from the impact point to the surrounding area, eventually forming several large fragments. As slab thickness increases, the main crack of PC slabs remains linear during failure, and no secondary crack develops, showing brittle failure.
Figure 13 shows the failure modes of slabs with 1% SF dosage, which demonstrates a better crack control effect. The crack development path shows more bending and branching, and the crack width is reduced compared to the PC slabs. The number of broken fragments increases, their size decreases, and the overall uniformity is improved.
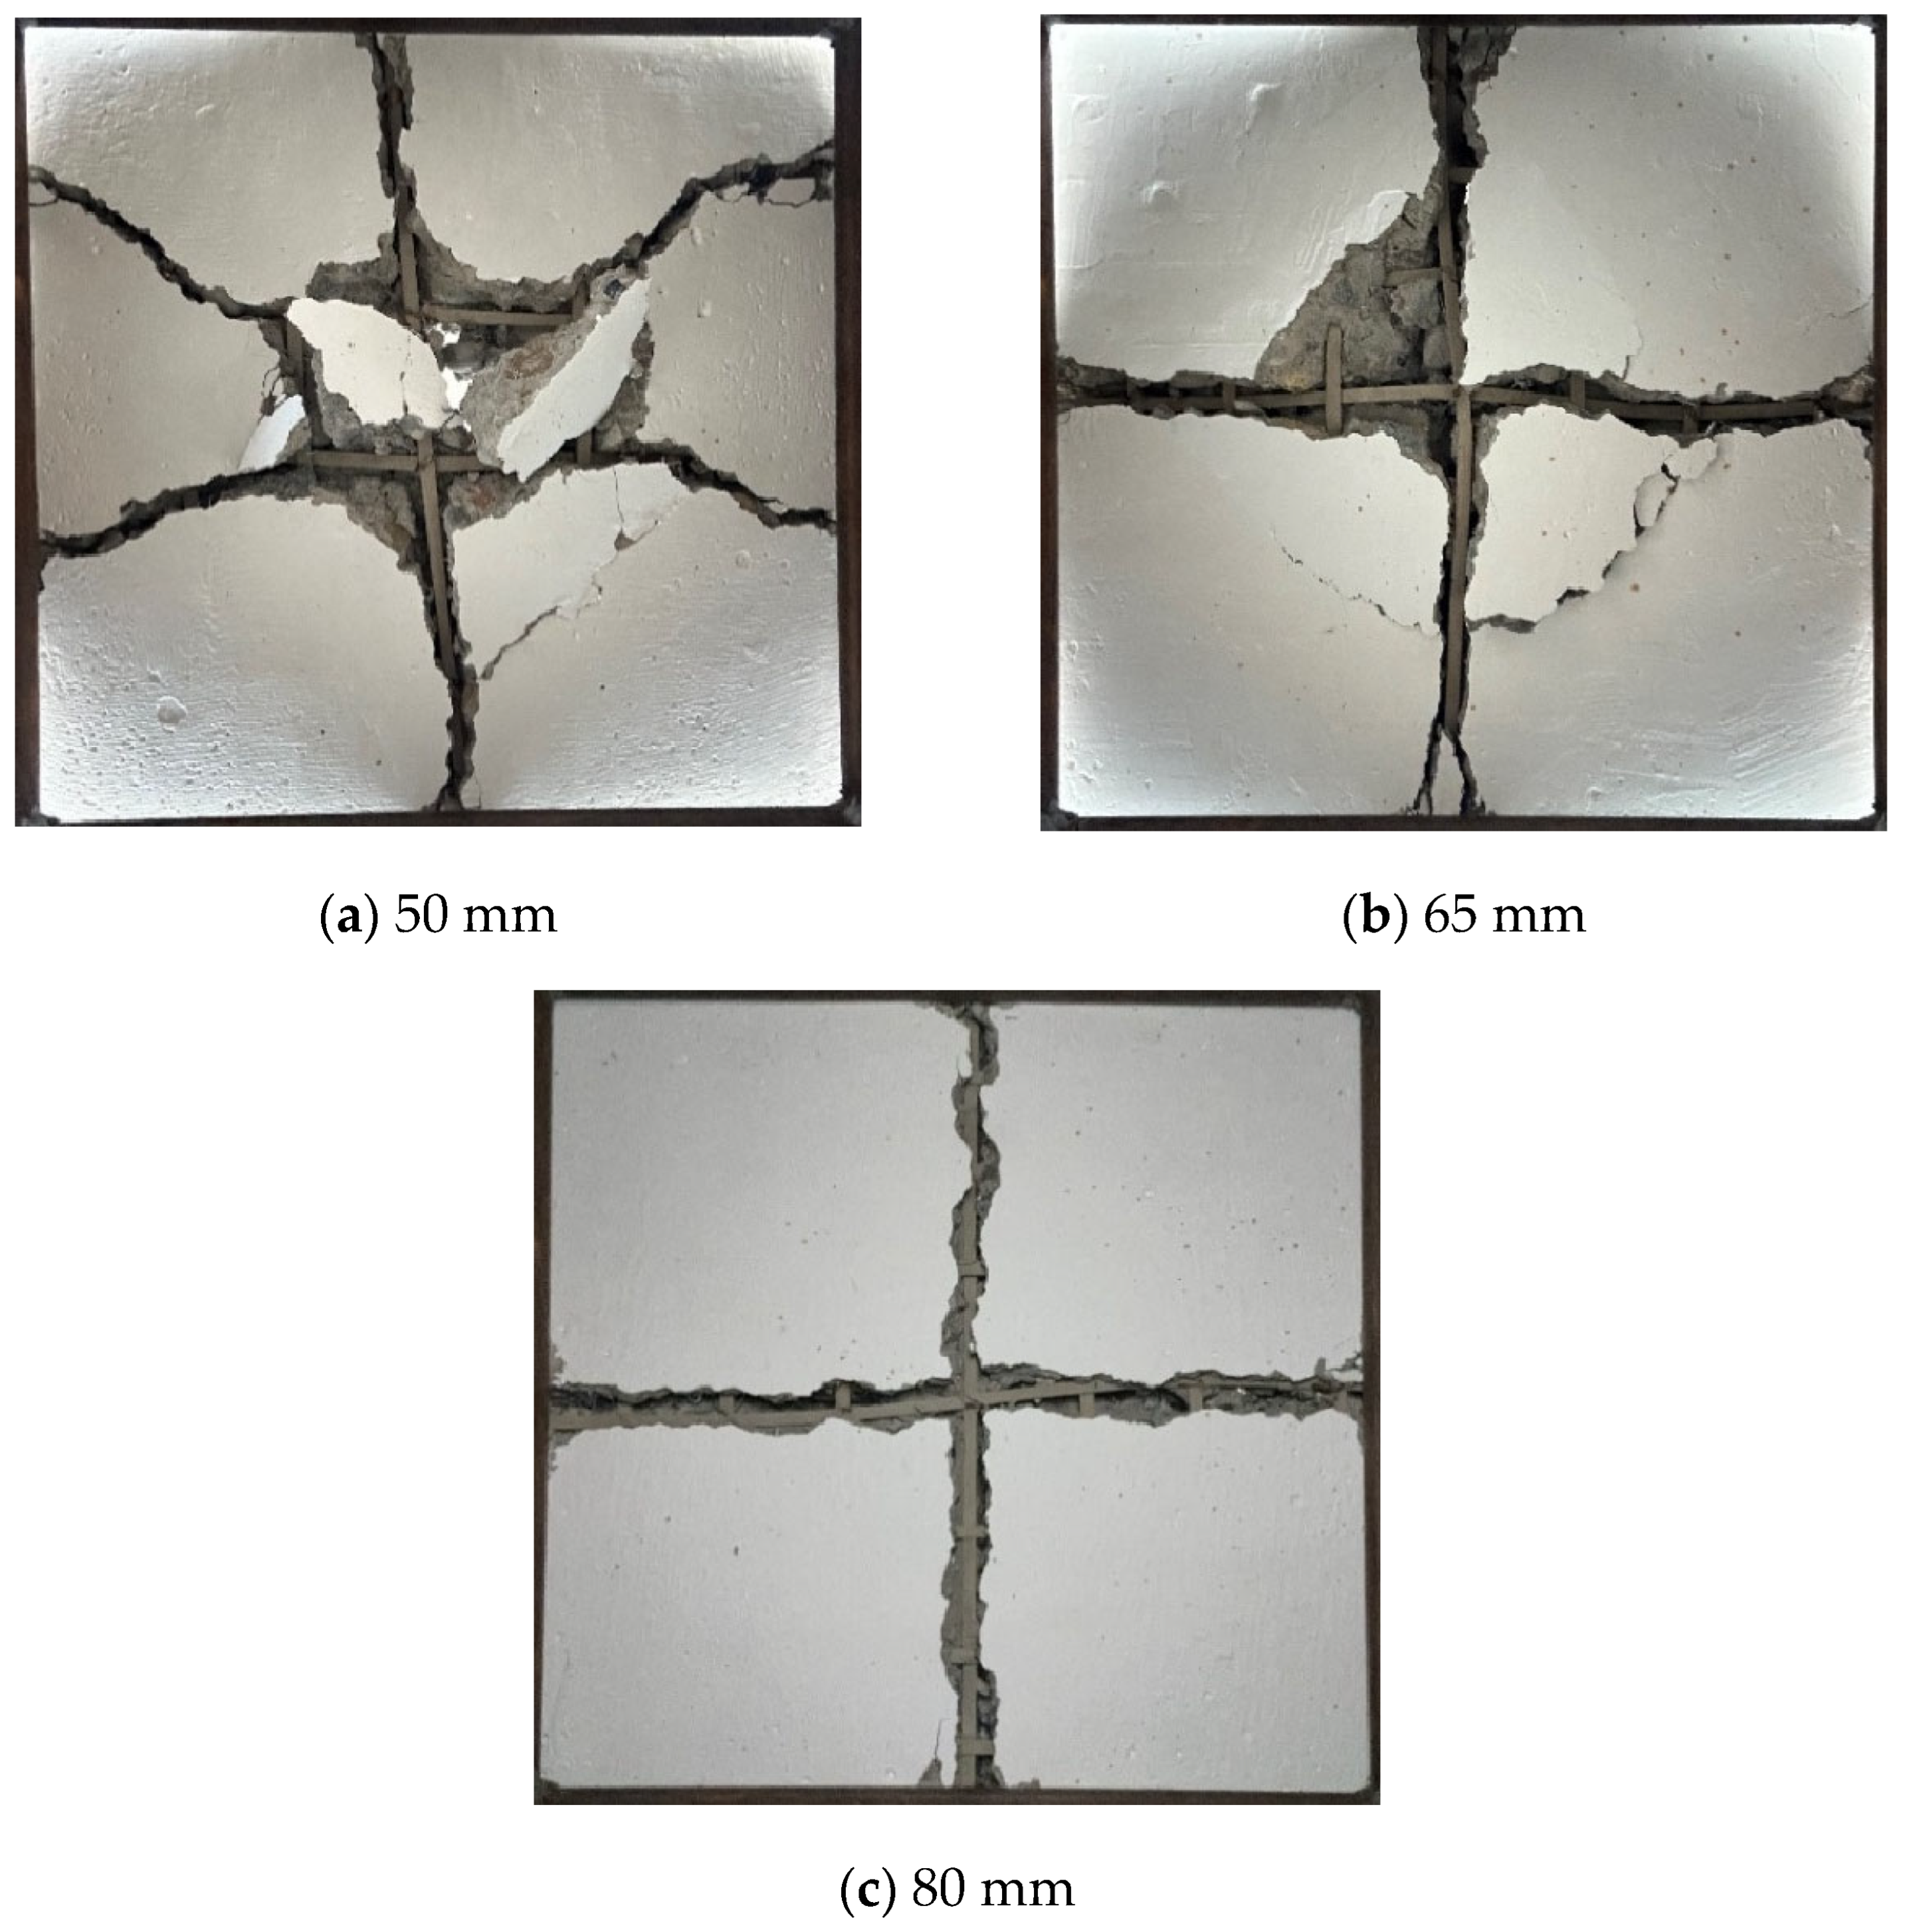
When the SF dosage reaches 2%, crack development is effectively controlled, and the inhibitory effect of SF is better, as shown in Figure 14. The crack development path becomes sparser and more dispersed, and the size of the fragments also becomes smaller. Adding of 2% SF dosage enhances the ability to absorb energy and resist impact. Especially in thicker slabs, the development speed of cracks slows down, and the crushing process is more uniform, which is the same as slabs with 1.5% SF dosage. When the SF dosage exceeds 1.5%, the synergistic effect of the fiber network begins to dominate the energy dissipation mechanism [19], which is consistent with the study.
With SF dosage increases, the fiber bridging effect is significantly enhanced, effectively hindering crack development and concentrating stress distribution, making the cracks more prone to form main cracks at a few positions. SF dissipates the energy required for crack development through tensile and bending mechanisms, which improves the ductility of slabs and reduces the formation and branching of cracks. In addition, SF can also inhibit the expansion of micro-cracks and even promote their closure, further reducing the number of main cracks. These effects lead to the concentration of crack distribution, and ultimately, the number of main cracks decreases with the increase in SF dosage.

3.2.2. Analysis of Drop Hammer Impact Test Results

Substitute the recorded N1 and N2 into Equation (1) to calculate the first cracking energy (E1) and failure energy (E2) of the slab. Note that Equation (1) calculates the cumulative gravitational potential energy input from the drop hammer. While kinetic energy losses due to rebound, sound, and vibration are inevitable, this “input energy” model is a standard method widely used in impact resistance evaluation for concrete materials. It provides a consistent basis for the relative comparison of different slab configurations. The results are shown in Table 8. For PC slabs, N1 and N2 are nearly the same, with low values, and E is also low. In contrast, while the first crack impact times (N1) for some SF slabs remained low (e.g., 1–2 impacts), similar to PC slabs, adding SF significantly increases the failure impact times (N2). This phenomenon indicates that the steel fibers primarily enhance post-cracking resistance rather than the initial cracking strength under high-strain impact loading. The fibers are activated after the formation of the first crack, bridging the crack opening and absorbing energy, which prevents immediate structural collapse and leads to a significant increase in N2 and the ductility ratio β.
W = N m g h
In the formula, N—impact times; m—the weight of the drop hammer (5 kg); h—the height of the drop hammer (120 cm); and g—acceleration of gravity (9.8 m/s2).
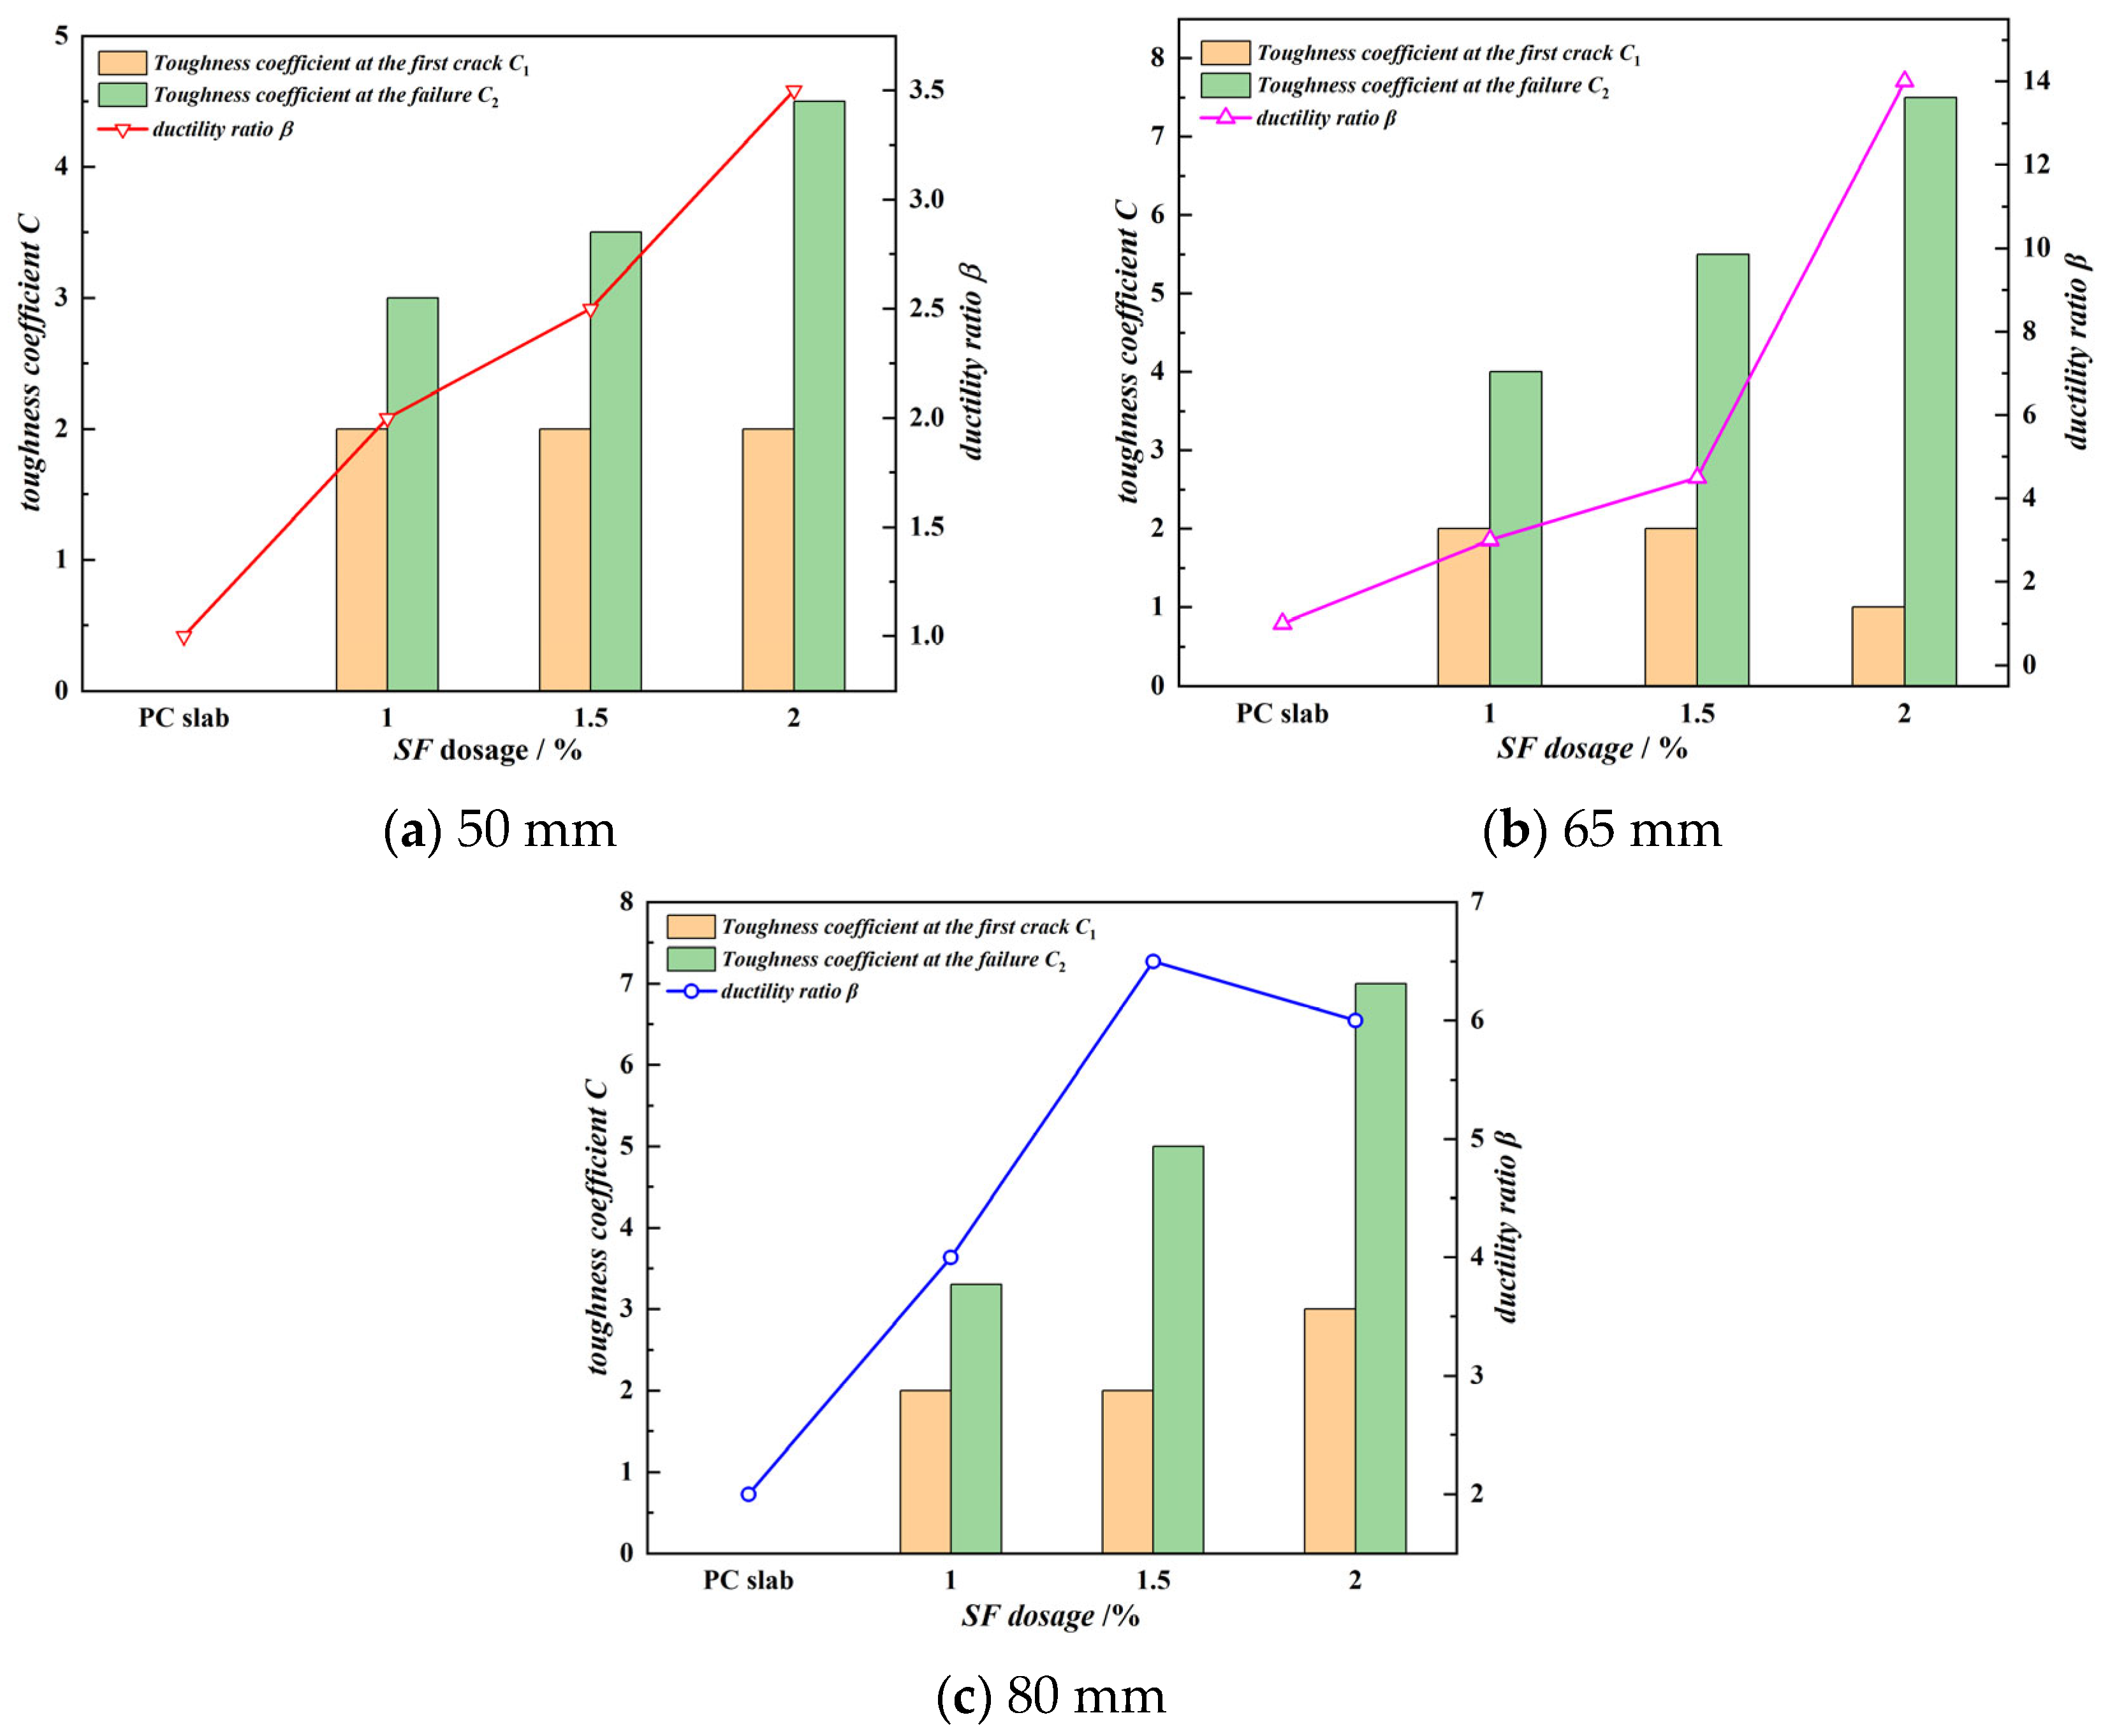
The ability of materials to absorb energy when it reaches failure under impact loading is defined as ductility. It should be noted that the “ductility ratio β” defined here is an impact-specific index. Since each impact delivers a constant input energy (mgh), Equation (2) can be simplified as β = N2/N1. This ratio, representing the number of impacts sustained between first cracking and failure, is a widely accepted metric for evaluating the impact toughness of fiber-reinforced concrete. It reflects the material’s capacity to absorb energy in the post-cracking stage. The ductility ratio β and ductility coefficient C are used as two indicators to evaluate the ductility of slabs, and the calculations are Equations (2) and (3), respectively.
β = N 2 N 1 N 1
C = W i W 0
In the formula, Wi—the impact work done by the impact load on the slabs, adding SF; W0—the impact work done by the impact load on the PC slabs. According to Equation (1), C can be simplified to Equation (4).
C = N i , S S F N 0
According to the mentioned equations, Figure 15 shows the relationship between the ductility ratio β and ductility coefficient C of slabs with different thicknesses and different SF dosages. It can be seen from Figure 15 that there is a correlation between the slab’s thickness, the SF dosages, and the ductility ratio β and ductility coefficient C of the slabs. The correlation indicates that the optimal configuration of slab thickness and SF dosages plays a significant role in enhancing the performance of concrete slabs, particularly in terms of ductility and toughness. From the change in ductility ratio β, it can be seen that SF dosages have significant effects on β. Taking a 50 mm slab as an example, when the SF dosage is 0%, β is only 1.0, while β increases to 2.0 when the dosage is 1%, and further increases to 2.5 and 3.5 when the dosages are 1.5% and 2%, which are more significant in 65 mm and 80 mm slabs. This indicates that thick slabs can better exert the enhancing effect of SF on ductility, and as the dosage increases, the growth rate of β also gradually increases. Meanwhile, there is a synergistic effect between the slab thickness and the SF dosage. Thicker slabs can more effectively coordinate the combined effect of bamboo and SF, making the enhanced ductility effect of SF more prominent. For example, in an 80 mm slab, the increase in C is higher than that in a 50 mm slab, which may be due to the stronger dispersion ability of the thick slab to the impact load and the ability to play the role of SF more fully.

3.2.3. Relationship Between SF Dosage and Dynamic Mechanical Properties

To quantitatively assess the damage degree observed qualitatively in Section 3.2.1, the fragment size distribution was analyzed as a key damage index. Table 9 shows the number of fragment diameters of slabs of different thicknesses with different dosages of SF. A higher number of small-diameter fragments indicates more extensive crack branching and a more ductile energy dissipation process. It can be seen that with SF dosage increases, the diameter of the fragments increases significantly. The size of the fragments is becoming more uniform. Especially at 2% SF, the integrity of the slab is maintained. Meanwhile, the synergistic effect of bamboo and SF effectively inhibits the increase in surface crack width and significantly reduces the degree of local damage.
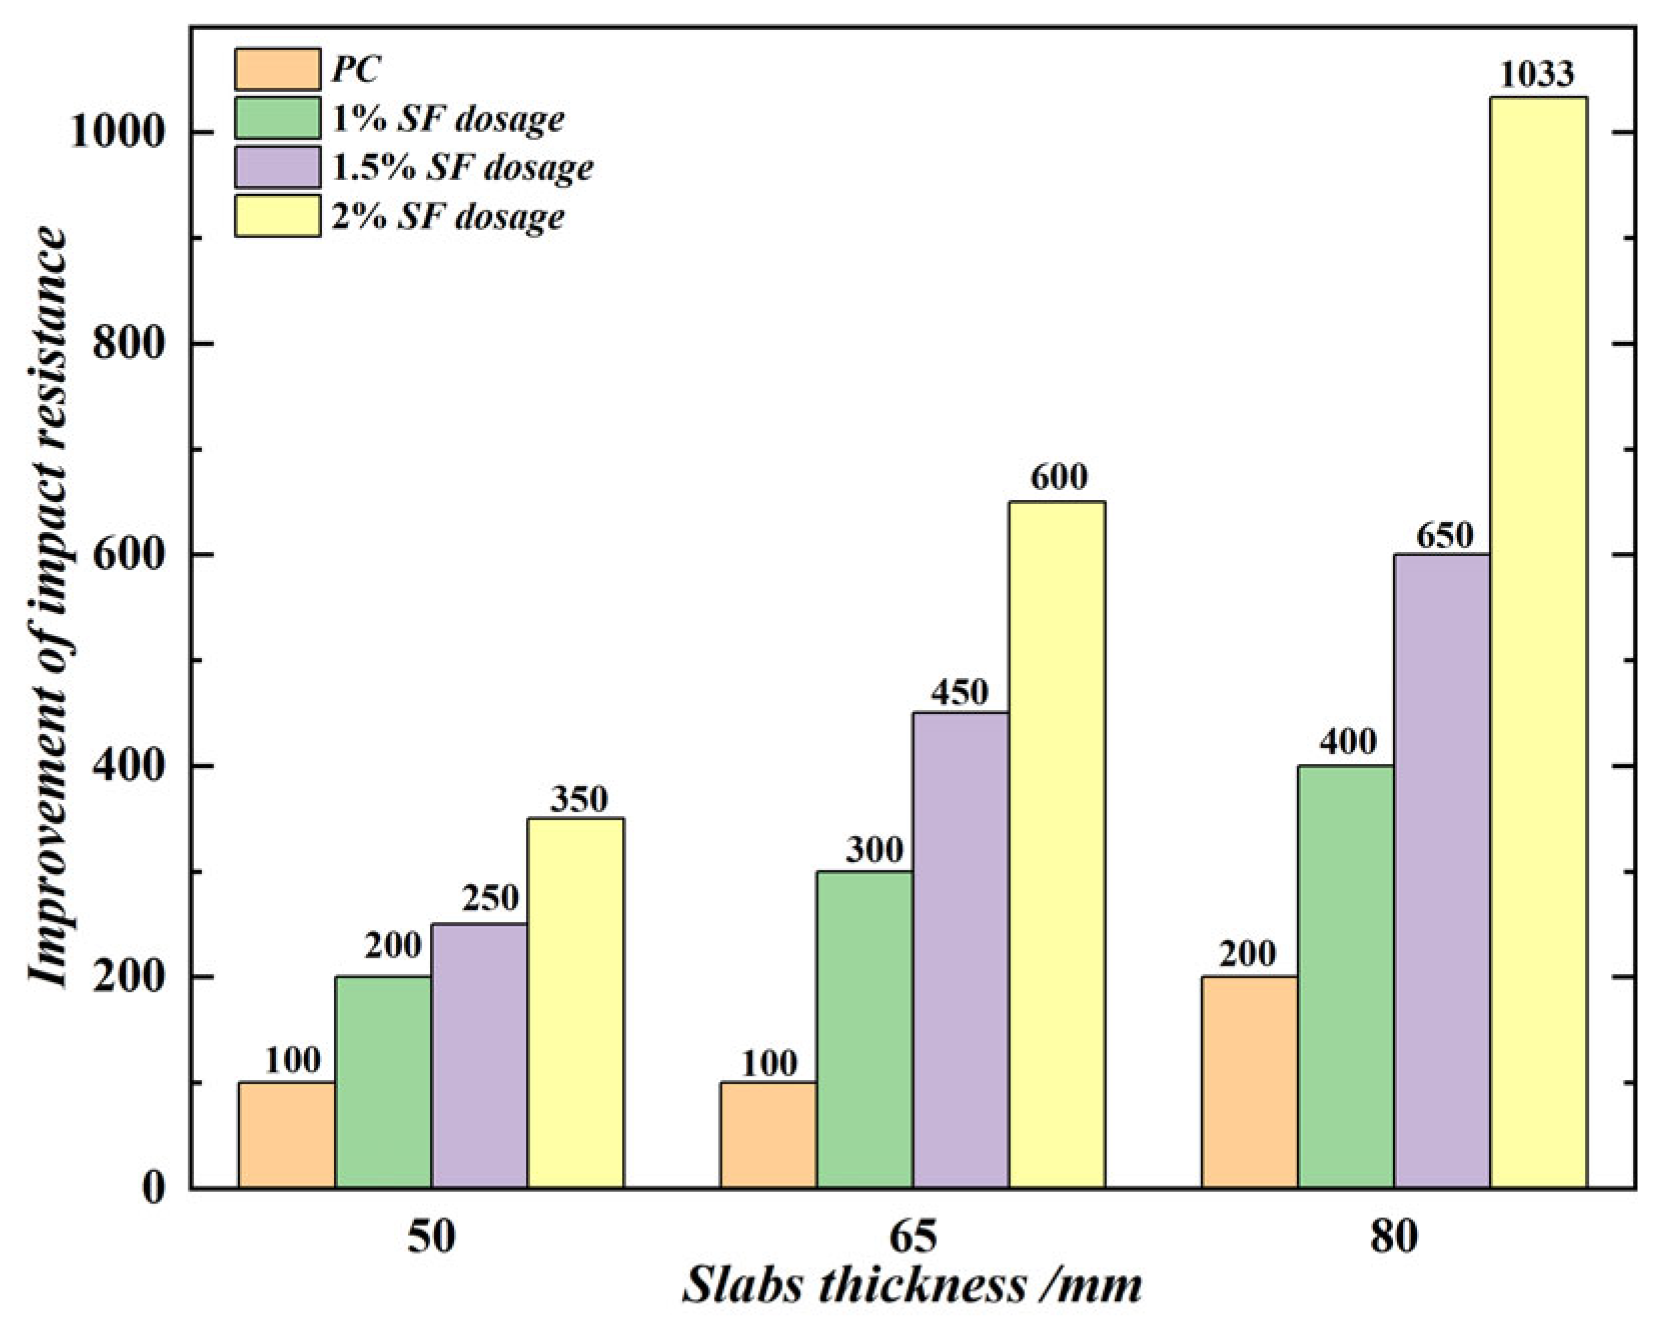
With the increase in SF dosage and slab thickness, the impact resistance of slabs gradually improves. Figure 16 shows the improvement of impact resistance of slabs with different thicknesses and SF dosages. As can be seen from the Figure, when the SF dosage reaches 2% and the slab thickness is 80 mm, SF and bamboo work together to optimize the impact resistance and ductility of slabs, providing strong support for structural optimization under impact loads.
The significant increase in impact energy dissipation (e.g., from 118 N·m for PC slabs to 706 N·m for SFRBCS with 2% SF and 80 mm thickness in Table 7) quantitatively demonstrates the synergistic effect. The combination results in an energy-absorption capacity much greater than the sum of individual contributions, confirming the ‘elastic-plastic’ synergy.

4. Bearing Capacity of SFRBCS

4.1. Calculation of Cross-Section Bearing Capacity

4.1.1. Basic Assumption

Through the combination of theoretical analysis and experiments, a bearing capacity calculation model suitable for slabs was proposed. The model comprehensively considers the mechanical properties of bamboo and the reinforcing effect of SF, and derives the bearing capacity of the slabs with different dosages of SF under local uniform loading. To simplify the calculation of the bearing capacity of slabs and ensure the rationality and accuracy of the calculation, the following assumptions are proposed:
(1) The strain of the slabs conforms to the plane cross-section assumption.
(2) Bamboo is treated as a linear elastic material under tension until brittle failure occurs. This assumption is supported by existing literature, which demonstrates that bamboo exhibits a relatively linear stress–strain relationship in the parallel-to-grain direction, lacking a distinct yield plateau like steel. Only the tensile force is considered, and the compressive strength is ignored. For the purpose of the bearing capacity calculation model, a simplified idealized model (Equation (5)) is adopted to account for the ultimate tensile state.
σ = E ε ( ε ε y ) σ y + E h ( ε ε y ) ( ε y < ε u )
In the formula, Eh—strengthening modulus; εu—ultimate strain.
(3) Assuming that the SF is uniformly distributed, its reinforcing effect is reflected through the equivalent concrete strength.
(4) The stress–strain relationship of concrete in the compression zone adopts a double broken line model, as shown in Equation (6), and the tensile strength of the concrete is ignored. The constitutive parameters are shown in Table 10.
σ c = E c ε c ( ε c 0.7 ε b ) E c ε c ( 1 D ) + D k ( ε c > 0.7 ε b ) D = 1 e x p [ ε c ε m a ]
In the formula, m and a are material constants; εb is the peak strain; ε* represents the cumulative threshold strain of material damage, which is taken as 0.7εb in the study; and k is the bearing capacity coefficient.

4.1.2. Nonlinear Mechanics Analysis

Under the ultimate limit state, the strain coordination of the slabs’ cross-section can be expressed by Equation (7). The relationship of the moment–curvature of slabs’ cross-section calculated through the internal force balance condition (Equation (8)) is shown in Table 11. When the concrete at the edge of the compressive zone of the slabs reaches the ultimate compressive strain, the corresponding section bending moment and curvature are, respectively, the ultimate bending moment Mu and the ultimate curvature φu.
φ = ε c f x = ε b i h i x
Axial   force   balance : N = Σ σ c i b i d x σ b i A b i = 0 Bending   moment   balance : M = σ c i b i ( h i x ) d x + σ b i A b i ( h i x )
In the formula, φ—curvature of the slab’s cross-section; εcf—strain of concrete at the compression edge; εbi—strain of bamboo at height hi; x—height of the compression zone; hi—distance from the center of gravity of the i-th layer of bamboo to the edge of compression; σci—stress of the i-th concrete, σbi—stress of the i-th bamboo; bi—width of the i-th concrete; and Abi—cross-sectional area of the i-th layer of bamboo.
It can be seen from the table that the influence of slab thickness on structural performance shows significant regularity. Take 1% SF dosage as an example, when the thickness increases from 50 mm to 65 mm, Mu jumps from 138.564 N·m to 221.348 N·m. After further increasing to 80 mm, Mu further climbed to 284.560 N·m. This increase stems from the geometric progression of the moment of inertia of the section, which essentially enhances the bending resistance of the slabs. However, the ultimate curvature shows an inverse trend: φu of the 50 mm slab reaches 0.000211 mm−1 when it fails, that of the 65 mm slab drops to 0.000162 mm−1, and that of the 80 mm slab further decreases to 0.000132 mm−1. This reflects that although the increase in thickness enhances the bending resistance, it also leads to the slab showing a smaller deformation capacity before failure.
The enhancing effect of SF dosage is particularly obvious under the same slab thickness conditions. Taking 65 mm as an example, when the SF dosage is increased from 1% to 1.5%, Mu increases from 221.348 N·m to 230.784 N·m. When the dosage reaches 2%, Mu reaches 238.912 N·m. The three-dimensional network structure formed by SF effectively inhibits crack development, which is a key mechanism for enhancing load-bearing capacity. The ultimate curvature shows a pattern of relatively small increase: φu of the 1% SF dosage is 0.000162 mm−1, while that of the 1.5% and 2% slabs increases to 0.000168 mm−1 and 0.000173 mm−1, respectively. This seemingly contradictory phenomenon actually reveals the unique ductility improvement mechanism of SF-reinforced concrete slabs, that is, the higher fiber dosages enable the slabs to undergo a more thorough plastic deformation stage before failure.
It should be noted that although all slabs were reinforced with a single layer of bidirectional bamboo net, the reinforcement ratio (ρ) varied due to the change in slab thickness. Thicker slabs had a lower reinforcement ratio. The significant increase in stiffness (bearing capacity) observed in thicker slabs is primarily attributed to the geometric progression of the moment of inertia and the increased height of the compression zone in the concrete section. Consequently, despite the lower reinforcement ratio, thicker slabs exhibited higher bending resistance but showed smaller deformation capacity before failure, consistent with the reduction in ultimate curvature observed in the tests.

4.2. Calculation of Bending Moment of Slabs

Two types of damage occur in the cross-section of slabs: the concrete in the compression zone is crushed, or the bamboo in the tension zone breaks. Based on the mechanical equilibrium of the cross-section, the theoretical ultimate flexural bearing capacity Fu (Equation (9)) is calculated when the total tensile force in the tensile zone and the total compressive force in the compressive zone are equal. The theoretical Fu and the measured Fu are shown in Table 12.
F u = k f t b ( h x ) ( h h x 2 β x 2 )
In the formula, ft—tensile strength of bamboo; k—correction coefficient, reflecting the non-uniformity of stress distribution; b—slab width; h—slab thickness; x—height of the compression zone; β—height coefficient of the equivalent rectangle.
It can be seen from the table that there is a systematic deviation between the measured Fu and the theoretical Fu, which indicates that the traditional theoretical model has limitations when describing the synergistic effect of thick slabs and high SF dosages. Similar deviations have been introduced in the research of natural fiber-reinforced concrete, and their root cause is often attributed to the difference in interfacial bonding performance between the fibers and the matrix. To enhance the accuracy of the theoretical model, a piecewise adjustment coefficient η is introduced. The necessity of η arises from the limitations of the theoretical assumptions: the idealized “plane section assumption” cannot fully capture the complex interfacial behavior (slip and bonding) between bamboo and concrete, nor the non-uniform fiber distribution effect. Therefore, η is defined here as a “Synergistic Efficiency Factor,” which quantifies the combined reinforcing efficiency of bamboo and SF that is unaccounted for in the classical flexural theory. Its functional form is related to the slab thickness d and SF dosages λf (Equation (10)). The selection of 1.5% SF dosage as the threshold is based on the experimental observations of bearing capacity growth trends. As shown in Table 5, the bearing capacity increases significantly when the dosage rises from 1% to 1.5%, but the growth rate slows down considerably when the dosage further increases from 1.5% to 2% (e.g., for 80 mm slabs, the increase drops from 24% to 5%). This indicates that 1.5% marks a critical transition in reinforcement efficiency (diminishing returns), justifying its selection as the boundary for the piecewise function. Equation (11) is used to correct the theoretical Fu. The corrected theoretical Fcu and measured Fum are shown in Table 13.
The introduction of the correction coefficient η quantifies the synergistic effect between bamboo and SF. As shown in Table 12, the model without this coefficient (theoretical Fu) deviates significantly from experimental results, whereas incorporating η reduces errors to within ±2%. This quantitative agreement validates the existence of a strong mechanical synergy, which is mathematically expressed by the coefficient η in Equations (10) and (11).
F u c = η ( d , λ f ) F u t η = 0.95 0.015 d λ f 1.5 0.98 0.005 d 0.02 λ f λ f > 1.5
M u = ( 0.95 0.015 h ) k f t b ( h x ) ( h 0 β x 2 ) λ f 1.5 ( 0.98 0.005 h 0.02 λ f ) k f t b ( h x ) ( h 0 β x 2 ) λ f > 1.5
Table 14 shows the comparison between the corrected theoretical values Fuc of the bearing capacity of several different SF dosages and different thicknesses of the slabs, and the calculated values of the existing model. It can be seen from the table that by introducing the segmented correction coefficient η related to the slab thickness and the SF dosage, the model error fluctuates within ±2%, indicating that the correction coefficient effectively balances the synergistic effect of “bamboo tensile strength” and “SF crack resistance”, and improves the calculation stability.

4.3. Calculation of Maximum Crack Width of Slabs

The maximum crack width wmax was calculated. For flexural slabs with SF added, the influence of SF dosage on the maximum crack width of slabs, wfmax, needs to be considered, and the introduction coefficient βcw is required, as shown in Equation (12). In the formula, λ f m represents the characteristic value of SF dosage, which is taken as 0.25. The calculated and measured wfmax of slabs with different thicknesses and different SF dosages are shown in Table 15.
w f max = w max ( 1 β c w λ f m )
From Table 15, the dosages of SF and the thickness of the slab have a significant correlation with crack development. When the dosage of SF was increased from 1% to 2%, wlf max of the slabs increased significantly. Take 50 mm as an example. The measured value has increased by 70%, and the calculated value also shows a growth trend. However, increasing the slab thickness has a limited effect on suppressing crack development. For instance, when the SF dosage is 1%, increasing the slab thickness from 50 mm to 80 mm only raises the measured crack width by 10%, which may be related to the enhanced stiffness and the redistribution of internal stress. Therefore, simply increasing the dosage of SF may exacerbate crack development due to insufficient dispersion or interface bonding defects. It is recommended that the dosage of SF be controlled within 1.5% in actual engineering, and the fiber dispersion process be optimized to improve uniformity.
This observation, while seemingly contradictory to the conventional crack-arresting effect of fibers, is actually a manifestation of enhanced ductility. Steel fibers effectively restrict crack width at initial cracking and service stages. However, they also impart significant deformation capacity to the slab. Consequently, SF-reinforced slabs sustain much larger deflections before final failure, allowing cracks to widen substantially compared to PC slabs, which fail in a brittle manner with limited deformation and narrower cracks. Therefore, the larger ultimate crack width in SF slabs is a trade-off for their superior energy absorption and ductility.

4.4. Durability Considerations

A potential concern regarding the use of steel fibers is corrosion. However, it is important to distinguish this from the corrosion of conventional steel bars. Steel fibers are finely distributed within the concrete matrix and are typically protected by the alkaline environment. Unlike reinforcing bars, where corrosion leads to expansive cracking and spalling, fiber corrosion is generally limited to the surface and does not significantly compromise structural integrity. Furthermore, the primary motivation for using bamboo in this study is its sustainability and low carbon footprint, rather than completely eliminating all metallic components.

4.5. Role of Bamboo Reinforcement vs. Distributed Reinforcement

SFRC slabs possess high toughness but relatively low flexural capacity due to the lack of longitudinal reinforcement. They typically fail by the gradual pull-out of fibers under high deflection. In this study, the inclusion of bamboo strips acts as longitudinal reinforcement, bridging the macro-cracks. The comparison between BRC and SF-BRC shows that steel fibers act as “distributed reinforcement” to control micro-cracking. The SF-BRC slab combines the high stiffness provided by bamboo (longitudinal) and the ductility provided by fibers (distributed). Without bamboo, the slab would lack sufficient load-bearing capacity for structural use; without fibers (i.e., BRC alone), the slab would exhibit brittle failure. The hybrid system is therefore essential.

5. Conclusions

This study investigated the mechanical behavior of steel fiber-reinforced bamboo-reinforced concrete slabs (SFRBCS) through static load and drop hammer impact tests. Based on the experimental analysis and theoretical modeling, the following conclusions are drawn:
(1) Mechanical performance and synergistic mechanism: The addition of steel fibers (SF) significantly enhances both the static and dynamic properties of the slabs. A distinct synergistic mechanism of “elastic energy absorption by bamboo–plastic energy dissipation by SF” was revealed. Specifically, the dynamic impact energy dissipation (E2) increased by approximately three times compared to PC slabs (Table 7, Section 3.2.2), and the ultimate bearing capacity increased by up to 24.5% at 1.5% SF dosage (Table 5, Section 3.1.2). The optimal synergistic effect for energy dissipation was observed at 2% SF dosage with an 80 mm slab thickness.
(2) Theoretical modeling: A bearing capacity calculation model considering the synergistic effect was established by introducing a “bamboo–SF interface correction coefficient η”. This correction successfully reduced the calculation error from 25% (using the traditional model) to 8.3%. The proposed model shows good agreement with experimental results, with deviations within 10% for most cases (Table 12, Section 4.2), effectively extending the applicability of yield line theory to such composite materials.
(3) Design optimization and application: The study identifies the combination of 1.5% SF dosage and 80 mm slab thickness as the optimal design, increasing material utilization by 20%. This configuration offers a balanced solution for structural efficiency and cost. The SFRBCS system provides a viable, green alternative for floor slabs and temporary structures in low- and multi-story buildings.
(4) Limitations and future work: It should be acknowledged that this study tested only one specimen per parameter configuration (n=1), which limits the statistical robustness of the data. Future research should increase the number of replicates to obtain more reliable statistical results. Furthermore, the scope will be expanded to beam and column structures to investigate seismic performance, optimize material proportions via numerical simulation and SEM analysis, and address long-term durability issues.

Author Contributions

Conceptualization, Y.G.; methodology, Y.G.; software, W.L.; validation, X.R.; formal analysis, B.W.; investigation, W.Y.; resources, W.L. and Y.L.; data curation, W.Y.; writing—original draft preparation, X.R.; writing—review and editing, Y.L. All authors have read and agreed to the published version of the manuscript.

Funding

This research was funded by the Jiangxi Province Intelligent Building Engineering Research Center Open Fund Project (No. HK20231009), the National Natural Science Foundation of China, and the State Key Laboratory of Geological Disaster Prevention and Geological Environmental Protection of Chengdu University of Technology, grant numbers 2015BAK09B01, 41877273, and SKLGP2019K019.

Data Availability Statement

Data will be made available upon request.

Acknowledgments

The authors of the paper would like to thank the editors and reviewers for their guidance and feedback on the paper.

Conflicts of Interest

The authors declare that they have no known competing financial interests or personal relationships that could have appeared to influence the work reported in this paper.

References

  1. Park, D.; Hwang, Y.K.; Jin, S. Optimization of rate-dependent material parameters for accurate blast response prediction in reinforced concrete slabs. Comput. Struct. 2025, 318, 107961. [Google Scholar] [CrossRef]
  2. Hason, M.M.; Al-Janabi, M.A.Q. Behavior of zero cement reinforced concrete slabs under monotonic and impact loads: Experimental and numerical investigations. Case Stud. Constr. Mater. 2024, 21, e03789. [Google Scholar] [CrossRef]
  3. Samiee, H.; Kheyroddin, A.; Sharbatdar, M.K. Performance evaluation of deteriorated reinforced concrete flat slab-column connections: An experimental study. J. Build. Eng. 2025, 113, 114122. [Google Scholar] [CrossRef]
  4. Dimri, A.; Chakraborty, S. Damage identification of reinforced concrete slabs using experimental modal testing and finite element model updating. Structures 2024, 67, 107023. [Google Scholar] [CrossRef]
  5. Li, W.; Ma, R.; Liu, Y. Fatigue deterioration of reinforced concrete slabs for composite bridges considering rebar-concrete interfacial bond damage: Testing, analysis, and modelling. Structures 2025, 80, 110131. [Google Scholar] [CrossRef]
  6. Gunasti, A.; Manggala, A.S.; Al-Rosyid, L.M.; Ahmad, H.H. Lateral cyclic performance of bamboo reinforced concrete columns with pilecap systems and incorporated rebar strengthening. Adv. Bamboo Sci. 2025, 13, 100198. [Google Scholar] [CrossRef]
  7. Zambak, O.K.; Celik, O.C. Behavior of bamboo reinforced concrete (BRC) beams under monotonic and dynamic loads. Constr. Build. Mater. 2025, 458, 139683. [Google Scholar] [CrossRef]
  8. Kanagaraj, B.; Sohliya, A.; Jayakumar, G. Performance evaluation of bamboo reinforced concrete slab: A comparative study between fibre reinforced mix and shape optimised composite. Clean. Waste Syst. 2025, 12, 100409. [Google Scholar] [CrossRef]
  9. Siddique, M.M.; Islam, M.S.; Arifuzzaman, M. Impact of coating and grooving on mechanical performance of bamboo-reinforced concrete. Hybrid Adv. 2025, 11, 100521. [Google Scholar] [CrossRef]
  10. Wu, C.; Wei, Y.; Tawfiq, W.; Chen, J.; Ding, Y. Flexural behavior of surface-modified bamboo scrimber-reinforced concrete beams: Experimental and theoretical studies. Eng. Struct. 2025, 335, 120319. [Google Scholar] [CrossRef]
  11. Luo, Y.; Chen, Y.; Yu, Y. Mechanical and impermeability properties of bamboo fiber reinforced concrete before and after wet-dry cycling. Structures 2025, 73, 108363. [Google Scholar] [CrossRef]
  12. Mali, P.R.; Datta, D. Experimental evaluation of bamboo reinforced concrete slab panels. Constr. Build. Mater. 2018, 188, 1092–1100. [Google Scholar] [CrossRef]
  13. Mali, P.R.; Datta, D. Experimental evaluation of bamboo reinforced concrete beams. J. Build. Eng. 2020, 28, 101071. [Google Scholar] [CrossRef]
  14. Bolina, F.L.; Fachinelli, E.G.; Rodrigues, J.P.C. Analysis of building structures subjected to electric vehicle fires. J. Build. Eng. 2025, 107, 112769. [Google Scholar] [CrossRef]
  15. Fan, Y.; Xu, S.; Yang, G. Dynamic response of air-backed steel-fiber reinforced concrete slabs subjected to underwater contact explosions. Structures 2025, 78, 109273. [Google Scholar] [CrossRef]
  16. Fayed, S.; Madenci, E.; Özkılıç, Y.O. The flexural behaviour of multi-layered steel fiber reinforced or ultra-high performance-normal concrete composite ground slabs. J. Build. Eng. 2024, 95, 109901. [Google Scholar] [CrossRef]
  17. Zhao, X.; Sun, J.; Zhao, H. Experimental and mesoscopic modeling numerical researches on steel fiber reinforced concrete slabs under contact explosion. Structures 2024, 61, 106114. [Google Scholar] [CrossRef]
  18. Seydmoradi, A.; Tavana, M.H.; Habibi, M.R. Investigation on the response of steel fiber reinforced lightweight aggregate concrete slab under sequential impact loading. Eng. Fail. Anal. 2024, 161, 108221. [Google Scholar] [CrossRef]
  19. Gao, D.; Diao, Y.; Zhang, S. Effects of steel fiber on the impact performance of ultra-high performance concrete using steel ball aggregates. Constr. Build. Mater. 2025, 458, 139570. [Google Scholar] [CrossRef]
  20. Babiker, A.; Abbas, Y.M.; Khan, M. Enhancing design and behavioral understanding of steel fiber-reinforced concrete flat slabs through a robust machine learning framework. J. Build. Eng. 2025, 111, 113133. [Google Scholar] [CrossRef]
  21. Ahmed, W.; Lim, C.W. Production of sustainable and structural fiber reinforced recycled aggregate concrete with improved fracture properties: A review. J. Clean. Prod. 2020, 263, 121501. [Google Scholar] [CrossRef]
  22. Alberti, M.G.; Enfedaque, A.; Gálvez, J.C. Fibre reinforced concrete with a combination of polyolefin and steel-hooked fibres. Compos. Struct. 2017, 171, 317–325. [Google Scholar] [CrossRef]
  23. Afroughsabet, V.; Biolzi, L.; Monteir, P.J.M. The effect of steel and polypropylene fibers on the chloride diffusivity and drying shrinkage of high-strength concrete. Compos. B Eng. 2018, 139, 84–96. [Google Scholar] [CrossRef]
  24. Afroughsabet, V.; Ozbakkaloglu, T. Mechanical and durability properties of high-strength concrete containing steel and polypropylene fibers. Construct. Build. Mater. 2015, 94, 73–82. [Google Scholar] [CrossRef]
  25. Liu, C.; Li, K.; Yang, M. Study on compressive and thermal properties of hybrid basalt-polypropylene fiber reinforced concrete subjected to elevated temperature after water cooling. Structures 2025, 81, 110285. [Google Scholar] [CrossRef]
  26. Mani, S.; Partheeban, P.; Andiyappan, K. Mechanical and durability performance of multilayered hemp–sisal fiber-reinforced geopolymer concrete for sustainable construction. Structures 2025, 81, 110328. [Google Scholar] [CrossRef]
  27. Hamada, H.M.; Al-Attar, A.; Askar, M.K. Advancing the sustainability of fiber-reinforced geopolymer concrete using natural plant fibers: A comprehensive review of properties and impacts. Structures 2025, 77, 109201. [Google Scholar] [CrossRef]
  28. Filho, R.D.T.; Ghavami, K.; Sanjuán, M.A. Free, restrained and drying shrinkage of cement mortar composites reinforced with vegetable fibres. Cem. Concr. Compos. 2005, 27, 537–546. [Google Scholar] [CrossRef]
  29. Qu, S.; Pan, C.; Peng, B. Study on the crack resistance of concrete reinforced with flax fiber and multi-walled carbon nanotubes. Constr. Build. Mater. 2025, 488, 141884. [Google Scholar] [CrossRef]
  30. CECS 13:2009; Standard for Test Methods of Fiber-Reinforced Concrete. China Planning Press: Beijing, China, 2010.
  31. GB 50010-2010; Code for Design of Concrete Structures. China Architecture & Building Press: Beijing, China, 2015.
Figure 1. Raw materials.
Buildings 16 01046 g001
Figure 2. The process of slab preparation and curing.
Buildings 16 01046 g002
Figure 3. The structure and reinforcement of the slab (mm).
Buildings 16 01046 g003
Figure 4. Test loading device.
Buildings 16 01046 g004
Figure 5. Measurement points arrangement (mm).
Buildings 16 01046 g005
Figure 6. Self-made test device.
Buildings 16 01046 g006
Figure 7. Failure modes and crack directions of PC slabs.
Buildings 16 01046 g007aBuildings 16 01046 g007b
Figure 8. Failure modes and crack directions of slabs with 1% SF dosage.
Buildings 16 01046 g008aBuildings 16 01046 g008b
Figure 9. Failure modes and crack directions of slabs with 1.5% SF dosage.
Buildings 16 01046 g009
Figure 10. Failure modes and crack directions of slabs with 2% SF dosage.
Buildings 16 01046 g010
Figure 11. Load–displacement curves.
Buildings 16 01046 g011
Figure 12. PC slabs’ failure modes.
Buildings 16 01046 g012
Figure 13. Slabs with 1% SF dosage failure modes.
Buildings 16 01046 g013
Figure 14. Slabs with 2% SF dosage failure modes.
Buildings 16 01046 g014
Figure 15. Relationship between ductility ratio β and ductility coefficient C.
Buildings 16 01046 g015
Figure 16. Improvement of impact resistance.
Buildings 16 01046 g016
Table 1. Cement performance index.
Loss on Ignition
(%)
Coagulation Time
(min)
Compressive Strength
(MPa)
Flexural Strength
(MPa)
2096Initial settingFinal setting3d28d3d28d
25931825.552.55.28.8
Table 2. Mixing ratio.
SF Dosage (%)Quantity of Each Material per Unit Volume (kg/m3)
SFCementFACAWaterWr
0%031084010801701
1%78.531084010801701
1.5%117.7531084010801701
2%15731084010801701
Table 3. Basic mechanical properties of SFRC.
SF Dosage (%)Compressive Strength fc (MPa)Splitting Tensile Strength ft (MPa)Elastic Modulus Ec (GPa)
032.52.830.5
1.035.23.131.2
1.537.83.432.0
2.039.53.632.8
Table 4. Slabs information.
TestsSize (mm)NumberTotal
Static load test400 × 400 × 50412
400 × 400 × 654
400 × 400 × 804
Drop hammer impact test400 × 400 × 50412
400 × 400 × 654
400 × 400 × 804
Table 5. The parameters of slabs.
Slabs NumberReinforcement RatioSF DosageThickness of SlabLoading Mode
PC-500050Local uniform loading
PC-650065
PC-800080
SF-1-500.63%1%50
SF-1-650.48%1%65
SF-1-800.39%1%80
SF-1.5-500.63%1.5%50
SF-1.5-650.48%1.5%65
SF-1.5-800.39%1.5%80
SF-2-500.63%2%50
SF-2-650.48%2%65
SF-2-800.39%2%80
Note: PC-50 indicates a 50 mm-thick plain concrete slab with a strength of C30; SF-1-50 indicates a concrete slab with an SF dosage of 1% and a thickness of 50 mm, and so on.
Table 6. Loading test results.
Slab NumberCracking Load
P c r (kN)
Cracking Displacement
Δ c r (mm)
Ultimate Load
P u (kN)
Ultimate Displacement
Δ u (mm)
Failure Mode
PC-0-509.71.2713.14.45Shear failure
PC-0-6511.22.7115.65.54
PC-0-8014.83.1817.46.10
SF-1-5010.61.6217.125.38Bending failure
SF-1-6512.32.3322.421.95
SF-1-8017.92.8831.826.94
SF-1.5-5014.62.3522.932.2
SF-1.5-6517.62.9725.743.33
SF-1.5-8022.42.5939.643.08
SF-2-5019.52.5229.441.23
SF-2-6525.53.6736.143.26
SF-2-8027.15.3641.538.97
Table 7. The growth rate of the cracking load and cracking displacement.
Variation in SF DosageThickness (mm)Cracking LoadCracking Displacement
Increased from 1% to 1.5%5038%39%
6543%26%
8025%−9%
Increased from 1% to 2%5084%68%
65107%53%
8051%87%
Increased from 1.5% to 2%5034%7%
6545%24%
8021%107%
Table 8. Impact test results.
Thickness
(mm)
NumberSF Dosage (%)N1N2E1
(N·m)
E2
(N·m)
E (Average Energy)
(N·m)
50PC0125911888
SF-1126118353235
SF-1.51.527118412265
SF-2229118530324
65PC0125911888
SF-1128118471294
SF-1.51.5211118647383
SF-2211559883471
80PC01359177118
SF-11210118589353
SF-1.51.5215118883500
SF-223211771236706
Table 9. Number of fragment diameters of slabs with different SF dosage.
Thickness
(mm)
Fragment Diameters (mm)Number with Different SF Dosages
0%1%1.5%2%
505–100235
10–150212
15–201122
20–251212
25–302245
655–100112
10–150112
15–201111
20–251222
25–302235
805–100010
10–150020
15–200110
20–253224
25–302220
Table 10. Concrete constitutive parameters.
SF Dosagesmak
1%1.42080.002722.3066
1.5%1.58310.0037211.34664
2%1.273521.2735224.94
Note: These parameters were calibrated from the uniaxial compressive tests of SFRC prisms described in Section 2.1.2.
Table 11. Relationship of the moment–curvature of slabs cross-section.
Slab NumberSF DosageMu (N·m)φu (mm−1)
SF-1-501%138.5640.000211
SF-1.5-501.5%145.2360.000221
SF-2-502%150.8720.000228
SF-1-651%221.3480.000162
SF-1.5-651.5%230.7840.000168
SF-2-652%238.9120.000173
SF-1-801%284.560.000132
SF-1.5-801.5%295.6960.000136
SF-2-802%305.8320.000140
Table 12. Measured Fum and theoretical Fut.
Slab NumberFum (kN·m)Fut (kN·m)
SF-1-501.51.62
SF-1.5-502.02.73
SF-2-502.574.44
SF-1-651.961.76
SF-1.5-652.253.10
SF-2-653.165.16
SF-1-802.781.88
SF-1.5-803.473.51
SF-2-803.635.65
Table 13. Measured Fum and corrected theoretical Fuc.
Slab NumberFumFutFucInitial Error (%)Error After Correction (%)
SF-1-501.51.621.51+8+0.7
SF-1.5-502.02.731.98−19−1
SF-2-502.574.442.50−36.5−2.7
SF-1-651.961.761.99+28.1+1.5
SF-1.5-652.253.102.28+27.6+1.3
SF-2-653.165.163.20+9.9+1.3
SF-1-802.781.882.85+37.4+2.5
SF-1.5-803.473.513.54+32.8+2
SF-2-803.635.653.70+35.3+1.9
Table 14. Comparison between the calculation model with η and the existing models.
Slab NumberFumCalculation Model with ηTraditional Calculation Model [31]Calculation Model of Pure Bamboo [12]
FucError (%)FutError (%)FutError (%)
SF-2-502.572.50+2.03.21+24.92.09–18.7
SF-1-651.961.99+1.52.45+25.01.58–19.4
SF-1.5-803.473.54–2.74.34+25.12.84–18.2
Average--±2.1-+25.0-–18.7
Table 15. wf max of slabs with different thicknesses and different SF dosages.
Slab Numberwlf max (mm)wcf max (mm)wlf max/wcf max
SF-1-500.2760.2511.10
SF-1.5-500.3530.3361.05
SF-2-500.4700.4311.09
SF-1-650.2970.2781.07
SF-1.5-650.3660.3271.12
SF-2-650.5220.4501.16
SF-1-800.3040.2981.02
SF-1.5-800.3860.3711.04
SF-2-800.3950.3911.01
Note: wlfmax represents the measured values of the maximum crack width, and wcf max represents the calculated values of the maximum crack width.
Disclaimer/Publisher’s Note: The statements, opinions and data contained in all publications are solely those of the individual author(s) and contributor(s) and not of MDPI and/or the editor(s). MDPI and/or the editor(s) disclaim responsibility for any injury to people or property resulting from any ideas, methods, instructions or products referred to in the content.