Article

Multi-Factor Modified Creep Deformation Prediction of High-Performance Concrete Structures: A Case Study

1
College of Civil Engineering and Architecture, Ningbo Tech University, Ningbo 315100, China
2
Institute of Structural Engineering, Zhejiang University, Hangzhou 310058, China
3
College of Architecture and Environment, Sichuan University, Chengdu 610065, China
*
Author to whom correspondence should be addressed.
Buildings 2026, 16(4), 857; https://doi.org/10.3390/buildings16040857
Submission received: 8 January 2026 / Revised: 7 February 2026 / Accepted: 13 February 2026 / Published: 20 February 2026
(This article belongs to the Section Building Structures)

Abstract

The use of high-performance concrete is a common practice in the construction of large-span bridges, where creep deformation may exert a considerable influence. This article puts forth a practical calculation method for long-term creep deformation of concrete bridges, based on short-term laboratory creep tests and multi-factor modification methods. A case study of a large-span railway concrete cable-stayed bridge examines the prediction results in conjunction with the monitoring data derived from digital image correlation (DIC) and compares these with the existing specifications. The results demonstrate that the mid-span deflection predicted by the proposed model shows a high degree of agreement with the short-term measurements. Over a monitoring period of 247 days, the mean mid-span deflection is found to be 2.948 mm and the predicted value is 3.343 mm, giving a relative error of 11.8% relative to the measured mean, which is deemed acceptable in engineering practice. The deflection values at various long-term time nodes indicate that the existing specifications generally overestimate the effect of creep when the concrete types are not taken into account. Although the predictions of the CEB90 model are closest to the model proposed in this paper, they are still 56.8%, 75.4% and 82.2% higher in the mid-span deflection at 3, 10 and 20 years after completion, respectively.

1. Introduction

Concrete creep is defined as the phenomenon of increasing deformation over time under constant load [1]. The influence of creep on the functionality of a structure can be considerable, resulting in complications such as substantial deformation, redistribution of internal forces, relaxation of prestress, and cracking in concrete structures [2]. The ramifications of creep are especially pronounced in expansive bridges, leading to considerable excess deflection [3,4,5,6,7]. Typically, the Koror-Barbourtuapu Bridge in the Republic of Palau exhibited a mid-span deflection of 1.61 m after 18 years of construction but collapsed within three months after the implementation of strengthening measures [8]. The Parrotts Ferry Bridge in the United States, with a main span of 195 m, exhibited a deflection of 635 mm 12 years after its completion [9]. A deflection of 22.2 cm was also observed in the left span of the Humen Bridge Auxiliary Channel Bridge seven years after its completion [10]. It should be noted that the use of high-performance concrete (HPC) is becoming increasingly prevalent in practical bridge projects, for which it is necessary to establish a constitutive creep model from nature [11,12]. Nevertheless, a unified specification and model for HPC, comparable to those established for ordinary concrete, has yet to emerge. This is largely due to the influence of admixtures. Therefore, there is a compelling requirement for enhanced methodologies for modelling the creep of HPC in practical applications.
The American ACI 209 Society identifies four primary mechanisms governing concrete creep under sustained load [13,14,15]: (1) flow and extrusion of cement and C-S-H colloids; (2) transmission, flow, and evaporation of pore water; (3) compaction and expansion of microporous space; and (4) long-term hydration and subsequent internal force redistribution, leading to phenomena such as delayed elastic deformation. In consequence, all the internal and external factors that affect the aforementioned processes will have an impact on the development of creep. The primary factors influencing concrete creep under a specific loading level are mixture ratio, ambient temperature and humidity, loading age, and component dimensions. The mixing ratio exerts an influence on the quantity of cement colloid and the density of the microstructure of the concrete [16]. The ambient temperature exerts an influence on the molecular activation energy of the internal components, which in turn affects the rate of colloidal deformation and the rate of the hydration reaction [17,18,19]. The ambient humidity exerts an influence on the rate of exchange of water between the interior of the concrete and the external environment [20,21,22,23]. The loading age affects the degree of internal hydration of the concrete during loading, which affects the material state and properties of the concrete under loading [24,25]. Furthermore, recent studies on advanced cementitious composites have highlighted the significant role of early-age property modulation—including hydration kinetics, pore structure refinement, and fiber-matrix interactions—in governing shrinkage development [26]. The dimensions of the component have an impact on the specific surface area of the concrete, which in turn affects the rate of water evaporation. Additionally, the dimensions exert an influence on the stresses experienced by the internal components when subjected to a load [27,28].
The aforementioned factors will impact specific elements of the creep process and must be taken into account when calculating creep and its effect. A substantial body of research has been conducted on the influence of the aforementioned factors on creep in ordinary concrete [21,29]. Following a comprehensive series of experiments, a universal specification has been developed that incorporates these factors. This includes models such as the CEB-FIP series [30,31,32], the ACI209 model [33], the B3 model [34,35], and other normative models. In the CEB-FIP70 model, the impact of multiple variables on creep is represented through a series of multiplicative factors. Some scholars have implemented enhancements to this framework to ensure its suitability for environments with fluctuating temperature and humidity [36,37]. Nevertheless, admixtures are not taken into account in the standard concrete creep model, and the impact of admixtures is typically regarded as straightforward. This may results in a significant discrepancy in the prediction of the creep behaviour of HPC [38,39,40].
The incorporation of admixtures renders the formation of a universal model for HPC, analogous to that of ordinary concrete, a challenging endeavor. In ordinary concrete, the impact of the mixture ratio on creep is expressed in terms of strength. In contrast, HPC admixtures are added in a range of forms and ratios, which influence the components and structure of the concrete, and thus lead to notable differences in creep. Different mineral admixtures affect creep through distinct mechanisms. As indicated in the literature [3,41,42,43], slag and fly ash impact the hydration and fine microstructure of concrete, thereby affecting creep. Specifically, silica fume refines pore structure and increases early-age stiffness, which can restrain creep but may also raise autogenous shrinkage [3]. Meanwhile, slag contributes to later-age hydration and pore-filling, often reducing long-term creep [41]. Fly ash, on the other hand, generally slows hydration and lowers heat release, mitigating early creep but potentially extending its development period [42].
Currently, mesoscale finite element models (e.g., ECCSrm) have been developed to explicitly simulate moisture transport and microstructural evolution, providing a high-fidelity physical basis for predicting shrinkage and creep. Ref. [44] However, empirical formula models are still required for engineering applications, and this issue remains to be resolved. There are two main methods for establishing a HPC empirical creep model: (1) modifying an ordinary concrete model or (2) directly establishing it via experimental results. In the former case, the HPC creep model is obtained by introducing the admixture adjustment factor [24,38,39,40,45,46]. For instance, existing mainstream HPC creep models (e.g., those based on ACI 209, CEB-FIP, or B3 model adjustments) typically introduce empirical admixture factors that are derived from specific mix proportions. However, such factors lack generality across varying admixture types and dosage rates. As a result, predictions for HPC with untested admixture combinations remain highly uncertain. The latter, as evidenced by the experimental results, establishes a model for a specific mix proportion, which can minimize the material’s deviation from the creep effect. Nevertheless, challenges arise from discrepancies between laboratory conditions and actual engineering conditions—including environmental factors such as temperature and humidity, loading age, and component dimensions. Furthermore, long-term experiments are inherently time-consuming. Taken together, these limitations underscore a pressing need for an efficient, practical prediction method that can account for both material specificity and real engineering environmental conditions, which is the focus of this study.
In order to address this issue, this paper presents a methodology for deriving an engineering HPC creep model through a laboratory short-term creep experiment with an equal proportion of constituents. The time-varying function of long-term laboratory creep is established through the short-term creep experiment with equal mixing ratios. Furthermore, the impact of influencing factors on creep is determined through experimentation and a review of the pertinent literature. In light of these findings, a methodology for developing an engineering-oriented creep model for HPC is put forth, with the objective of implementing it in a tangible bridge project. The efficacy of the proposed methodology is validated through a comparative analysis of the predicted outcomes with the actual measured data.
The remainder of this paper is structured as follows. Section 2 details the proposed multi-factor modification methodology for the creep model. Section 3 presents the case study of a cable-stayed bridge, including the monitoring setup and the application of the modified model. The results, including sensitivity analysis and a comparison with existing code models, are discussed in Section 4. Finally, Section 5 summarizes the main conclusions and suggests directions for future work.

2. Multi-Factor Modified Creep Model Based on Practical Engineering

2.1. Creep Model Modification Method

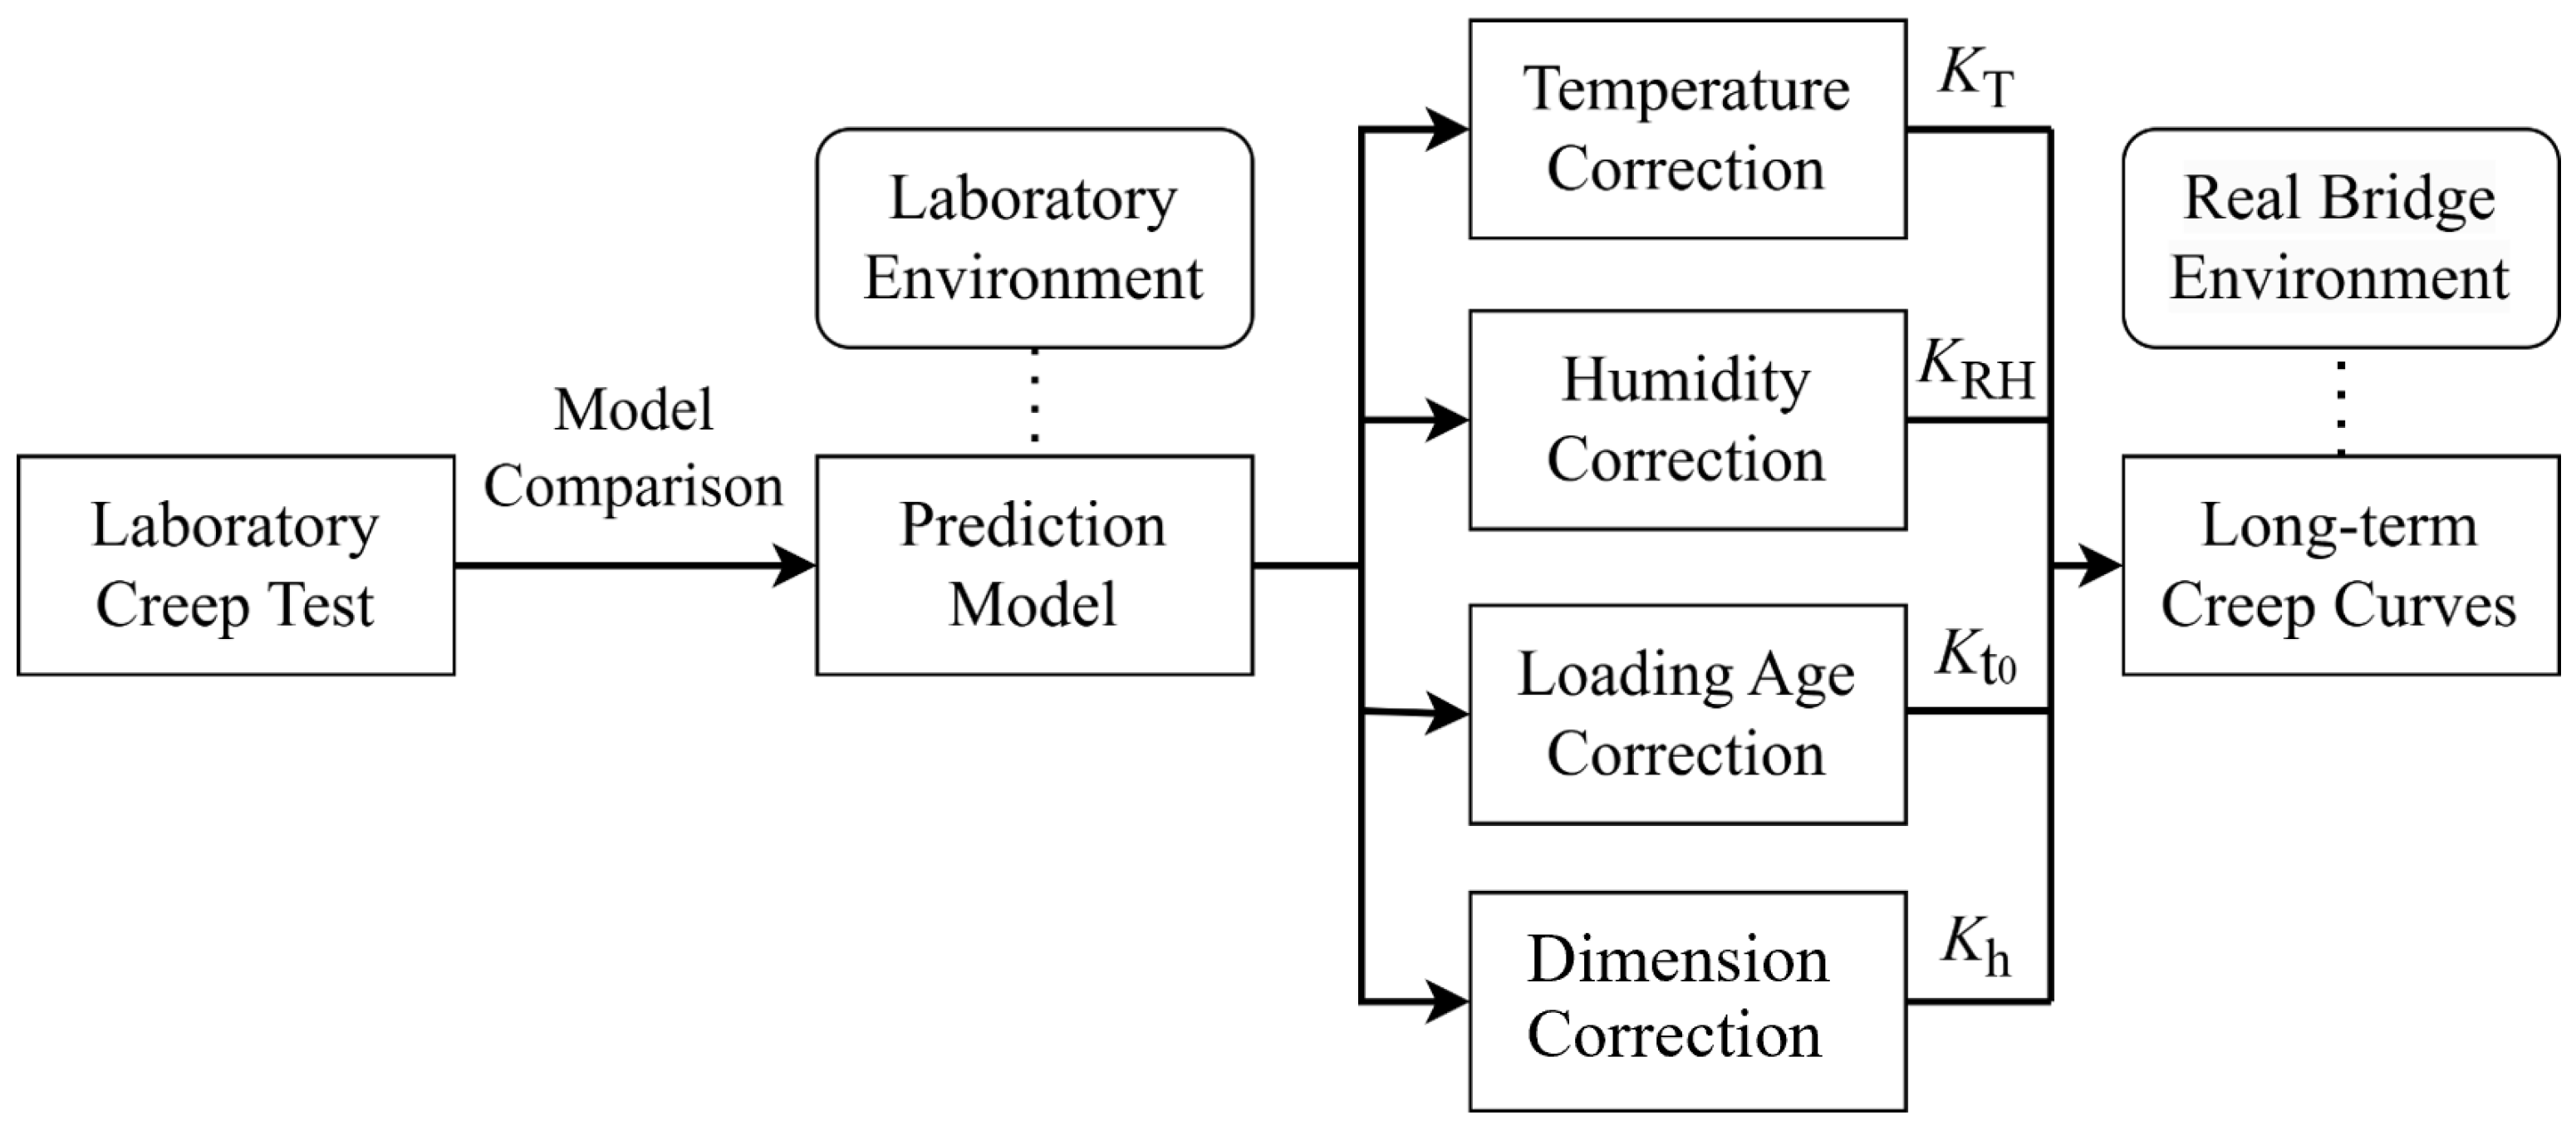
As previously indicated, the primary factors influencing concrete creep are the mixing ratio, ambient temperature and humidity, loading age, and component dimension, among others. Consequently, these factors are duly adjusted. The concept of the correction is illustrated in Figure 1. The concrete creep test is conducted with the concrete mix ratio utilized in the practical project, and a prediction model is selected to align the creep results with the laboratory environment. Subsequently, the actual bridge service environment data are collected, and the temperature, humidity, loading age, and component dimensions are corrected to align with the real bridge environment. This enables the prediction of the long-term creep of the bridge.
Given the interplay among key influencing factors—ambient temperature and humidity, loading age, and component dimensions—a multiplicative correction model is developed to translate experimental conditions into realistic bridge service conditions. This approach is employed to transform the experimental conditions into those more reflective of real-world bridge scenarios. Unlike conventional prediction models that rely on generalized empirical coefficients derived from extensive databases, this paper proposes a modification framework based on the practical project. This approach establishes a direct mapping between laboratory creep tests and the actual bridge environment, effectively mitigating prediction discrepancies caused by material specificity and complex service conditions in the real bridge. The modified model is presented below.
φ e ( t , t 0 ) = K RH · ( 1 + K T ) · K t 0 · K h · φ l a b ( t ,   28 )
where φ denotes the creep coefficient. φ e t , t 0 is the predicted value of concrete creep under the actual bridge environment, with the loading age of t 0 and the holding time of t. K R H is the humidity correction coefficient, K T is the temperature correction coefficient, K t 0 is the loading age correction coefficient, K h is the dimension correction coefficient, φ l a b t , 28 is the predicted value of concrete creep under the test environment, with the loading age of 28 days and a holding time of t.

2.2. Modification of Multi-Factors

2.2.1. Temperature

The CEB-FIP (MC90) model [31] summarizes the effect of ambient temperature on concrete creep and proposes a temperature influence coefficient K T t , using 20 °C as the base temperature.
K T t = 0.0004 θ t / θ 0 20 θ t / θ 0 20
where θ t is the actual temperature at time t, θ 0 = 1 °C. When the temperature is less than 20 °C, K T t is a negative. And when the temperature is greater than 20 °C, K T t is positive. Conventional prediction techniques often simplify ambient temperature conditions to constant temperature conditions. Existing specifications that consider concrete creep typically utilize the “average annual temperature” for provisions, which may not fully align with the actual structural service environment. This discrepancy could potentially result in a lack of precision in creep prediction. Consequently, there is a necessity to modify the creep prediction model based on variable temperature conditions.
The effect of continuous temperature change on concrete creep is the sum of the changes caused by the temperature changes Δ T in each period Δ t [36]. Based on L. Boltzman’s superposition principle, this paper considers the concrete creep prediction value at the target time as the incremental sum of the creep prediction values in each period starting from the initial time t 0 , and the equation is as follows.
φ e t , t 0 = t 0 t φ e t , t 0 t d t
Rewrite the above equation in sum form as follows.
φ e t , t 0 = 1 n φ e t 0 + n Δ t , t 0 φ e t 0 + n 1 Δ t , t 0
where φ e t , t 0 is the predicted value of concrete creep under actual bridge environment, with loading age of t 0 and load holding time of t. d t is the time increment, and the temperature is considered to be constant within one time increment. φ e t 0 + n Δ t , t 0 φ e t 0 + n 1 Δ t , t 0 is the increment of the predicted value of concrete creep determined by the temperature at time t 0 + n 1 Δ t .
In practical application, the time increment Δt is chosen based on the resolution of the available environmental data (e.g., daily, monthly). The temperature influence coefficient K T t in Equation (2) is therefore calculated for each time step using the corresponding temperature data, yielding a series of discrete coefficients K T t i . The incremental creep Δφ t i for each step is then obtained by applying K T t i to the creep increment predicted under the reference temperature (20 °C) over the same duration Δt. The total creep at time tn is finally computed by summing these temperature-adjusted increments according to Equation (4). In the subsequent case study, a monthly increment (Δt = 1 month) was adopted, consistent with the monthly average temperature records used for the analysis.

2.2.2. Humidity

The CEB-FIP specification employs concrete creep in a 100% relative humidity environment as the benchmark for correcting the creep of concrete. This method is currently widely accepted in the academic community and is the most commonly used method for humidity influence correction. Consequently, this specification method is utilized to calculate the humidity influence coefficient ( K RH,CEB ). The equation is as follows.
K RH,CEB = 1 + 3.25 [ 1 e 0.01685 ( 100 R H ) ]
In order to obtain the relative humidity influence coefficient K RH for RH% in conditions of 60%, the following procedure should be followed.
K RH = 1 + 3.25 [ 1 e 0.01685 ( 100 R H ) ] 1 + 3.25 [ 1 e 0.01685 ( 100 60 ) ]

2.2.3. Loading Age

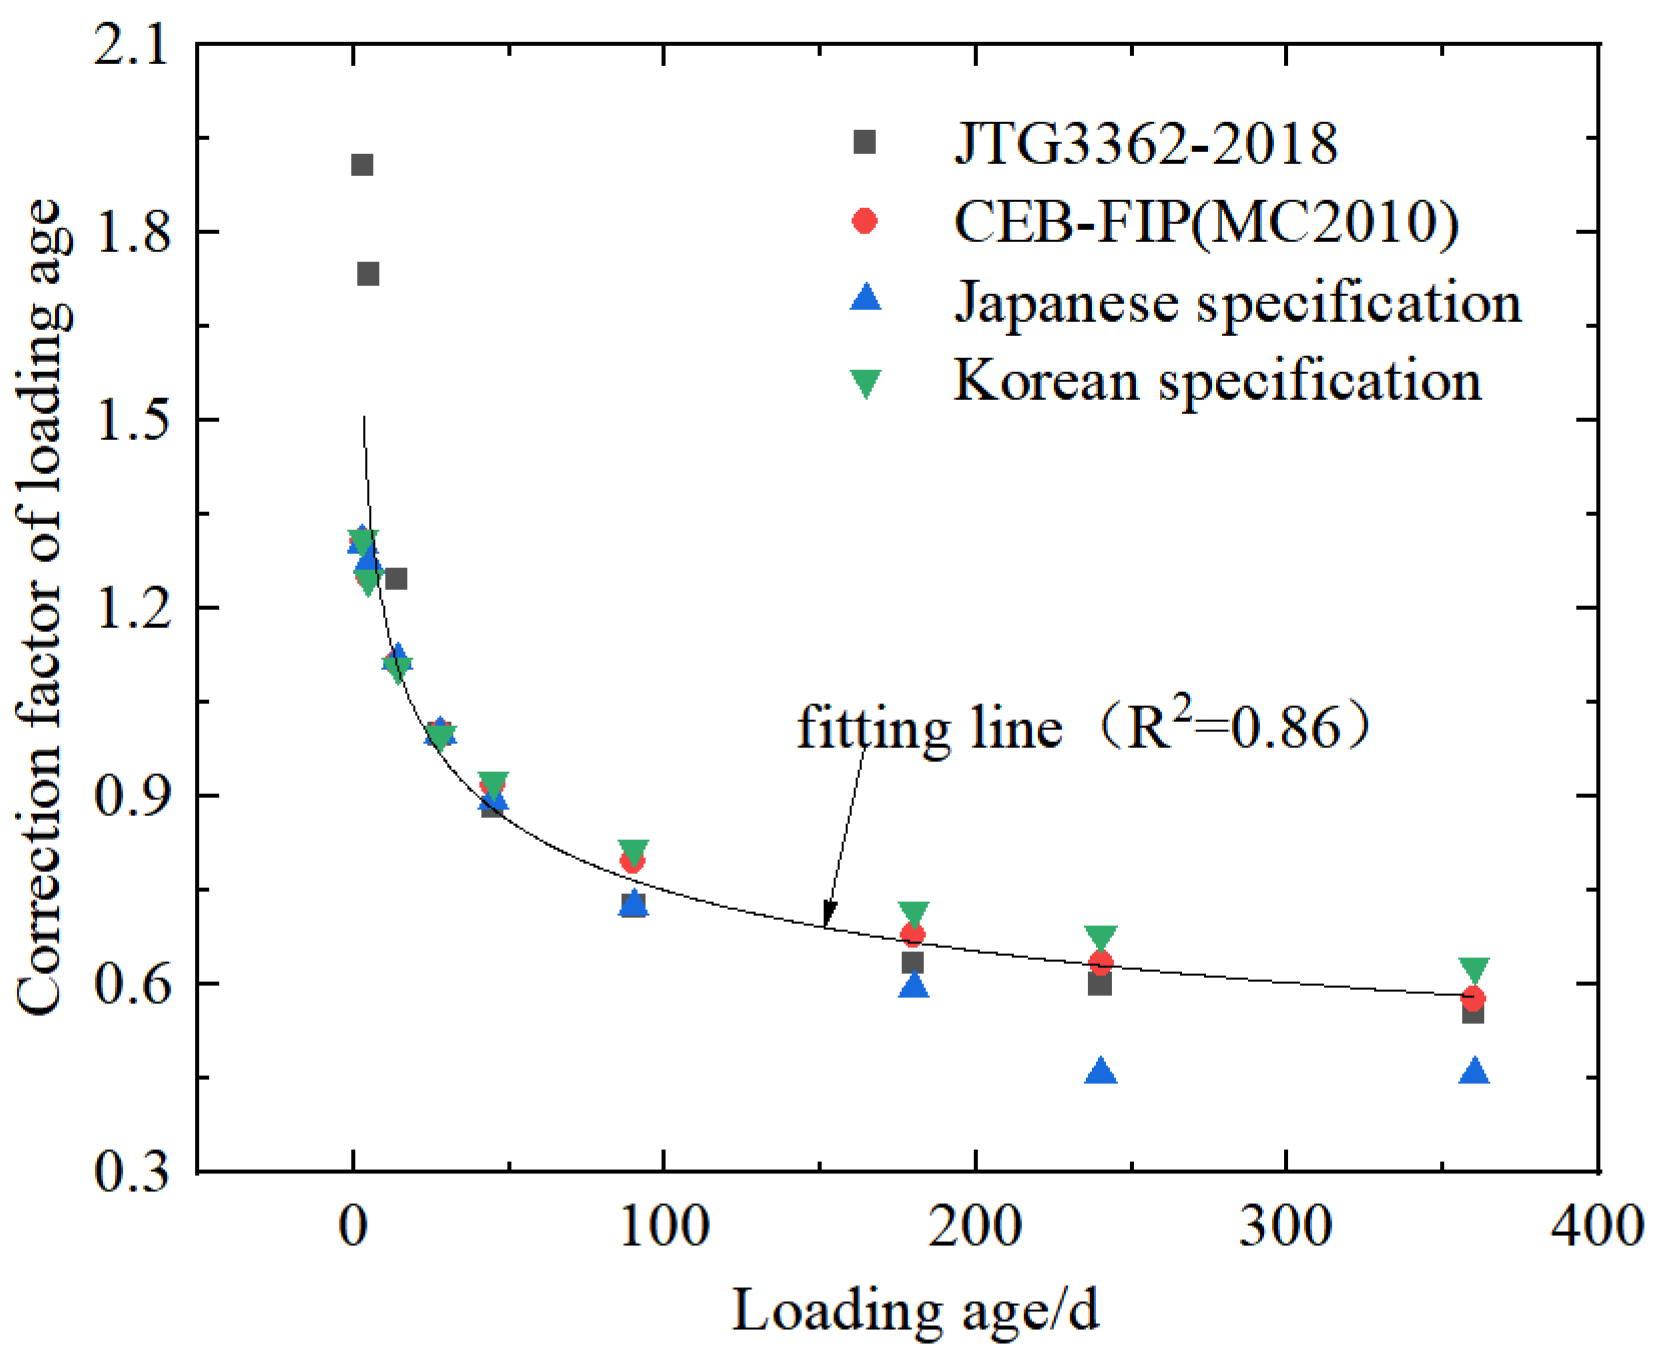
The creep model in the Chinese specification JTG3362-2018 [47], the European specification CEB-FIP, the Japanese specification, and the Korean specification incorporates the effect of loading age. Consequently, the four specifications are employed to investigate the impact of loading age. The correction factor K t 0 of loading age on creep is calculated as the ratio of the creep coefficient of each loading age to the creep coefficient when the loading age is 28 days. For each model, the remaining conditions are held constant at 20 °C, 60% humidity, and a theoretical thickness (defined in Section 2.2.4) of 75 mm. Section 4.3 of the subsequent analysis indicates that the calculated values of each influence coefficient converge to similar results under different loading durations. Therefore, the creep values corresponding to a 30-year loading duration were selected to compute the respective influence coefficients. As shown in Figure 2, the creep coefficient values for a 30-year loading period under different loading ages were statistically compiled for the four creep specifications, yielding Kt0. According to literature [48], the power-law fitting form provides a better fit for Kt0. Fitting yields:
K t 0 = 1.874 · t 0 0.199
As shown in Figure 2, R2 = 0.86.

2.2.4. Component Dimensions

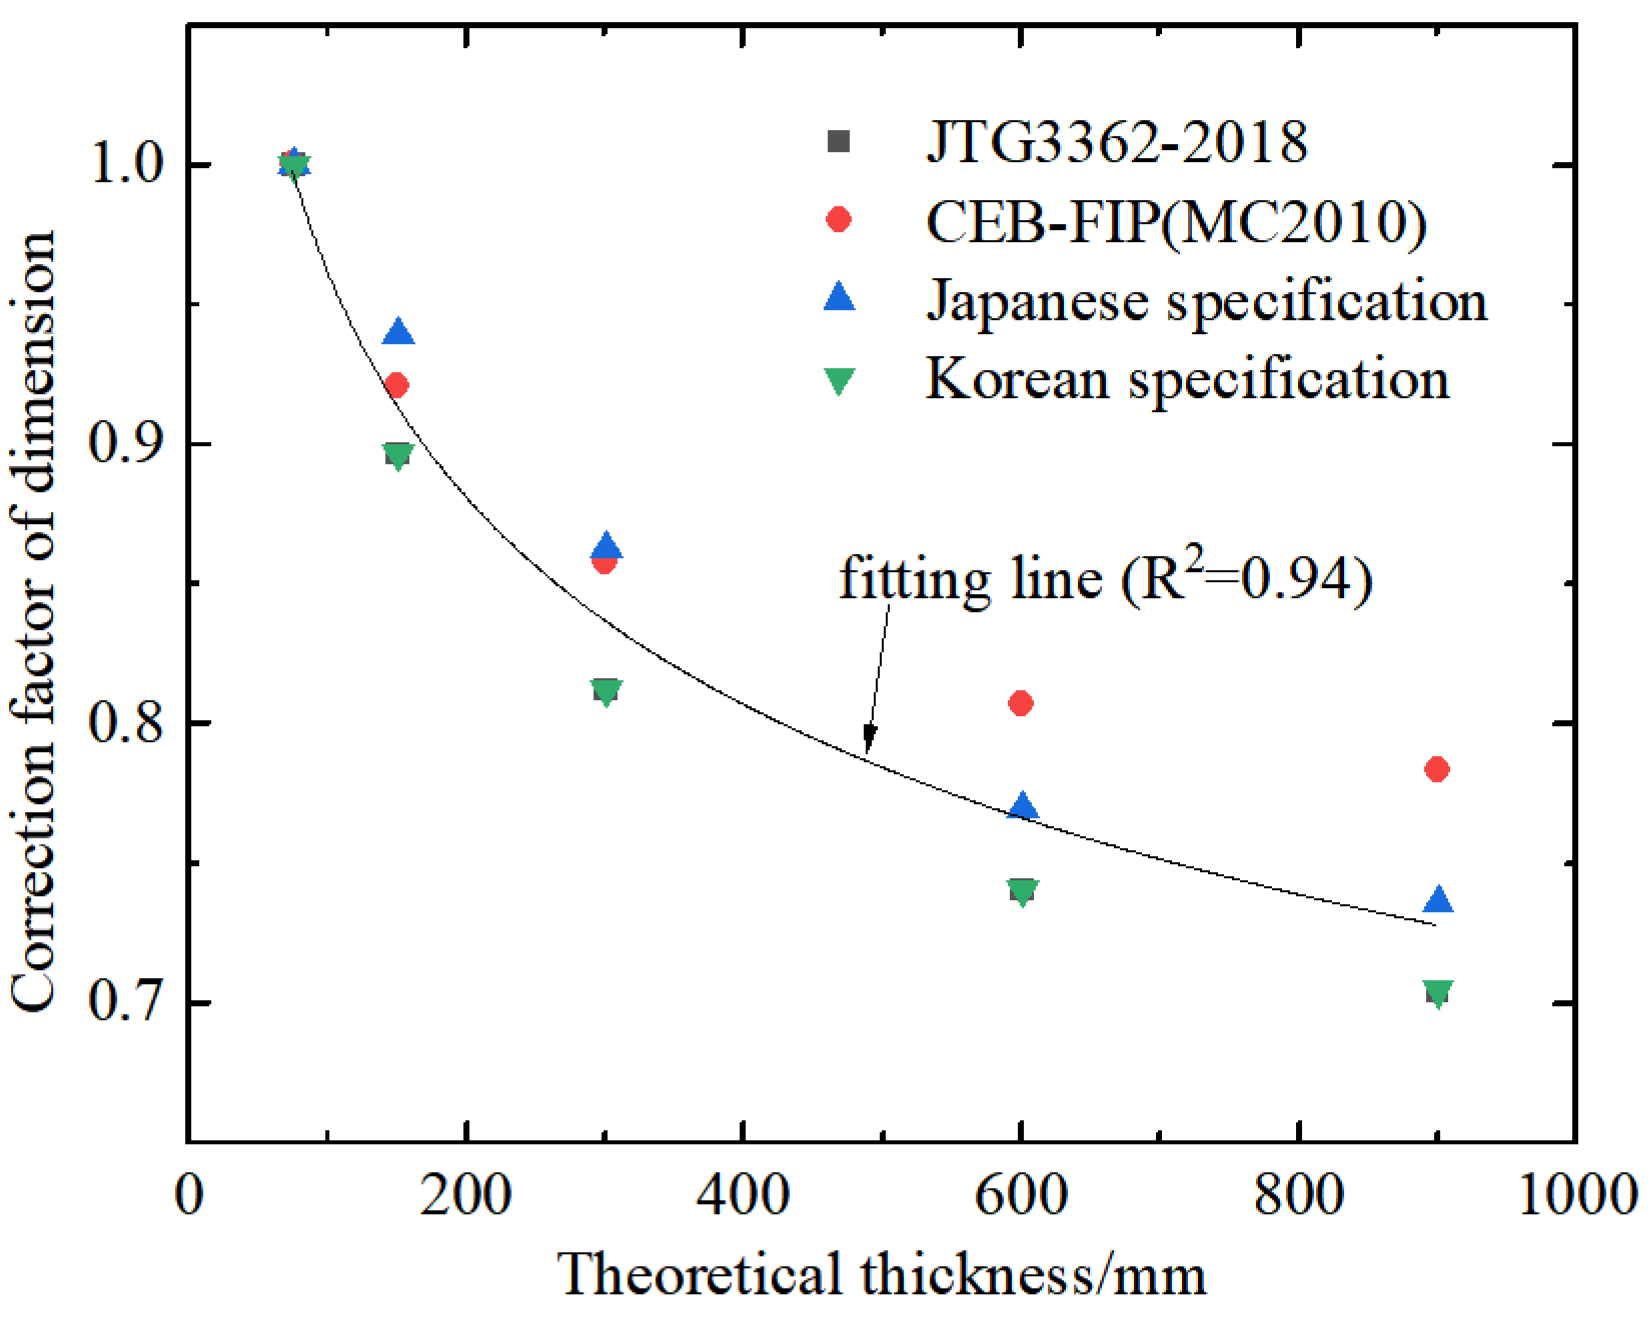
The constraints of laboratory settings preclude the possibility of conducting a comprehensive array of creep tests. However, in practical engineering applications, the component dimension of the beam segment is subject to change in accordance with the shape of the bridge line. Accordingly, it is essential to make component dimension corrections to the laboratory results in order to obtain the creep of real bridges of varying component dimensions. The correction factor of dimension K h is defined as the ratio of the creep coefficient calculated by theoretical thickness to the creep coefficient calculated by standard theoretical thickness. The theoretical thickness is the quantity that characterizes the effect of the component dimensions in the creep calculation. It is calculated by the following formula:
h m = 2 A c / u
where A c is the cross-sectional area of the member, u is the perimeter of the section. In this paper, the component dimension in the standard test is 150 mm × 150 mm × 550 mm, so the standard theoretical thickness is 75 mm obtained by Equation (8). As illustrated in Figure 3, the correction factor of dimension of the four specifications are collated and fitted. The fitting formula is given by Equation (9), with R2 = 0.94.
K h = 1.727 h m 0.127
The discrepancies in the component dimensions effects between the specified models are relatively minor in comparison to the loading age. It is evident that there is greater consistency in the way that countries approach the issue of component dimensions effects, at least in comparison to other areas of regulation.

3. Case Study

3.1. Background

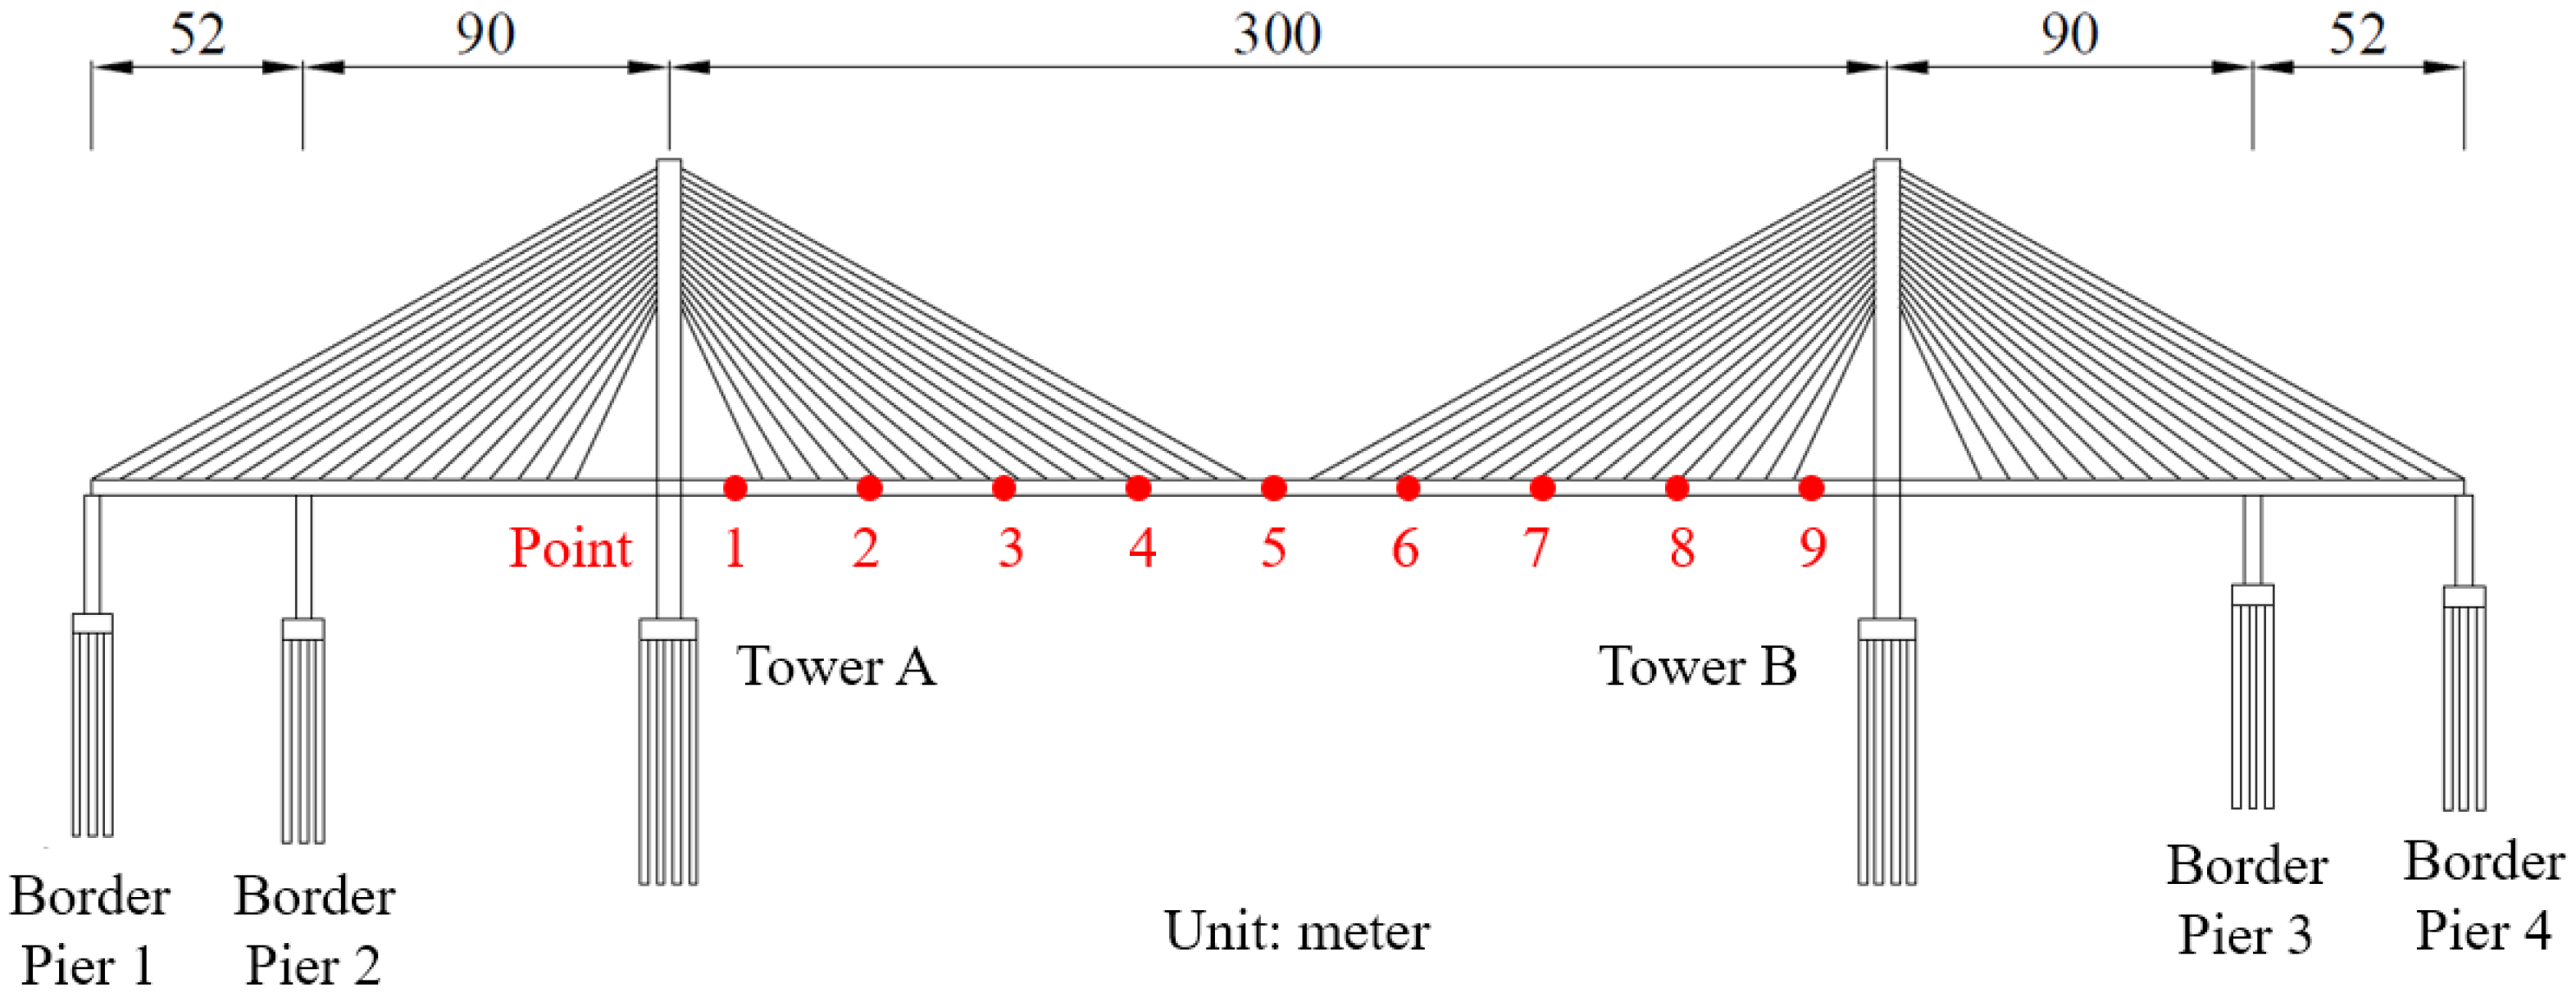
This study draws on a practical cable-stayed bridge project in Wenzhou, China. The structure is a double-tower, double-cable-plane bridge with a full-span layout of (52 + 90 + 300 + 90 + 52) meters. The bridge features four auxiliary side piers (1–4) and two towers (A, B), as illustrated in Figure 4, which depicts the bridge elevation diagram. This paper presents a non-contact monitoring system for the full-field deformation of a dependent real bridge, which is based on displacement recognition means using Digital Image Correlation (DIC). Measurement points 1 through 9 are evenly distributed between Tower A and Tower B. The DIC system was calibrated using a high-precision grid prior to deployment. Under the field monitoring conditions, the displacement measurement accuracy was validated to be within ±0.15 mm, with a spatial resolution of approximately 0.1 mm/pixel for the target field of view. This accuracy was maintained through controlled daily imaging at 14:00 to minimize lighting variations.
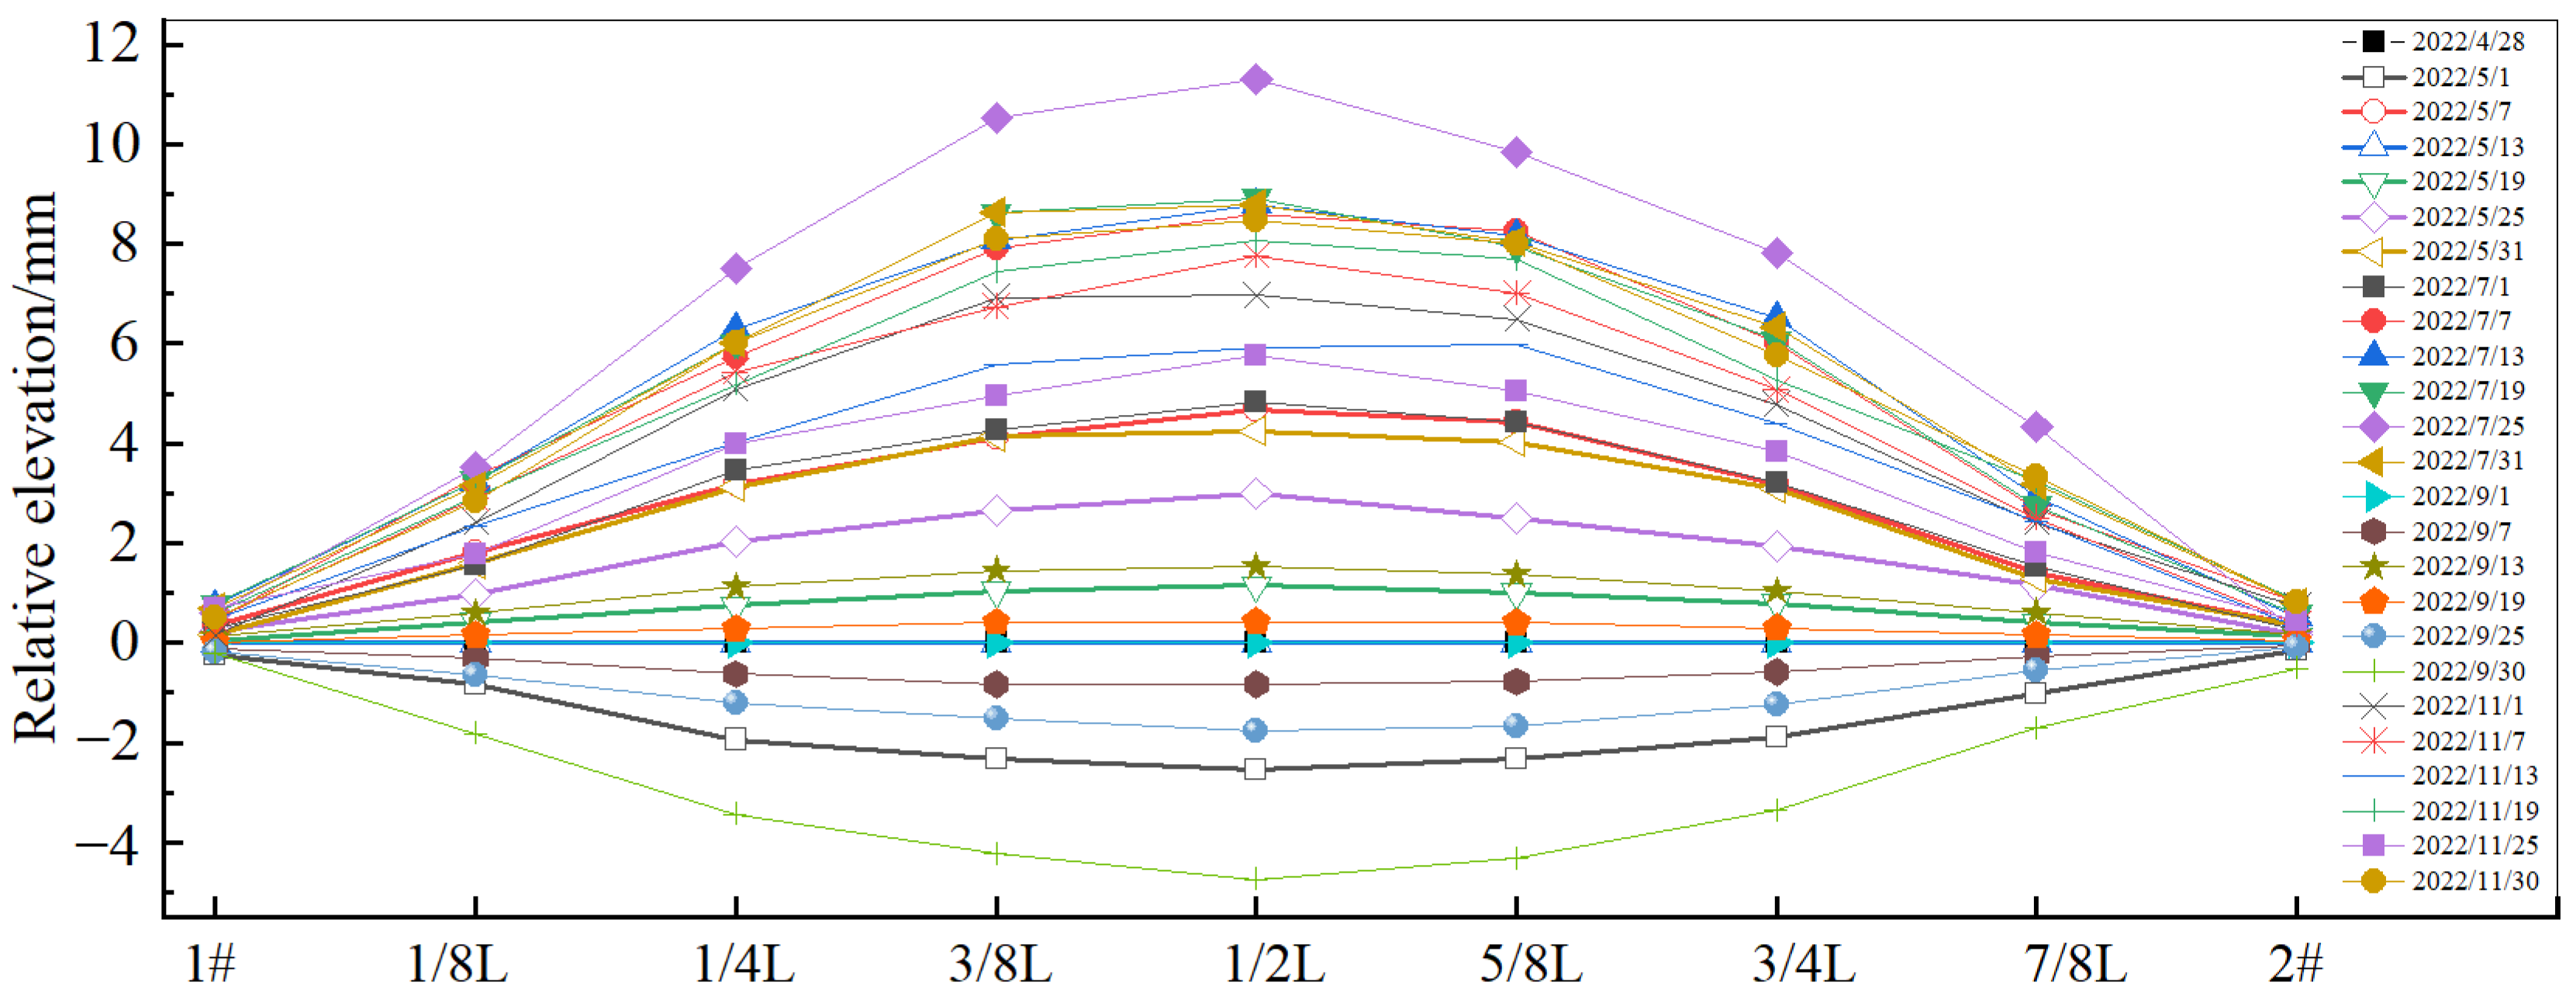
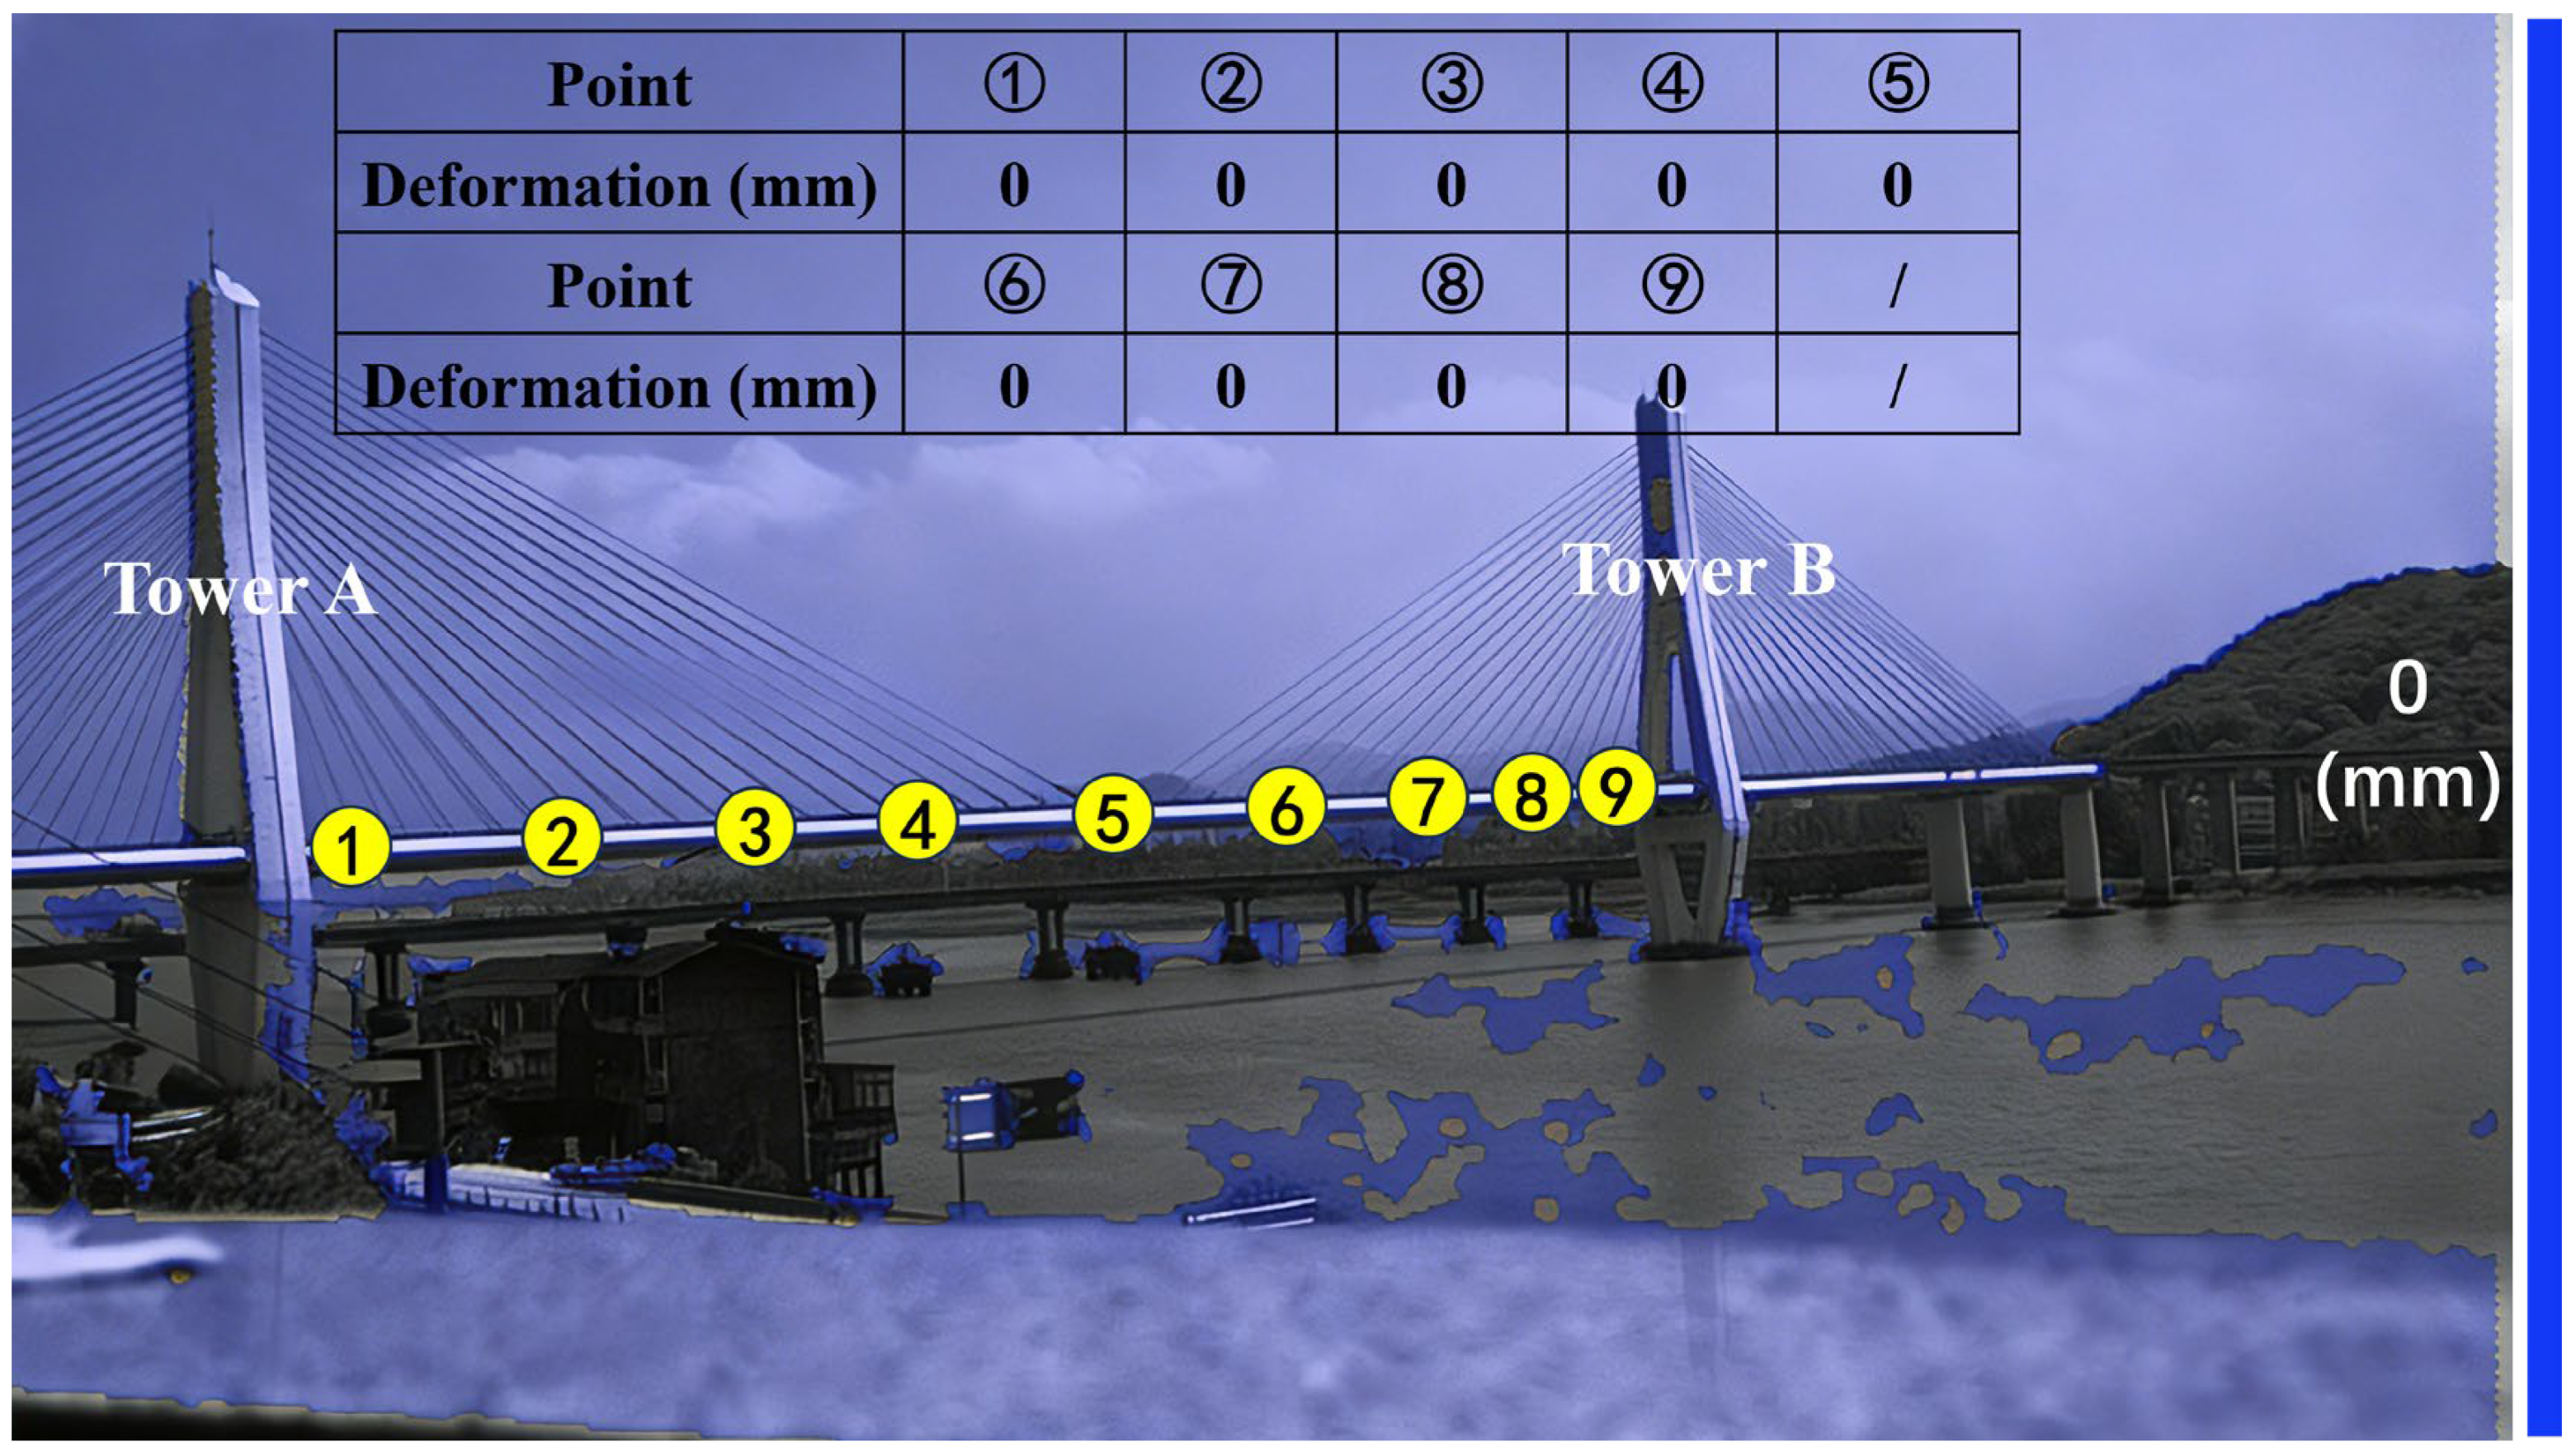
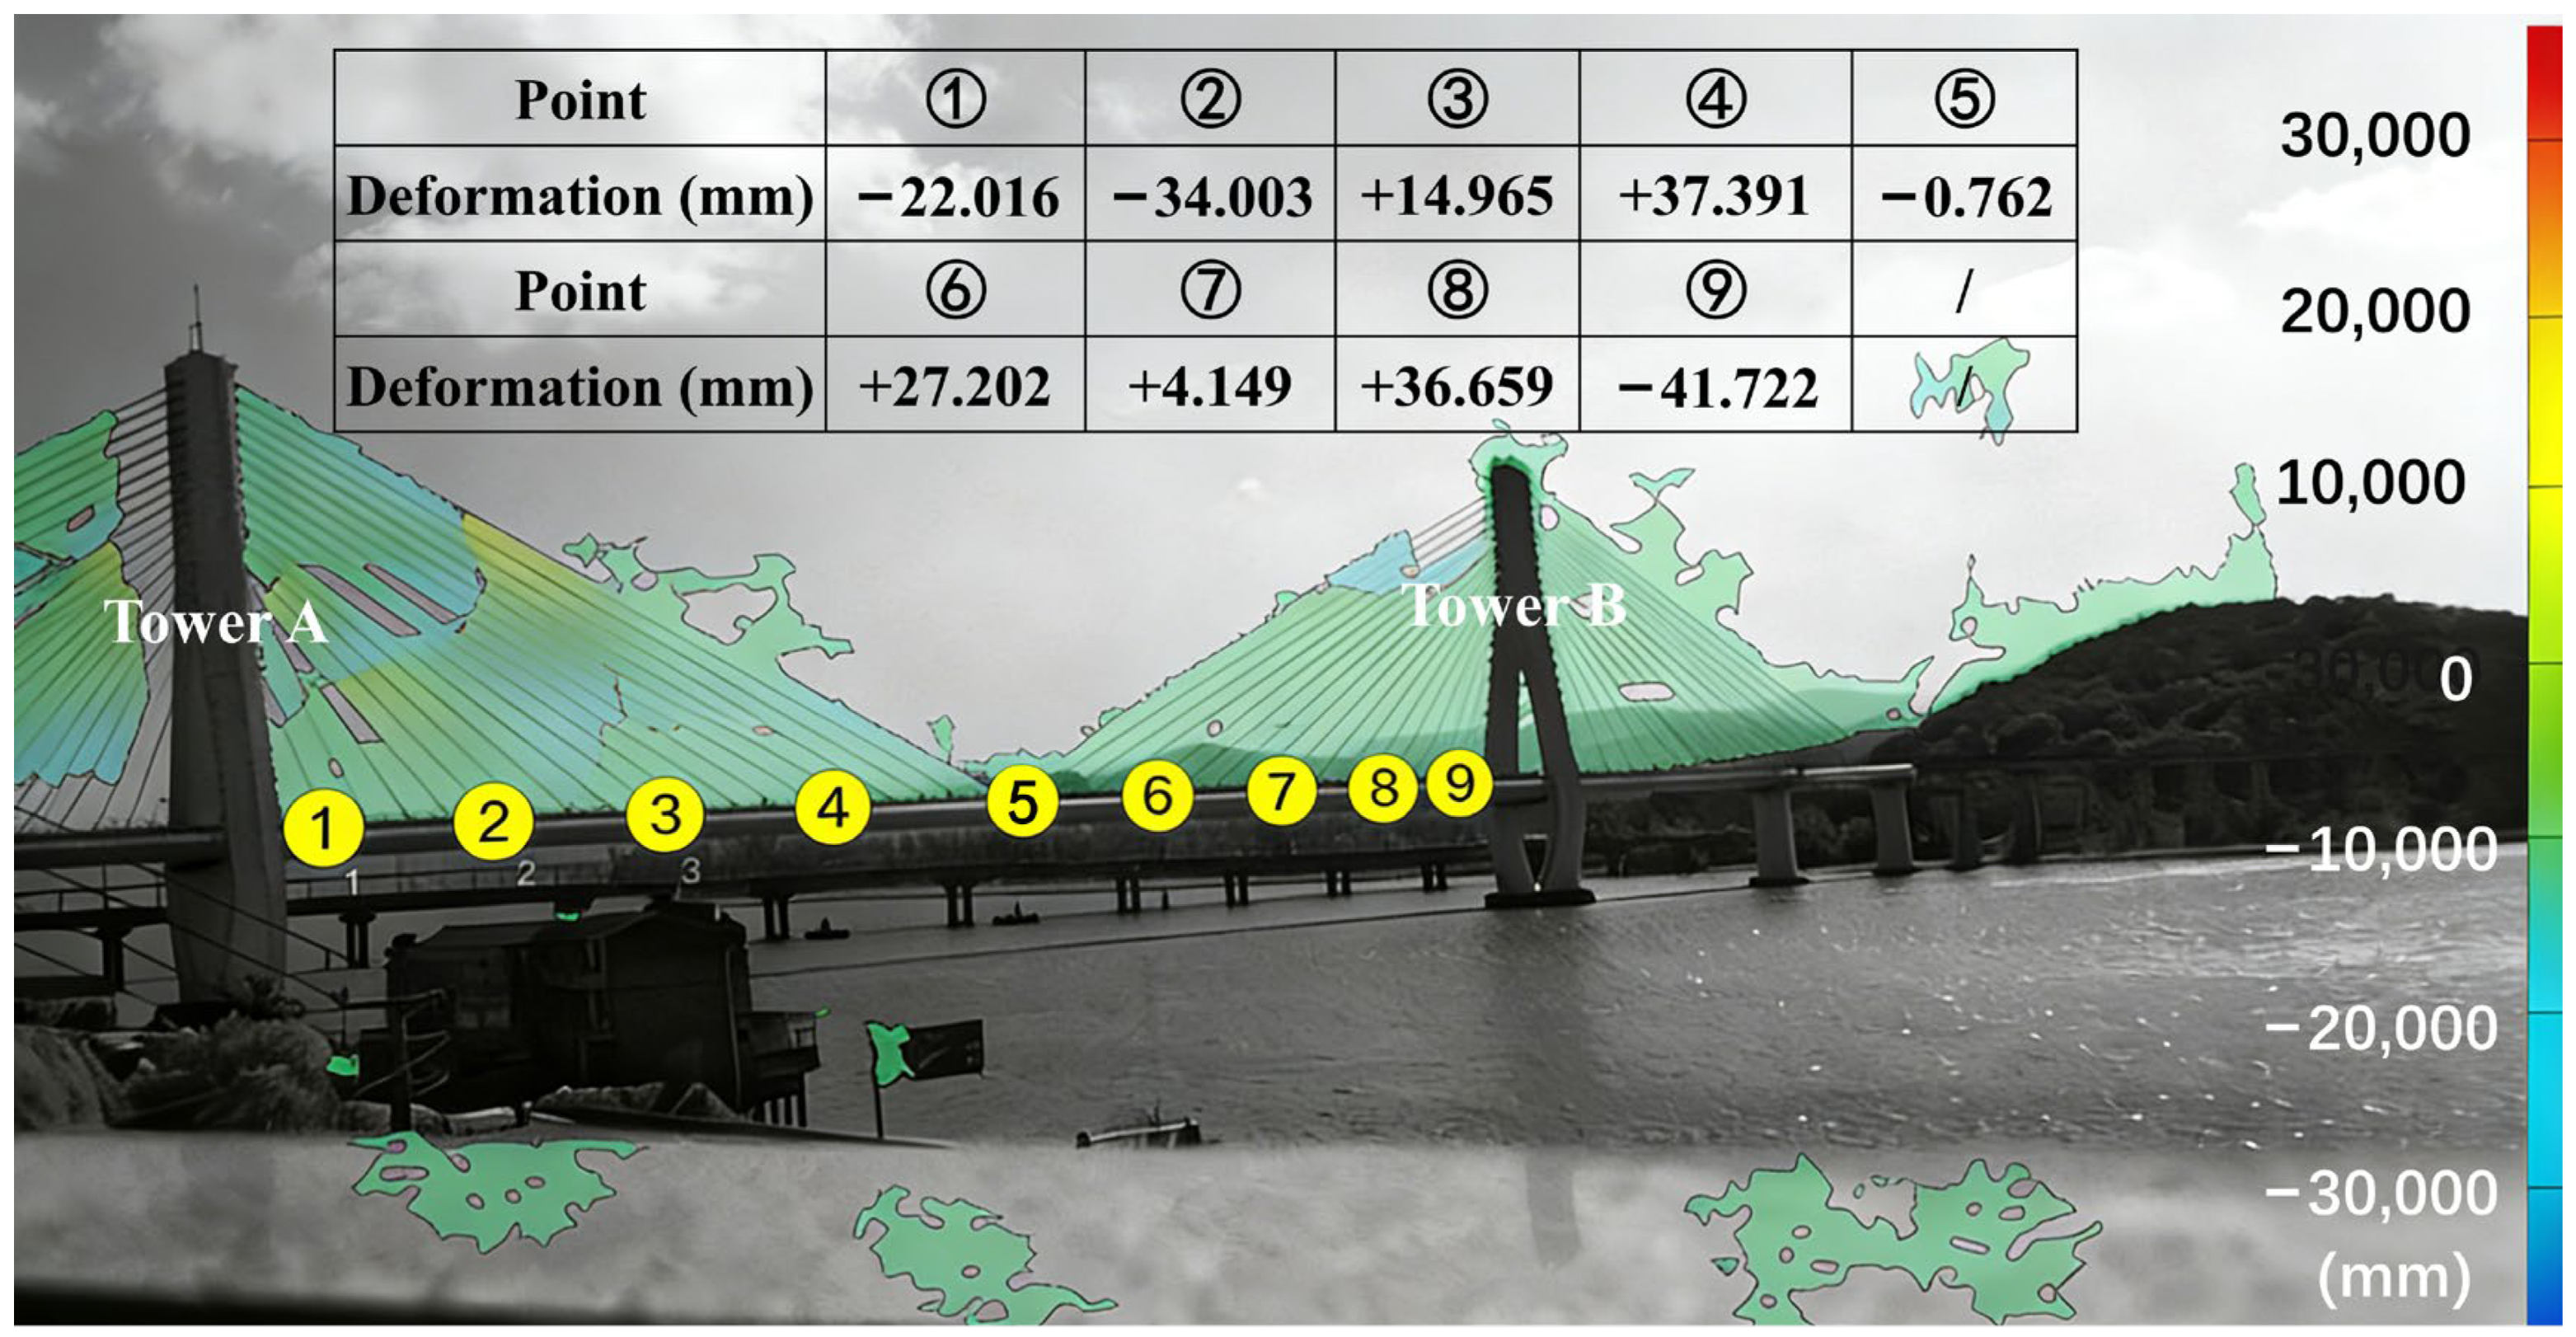
The initial linear shape of the bridge at 14:00 on 28 April 2022 (as illustrated in Figure 5) serves as the benchmark for the image acquisition and subsequent analysis of the deformation in the absence of a train live load at 14:00 on a daily basis throughout the seven-month period of 2022, specifically May, June, July, August, September, and October, and November. Monitoring data were collected until 30 November 2022, with a total duration of 247 days. The average value of the deformation when there is no train passing within a five-minute interval represents the deformation observed during the monitoring period. The result is the cumulative change in the geometric line shape for the specified month. The cumulative deformation is automatically analyzed and calculated by the system based on the baseline image and the post-deformation image, as illustrated in Figure 6.

3.2. Modification of Creep Model Based on the Service Environment

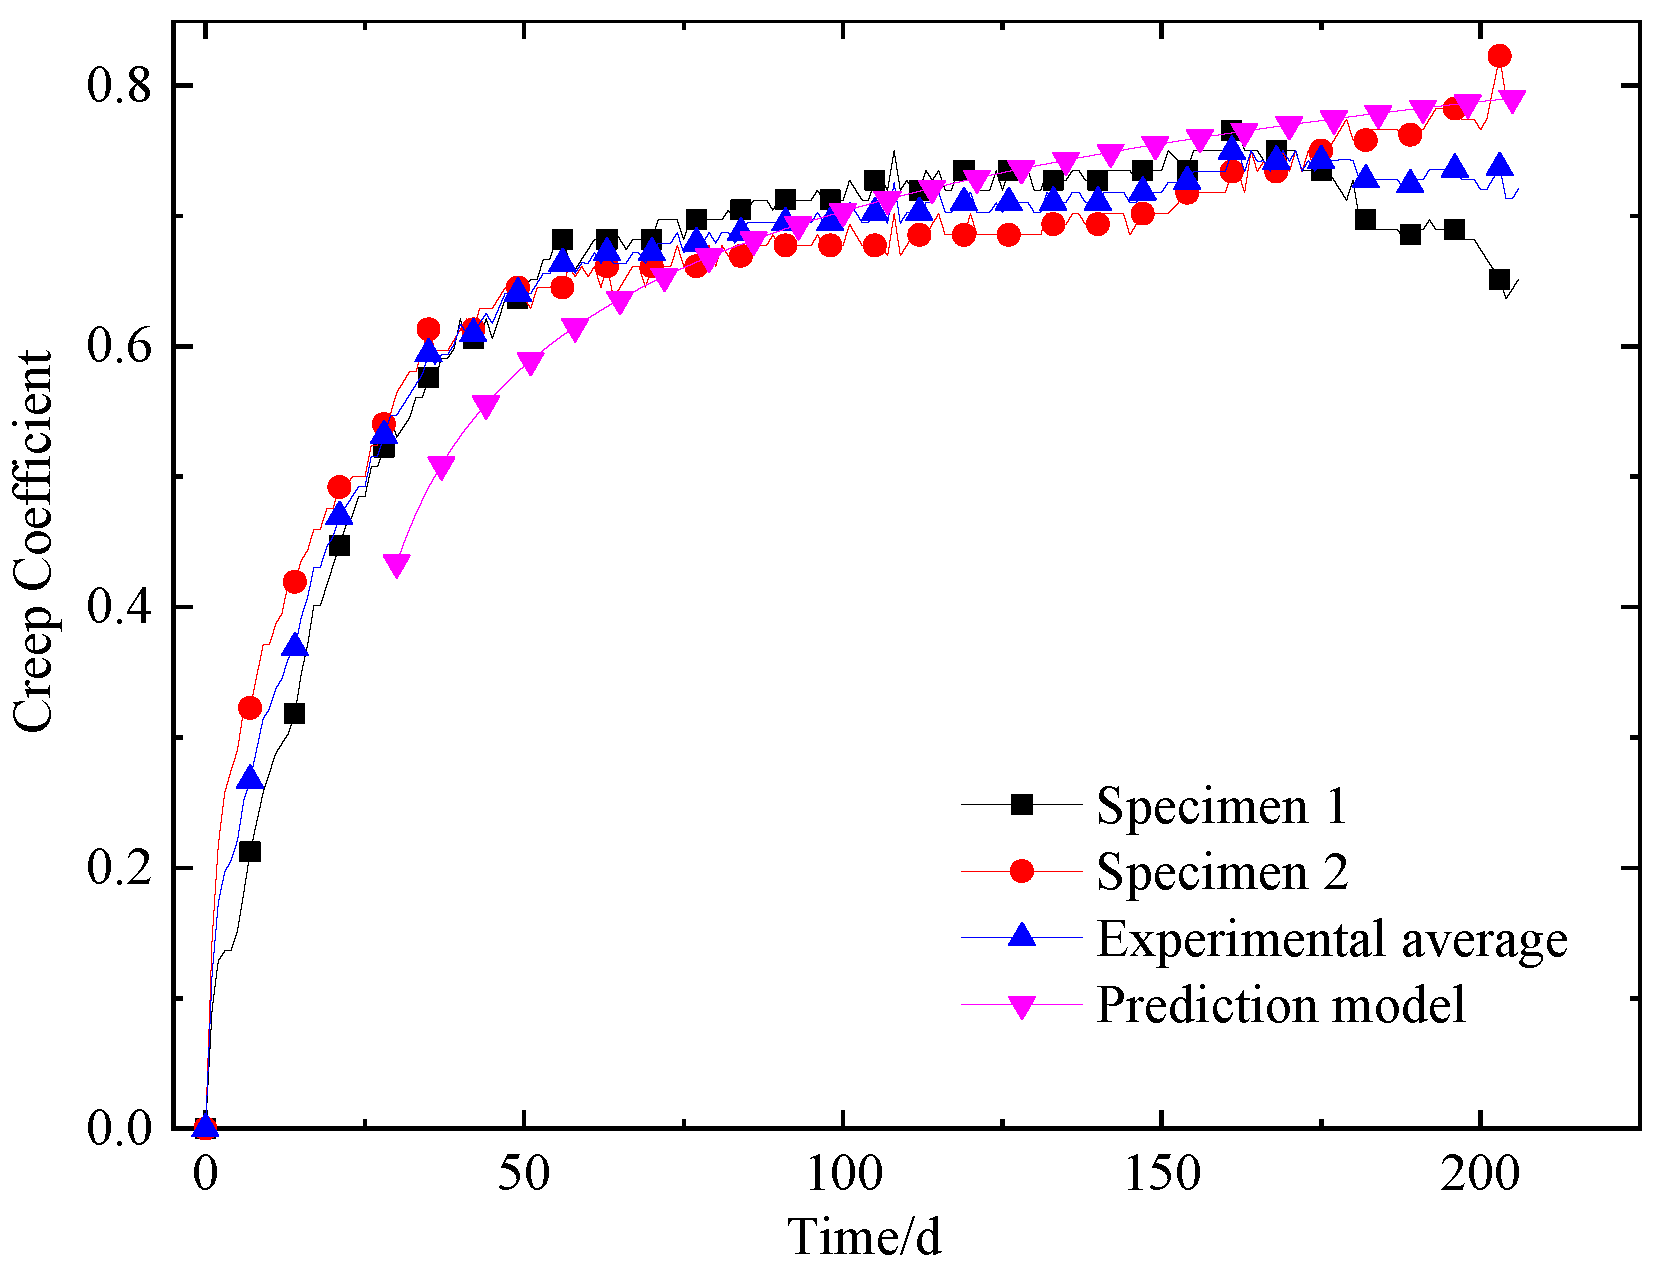
Concrete creep tests utilizing concrete materials of the project were carried out in laboratory environment which have been published by the research group [49]. A variety of concrete creep prediction models were evaluated based on the test results, including the widely utilized specifications JTG D62-04 [50], JTJ023-85 [51], CEB-FIP78 [30], CEB-FIP90 [31], ACI209 [33], and the creep prediction equation proposed by J.J. Brooks [52]. The findings indicated that the Brooks prediction equation exhibited the greatest similarity to the observed outcomes during the testing phase. Accordingly, the Brooks prediction equation was selected as the creep model, and the resulting fitting (Figure 7) yielded the following prediction equation:
φ T t = φ T 28 1.71 l n t 5.31 1 / 3.36
where φ T t   is the predicted creep coefficient at time t. φ T 28 is the measured value of creep coefficient at 28d. t is the load holding time.
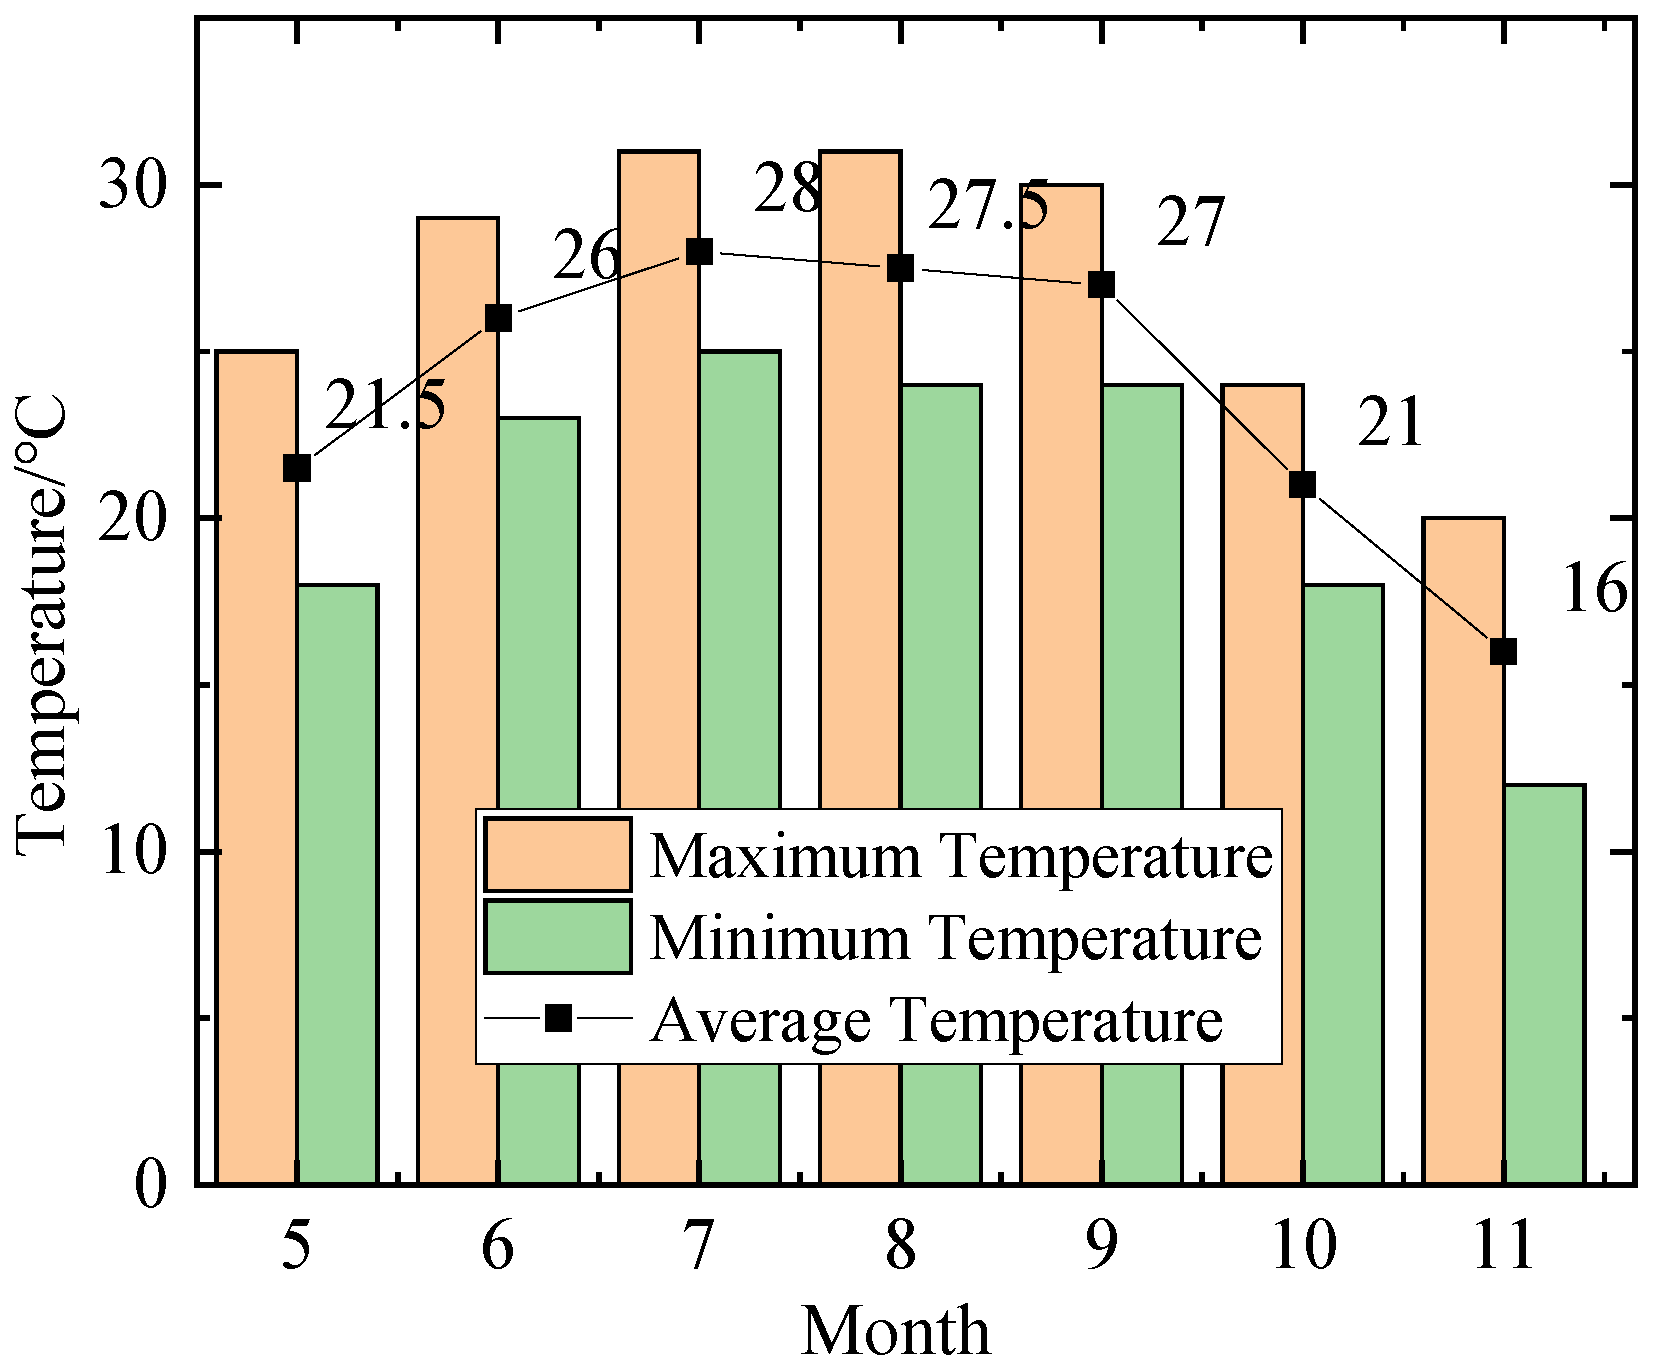
The model is then corrected by temperature, humidity, loading age and component dimension in order to obtain a long-term creep prediction model that is suitable for use in the particular bridge. The estimated loading age of the bridge is 28 days, and the theoretical section thickness of the main girder of the background bridge is 478 mm. Some scholars [53] have calculated that when the theoretical thickness is larger, the humidification conditions have little effect on the concrete creep, which is consistent with the background situation of cable-stayed bridge concrete members. Thus, the annual average relative humidity can be calculated with greater simplicity. According to the Wenzhou Meteorological Database, the mean annual relative humidity of the bridge environment is 79%. The average monthly temperature of the bridge is shown in Figure 8. In accordance with the multi-factor creep correction methodology and the empirical data pertaining to the operational context, the finite element model is established via the Midas Civil 2019 software.

3.3. Comparison Between Measured Results and Theoretical Model

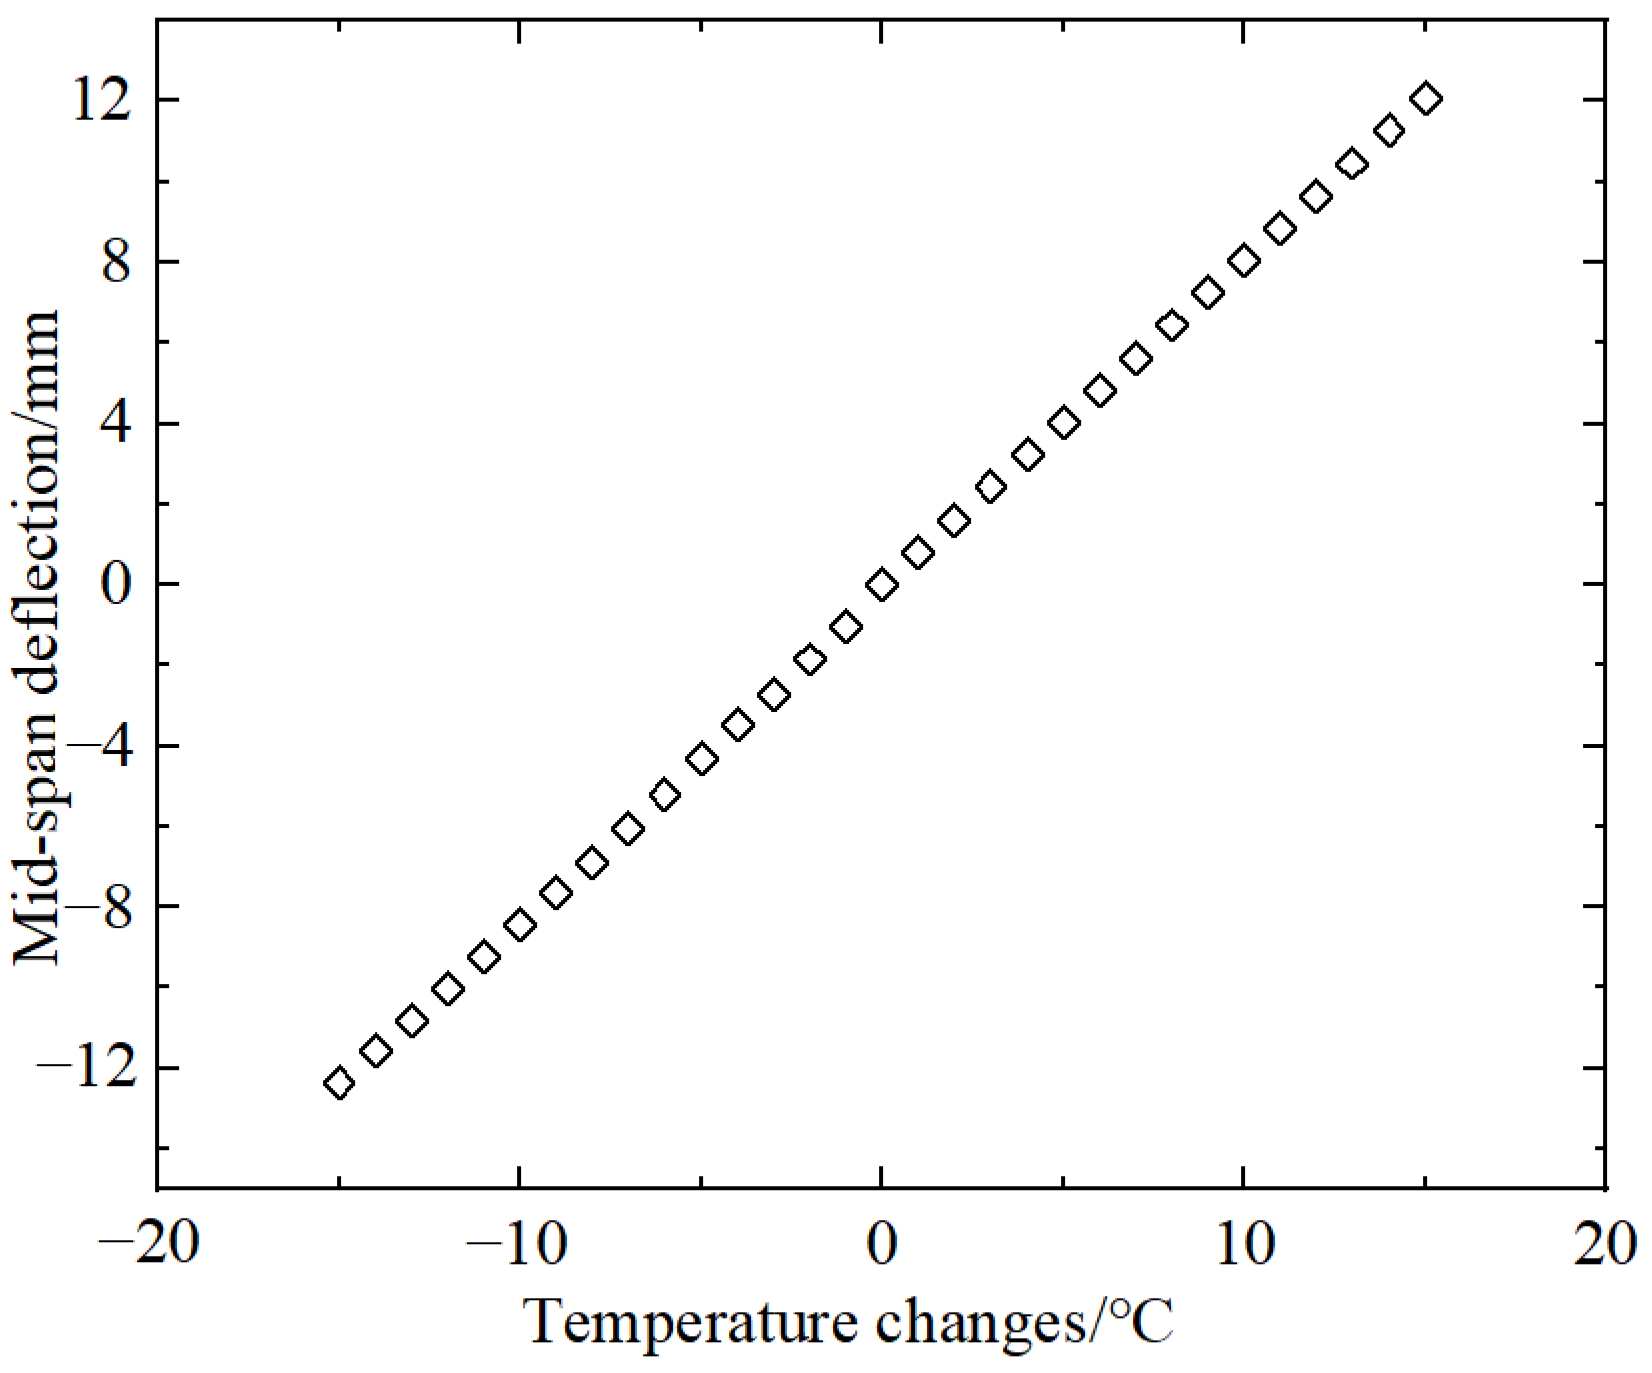
The cumulative deformation of the main girders at nine cross-section locations on the main span of the bridge (see points 1 to 9 in Figure 4) was employed as a control point to ascertain the alterations in the structural geometric lineal elevation in comparison to the original lineal configuration of the bridge at 1400 h on 28 April, as illustrated in Figure 9. From May to November, the cumulative deformation at each point of the bridge main span demonstrated an initial upward trajectory, followed by a subsequent downward trajectory. This occurred concurrently with a change in the overall temperature, which first increased and then decreased, with the highest temperature occurring in July. To eliminate the influence of temperature on the bridge deformation and facilitate the extraction of the continuous deflection development process from the bridge inspection data, the initial temperature collected at 14:00 on 28 April for the background cable-stayed bridge is used as a benchmark to calculate the change in mid-span deflection when the temperature changes in the range of −15~+15 °C. The results are presented in Figure 10. It can be observed that there is a linear and positive correlation between the mid-span deflection exhibited by the background cable-stayed bridge structure model and temperature change. It should be noted that the linear mapping relationship between temperature and deflection is established and validated solely based on the 247-day monitoring data and its corresponding temperature range. Therefore, this linear relationship is only applicable within the time and temperature interval covered by the present monitoring. Its applicability over longer durations or wider temperature ranges requires further verification with additional monitoring data.
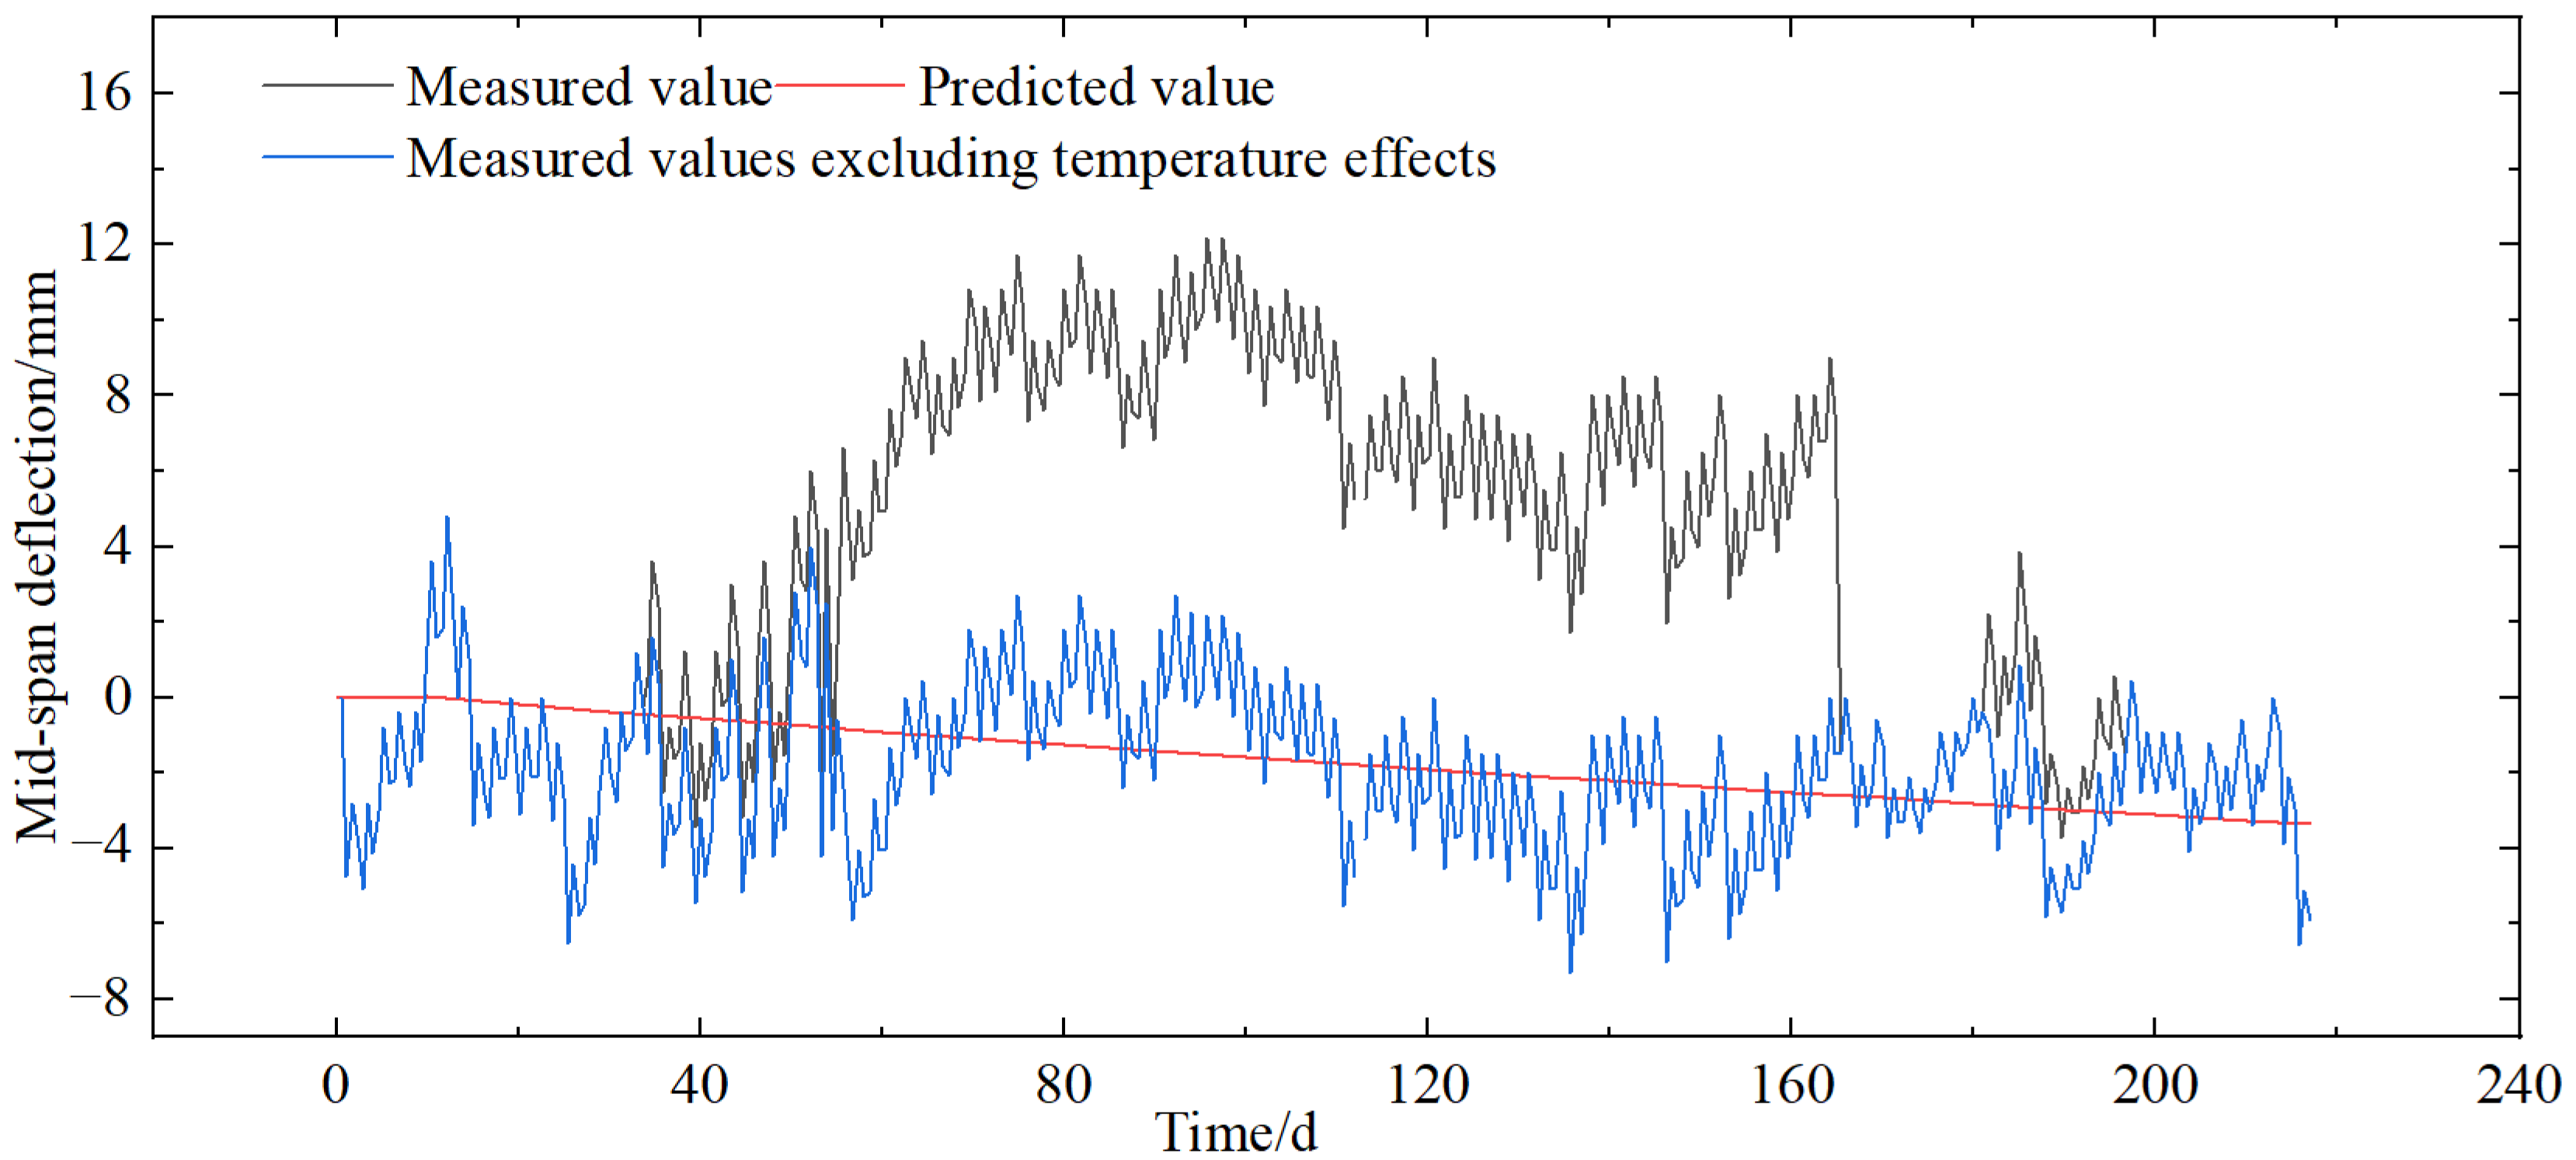
The time-course curve of mid-span deflection during the monitoring period is corrected based on the mapping relationship between mid-span deflection and temperature change, allowing for the elimination of any potential confounding effects of temperature on the observed deflection. This is achieved by making the requisite adjustments to the measured deflection in each month, whereby the former is aligned with the local temperature at the time of the initial collection. Subsequently, the resulting time-course curve of deflection can be obtained. It is difficult to eliminate the fluctuations in deflection observed across different time periods, due to the inherent limitations of the meteorological data available. The mid-span elevation on 28 April was taken as the base point for the deflection development process, and the bridge model prediction results within this interval were extracted and presented in Figure 11. Once the influence of temperature on deflection has been taken into account, it becomes evident that the recorded values display a pattern of fluctuating deflection. Moreover, the measured deflection demonstrates a tendency to fluctuate around the predicted value, indicating that the sustained deflection observed in the mid-span during the monitoring period is closely associated with creep deformation. Over the course of the 247-day monitoring period, the mean value of downward deflection in the bridge mid-span was found to be 2.948 mm with the effect of temperature excluded. The model predicted a value of 3.343 mm, resulting in an error of 11.8%. The root mean square error (RMSE) between the observed data and the predicted values over the entire monitoring period is 2.099 mm (22%). The creep prediction model presented in this paper offers a more precise prediction of the deflection development of the background cable-stayed bridge.

4. Discussion

4.1. Sensitivity Analysis

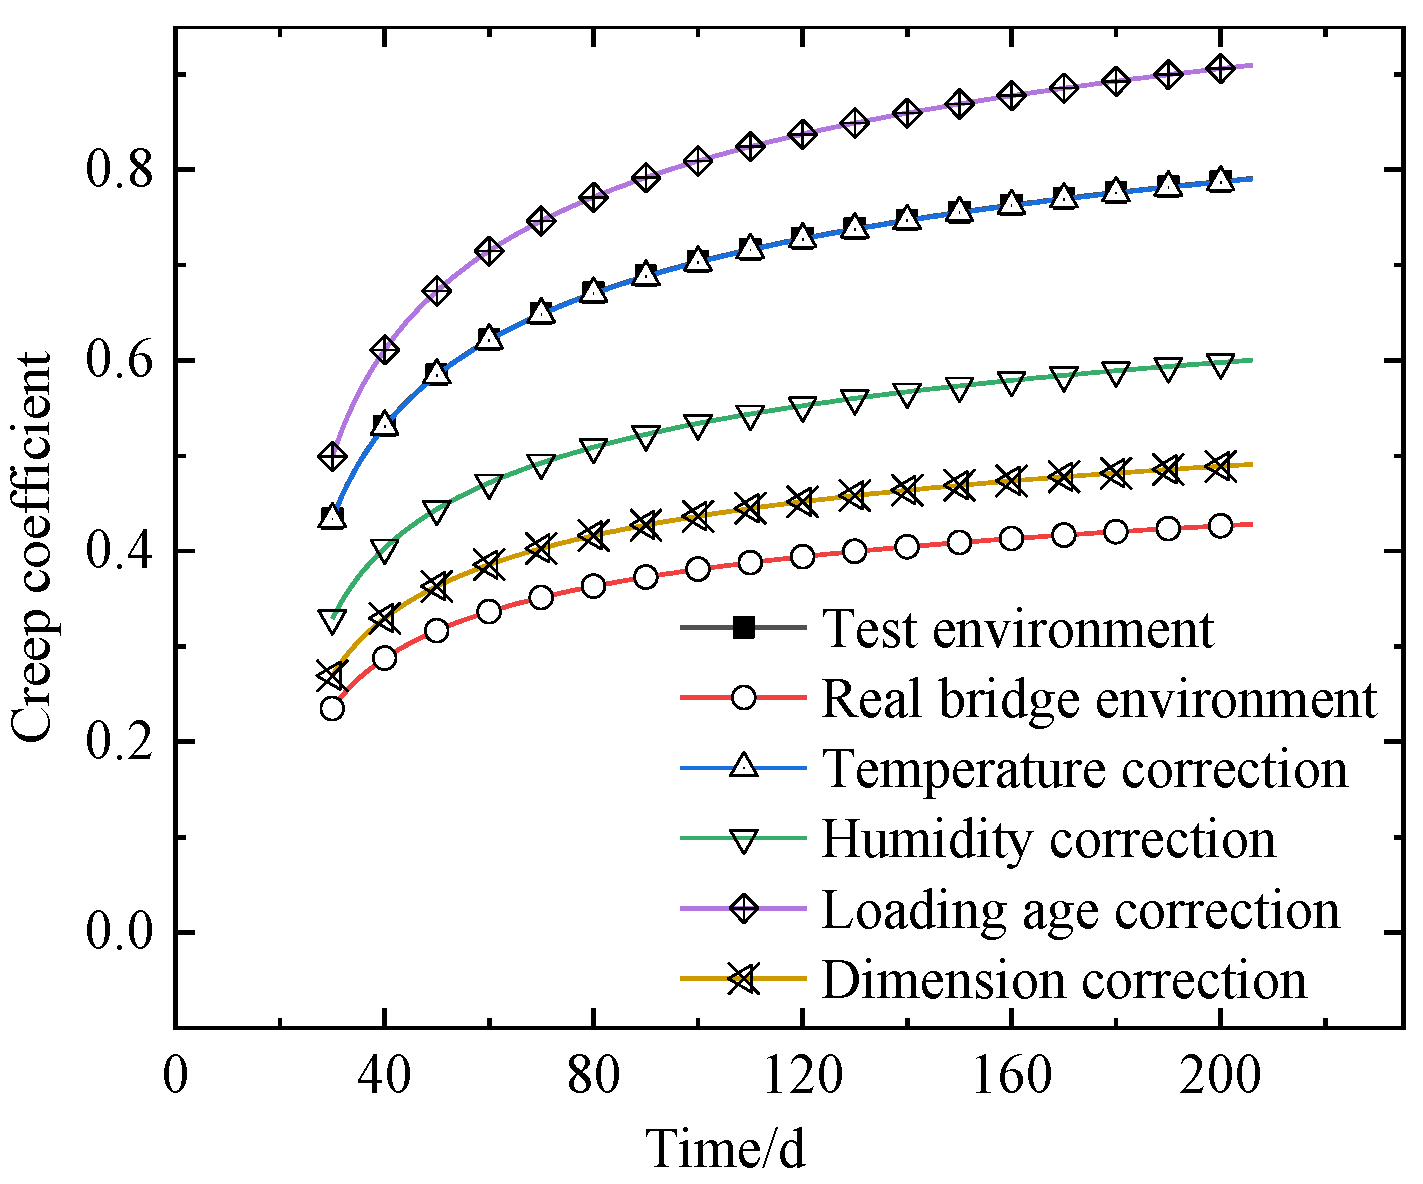
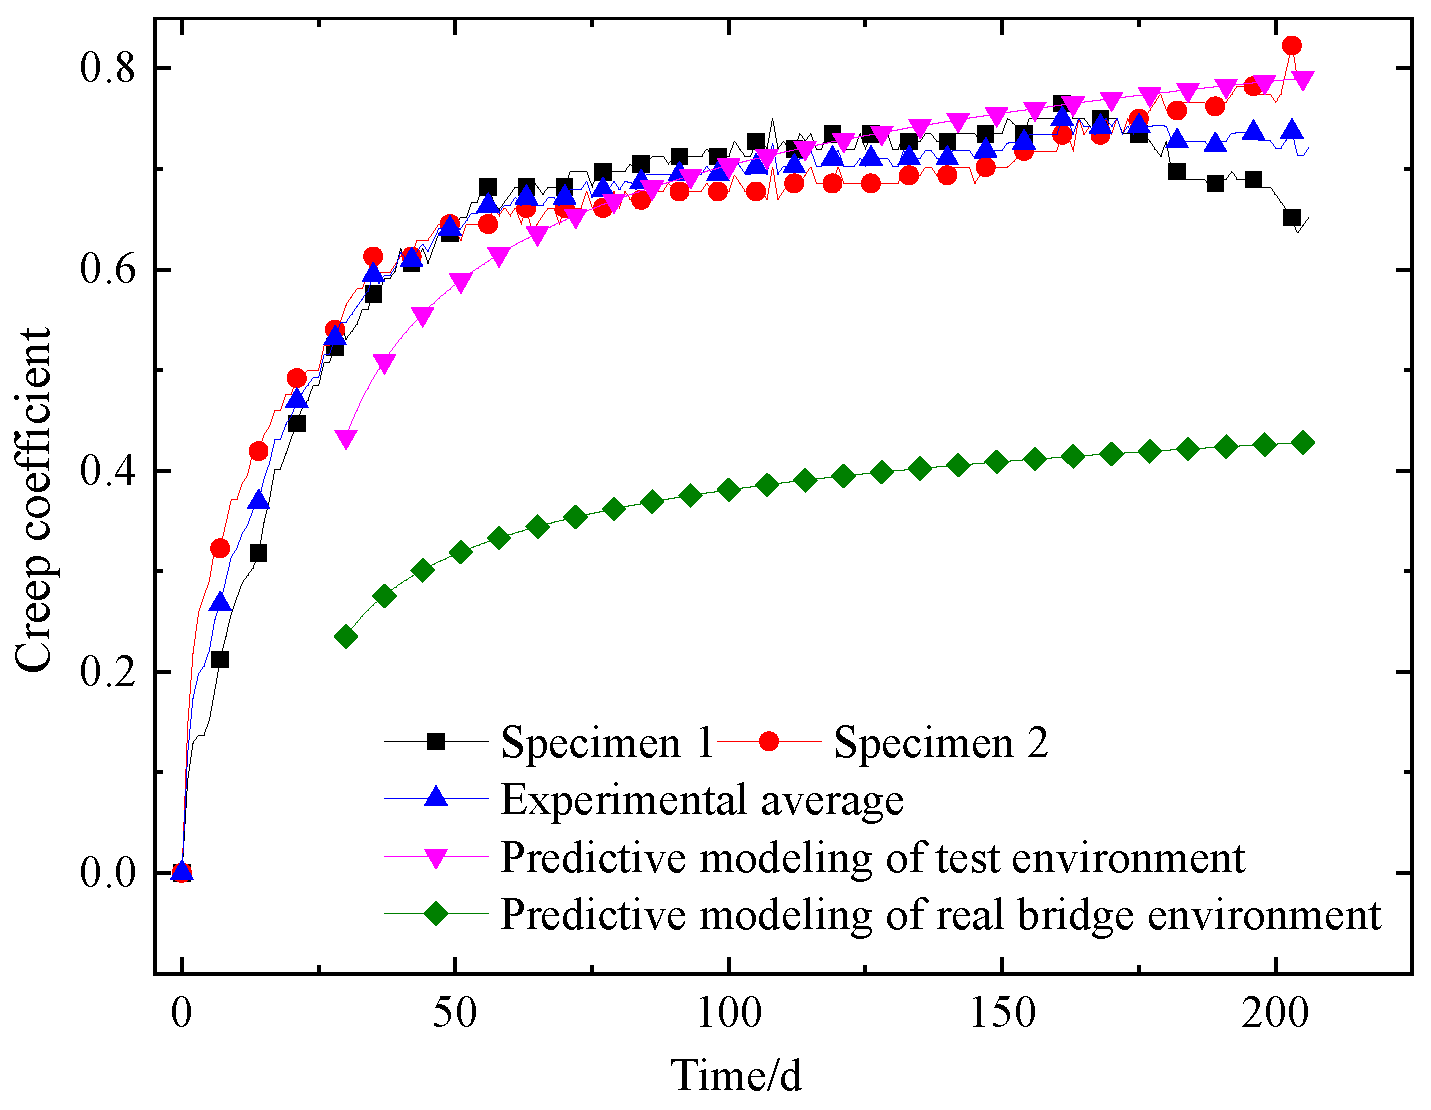
The modified model is employed to forecast the concrete creep in both laboratory and real bridge settings. The resulting creep coefficients are illustrated in Figure 12, which reveals that the modified concrete creep prediction model exhibits a notable reduction in creep in comparison to the pre-modified model. To address this phenomenon, a sensitivity analysis is performed when each factor is corrected individually as shown in Figure 13. From which, it can be seen that the above four factors have a large difference in the degree of influence on the model. (1) The temperature correction curve nearly overlaps with the baseline, indicating a minimal temperature difference between the laboratory and field environments, and thus a negligible effect on creep prediction. (2) The humidity correction curve exhibits a pronounced decline. An increase in humidity results in a more accessible equilibrium between the material and its surrounding environment, which in turn reduces dry creep. (3) Following the correction for loading age, a notable increase in creep is observed. This discrepancy is attributable to the use of cast-in-place beams in the construction of the bridge, which results in a loading age that is smaller than that of the test conditions. Additionally, the strength of the concrete in its early age is not fully developed, and the internal cementitious materials exhibit a lower degree of hardening. This renders the concrete more prone to slip flow under load, which in turn gives rise to a more significant creep effect. Accordingly, rectifying this factor will result in enhanced precision in the forecasting of concrete creep. (4) Following the implementation of corrective measures designed to address dimensional inconsistencies, the projected creep value undergoes a notable reduction. As the dimensions increase, the rate of moisture transfer from the concrete to the external environment also increases. This results in a reduction in the drying creep generated during the drying process, which is comparable to the effect of an increase in humidity. The theoretical cross-sectional thickness of the standard cable-stayed bridge main beam is 478 mm, whereas the theoretical thickness of the specimen is only 75 mm. This discrepancy in dimensions is clearly evident in the figure, which shows that the dimension correction curve exhibits a notable decline in comparison to the original curve and approaches the final correction curve. It may be posited that the dimension correction exerts the most significant influence within the context of a multi-factor correction process.
Figure 13 reveals that the component size correction exerts the most significant influence on the predicted creep within the multi-factor modification process. This predominance can be attributed primarily to the substantial difference between the theoretical thickness of the actual bridge member (478 mm) and that of the laboratory specimen (75 mm), which results in a large scaling factor. Furthermore, the larger dimension reduces the specific surface area, thereby limiting the rate of moisture exchange between the concrete interior and the external environment. This interaction inherently couples the ‘dimension’ with the ‘humidity effect,’ as the efficiency of moisture transport—a key driver of drying creep—is governed by the member’s geometry. Consequently, in cases involving members with large cross-sections, the size effect can become the dominant factor influencing long-term creep predictions. It may be posited that the dimension correction exerts the most significant influence within the context of a multi-factor correction process.

4.2. Comparative Analysis of Creep Models

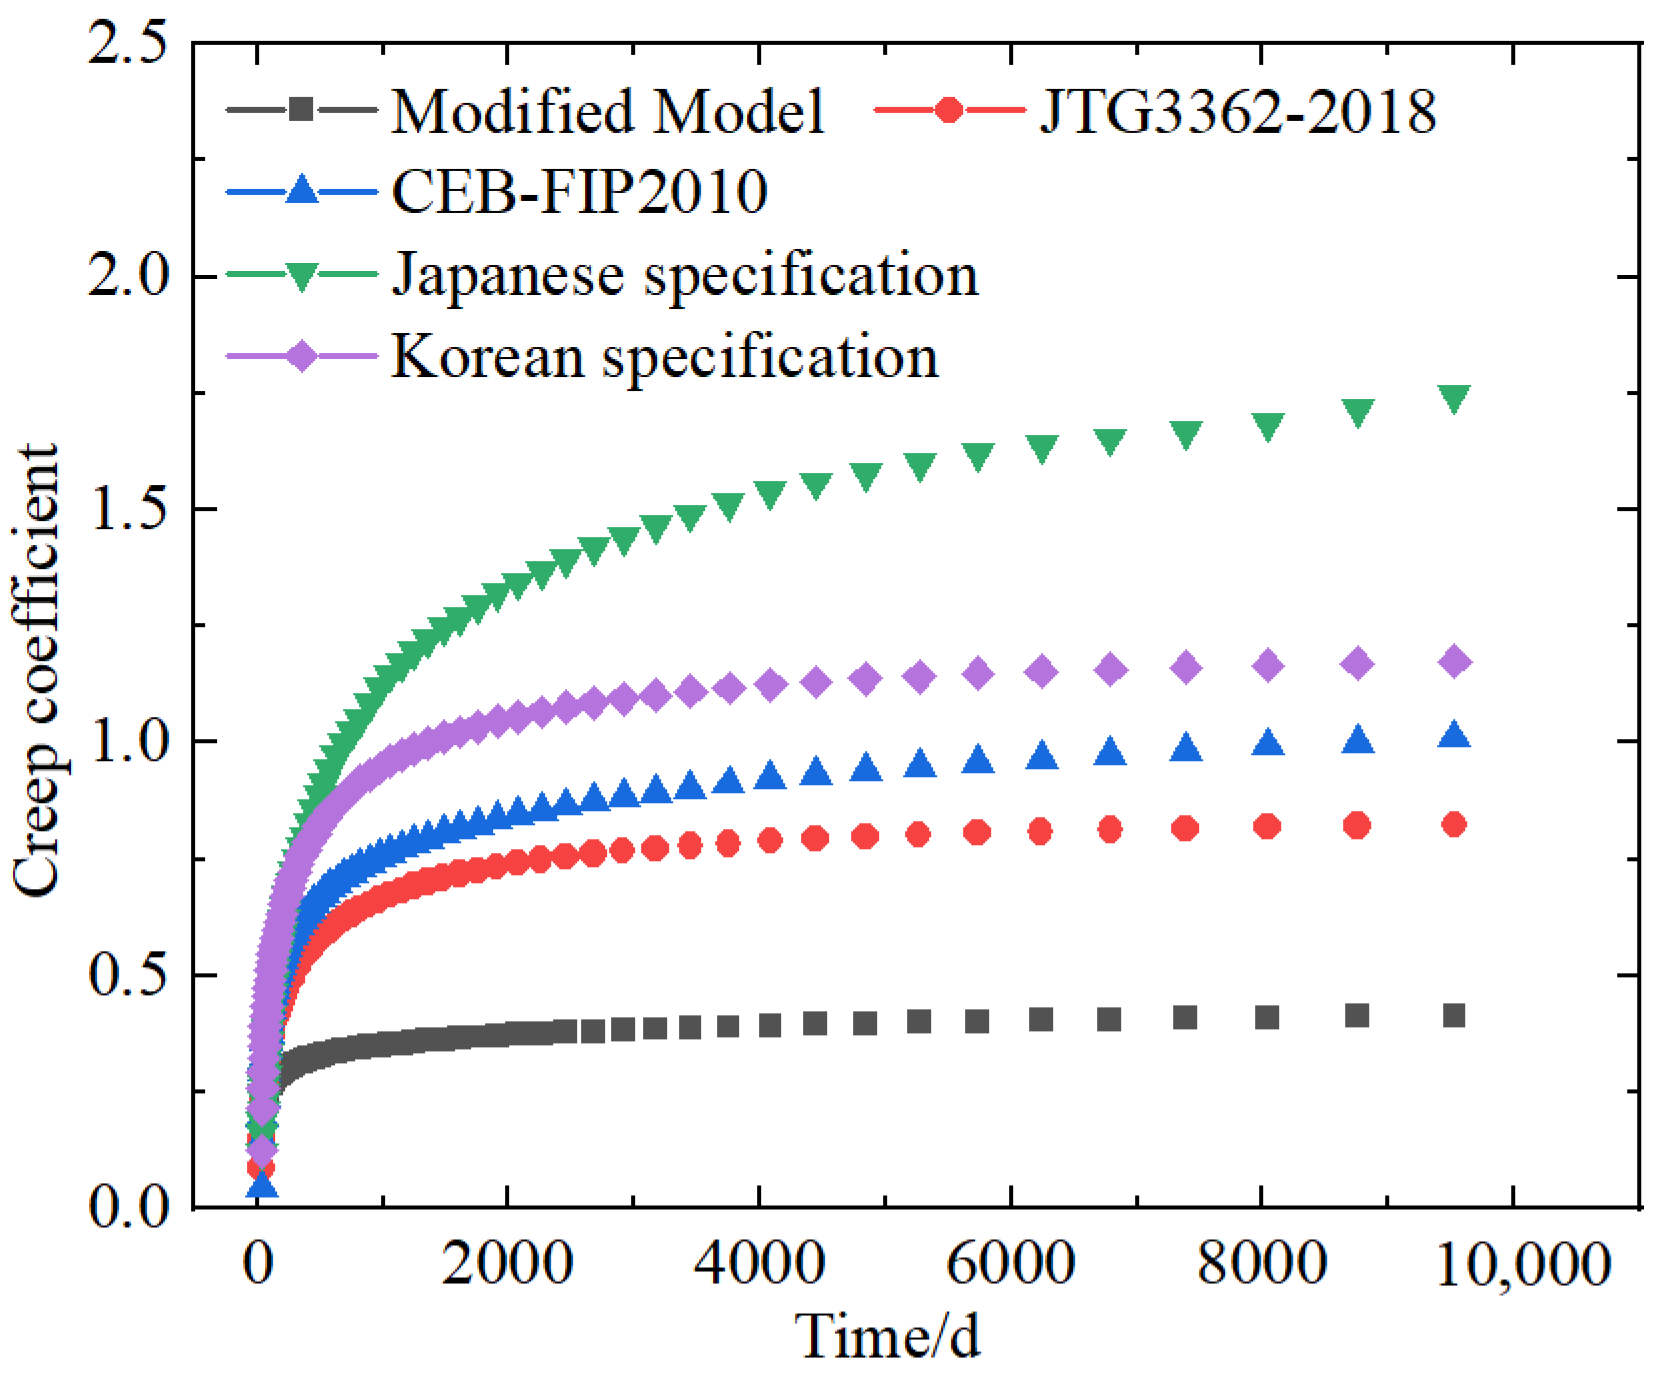
The creep prediction of the standard section of the main beam was conducted using the local annual average temperature of Wenzhou, which is 18.3 °C. The results of the model predictions are presented in Figure 14. Except for the mix proportion, all other input parameters—including concrete strength, loading age, loading duration, member dimensions, average temperature, and average humidity—were kept identical between the conventional concrete creep models and the prediction model proposed in this paper, in order to minimize variables in the comparison. It is evident that the creep predictions for the four specified models are conservative. Among these, the JTG3362-2018 model and the Korean specification exhibit a trend similar to that of the modified model, with only a slight numerical discrepancy. In contrast, the CEB-FIP (MC2010) model and the Japanese specification demonstrate a notable overestimation of the creep development rate in the later stages, particularly the Japanese specification.
These discrepancies highlight the limitations inherent in applying universal standard models to this specific bridge. Standard models typically employ generalized environmental coefficients and material assumptions, which fail to adequately capture the sensitivity of the HPC or the impact of the actual bridge environment. In contrast, the proposed model minimizes these deviations by basing predictions on measured results and explicitly correcting for the specific engineering conditions.
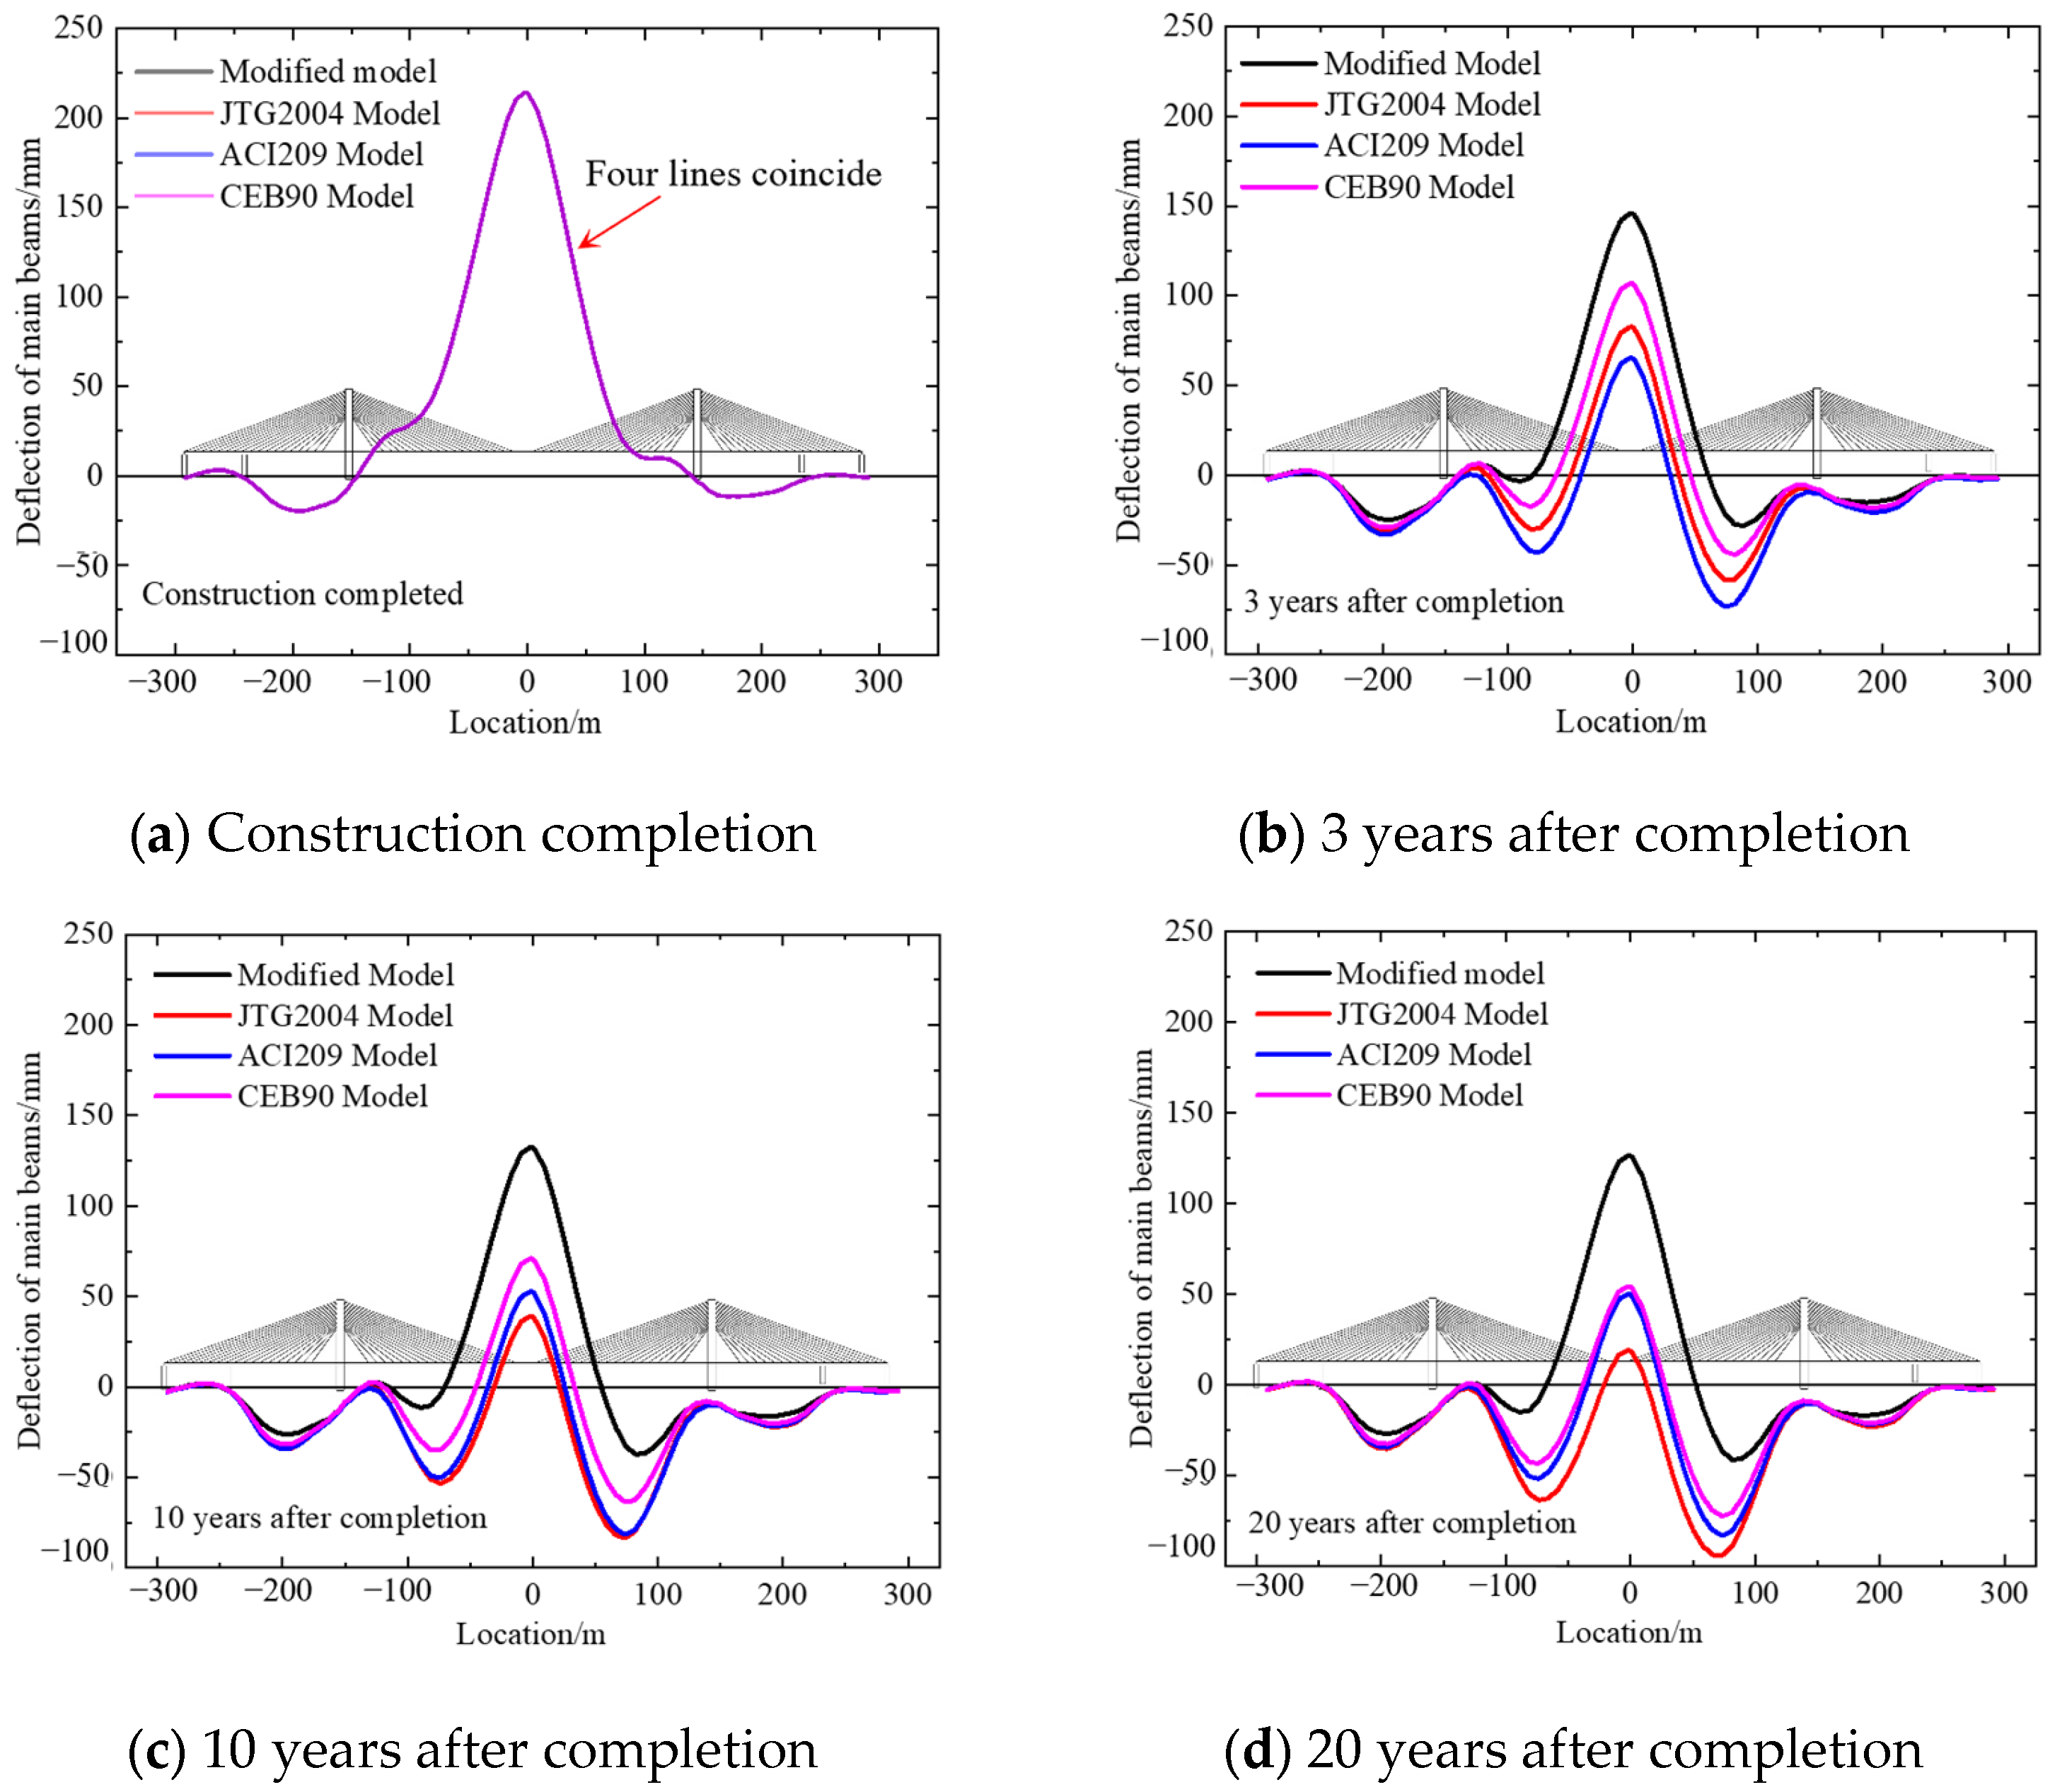
Figure 15 and Table 1 present the quantitative comparison of mid-span deflection predictions at 3, 10, and 20 years. The results indicate that standard specifications consistently overestimate the long-term deformation. Specifically, the JTG2004 model exhibits an increasing deviation over time, predicting values 92.5%, 114.5%, and 122.3% higher than the proposed model at 3, 10, and 20 years, respectively. The ACI209 model shows the largest initial discrepancy with a 117.7% overestimation at 3 years, which slightly decreases to 86.9% at 20 years. Although the CEB90 model predictions are closest to the proposed method, they still remain significantly higher, with overestimations of 56.8%, 75.4%, and 82.2% at the corresponding time nodes. These substantial quantitative differences confirm that the proposed model, by accounting for specific engineering conditions, offers a much more precise prediction for the bridge’s serviceability limit state. The significant reduction in predicted long-term deflection (e.g., 87.89 mm vs. 195.39 mm at 20 years) indicates that the required design camber could be reduced by approximately 55% compared to the most conservative code prediction. This would translate into substantial material savings and allow for optimization of prestressing design.

4.3. Analysis of the Long-Term Applicability of the Prediction Model

The long-term deflection prediction of the bridge under a 20-year loading duration, as presented in the preceding analysis, relies critically on two fundamental conditions: (1) the extrapolation reliability of the Brooks equation (Equation (10)) fitted from short-term laboratory data, and (2) the applicability of the multi-factor correction coefficients over such an extended timeframe. This section analyzes these two prerequisites.
Regarding the extrapolation reliability of the Brooks equation, the literature [46] indicates that its long-term predictive accuracy is acceptable. The reported deviations between predicted and actual creep values are approximately 5%, 10%, and 20% for 5-year, 10-year, and 30-year predictions, respectively, when the equation is calibrated using 28-day creep data. This demonstrates the reasonable reliability of the Brooks equation for long-term creep extrapolation.
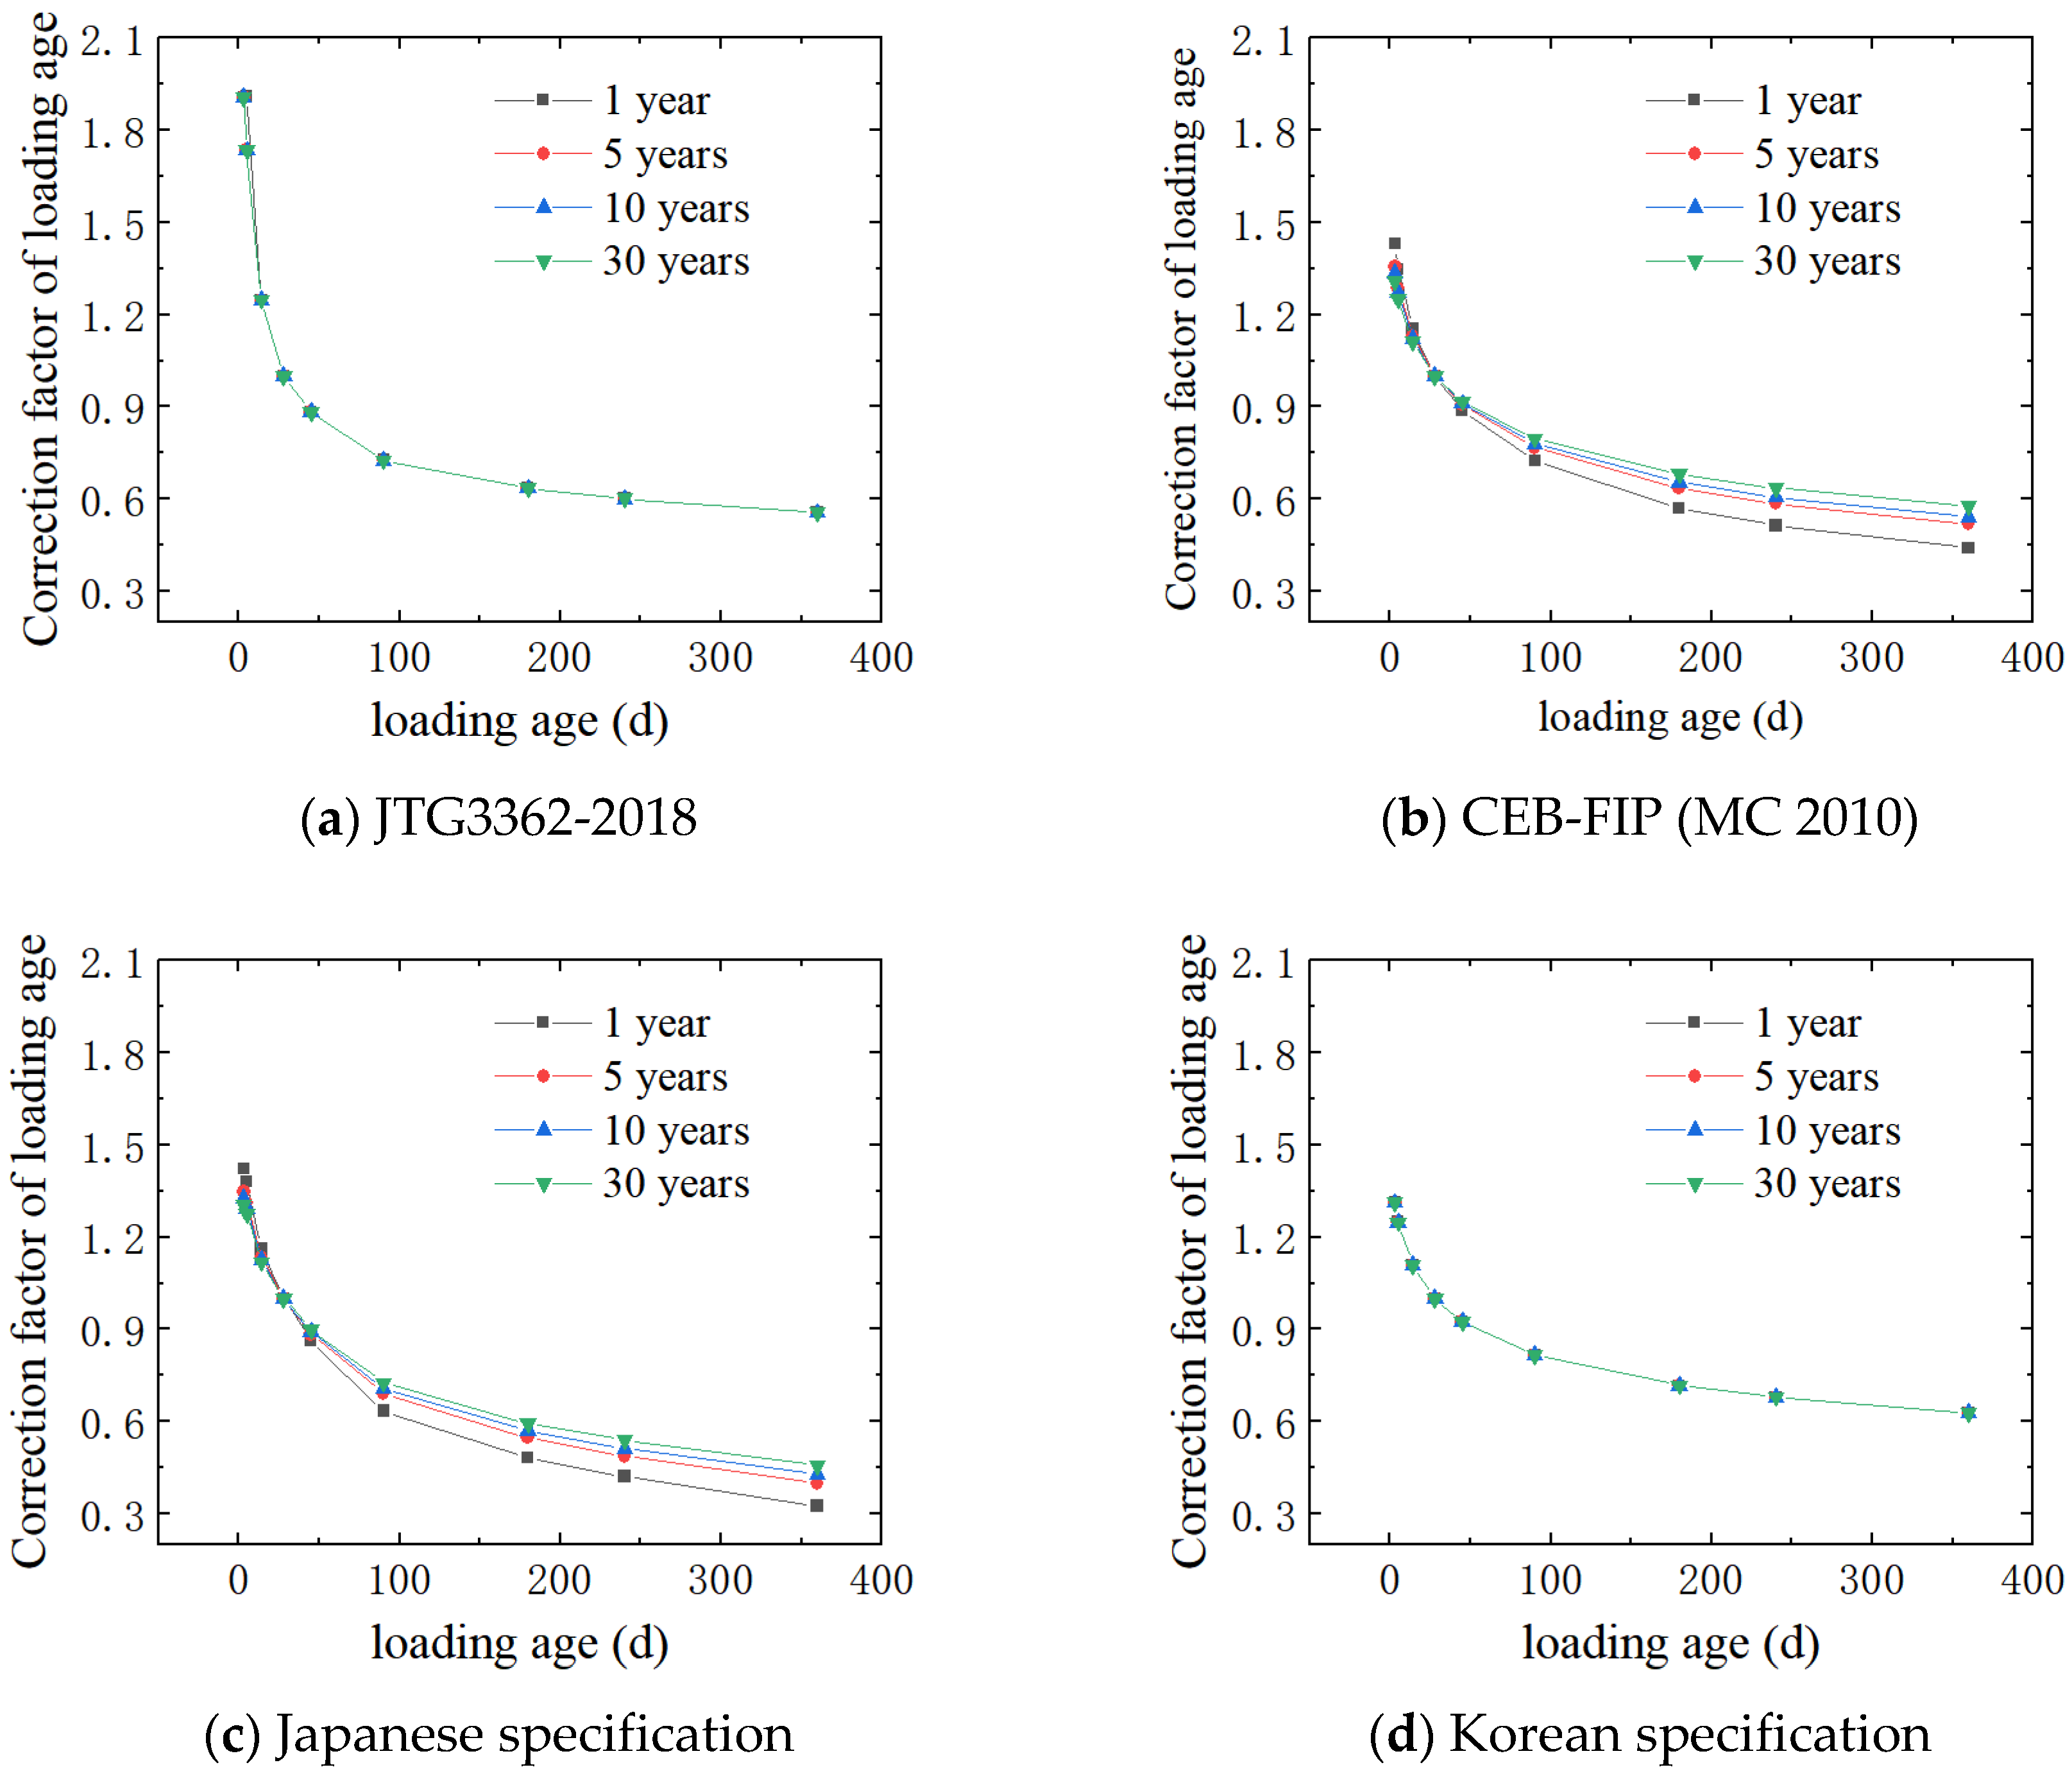
Concerning the long-term applicability of the correction coefficients, the applicability of temperature, humidity, and dimension correction coefficients for long-term predictions is supported by references [37]. The applicability of the loading age correction coefficient is discussed in [48]. Taking the loading age factor as a specific example, the calculated correction coefficients based on creep values for 1-year, 5-year, 10-year, and 30-year loading durations show minimal variation, as illustrated in Figure 16.
The influence coefficient curves for the four specifications under different loading durations are nearly coincident. Therefore, it is reasonable to use the coefficient derived from the 30-year loading duration to represent the effect for a 20-year prediction. A similar conclusion holds for the dimension correction coefficient. This consistency supports the use of these correction factors for the 20-year prediction in this study.
While the analysis above supports the model’s framework for long-term prediction, it is important to acknowledge the inherent uncertainties associated with extrapolation. The primary risks include potential changes in concrete material properties over decades, unaccounted environmental variations beyond the monitored range, and the simplified assumption of time-invariant correction mechanisms. These factors could introduce deviations in very long-term forecasts. Therefore, the 20-year predictions presented should be interpreted as well-informed estimates based on current data and established methodologies, with their accuracy to be further validated by future long-term monitoring data.

4.4. Possibilities for Machine Learning (ML) in Future Research

Recent studies [54] indicate that machine learning models are well-suited for predicting complex multi-factor behaviors in cement-based systems. Given the shared mechanistic origins of shrinkage and creep involving non-linear interactions, ML approaches demonstrate significant potential for creep prediction, although they typically demand extensive datasets for training. In future research, upon the accumulation of sufficient long-term monitoring data, we intend to integrate these methods to capture complex non-linear interactions, thereby enhancing the model’s robustness and universality.

5. Conclusions

This paper presents the establishment of a multi-factor modified creep model for HPC applicable to the practical service environment. The model is examined using the monitoring data from a bridge structure.
(1)
A long-term creep prediction method for high-performance concrete is proposed, based on short-term laboratory tests and incorporating corrections for temperature, humidity, loading age, and component dimensions. And the sensitivity analysis indicating that the dimension has the greatest impact, followed by the loading age and humidity.
(2)
The prediction results demonstrate a high degree of correlation with the monitoring data of mid-span deflection. Over a monitoring period of 247 days, the mean mid-span deflection is found to be 2.948 mm and the predicted value is 3.343 mm, giving an error of 11.8%. In comparison to the existing specifications, the deflection calculated by the proposed model presented in this paper is considerably smaller. The closest to the model proposed in this paper is the CEB90 model, but it is still 56.8%, 75.4% and 82.2% higher in the mid-span deflection at 3, 10 and 20 years after completion.
(3)
This paper presents a simplified approach to predicting the creep deflection of large-span bridges, taking into account the influence of temperature and humidity. However, further improvements are needed to account for the interval effect of temperature and humidity correction. Additionally, there is a limited availability of long-term data for comparison. Further research is required to investigate the long-term service performance of the bridge.

Author Contributions

Conceptualization, Y.Z. and J.Z.; methodology, J.M.; software, R.F.; validation, H.G.; formal analysis, Y.Z.; investigation, H.G.; writing—original draft preparation, R.F.; writing—review and editing, W.J.; visualization, H.G. and J.Z.; project administration, J.M.; funding acquisition, J.Z. and W.J. All authors have read and agreed to the published version of the manuscript.

Funding

This research was funded by Zhejiang Province Leading Geese Plan (grant number 2023C03183), the Natural Science Foundation of Zhejiang Province (Grant Nos. LY23E080005, LY24E080012), the Natural Science Foundation of Ningbo (Grant No. 2023J041), Ningbo Key R&D Program (2023Z221, 2024Z287) and Ningbo Public Welfare Research Program (2023S004).

Data Availability Statement

Data are contained within the article.

Conflicts of Interest

The authors declare no conflicts of interest.

References

  1. Aydin, A.C.; Arslan, A.; Gül, R. Mesoscale simulation of cement based materials’ time-dependent behavior. Comput. Mater. Sci. 2007, 41, 20–26. [Google Scholar] [CrossRef] [Scilit]
  2. Guo, F.; Qin, H.G.; Cao, P.F.; Liu, G.G.; Zhang, Y.S. Analysis on creep property and model of bridge girder concrete with various mix proportions. Frontiers of Green Building. Mater. Civ. Eng. 2013, 368–370, 1487. [Google Scholar] [CrossRef] [Scilit]
  3. He, Z.; Qian, C.; Li, L.; Du, S. Creep analysis of concrete with different mineral admixtures. Mater. Express 2016, 6, 328–336. [Google Scholar] [CrossRef] [Scilit]
  4. Yazdizadeh, Z.; Marzouk, H.; Hadianfard, M.A. Monitoring of concrete shrinkage and creep using Fiber Bragg Grating sensors. Constr. Build. Mater. 2017, 137, 505–512. [Google Scholar] [CrossRef] [Scilit]
  5. Wang, Y.; Zhao, R.; Jia, Y.; Liao, P. Creep Characteristics of Concrete Used in Long-Span Arch Bridge. Balt. J. Road Bridge Eng. 2019, 14, 18–36. [Google Scholar] [CrossRef] [Scilit]
  6. Luo, H.; Xu, C.; Gan, X.; Liu, M.; Guo, X.; Guo, H. The Train-Bridge Coupled Vibration Analysis of a Long-Span Prestressed Concrete Continuous Beam Bridge under Creep Deformation Effect. Appl. Sci. 2022, 12, 11838. [Google Scholar] [CrossRef] [Scilit]
  7. He, M.; Zheng, Y.; Zhao, Q. Research on controlling long-term performance by tensioning post tendon of long-span continuous rigid-frame bridges. Glob. Geol. 2013, 16, 213–216. [Google Scholar]
  8. Bažant, Z.P.; Yu, Q.; Li, G.H. Excessive long-time deflections of prestressed box girders. I: Record-span bridge in Palau and other paradigms. J. Struct. Eng. 2012, 138, 676–686. [Google Scholar] [CrossRef] [Scilit]
  9. Manzanarez, R.; Olmer, M. Parrotts Ferry Bridge Retrofit; T.Y. Lin International: San Francisco, CA, USA, 1994. [Google Scholar]
  10. Zhou, J.; Sun, Z.; Wei, B.; Zhang, L.; Zeng, P. Deflection-based multilevel structural condition assessment of long-span prestressed concrete girder bridges using a connected pipe system. Measurement 2021, 169, 108352. [Google Scholar] [CrossRef] [Scilit]
  11. Shi, C.; Jiao, D.; Zhang, J.; Wang, D.; Zhang, Y.; Farzadnia, N.; Hu, X. Design of high performance concrete with multiple performance requirements for #2 Dongting Lake Bridge. Constr. Build. Mater. 2018, 165, 825–832. [Google Scholar] [CrossRef] [Scilit]
  12. Sun, Y.; Wang, Z.; Gao, Q.; Liu, C. A new mixture design methodology based on the packing density theory for high performance concrete in bridge engineering. Constr. Build. Mater. 2018, 182, 80–93. [Google Scholar] [CrossRef] [Scilit]
  13. Kai, M.F.; Zhang, L.W.; Liew, K.M. New insights into creep characteristics of calcium silicate hydrates at molecular level. Cem. Concr. Res. 2021, 142, 106366. [Google Scholar] [CrossRef] [Scilit]
  14. Saliba, J.; Grondin, F.; Matallah, M.; Loukili, A.; Boussa, H. Relevance of a mesoscopic modeling for the coupling between creep and damage in concrete. Mech. Time-Depend. Mater. 2013, 17, 481–499. [Google Scholar] [CrossRef] [Scilit]
  15. Rossi, P.; Tailhan, J.L.; Le Maou, F.; Gaillet, L.; Martin, E. Basic creep behavior of concretes investigation of the physical mechanisms by using acoustic emission. Cem. Concr. Res. 2012, 42, 61–73. [Google Scholar] [CrossRef] [Scilit]
  16. Huang, Y.; Wang, J.; Wei, Q.A.; Shang, H.; Liu, X. Creep behaviour of ultra-high-performance concrete (UHPC): A review. J. Build. Eng. 2023, 69, 106187. [Google Scholar] [CrossRef] [Scilit]
  17. Bazant, Z.P.; Kim, J.K.; Panula, L. Improved prediction model for time-dependent deformations of concrete: Part 4-Temperature effects. Mater. Struct. 1991, 24, 327–345. [Google Scholar] [CrossRef] [Scilit]
  18. Liang, Y.; Chen, W.; Burlion, N.; Shao, J. Experimental study of concrete creep under thermal-mechanical-hydric conditions. Mater. Struct. 2021, 54, 49. [Google Scholar] [CrossRef] [Scilit]
  19. Vidal, T.; Sellier, A.; Ladaoui, W.; Bourbon, X. Effect of temperature on the basic creep of high-performance concretes heated between 20 and 80 °C. J. Mater. Civ. Eng. 2015, 27, B4014002. [Google Scholar] [CrossRef] [Scilit]
  20. Troxell, G.E.; Raphael, J.M.; Davis, R.E. Long-time creep and shrinkage tests of Plain and reinforced concrete. Porc. ASTM 1958, 58, 1101–1120. [Google Scholar]
  21. Neville, A.M.; Dilger, W.H.; Brooks, J.J. Creep of Plain and Structural Concrete; Construction Press: London, UK; New York, NY, USA, 1983. [Google Scholar]
  22. Hansen, T.C. Creep and Stress Relaxation of Concrete; Proc. No. 31; Swedish Cement Research Institute: Stockholm, Sweden, 1960; 112p. [Google Scholar]
  23. Hansen, T.C. Creep of Concrete; Bulletin No.33; Swedish Cement and Concrete Research Institute: Stockholm, Sweden, 1958; 48p. [Google Scholar]
  24. Wang, J.; Fang, Z.; Deng, B.; Ma, Z.; Zhu, M. Experimental analysis of shrinkage and creep of high strength concrete with fly ash and the correction model. J. Civ. Archit. Environ. Eng. 2016, 38, 110–117. [Google Scholar]
  25. Fang, S.; Xiao, X.; Li, J. Optimization of sequences of multispan continuous beams’ closure and discussion of initial loading age of concrete. J. Rail Way Sci. Eng. 2013, 10, 24–29. [Google Scholar]
  26. Das, A.K. Natural sea-based materials SBM-ECCs: Experimental, analytical, and machine learning approaches to early-age behavior and modulating factors. Appl. Soft Comput. 2025, 186, 114101. [Google Scholar] [CrossRef] [Scilit]
  27. Saliba, J.; Grondin, F.; Loukili, A.; Morel, S. Numerical investigation of the size effects on the creep damage coupling. Procedia Mater. Sci. 2014, 3, 1038–1043. [Google Scholar] [CrossRef] [Scilit]
  28. Hansen, T.C.; Mattock, A.H. Influence of Size and Shape of Member on the Shrinkage and Creep of Concrete. J. Proc. 1966, 63, 267–290. [Google Scholar]
  29. Su, J.; Li, W. Influencing Factors of Creep in High-performance Concrete and Model Optimization. J. Yangtze River Sci. Res. Inst. 2015, 32, 120–124. [Google Scholar]
  30. CEB-FIP MC 78; CEB-FIP Model Code for Concrete Structures. Comitë Euro International du Beton: Paris, France, 1978.
  31. Euro-International Committee for Concrete. CEB-FIP Model Code 1990: Design Code; Thomas Telford: London, UK, 1990. [Google Scholar]
  32. fib - International Federation for Structural Concrete. fib Model Code for Concrete Structures 2010; Ernst & Sohn: Berlin, Germany, 2013; ISBN 978-3-433-03061-5. [Google Scholar]
  33. ACI209 R-92; Prediction of Creep, Shrinkage, and Temperature Effects in Concrete Structures. American Concrete Institute: Detroit, MI, USA, 1992.
  34. Bazant, Z.P.; Baweja, S. Justification and refinement of Model B3 for concrete creep and shrinkage. Statistics and sensitivity. Mat. Struct. 1995, 28, 415–430. [Google Scholar] [CrossRef] [Scilit]
  35. Bazant, Z.P.; Baweja, S. Creep and shrinkage prediction model for analysis and design of concrete structures-B3 model. Mater. Struct. 1995, 28, 357–365. [Google Scholar]
  36. Yang, Y.; Lu, W.; Li, X.; Yu, X. Experimental study and prediction model for concrete creep in ambient environment. J. Southwest Jiaotong Univ. 2015, 50, 977–983, 1010. [Google Scholar]
  37. Zhang, Y.; Zhang, J.; Mao, J.; Lu, F.; Jiang, Z. Investigating the Influence of Fluctuating Humidity and Temperature on Creep Deformation in High-Performance Concrete Beams: A Comparative Study between Natural and Laboratorial Environmental Tests. Materials 2024, 17, 998. [Google Scholar] [CrossRef] [Scilit]
  38. Xu, Y.; Liu, J.; Liu, J.; Zhang, P.; Zhang, Q.; Jiang, L. Experimental studies and modeling of creep of UHPC. Constr. Build. Mater. 2018, 175, 643–652. [Google Scholar] [CrossRef] [Scilit]
  39. Xiong, X.; Wang, L.; Xue, R.; Zhang, X.; Li, Q.; Chen, W.; Liu, Y.; Zhao, H.; Wang, J.; Sun, P.; et al. Creep Behavior of High-performance Concrete. Adv. Constr. Technol. 2014, 919–921, 1885–1889. [Google Scholar] [CrossRef] [Scilit]
  40. Wang, P.; Li, C.; Zhang, R.; Zhou, S.; Zheng, J. Exponential function model for creep coefficient of high performance concrete. Concrete 2020, 1, 50–55. [Google Scholar]
  41. Gu, C.; Wang, Y.; Gao, F.; Yang, Y.; Ni, T.; Liu, J.; Lou, X.; Chen, J. Early age tensile creep of high performance concrete containing mineral admixtures: Experiments and modeling. Constr. Build. Mater. 2019, 197, 766–777. [Google Scholar] [CrossRef] [Scilit]
  42. Wang, Y.; Ma, Y.; Zhou, L. Creep of FRP-wrapped concrete columns with or without fly ash under axial load. Constr. Build. Mater. 2011, 25, 697–704. [Google Scholar] [CrossRef] [Scilit]
  43. Zhang, L.L.; Wu, L.Q.; Yang, J.X.; Zhang, K. Effect of fly ash on creep of high performance concrete used in bridge. Appl. Mech. Mater. 2012, 204, 2192–2195. [Google Scholar] [CrossRef] [Scilit]
  44. Das, A.K.; Jiang, J.; Leung, C.K.Y. ECCSrm: A novel meso-scale finite element model to simulate shrinkage of engineered cementitious composites (ECCs) incorporaring fiber characteristics. Constr. Build. Mater. 2025, 461, 139753. [Google Scholar] [CrossRef] [Scilit]
  45. Chen, P.; Zheng, W.; Wang, Y.; Chang, W. Analysis and modelling of shrinkage and creep of reactive powder concrete. Appl. Sci. 2018, 8, 732. [Google Scholar] [CrossRef] [Scilit]
  46. Dabarera, A.; Li, L.; Dao, V. Experimental evaluation and modelling of early-age basic tensile creep in high-performance concrete. Mater. Struct. 2021, 54, 130. [Google Scholar] [CrossRef] [Scilit]
  47. Ministry of Transport of the People’s Republic of China. Specifications for Design of Highway Reinforced Concrete and Prestressed Concrete Bridges and Culverts: JTG 3362-2018; China Communications Press: Beijing, China, 2018. [Google Scholar]
  48. Zhang, Y.; Mao, J.; Jin, W.; Zhang, J. Creep model of high-performance concrete at different loading ages. Constr. Build. Mater. 2022, 357, 129379. [Google Scholar] [CrossRef] [Scilit]
  49. Lu, F. Creep Test and Deformation Simulation of Cable-Stayed Bridge Concrete Considering Temperature and Humidity Effects. Master’s Thesis, Chongqing Jiaotong University, Chongqing, China, 2019. [Google Scholar]
  50. Ministry of Transport of the People’s Republic of China. Code for Design of Highway Reinforced Concrete and Prestressed Concrete Bridges and Culverts: JTG D62-2004; China Communications Press: Beijing, China, 2004. [Google Scholar]
  51. Ministry of Transport of the People’s Republic of China. Design Standard on Reinforced and Prestressed Concrete Highway Structures: JTJ023-85; China Communications Press: Beijing, China, 1985. [Google Scholar]
  52. Brooks, J.J. Accuracy of estimating long-term strains in concrete. Mag. Concr. Res. 1984, 36, 131–145. [Google Scholar] [CrossRef] [Scilit]
  53. Wan, S. Research on the Creep Effect of Box-Girder Bridge Under Variable Temperature and Humidity Conditions. Master’s Thesis, Guangzhou University, Guangzhou, China, 2016. [Google Scholar]
  54. Das, A.K.; Leung, C.K.Y.; Barbhuiya, S. Experimental investigation and machine learning-based modelling of shrinkage evolution due to natural sea sand on fiber reinforced cementitious composites. J. Sustain. Cem. Based Mater. 2025, 14, 2145–2165. [Google Scholar] [CrossRef] [Scilit]
Figure 1. Long-term service modeling process for bridges considering creep.
Buildings 16 00857 g001
Figure 2. Fitting of the correction factor of loading age based on different standards.
Buildings 16 00857 g002
Figure 3. Fitting of correction factor of dimension based on different standards.
Buildings 16 00857 g003
Figure 4. Bridge Elevation.
Buildings 16 00857 g004
Figure 5. Initial image acquisition at 14:00, 28 April 2022.
Buildings 16 00857 g005
Figure 6. Deformation at 14:00, 1 May 2022.
Buildings 16 00857 g006
Figure 7. Comparison of prediction model and test data.
Buildings 16 00857 g007
Figure 8. Average monthly temperature of the bridge.
Buildings 16 00857 g008
Figure 9. Geometric line shape change pattern from 28 April to 30 November 2022. Note: # denotes pier number, where 1# and 2# represent Pier 1 and Pier 2 respectively. The span between them constitutes the bridge span.
Buildings 16 00857 g009
Figure 10. Temperature-induced mid-span deflection.
Buildings 16 00857 g010
Figure 11. Comparison of measured and predicted values for mid-span deflection of bridges over time.
Buildings 16 00857 g011
Figure 12. Comparison of the model before and after correction.
Buildings 16 00857 g012
Figure 13. Sensitivity analysis of each factor.
Buildings 16 00857 g013
Figure 14. Comparison of various creep prediction models.
Buildings 16 00857 g014
Figure 15. Deflection development of main beam predicted by different models at different period.
Buildings 16 00857 g015
Figure 16. Correction factor of loading age (t0) for different codes at 1, 5, 10, and 30 years of loading duration (t).
Buildings 16 00857 g016
Table 1. Prediction Results of Mid-Span Deflection/mm.
Development Time/YearModified ModelJTG2004 ModelACI209 ModelCEB90 Model
368.44131.72 (92.5%)149.01 (117.7%)107.34 (56.8%)
1081.73175.33 (114.5%)161.56 (97.7%)143.33 (75.4%)
2087.89195.39 (122.3%)164.30 (86.9%)160.10 (82.2%)
Disclaimer/Publisher’s Note: The statements, opinions and data contained in all publications are solely those of the individual author(s) and contributor(s) and not of MDPI and/or the editor(s). MDPI and/or the editor(s) disclaim responsibility for any injury to people or property resulting from any ideas, methods, instructions or products referred to in the content.