1. Introduction
Global climate change intensifies extreme heat and humidity, making building climate resilience and low-carbon operation a core urban sustainability priority [
1,
2]. Buildings consume 36% of final energy and generate 37% of total energy-related CO
2 emissions [
3,
4]; thus, energy system upgrades are also essential for meeting carbon peaking and neutrality targets. In China, air-conditioning facilities account for half of building-operational energy consumption, with this figure rising above 70% in certain hot–humid climatic regions. However, the energy efficiency ratio (EER) of refrigeration plants in 90% of existing projects is less than 3.5 [
5,
6]. Many office refrigeration plants over 15 years old in China suffer from chiller performance degradation, hydraulic losses in fixed-speed pumps, reduced cooling tower heat exchange, and automation failures, leading to low annual efficiency, poor cooling stability under high temperatures and humidity, and weakened climate resilience [
7,
8,
9]. These issues are more pronounced in the hot–humid region (e.g., Guangzhou), where long cooling seasons and persistent humid heat prevail. As stipulated in the ASHRAE Handbook, refrigeration plants with annual average EER below 3.5 shall be retrofitted [
10]. Hence, research on integrated refrigeration plant retrofitting tailored to local climate has both engineering value and practical urgency.
Existing aged refrigeration plants commonly suffer from excessive equipment redundancy, degraded heat exchange performance, hydraulic imbalance and extensive operation and maintenance [
6]. These defects lead to the low overall operational efficiency of the system, leaving considerable potential for energy-saving retrofitting. Research on the retrofit of refrigeration plants mainly falls into three categories: equipment upgrading and retrofitting, operation optimization and control, and system-integrated retrofitting that combines both aforementioned approaches. The early research on energy-saving retrofitting of water-cooled refrigeration plants primarily focused on hardware upgrades, including chiller efficiency improvement [
11], variable-frequency control of pumps [
12], and optimization of cooling tower [
13,
14]. Reference [
11] reported a chiller replacement project for a shopping mall in Hong Kong. Following the retrofit, the annual average COP rose from 4.09 to over 6.0, demonstrating a notable improvement in energy efficiency. Xu et al. [
12] carried out a variable-frequency retrofit of water pumps for the air-conditioning system of a newspaper office building in Beijing, achieving an energy-saving rate of 33.7%. Reference [
14] described retrofit measures for cooling towers at Guilin Liangjiang International Airport, including optimization of heat exchange structures and replacement of manual valves with electric ones. Calculations indicated that the retrofitted cooling towers attained an annual energy-saving rate of 45.4%. Subsequently, the research scope progressively expanded toward intelligent regulation and control strategies. As far as refrigeration plant optimization is concerned, genetic algorithm (GA) and particle swarm optimization (PSO) are the most commonly utilized swarm intelligence algorithms in relevant studies [
15,
16,
17,
18]. Tu et al. conducted simulation-based optimization of the group control strategy for the chilled-water plant of a medical building using the particle swarm optimization algorithm, achieving energy-saving rates of 9.42%, 8.04%, 5.67% and 14.64% for chillers, chilled-water pumps, cooling-water pumps and cooling towers, over the cooling season [
15]. In addition, Yang et al. took the water-cooled refrigeration plant of a commercial office building as the research object and adopted the gray wolf optimization algorithm for system operation simulation optimization, achieving an 11.82% improvement in the annual comprehensive energy efficiency ratio [
19]. Currently, refrigeration plant retrofits shift from standalone equipment efficiency promotion to system-wide collaborative optimization. Integrated solutions combining precise load calculation, hardware renovation, intelligent system control and digital operation and maintenance management dominate the low-carbon upgrading of refrigeration plants [
20]. Reference [
20] reported the retrofit of the chiller plant for an office building in Xi’an, including equipment cleaning, variable-frequency retrofits for water pumps and cooling tower fans, and the construction of an intelligent group control platform. Field measurements show that the annual energy-saving rate of the system reaches 44.8%.
Although current research has achieved some advances, certain limitations still exist. First, comprehensive research covering chillers, pumps, cooling towers, energy-efficiency metering, and intelligent group control systems is still insufficient. Secondly, most retrofit schemes are analyzed merely through simulation rather than being verified by long-term on-site measured data. In addition, there is insufficient research on energy-saving retrofits for cooling plants in old office buildings located in hot–humid climates, and existing relevant studies cannot be directly adapted for such scenarios.
To address the aforementioned research gaps, this study aims to establish an engineering-oriented integrated energy retrofit framework for aged refrigeration stations of office buildings in hot and humid regions. Rather than a mere research workflow, this framework constitutes a complete technical system integrating equipment retrofit scheme design, techno-economic trade-off evaluation, on-site implementation, and long-term measurement and verification, and covers full-chain upgrades of chillers, water pumps, cooling towers, metering, and intelligent group control systems. Taking the aged refrigeration plant of an office building in Guangzhou as a case study, energy consumption prediction models for chillers, circulating water pumps and cooling towers are established. Three integrated renovation schemes are proposed in accordance with the annual temperature–humidity and cooling load distribution characteristics. The optimal scheme is determined via techno-economic evaluation and implemented on site. Continuous field measurements in 2026 are used to evaluate the renovated refrigeration plant’s overall energy efficiency and equipment performance and quantify each unit’s energy-saving effect. The research objectives are as follows: (1) propose an integrated retrofitting scheme covering the full chain of chillers, pump sets, cooling towers, energy-efficiency metering and intelligent group control systems to specifically address common operational drawbacks of aged refrigeration plants; (2) determine the optimal scheme through techno-economic comparison, estimate the annual integrated EER of the refrigeration plant and conduct benchmarking against standard T/CRAAS 1039-2023 [
21]; (3) verify the improvement outcomes using field-monitored long-period datasets, and explore the real-world operational performance of the refrigeration plant together with its principal equipment: chillers, circulating pumps and cooling towers.
2. Office Building Refrigeration Plant Overview
2.1. Refrigeration Plant’s Existing Configuration and Cooling Load Characteristics
This work selects a typical office building located in Guangzhou as the research object, which was completed and put into official operation in December 2006. This building is chosen for two primary reasons. First, the site belongs to the hot summer and warm winter climatic region, featuring high energy consumption for office buildings. Second, the building affords continuous operational monitoring data for the year 2026 for operation performance validation. The building covers a total floor area of 228,000 m2, with 130,000 m2 designated as the air-conditioned zone.
This building’s U-values are approximately 1.5 W/(m
2·K) for external walls, 0.8 W/(m
2·K) for the roof, and 3.0 W/(m
2·K) for external windows, with no external shading installed. The occupancy density is 0.125 persons/m
2. These parameters are broadly consistent with those of many existing office buildings built in the same period within hot–humid regions and GB 50189-2005 [
22]. Hence, this case can represent large-scale office buildings equipped with water-cooled refrigeration plants from that era.
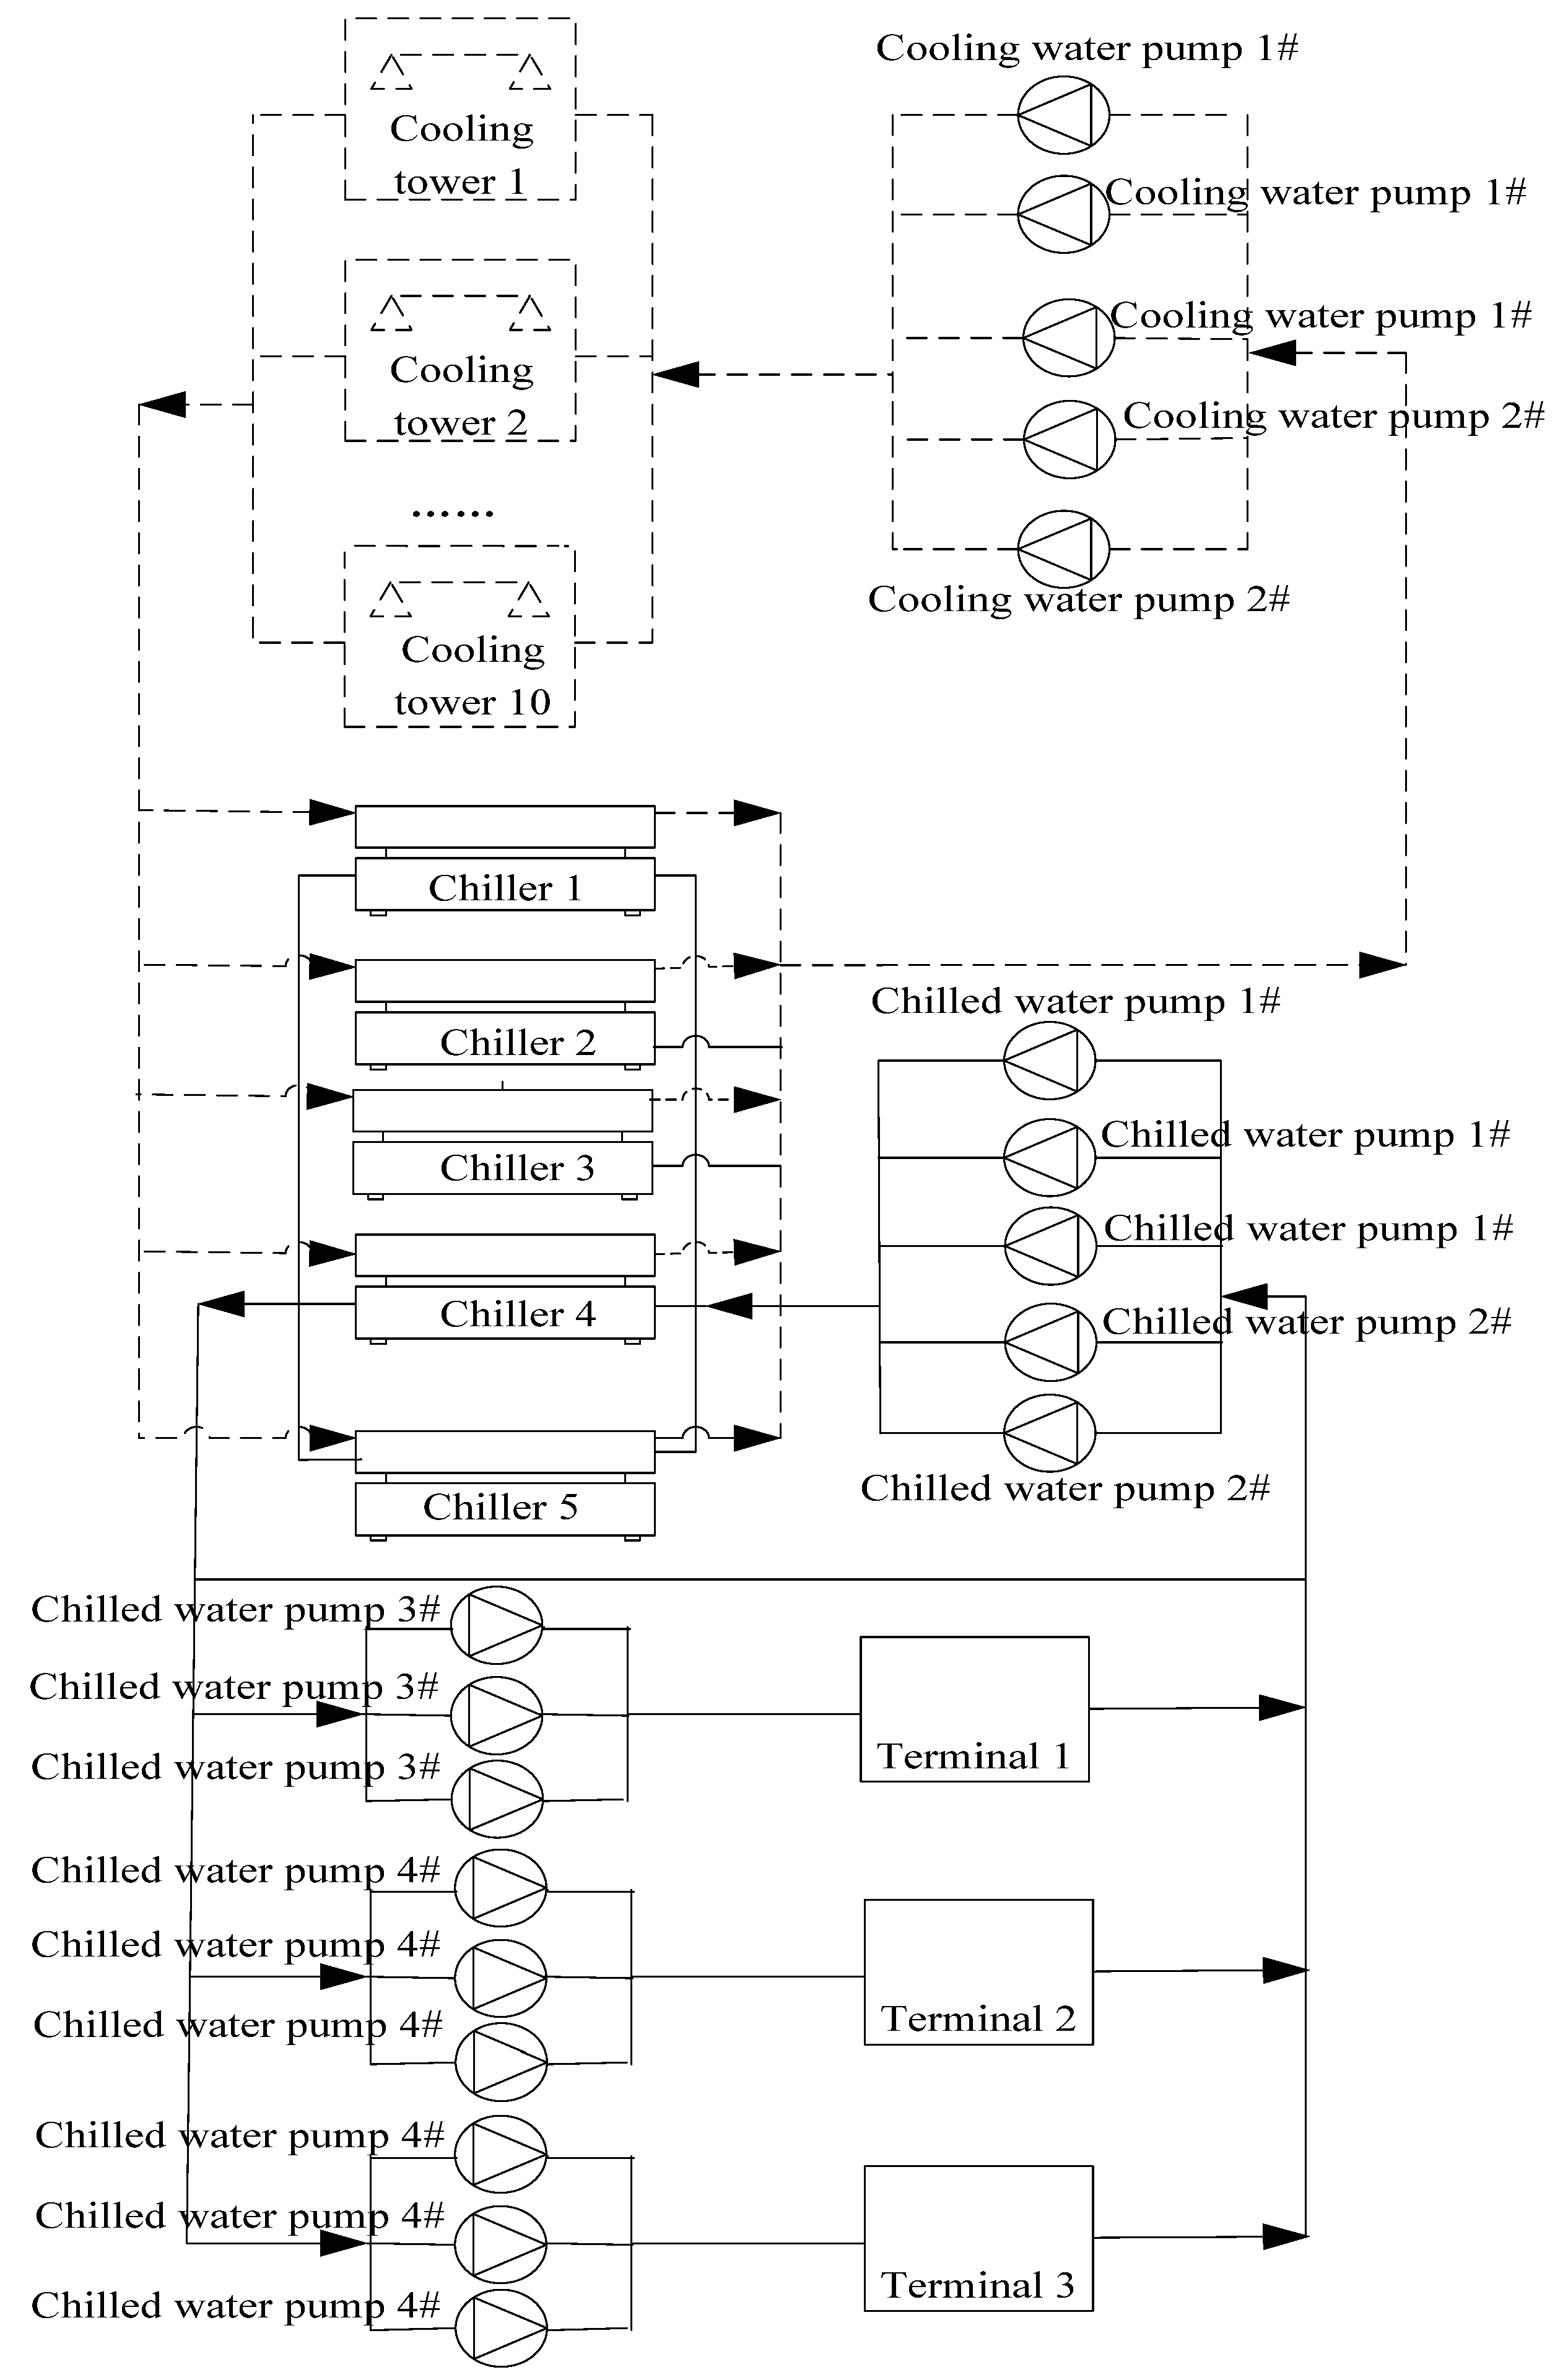
Figure 1 presents a schematic layout of the refrigeration plant system. This system comprises five chillers, fourteen chilled-water pumps, five cooling-water pumps and ten cooling towers. In
Figure 1, solid lines represent the chilled-water loop and dashed lines represent the cooling-water loop.
Table 1 lists key performance data of all above-mentioned devices. The device numbers in
Figure 1 correspond to those in
Table 1. In terms of control strategy, constant temperature difference control is adopted for the two hydraulic loops of chilled water and cooling water. In detail, the supply–return temperature difference of chilled-water is held at 7 °C, and the cooling-water loop uses a set-point difference of 5 °C. With the exception of secondary chilled-water pumps, all other pumps and cooling tower fans employ fixed-frequency operation modes.
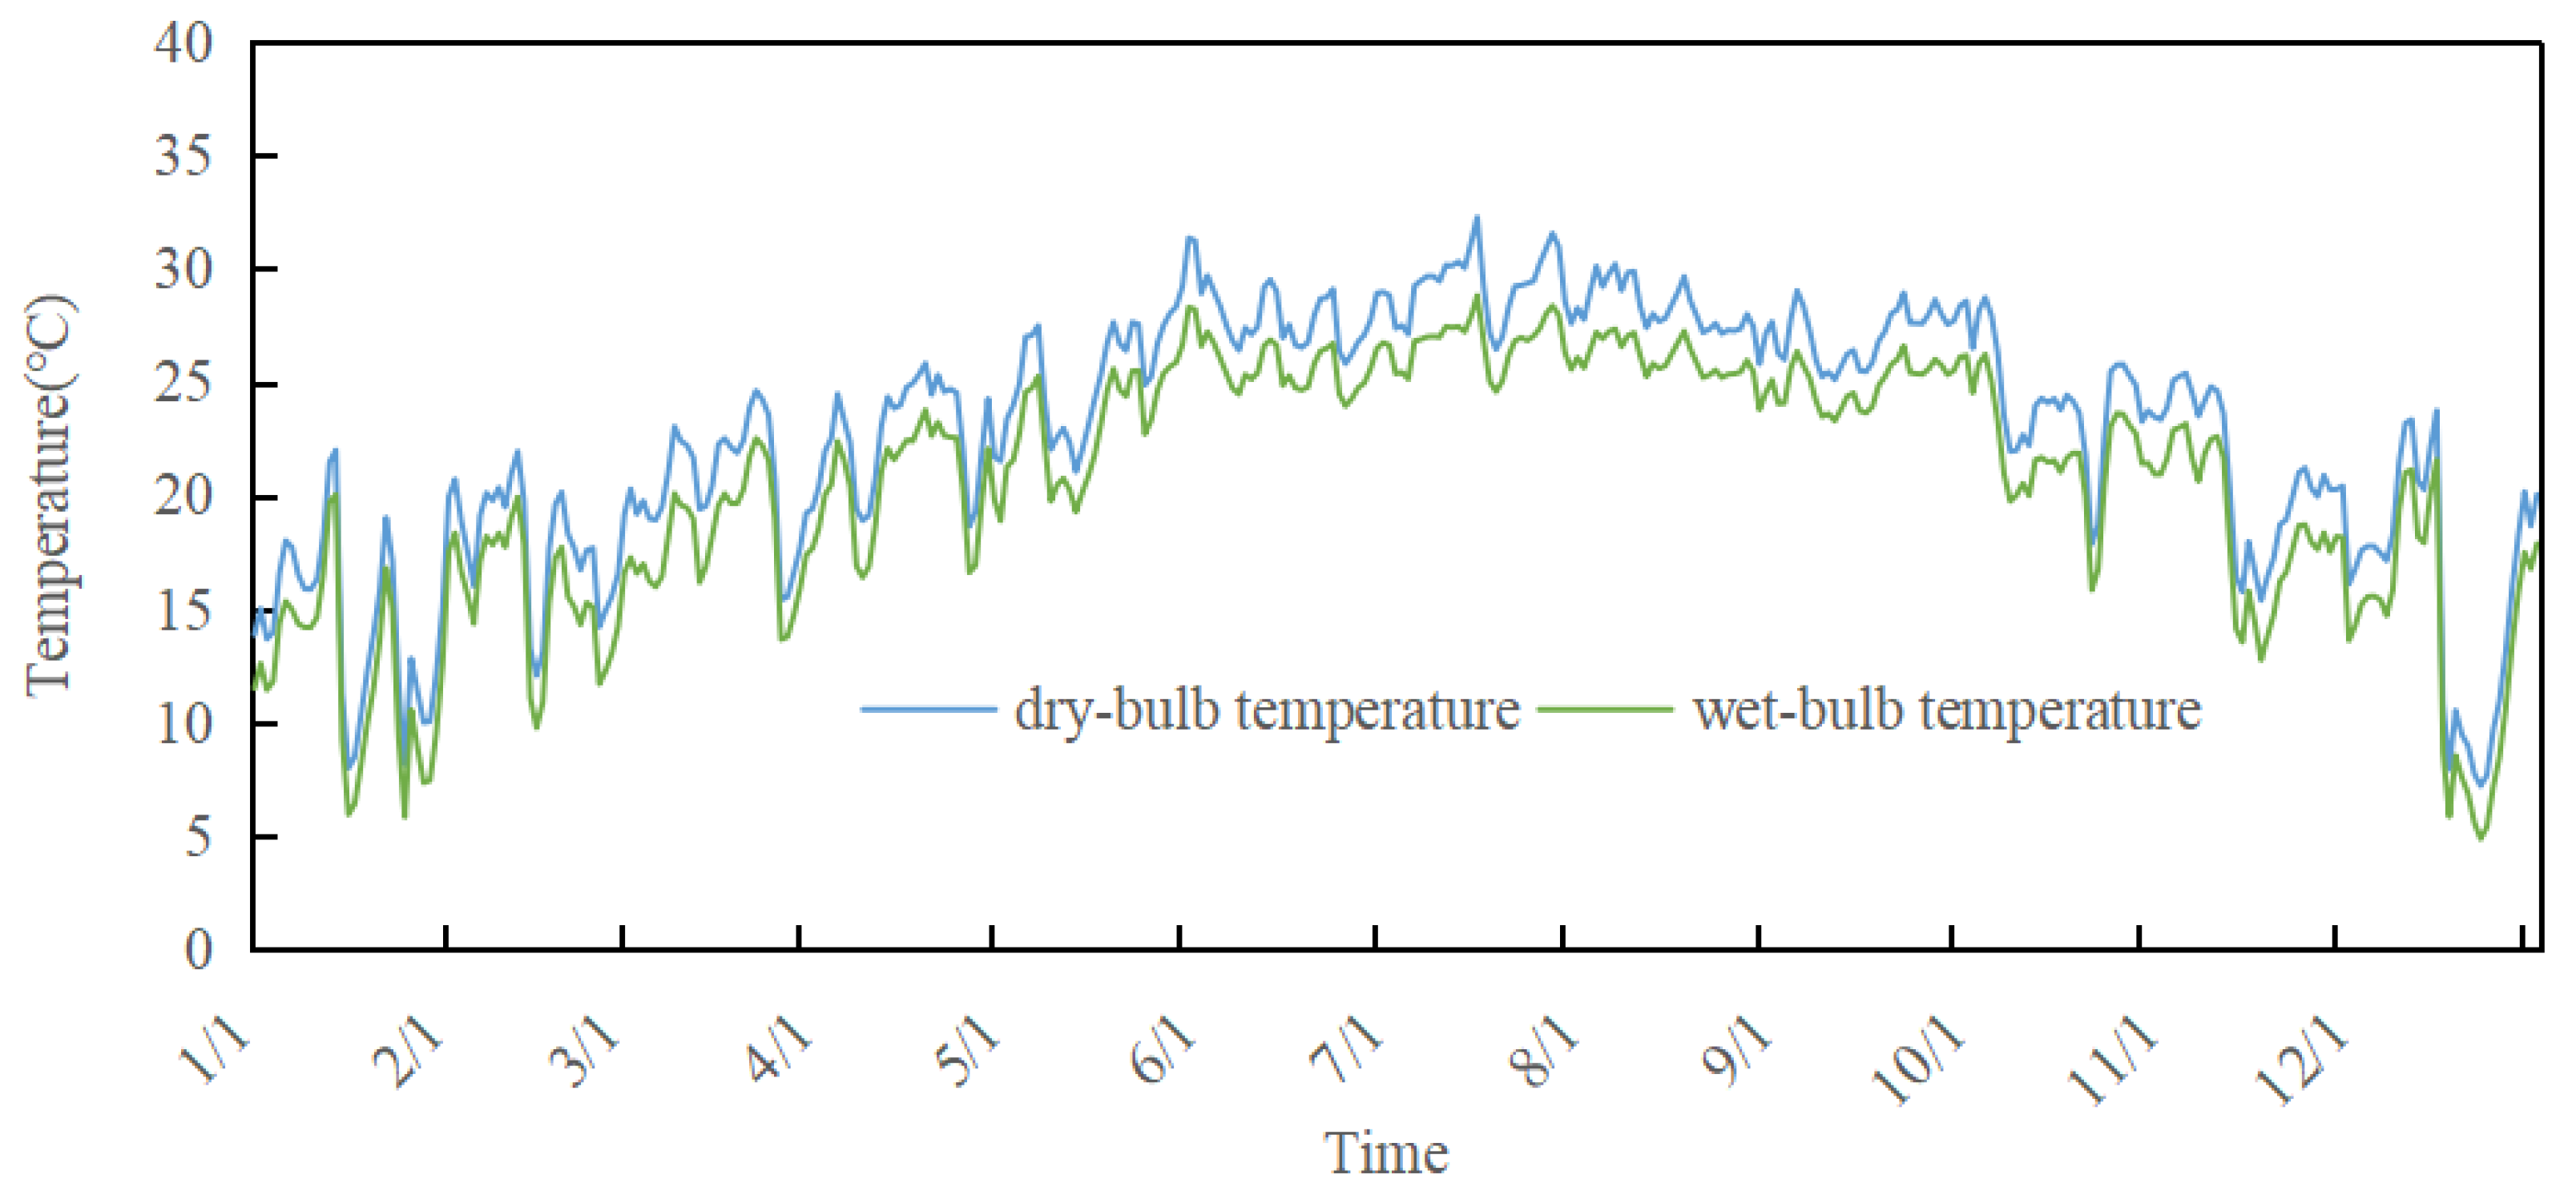
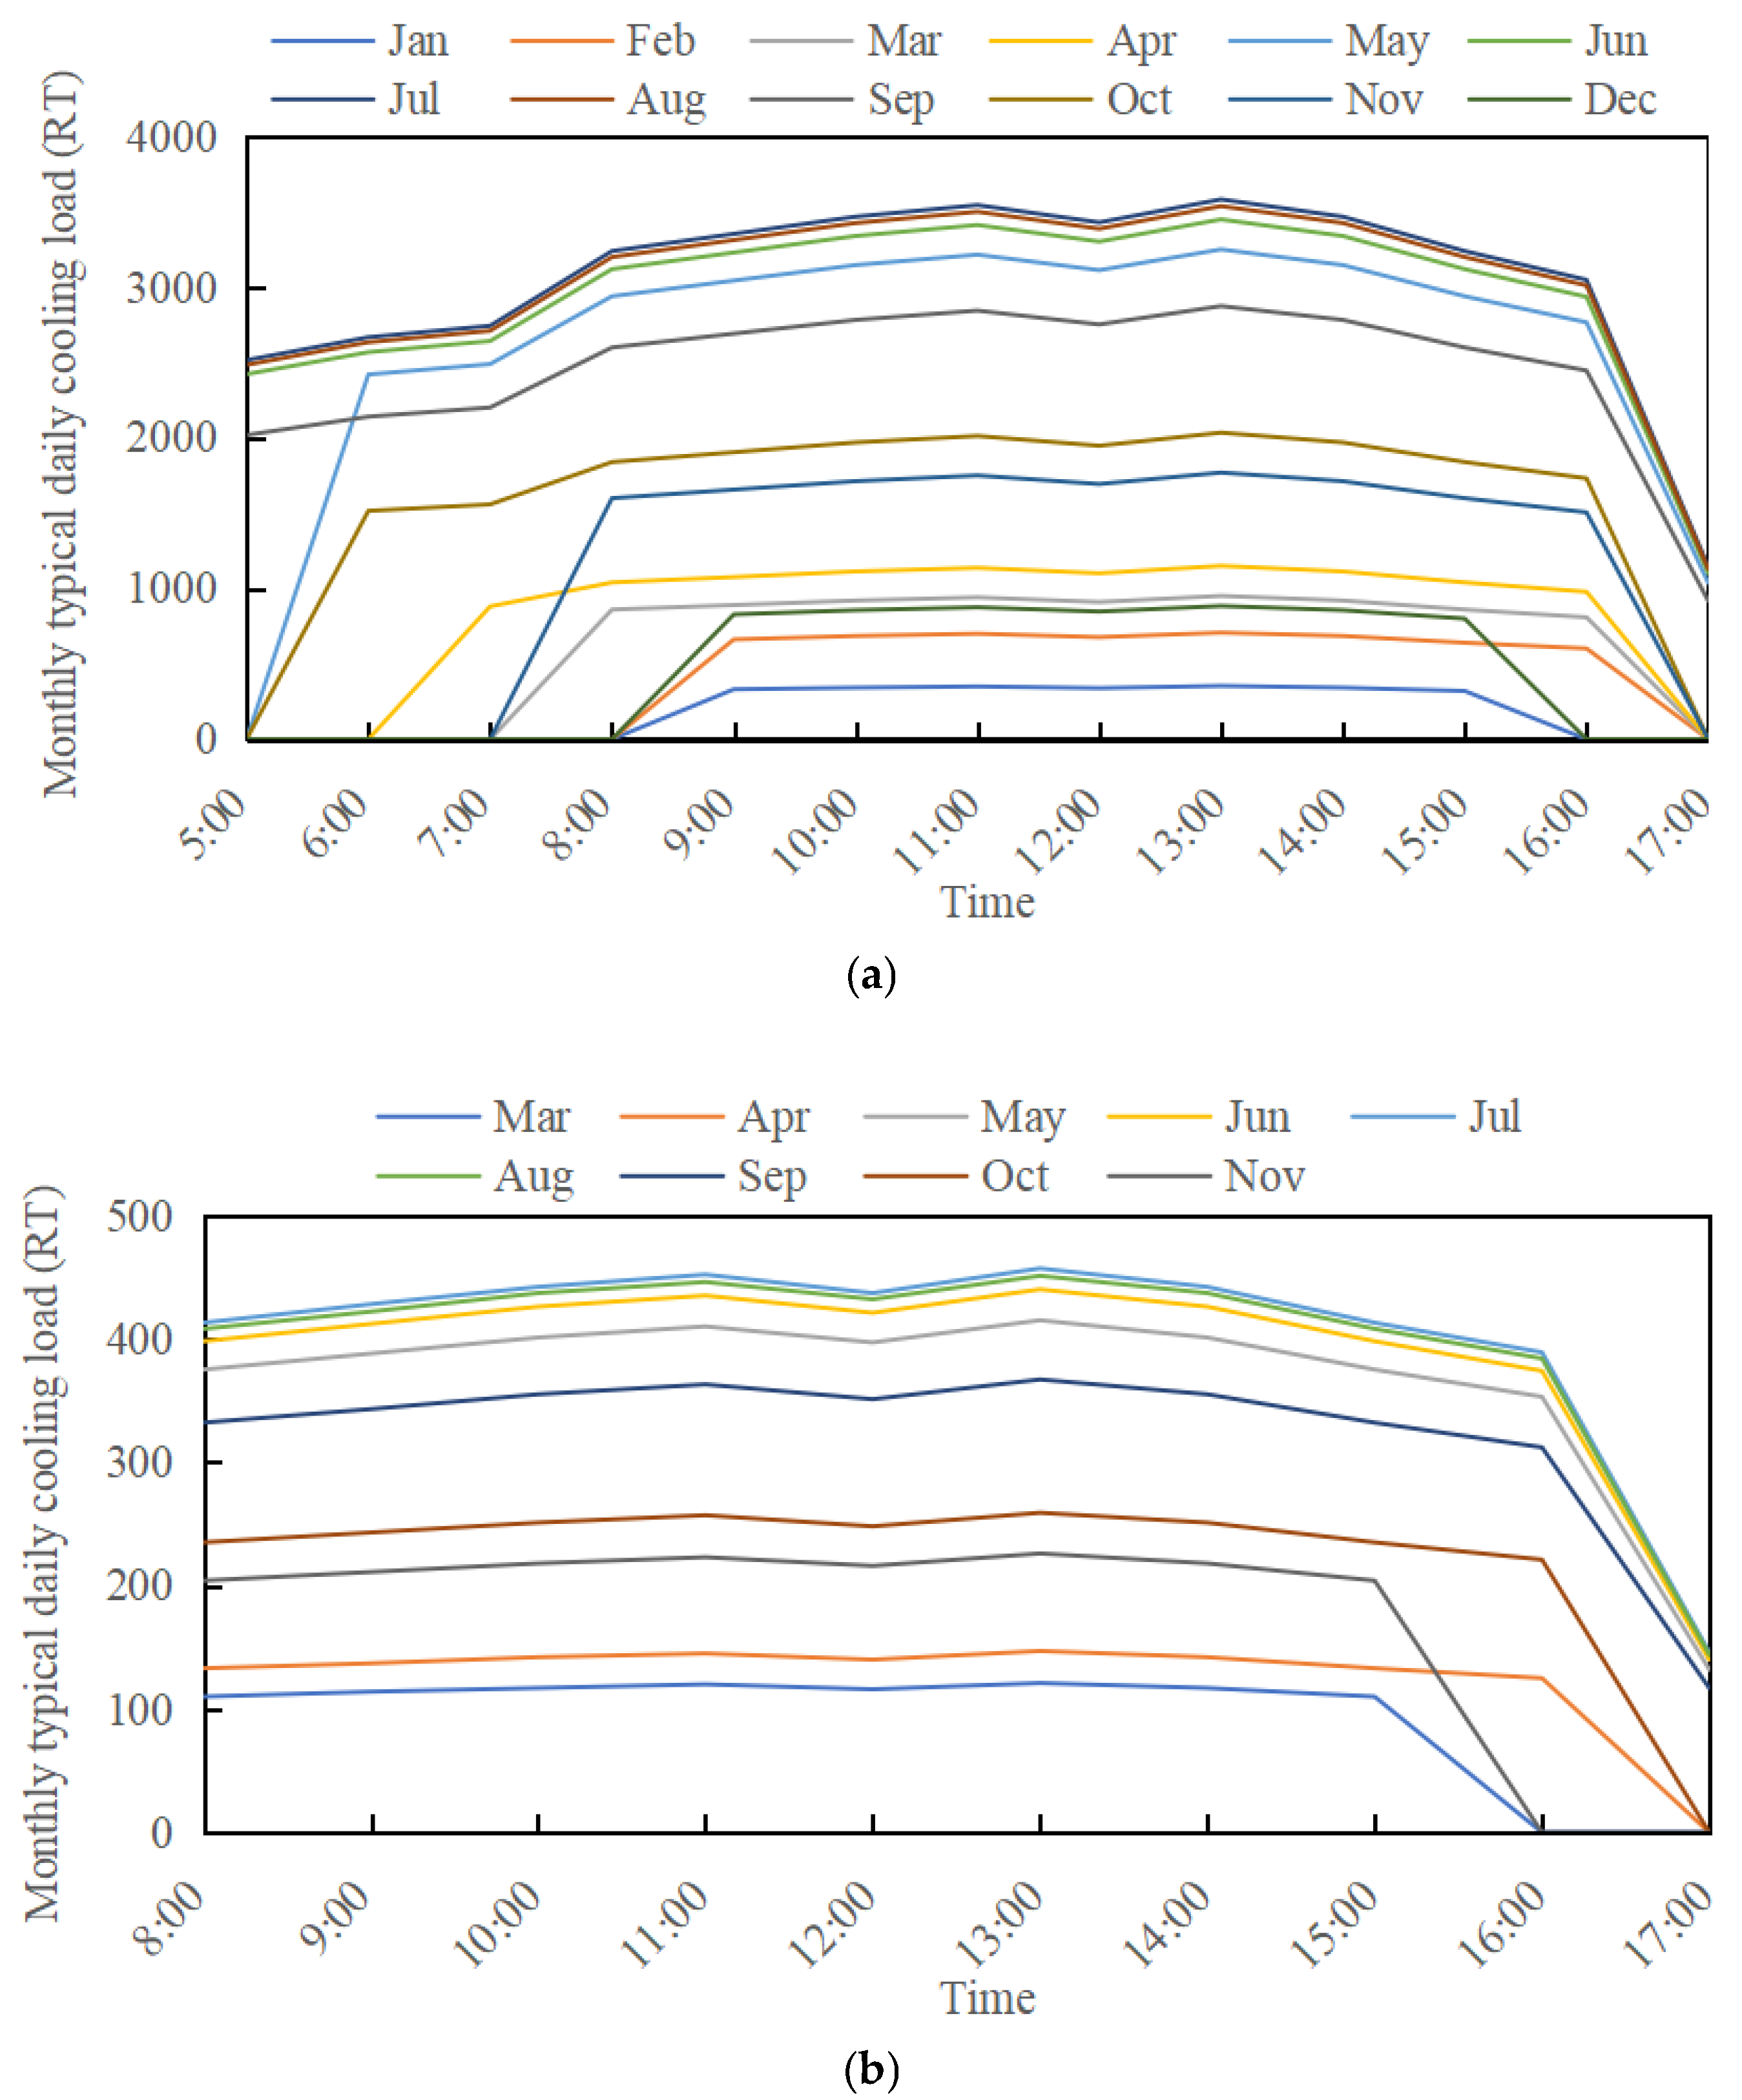
Figure 2 illustrates the ambient-air dry-bulb and wet-bulb temperature distributions for Guangzhou, with design parameters set to 33.5 °C and 27.5 °C. The monthly weighted cooling load characteristics were determined via the cooling load coefficient approach. Simulation parameters covering building-envelope thermal performance, internal heat gains, and indoor air thermal–humidity levels are configured according to GB 50189-2005, China’s national energy-efficiency standard for public buildings.
Figure 3 presents the calculated cooling loads of the building. Outdoor meteorological conditions are key drivers that determine cooling demand and the operational performance of cold-source systems [
23]. Based on long-term field measurements of multiple commercial buildings, Naeem et al. found that the daily mean outdoor air temperature acts as the primary driver of cooling-related energy consumption. A 1 °C rise in daily mean outdoor air temperature leads to a 7.6–9.8% increase in cooling intensity for commercial buildings [
24]. This pattern is also reflected in the present case: the high-temperature conditions in Guangzhou during summer raise the building cooling intensity, which directly leads to a notable rise in cooling load in summer. As shown in
Figure 2 and
Figure 3, working-day total cooling load reaches its maximum in July and minimum in January. During overtime periods, the peak cooling load also appears in July, with the lowest value recorded in March. Annual load curve analysis (
Figure 3) yields the proportional runtime for each cooling load interval, and these statistics are compiled in
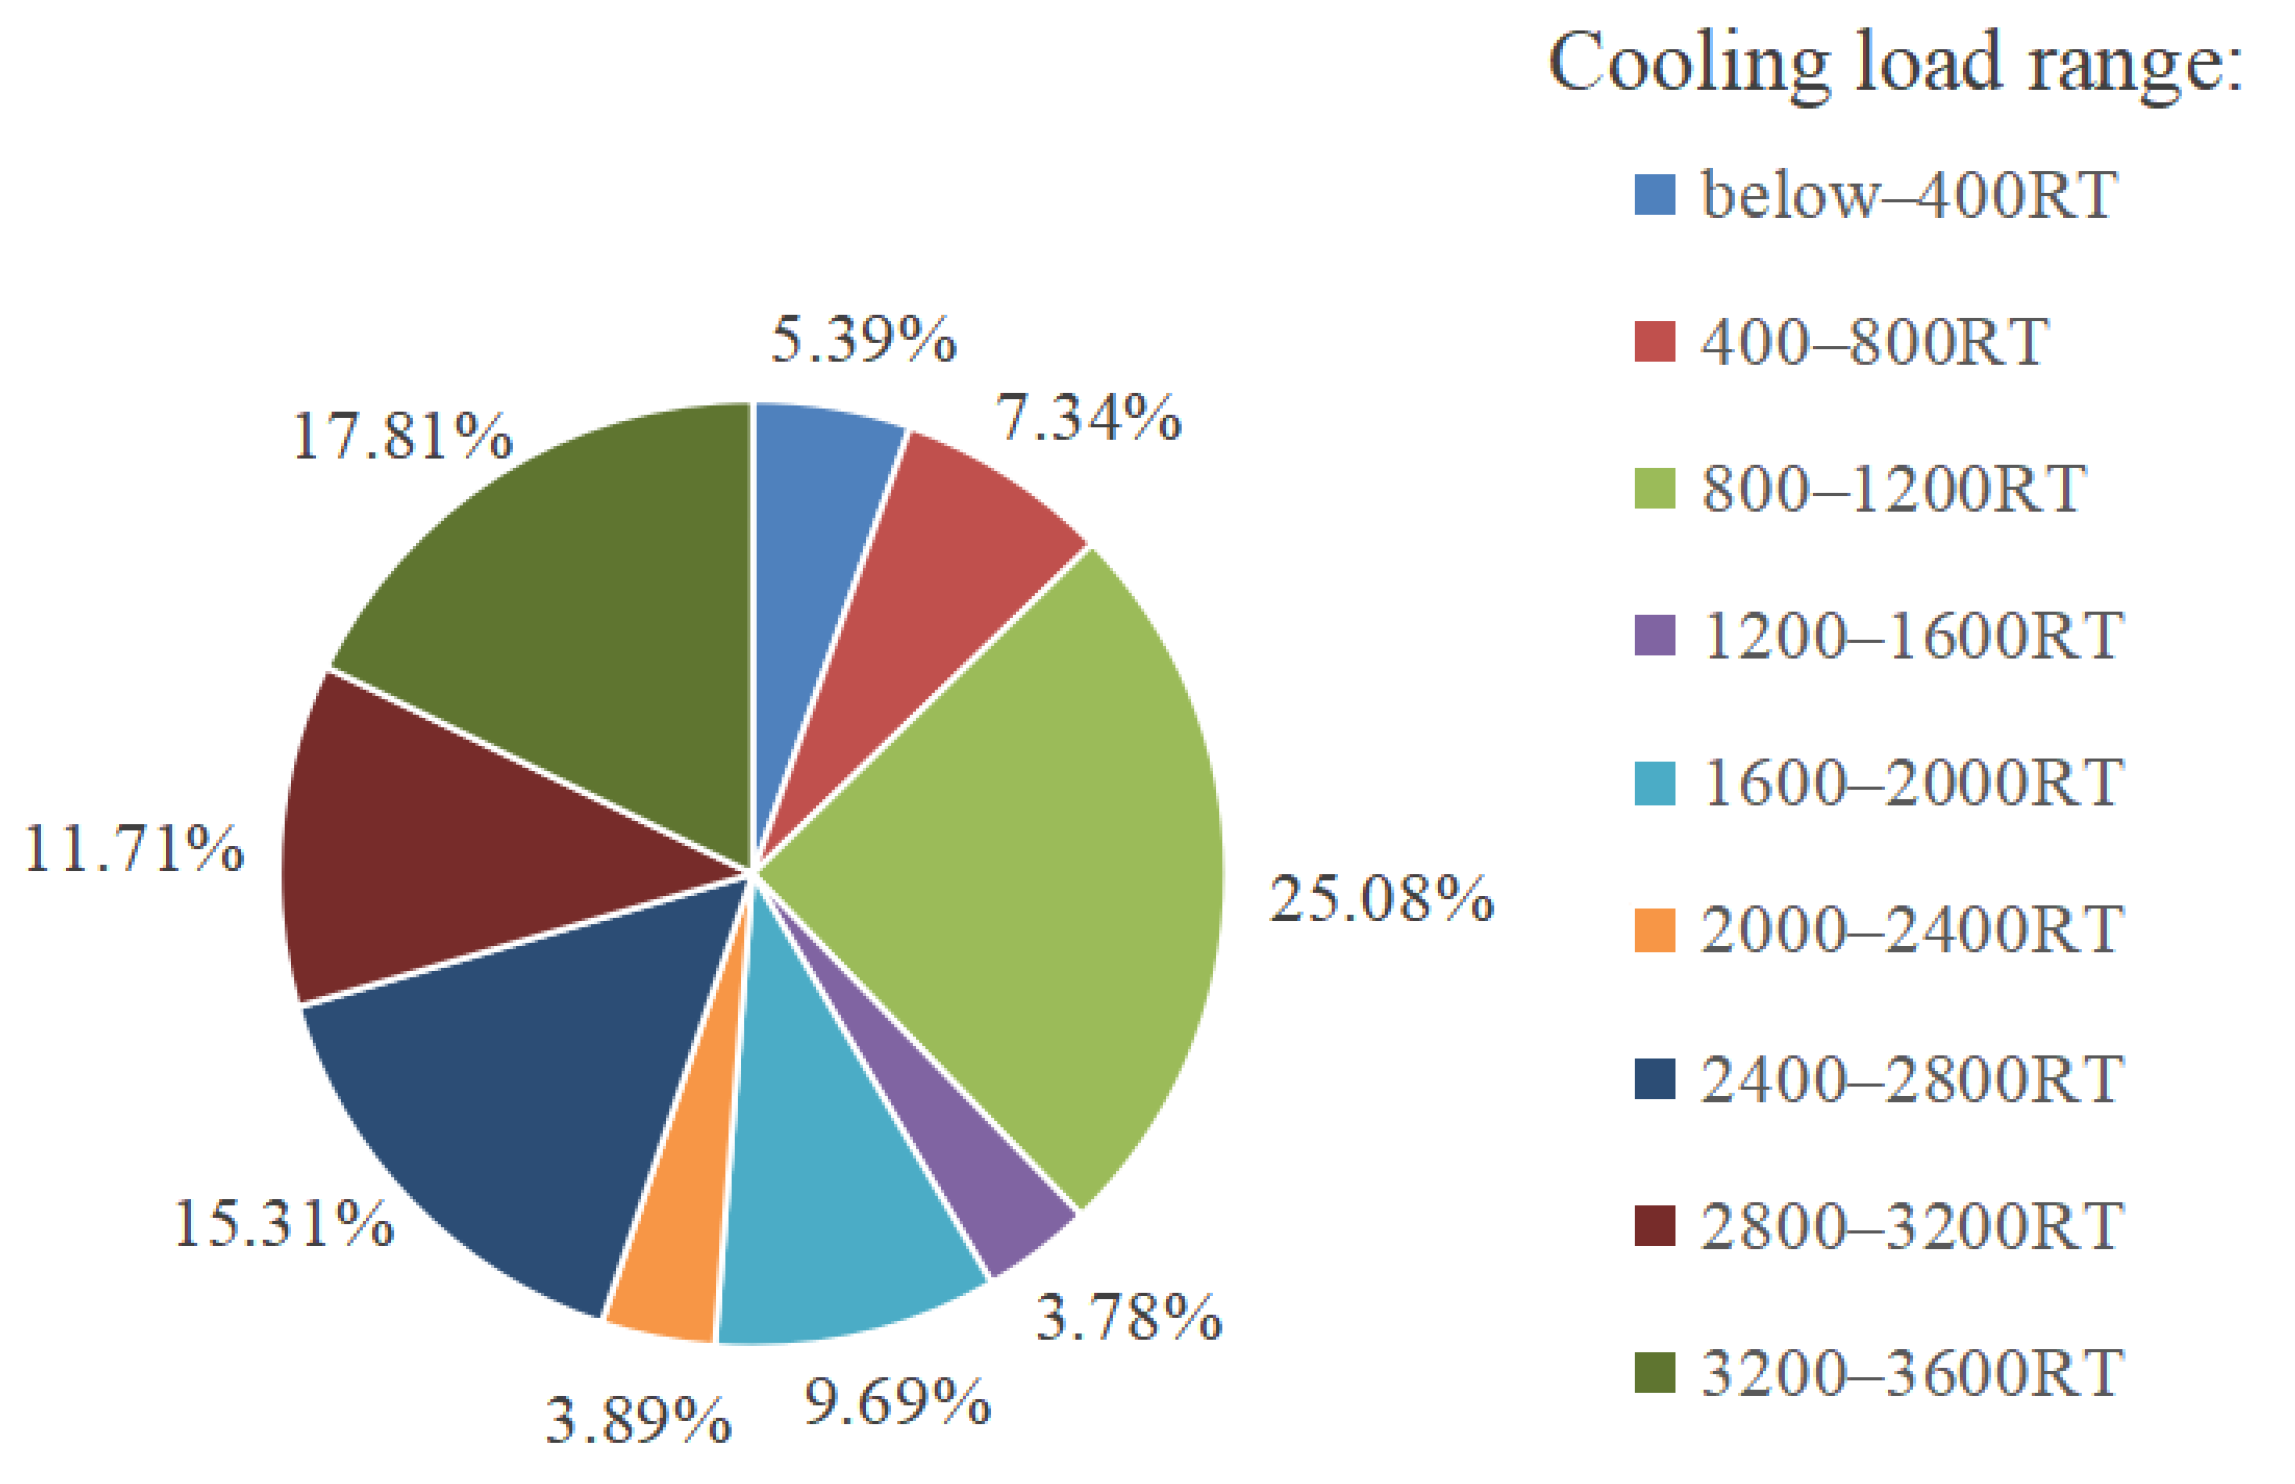
Figure 4. The 800–1200 RT load interval accounts for 25.07% of annual runtime, and the 2400–3600 RT range occupies around 45% of yearly operating time.
The above annual load variation and runtime distribution under different cooling load levels provide a basis for chiller retrofits and efficiency improvement. In addition, the extended duration of the cooling season in Guangzhou renders energy-saving retrofit particularly impactful in terms of potential energy savings.
2.2. Refrigeration Plant Current Operating Status
The refrigeration plant is equipped with a total of five chillers, one of which rated at 180 RT has remained idle for a long time. Field test operational data demonstrate that the supply–return temperature difference of cooling-water is generally lower than the design value of 5 °C, with a minimum value of merely 1.5 °C. Accordingly, the chillers fail to operate efficiently for most of the year, leading to the low overall energy efficiency of the refrigeration plant. Such an operational defect is a common issue in aged refrigeration plants, predominantly found in facilities constructed years ago with constant-speed water pumps and incomplete automatic control systems.
Furthermore, field measurement results indicate that the supply–return temperature difference of chilled water generally exceeds the design threshold of 5 °C, which reflects two prominent operational drawbacks: 1. The cooling load imposed by building air-conditioning terminals remains excessively high. The system suffers from insufficient water flow, thereby triggering a notable elevation in return water temperature. 2. Operation and maintenance personnel manually increase the set-point temperature of supply chilled water. While such operation marginally elevates the chiller COP in the short run, it severely degrades the terminal’s cooling and dehumidification capacity and impairs indoor thermal–humid comfort.
In addition, field measurement results reveal that the cooling tower approach temperature generally exceeds the design value of 3 °C, with a maximum value up to 10 °C. The poor cooling performance of cooling towers consequently impairs the energy efficiency of chillers. The main causes are threefold. First, having been in service for nearly 20 years, cooling towers suffer from aged filler material and clogging of water distribution nozzles due to long-term water vapor erosion. The water distribution uniformity within the filler zone deteriorates, accompanied by severe water seepage and dripping, which substantially reduces the heat exchange efficiency of cooling towers. Second, the elevation of the cooling tower air outlet falls below the surrounding perimeter walls, facilitating the recirculation of discharged hot air and further compromising the tower’s thermal rejection capacity. Third, the motorized control valves on the supply and return water piping are found to be inoperable, resulting in severe cross-mixing between chilled and hot water streams within the system.
As shown in
Figure 3 and
Figure 4, the cooling load of this office building fluctuates drastically over the whole year. The operation time under low-load conditions below 1200 RT accounts for roughly 40% of total running hours. Both primary chilled-water pumps and cooling-water pumps operate with fixed frequency all year round, which leads to an excessive surplus of pump flow rate and water head under low-load working conditions and consequently causes unnecessary energy loss.
Furthermore, the metering and automation system of the refrigerant plant is nearly completely inoperative, relying on manual start-up and temperature adjustment, and thus fails to achieve real-time optimal energy-saving scheduling. The refrigerant plant system also lacks precise metering data on energy consumption and energy efficiency, which not only hinders the formulation of energy-saving measures but also renders the quantification of energy-efficiency management targets with a solid basis infeasible.
2.3. Energy Consumption Models of Equipment
As expressed in Equation (1), the refrigeration plant system’s overall energy consumption consists of the energy consumption of chillers, pumps and cooling towers.
where
ECchiller is the chillers’ energy consumption (kWh).
ECpump is the pumps’ energy consumption (kWh).
ECtower is the cooling towers’ energy consumption (kWh).
Energy consumption models for chillers, pumps and cooling towers are presented below.
(1) Chiller
The water-cooled chiller energy consumption model shown in Equation (2) is established by adopting the polynomial model [
25] with sampled data.
where PLR stands for chiller part load ratio, defined as the quotient of measured cooling capacity and the chiller’s nominal capacity.
Teo is the evaporator outlet temperature (°C).
Tci is the condenser inlet temperature (°C).
a1 to a9 are regression coefficients.
(2) Pump
Constant-speed pumps maintain nearly constant rotational speed, and their operating power is approximately equal to the rated power. An analysis of parameter samples for variable-frequency pumps indicates that their energy consumption has a quadratic polynomial correlation with flow rate [
26], thereby yielding the subsequent energy consumption model:
where
ECpump,r denotes pump rated energy consumption (kWh).
v represents water flow rate (m3/h).
b1, b2, and b3 are regression coefficients fitted via multiple linear regression analysis using pump sample data.
(3) Cooling tower
The semi-empirical Braun model [
27] is widely adopted to compute the power consumption of cooling tower fans. Despite its capability in predicting thermal performance, this model cannot characterize the coupling interactions among cooling tower approach temperature, chiller power draw and total system efficiency. For this reason, it is incapable of evaluating how fluctuations in approach temperature affect system optimization under fixed cooling load conditions.
To overcome the aforementioned drawback, this study adopts 21,369 groups of verified datasets derived from standardized performance tables released by the Cooling Technology Institute. Gradient boosting regressor is developed using 200 decision tree estimators, a 0.1 learning rate and a maximum tree depth of 4. Previous research [
19] has verified the outstanding prediction precision of this model. Most importantly, the model can precisely quantify how cooling tower approach temperature affects overall system efficiency, which remedies the critical defect inherent to the conventional Braun model.
Cooling tower energy use is computed as presented below [
19]:
where C represents a dimensionless conversion coefficient that unifies the units of performance coefficient and energy-related parameters, C = 0.871.
ECrated denotes cooling tower rated energy consumption.
η is efficiency under current operating conditions.
η0 is the performance coefficient under base operating conditions.
Qactual is the cooling tower’s actual water flow, m3/h.
Qrated is the cooling tower’s rated water flow, m3/h.
3. Refrigerant Plant Retrofit Scheme Comparison
Based on the operational status of this refrigeration plant, the specific renovation contents of this project include demand-driven replacement of chillers and cooling towers, variable-frequency upgrading of pumps, and the addition of energy-efficiency metering and intelligent group control systems, which are detailed as follows.
For the retrofitting of cooling towers, the specific implementation measures are outlined as follows. All aged cooling towers are dismantled and replaced with ten cooling towers with a rated flow rate of 500 m3/h. Meanwhile, the original rusted steel foundations are removed, and matching steel support platforms together with grating maintenance treads are newly constructed. The electric inlet valves and manual maintenance valves matched to each cooling tower are replaced to eliminate pipeline water mixing. Variable-frequency fans are adopted for all cooling towers to realize low-frequency variable-flow operation under the parallel connection of multiple towers and reduce fans’ energy consumption. The ventilation structure of tower bodies is optimized to widen the air intake width and mitigate the adverse effect of hot air recirculation.
The water system retrofitting includes two measures: installing variable-frequency controllers for primary chilled-water pumps and all cooling-water pumps to realize dynamic flow regulation under real-time terminal loads, and renewing chiller inlet/outlet valves together with piping layout optimization. These modifications eliminate local resistance and water mixing, optimize pipe network hydraulic performance, and enhance the overall conveying efficiency of the water system.
For the renovation of energy-efficiency metering and intelligent group control systems, the specific transformation scheme is composed of four parts. Firstly, a brand-new automatic control platform for the refrigeration plant is constructed, together with the deployment of upper computer monitoring workstations, industrial switches and dedicated operation and maintenance management software. Secondly, high-precision measuring points for temperature, pressure and flow rate are arranged in the refrigerant plant, while intelligent electricity meters for individual equipment, cold metering modules and intelligent gateways for data acquisition are additionally installed. Thirdly, customized artificial intelligence optimal regulation algorithms are compiled. With boundary parameters including ambient-air dry-bulb and wet-bulb temperature as well as instantaneous building cooling loads adopted as inputs, the algorithm can automatically regulate the chillers’ operating quantity, chilled-water supply set-point temperature, cooling-water circulating flow rate and cooling tower fans’ operating frequency, thereby realizing fully automatic unattended operation of the refrigeration plant. Fourthly, analytical modules covering energy consumption heat balance verification, monthly intelligent diagnosis of unit energy efficiency and time-series prediction of cooling/heating loads are integrated into the system, which provides credible data support for refined optimization of daily operation and maintenance as well as energy-saving management of the whole system.
For chiller retrofitting, the implemented works are summarized as follows. According to the operational time distribution of cooling loads (
Figure 4), operating hours under 400 RT account for 5.39% of the yearly operation duration, while 800–1200 RT and 2400–3600 RT load ranges correspond to 25.07% and approximately 45% of the total annual runtime, respectively. Thus, the original chiller configuration scheme consisting of two 1752 RT CSD chillers plus two 600 RT CSD chillers is technically reasonable, and it is unnecessary to incorporate an additional 180 RT chiller. The chiller retrofitting in this project is implemented in accordance with the following principles. Large-capacity constant-speed chillers with favorable operating conditions are retained for continued service, while severely aged units with poor energy efficiency are eliminated and replaced. Meanwhile, variable-frequency centrifugal chillers are additionally configured to enable the refrigeration system to operate efficiently and stably across the full load range throughout the whole year. Considering the capital cost of chiller replacement, three retrofitting schemes are proposed, as summarized in
Table 2, including replacing one large-capacity chiller together with two small-capacity chillers, replacing one large and one small chiller, and replacing two small-capacity chillers. As stipulated in T/CRAAS 1039-2023 [
21], annual energy-efficiency thresholds for a refrigeration plant with cooling capacity above 1758 kW located in Guangzhou are 4.3 for Grade III, 4.7 for Grade II, 5.0 for Grade I, and 5.2 for the top-runner tier, respectively. The higher the annual average energy efficiency of chillers post retrofit, the better the overall implementation effect of the transformation.
It should be noted that the above-mentioned refrigeration plant retrofit schemes, covering cooling tower retrofits, water system retrofits, metering and intelligent group control platform deployment, and chiller retrofit selection, represent an engineering application case of the integrated retrofit framework proposed herein. This study is not confined to simulation comparisons of these schemes, and further includes subsequent engineering implementation and on-site measurement and verification.
Based on the energy-saving calculation methodology for the refrigeration plants specified in ASHRAE Guideline 14-2014 [
28], this study calculates the monthly weighted-average energy consumption and total annual energy consumption of the refrigerant plant by combining the building hourly cooling load profiles and equipment-specific energy models. The fitting coefficients for each chiller and water pump energy consumption models are provided in
Table S1 and Table S2 in the Supplementary Material. Restricted by the schematic design stage conditions, actual field-measured operational data of the equipment are unavailable; thus, the coefficients of each chiller and water pump energy consumption model in this work are fitted using manufacturer sample data. The above-mentioned modeling approach for chillers, water pumps and cooling towers has been validated in other practical engineering projects, and its calculation accuracy can meet the requirements of engineering applications [
19,
29]. Dividing cooling load by energy consumption yields the monthly weighted-average EER and the yearly integrated system-level EER. Of note, energy consumption calculations for both the baseline and retrofit schemes utilize the same set of meteorological data (
Figure 2) and identical building cooling load profiles (
Figure 3), and adopt the same control strategies described in
Section 2.1.
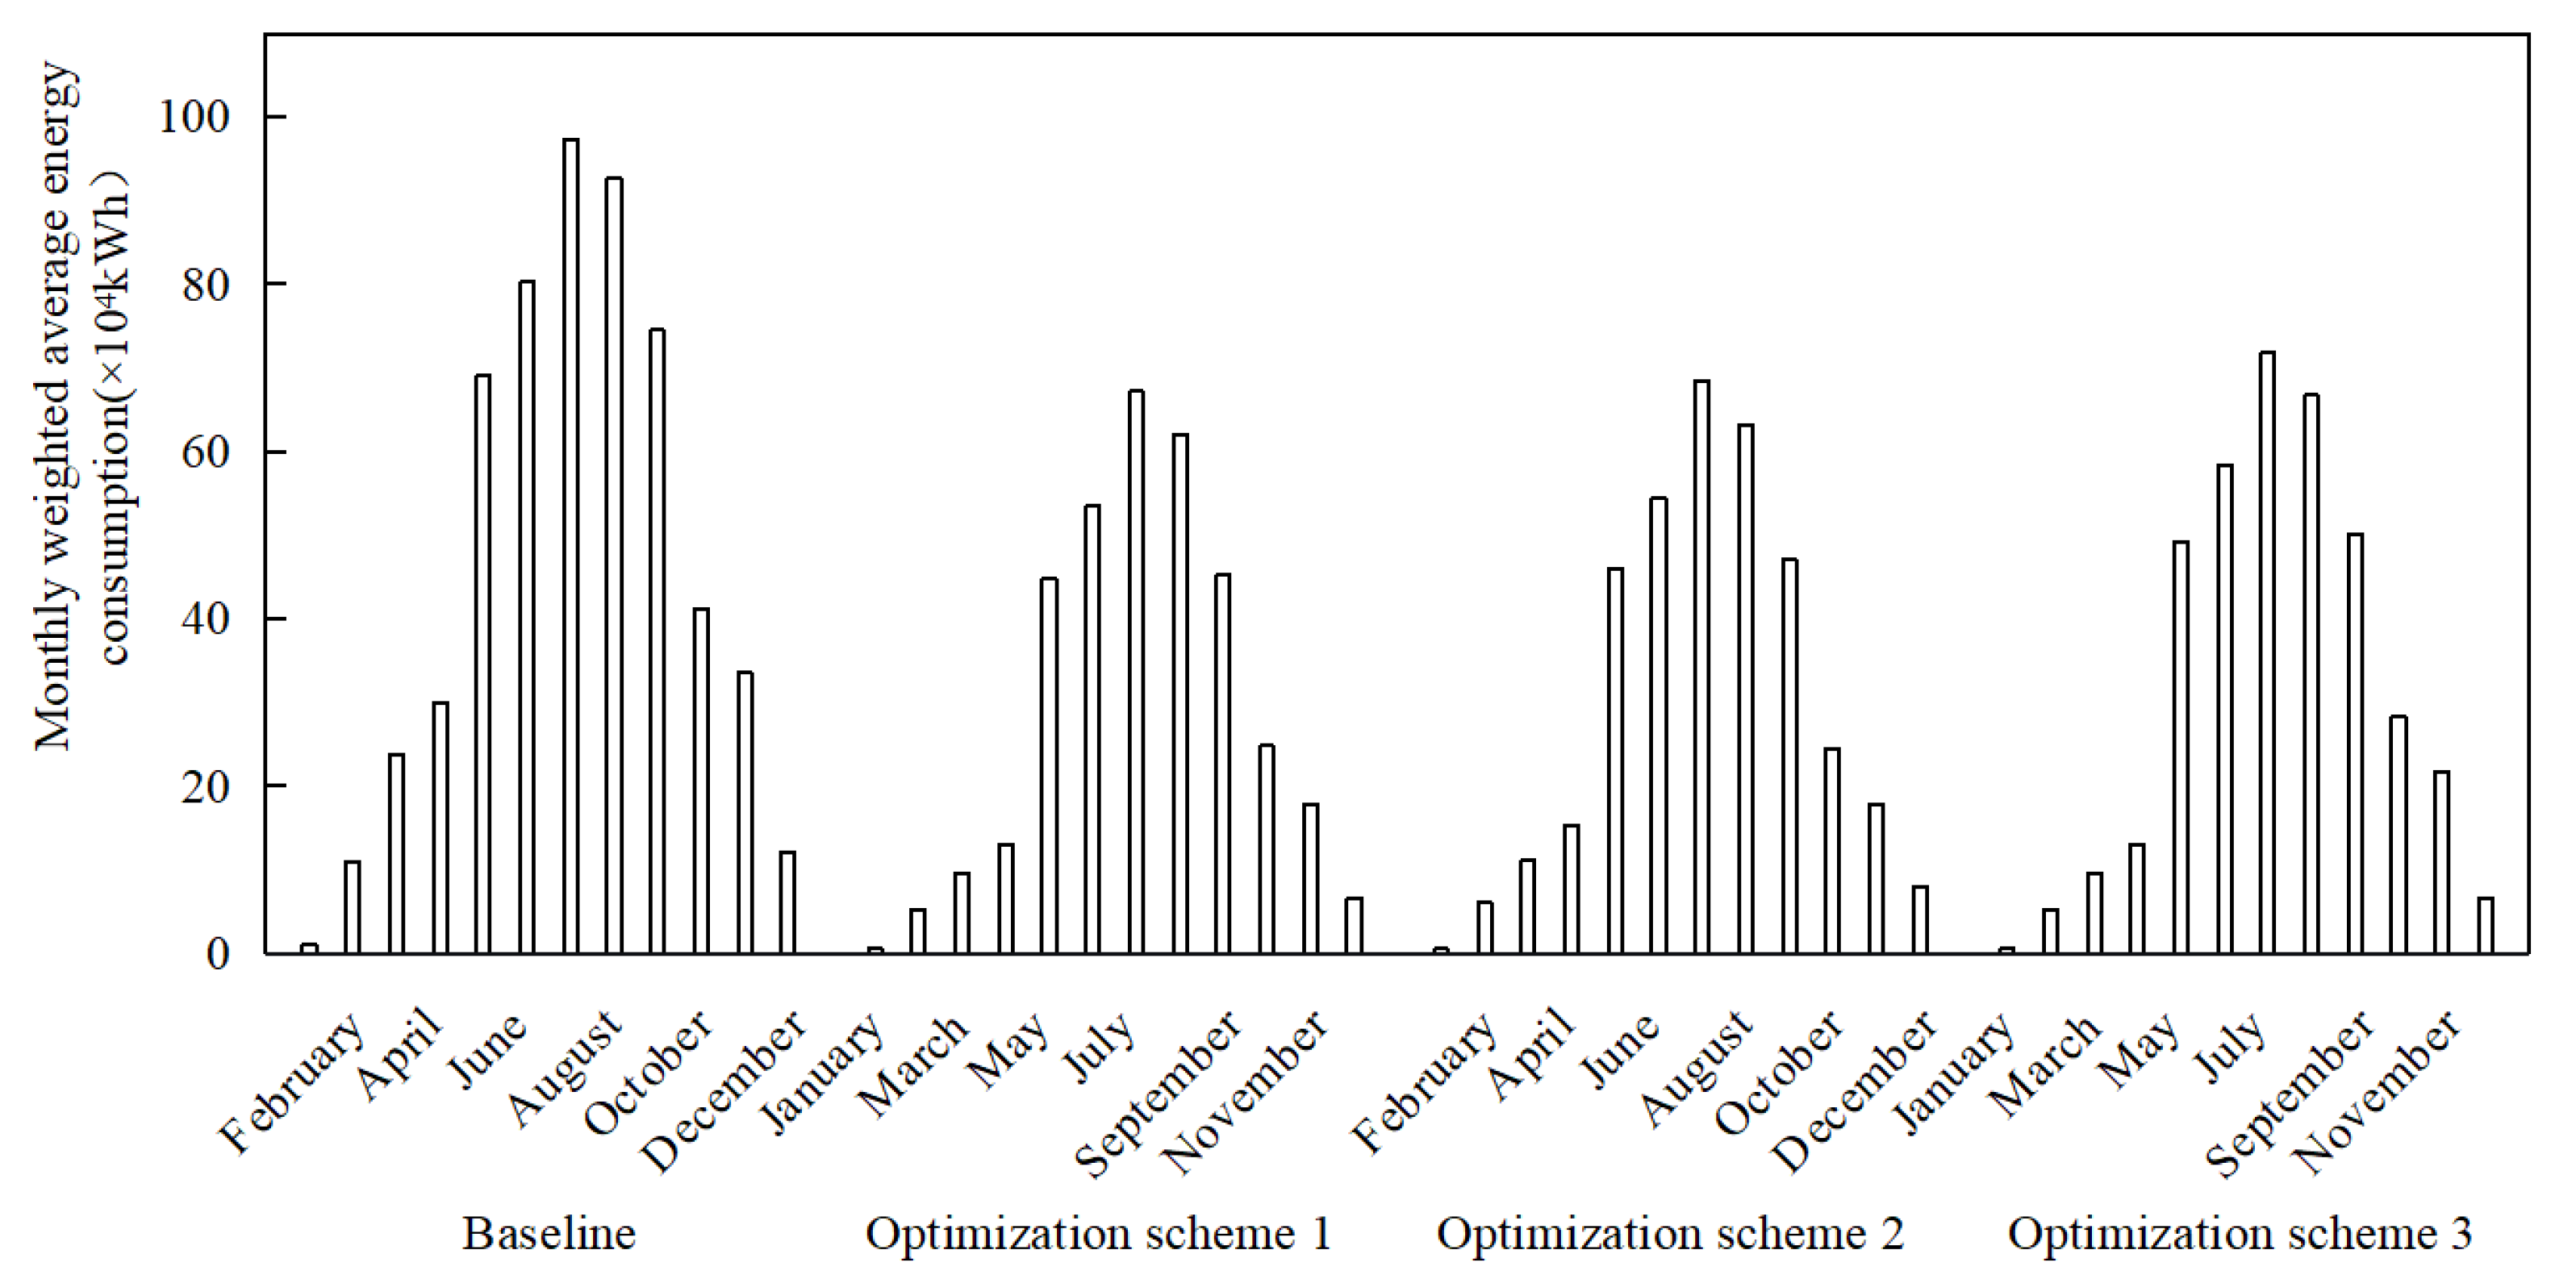
The comparison results of monthly energy consumption between the three retrofitting schemes (including chiller, cooling tower, water pump, energy-efficiency metering, and intelligent group control system innovation) and the original baseline scheme based on calculations are illustrated in
Figure 5.
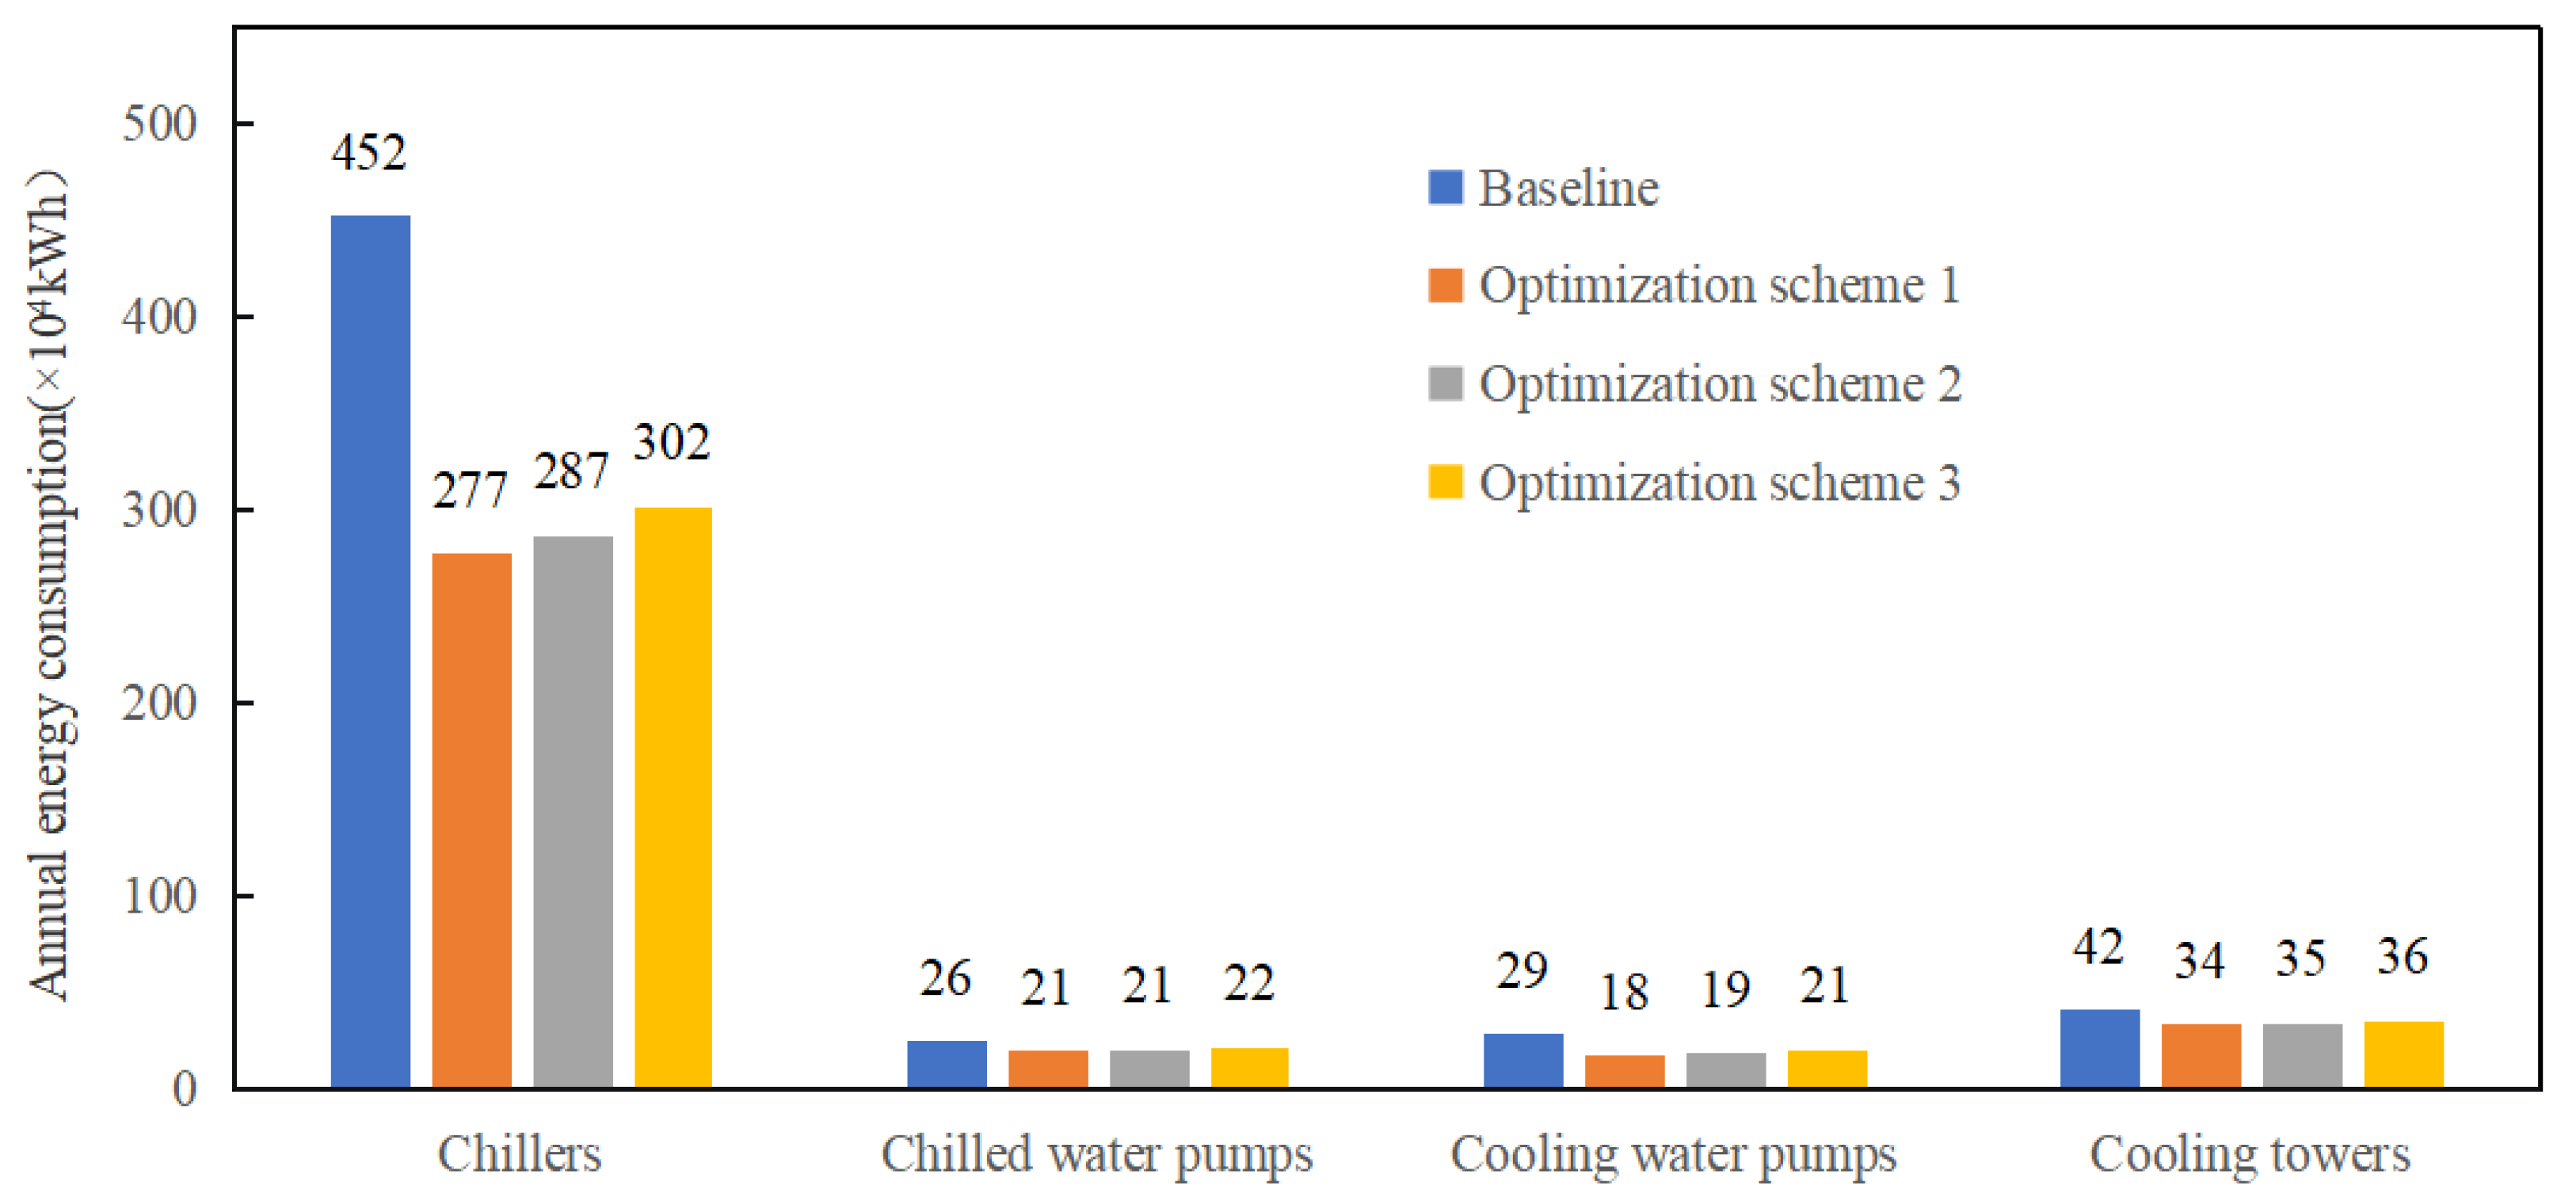
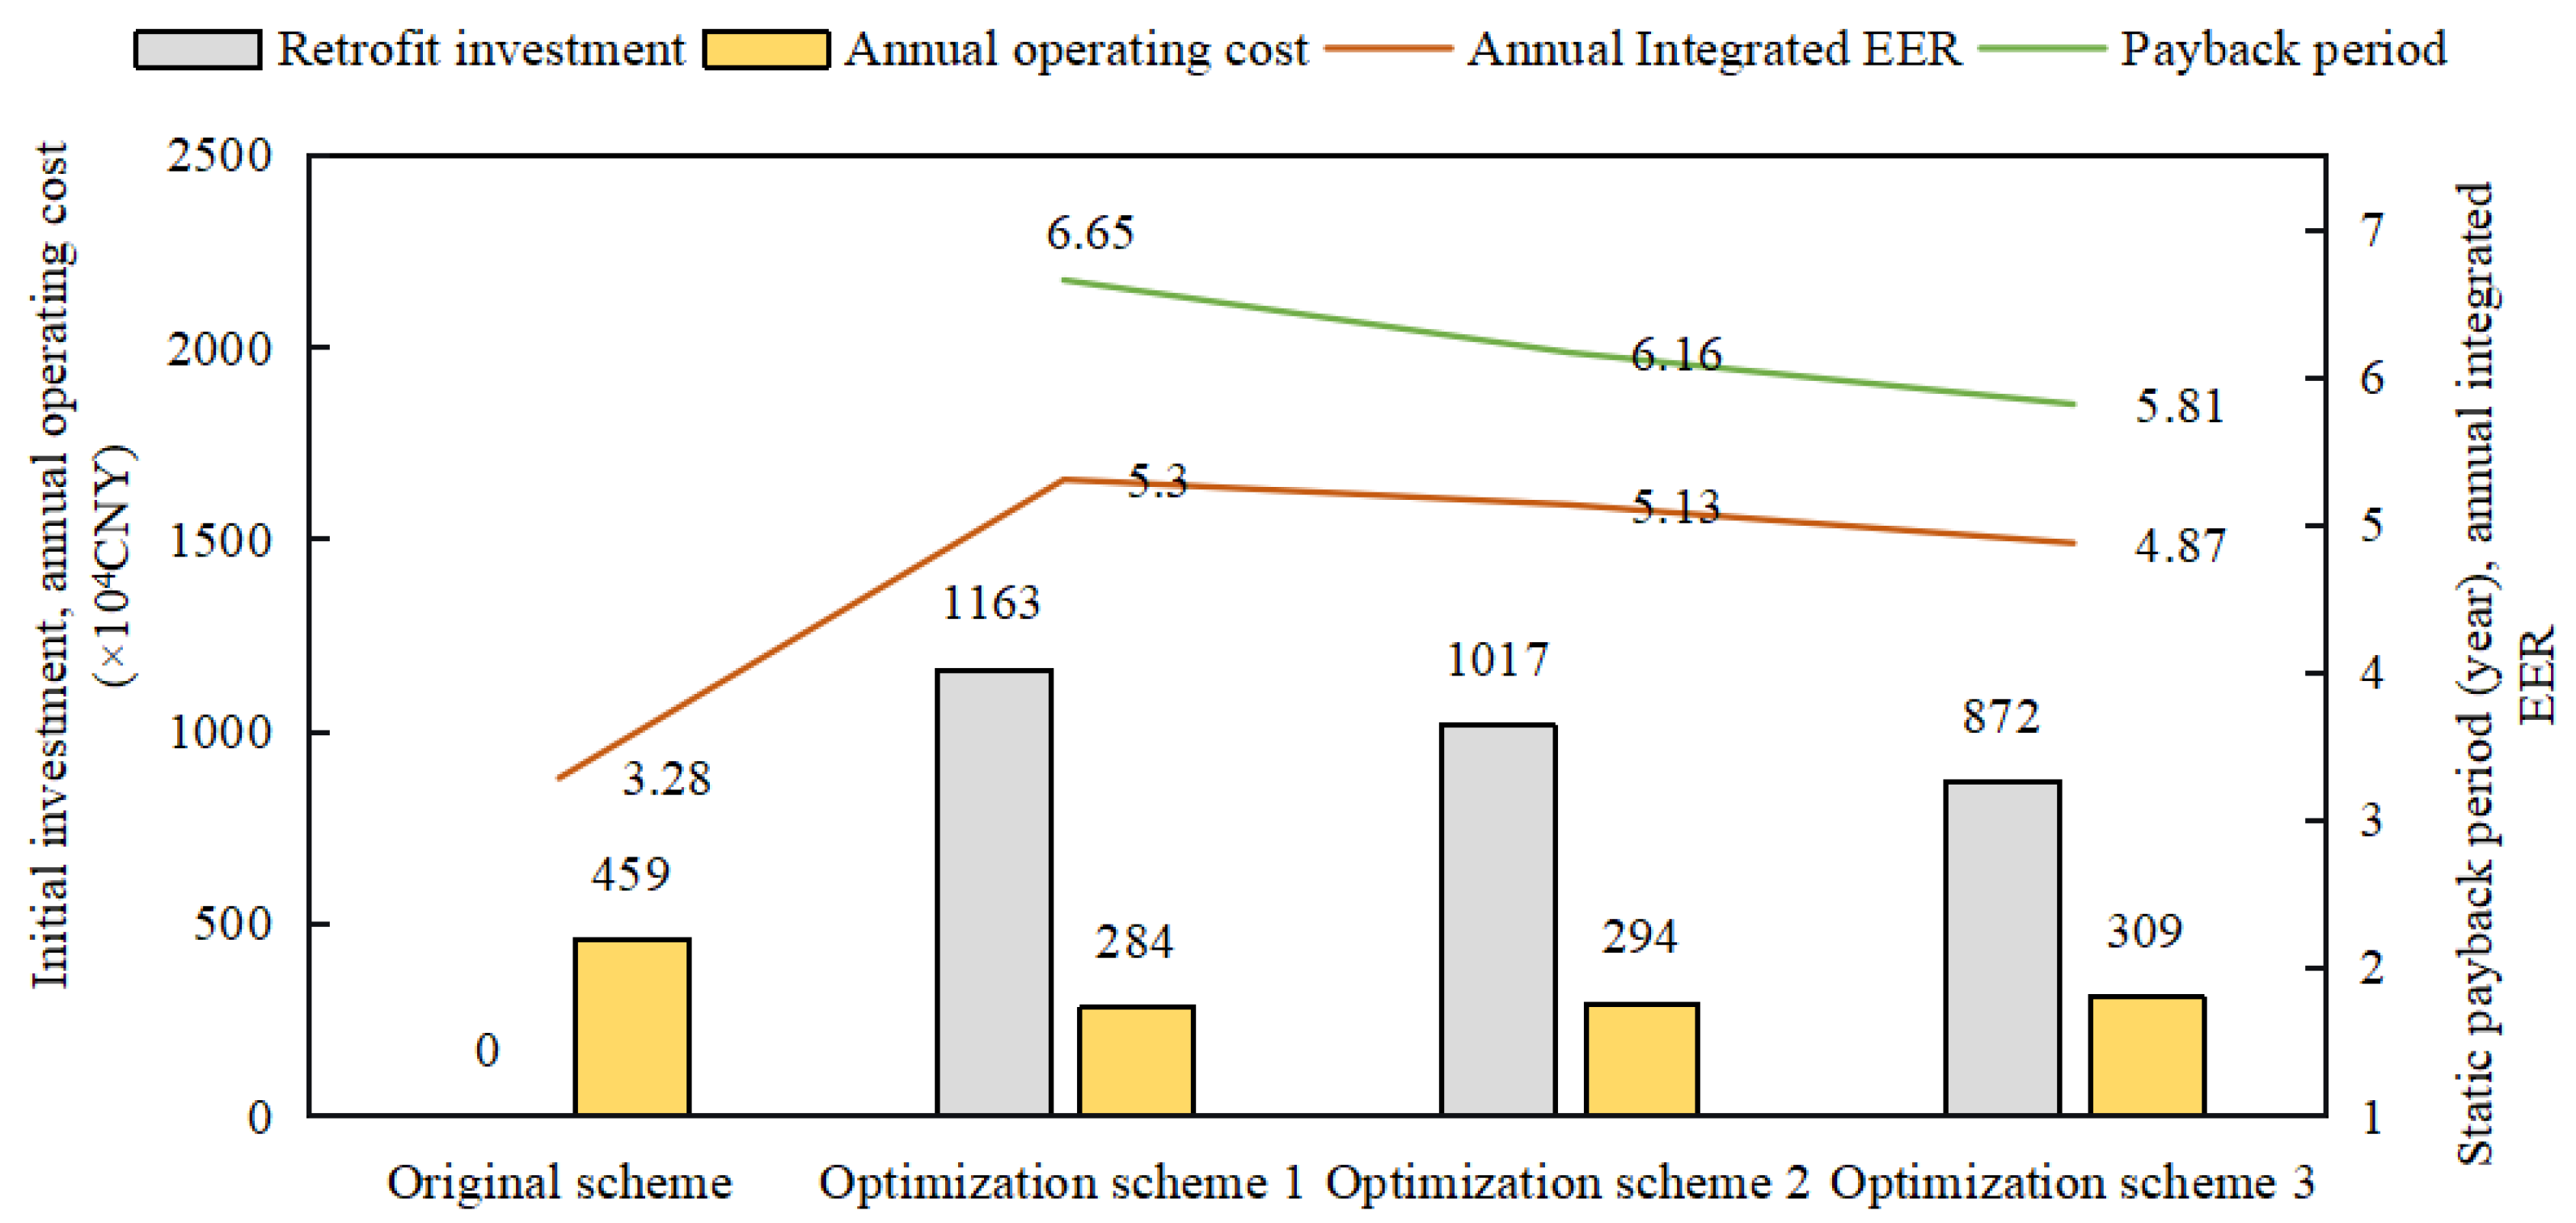
Figure 6 presents a comparison of the calculated yearly energy consumption of each unit among three retrofitting schemes and the original baseline scheme. Refrigeration plant retrofit investment is calculated by summing up the individual costs of chiller replacement, cooling tower renovation, water system upgrading, automatic control system and metering system construction. The retrofit investment, yearly operating cost, static payback period and calculated yearly integrated EER of each retrofit scheme are shown in
Figure 7.
As presented in
Figure 5, the three retrofitting schemes are effective in improving energy conservation of the refrigeration plant. Among them, Scheme 1 yields the most prominent energy-saving benefits, while markedly curbing the peak power consumption in summer. As shown in
Figure 6, compared with the original baseline scheme, Scheme 1 yields the maximum energy-saving rates of 38.7% for chillers benefiting from the high-performance chiller retrofitting scheme, 19.9% for chilled-water pumps and 38.1% for cooling-water pumps owing to the variable-frequency renovation strategy of water pumps, and 18.4% for cooling towers due to the superior cooling tower retrofitting scheme.
As shown in
Figure 7, the original baseline scheme has an annual operating cost of 4.59 million RMB and an annual integrated EER of merely 3.28, failing to satisfy the Grade III energy-efficiency limit. In contrast to the original baseline scheme, retrofit Scheme 1 achieves an annual integrated EER of 5.3, which complies with the top-runner tier requirement; retrofit Scheme 2 delivers an annual integrated EER of 5.13, conforming to the Grade I energy-efficiency standard; retrofit Scheme 3 obtains an annual integrated EER of 4.87 and meets the Grade II energy-efficiency threshold. In addition, retrofit Scheme 1 requires an initial investment of 11.63 million RMB, with an annual cost saving of approximately 1.75 million RMB and a static payback period of 6.65 years. By contrast, retrofit Scheme 2 demands an upfront capital cost of 10.17 million RMB and achieves an annual cost reduction of around 1.65 million RMB, corresponding to a shorter static payback period of 6.16 years. Among the three proposed retrofit schemes, Scheme 3 has the lowest investment cost and static payback period, standing at 8.72 million yuan and 5.81 years, respectively. Considering the long-term operational comprehensive returns, top-runner energy-efficiency requirement and carbon reduction demand of the project, the property owner ultimately adopted retrofit Scheme 1, despite its relatively longer static payback period. An annual integrated EER of 5.3 is obtained in this scheme to realize optimal energy conservation, and the maximum annual operating cost reduction is achieved, contributing to remarkable long-term operational revenues.
4. Empirical Outcomes and Discussion
While computation results have proved the achievable energy-saving gains of retrofit Scheme 1, field test verification of the improved system is currently inadequate. Hence, this section carries out a comprehensive performance analysis of the refrigeration plant with retrofit Scheme 1 renovation using the field operation data acquired in 2026.
4.1. Analaysis of Refrigeration Plant System’s Operational Performance
High-accuracy calibrated sensors were deployed in the on-site monitoring platform to acquire real-time operating parameters. Specifically, chilled-water and cooling-water flows were measured via electromagnetic flow sensors featuring a tolerance of ±0.5%; PT1000 thermal resistors with a precision of ±0.1 °C were responsible for monitoring supply and return water temperatures; three-phase integrated power analyzers (accuracy: ±0.5%) were used to record the energy consumption of each device. The whole set of sensing devices follows prevailing high-precision industrial specifications widely accepted in this sector, complying with the precision criteria defined for building energy measurement and online operational supervision. On the basis of the definition of EER and uncertainty-propagation law [
30], the root-sum-square (RSS) method was adopted to synthesize the relative uncertainty of EER derived from fluid flow, the supply–return water temperature difference and electric power measurement. The computational formulas for EER and its corresponding relative combined uncertainty
ur,EER are presented as follows:
where
ρ is the density of chilled water (kg/m
3);
cp is the isobaric specific-heat capacity of chilled water (kJ/(kgK));
V is the volumetric flow rate of chilled water (m3/s);
ΔT is the chilled water supply–return temperature difference (K);
W is the total electric power consumption of the refrigeration plant (kW);
ur,V, ur,∆T and ur,W represent the relative standard uncertainties of volumetric flow rate, the supply–return water temperature difference and electric power consumption, respectively (dimensionless).
Thus, the overall combined relative uncertainty of hourly EER was finally quantified as approximately 2.92%, as calculated by Equation (2). Note that this 2.92% uncertainty is valid only for hourly EER. Averaging over hourly measurement datasets can suppress random uncertainties, while systematic biases cannot be eliminated. Consequently, the overall uncertainty of daily and monthly EER will be reduced through data averaging and be smaller than 2.92%.
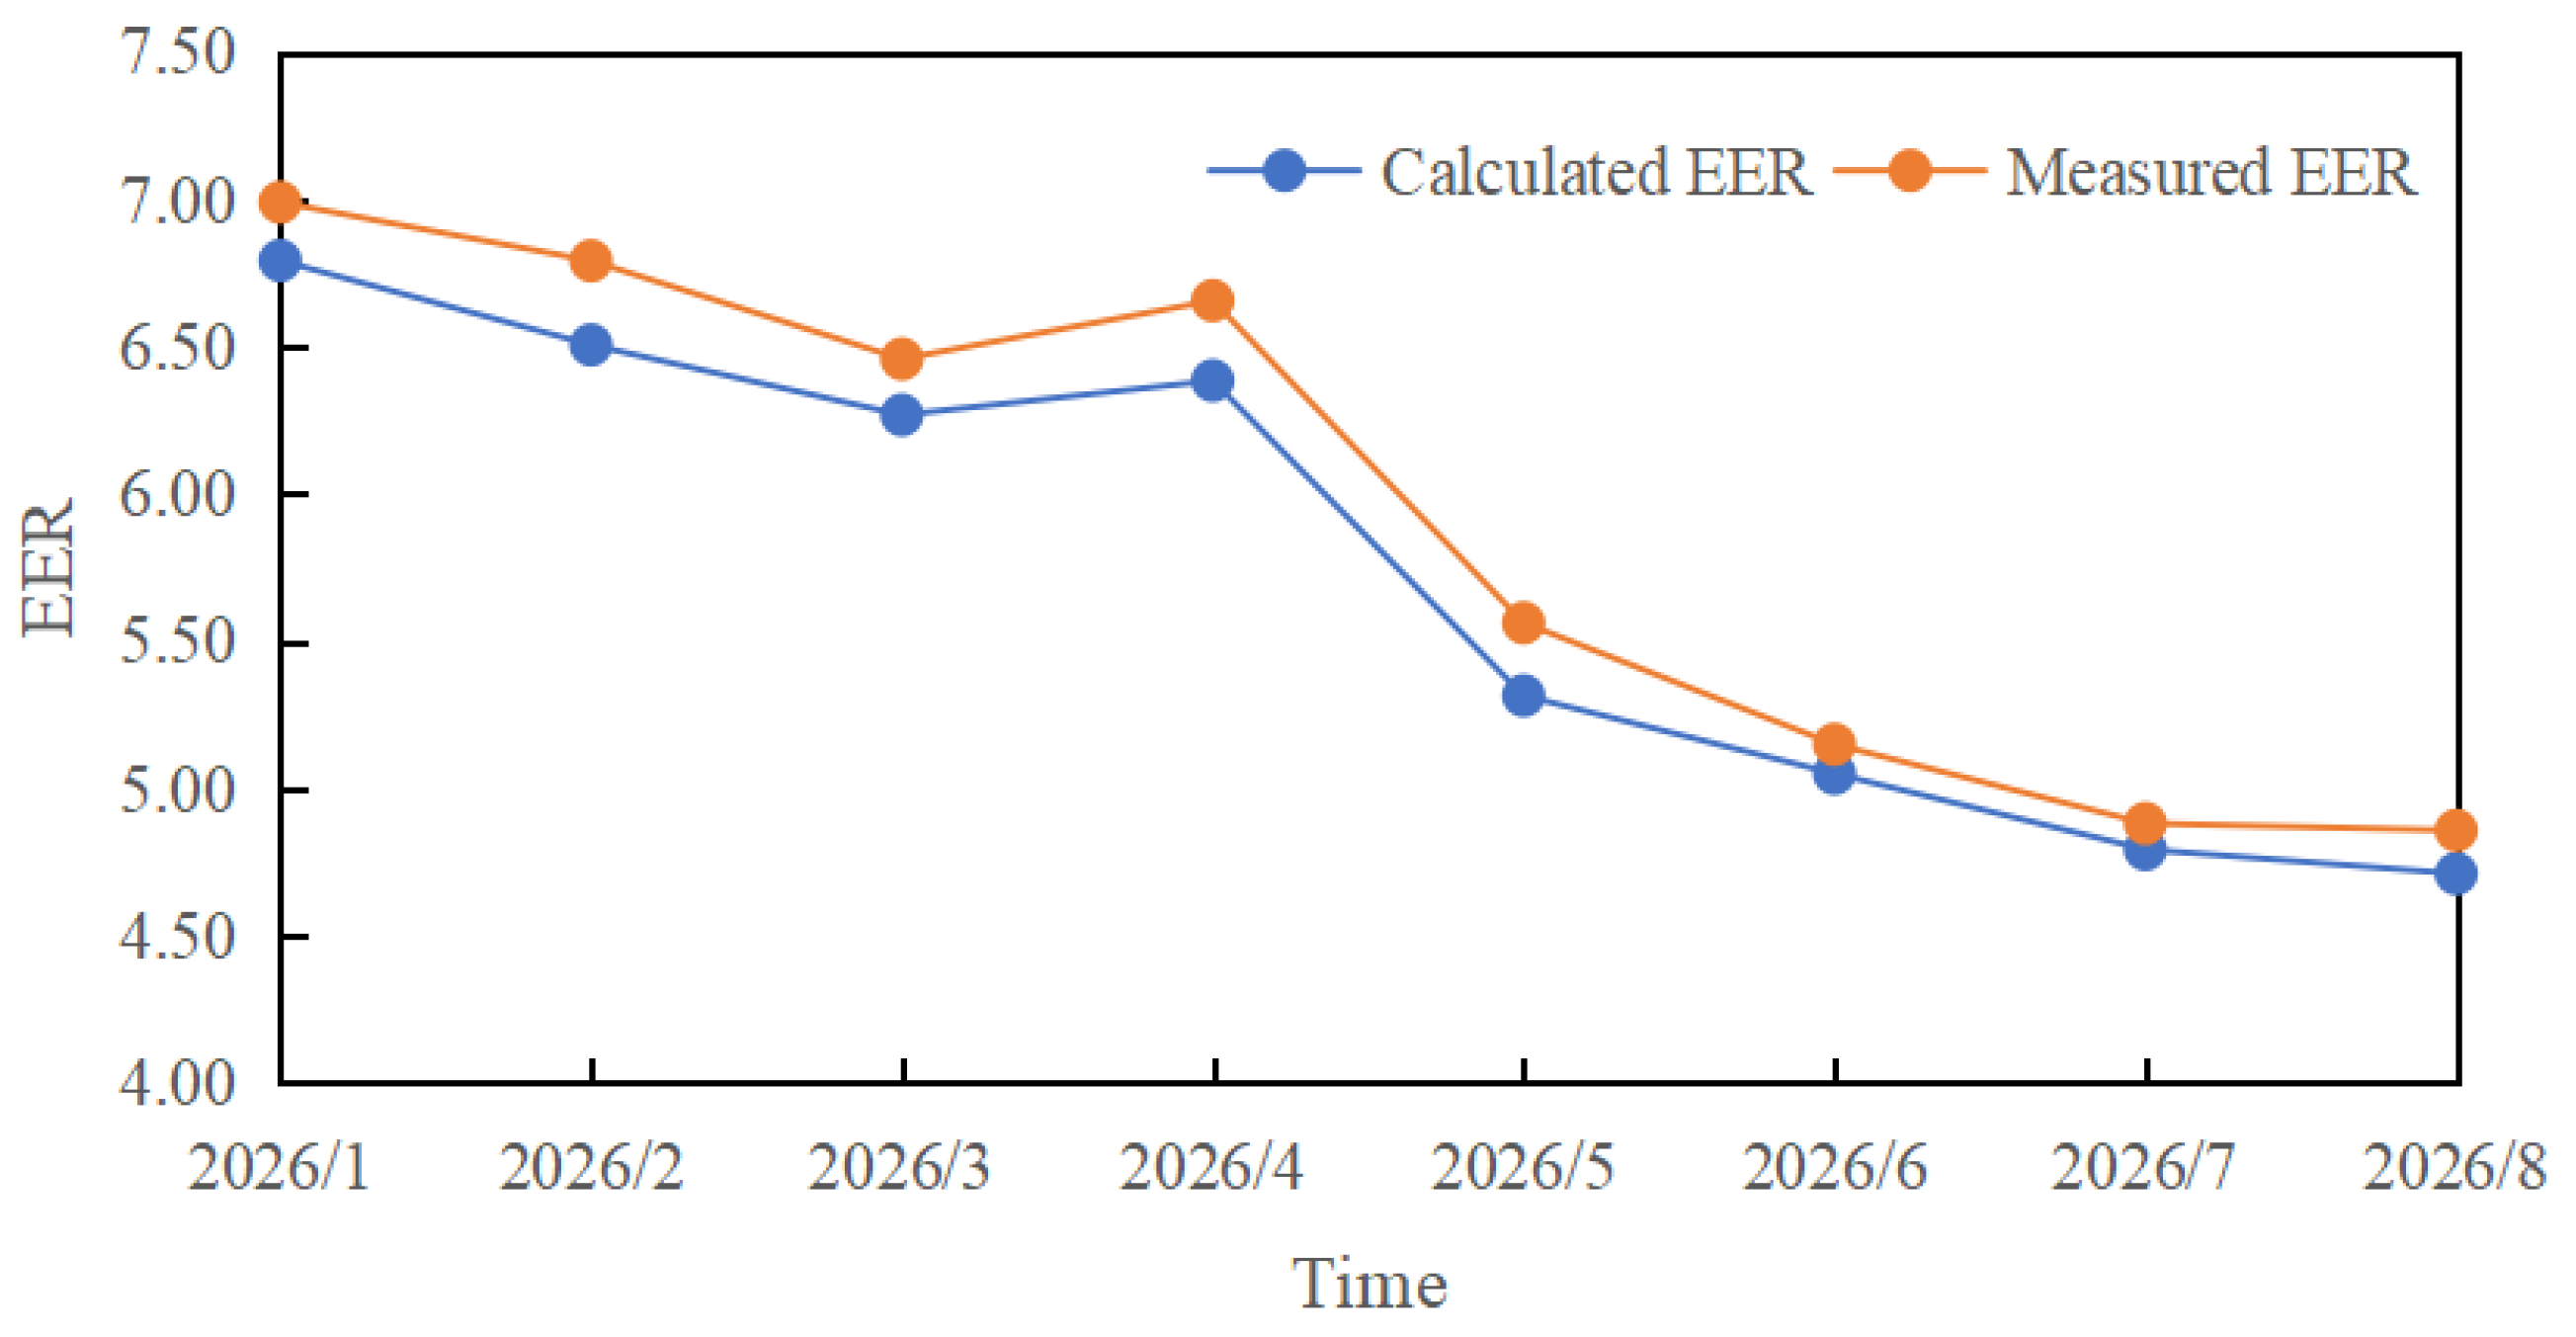
Figure 8 compares the refrigeration plant’s measured monthly EER after retrofit Scheme 1 was implemented with the theoretical monthly EER calculated by retrofit Scheme 1. It can be observed that the measured monthly EER values from January to August are slightly higher than the calculated values, with all relative errors controlled within 5%, which verifies the high accuracy of the theoretical calculation model within the January–August period. As calculated, the average integrated EER of the refrigeration plant from January to August 2026 is 5.2. Since the ambient air temperature from September to December is lower than that from May to August (
Figure 2), the building cooling load decreases accordingly (
Figure 3). Based on the characteristics of the measured monthly EER from January to August (
Figure 8), the monthly integrated EER from September to December is expected to be higher than that from May to August. At present, the integrated EER for January to August has reached 5.2. When the refrigeration plant’s EER from September to December is incorporated into calculation, the full-year (January–December) integrated EER is anticipated to exceed 5.2. It should be noted that field-measured data for September–December are not yet available, and further validation will be performed once complete full-year monitoring data are accumulated in future work.
As shown in
Figure 2, July experiences the highest ambient temperatures in Guangzhou. Accordingly, the operational data collected in July 2026 are also selected to verify the actual performance of retrofit Scheme 1. As shown in
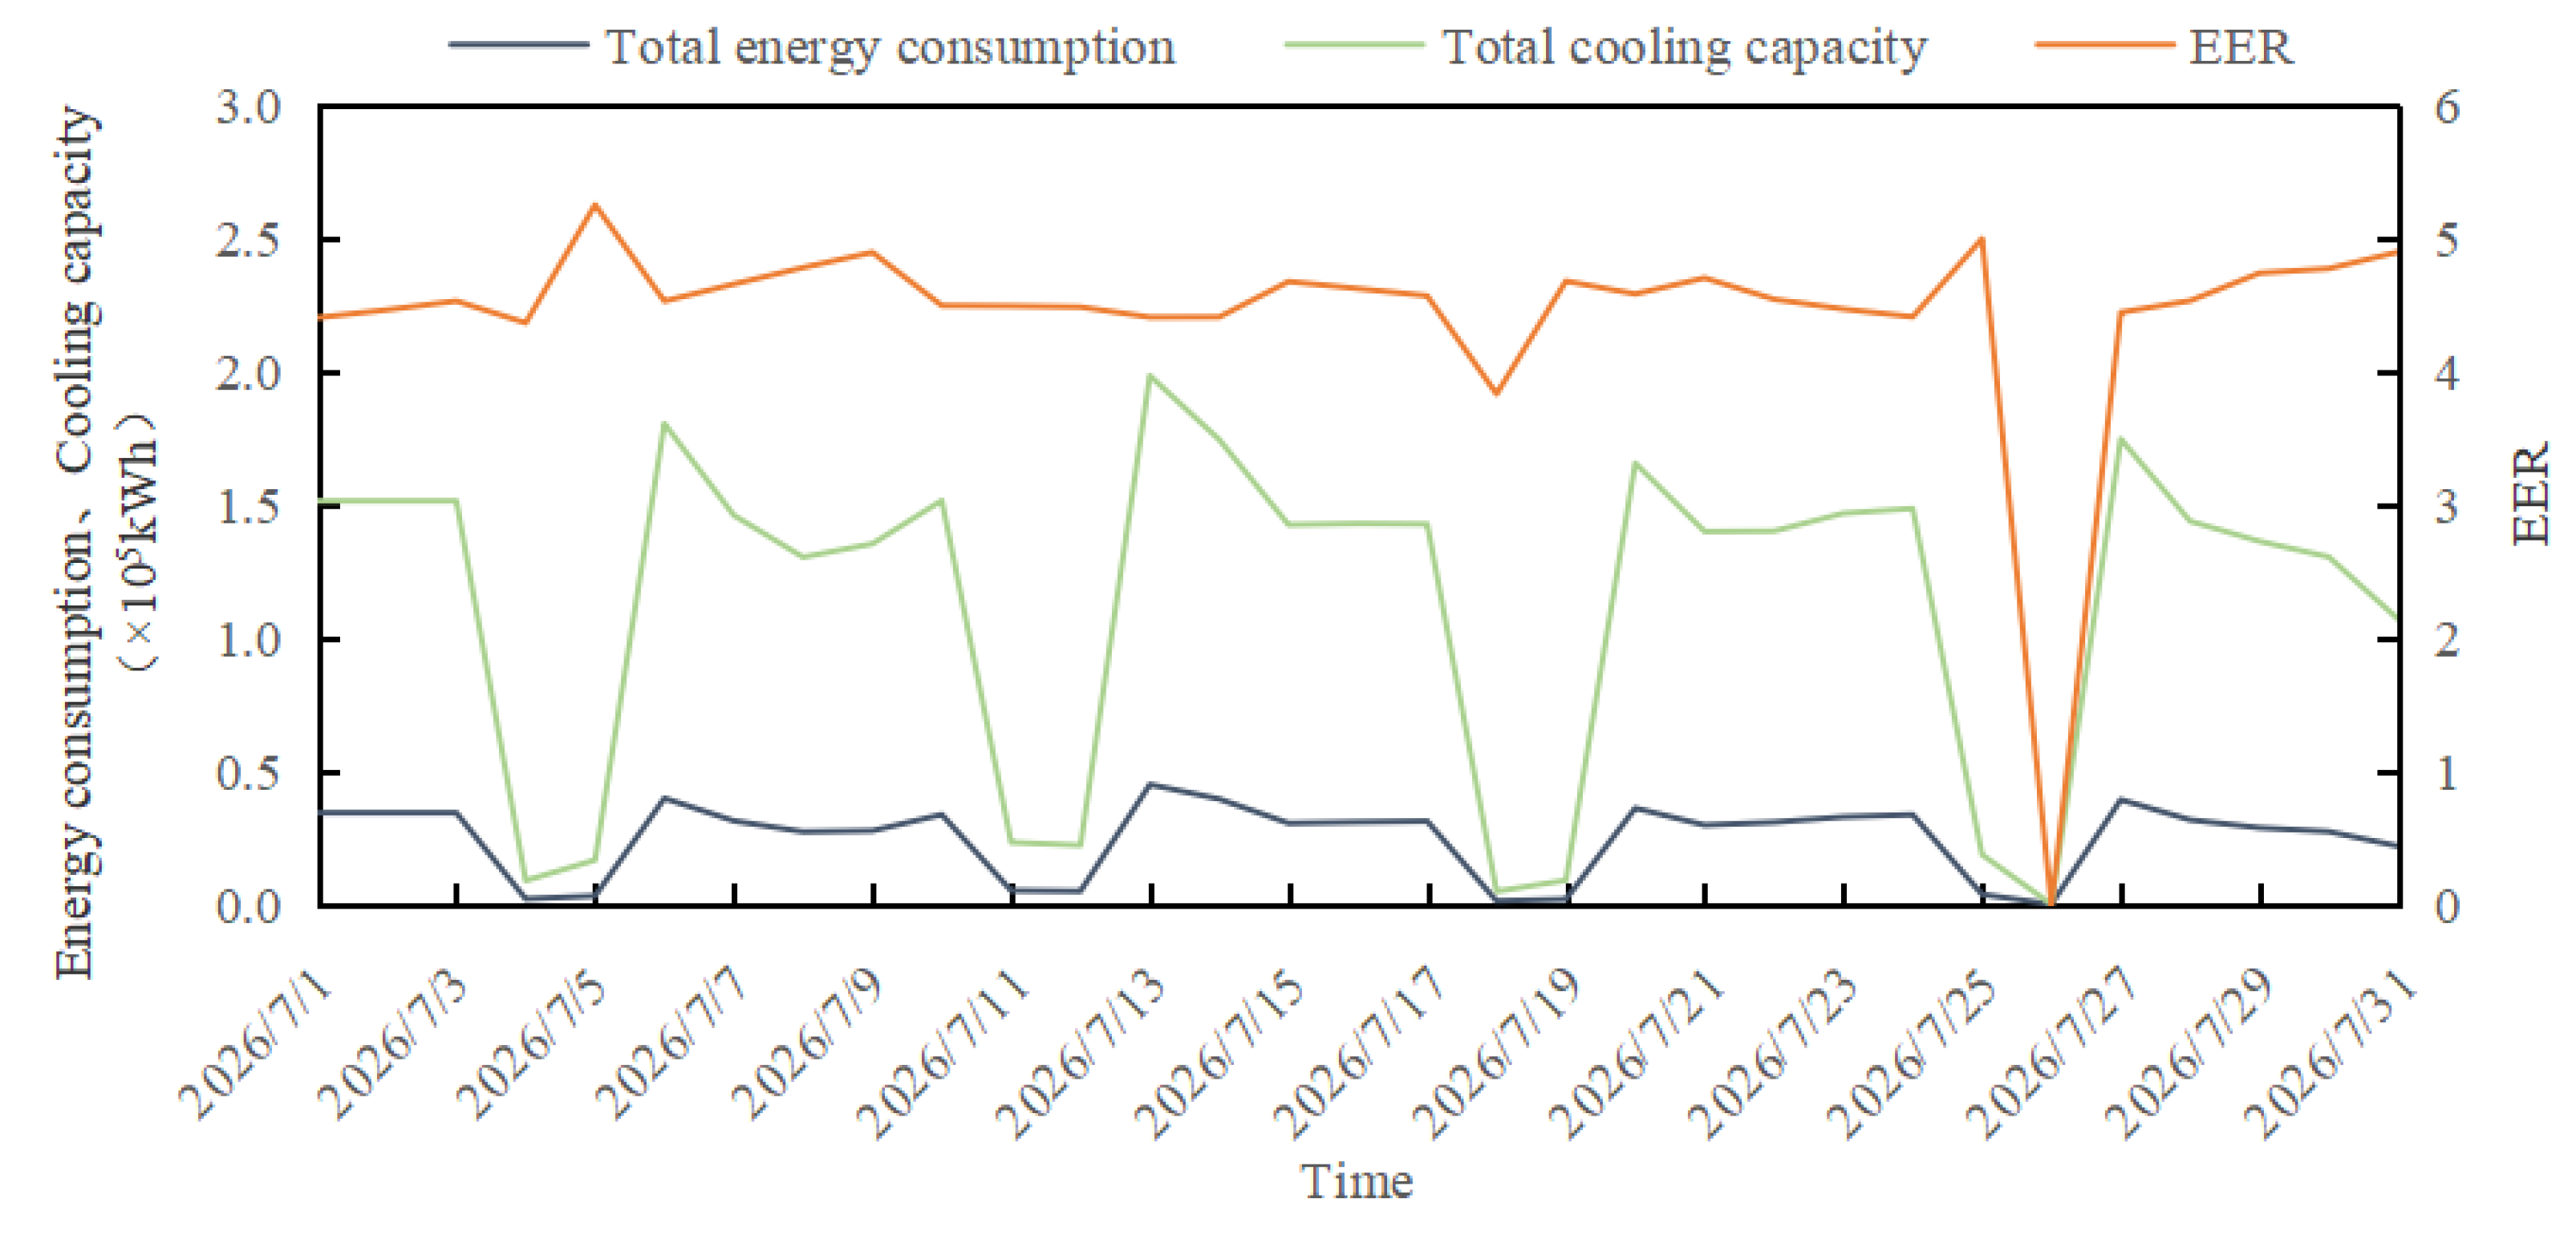
Figure 9, refrigeration plant energy consumption varies synchronously with its cooling capacity in July. The daily energy-efficiency ratio (EER) of the system is generally above 4.4, with a maximum value of 5.26. The monthly average EER in July after renovation is 4.58, which represents a 38.5% improvement compared with the pre-retrofit value of 3.31 (calculated from
Figure 3 and
Figure 5). This result fully demonstrates the prominent energy-saving benefits of retrofit Scheme 1.
4.2. Equipment Operational Performance Analysis
(1) Chiller
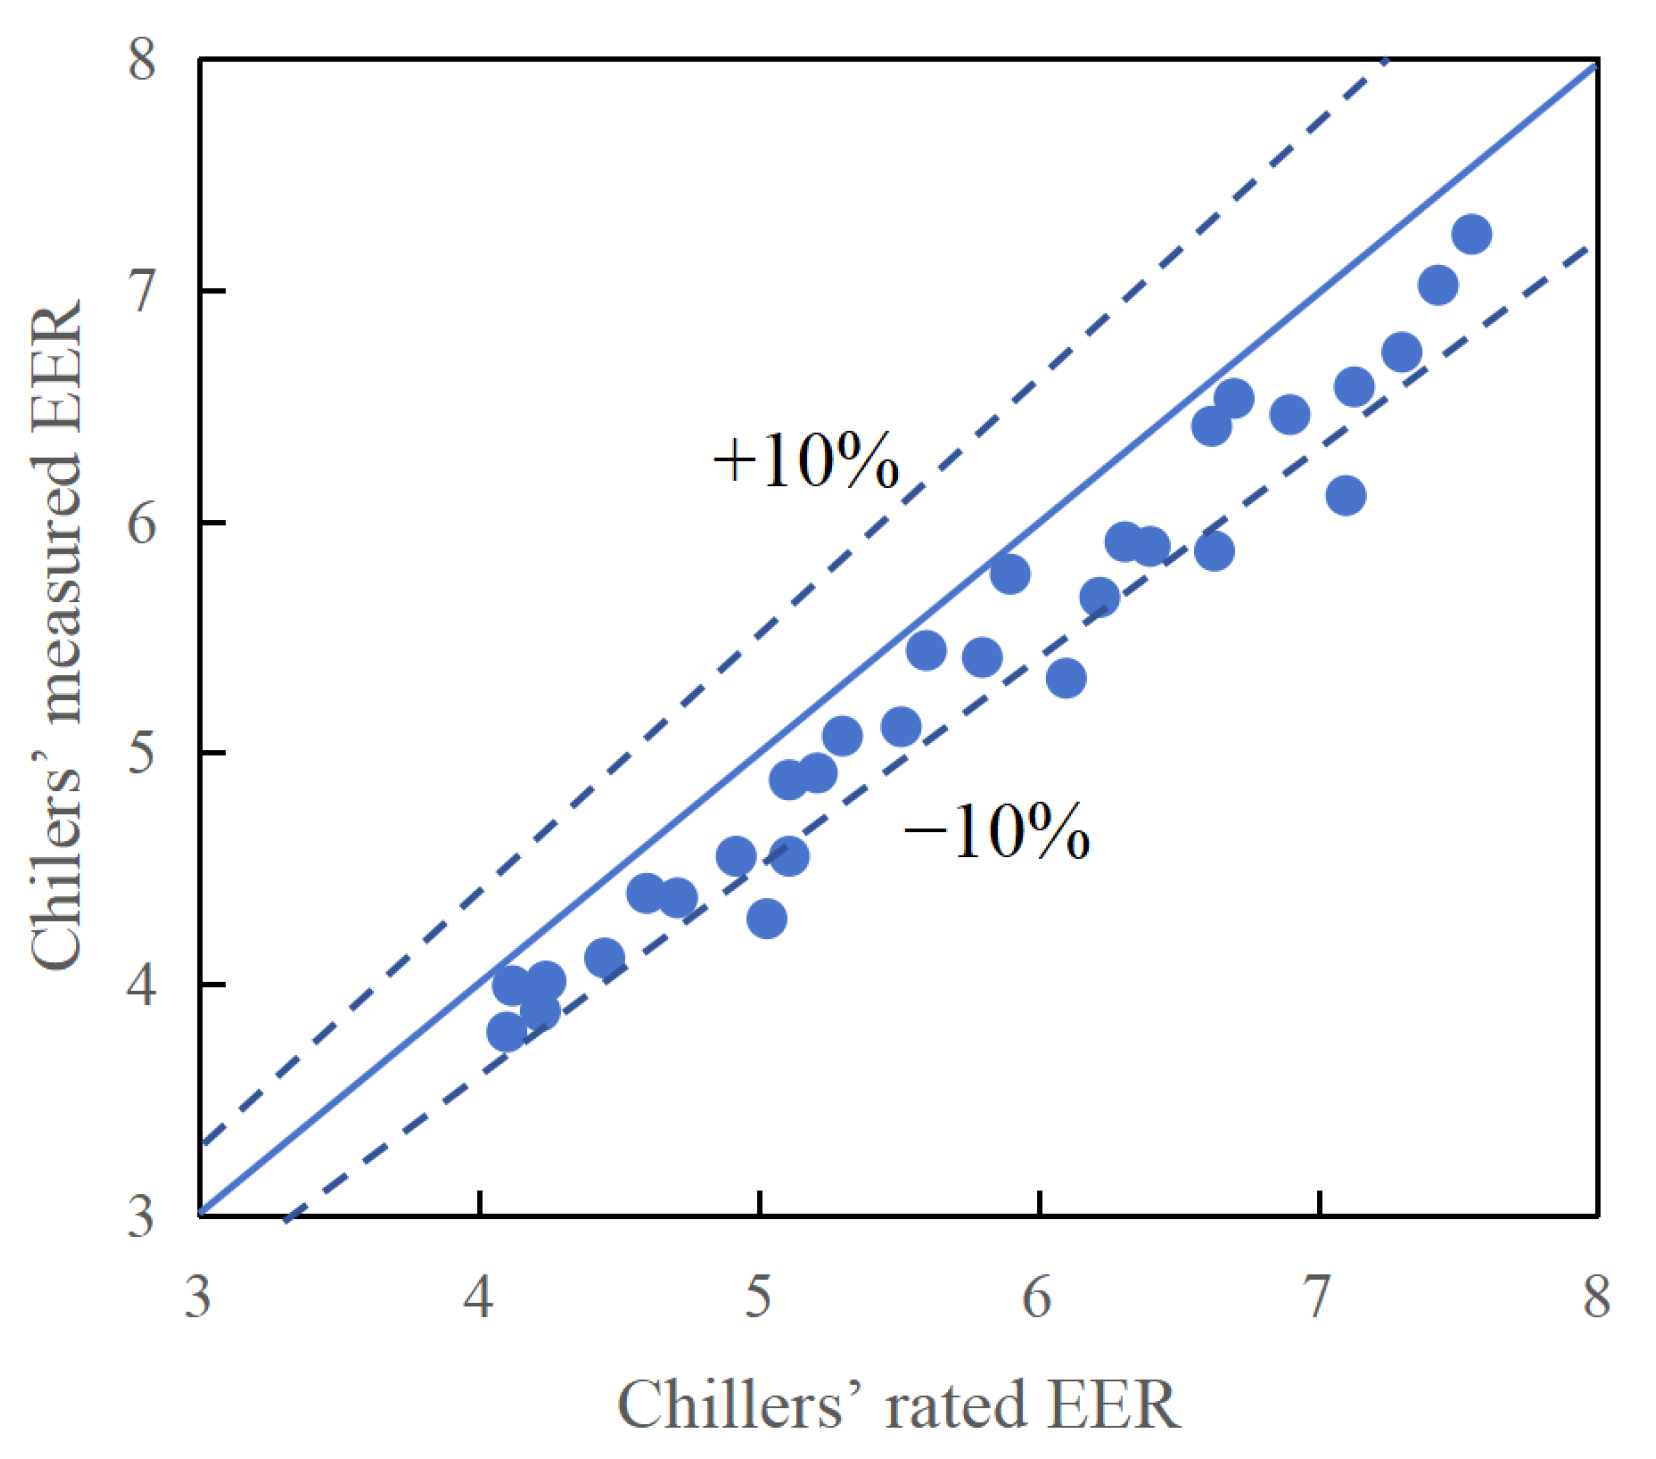
Figure 10 compares the measured EER with the rated EER of chillers after retrofitting. It can be observed that the measured EER values under practical operating conditions are lower than the rated values. The deviation is less than 10% for most working conditions, the EER of partial operating points is close to the rated index, and only a few individual conditions present a deviation ranging from 10% to 15%. In accordance with the high-efficiency operation specifications for chillers specified in ASHRAE Guideline 36-2021 [
31], a deviation of 5–15% between measured and rated EER falls within the acceptable tolerance range; a deviation below 10% indicates favorable unit performance. Thus, it is concluded that the overall operating performance of the retrofitted chillers meets the ASHRAE Guideline 36-2021 requirement and maintains a satisfactory operating state.
(2) Pump
Two characteristic parameters
μch and
μc are proposed for the performance evaluation of chilled-water pump and cooling-water pump systems separately. Specifically, higher numerical results of the two coefficients manifest better performance, and their specific calculation formulas are presented in Equations (7) and (8).
where
Q is the refrigeration plant’s refrigeration capacity (kW);
Wchwp is chilled-water pump energy consumption (kW);
Qc is cooling-water system heat rejection (kW);
Wcwp is cooling-water pump energy consumption (kW).
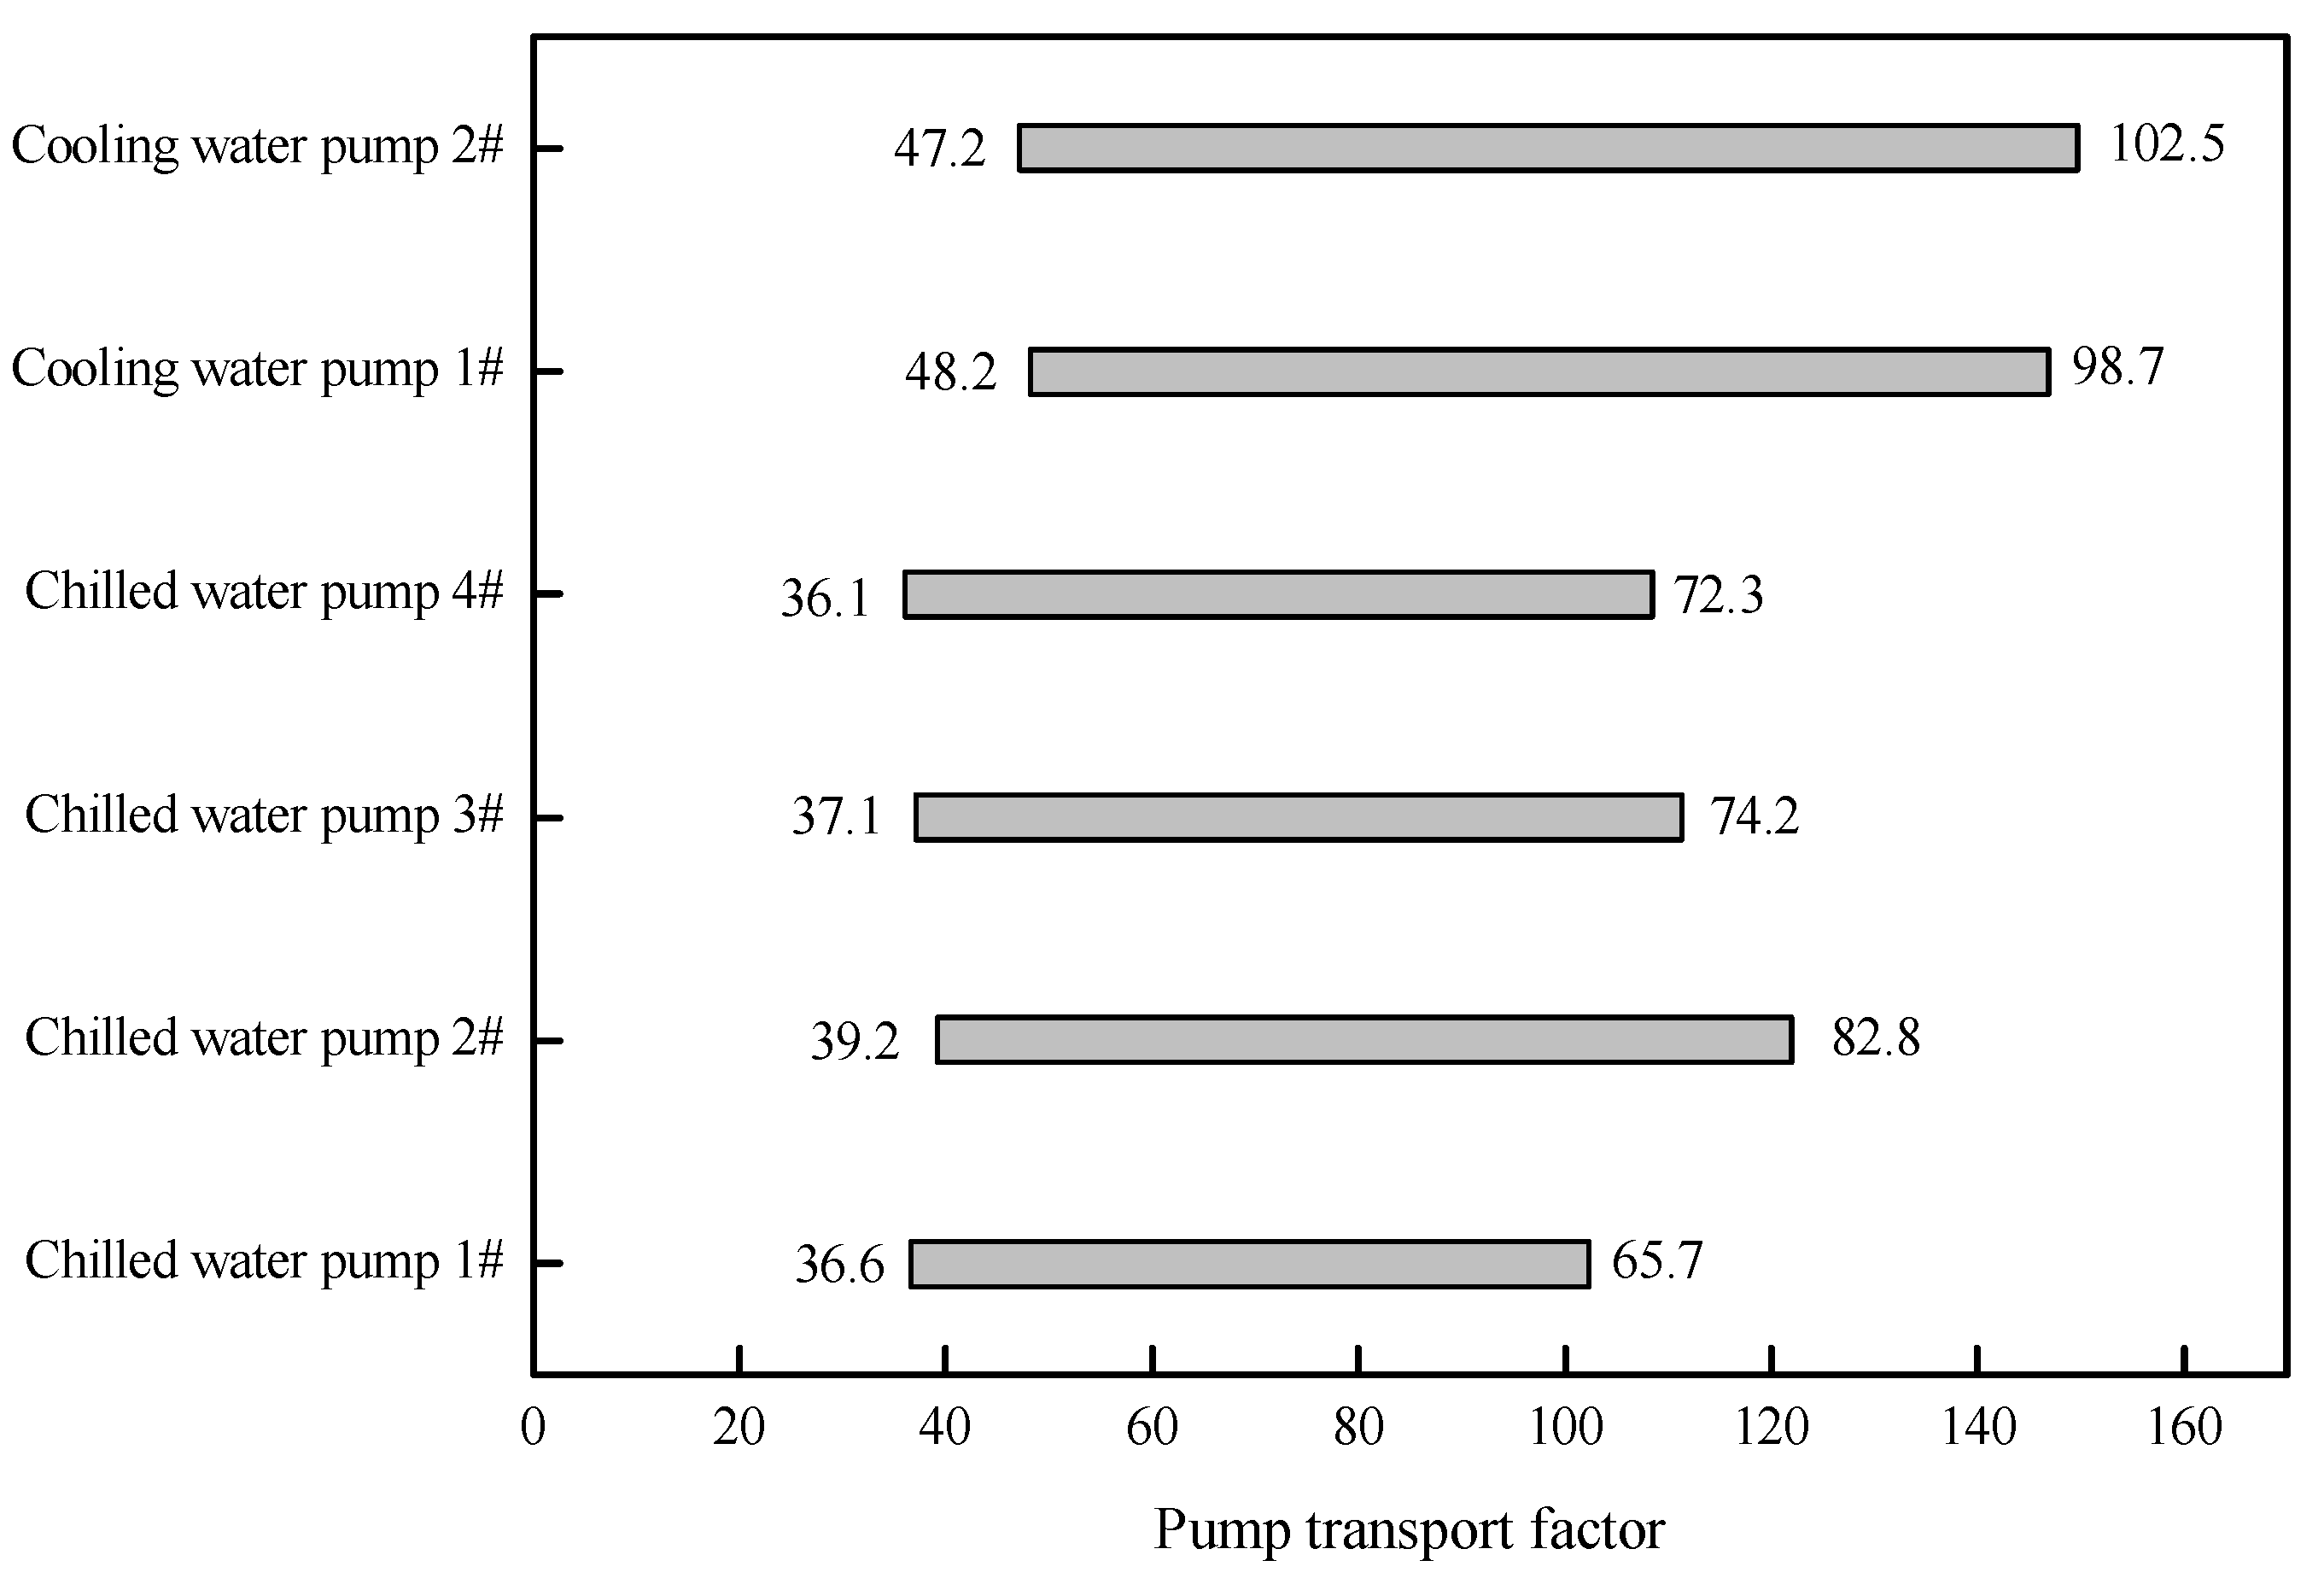
High-frequency operating data sampled from January to July 2026 were adopted to calculate the pump transport factor, as illustrated in
Figure 11. Benefiting from the variable-frequency configuration, all delivery coefficients of chilled-water pumps are above 35, while the values of cooling-water pumps surpass 45, which verifies the favorable working state of the whole pump system.
(3) Cooling tower
Two core evaluation indexes, namely the approach temperature and overall efficiency, are adopted to quantify cooling tower operation performance. The two parameters are calculated by Equations (9) and (10) in sequence.
where
Tout is the outlet water temperature of the cooling tower (°C);
Ts is the ambient wet-bulb temperature (°C);
Tin is the inlet water temperature of the cooling tower (°C).
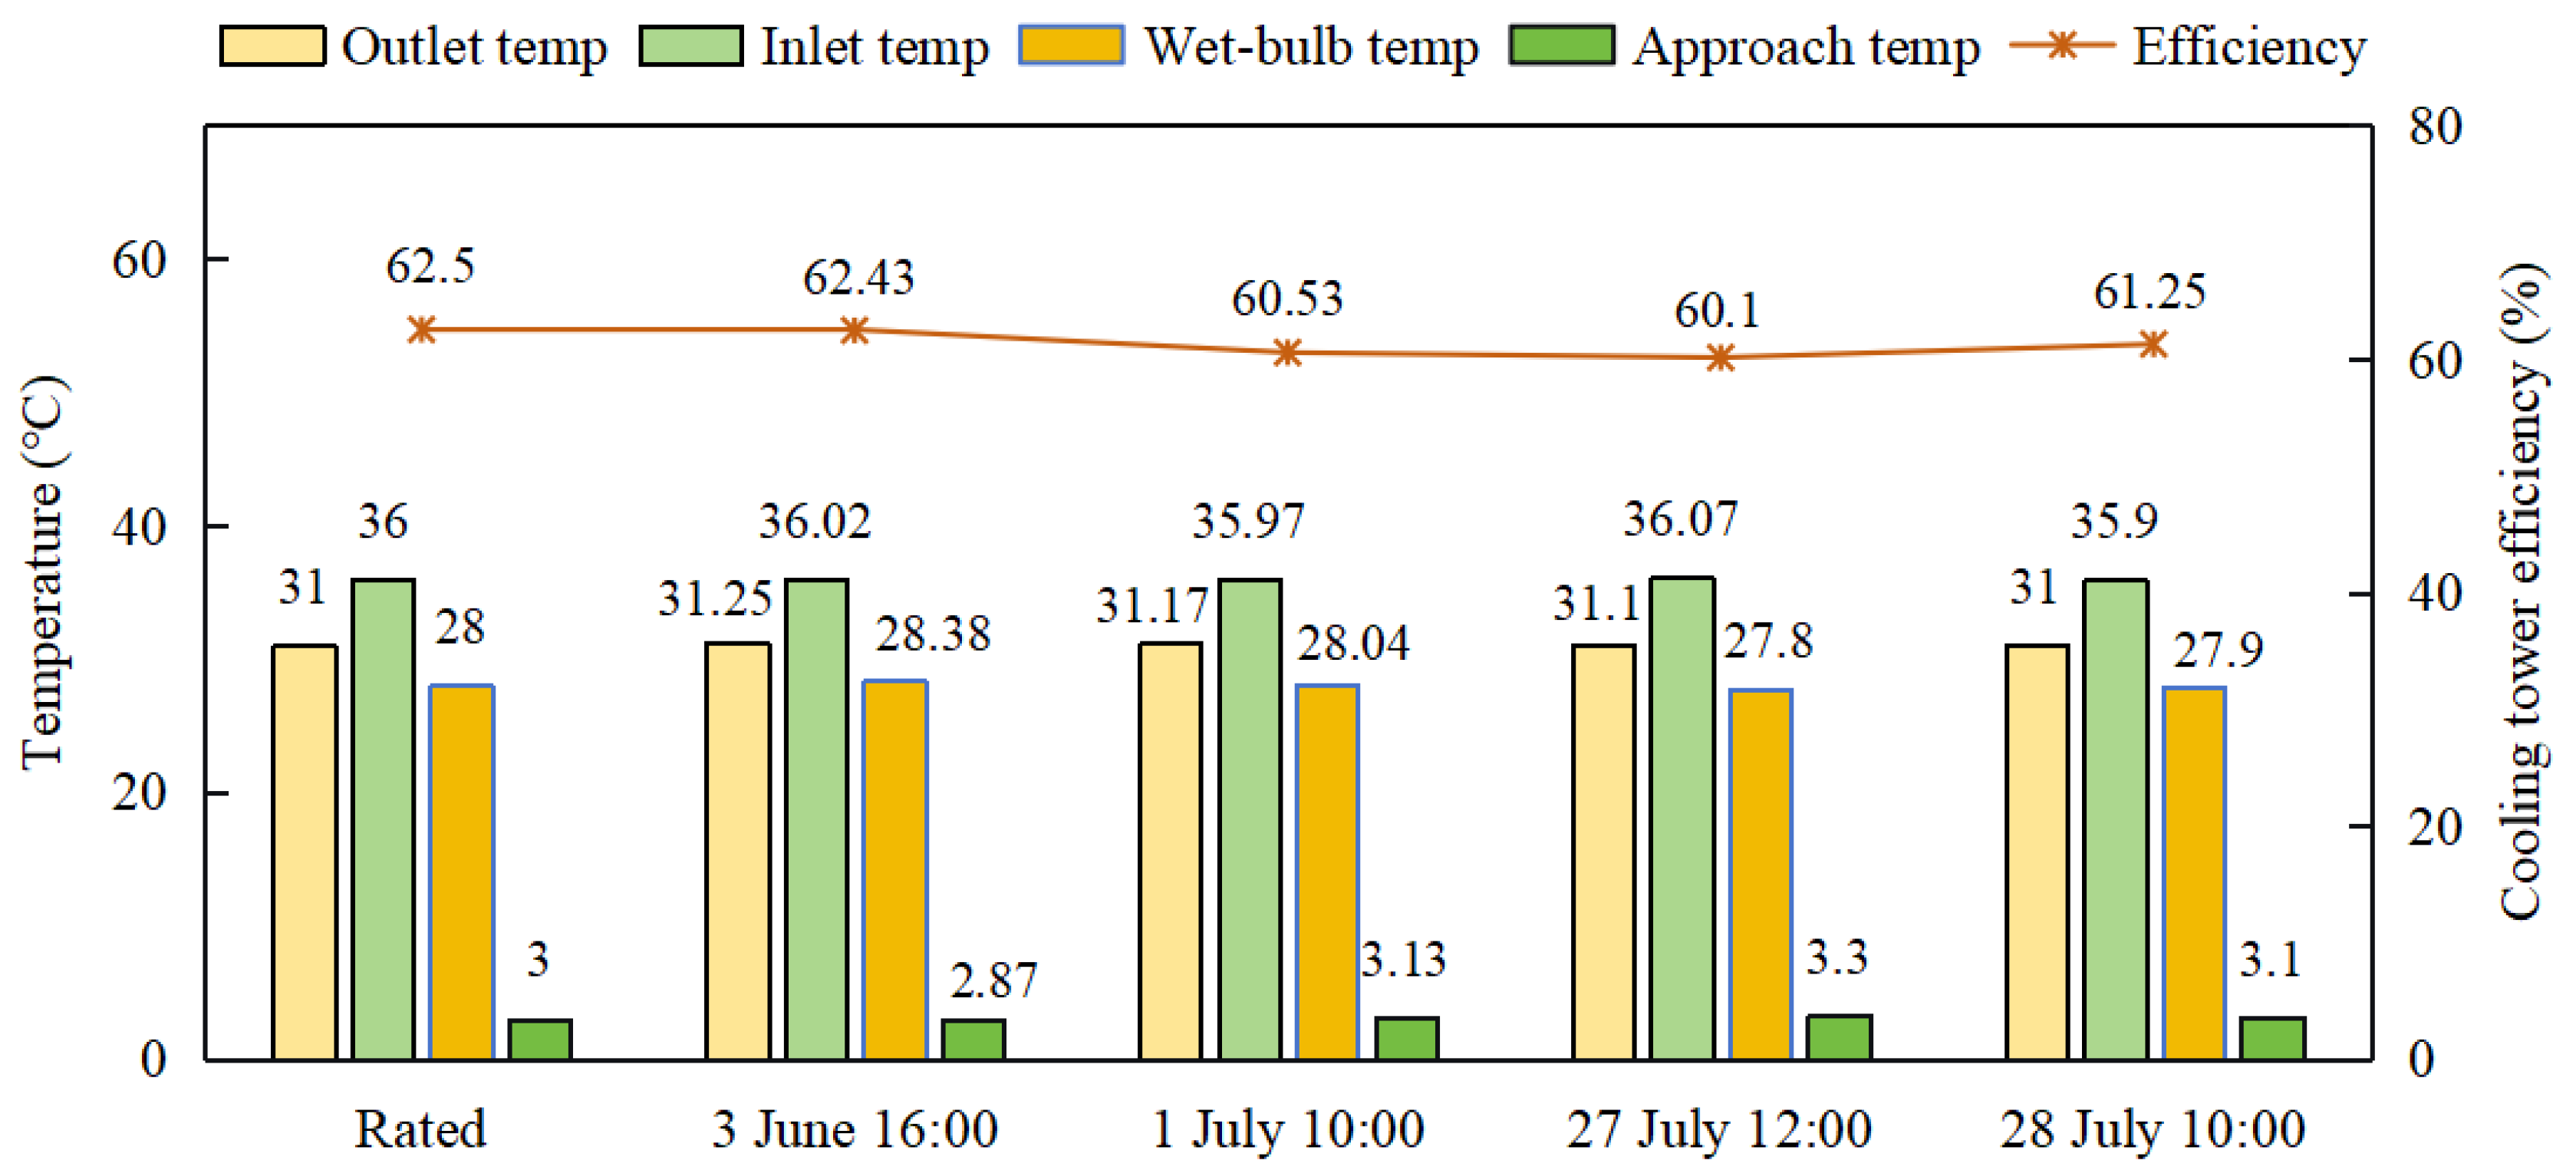
From the measured operating data of cooling towers collected from January to July 2026, working conditions approximating the nominal inlet and outlet water temperatures were screened to implement a comparison between practical operating performance and rated performance parameters. The comparative results are shown in
Figure 12. It is obvious that the cooling towers’ actual approach value and efficiency are basically equivalent to the rated indexes and, in some cases, even surpass the rated values.
The cooling towers’ performance advantage is rooted in the fact that Guangzhou features a subtropical oceanic monsoon climate. The perennial local wet-bulb temperature matches the design operating conditions of cooling towers well; meanwhile, coastal breezes strengthen the heat and mass transfer between air and water inside tower fillers. In addition, the ambient temperature remains relatively high in winter, eliminating the risk of icing inside piping systems. Rational configuration of key parameters such as the cooling tower approach temperature based on local meteorological characteristics can fully exploit its energy-saving potential, enabling the practical operating performance to reach the rated performance given by manufacturers.
5. Conclusions
This study develops an integrated energy-saving retrofit framework for aged refrigeration plants of office buildings in hot–humid regions which integrates equipment retrofit scheme design, techno-economic trade-off evaluation, on-site implementation, and long-term measurement and verification. The core research findings are summarized as follows:
- (1)
Three retrofitting schemes were compared in this work. All three schemes adopted identical retrofit measures for water pumps, cooling towers, metering facilities, and intelligent group control systems, while differing only in chiller replacement scope: Scheme 1 replaced one large-capacity and two small-capacity chillers; Scheme 2 replaced one large-capacity and one small-capacity chiller; Scheme 3 only replaced two small-capacity chillers. Comparative analysis of the three retrofit schemes reveals that Scheme 1, with the largest-scale chiller renewal scope, delivers the optimal energy-saving performance. Its annual integrated EER reaches 5.3, complying with the top-runner tier specified in T/CRAAS 1039-2023. By contrast, Scheme 2 and Scheme 3 merely satisfy the Grade I and Grade II energy-efficiency thresholds, respectively. Although Scheme 1 features a relatively longer static payback period, the property owner finally selected it considering long-term operational benefits, top-runner energy-efficiency requirements and carbon reduction targets.
From an engineering perspective, for large-scale office building aged refrigeration plants in hot–humid regions, expanding the renewal scope of VSD chillers enables the system to well accommodate full-range annual load variations and achieve a system-level leap-forward improvement in annual energy efficiency. Limited replacement of only small-capacity units cannot deliver such prominent system-wide annual energy-efficiency improvement.
- (2)
Field test verification demonstrates that the refrigeration plant renovated under Scheme 1 achieves an average integrated EER of 5.2 from January to August 2026, and the full-year integrated EER is anticipated to exceed 5.2, satisfying the top-runner tier defined in T/CRAAS 1039-2023. In July, with the highest ambient temperature, its monthly average EER is 4.58, representing a 38.5% improvement compared with the pre-retrofit condition and showing remarkable energy-saving performance.
These field test results confirm that, within the proposed integrated energy-saving retrofit framework, expanding the renewal scope of VSD chillers can effectively improve the operating efficiency of large-scale refrigeration plants in hot–humid climates, even when subjected to extreme high-temperature conditions.
- (3)
Measured data of the core refrigeration plant equipment indicate that efficiency deviations between the measured and rated performance of chillers are mostly less than 10%, which meets the allowable tolerance for high-efficiency chiller operation given by ASHRAE Guideline 36-2021 and reflects favorable chiller operating performance. After variable-frequency retrofits, the transport factors of chilled-water and cooling-water pumps stably exceed 35 and 45, respectively, reflecting satisfactory operating characteristics of water pumps. Benefiting from local subtropical climatic characteristics, the actual on-site performance of renovated cooling towers basically matches their rated indexes.
The engineering insight drawn here is that synchronous upgrades of chillers, pumps, cooling towers, metering systems and automatic control systems in aged refrigeration plant are indispensable to unlock the designed performance of chillers, pumps and cooling towers.
This study integrates retrofit scheme design, comparison selection and post-retrofit long-term field measurement verification, proposing a practical, data-supported technical pathway for the renovation of aged refrigeration plants in office buildings. The established integrated retrofit framework is not limited to the hot–humid climate of Guangzhou and can provide references for multiple climate zones and diverse building types. Follow-up work will extend this approach to broader climatic regions and building categories to build a comprehensive refrigeration plant retrofit database. Indoor thermal-comfort field measurements will also be incorporated to complement air-conditioning system performance evaluation. Furthermore, cross-regional comparative analysis will be carried out to characterize how climatic conditions influence the optimal retrofit solutions for refrigeration plants.