Article

Machine Learning Predictions of the Flexural Response of Low-Strength Reinforced Concrete Beams with Various Longitudinal Reinforcement Configurations

1
Department of Computer Engineering, Graduate School of Natural and Applied Sciences, Ankara University, 06110 Ankara, Türkiye
2
Department of Computer Engineering, Zonguldak Bulent Ecevit University, 67100 Zonguldak, Türkiye
3
Department of Civil Engineering, Zonguldak Bulent Ecevit University, 67100 Zonguldak, Türkiye
4
Department of Civil Engineering, Engineering Faculty, Sakarya University, 54050 Sakarya, Türkiye
5
Department of Computer Science, Faculty of Science, Ankara University, 06560 Ankara, Türkiye
*
Author to whom correspondence should be addressed.
Buildings 2026, 16(2), 433; https://doi.org/10.3390/buildings16020433
Submission received: 3 December 2025 / Revised: 16 January 2026 / Accepted: 19 January 2026 / Published: 20 January 2026
(This article belongs to the Section Construction Management, and Computers & Digitization)

Abstract

There are almost no studies that investigate the flexural behavior of existing reinforced concrete (RC) beams with insufficient concrete strength using machine learning methods. This study investigates the flexural response of low-strength concrete (LSC) RC beams reinforced exclusively with steel rebars, focusing on the effectiveness of three different longitudinal reinforcement configurations. Nine beams, each measuring 150 × 200 × 1100 mm and cast with C10-grade low-strength concrete, were divided into three groups according to their reinforcement layout: Group 1 (L2L) with two Ø12 mm rebars, Group 2 (L3L) with three Ø12 mm rebars, and Group 3 (F10L3L) with three Ø10 mm rebars. All specimens were tested under three-point bending to evaluate their load–deflection characteristics and failure mechanisms. The experimental findings were compared with ML approaches. To enhance predictive understanding, several ML regression models were developed and trained using the experimental datasets. Among them, the Light Gradient Boosting, K Neighbors Regressor and Adaboost Regressor exhibited the best predictive performance, estimating beam deflections with R2 values of 0.89, 0.90, 0.94, 0.74, 0.84, 0.64, 0.70, 0.82, and 0.72, respectively. The results highlight that the proposed ML models effectively capture the nonlinear flexural behavior of RC beams and that longitudinal reinforcement configuration plays a significant role in the flexural performance of low-strength concrete beams, providing valuable insights for both design and structural assessment.

1. Introduction

Today, most of the existing building stock exhibits inadequate material strength [1,2,3]. On 1 October 1995, an earthquake struck Dinar, resulting in the destruction of approximately 3000 buildings and the loss of 90 lives. A subsequent material quality investigation conducted on 35 structures in Dinar, employing both destructive and non-destructive testing techniques, reported an average concrete compressive strength of 10 MPa. The relationship between material quality and the observed damage levels of buildings affected in the Elbistan region was examined with particular emphasis on the prevalence of low-quality materials. An evaluation of the earthquake-induced structural damage clearly indicates that deficient material quality and poor workmanship were the dominant causes, compounded by insufficient detailing and architectural deficiencies.
In recent years, the flexural capacity and behavior of concrete beams have been studied extensively. Predicting the mechanical properties of concrete, including ultimate load-bearing capacity and deformation under load, is a critical research task that can help meet the requirements of various design codes and standards [4]. Conventional analytical and empirical methods often have limitations in accurately accounting for the complex and nonlinear behavior of concrete, particularly when dealing with factors like material heterogeneity, mix design, and environmental conditions. To address these challenges, researchers have explored the potential of machine learning (ML) techniques as a viable alternative for developing more accurate predictive models. One promising application of machine learning in concrete technology is the prediction of failure mode and shear capacity of ultra-high-performance concrete (UHPC) beams [5]. The researchers used an ensemble machine learning approach to classify the failure modes (flexure, shear, or mixed) and predict the corresponding ultimate load-carrying capacity. Similarly, machine learning techniques such as Gaussian Process Regression and Support Vector Regression have been used to model the tensile breakout capacity of anchor bolts embedded in concrete, demonstrating improved accuracy over traditional semi-empirical models. In the context of predicting long-term deflections in reinforced concrete structures, data-driven machine learning models have also shown promising results [6]. In [7], An optimization for the flexural strength and stiffness of reinforced concrete beams with machine learning was presented by researchers, focusing on design input variables related to steel bar areas in different regions. In [8], the flexural strength of over-reinforced concrete beams with highly ductile fiber-reinforced concrete layers have been studied and a stripped-down calculation method for the flexural capacity of HDC-reinforced beams was proposed.
Ensemble machine learning models have been successfully applied to predict the flexural strength of steel fiber-reinforced concrete, with Gradient Boosting outperforming Random Forest and Extreme Gradient Boosting in terms of prediction accuracy [9].
A wide range of machine learning (ML) algorithms have been applied in structural engineering to predict the mechanical behavior and performance of concrete and composite structural members. Artificial Neural Networks (ANNs) and their variants have been extensively used for estimating load-carrying capacity, deflection, shear strength, and failure modes of structural elements. For instance, ANN-based models were successfully employed to predict the ultimate strength of steel and reinforced concrete members, including composite beams and shear connectors [10,11,12,13]. Advanced neural network architectures, such as Backpropagation Neural Networks with exponential rectified linear unit (eReLU) activation functions, have also demonstrated high accuracy in predicting the load capacity of reinforced concrete columns [14]. Additionally, ANN and K-Nearest Neighbor (KNN) models were reported to provide superior performance in predicting shear strength and identifying failure modes of rectangular reinforced concrete columns [15].
Tree-based ensemble learning methods, including Random Forest (RF), Gradient Boosting, and Extreme Gradient Boosting (XGBoost), have gained increasing attention due to their robustness and high predictive capability. Random Forest and support vector regression models were used to predict the ultimate strength of steel beams with promising results [10]. The punching shear capacity of reinforced concrete flat slabs was accurately predicted using an M5P model tree approach [11]. Moreover, extra-gradient boosting algorithms were effectively applied to estimate the load-carrying capacity of ECC-strengthened reinforced concrete beams with high accuracy [16]. Ensemble ML models have also been utilized to predict the compressive and flexural strengths of steel fiber-reinforced concrete, where higher accuracy was generally achieved for compressive strength prediction [17].
Instance-based and regression-based ML approaches, such as K-Nearest Neighbor (KNN) and multivariable regression, have been employed to model the flexural behavior and deflection of reinforced concrete beams. KNN models developed with different training–testing ratios showed strong agreement with experimental data in predicting deflection of high-strength reinforced concrete beams [18]. Machine learning models were also applied to analyze the flexural response of reinforced concrete beams reinforced with steel and GFRP bars under varying concrete strengths and thermal conditions, yielding promising predictive performance [19,20,21,22].
In addition, ML techniques have been extended to more complex structural systems and loading scenarios. The bending capacity of ECC–concrete composite beams reinforced with steel and FRP bars was successfully predicted using various ML algorithms, confirming their applicability in practical design problems [23]. The triaxial behavior of concrete incorporating recycled aggregates was effectively forecast using artificial neural networks and multivariable regression models [24]. Furthermore, ML-based models achieved very high accuracy in predicting the structural response of reinforced concrete columns subjected to blast loading [25]. Shear strength prediction of exterior reinforced concrete beam–column joints using ML methods demonstrated superior predictive performance compared to conventional approaches [26]. Machine learning models have also been employed to evaluate the performance of structural concrete members reinforced with fiber-reinforced polymers [27].
While the experimental originality of this study lies in the investigation of the flexural strength of low-strength concrete beams with different reinforcement configurations in the tensile zone, another novel and original aspect of the study is the use of different machine learning models to predict the flexural behavior of beams with insufficient concrete strength, which are presented and compared by taking the R2 value as the reference metric. It is evident that these machine learning models, which are capable of predicting deflection capacity with high levels of accuracy, represent innovative, fast, and reliable technological methods for the assessing the safety of structural elements.
In this study, the flexural performance of low-strength concrete (LSC) reinforced concrete beams strengthened exclusively with steel reinforcement is examined, with particular emphasis on the influence of tensile-zone longitudinal reinforcement across three different configurations. Nine beam specimens, each measuring 150 × 200 × 1100 mm and cast with C10-grade LSC, were categorized into three groups based on the longitudinal bars placed in the tensile zone: Group 1 containing two Ø12 mm bars, Group 2 containing three Ø12 mm bars, and Group 3 incorporating three Ø10 mm bars. All specimens were subjected to three-point bending tests to evaluate their load–deflection responses and failure mechanisms. The experimental results were compared with machine learning–based predictions. To enhance predictive accuracy, 18 distinct ML regression models were developed, trained, and validated using the experimental dataset. These studies collectively highlight the potential of machine learning in predicting the load-carrying capacity and deflection values of low strength concrete RC beams.

2. Materials and Methods

2.1. Fabrication of Low-Strength Concrete and Reinforced Concrete Beams

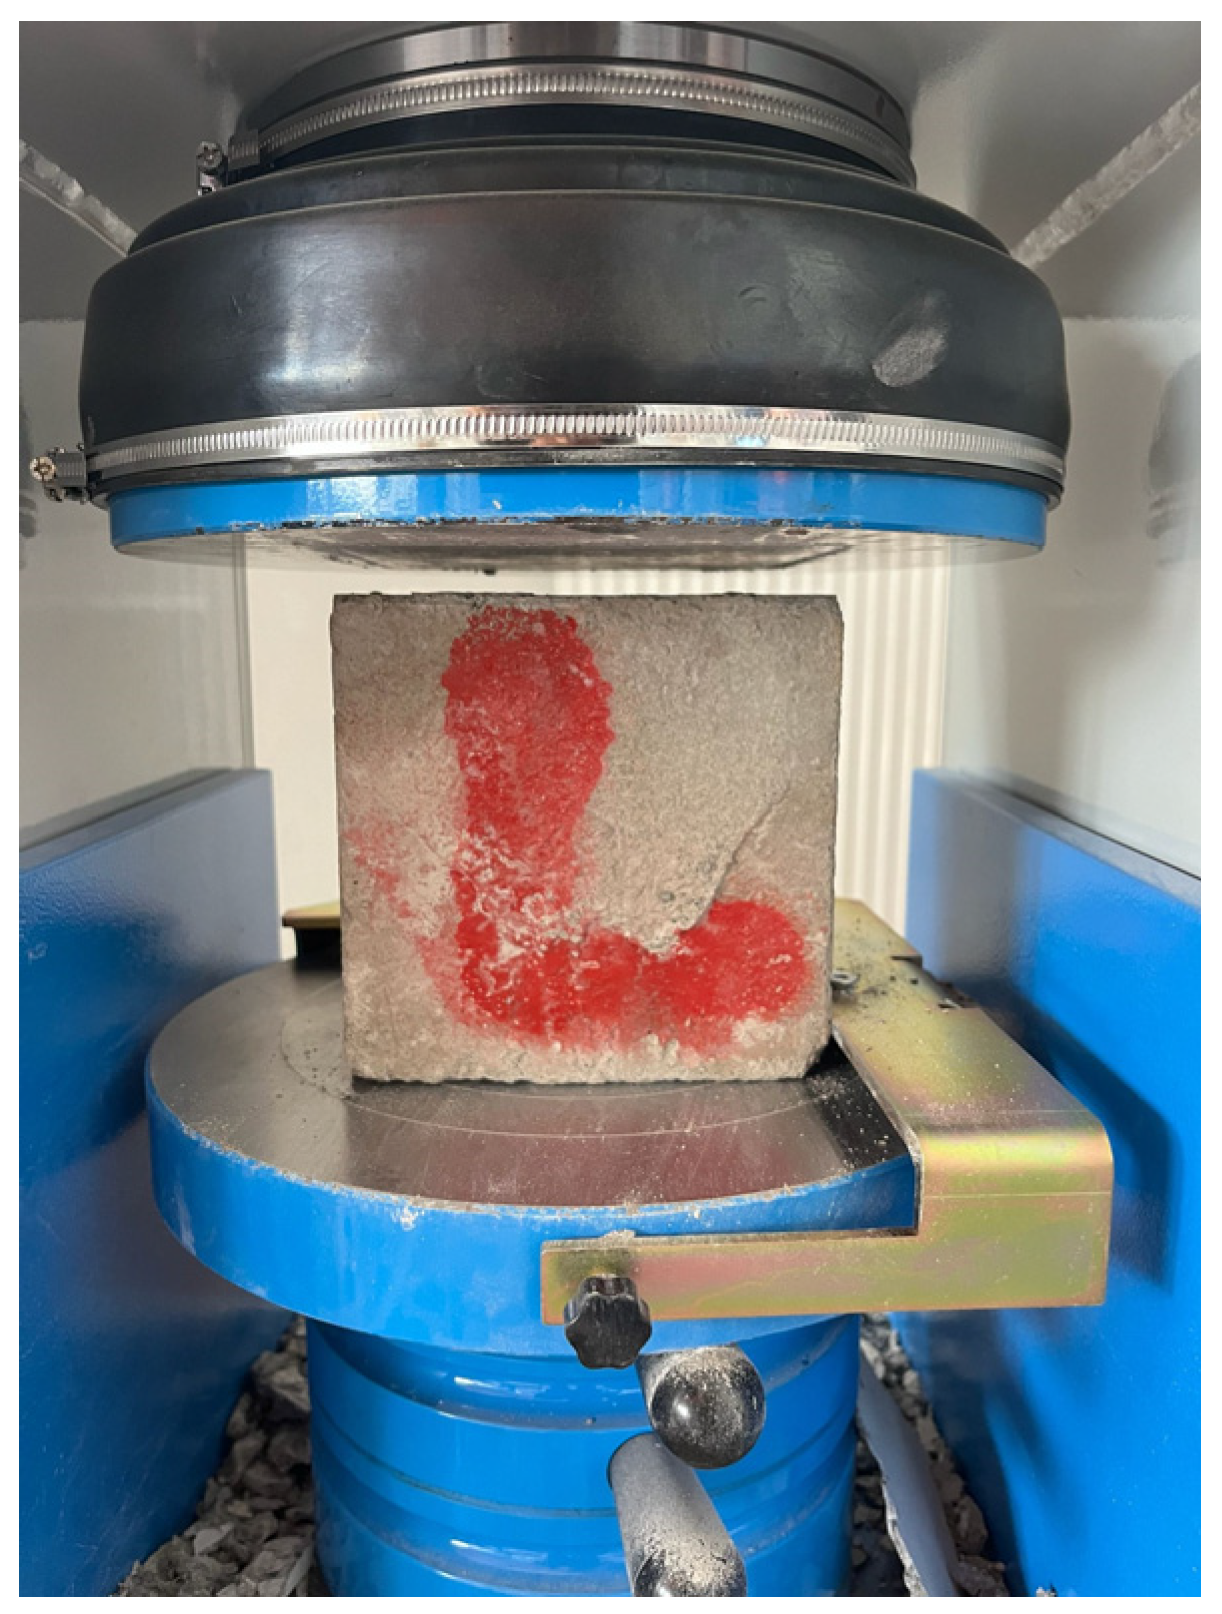
Since this study aims to investigate reinforced concrete beams produced with low concrete strength, the compressive strength of the nine fabricated beams was deliberately targeted to be around 10 MPa. This value was selected to represent the approximate strength commonly observed in existing structures, particularly in Istanbul, Türkiye. The same concrete was used in all RC beams. In this study, the effect of steel reinforcement configuration in the tensile zone of reinforced concrete beams with low concrete strength was investigated while keeping the concrete material constant. Additionally, the same production and manufacturing procedures were applied to all beams, and curing processes were carried out uniformly under laboratory conditions. Accordingly, the RC beams were designed and cast to achieve this low-strength concrete level, and the production process was carried out in line with this objective. For this purpose, three fresh concrete samples were taken for both 7-day and 28-day testing, and after the curing process was completed under laboratory conditions, these specimens were subjected to compressive strength testing. The testing of the low-strength concrete specimens is presented in Figure 1, while the obtained compressive strength values are provided in Table 1.
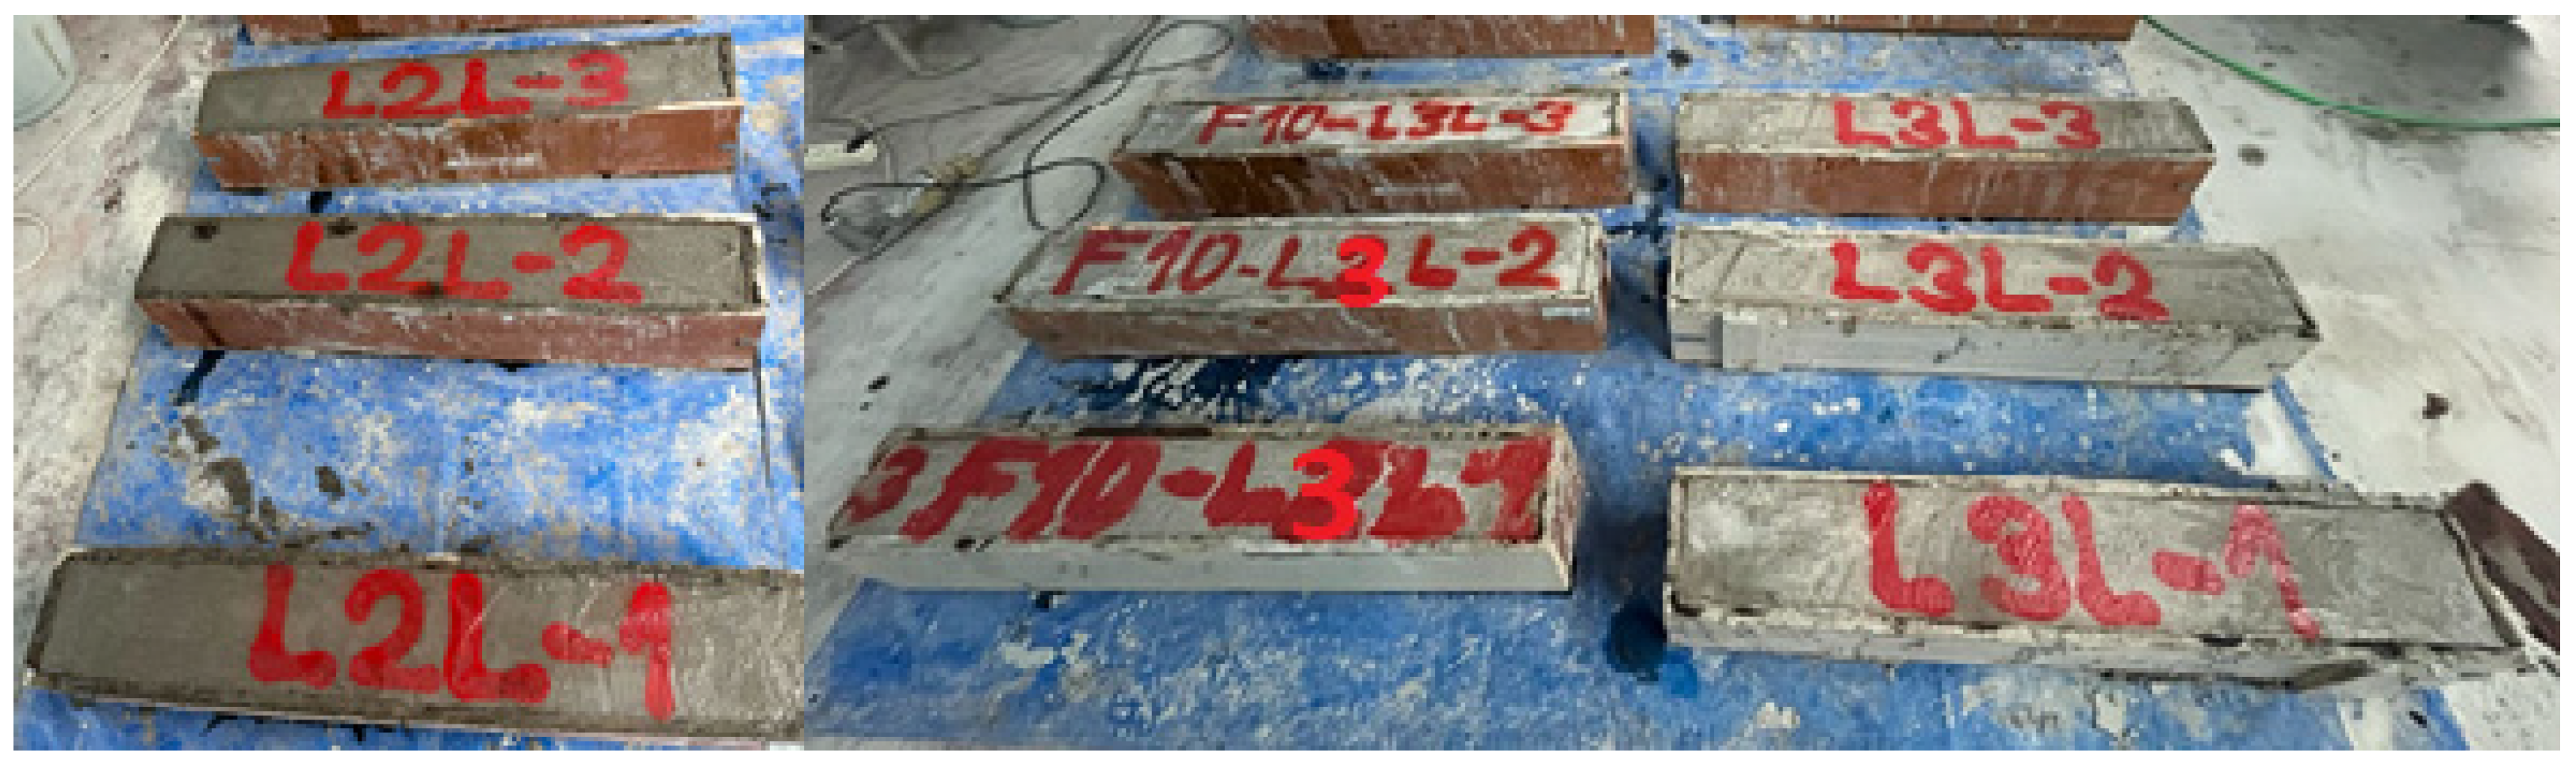
The evaluation of the obtained results indicates that the concrete produced achieved a compressive strength consistent with approximately C10 grade. Accordingly, nine beams incorporating different longitudinal reinforcement configurations were cast using this concrete strength. The production stages of the beams are presented in Figure 2 below.
Concrete mix design for 15 MPa concrete is given in detail in Table 2.
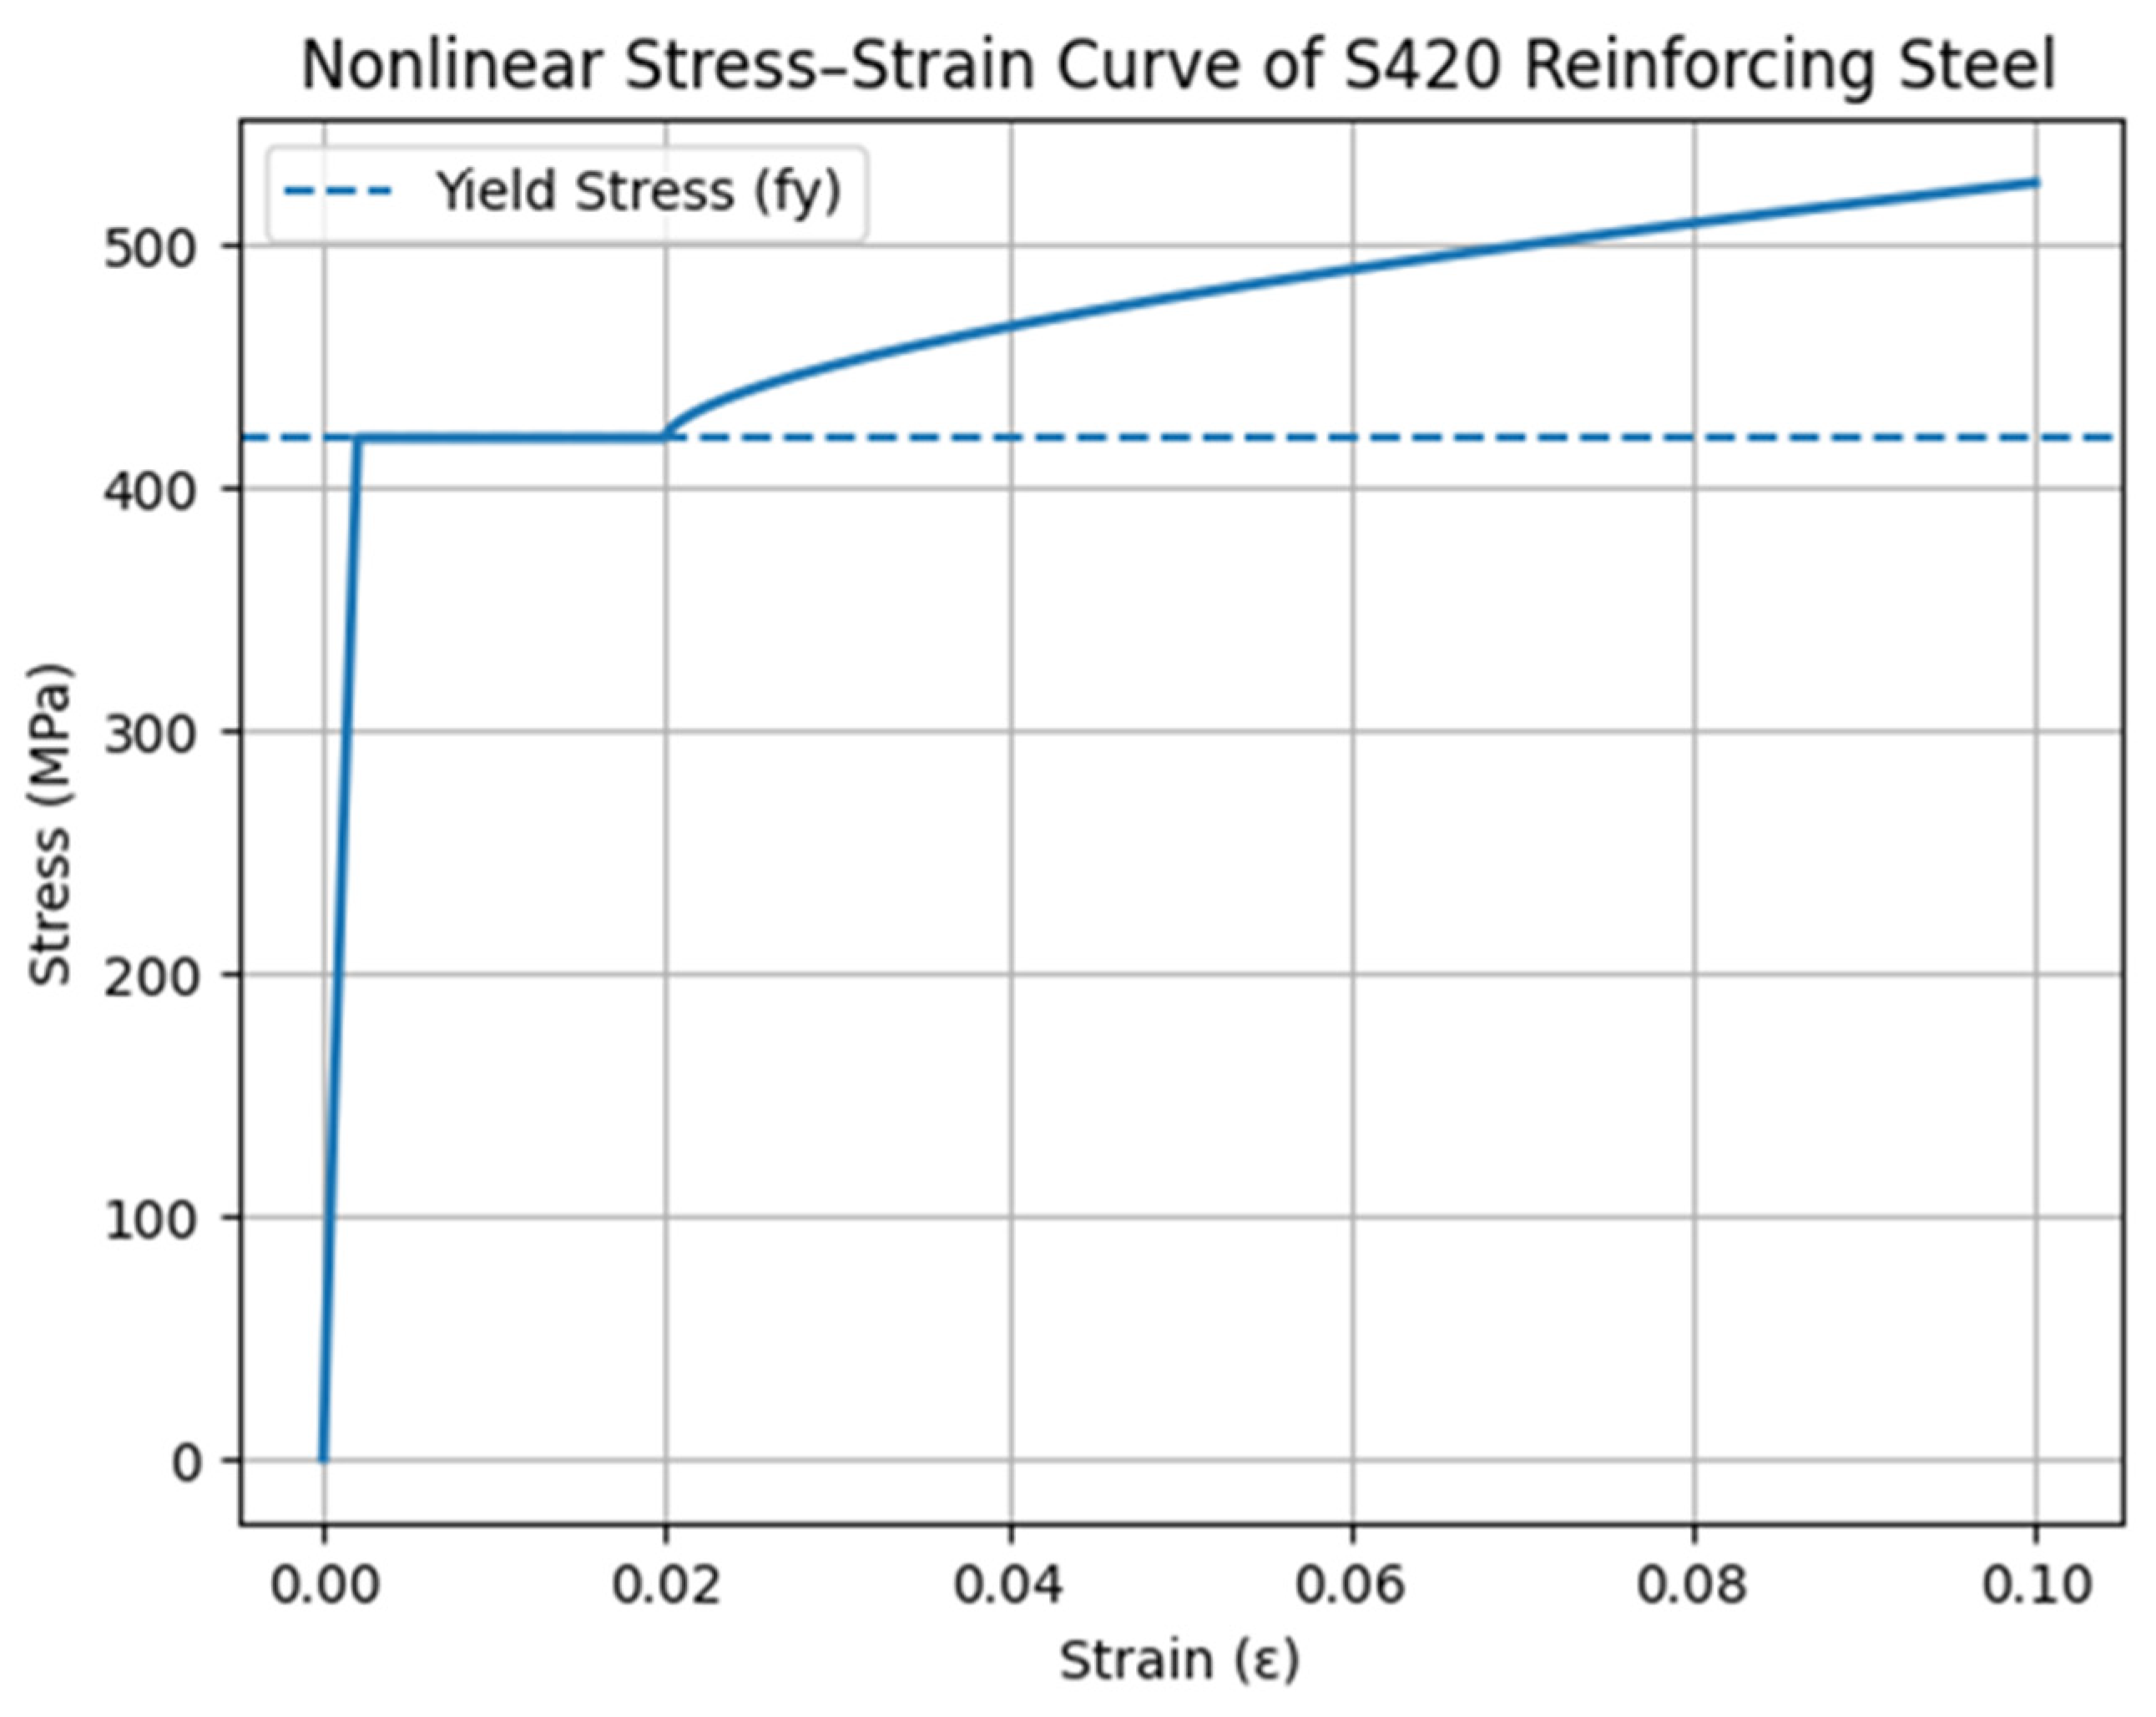
Nonlinear stress–strain curve of S420 reinforcing steel is shown in Figure 3.

2.2. Three-Point Bending Test Method

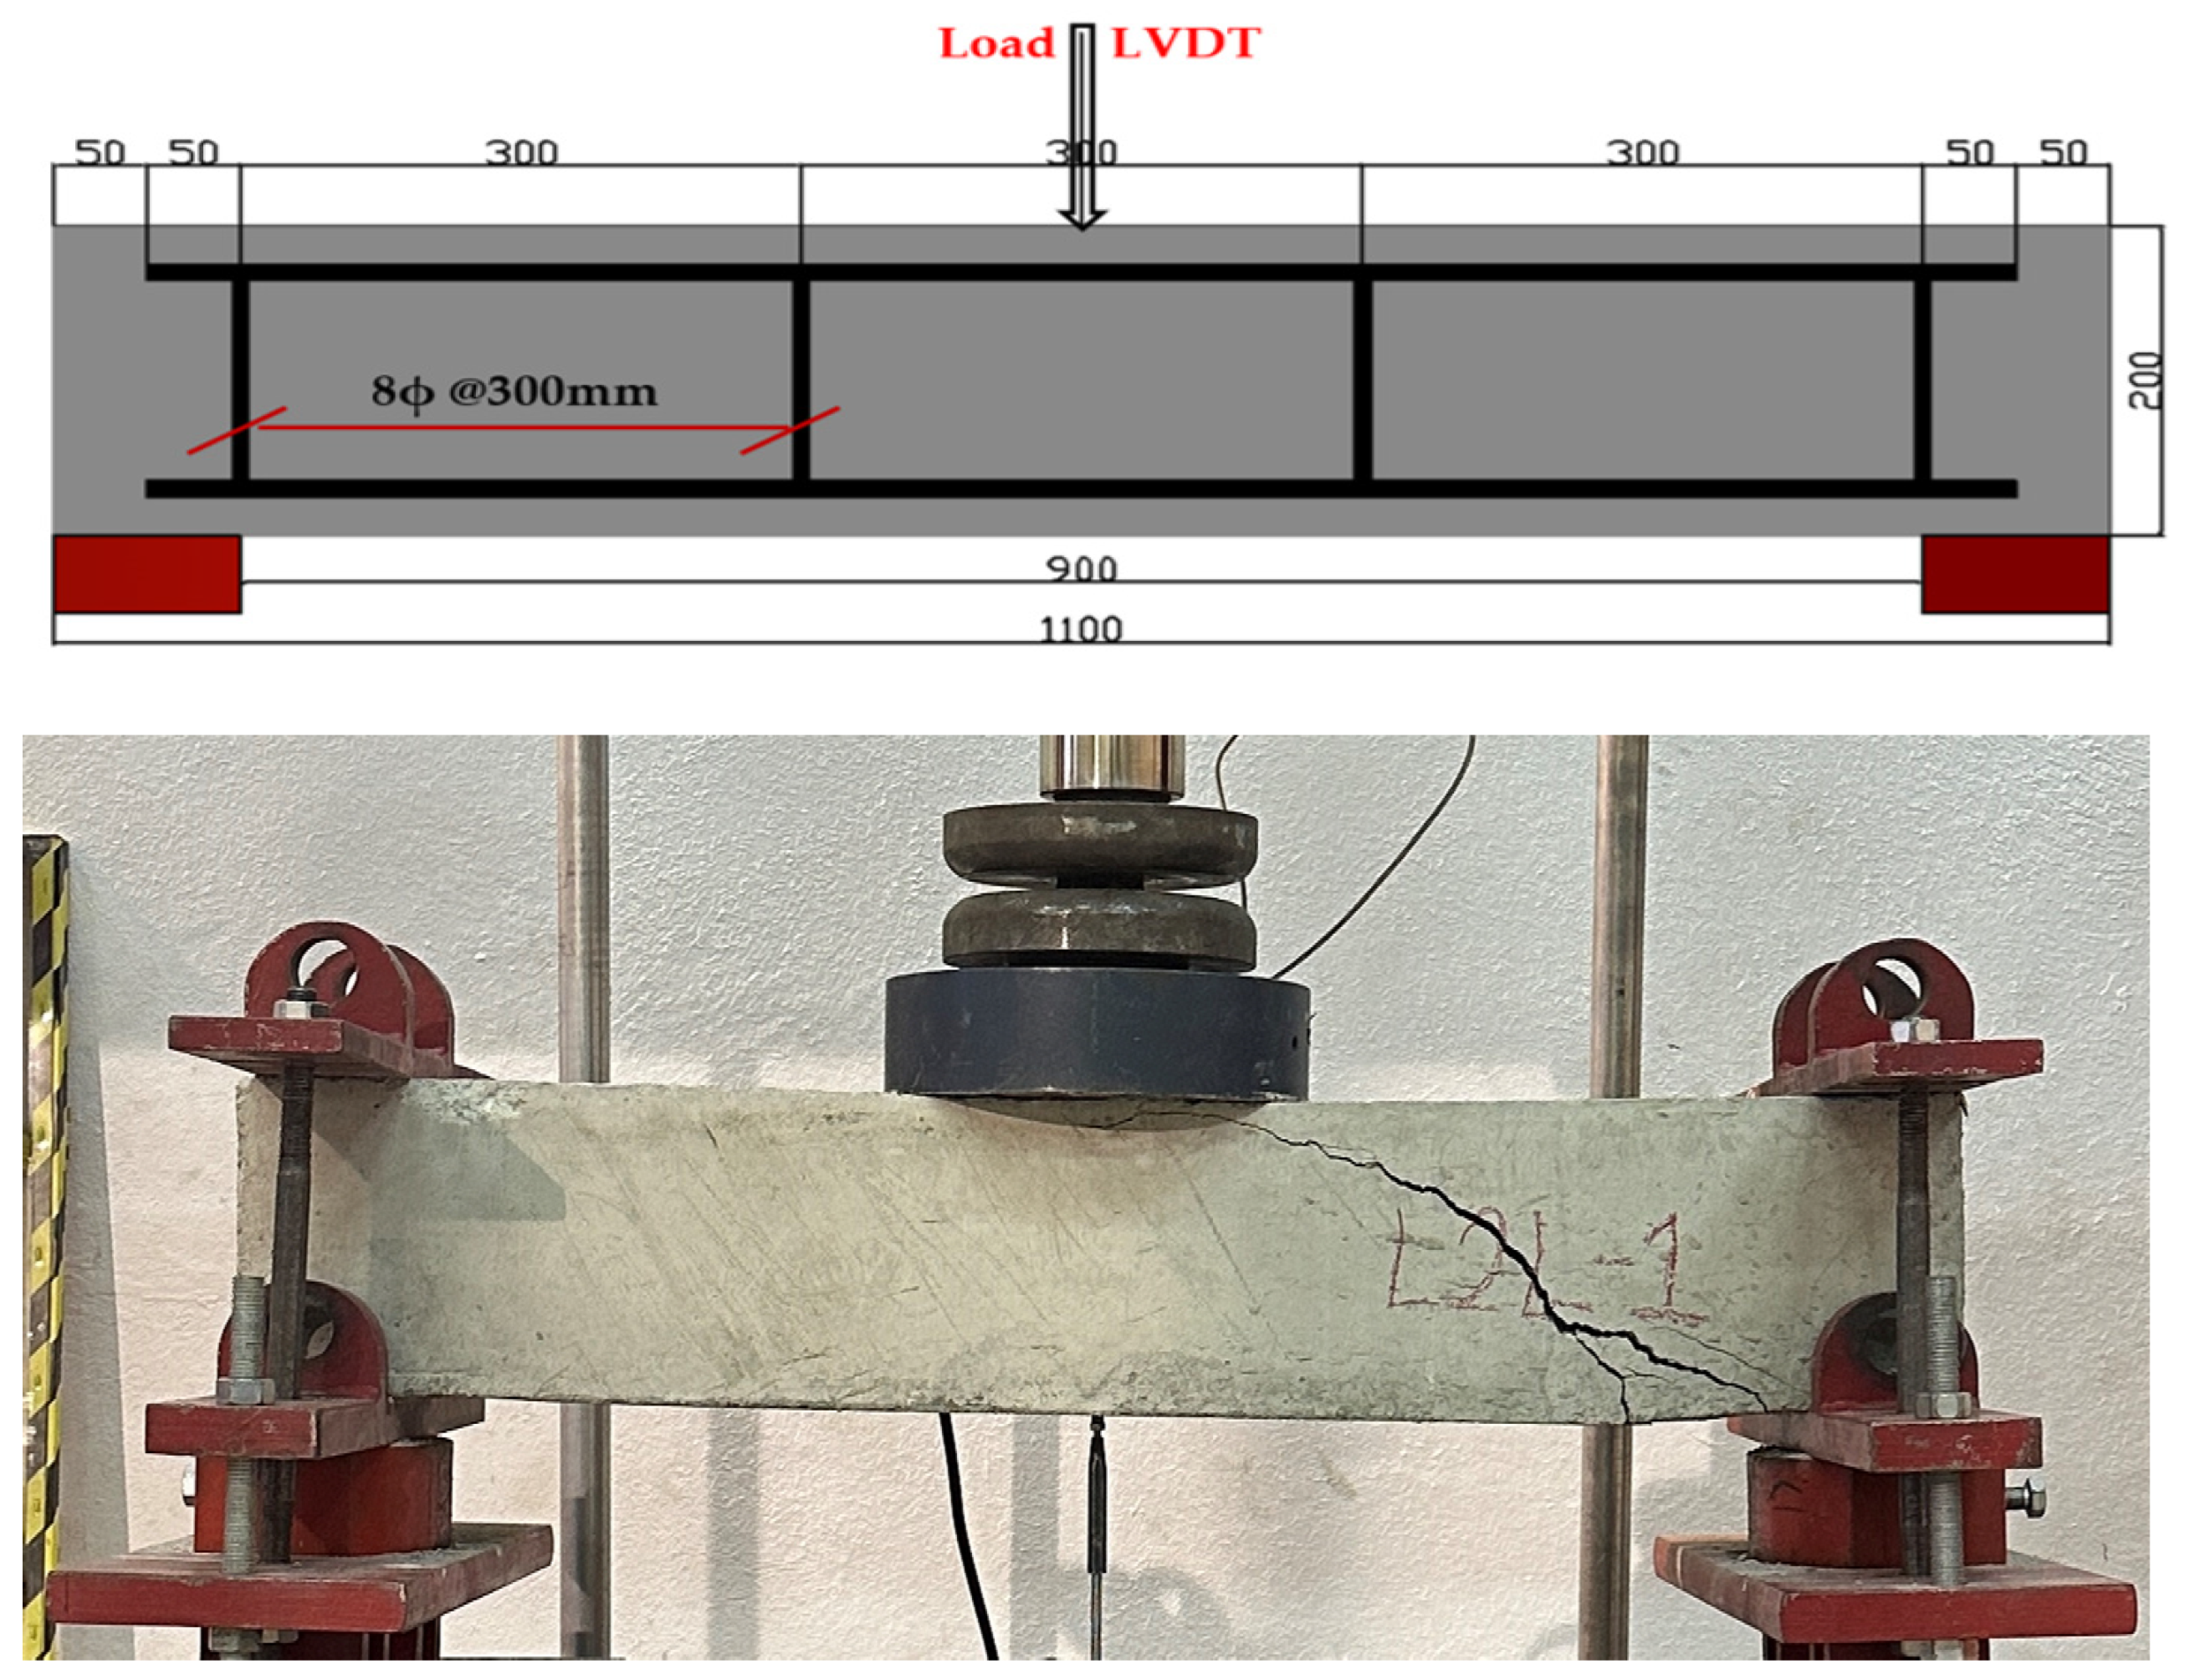
As illustrated in Figure 4, three-point bending tests were performed on all nine low-strength concrete beams and were carried out to complete structural failure.
The three-point bending test setup and the reinforced concrete beam detailed diagram are shown in Figure 5.
The experimental program aimed to evaluate the influence of varying tensile-zone steel reinforcement configurations on the flexural response and failure mechanisms of the low-strength RC beams.

2.3. Machine Learning Analysis

Recent progress in artificial intelligence has enabled its integration into a wide range of disciplines, making it a prominent tool in numerous contemporary applications. Despite the fact that machine learning—one of the analytical components of artificial intelligence—has only limited adoption within civil and structural engineering, existing literature clearly indicates that ML-based approaches can provide rapid and highly consistent predictions when compared with laboratory measurements. In the present study, machine learning (ML) algorithms were employed to support the experimental program by estimating the deflection behavior of reinforced concrete (RC) beams subjected to three-point bending.
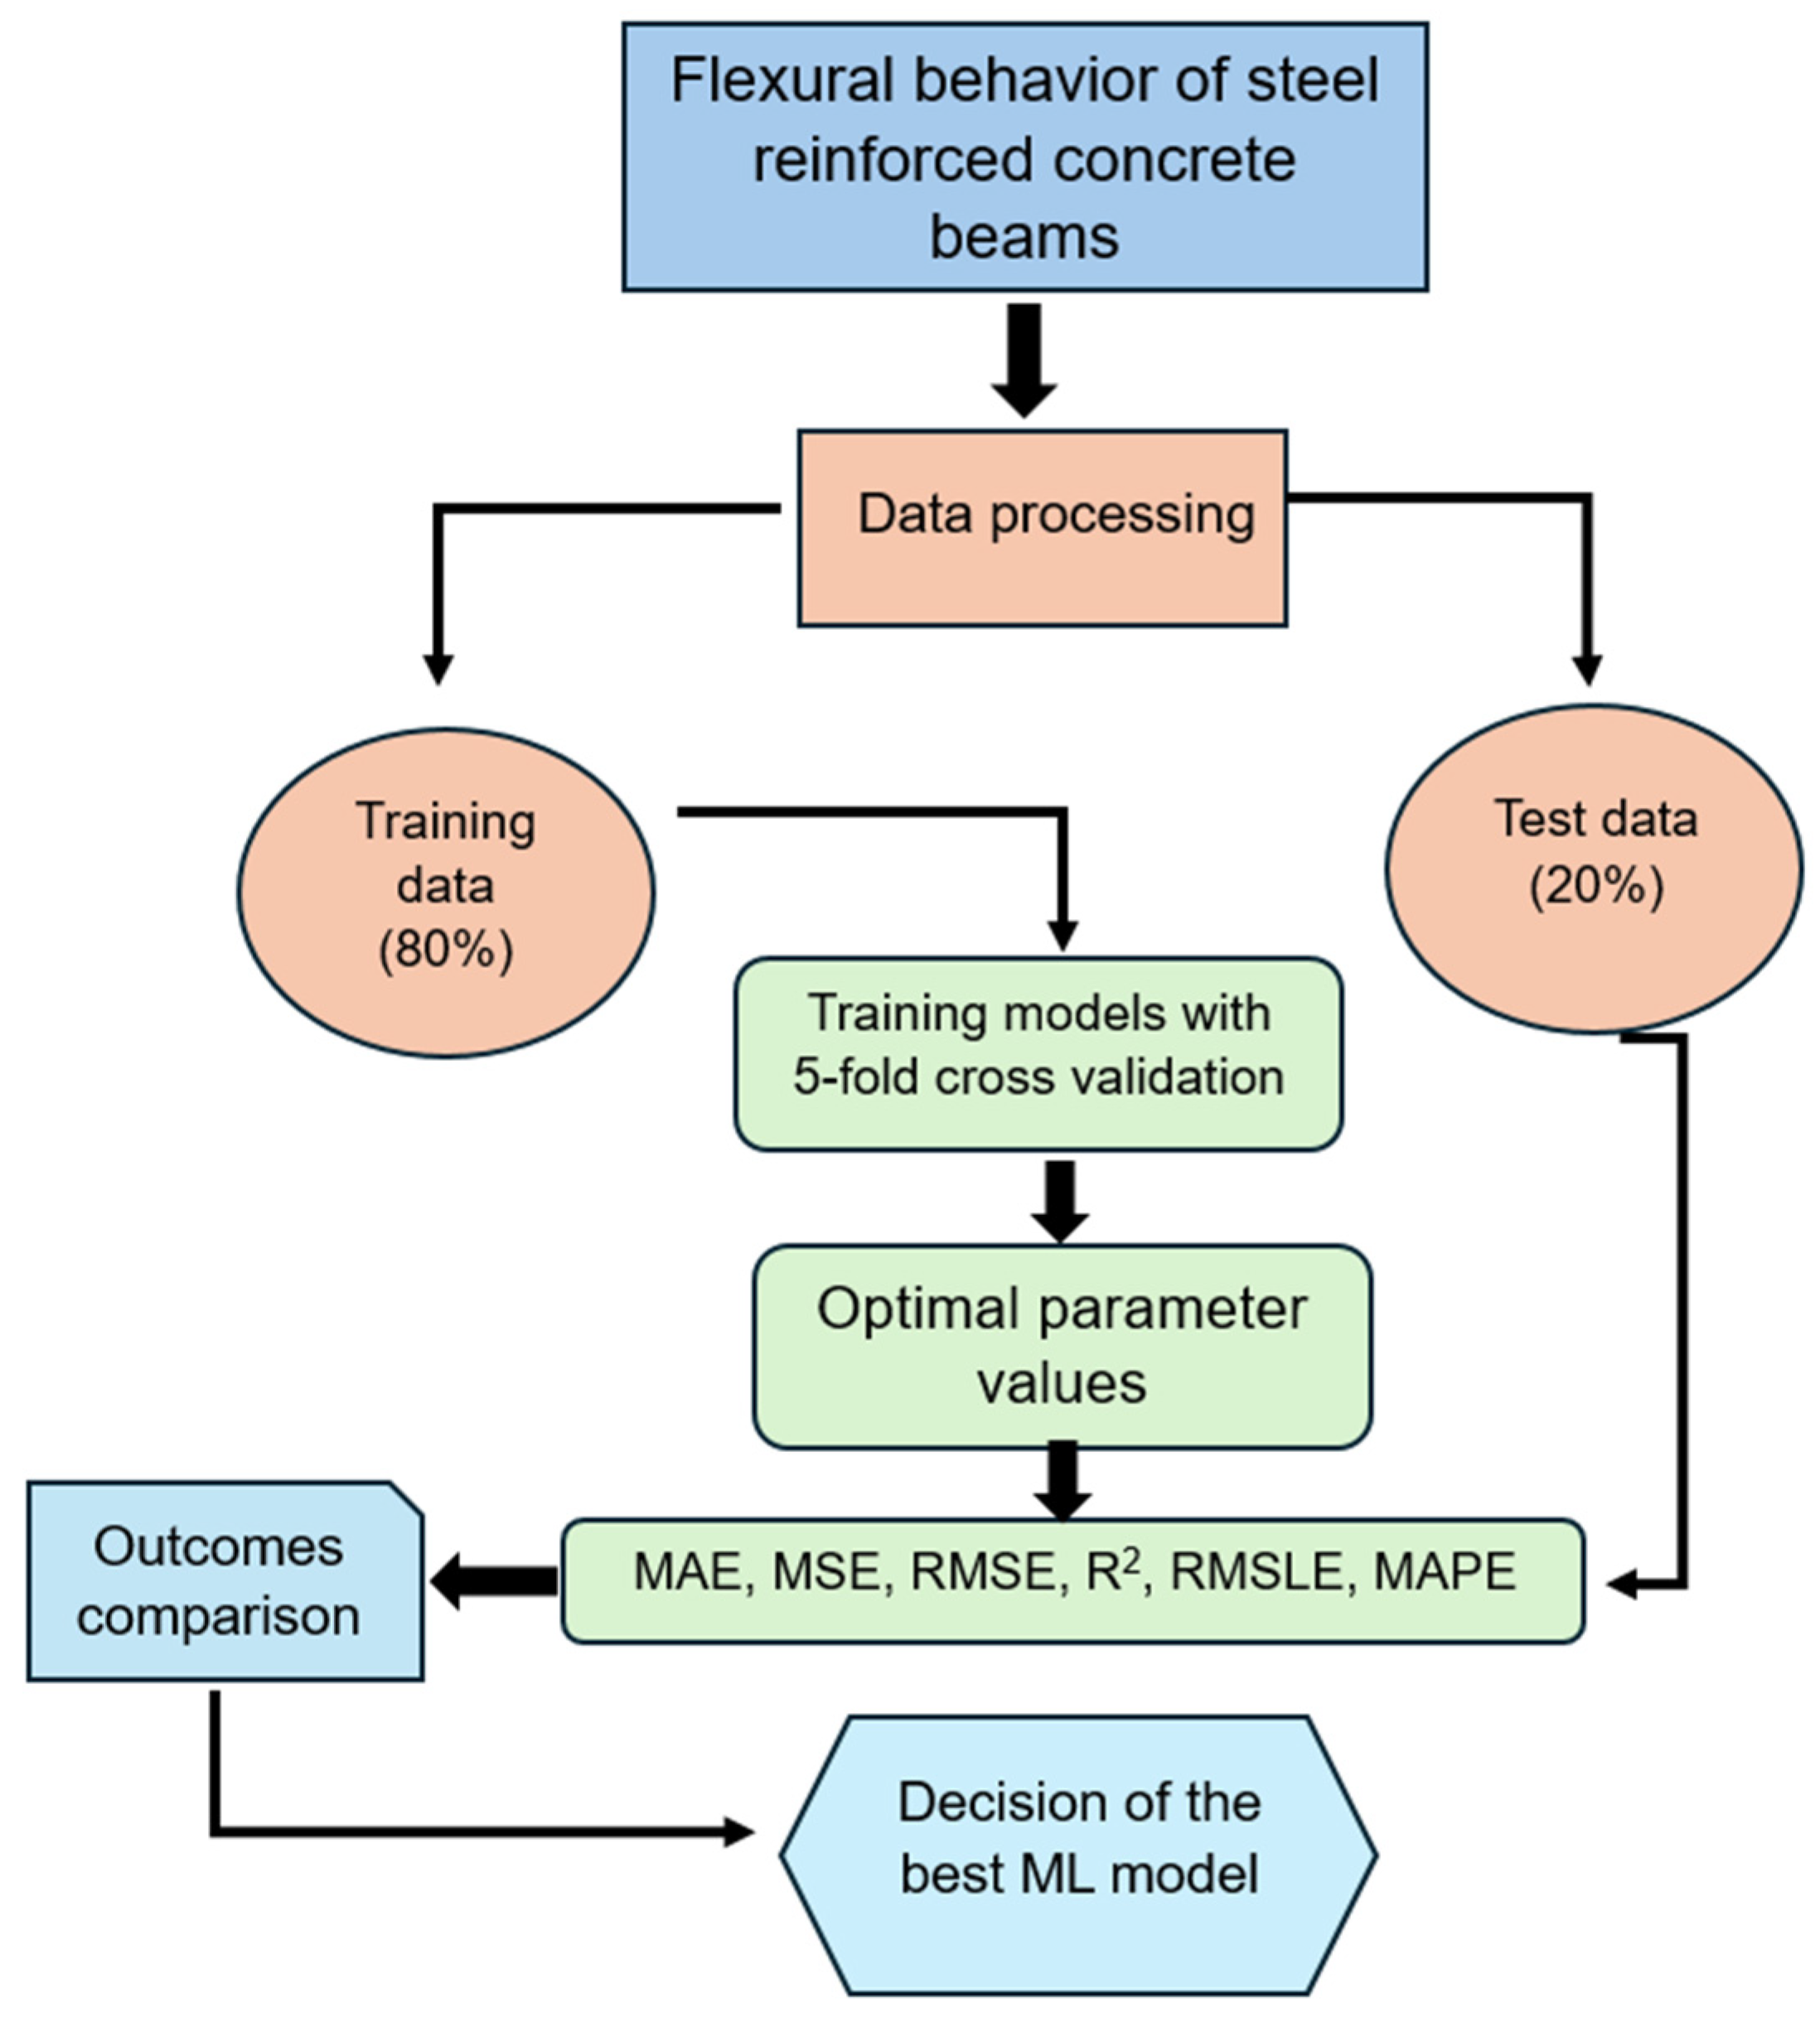
The experimental load–deflection data collected from nine RC beams reinforced with steel bars served as the foundation for developing and validating multiple ML regression models individually. On average, 350 lines of measurements for each beam were used for training and testing of the machine learning models, individually. In some beams, these values correspond to a much larger number of data rows; therefore, as an evaluation criterion, the number of experimental data rows used was taken into account rather than the number of beams (nine). Figure 6 illustrates the machine learning framework employed in this study.
To streamline the modeling process, the PyCaret library in Python 3.10.11 was adopted. PyCaret, an open-source automated machine learning framework, facilitates efficient data processing, model training, evaluation, and optimization, thereby reducing the complexity typically associated with ML model development.
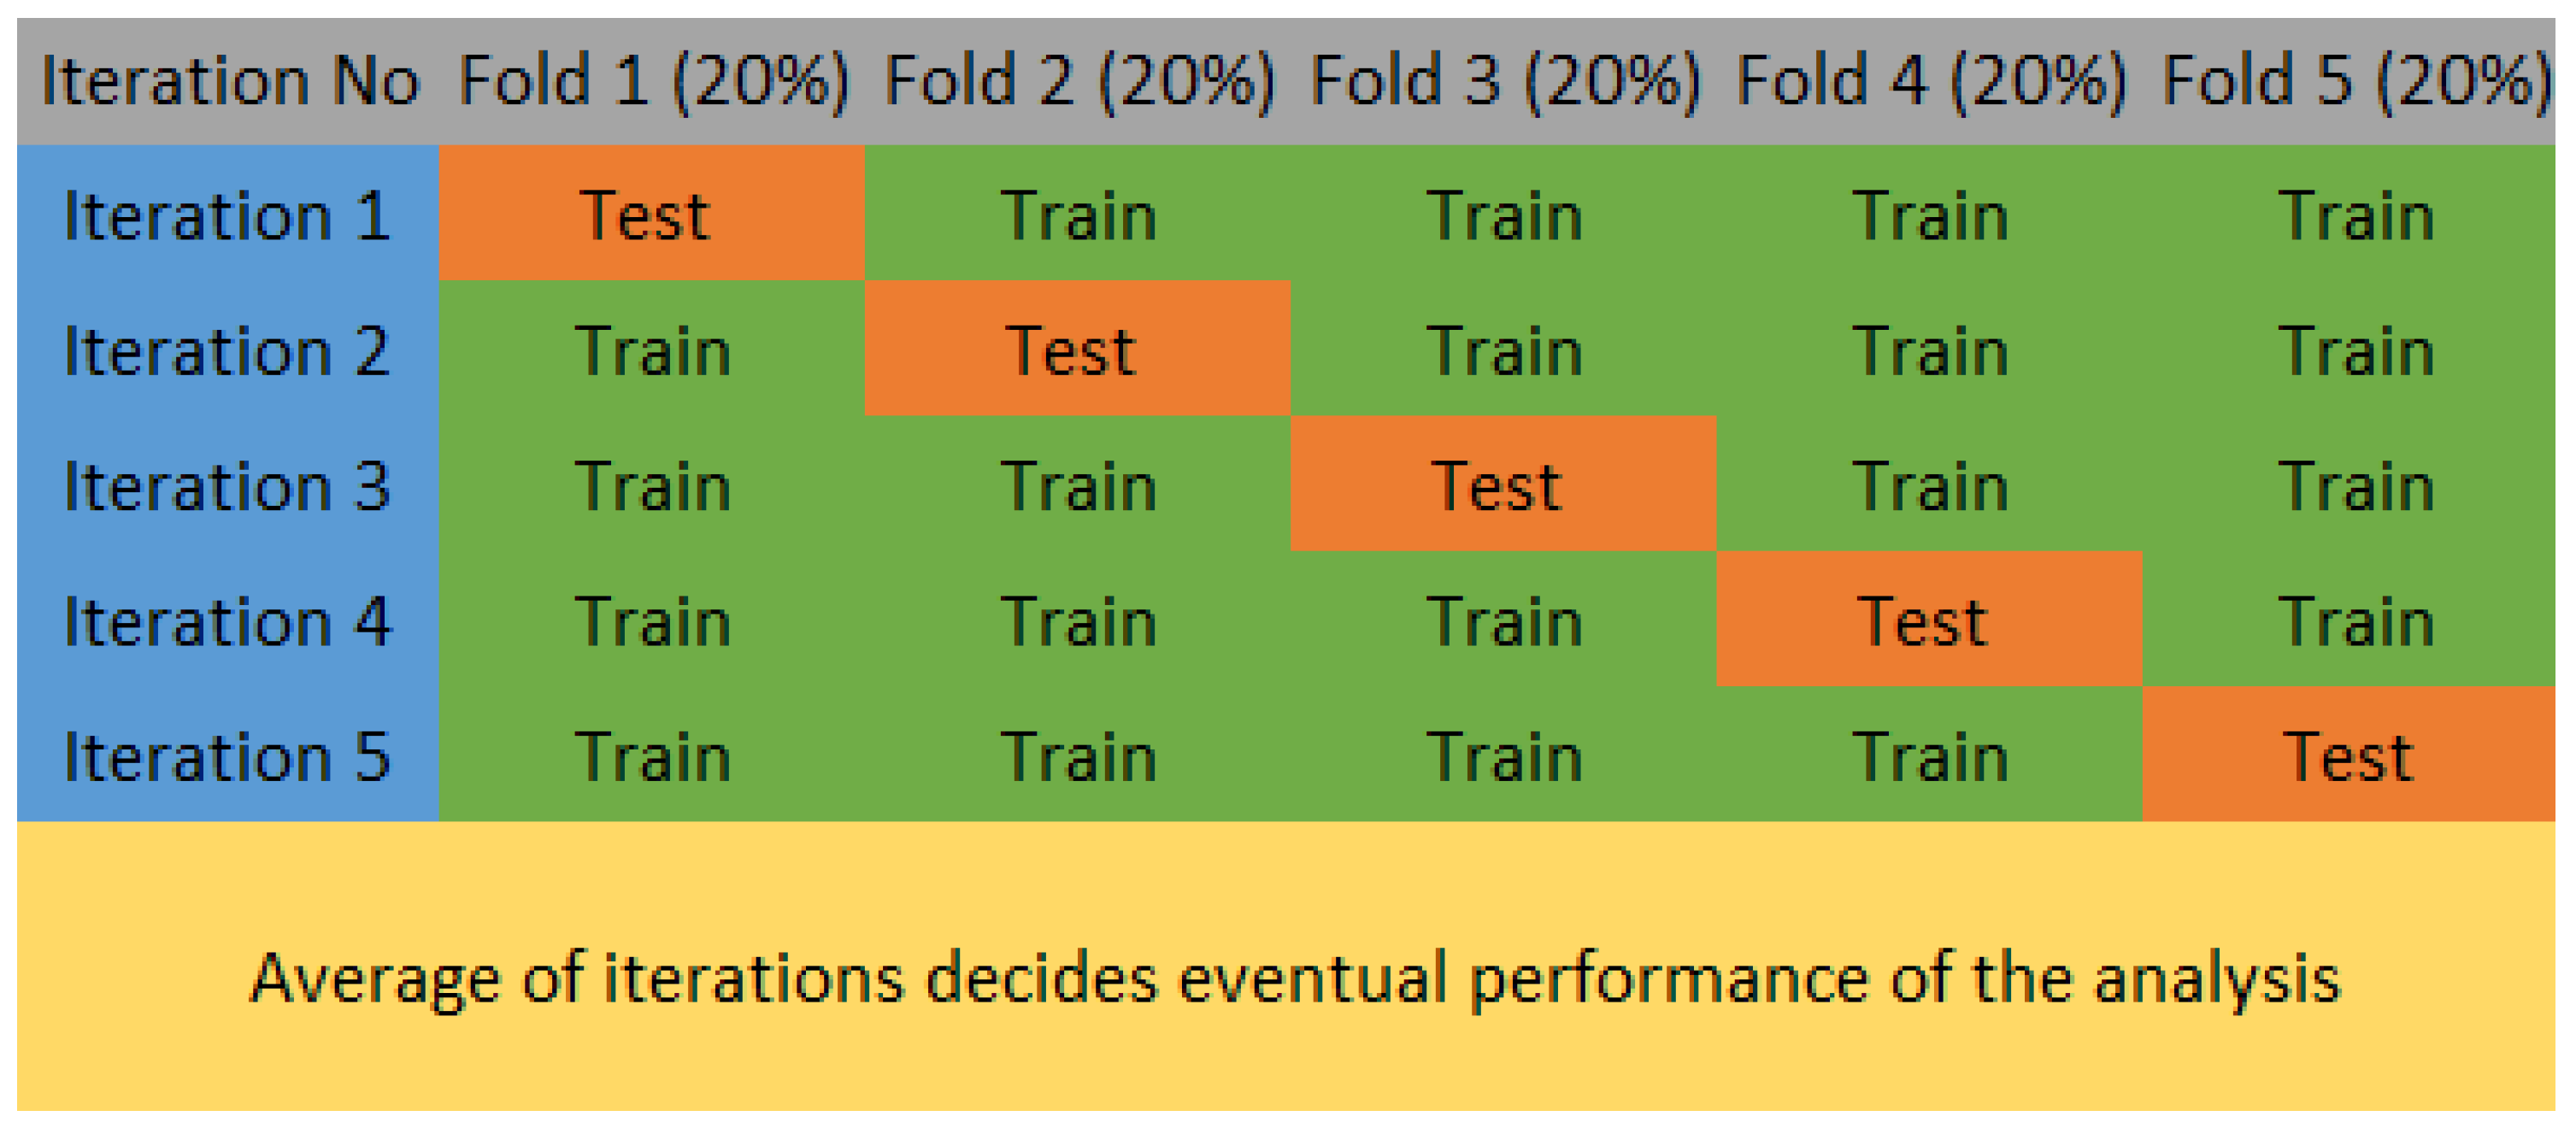
The datasets for each beam were partitioned into training (80%) and testing (20%) subsets, separately. Key input features included concrete compressive strength (fc′), geometric properties of the beams, reinforcement configuration, reinforcement ratios, and applied load levels, while the response variable was defined as the midspan deflection (Δ). Model performance for each beam was examined separately using 5-fold cross-validation in combination with evaluation indicators including the Root Mean Square Error (RMSE), Mean Absolute Error (MAE), and the coefficient of determination (R2). This process was carried out using hundreds of rows of data for each beam. Figure 7 presents the 5-fold cross-validation procedure employed to verify the sturdiness and reliability of the models.
Hyperparameter optimization was additionally conducted to enhance predictive capability and reduce error. A total of eighteen regression algorithms were investigated, such as the Gradient Boosting Regressor, Light Gradient Boosting Machine, K-Nearest Neighbors Regressor, AdaBoost Regressor, and Extra Trees Regressor. Among all tested models, the K-Nearest Neighbors Regressor, Gradient Boosting Machine and Ada Boost Regressor consistently produced the most accurate predictions. Table 3 shows the 18 employed machine learning regression models to predict the ultimate load–deflection capacity, based on the experimental data obtained from the steel rebar–reinforced concrete beams.

2.4. Evaluation Criteria for Machine Learning Analysis

In quantitative modeling and statistical analysis, several performance indicators are commonly applied to assess how well a machine learning algorithm operates. Among the most frequently employed measures are the Root Mean Squared Logarithmic Error (RMSLE), Root Mean Square Error (RMSE), Mean Absolute Error (MAE), Mean Squared Error (MSE), the coefficient of determination (R2), and the Mean Absolute Percentage Error (MAPE). These metrics provide an objective means of determining how closely the predictions generated by an ML regression model align with the actual observed data. Models that perform effectively generally exhibit lower RMSE, MAE, and MAPE values, whereas R2 values approaching 1.0 indicate a stronger level of predictive accuracy [19].
The R2 statistic, in particular, offers insight into the explanatory capability of a model; a high R2 suggests that the model captures a substantial portion of the variability in the target response. Nevertheless, while a large R2 is advantageous for linear relationships, it may provide misleading interpretations when nonlinear patterns dominate the dataset. MSE quantifies the magnitude of prediction errors, reflecting how distant the predicted outputs are from the true values—thus, a smaller MSE signifies better predictive performance. MAPE expresses the average prediction error as a percentage, allowing the model’s accuracy to be interpreted more intuitively. For instance, a MAPE value of 10% indicates that the model’s outputs deviate from actual values by an average of 10%.
The mathematical formulations for these evaluation metrics are provided in Equations (1)–(4) [19].
R M S E = i = 1 n ( x i x i ) 2 N
M A E = 1 N i = 1 n x i x i
R 2 = 1 i = 1 n ( x i x i ) 2 i = 1 n ( x i x i )
M A P E = i = 1 n 1 N x i x i x i

3. Experiments and ML Analysis Results and Discussion

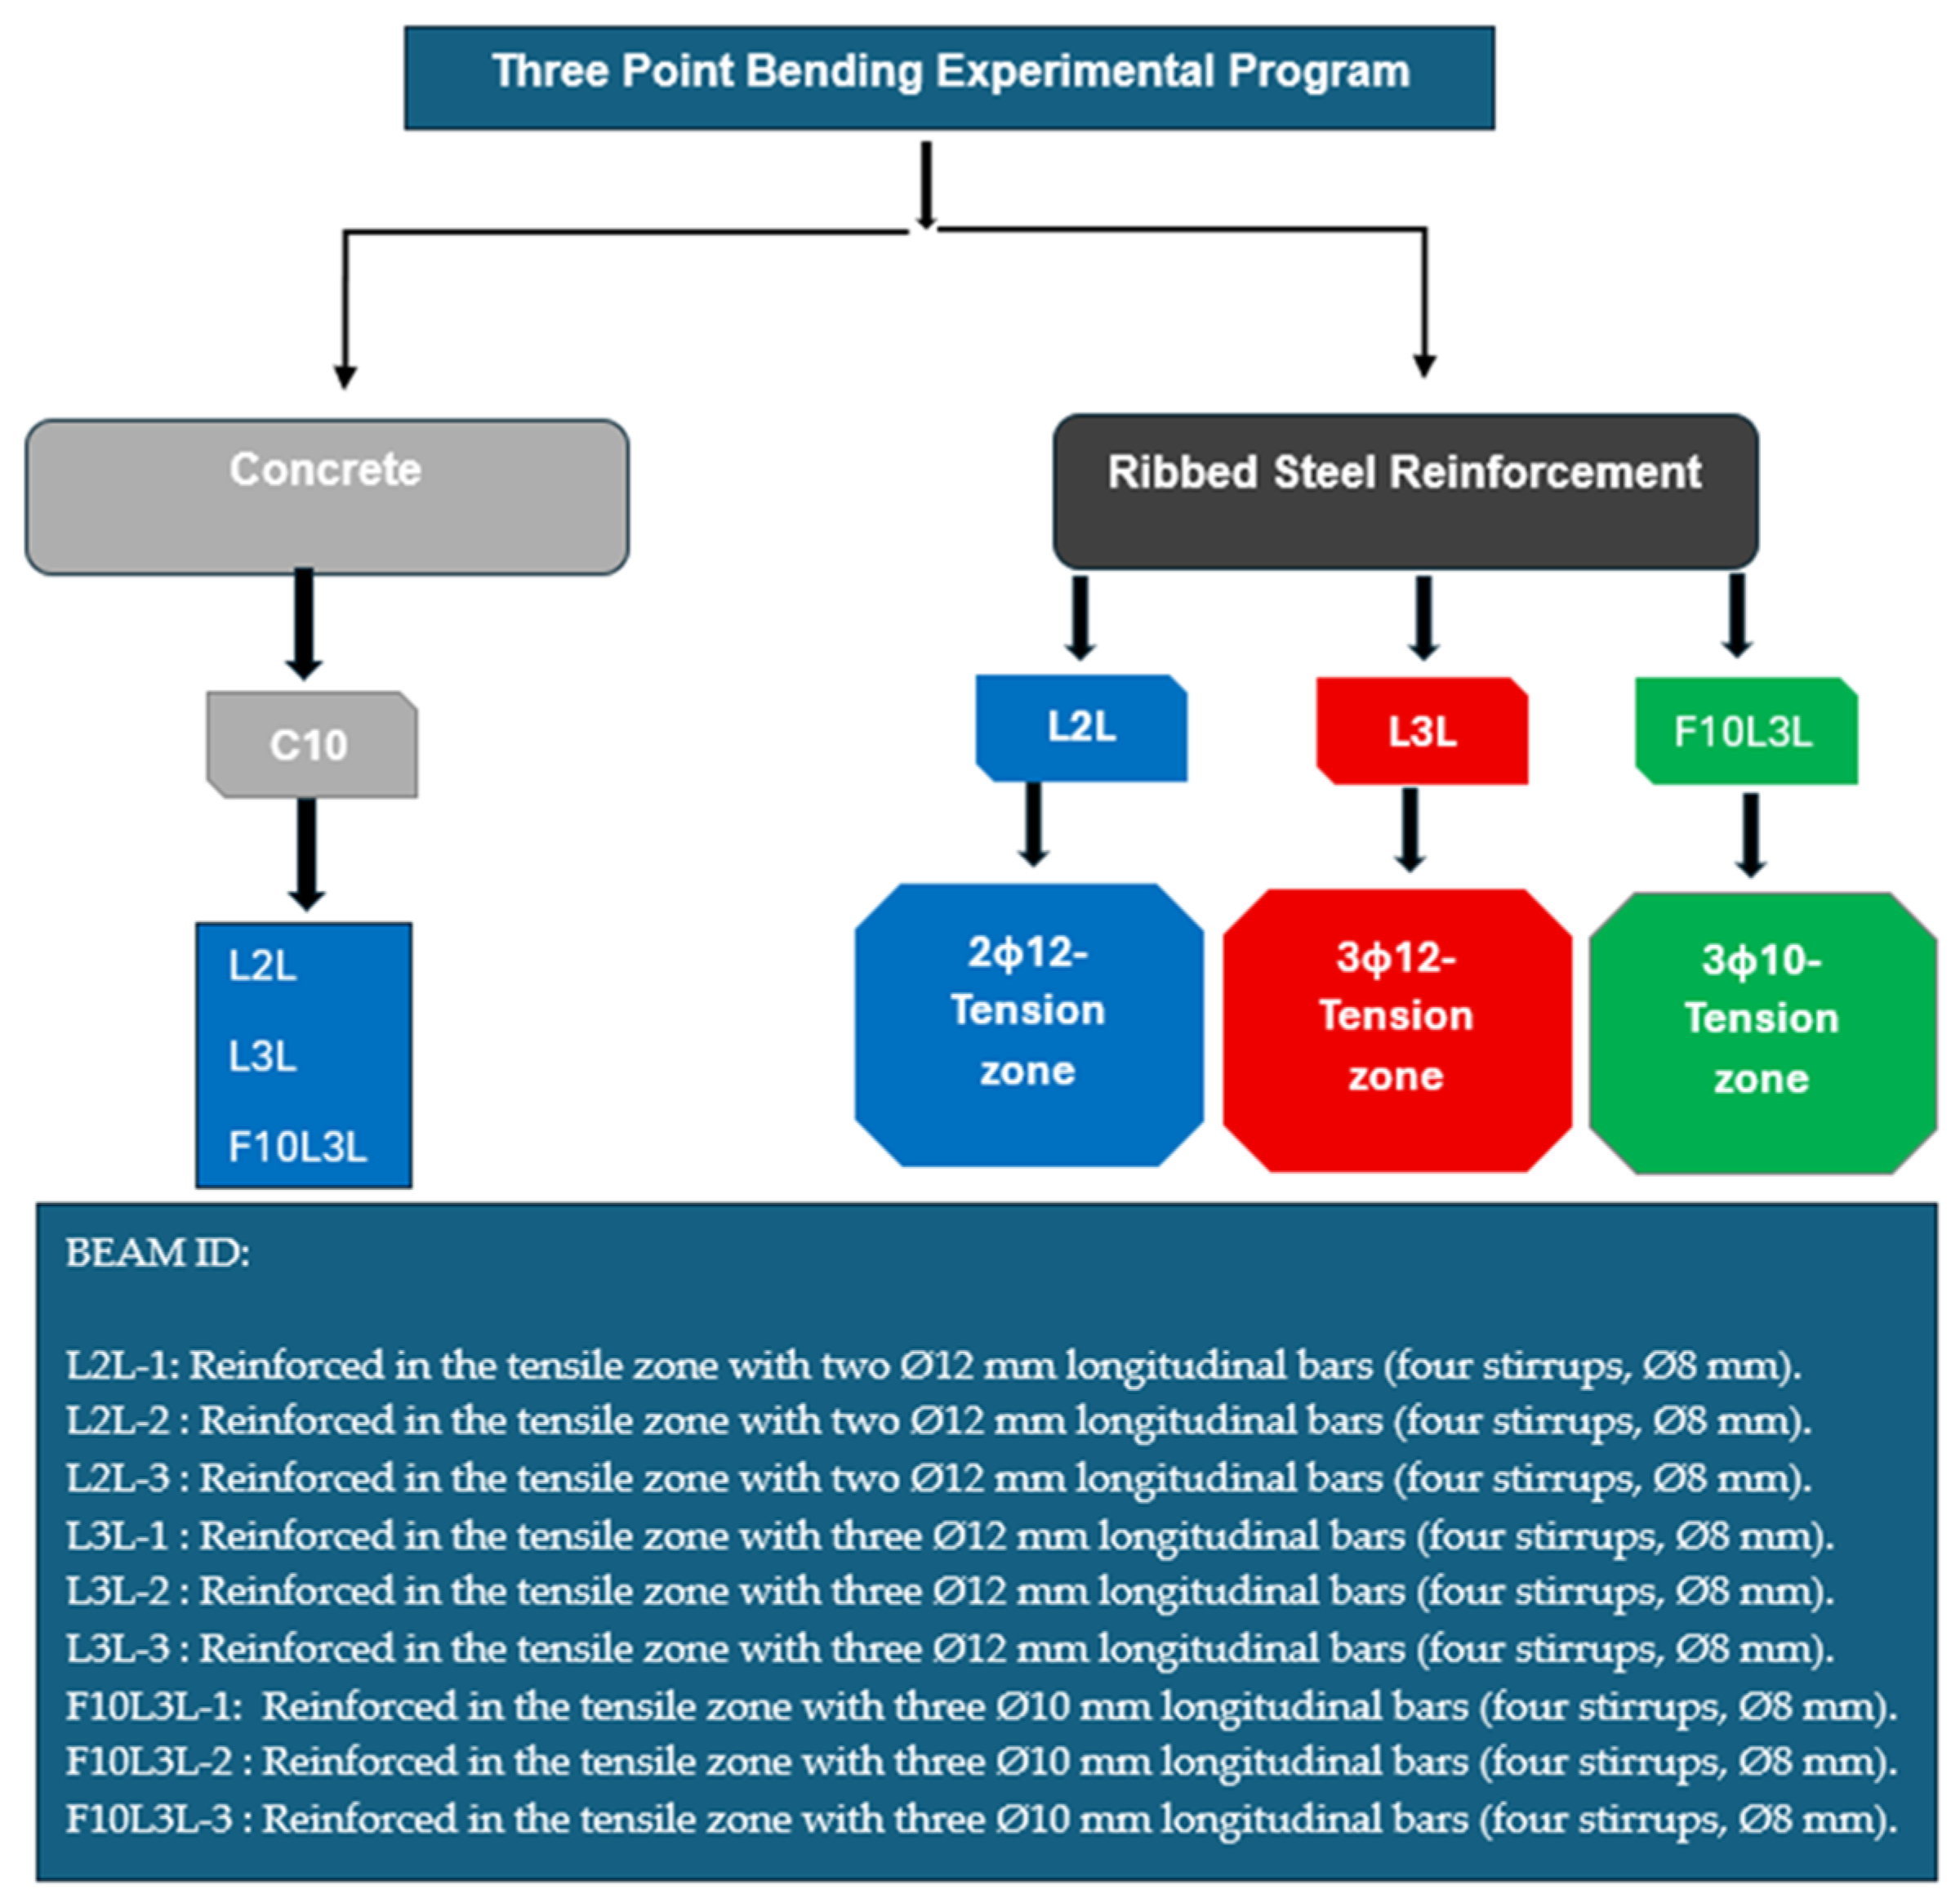
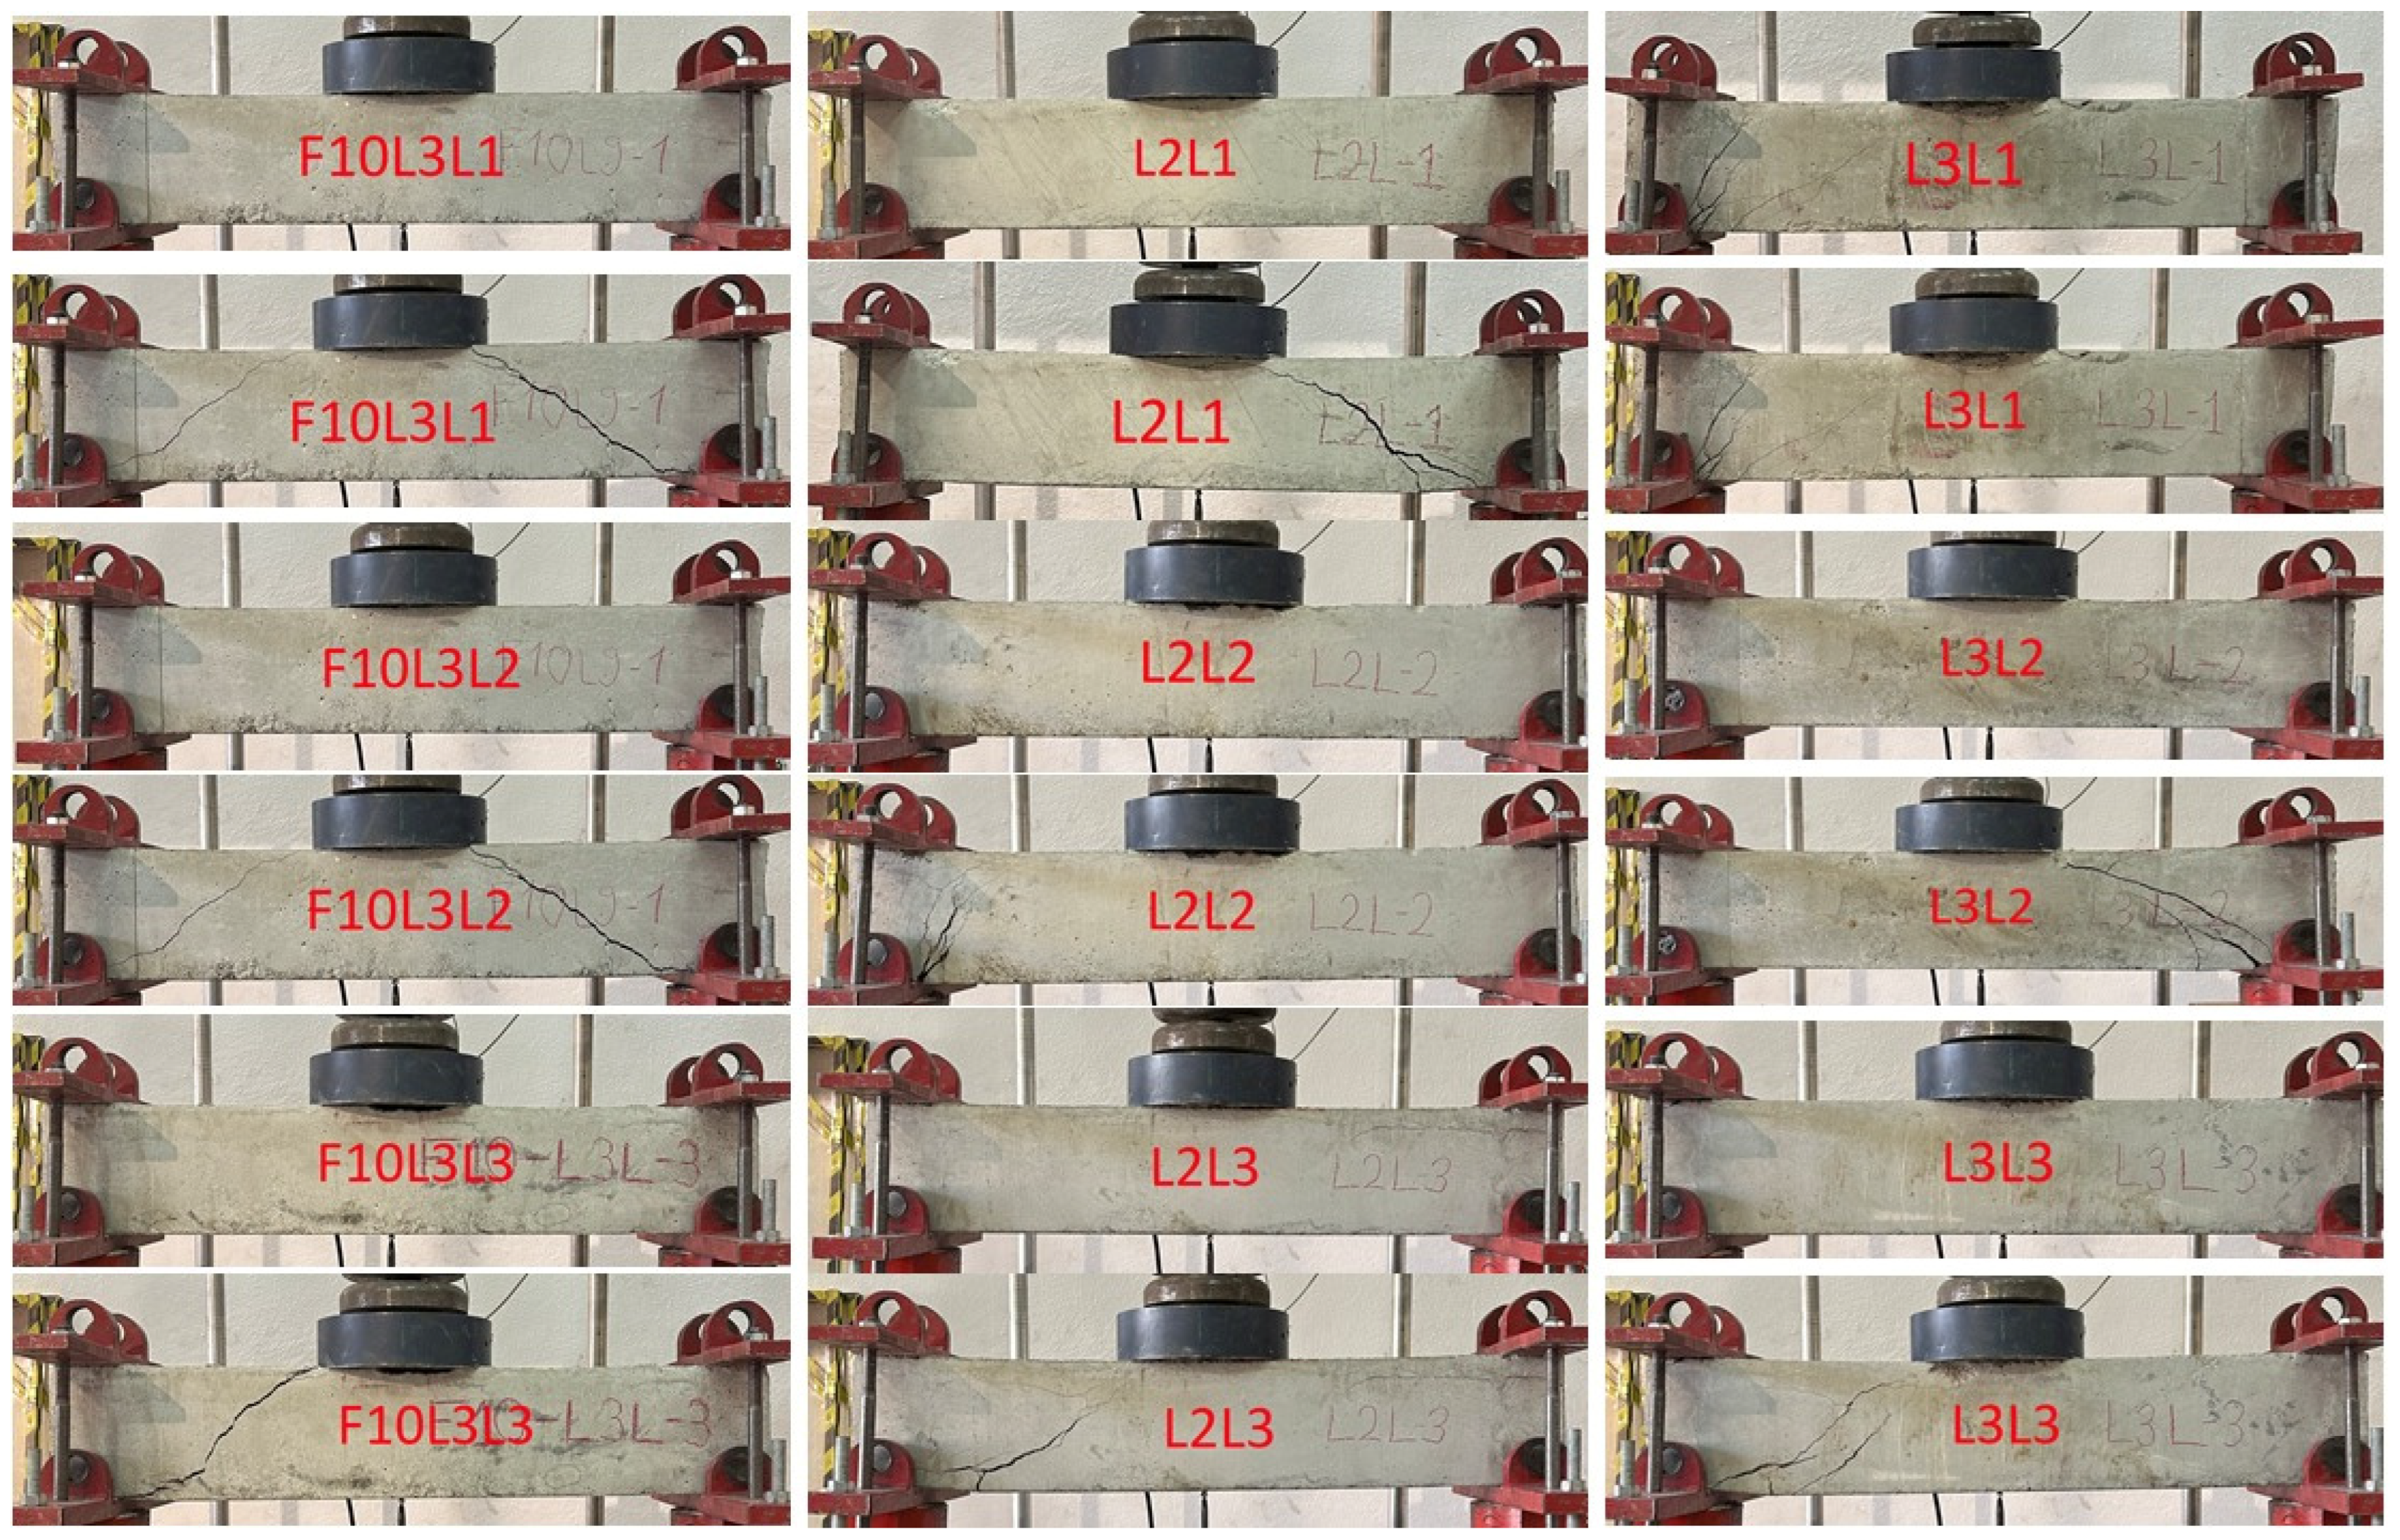
In this study, nine reinforced concrete beams produced with low-strength concrete and configured with three distinct longitudinal reinforcement layouts were subjected to three-point bending tests. The first series, identified by the designation F10L3L, consisted of specimens reinforced with three Ø10 longitudinal bars in the tensile zone and two Ø10 longitudinal bars in the compression zone. Additionally, Ø8 stirrups spaced at 30 cm were provided along the span to ensure adequate shear resistance. All beams were manufactured with nominal dimensions of 150 × 200 × 1100 mm. The beams belonging to this group were coded as F10L3L-1, F10L3L-2, and F10L3L-3, representing the low-strength concrete specimens fabricated under the same reinforcement configuration. The L2L and L3L specimen groups were produced with low concrete compressive strength and reinforced with Ø8 four stirrups spaced at 30 cm. In the L2L group, two Ø12 longitudinal bars were placed in both the tension and compression zones, and the specimens were designated as L2L-1, L2L-2, and L2L-3. In the L3L group, the tension zone reinforcement consisted of three Ø10 longitudinal bars, while the compression zone contained three Ø12 bars; these specimens were labeled L3L-1, L3L-2, and L3L-3. Figure 8 illustrates both the pre- and post-loading states of the low-strength reinforced concrete beams tested under three-point bending, together with the characteristic damage mechanisms that developed throughout the experiments. To ensure a clear understanding of beam group details, the following beam details are presented comprehensively as examples from each group of beams.
  • F10L3L-1: Specimen 1 with low concrete compressive strength, reinforced in the tensile zone with three Ø10 mm longitudinal bars (four stirrups, Ø8 mm).
  • L3L-1: Specimen 1 with low concrete compressive strength, reinforced in the tensile zone with three Ø12 mm longitudinal bars (four stirrups, Ø8 mm).
  • L2L-1: Specimen 1 with low concrete compressive strength, reinforced in the tensile zone with two Ø12 mm longitudinal bars (four stirrups, Ø8 mm).
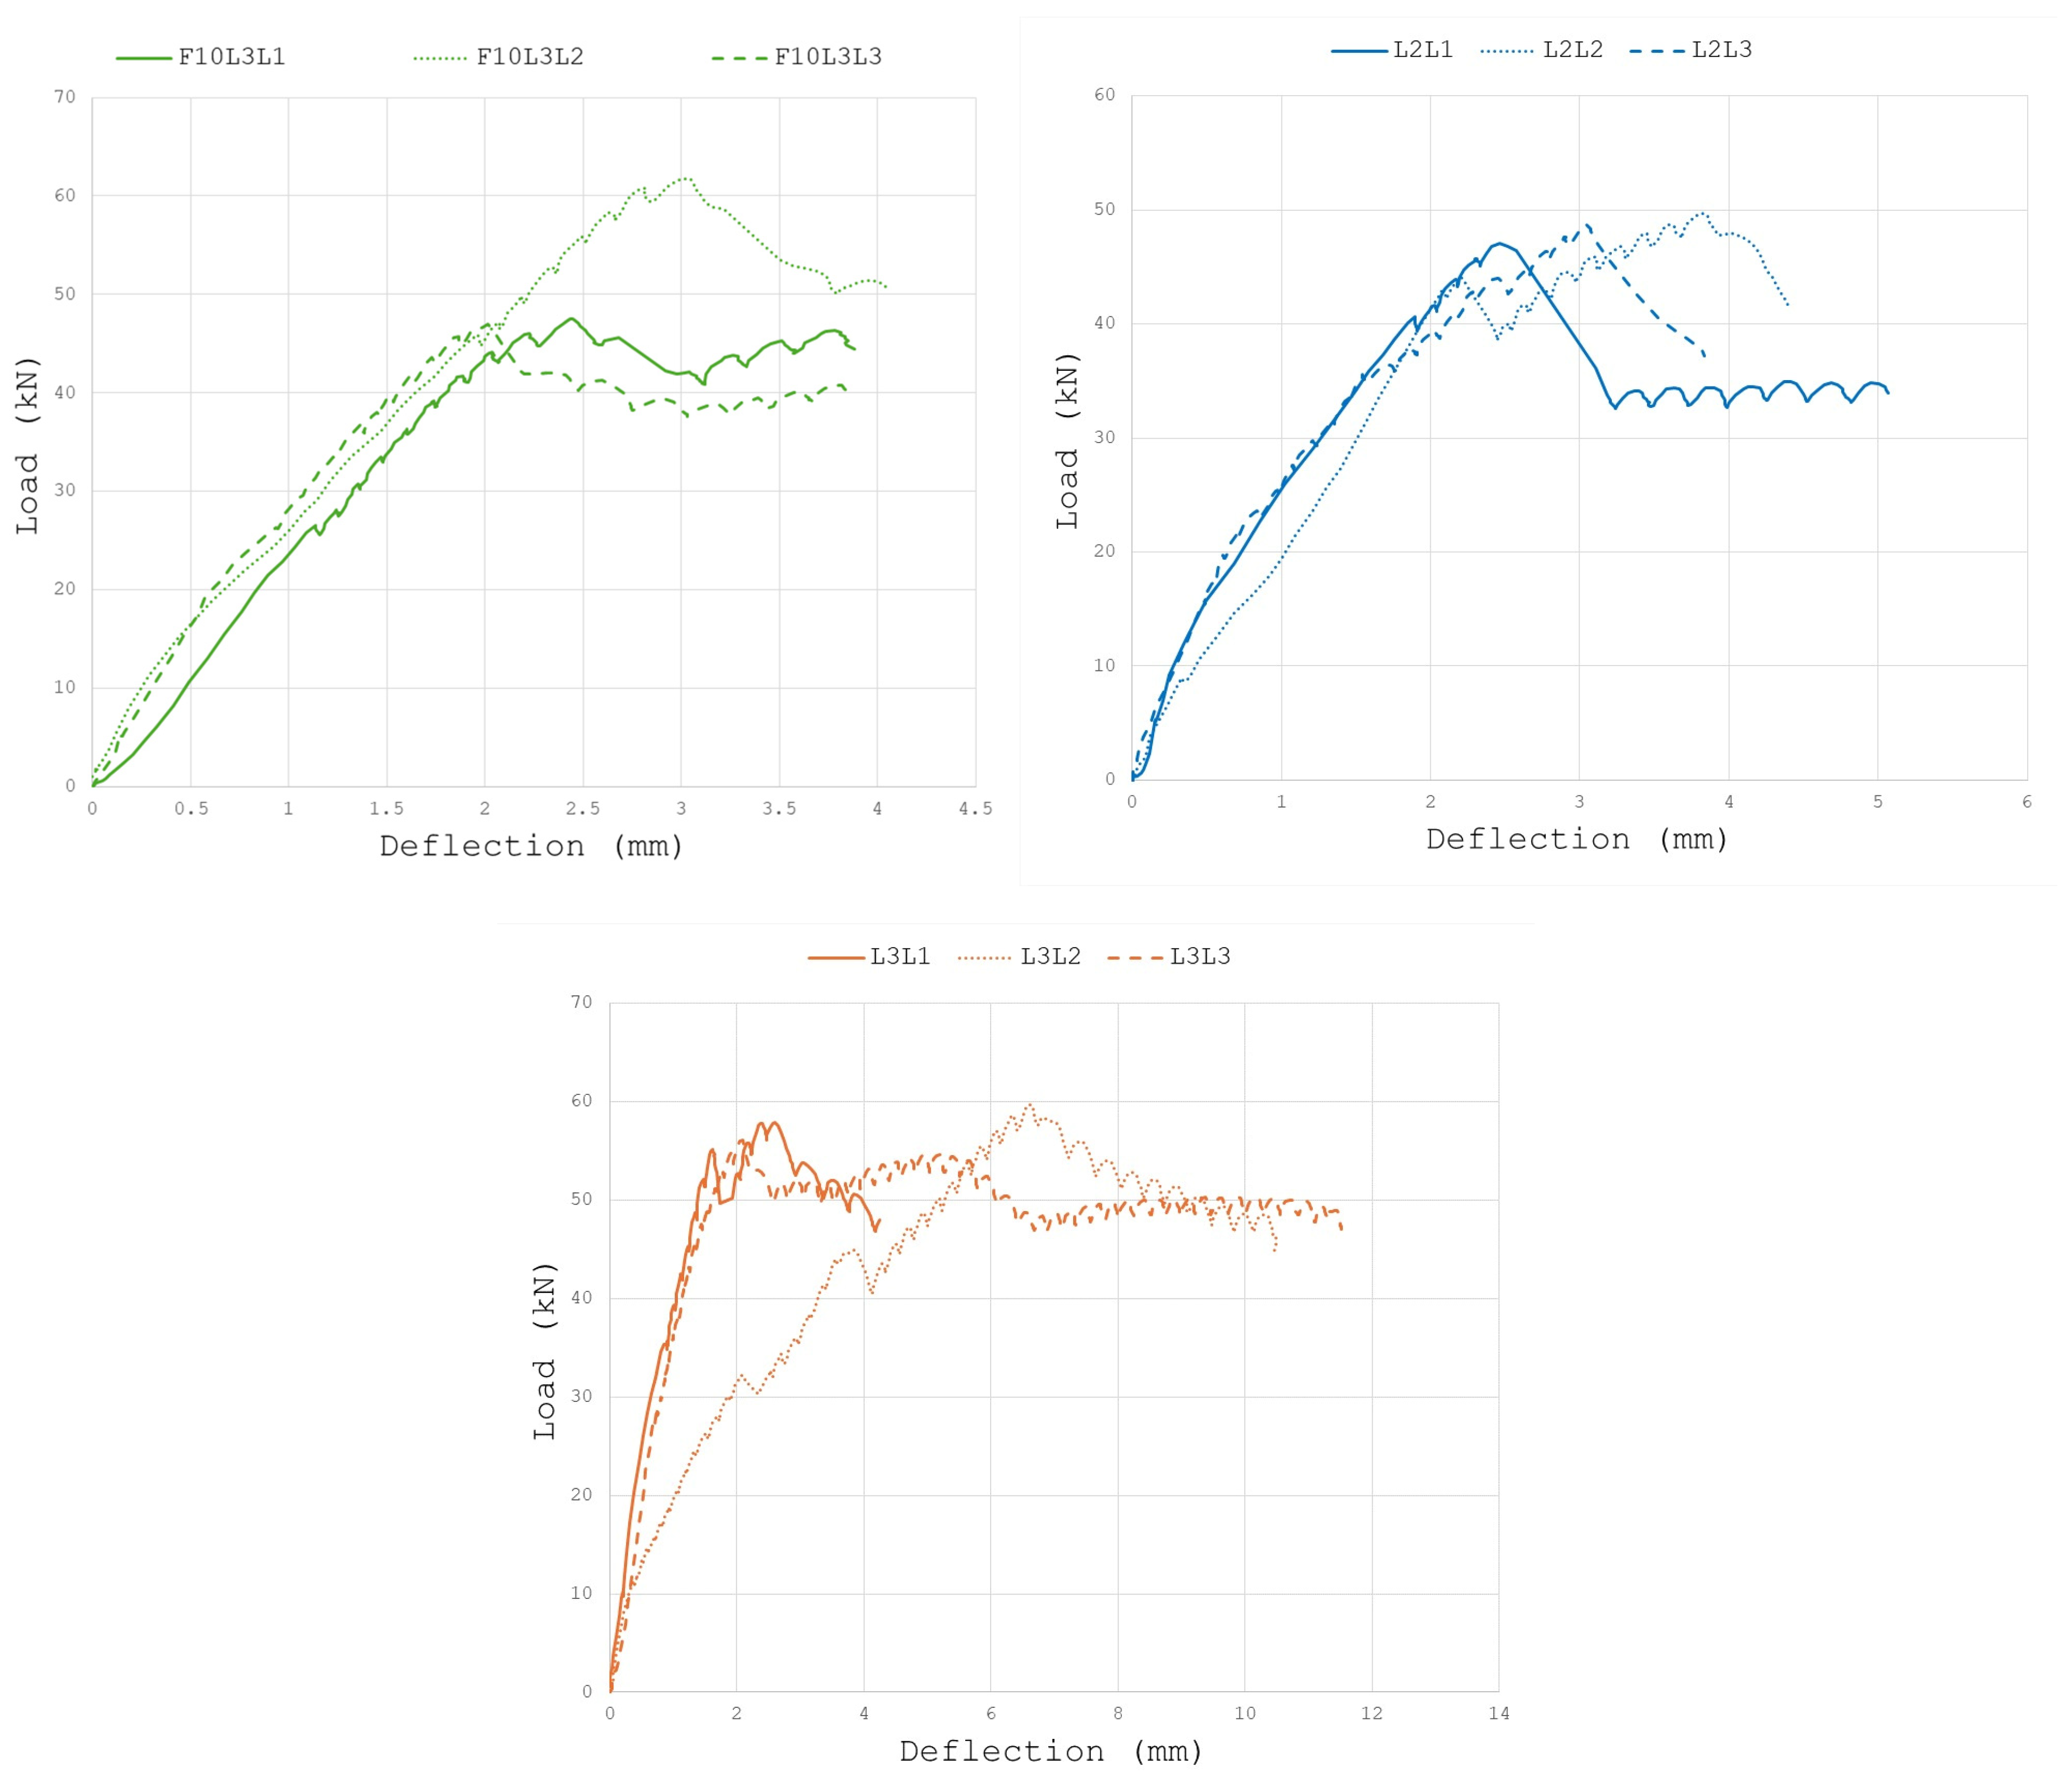
The experimental load–deflection curves are shown in Figure 9, enabling a direct comparison of the structural responses within each specimen group.
It can be interpreted from Figure 8 that, regardless of the reinforcement configuration, the beams in all three groups predominantly failed in shear cracking and exhibited generally similar load–deflection trends. As observed in Figure 9, the L3L group demonstrates higher load-carrying capacity and larger deflection values compared to the other groups. In terms of initial stiffness, the F10L3L group exhibits a steeper initial slope than the L2L and L3L groups, indicating a noticeably stiffer initial response.
The beams in the F10L3L and L2L groups reached their maximum load values within a deflection range of approximately 2–4 mm, whereas the beams in the L3L group attained their peak deflections in the range of roughly 2–6 mm.
The L3L group, which contains the highest longitudinal reinforcement ratio in the tension zone, exhibited the greatest load-carrying capacity, with an average peak load of approximately 58 kN. The presence of three Ø12 tensile reinforcement bars is the primary reason for the better performance and this significantly enhanced the flexural resistance of the beams.
Although the RC beams failed through concrete shear cracks and flexural–shear cracks before yielding of the reinforcement due to the very low concrete strength, it can be interpreted from the load–deflection curves presented in Figure 9 that variations in the diameter and number of tensile reinforcements made a significant contribution to the initial and secant stiffness of the beams and considerably enhanced their seismic energy dissipation capacity. The L2L group, which has the lowest tensile reinforcement ratio with two Ø12 longitudinal tensile bars, reached an average ultimate load capacity of approximately 48 kN. In contrast, the F10L3L group—characterized by a moderate reinforcement ratio through the use of three Ø10 tensile bars—achieved a higher average ultimate load of about 52 kN.
Furthermore, when the areas under the load–deflection curves are considered as indicators of energy dissipation capacity, it is observed that the L3L group exhibits a higher energy absorption capability. This behavior is attributed to the greater total cross-sectional area of tensile reinforcement used in this group.
It is noteworthy that none of the beams in the L3L group (L3L-1, L3L-2, and L3L-3) exhibited a peak load below 50 kN, and their responses were highly consistent and closely aligned. These results indicate that, among the three groups examined, the L3L configuration provides the most favorable reinforcement arrangement in terms of structural performance.
The experimental results of the beams, including detailed measurements and the corresponding failure modes, are presented in Table 4.
In this study, the ultimate load–deflection behavior of the reinforced concrete beam specimens was predicted using a set of 18 machine learning regression algorithms, for which the evaluation indices—MAE, MSE, R2, RMSE, and RMSLE—were systematically computed. For each regression trial, the algorithm that produced the most accurate prediction was identified as the leading performer, and the corresponding model names along with the frequency of their superior performance are presented in Figure 8. The principal input and output variables incorporated into the machine learning models are listed in Table 5.
According to the parameter set provided in Table 5, the concrete compressive strengths (f′c) used in the analyses were derived independently for the C10 concrete class based on the 28-day cube compressive test results of the fresh concrete batches. The yield strength of the longitudinal steel reinforcement (fy) was taken as a constant value of 420 MPa. Beam geometry—including width, height, span length, and effective depth—was also treated as fixed for all analyses.
The ultimate load capacities (F) measured from the three-point bending tests ranged between 46.1 kN and 62.1 kN and were incorporated as the target output values in the regression models. Additionally, the reinforcement ratios (ρb), spanning from the minimum to the maximum provided in the experimental program, were included as key predictive variables to capture the influence of longitudinal reinforcement variation on structural response.
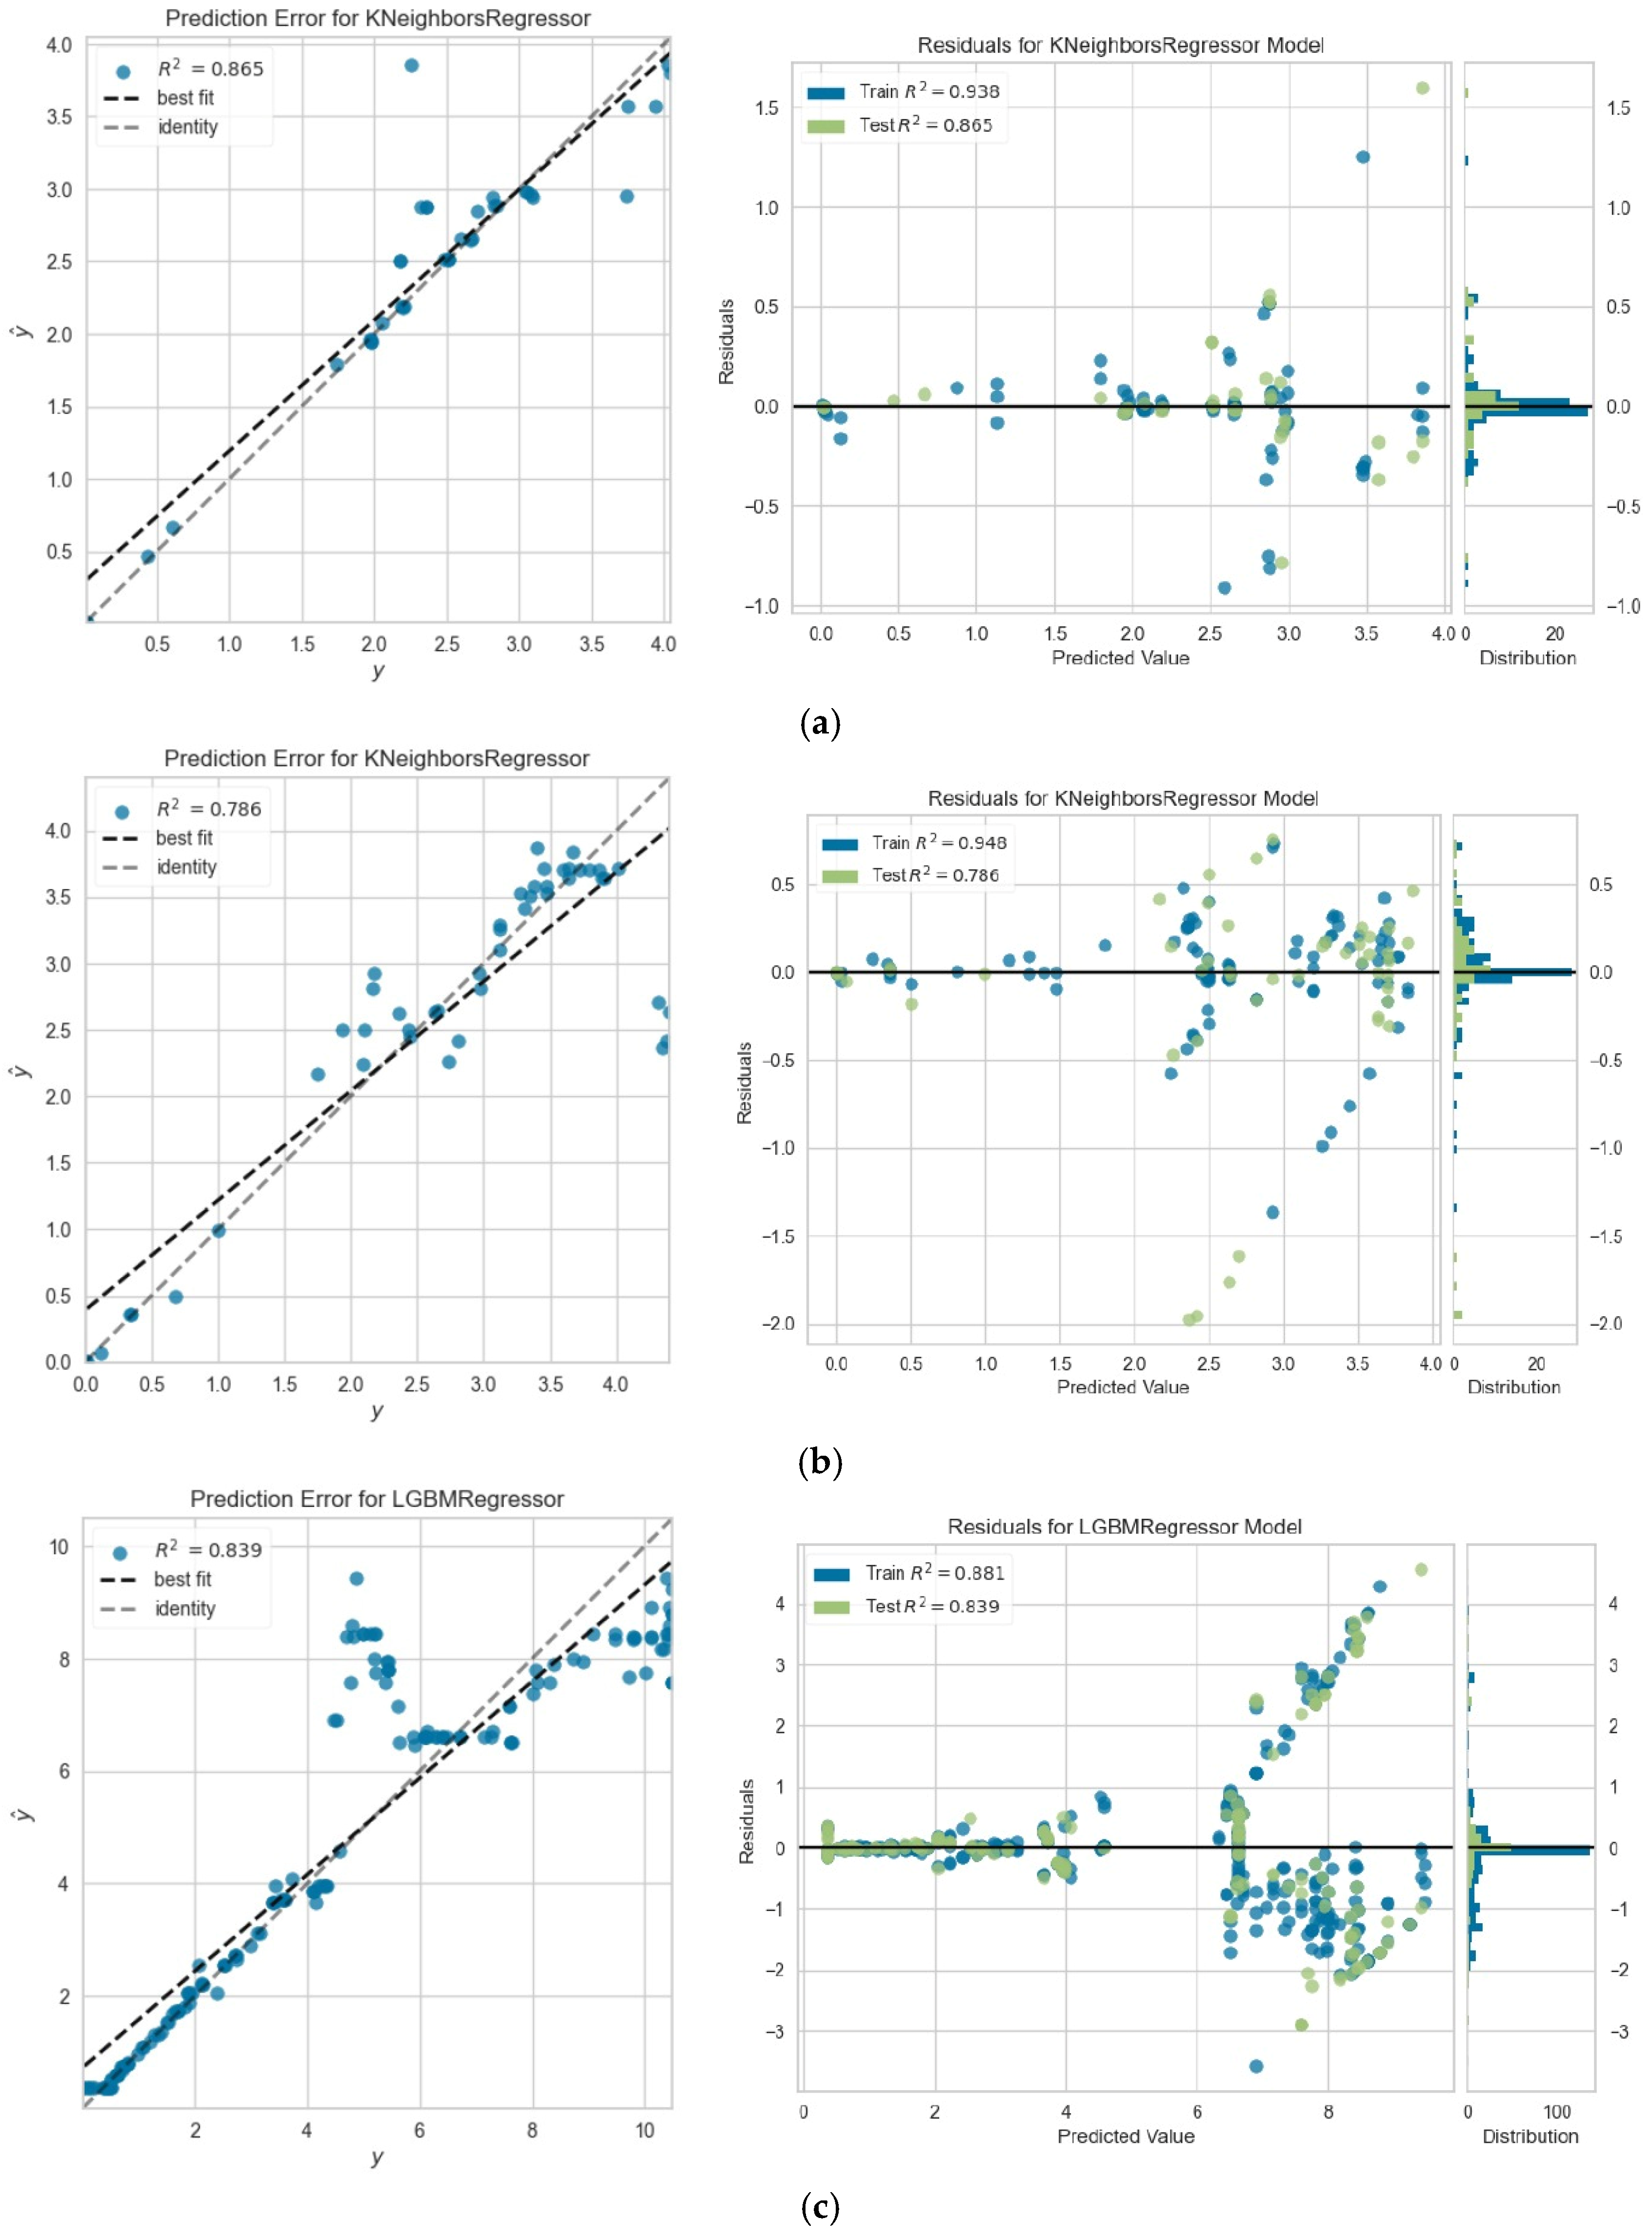
Figure 10 illustrates the prediction error and residual distributions associated with the L2L2, L3L2, and F10L3L2 models.
For the prediction of load–deflection values of reinforced concrete beams with low concrete strength, machine learning regression analyses were conducted, and among the 18 different models evaluated for each beam, the models that yielded the best performance along with their numerical results are presented in Table 6.
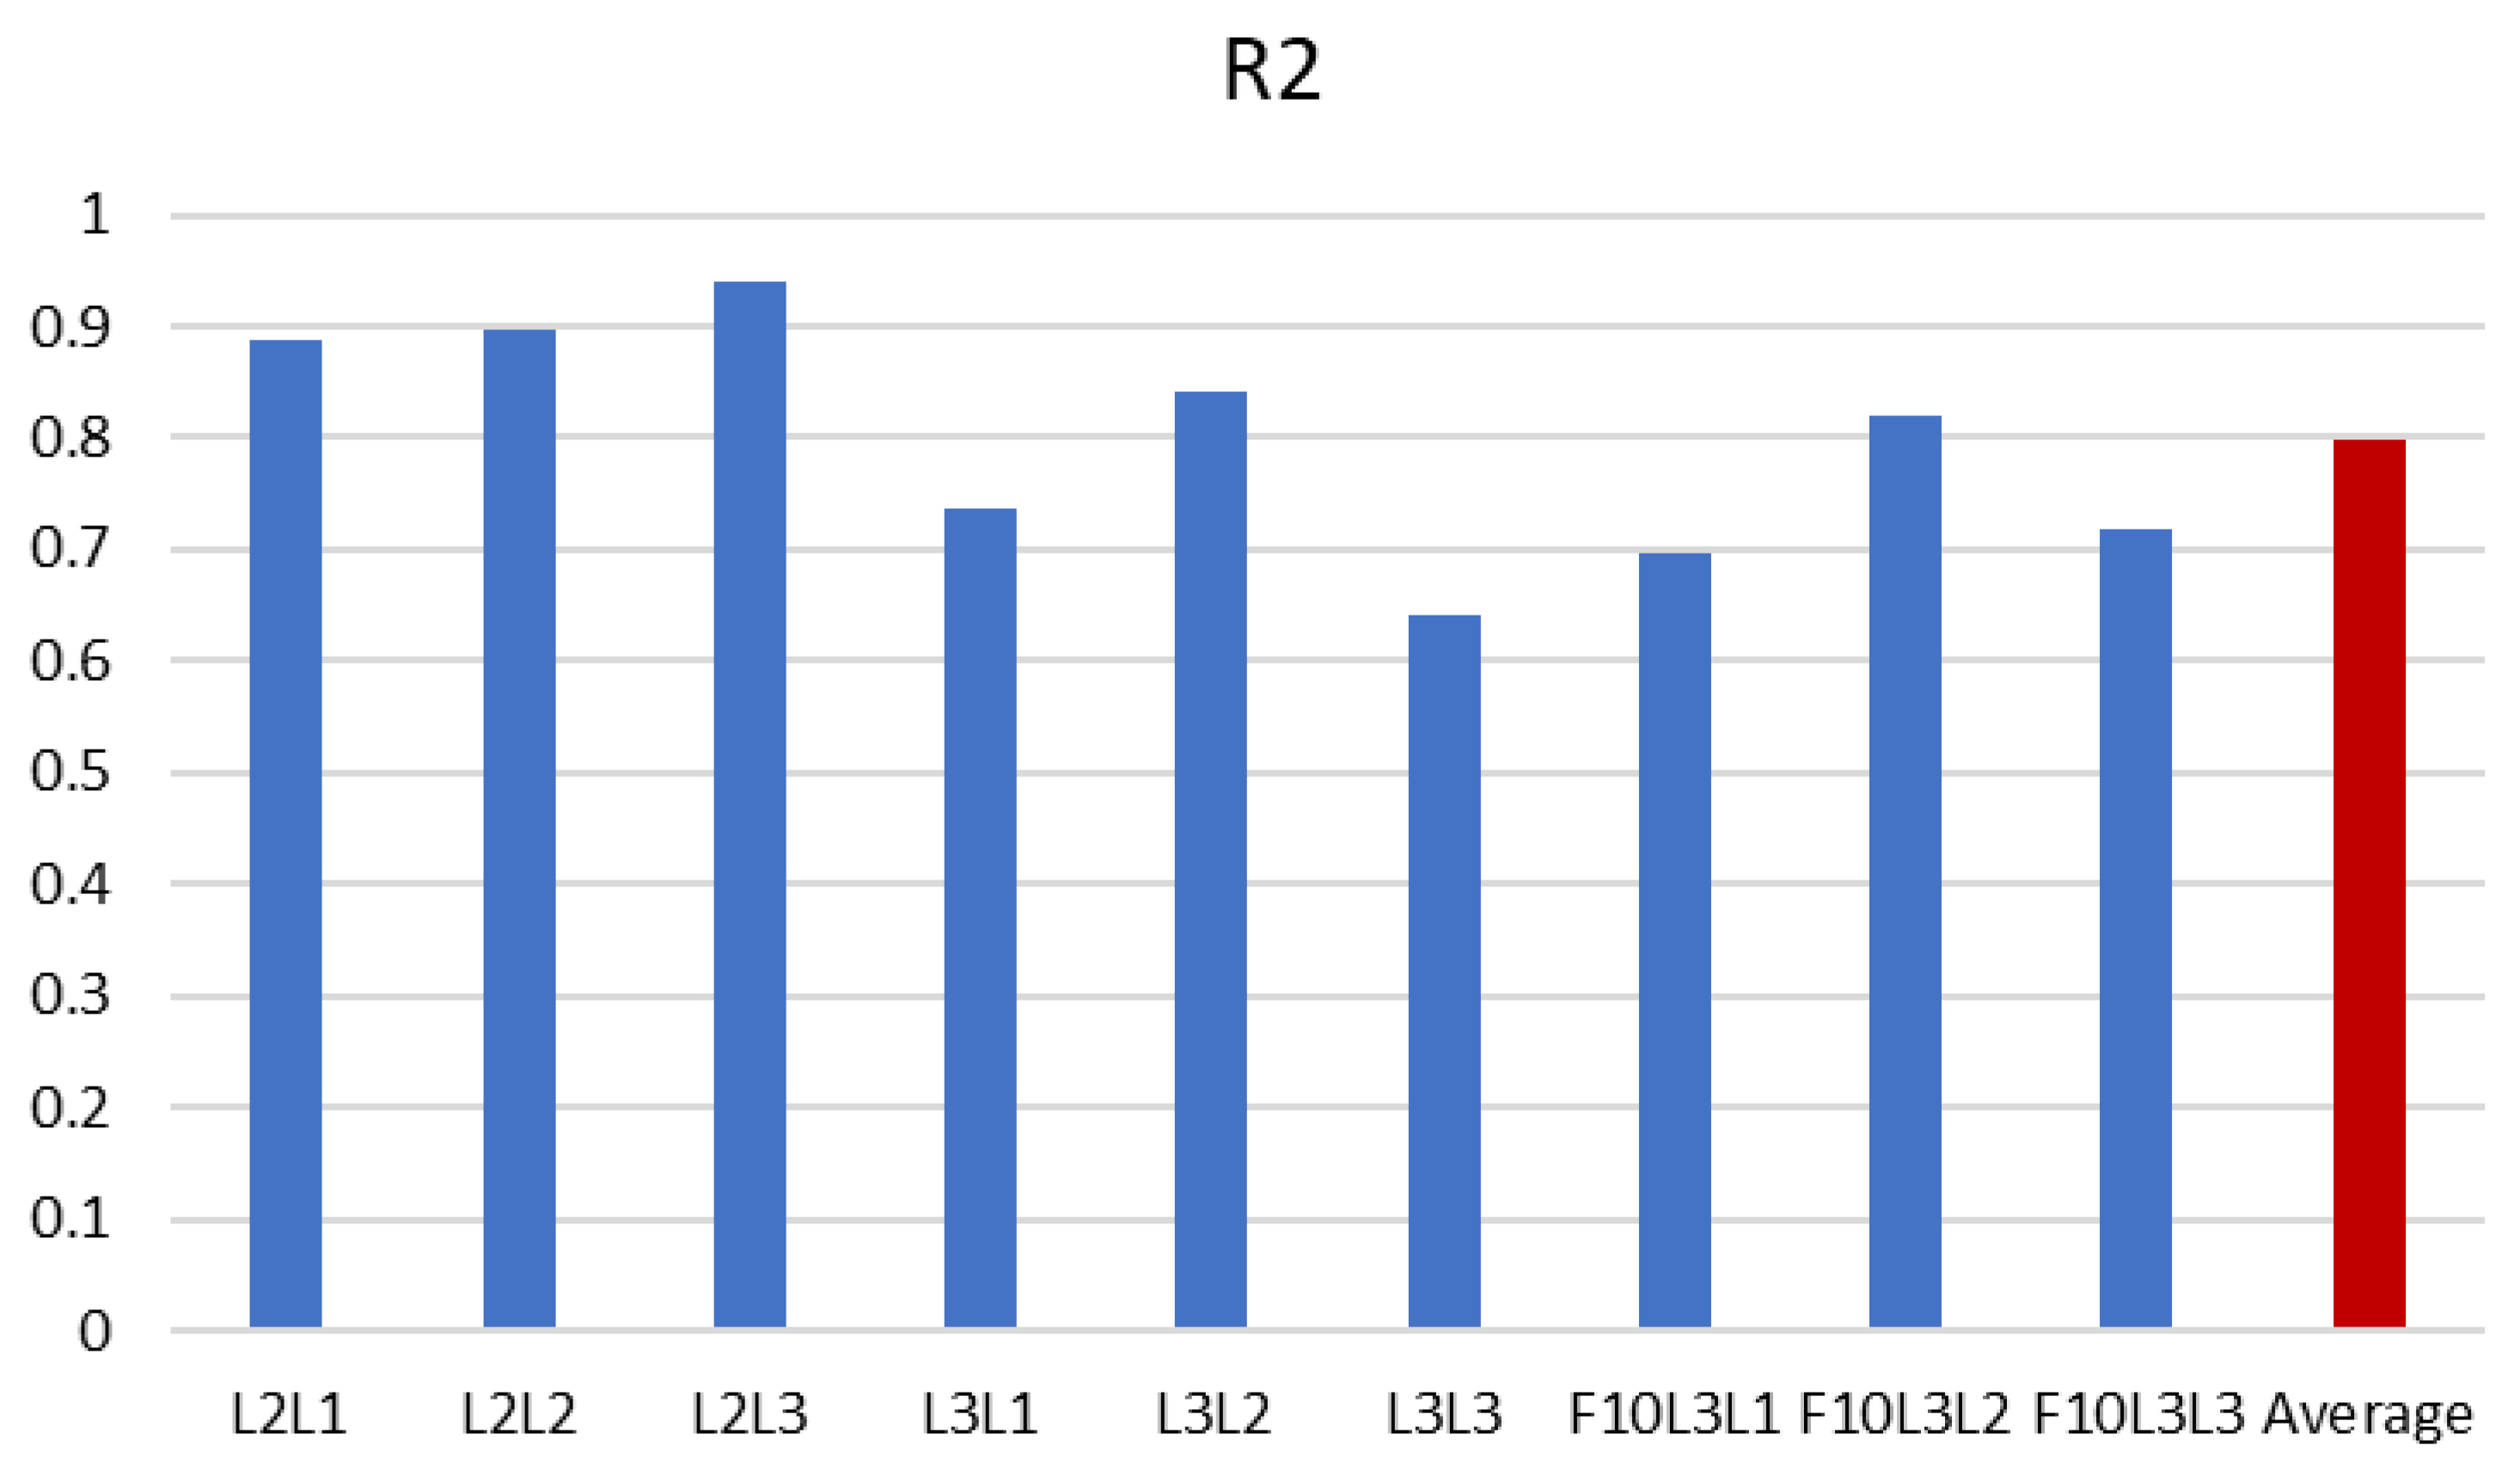
When the results of the machine learning analyses are evaluated, it is observed that among the 18 ML regression models applied for the nine beams, the K Neighbors Regressor model yielded the best prediction performance most frequently, achieving this outcome in five cases. Following this, the Light Gradient Boosting Machine model and the AdaBoost Regressor model each produced the best prediction results twice. Furthermore, in predicting the deflection of low-strength reinforced concrete beams, the K Neighbors Regressor model provided the highest and most consistent accuracy, with an R2 value of 0.9392, while the Light Gradient Boosting Machine model also demonstrated higher predictive accuracy compared to the AdaBoost Regressor model. It was determined that the beam designated as L2L3 exhibited the highest prediction accuracy in terms of the R2 value, whereas the beam designated as L3L3 had the lowest R2 value. The ML deflection prediction performance for each beam, along with the overall average, is presented in Figure 11.
As presented in Figure 11, the average deflection prediction success of the ML models for steel RC beams with low concrete strength was obtained to be approximately 80%. Considering the values reported in the literature, this level of accuracy can be regarded as both consistent and satisfactory. Furthermore, to achieve improved prediction performance, it is recommended to increase the amount of experimental data and to implement purpose-oriented refinements in the algorithms.

4. Conclusions

In this study, the flexural behavior and crack mechanisms of steel-reinforced concrete beams with low concrete strength—an area scarcely addressed in the existing literature—were investigated under various longitudinal reinforcement configurations. Additionally, the deflections of these beams were predicted using ML regression models. The principal conclusions derived from the research are presented below:
At this point, the influence of both the number of longitudinal tensile bars and their cross-sectional area on the load-carrying capacity of low-strength concrete beams has been clearly demonstrated. The formation of the crack mechanism and the failure of the RC beams occurred through shear cracking, independent of the steel reinforcement configuration.
Among the low-strength concrete beams, the L3L group—which possesses the highest tensile longitudinal reinforcement ratio—exhibited the highest overall load-carrying capacity on average.
The experimental results revealed that the L3L group, characterized by the highest tensile longitudinal reinforcement ratio, demonstrated the greatest initial stiffness, while the L2L group, which contains the lowest amount of tensile longitudinal reinforcement, exhibited the lowest initial stiffness. These results verify that the amount of longitudinal reinforcement in the tension region directly affects the initial stiffness of the beams.
The overall success of the ML regression models in predicting the deflection capacity of low-strength concrete beams was found to be satisfactory, achieving an average accuracy of approximately 80%.
Considering the results of the study, the use of the K Neighbors Regressor model is recommended for predicting the load–deflection capacity of steel-reinforced concrete beams with low concrete strength, as it demonstrated the most reliable performance among the machine learning regression models. Additionally, the Light Gradient Boosting Machine and AdaBoost Regressor models were also found to perform successfully in these prediction tasks.
Another conclusion drawn from the study is that, among the low-strength steel reinforced concrete beams, the L2L group—which possessed the lowest tensile longitudinal reinforcement ratio—generally exhibited a higher R2 prediction accuracy with R2 values of 0.89, 0.90, and 0.94, respectively.

Author Contributions

Conceptualization, M.K. and B.C.Ö.; methodology, M.K. and B.C.Ö.; software, B.C.Ö., B.T. and M.K.; validation, M.K., B.C.Ö. and B.T.; formal analysis, H.Ö.; investigation, M.K. and B.C.Ö. resources, B.C.Ö.; data curation, B.C.Ö. and M.K.; writing—original draft preparation, B.C.Ö. and M.K.; writing—review and editing, B.T.; visualization, B.T.; supervision, B.T. and M.K.; project administration, B.C.Ö.; funding acquisition, B.C.Ö. and M.K. All authors have read and agreed to the published version of the manuscript.

Funding

This research received no external funding.

Data Availability Statement

The experimental data is available upon request.

Acknowledgments

The authors are grateful to Zonguldak Bulent Ecevit University, Sakarya University and Ankara University for sample preparation, experiments and analysis. This publication is generated from Batuhan Cem ÖĞE’s thesis study titled “Predicting the Ultimate Load Carrying Capacity and Deflection Values of Concrete Beams using Machine Learning Methods”.

Conflicts of Interest

The authors declare no conflicts of interest.

References

  1. De Stefano, M.; Tanganelli, M.; Viti, S. On the Variability of Concrete Strength as a Source of Irregularity in Elevation for Existing RC Buildings: A Case Study. Bull. Earthq. Eng. 2013, 11, 1711–1726. [Google Scholar] [CrossRef]
  2. Bozdogan, O.; Erdag, A.; Ozdemir, A. Determination of Mechanical Properties of Concrete and Steel Materials Taken from Buildings in Antakya after the Kahramanmaraş Earthquakes. Case Stud. Constr. Mater. 2024, 21, e03445. [Google Scholar] [CrossRef]
  3. Zengin, B.; Aydin, F. The Effect of Material Quality on Buildings Moderately and Heavily Damaged by the Kahramanmaraş Earthquakes. Appl. Sci. 2023, 13, 10668. [Google Scholar] [CrossRef]
  4. Ben Chaabene, W.; Flah, M.; Nehdi, M.L. Machine Learning Prediction of Mechanical Properties of Concrete: Critical Review. Constr. Build. Mater. 2020, 260, 119889. [Google Scholar] [CrossRef]
  5. Solhmirzaei, R.; Salehi, H.; Kodur, V.; Naser, M.Z. Machine Learning Framework for Predicting Failure Mode and Shear Capacity of Ultra High Performance Concrete Beams. Eng. Struct. 2020, 224, 111221. [Google Scholar] [CrossRef]
  6. Feng, D.C.; Liu, Z.T.; Wang, X.D.; Jiang, Z.M.; Liang, S.X. Failure Mode Classification and Bearing Capacity Prediction for Reinforced Concrete Columns Based on Ensemble Machine Learning Algorithm. Adv. Eng. Inform. 2020, 45, 101126. [Google Scholar] [CrossRef]
  7. Nariman, N.A.; Hamdia, K.; Ramadan, A.M.; Sadaghian, H. Optimum Design of Flexural Strength and Stiffness for Reinforced Concrete Beams Using Machine Learning. Appl. Sci. 2021, 11, 8762. [Google Scholar] [CrossRef]
  8. Deng, M.; Zhang, M.; Ma, F.; Li, F.; Sun, H. Flexural Strengthening of Over-Reinforced Concrete Beams with Highly Ductile Fiber-Reinforced Concrete Layer. Eng. Struct. 2021, 231, 111725. [Google Scholar] [CrossRef]
  9. Zheng, D.; Wu, R.; Sufian, M.; Kahla, N.B.; Atig, M.; Deifalla, A.F.; Accouche, O.; Azab, M. Flexural Strength Prediction of Steel Fiber-Reinforced Concrete Using Artificial Intelligence. Materials 2022, 15, 5194. [Google Scholar] [CrossRef]
  10. Couto, C.; Real, P.V. Machine Learning Models for the Ultimate Strength of Steel Beams—Influence of Bending Moment Diagram. Ce/Papers 2023, 6, 848–853. [Google Scholar] [CrossRef]
  11. Abdallah, M.H.; Thoeny, Z.A.; Henedy, S.N.; Al-Abdaly, N.M.; Imran, H.; Bernardo, L.F.A.; Al-Khafaji, Z. The Machine-Learning-Based Prediction of the Punching Shear Capacity of Reinforced Concrete Flat Slabs: An Advanced M5P Model Tree Approach. Appl. Sci. 2023, 13, 8325. [Google Scholar] [CrossRef]
  12. Qin, X.; Kaewunruen, S. Eco-Friendly Design and Sustainability Assessments of Fibre-Reinforced High-Strength Concrete Structures Automated by Data-Driven Machine Learning Models. Sustainability 2023, 15, 6640. [Google Scholar] [CrossRef]
  13. Cao, Y.; Zandi, Y.; Agdas, A.S.; Wang, Q.; Qian, X.; Fu, L.; Wakil, K.; Selmi, A.; Issakhov, A.; Roco-Videla, A. A Review Study of Application of Artificial Intelligence in Construction Management and Composite Beams. Steel Compos. Struct. 2021, 39, 685–700. [Google Scholar] [CrossRef]
  14. Tipu, R.K.; Batra, V.; Suman; Pandya, K.S.; Panchal, V.R. Enhancing Load Capacity Prediction of Column Using EReLU-Activated BPNN Model. Structures 2023, 58, 105600. [Google Scholar] [CrossRef]
  15. Phan, V.T.; Tran, V.L.; Nguyen, V.Q.; Nguyen, D.D. Machine Learning Models for Predicting Shear Strength and Identifying Failure Modes of Rectangular RC Columns. Buildings 2022, 12, 1493. [Google Scholar] [CrossRef]
  16. Tuken, A.; Abbas, Y.M.; Siddiqui, N.A. Efficient Prediction of the Load-Carrying Capacity of ECC-Strengthened RC Beams—An Extra-Gradient Boosting Machine Learning Method. Structures 2023, 56, 105053. [Google Scholar] [CrossRef]
  17. Kang, M.C.; Yoo, D.Y.; Gupta, R. Machine Learning-Based Prediction for Compressive and Flexural Strengths of Steel Fiber-Reinforced Concrete. Constr. Build. Mater. 2021, 266, 121117. [Google Scholar] [CrossRef]
  18. Karabulut, M. Influence of Training–Testing Data Variation on ML-Based Deflection Prediction of GFRP-Reinforced High-Strength Concrete Beams. Polymers 2025, 18, 55. [Google Scholar] [CrossRef]
  19. Karabulut, M. Nonlinear Load-Deflection Analysis of Steel Rebar-Reinforced Concrete Beams: Experimental, Theoretical and Machine Learning Analysis. Buildings 2025, 15, 432. [Google Scholar] [CrossRef]
  20. Karabulut, M. Investigation of the Bending Strength of Glass Fiber-Reinforced Polymer (GFRP) Bars Exposed to Thermal Stress. J. Struct. Eng. Appl. Mech. 2025, 8, 1–12. [Google Scholar] [CrossRef]
  21. Karabulut, M. Machine Learning-Driven Flexural Performance Prediction and Experimental Investigation of Glass Fiber-Reinforced Polymer Bar-Reinforced Concrete Beams. Polymers 2025, 17, 713. [Google Scholar] [CrossRef] [PubMed]
  22. Karabulut, M. Experimental and Regression Modeling of Short-Term Flexural Behavior of Steel- and GFRP-Reinforced Early-Age Concrete Beams. Buildings 2025, 15, 4049. [Google Scholar] [CrossRef]
  23. Ge, W.; Zhang, F.; Wang, Y.; Ashour, A.; Luo, L.; Qiu, L.; Fu, S.; Cao, D. Machine Learning Predictions for Bending Capacity of ECC-Concrete Composite Beams Hybrid Reinforced with Steel and FRP Bars. Case Stud. Constr. Mater. 2024, 21, e03670. [Google Scholar] [CrossRef]
  24. Xu, J.; Chen, Y.; Xie, T.; Zhao, X.; Xiong, B.; Chen, Z. Prediction of Triaxial Behavior of Recycled Aggregate Concrete Using Multivariable Regression and Artificial Neural Network Techniques. Constr. Build. Mater. 2019, 226, 534–554. [Google Scholar] [CrossRef]
  25. Almustafa, M.K.; Nehdi, M.L. Machine Learning Model for Predicting Structural Response of RC Columns Subjected to Blast Loading. Int. J. Impact Eng. 2022, 162, 104145. [Google Scholar] [CrossRef]
  26. Dogan, G. Machine Learning-Based Shear Strength Prediction of Exterior RC Beam-Column Joints. Multiscale Multidiscip. Model. Exp. Des. 2024, 7, 2319–2341. [Google Scholar] [CrossRef]
  27. Kazemi, F.; Asgarkhani, N.; Shafighfard, T.; Jankowski, R.; Yoo, D.Y. Machine-Learning Methods for Estimating Performance of Structural Concrete Members Reinforced with Fiber-Reinforced Polymers; Springer: Dordrecht, The Netherlands, 2025; Volume 32, ISBN 1183102410. [Google Scholar]
Figure 1. Testing of low-strength concrete specimens.
Buildings 16 00433 g001
Figure 2. The fabricated low-strength RC beams incorporating various longitudinal reinforcement configurations.
Buildings 16 00433 g002
Figure 3. Nonlinear stress–strain curve of S420 reinforcing steel.
Buildings 16 00433 g003
Figure 4. Experimental and schematic illustration of the three-point bending test setup and the longitudinal reinforcement details of the fabricated low-strength RC beams.
Buildings 16 00433 g004
Figure 5. Three point bending test setup.
Buildings 16 00433 g005
Figure 6. Schematic representation of the ML model employed in the present research.
Buildings 16 00433 g006
Figure 7. Cross-validation carried out with K = 5.
Buildings 16 00433 g007
Figure 8. Three-point bending tests of low-strength reinforced concrete steel RC beams.
Buildings 16 00433 g008
Figure 9. Load–deflection curves of the beams from the three different specimen groups.
Buildings 16 00433 g009
Figure 10. Prediction error and residual plots of RC beams: First row (a): L2L2, Second Row (b): L3L2, Third Row (c): F10L3L2.
Buildings 16 00433 g010
Figure 11. Deflection prediction performance and overall accuracy of ML models for low-strength RC beams.
Buildings 16 00433 g011
Table 1. Compressive strength values obtained from testing.
Specimen No.7-Day Cube Strength (MPa)28-Day Cube Strength (MPa)28-Day Cylinder Strength (MPa)
L 19.815.112.1
L 210.516.212.9
L 39.214.211.3
Table 2. Mix design for 15 MPa concrete (28-day cube strength)—per 1 m3.
ParameterValueNotes
Target compressive strength (cube)15 MPaAt 28 days
Water–cement ratio (w/c)0.70Typical range for low-strength concrete: 0.65–0.75
Cement content260 kg/m3CEM I 42.5R or equivalent
Water content182 L/m3w/c = 0.70
Maximum aggregate size16 mmCommon for RC beams
Fine aggregate (0–4 mm, sand)780 kg/m3Saturated Surface Dry condition
Coarse aggregate (4–16 mm)1050 kg/m3Saturated Surface Dry condition
Entrapped air (approx.)1–2%Non air-entrained concrete
(Optional) Plasticizer0–0.5% of cement weightTo improve workability without increasing w/c
Table 3. List of the machine learning regression models employed in this study.
ML Regression Model No.ML Regression Model NameML Model Name
Abbreviation
1Gradient Boosting Regressorgbr
2K Neighbors Regressorknn
3Ada Boost Regressorada
4Random Forest Regressorrf
5Light Gradient Boosting Machinelightgbm
6Extra Trees Regressoret
7Decision Tree Regressordt
8Lasso List Angle Regressorllar
9Ridge Regressionridge
10Bayesian Ridgebr
11Orthogonal Matching Pursuitomp
12Elastic Neten
13Least Angle Regressionlar
14Lasso Regressionlasso
15Linear Regressionlr
16Huber Regressionhuber
17Passive Aggressive Regressorpar
18Dummy Regressordummy
Table 4. Details of three-point bending test and results of reinforced concrete beams.
SeriesBeam No.RC Beam Failure BehaviorFailure Load,
Fexp (kN)
Maximum Mid Span Deflection, Δexp (mm)Failure Moment, Mexp (kN.m)
F10L3LF10L3L-1SC47.52.421.4
F10L3L-2SC62.13.127.9
F10L3L-3SC46.82.021.1
AverageF10L3L-ASC52.12.523.5
L2LL2L-1SC46.12.420.8
L2L-2SC48.53.821.8
L2L-3SC49.73.122.4
AverageL2L-ASC48.13.121.7
L3LL3L-1SC57.22.225.7
L3L-2SC59.76.226.9
L3L-3SC56.12.125.2
AverageL3L-ASC57.73.525.9
Table 5. Parameter details in the database.
FeatureTypeCmin (MPa)Cmax (MPa)Ave
fc′ (MPa)Input14.216.215.2
fy (MPa)Input420420420
b (mm)Input150150150
h (mm)Input200200200
d (mm)Input162162162
L (mm)Input110011001100
⍴b (%)Input0.8871.3311.047
F (kN)Input46.162.154.1
Δ (mm)Output26.24.1
Table 6. Analysis results of the ML regression models.
#Beam CodeMethodModelMAEMSERMSER2RMSLEMAPETT (s)
1L2L1lightgbmLight Gradient Boosting Machine0.310.190.420.890.1639.720.08
2L2L2knnK Neighbors Regressor0.210.110.320.900.080.130.01
3L2L3knnK Neighbors Regressor0.080.050.170.940.050.050.01
4L3L1knnK Neighbors Regressor0.360.340.560.740.170.280.01
5L3L2lightgbmLight Gradient Boosting Machine0.7715.9712.580.840.160.180.06
6L3L3adaAdaBoost Regressor16.2548.3821.800.640.350.570.01
7F10L3L1adaAdaBoost Regressor0.370.240.470.700.130.380.01
8F10L3L2knnK Neighbors Regressor0.150.080.260.820.070.100.01
9F10L3L3knnK Neighbors Regressor0.350.310.550.720.160.210.01
Disclaimer/Publisher’s Note: The statements, opinions and data contained in all publications are solely those of the individual author(s) and contributor(s) and not of MDPI and/or the editor(s). MDPI and/or the editor(s) disclaim responsibility for any injury to people or property resulting from any ideas, methods, instructions or products referred to in the content.