Article

Impact of Subway Platform Screen Door Opening and Closing on Particulate Matter Concentration Distribution at Different Locations and Times: The Case of Xi’an


1
Tianjin Chengjian University of Architectural Design and Research Co., Ltd., Tianjin 300000, China
2
CCCC Second Highway Engineering Co., Ltd., Xi’an 710065, China
3
Research and Development Center on Construction Technology of Long Bridge and Tunnel in Mountain Areas, CCCC, Xi’an 710199, China
4
State Key Laboratory of Green Building, Xian University of Architecture & Technology, Xi’an 710055, China
5
College of Architecture and Energy Engineering, Wenzhou University of Technology, Wenzhou 325000, China
*
Author to whom correspondence should be addressed.
Buildings 2026, 16(2), 356; https://doi.org/10.3390/buildings16020356
Submission received: 17 December 2025 / Revised: 13 January 2026 / Accepted: 14 January 2026 / Published: 15 January 2026
(This article belongs to the Section Building Energy, Physics, Environment, and Systems)

Abstract

To explore how the opening and closing of subway platform screen doors (PSD) affect particulate matter concentrations (PM10, PM2.5, and PM1.0) across different times (morning peak, off-peak, evening peak), and three key locations (subway tunnels, platforms, and waiting areas), we studied the Xi’an subway using a systematic monitoring approach, and a total of 6 monitoring points were monitored at 3 locations for 60 consecutive days of testing. The sampling time for each measurement point was 20 min, and a total of three groups were tested. The relationship between the opening/closing status of PSD and changes in particulate matter concentrations was then analyzed using statistical methods. The results showed that the particulate matter concentrations followed a sequential pattern: tunnel concentrations were higher than those in the waiting area, which in turn were higher than those at the platform center. PM10 concentrations exceeded China’s standards for indoor air quality (GB/T 18883-2022) at all three locations. For PM2.5, concentrations in the tunnel and waiting area exceeded the standard, while those at the platform center remained within the limit. Particles smaller than 1.0 μm constituted the dominant fraction of particulate matter in the tunnel, waiting area, and platform center. After the PSD opened, the peak average concentrations of PM10, PM2.5, and PM1.0 in the waiting area increased by 70.53%, 55.81%, and 42.41%, respectively, compared to the average concentrations before the train entered the station. PSD had a significant impact on fine particulate matter concentrations on the platform during the evening peak: PM10 concentrations in the front and rear of the waiting area were 37.85% and 57.61% higher than those in the middle, while PM2.5 concentrations in these two areas were 39.81% and 50.23% higher than in the middle. No obvious distribution pattern was observed for PM1.0. These results provide reference data for optimizing indoor air quality in the Xi’an subway and regulating the operation of platform screen doors.

1. Introduction

Under the wave of global urbanization, urban population density continues to rise, and problems such as traffic congestion and environmental pollution are becoming increasingly prominent [1,2]. Traditional ground transportation is no longer able to meet the needs of high-capacity and high-efficiency travel. The subway, with its outstanding advantages such as high transportation capacity, fast operating speed, low energy consumption, and low pollution, has become central to alleviating traffic, optimizing transportation structure, and promoting the construction of new urban areas [3,4,5]. As of the end of 2024, 47 cities in mainland China have opened subways, with a total operating mileage exceeding 14,000 km, making it the country with the largest subway network in the world [6].

1.1. Air Quality Challenges in Subway Environments

However, as a typical semi-enclosed underground space, the structure and operating environment of a subway result in poor air circulation and easy accumulation of pollutants. Air quality issues have gradually become a key factor restricting the improvement of subway service quality and public health protection [7]. Unlike the above-ground environment, subway spaces are relatively enclosed, with ventilation mainly relying on mechanical systems [8]. There are also numerous sources of internal pollutants resulting in high concentrations, including metal particles generated by train wheel rail friction and brake wear, dust from tunnel walls and tracks, external pollutants carried by passengers, and exhaust emissions from equipment operation [9]. Among them, particulate matter, as the most important pollutant in subways, can carry toxic and harmful substances such as heavy metals and polycyclic aromatic hydrocarbons due to its small particle size, large specific surface area, and strong adsorption capacity. Long-term exposure can significantly increase the risk of asthma, chronic obstructive pulmonary disease, cardiovascular disease, and other diseases [10,11,12]. Therefore, in-depth exploration of the pollution characteristics and influencing factors of particulate matter in subways is of great practical significance for formulating scientific and effective pollution control strategies.

1.2. Role of Platform Screen Doors (PSDs) in Regulating Particulate Matter

Platform screen doors (PSDs) are important facilities used to separate the platform and the tunnel in a subway [13]. The opening and closing of these doors directly affects the efficiency of airflow between the tunnels and platforms, thereby regulating the migration and concentration distribution of pollutants such as particulate matter. When the platform screen doors are closed, a relatively independent space is formed between the platform and the tunnel, effectively isolating high concentrations of particulate matter generated inside the tunnel. The air quality of the platform is mainly determined by the fresh air system and internal pollutant emissions [14]. When the platform screen doors are opened, the piston wind generated by the train entering the station drives the high-concentration airflow in the tunnel to spread towards the platform; at the same time, the airflow field inside the platform also experiences severe disturbances, resulting in rapid changes in particulate matter concentration in a short period of time [14]. In addition, the entire process of the train entering the station, stopping, and leaving triggers the opening and closing of the platform screen doors. There are significant differences in train operating frequency and passenger flow density during different time periods (morning peak, evening peak, non-peak), which further amplifies the impact of platform screen doors opening and closing on particulate matter concentration. Therefore, the opening and closing states and timing of platform screen doors have become key to regulating the concentration of particulate matter and have a decisive impact on the air quality of subways [15].

1.3. Review of Existing Research

At present, scholars worldwide have conducted extensive research on subway particulate matter pollution and the impact of platform screen doors [16,17,18,19,20]. Research conducted outside of China has mostly focused on old subway lines, emphasizing the combination of numerical simulation and actual measurement [16], and paying more attention to the interaction between climate conditions, track materials, and platform screen doors [17]. Research based on China has mainly analyzed newly built power lines, with a focus on actual measurement and analysis. Numerical simulations often use simplified models [18], with a greater emphasis on optimizing engineering applications such as types of platform screen doors and ventilation system parameters [19,20], in addition to real-time air quality monitoring methods and passenger exposure in transportation environments [21]. Although achievements have been made, there remain limitations in the current literature. Existing research has mostly focused on the concentration changes in single states such as the “opening/closing” of platform screen doors or single moments such as train arrivals and stops, without fully considering the differences in operational characteristics during different time periods such as morning rush hour, evening rush hour, and off peak hours [22]. During the morning and evening rush hours, the frequency of train operation and the passenger flow density are high. During non-peak hours, there are longer intervals between trains and the passenger flow is sparse. These differences in different time periods can lead to vastly different effects of the opening and closing of the shielding door on the concentration of particulate matter. Furthermore, differences in the aerodynamic characteristics of key locations such as the platform waiting area (densely populated), the central area of the platform (with stable airflow), and the tunnel (pollutant source) have not been fully considered [23], and there is a lack of targeted monitoring and analysis of these key locations. In addition, existing research mainly focuses on eastern coastal cities such as Beijing, Shanghai, and Guangzhou [24,25,26], whose geological conditions, climate characteristics, and ventilation system design are significantly different from those of Xi’an.

1.4. Xi’an Subway and Its Unique Characteristics

As the starting point of the ancient Silk Road and the core hub city of the “the Belt and Road” [27], Xi’an’s subway system is distinctive and unique, making it difficult to adapt existing research to its context. Xi’an has opened 11 subway lines with a total mileage of over 400 km and a maximum daily passenger volume of 5.539 million. Core lines such as Line 2 have very high passenger flow intensity [28,29], and the network connects historical sites, transportation hubs, and commercial districts. The passenger composition includes office workers and an average of 300 million tourists per year, with complex flow characteristics.
Moreover, as a city in a cold region, Xi’an belongs to the Köppen climate classification Cwa (Humid Subtropical Climate with Dry Winters), characterized by distinct seasonal variations: cold and dry winters and hot and humid summers [30]. The temperature difference between inside and outside the station often exceeds 9 °C, which requires special sealing and thermal insulation functions for the platform screen doors. The ventilation systems of the Beijing and Shanghai subways focus more on humidity control and uniform air supply, and the difference in ventilation strategies directly affects the efficiency of airflow exchange and particle dilution between platforms and tunnels. Meanwhile, some lines of the Xi’an subway pass through the Huangtu Plateau and the ancient city ruins protection area, with tunnel burial depths generally reaching 20–30 m, significantly deeper than most subway lines in Beijing and Shanghai. Deeper burial depths result in longer exchange paths between the tunnel and the outside atmosphere, increased resistance to pollutant diffusion, and easy accumulation of pollutants inside the tunnel [31]. Moreover, most of the railway lines in Xi’an have underground two-level island platforms, with platform lengths generally exceeding 120 m. Some stations are connected to transportation hubs and commercial districts, with platform widths reaching 12–14 m, which is wider than conventional platforms in Beijing and Shanghai. This spatial scale difference can lead to a more complex distribution of airflow fields inside the platforms, and the piston wind propagation path and disturbance intensity caused by the opening and closing of platform screen doors are also different from those in eastern cities [32]. In addition, the soil in the Xi’an subway track-laying area is mostly loess, and the particle size and bonding characteristics of dust are different from those of silty clay or sandy soil in eastern cities. There are differences in the physical properties of particles generated by train wheel rail friction and track dust, which further affect their migration patterns between tunnels and platforms. The above differences collectively demonstrate that Xi’an Metro represents a unique case in terms of the concentration distribution of particulate matter and the regulatory effect of platform screen doors. Therefore, it is necessary to carry out targeted research on the screen doors of the Xi’an subway to provide support for optimizing operation safety and environmental comfort.

1.5. Research Objectives and Significance

Based on the above practical problems, this study takes the Xi’an subway as a case study, selecting different typical time periods and focusing on changes in pollutant concentration at different locations in the subway when the platform screen doors open and close. It reveals the evolution law of particulate matter concentration under different time periods and at different locations and platform screen door statuses, providing a theoretical basis and technical support for optimizing air quality in the Xi’an subway and regulating the operation timing of platform screen doors. At the same time, it also provides reference for the control of particulate matter pollution in similar urban subways in China.

2. Methods

2.1. Test Location

Xi’an Metro stations and tunnels adopt a standardized mechanical ventilation system to address the semi-enclosed underground environment and local climate (Köppen Cwa). For passenger areas in the stations (platforms and concourses), a combined supply and return air system is employed: fresh air is drawn in from the outside via air intake shafts, filtered through high-efficiency particulate air (HEPA) filters, and distributed to the platform through ceiling air outlets; exhaust air is collected via return air grilles near the platform edges and discharged after treatment. For tunnels, a longitudinal ventilation system is used: jet fans installed along the tunnel walls promote air flow, and tunnel air is exchanged with the outside through dedicated ventilation shafts at intervals of 800–1000 m. This design aims to control pollutant accumulation and maintain thermal comfort, especially given the significant indoor–outdoor temperature difference in Xi’an. The test was conducted at Xi’an subway Line 2, Beidajie Station—a typical underground two-level island platform station with a full-height platform screen door (PSD) system. Line 2, operational since 2011, is a core trunk line with a daily passenger flow of approximately 800,000, characterized by morning peak outbound passenger flow (7:00–9:00) and evening peak inbound passenger flow (17:00–19:00), making it representative of Xi’an Metro’s operational patterns.
Beidajie Station is located in the central urban area, adjacent to commercial complexes and office buildings, with a mixed passenger composition of commuters and tourists. The station’s platform is 120 m long, 14 m wide, and 8 m high. The PSD system consists of 42 pairs of doors (each 1.4 m wide), with a closing time of 3 s and opening time of 2 s, synchronized with train arrival and departure. The platform ventilation system operates at a constant air supply rate of 30 m3/(h·person) during peak hours and 20 m3/(h·person) during off-peak hours, with air change rates of 6 times per hour.
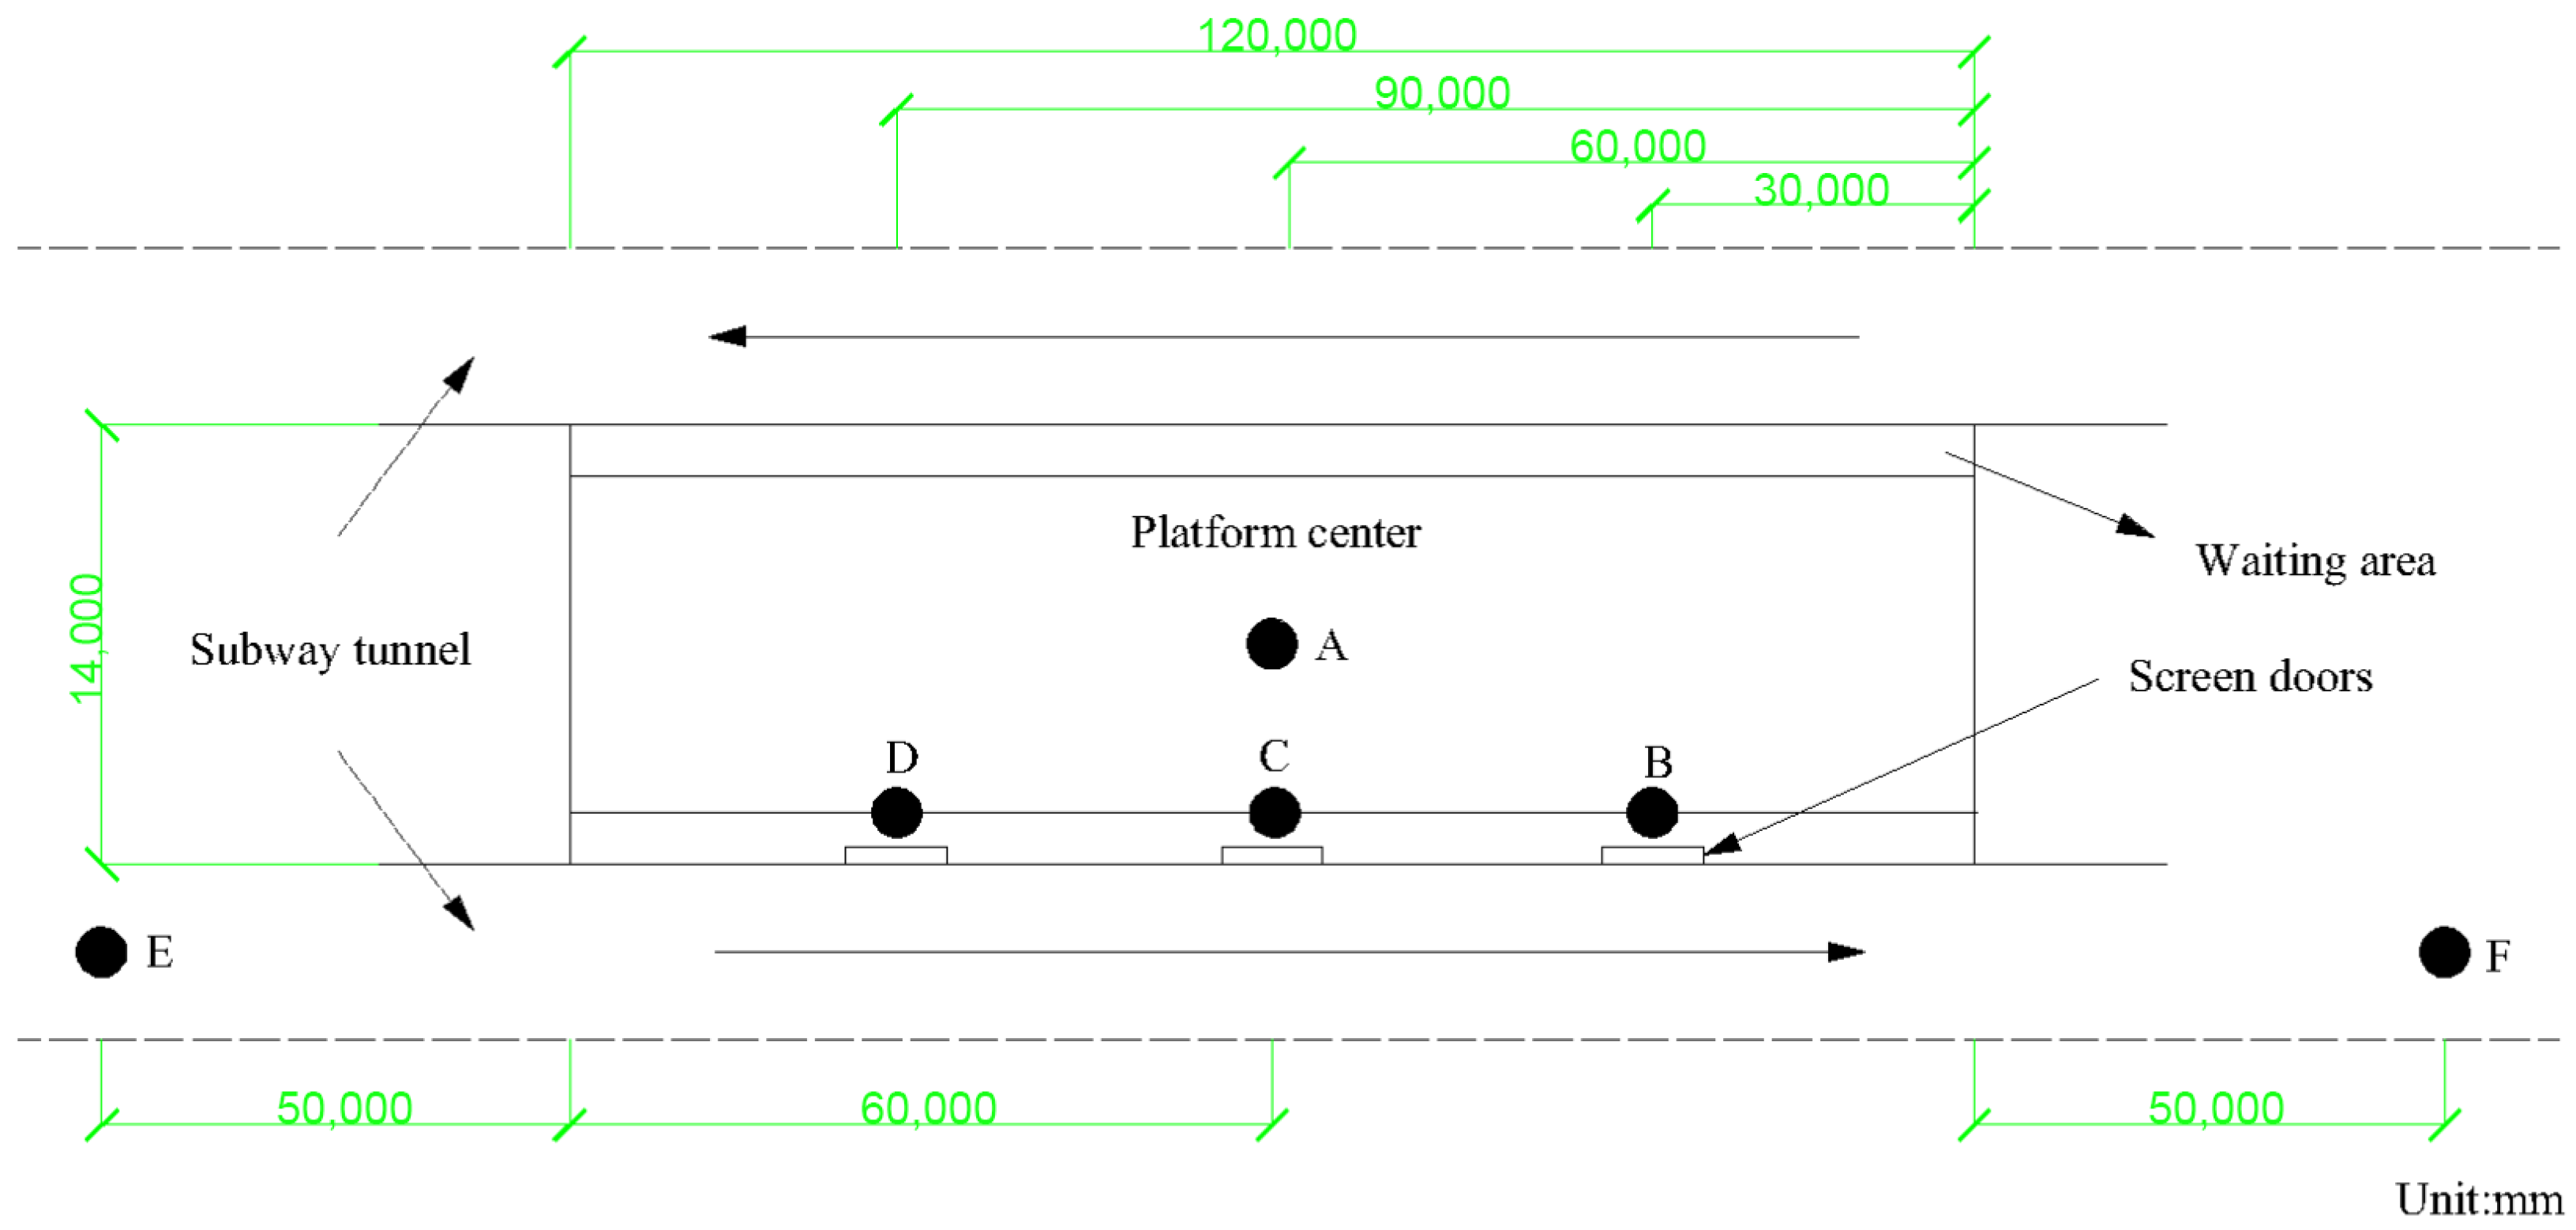
Measuring points were strategically arranged at three key locations (tunnel, platform center, and waiting area) to capture spatial differences in particulate matter concentrations, with all sampling heights set at 1.5 m (consistent with the passenger breathing zone) to ensure relevance to human exposure. The specific layout is as follows (see Figure 1 for the scaled plan):
The tunnel measuring points (E, F) were located on the side walls of the tunnel, 50 m away from the north and south ends of the platform, respectively. These points avoid the direct impact of train piston wind and are representative of the tunnel’s background pollutant concentration.
The platform center measuring point (A) was marked at the geometric center of the platform (60 m from both ends), avoiding fresh air outlets and return air grilles to eliminate local ventilation disturbances.
The platform waiting area measuring points (B, C, D) were arranged 1 m away from the PSD (the main passenger waiting zone), with B (front), C (middle), and D (rear) corresponding to the 30th, 60th, and 90th meter positions of the platform, respectively. This layout captures concentration variations along the platform length.
Sampling period: 1 July–31 August 2024. This period covered the summer season in Xi’an and was selected to avoid seasonal variations in pollutant sources (e.g., winter heating-related emissions) and ensure consistent environmental conditions. Three time periods were monitored every day: the morning peak period (7:00–9:00), the off-peak period (9:00–17:00), and the evening peak period (17:00–19:00). The sampling time for each measurement point was 20 min, and a total of three groups were tested. The final result was calculated by taking the average of the three groups’ values. Among them, the morning peak departure interval is 2 min, and about 10 trains arrive and depart in 20 min. The evening peak departure interval is 2.5 min, and about 8 trains arrive and depart. The off peak departure interval is 5 min, and about 4 trains arrive and depart. GB/T18883-2022 is China’s national standard for indoor air quality, specifying limits for particulate matter to protect human health during long-term indoor exposure [33]. For this study, the core relevant limits are as follows: PM10: 100 μg/m3 (24 h average); PM2.5: 50 μg/m3 (24 h average). No national standard limit is currently specified for PM1.0, but its small particle size (≤1.0 μm) allows it to penetrate deep into the respiratory system, posing significant health risks, so its concentration characteristics are still analyzed in this study.

2.2. Experimental Apparatus

The particle concentration was tested using the Grimm1.109 portable aerosol spectrometer, with a mass concentration range of 0.1–100,000 μg/m3, a particle size range of 0.25–32 μm, a repetition rate of 5%, and a sampling frequency of 1 Hz. This instrument uses optical scattering principles to detect particulate matter, which is suitable for real-time monitoring of high-concentration and rapidly changing particulate matter in subway environments. Temperature, humidity, and carbon dioxide were tested using an indoor air quality analyzer, 7525. The range of carbon dioxide is 0–5000 ppm, with an accuracy of ±3.0% or ±50 ppm of the reading and a resolution of 1 ppm. The temperature range is 0–60 °C, with an error of ±0.6 °C and a resolution of 0.1 °C. The range of relative humidity is 5–95% RH, with an accuracy of ±3.0% RH and a resolution of 0.1% RH. To ensure measurement accuracy, the instruments underwent systematic calibration before and during the test. A zero-point calibration was performed for the Grimm1.109 every 3 days. The instrument was placed in a clean room (Class 100) for 30 min, and the zero-point offset was adjusted to ≤0.01 μg/m3 to eliminate background interference. The Testo 7525 was calibrated weekly using the same CO2 standard gas cylinder and temperature–humidity chamber to correct for drift. After each day’s sampling, the inlet nozzle of the Grimm1.109 was cleaned with compressed air (pressure: 0.3 MPa) to remove particulate matter residues and avoid blockage. The filter screen at the air inlet of the Testo 7525 was cleaned with deionized water and dried naturally to prevent dust accumulation from affecting measurement accuracy. Battery levels of both instruments were checked daily, and spare batteries were prepared to avoid power outages during sampling. To address gaps in the data of less than 5 min, linear interpolation was used to fill the missing values based on the valid data before and after the gap. For gaps of more than 5 min, the corresponding sampling session was repeated on the same day to supplement the data. If repetition was not possible, the missing data was substituted with data from the same time period on adjacent days, and the substitution was noted in the data report. SPSS 26.0 software was used for statistical analysis, calculating the mean and increase in particulate matter concentration at different time periods and positions in the open and closed state of the shielding door, and clarifying the concentration response characteristics and influence rules through comparative analysis.

3. Results and Discussion

3.1. Changes in Particle Mass Concentration at Different Locations

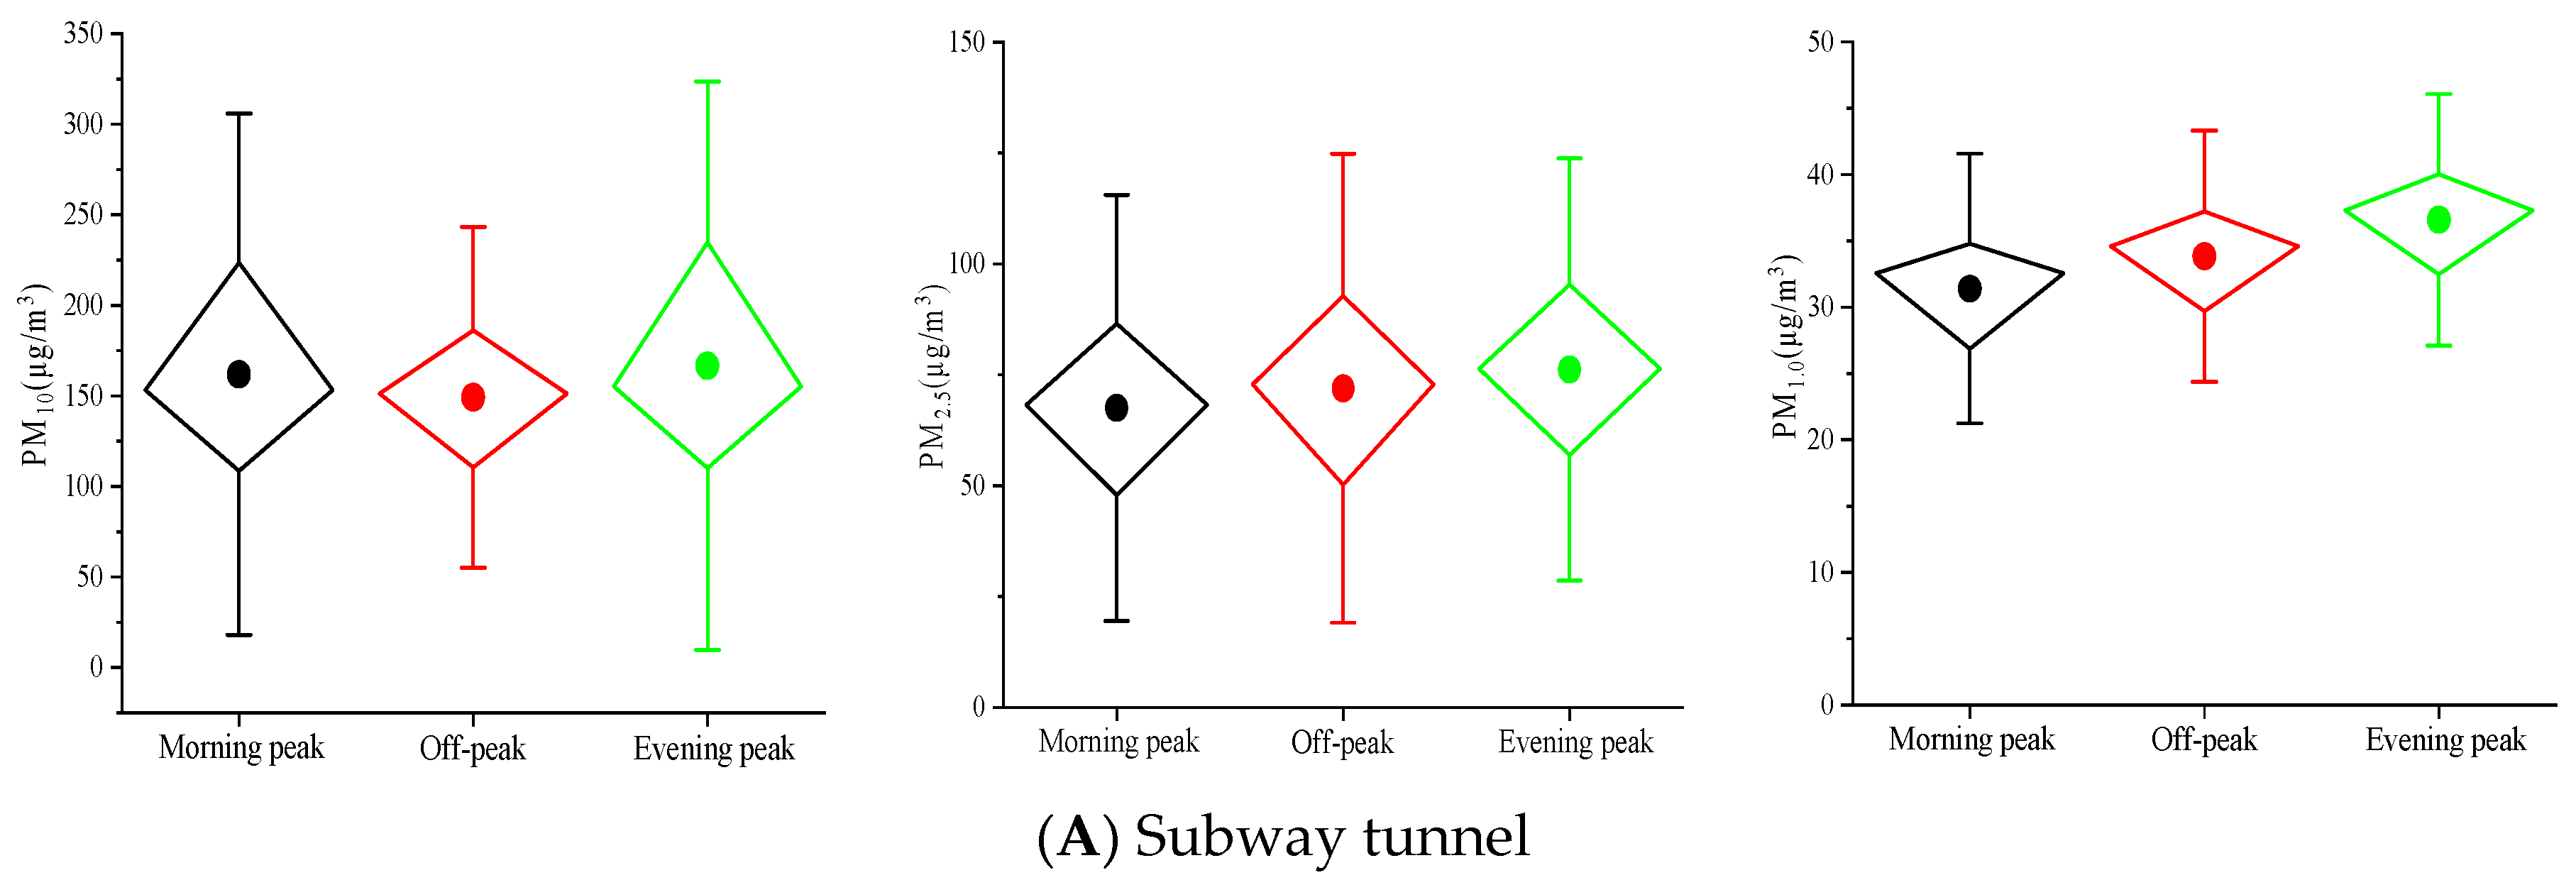
The changes in particle mass concentration at different positions at different times are shown in Figure 2.
Temperature: 18.83–39.27 °C; humidity: 32.01–67.98%; wind speed: 0.01–2.79 m/s.
From Figure 2, it can be seen that the concentrations of PM10, PM2.5, and PM1.0 in the subway tunnel, waiting area, and platform center shows the following trend: subway tunnel > waiting area > platform center. The average PM10 concentrations in the subway tunnel, waiting area, and the platform center at different times are 154.91 μg/m3, 127.35 μg/m3, and 110.36 μg/m3, respectively, all exceeding the standards for indoor air quality (GB-T18883-2022) (limit: 100 μg/m3) [33]. The average PM2.5 concentrations in the subway tunnel, waiting area, and platform center at different times are 77.08 μg/m3, 61.66 μg/m3, and 45.70 μg/m3. Only the platform center meets the standard (≤50 μg/m3), while the tunnel and waiting area exceed the limit. The average PM1.0 concentrations in the subway tunnel, waiting area, and platform center at different times are 33.73 μg/m3, 27.98 μg/m3, and 23.91 μg/m3. At present, there is no national standard limit for PM1.0, but its particle size is smaller and more harmful to human health. Therefore, there is practical value in effectively controlling the concentration index of PM1.0.
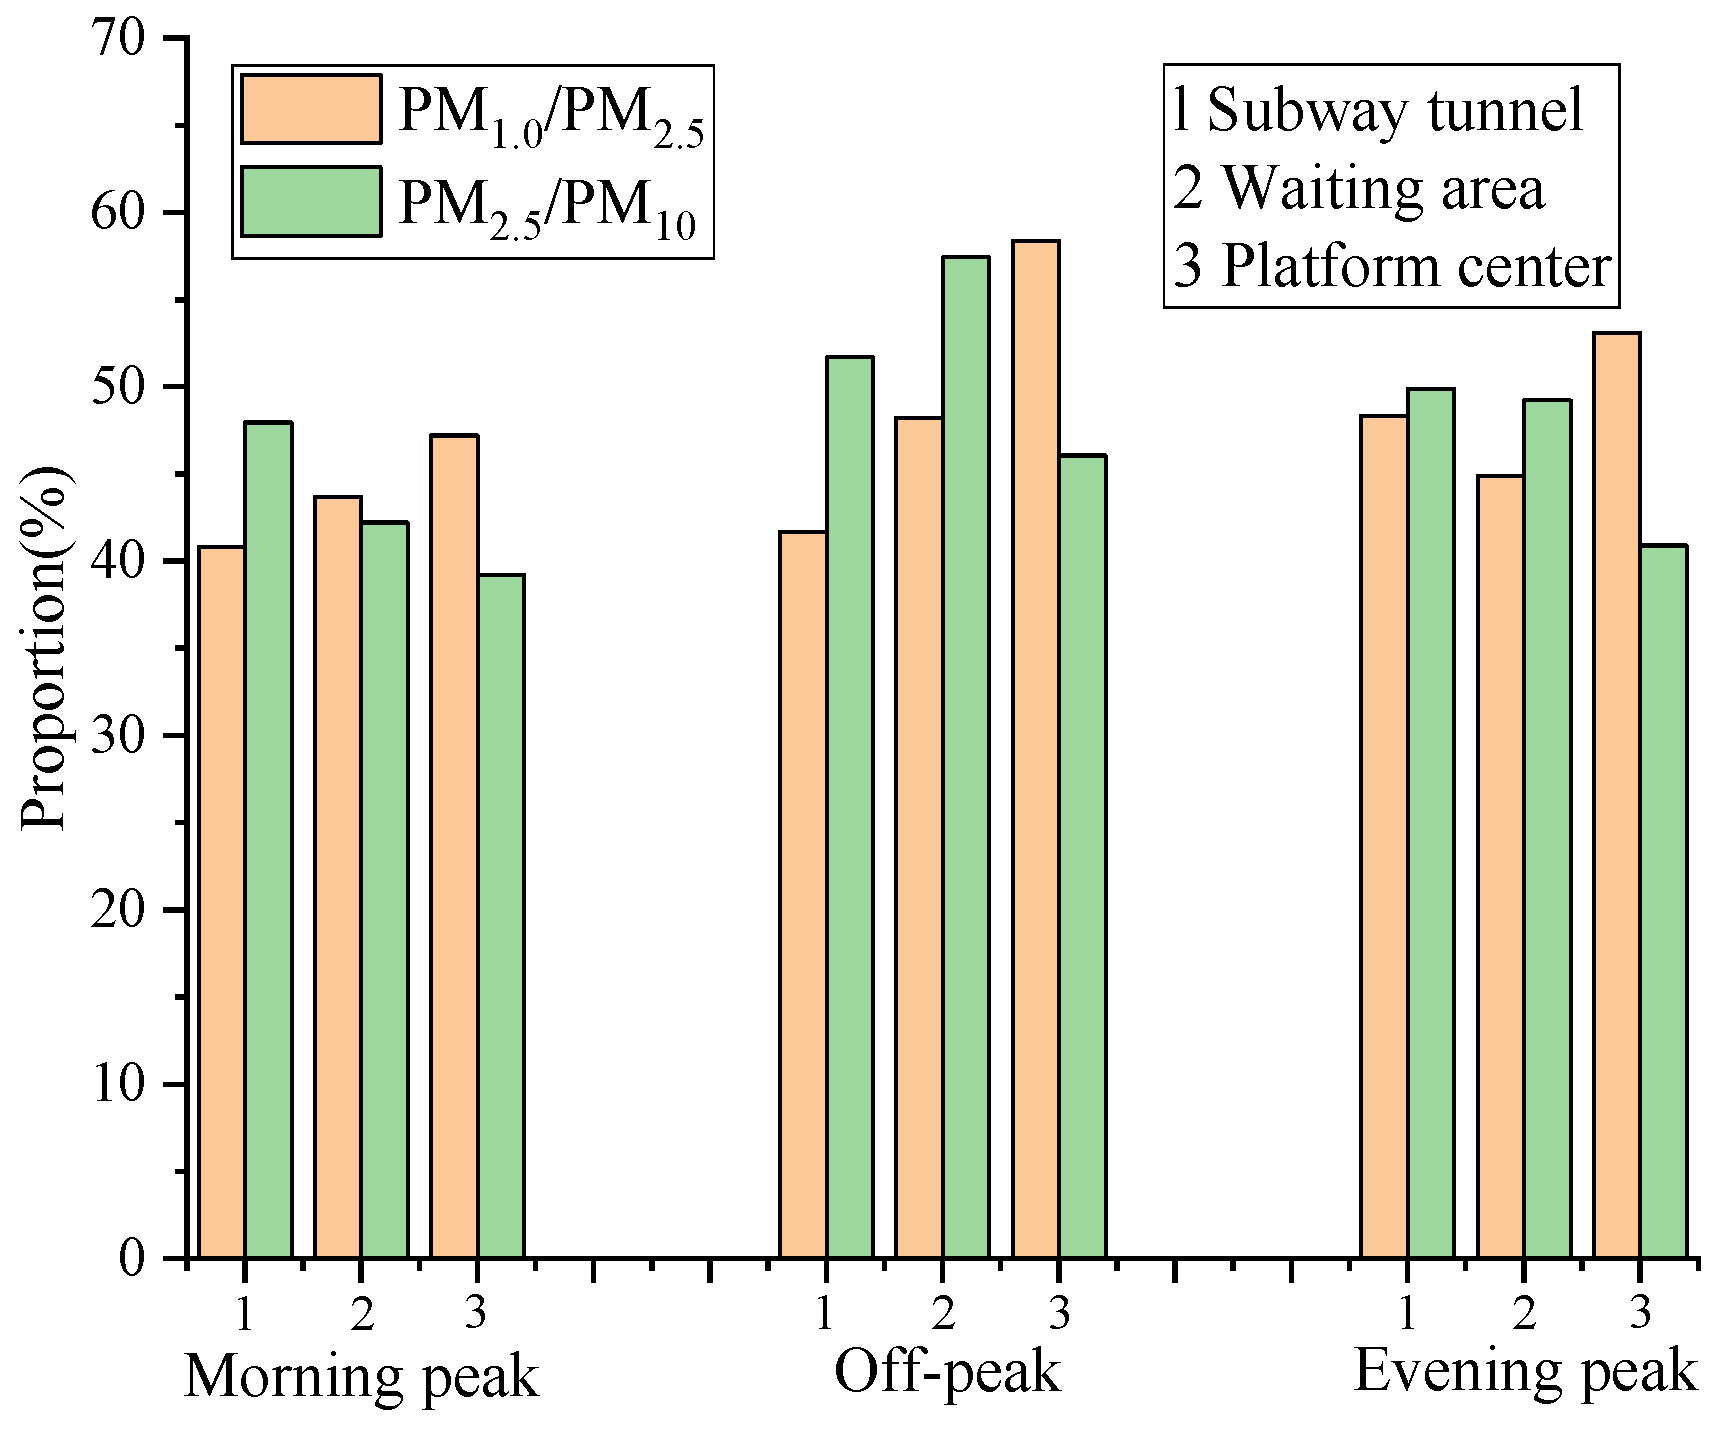
In addition, during the morning peak, the average concentrations of PM10, PM2.5, and PM1.0 in the subway tunnel are 8.95% and 23.66% higher, 19.81% and 37.54% higher, and 14.18% and 27.75% higher than that in the waiting area and platform center, respectively. The average concentrations of PM10, PM2.5, and PM1.0 in the subway tunnel during off-peak times are 38.15% and 48.03% higher, is 31.25% and 53.68% higher, and 20.43% and 35.14% higher than that in the waiting area and platform center, respectively. The average concentrations of PM10, PM2.5, and PM1.0 in the subway tunnel during the evening peak are 9.11% and 17.38% higher, 10.35% and 32.28% higher, and 16.74% and 25.63% higher than that in the waiting area and platform center, respectively. It can be seen that the average concentrations of PM10, PM2.5, and PM1.0 in the subway tunnel compared to the waiting area and platform center are highest during off-peak times, followed by the morning peak, and are the lowest in the evening peak. This is because during off-peak times, the departure interval of trains is extended, the intensity of piston wind is weakened, and the fixed-source pollutants in the subway tunnel diffuse more slowly and accumulate easily [34]. The subway platform area, due to the disappearance of dynamic crowd sources, only receives a small amount of pollutants via tunnel diffusion, and the ventilation system continues to function, with dilution effects dominating. Eventually, the cumulative concentration of subway tunnel pollutants increases, while the that of subway platform pollutants decreases due to the lack of dynamic source supplementation, resulting in a higher proportion of pollutants in the tunnel. The proportions of different particles are provided in further detail in Figure 3.
From Figure 3, it can be seen that the ratios of PM1.0/PM2.5 in the platform center are 47.21%, 58.35%, and 53.07% at different time periods, respectively, which are higher than the 40.82%, 41.67%, and 48.33% in the subway tunnel and the 43.68%, 48.23%, and 44.88% in the waiting area. However, the PM2.5/PM10 ratio showed different trends in different time periods, with the highest ratio in the subway tunnel during morning and evening peak times, and the highest proportion in the waiting area during the off-peak period. This difference is due to the fact that the waiting area is closer to the platform screen doors. When the doors are opened, a large amount of larger particles arrive here first, resulting in a lower PM1.0/PM2.5 in the waiting area. However, the platform center is further away from the platform screen doors, and is less affected by crosswind compared to the waiting area, with a higher PM1.0/PM2.5. High-density crowds during the morning and evening peak will also adsorb some particulate matter through their clothing and hair, reducing the suspended concentration of particulate matter in the subway platform area [35]. At the same time, the flow of people drives local airflow disturbance, promotes particle diffusion, and further reduces subway platform concentration [36]. During the off-peak period, the crowd is sparse and suspended particles on the subway platform are not easily carried away, so the proportion of PM2.5/PM10 in the waiting area is the highest at this time.

3.2. Changes in Particle Counting Concentration at Different Locations

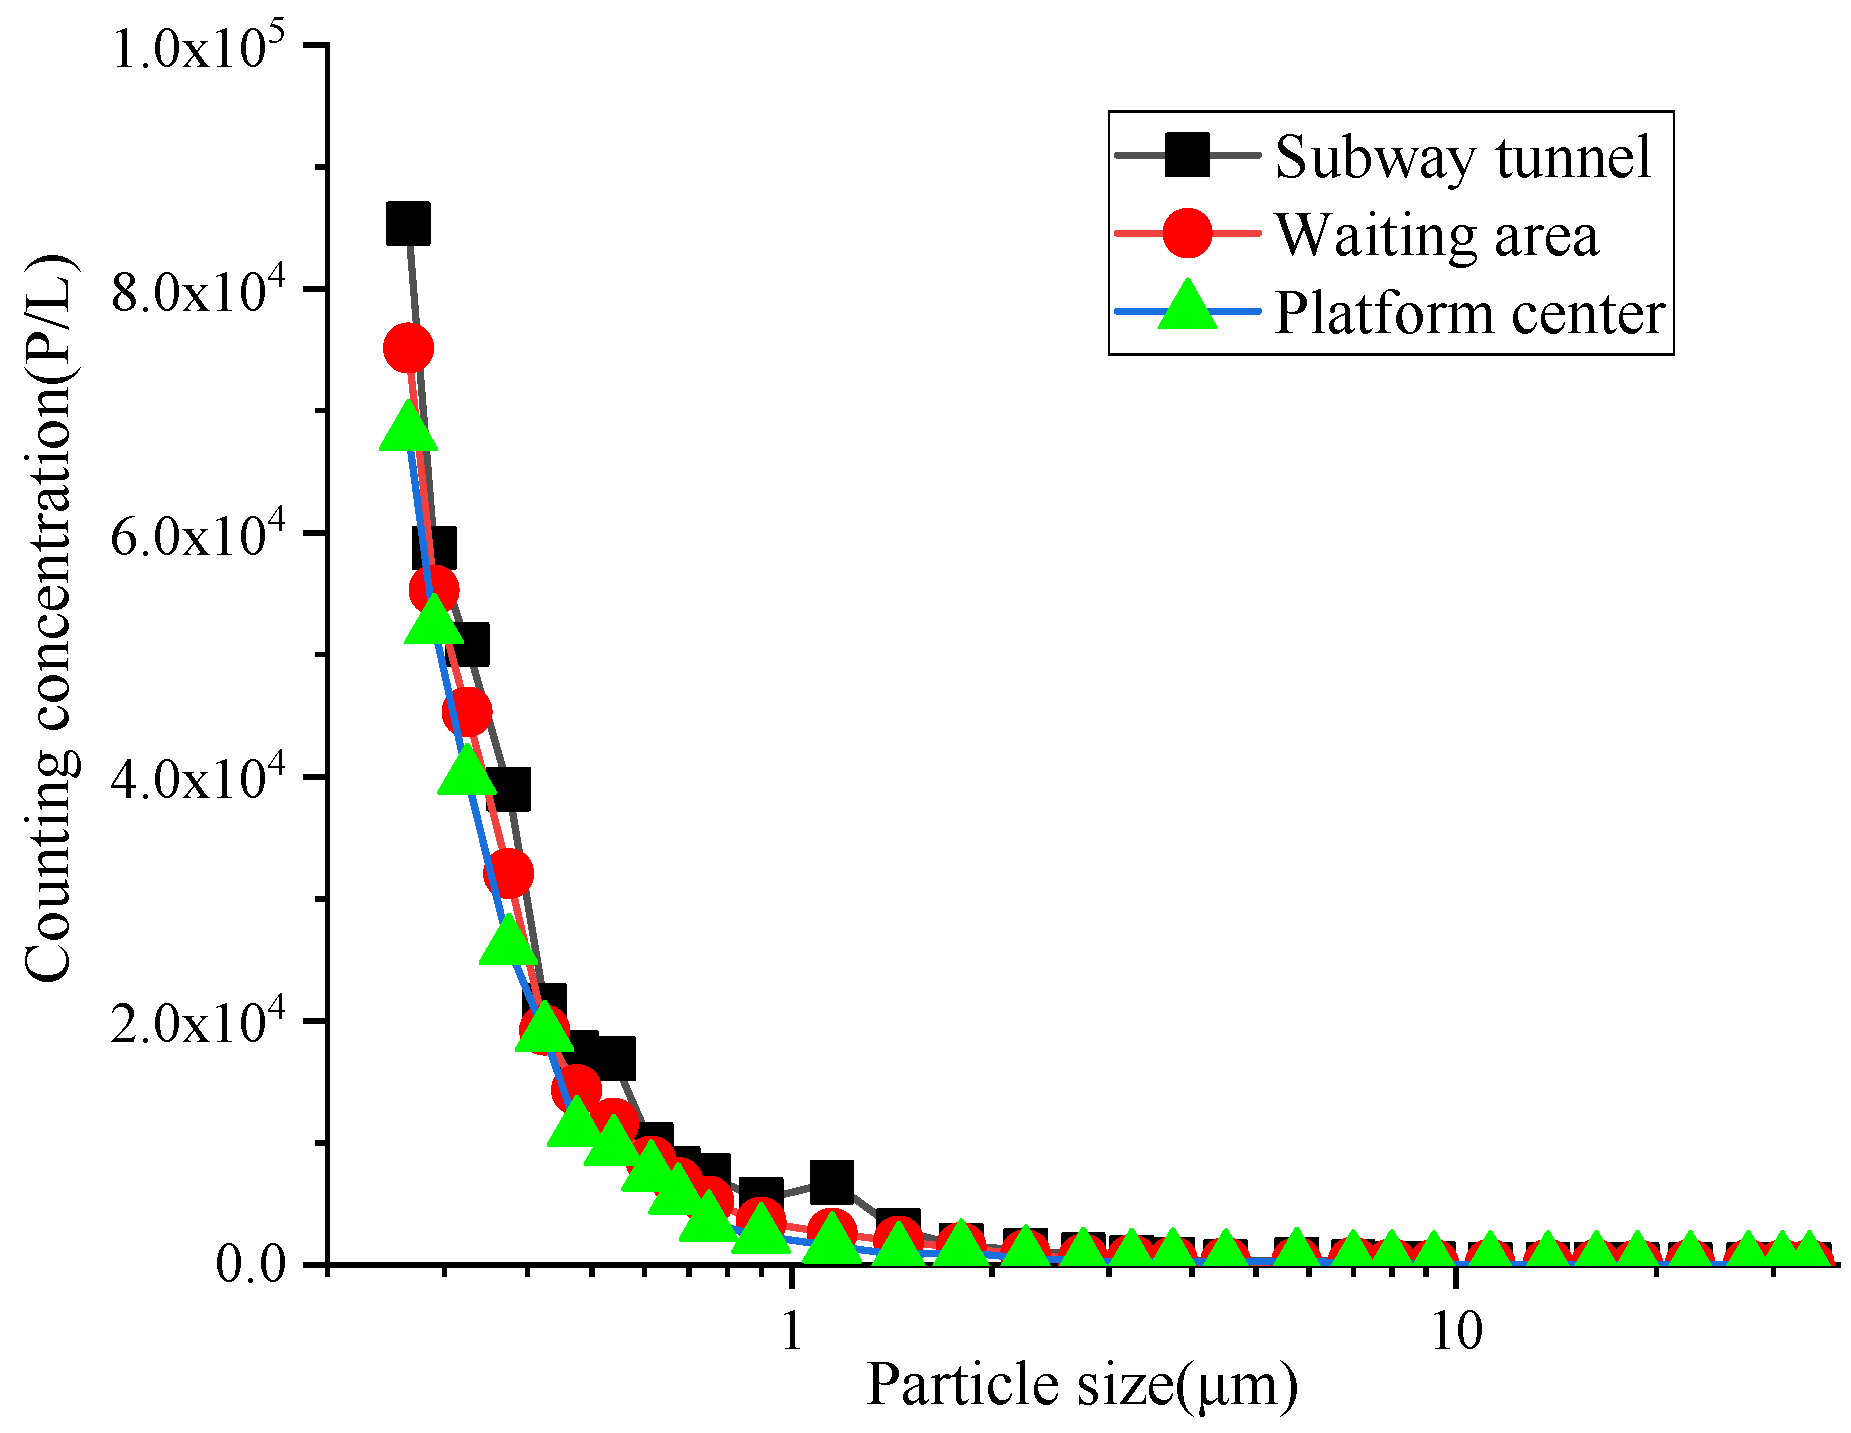
The average particle counting concentration changes at different times in the subway tunnel, waiting area, and platform center of the test point are shown in Figure 4.
From Figure 4, it can be seen that the overall trend of changes in particle counting concentration at the three locations is that as the particle size increases, the counting concentration gradually decreases. The concentration of particulate matter in the subway tunnel is higher than that in the waiting area and platform center. Particles with a diameter less than 1.0 μm account for more than 95% of the total number of particles, and so the contribution of particles above 1.0 μm can be mostly ignored. This is similar to the particle size distribution of particles on the Athens subway platform in Greece [37], which verifies the findings of this paper. Among these particles, there is a certain fluctuation in the concentration of those with a diameter of 0.475 μm to 0.9 μm. The main reason for this is that during the braking process when the train enters the station, a large amount of particles are generated by friction with the rail, ranging in size from 0.475 μm to 0.9 μm. This is consistent with the results of the study by Hyeong Gyu Namgung et al. [38], which also confirm that the large amount of particles generated by trains braking range in size from 0.475 μm to 0.9 μm. Therefore, it is also necessary to effectively control particles below 1.0 μ m in the subway platform.

3.3. Influence of the Opening and Closing of Platform Screen Doors at Different Times

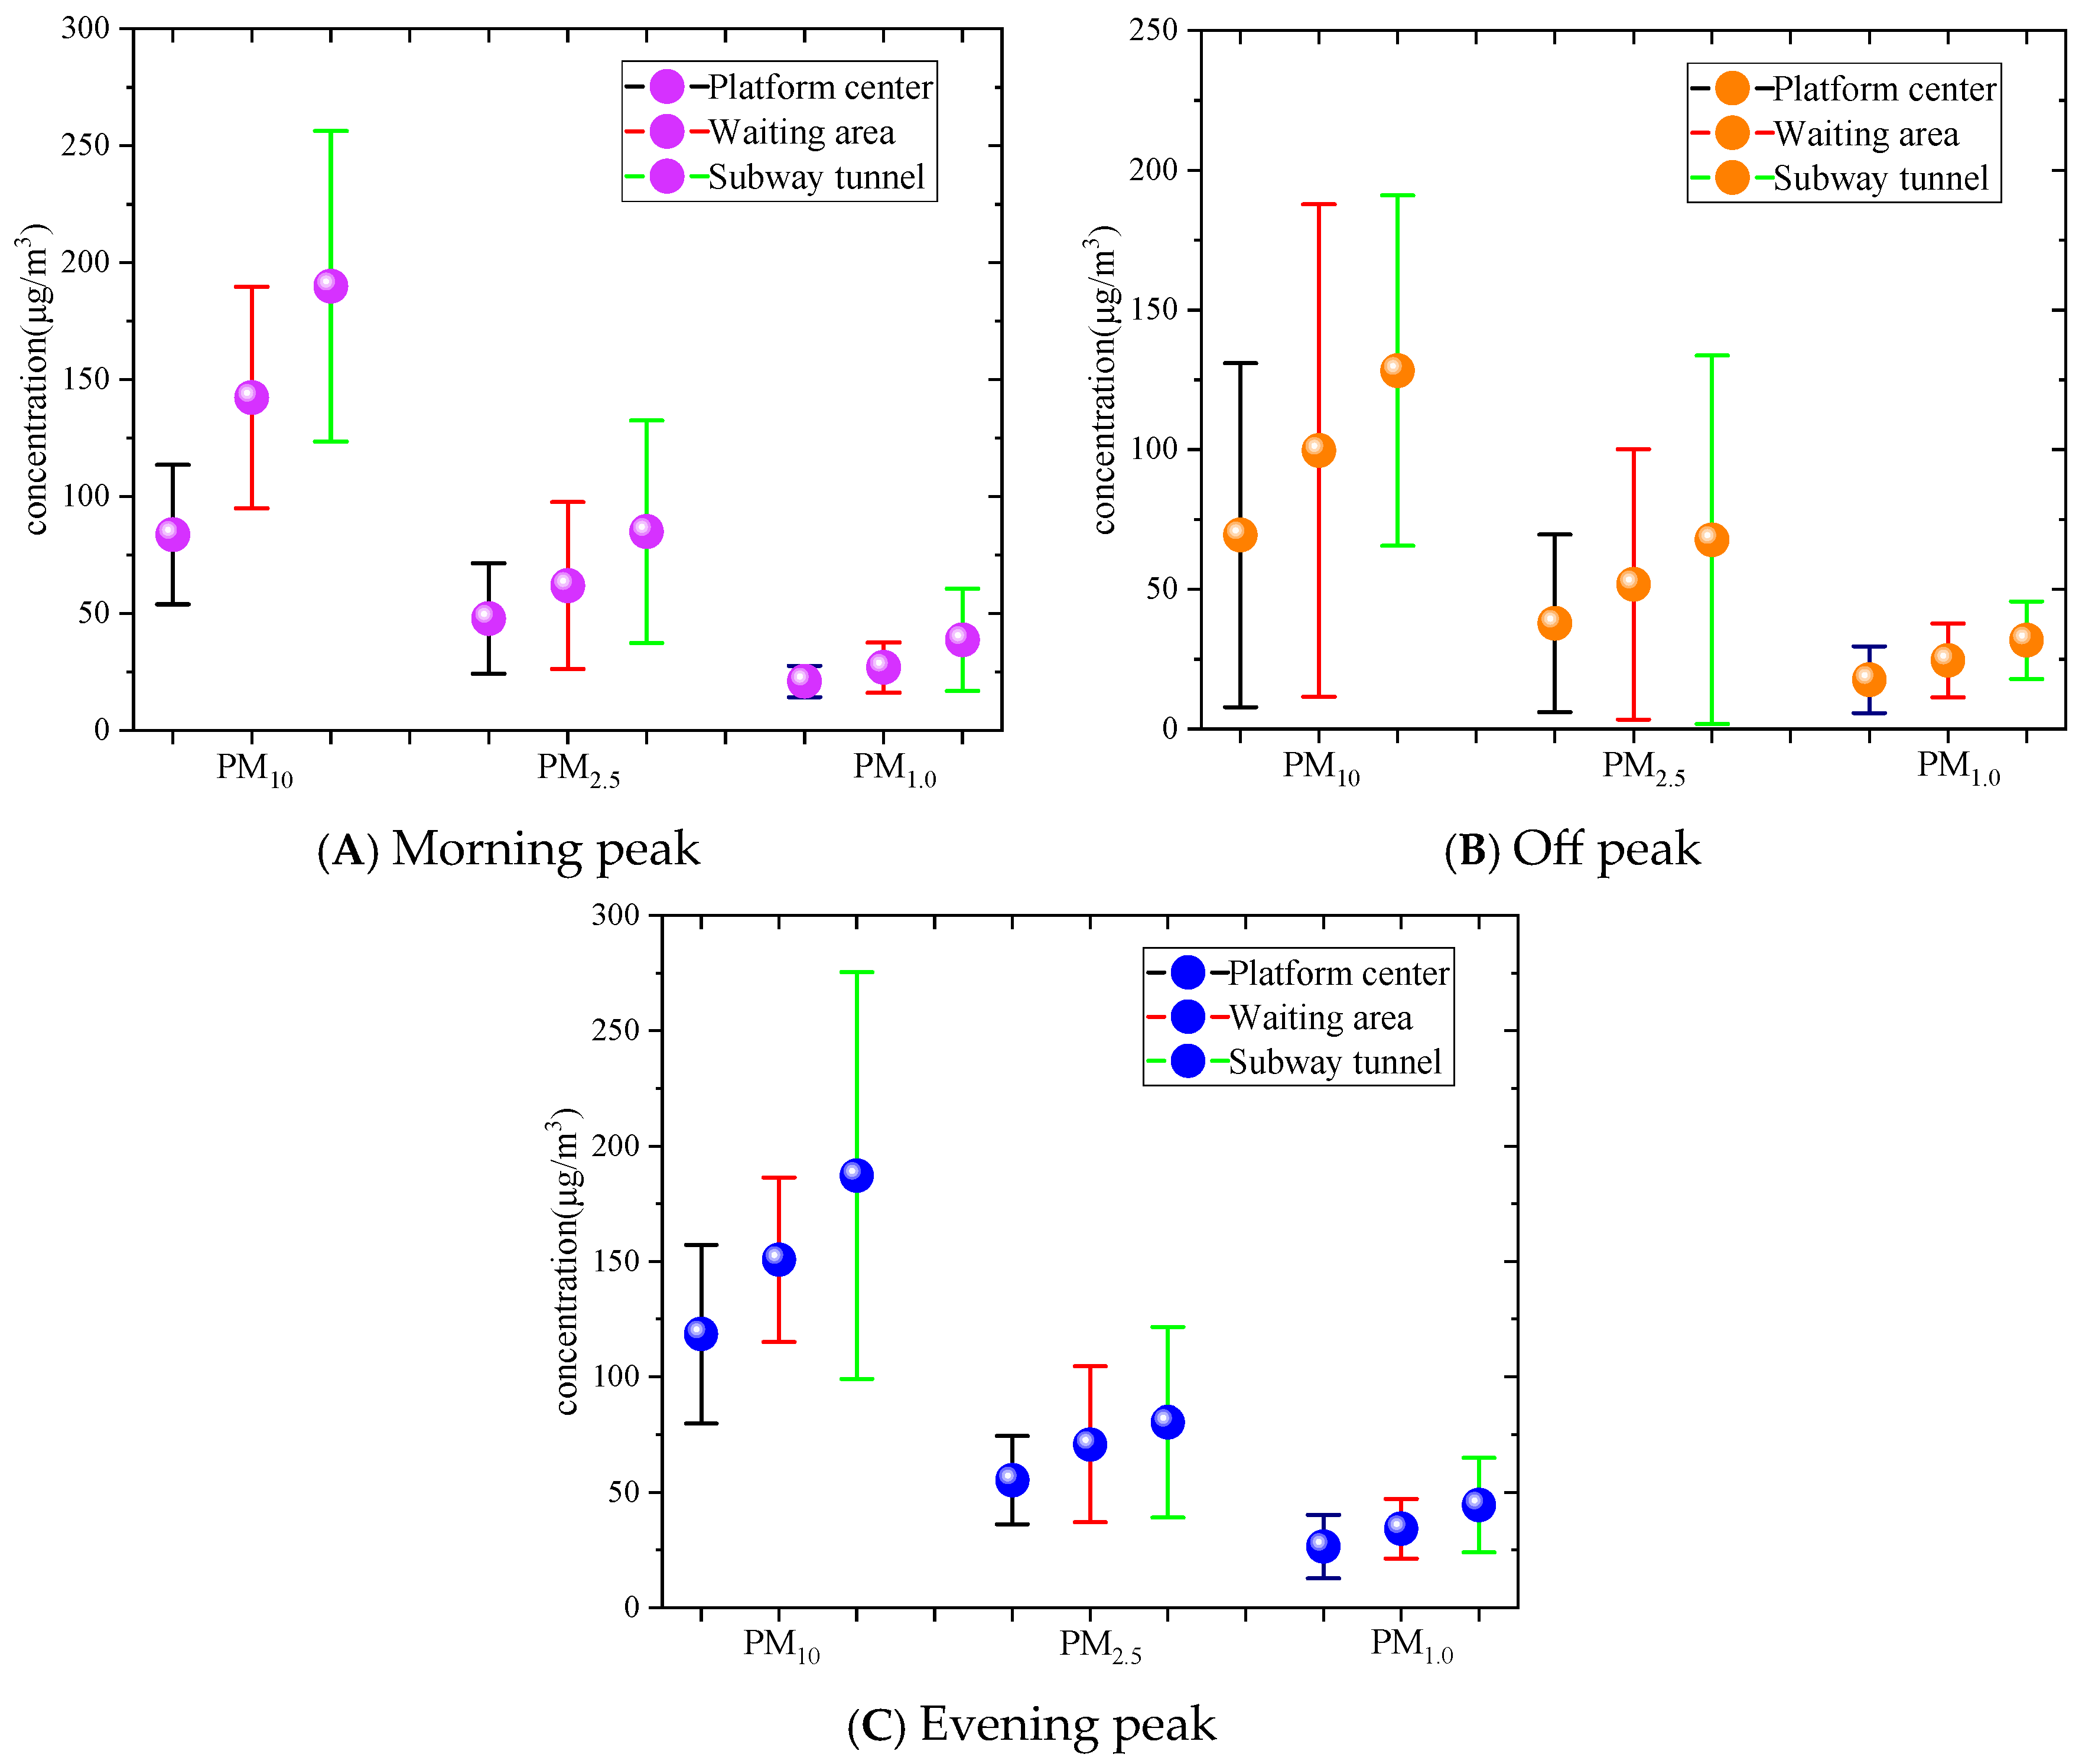
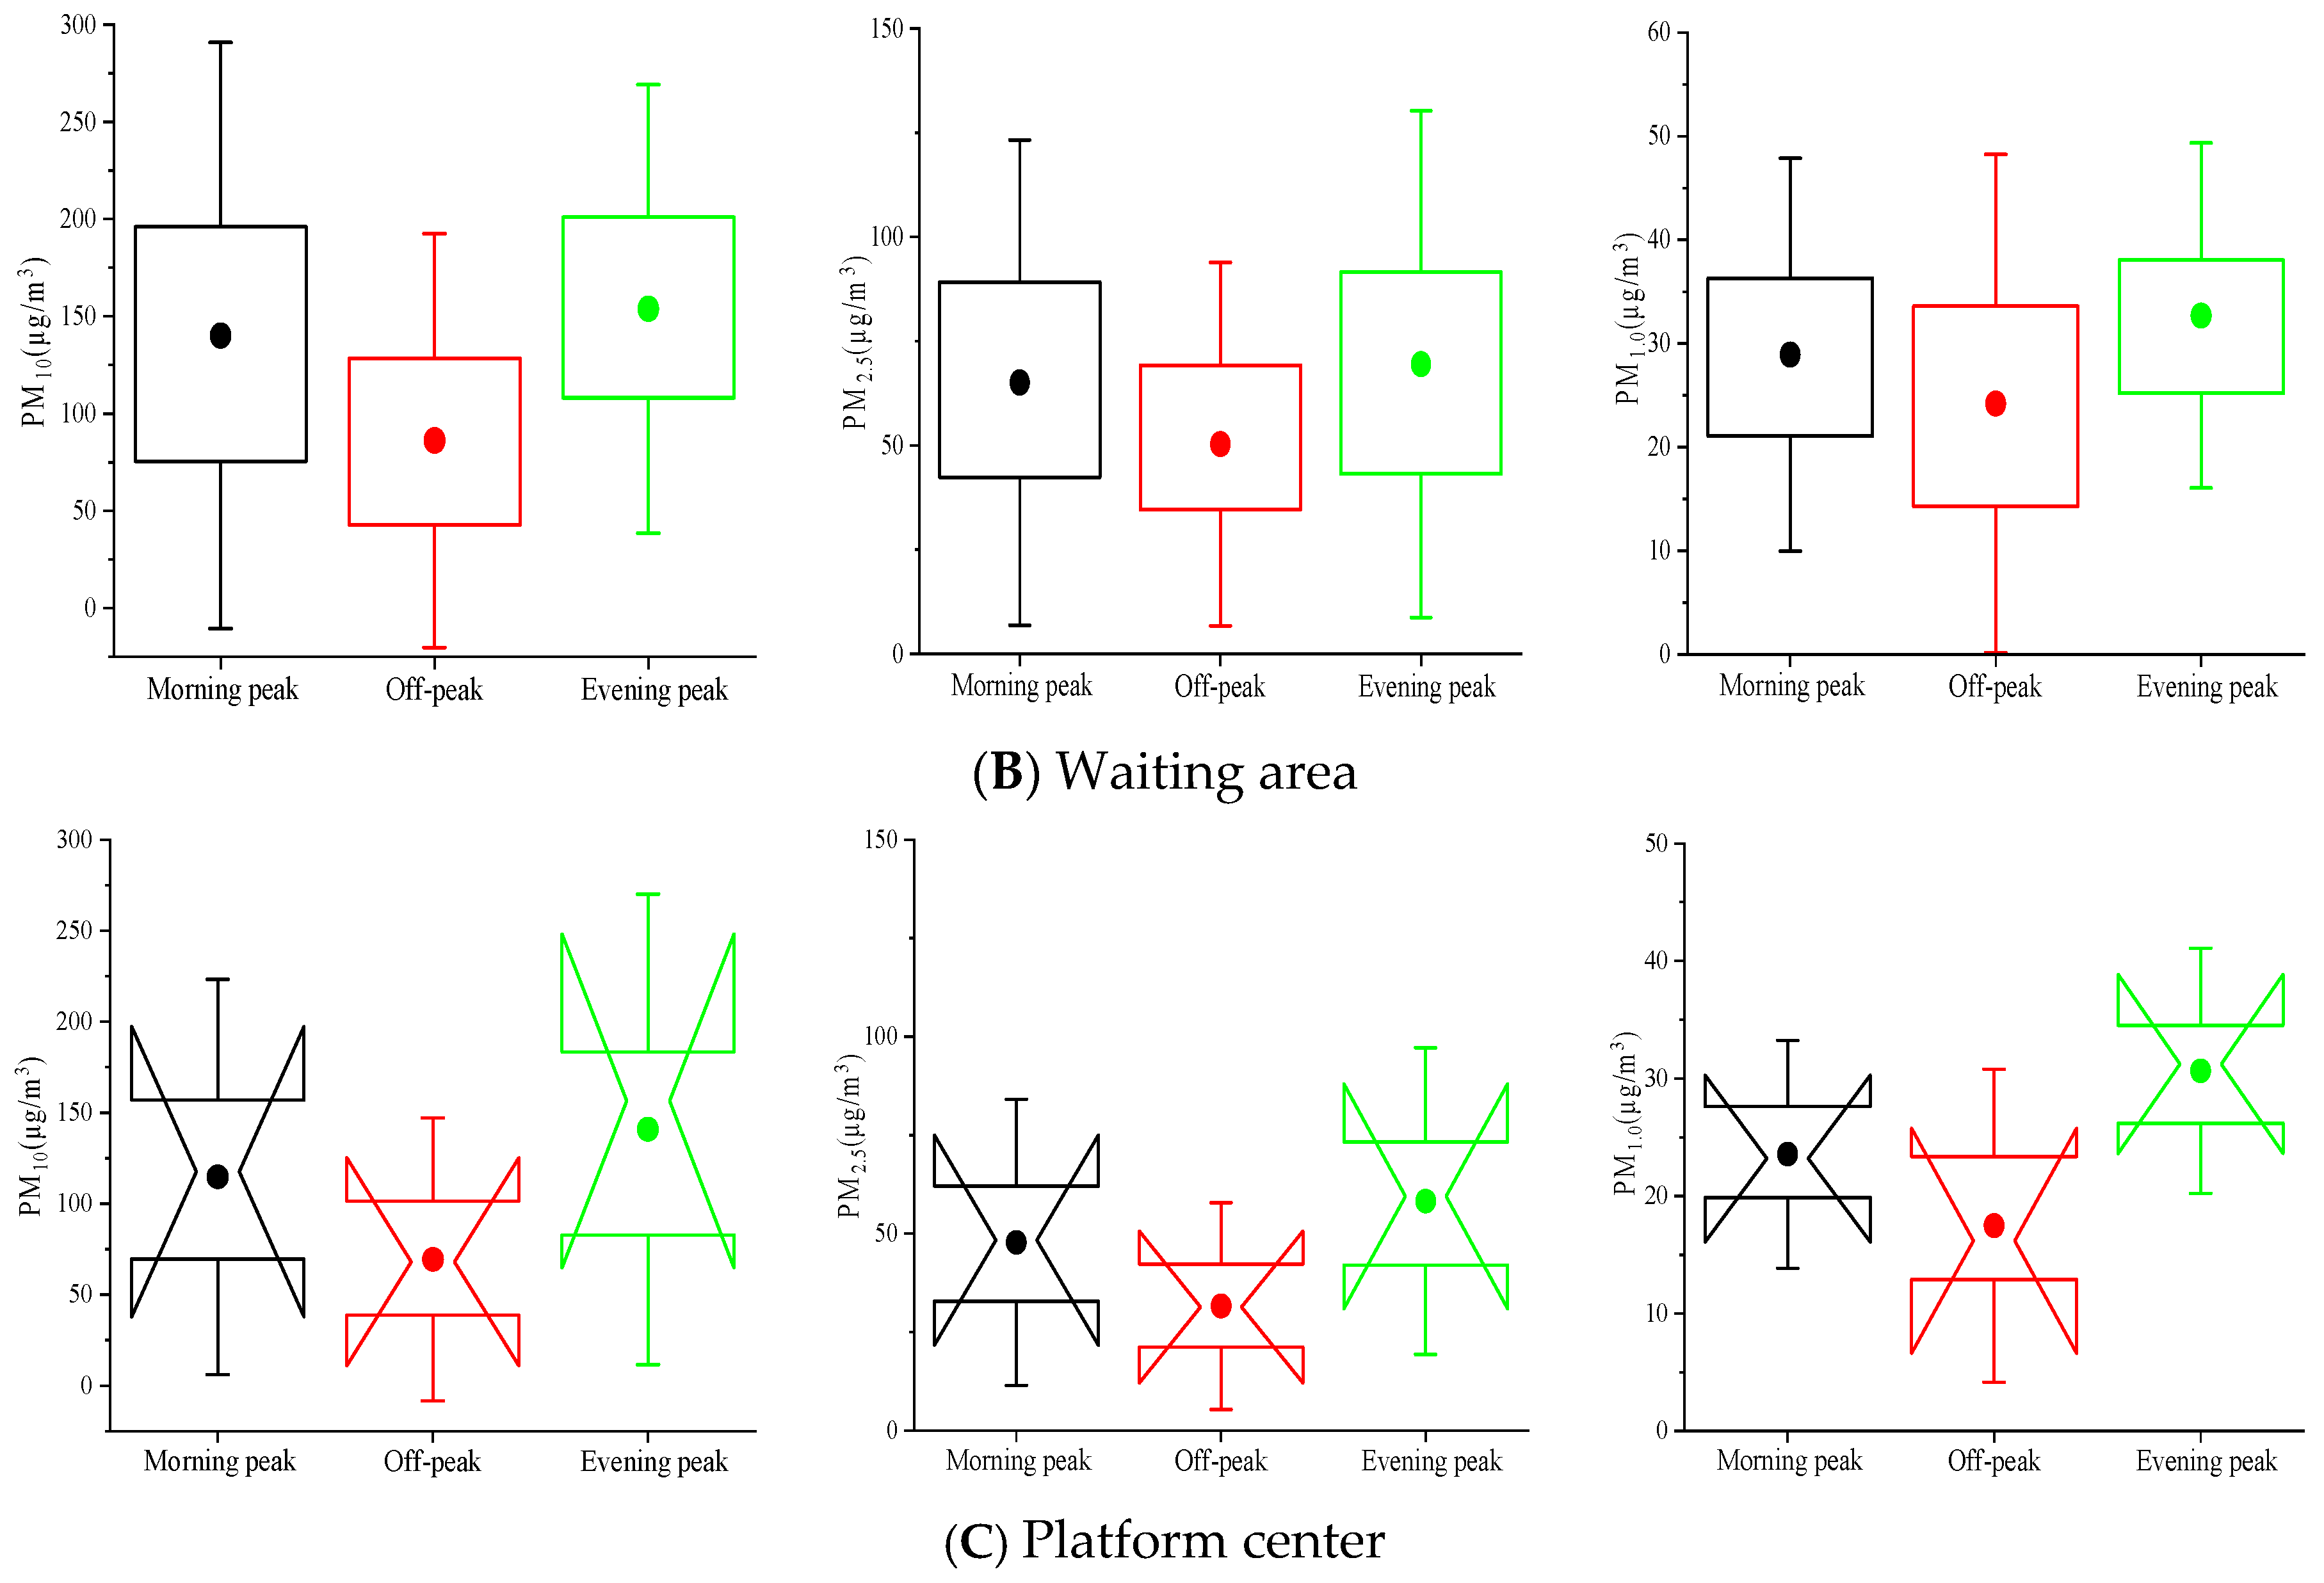
Figure 5 shows the changes in the concentration of particulate matter in the subway tunnel, waiting area, and platform center at different time periods under the opening and closing of the platform screen doors.
From Figure 5, it can be seen that the concentration of PM10 in the subway tunnel remains almost unchanged over the course of a day, at approximately 153.27 μg/m3. The concentrations of PM2.5 and PM1.0 show a gradually increasing trend, and are highest during the evening peak. It can be seen that the opening and closing of the platform screen doors has a relatively small impact on the concentration of particulate matter in the subway tunnel. This is because the subway tunnel space is relatively independent, and the air exchange with the subway platform only occurs when the screen doors are open. The train brakes and starts up when entering and leaving the station, and the friction between the train and the rail produces a large amount of fine particulate matter, which gradually increases with the increase in running time. Moreover, the concentration of particulate matter in the tunnel is higher than that in the air on the platform, and the rate of particulate matter generation in the subway tunnel is much higher than the diffusion rate. The opening and closing time of the platform screen door is limited, which impedes the effective dilution of the high concentration of particulate matter in the subway tunnel, resulting in severe air pollution in this area. Therefore, it is necessary to strengthen the control of air pollution in the subway tunnel. In addition, the high frequency of train departures during peak hours in the morning and evening can lead to an increase in particulate matter concentration in the subway tunnel, resulting in poorer air quality inside the train. It is recommended that the air supply is increased during peak hours in the morning and evening when trains are in operation.
The waiting area and platform center show higher concentrations of PM10, PM2.5, and PM1.0 during the morning and evening peak. The main reason for this is that when the platform screen doors are opened, the strong piston wind generated by the train entering the station overlaps with the airflow disturbance caused by dense passenger flow, accelerating the migration of particulate matter from the subway tunnel to the subway platform [39]. At the same time, the resuspension effect of passenger flow enhances the intensity of particulate matter sources, resulting in peak concentrations in the waiting area and platform center throughout the day. After the platform screen doors are closed, although they can block the intrusion of particulate matter into the subway tunnel, the continuous disturbance caused by passenger flow slows down the concentration in the waiting area. Moreover, due to the short train interval and the limited time that the platform screen doors remain closed, the concentration on the subway platform remains at a high level.
Furthermore, the concentration in the waiting area is higher than that in the center of the platform because the waiting area is the most densely populated area for passenger flow. The concentration of particulate matter is affected by three factors: the opening and closing of the platform screen doors, passenger flow activity, and airflow disturbance. During the morning and evening peak, the PM10, PM2.5, and PM1.0 concentrations in the waiting area increased by 41.25% and 42.71%, 26.12% and 36.09%, 15.87% and 29.12%, respectively, compared to the off-peak period. Furthermore, the concentrations of PM10, PM2.5, and PM1.0 in the platform center increased by 42.09% and 56.49%, 35.12% and 47.28%, and 30.17% and 48.21%, respectively, compared to the off-peak period. The main reasons for this are the high flow of people during the morning and evening peaks and the highest frequency of train operation, which lead to an increase in the concentration of pollutants. However, the higher concentrations of PM10, PM2.5, and PM1.0 during the evening peak are due to the increased concentration of the same pollutants inside the subway tunnel, which enter the subway platform after the screen doors are opened. The impact of platform screen doors on the concentration of fine particulate matter on the subway platform is relatively low during the morning peak, and has a greater impact during the evening peak. This is consistent with the results given in [40], verifying our results. Therefore, effectively reducing the concentration of particulate matter at the subway platform is particularly important for creating a good indoor environment, and further in-depth research is needed on the relationship between particulate matter in waiting areas and the opening and closing of platform screen doors.

3.4. Influence of the Opening and Closing of Platform Screen Doors in the Waiting Area

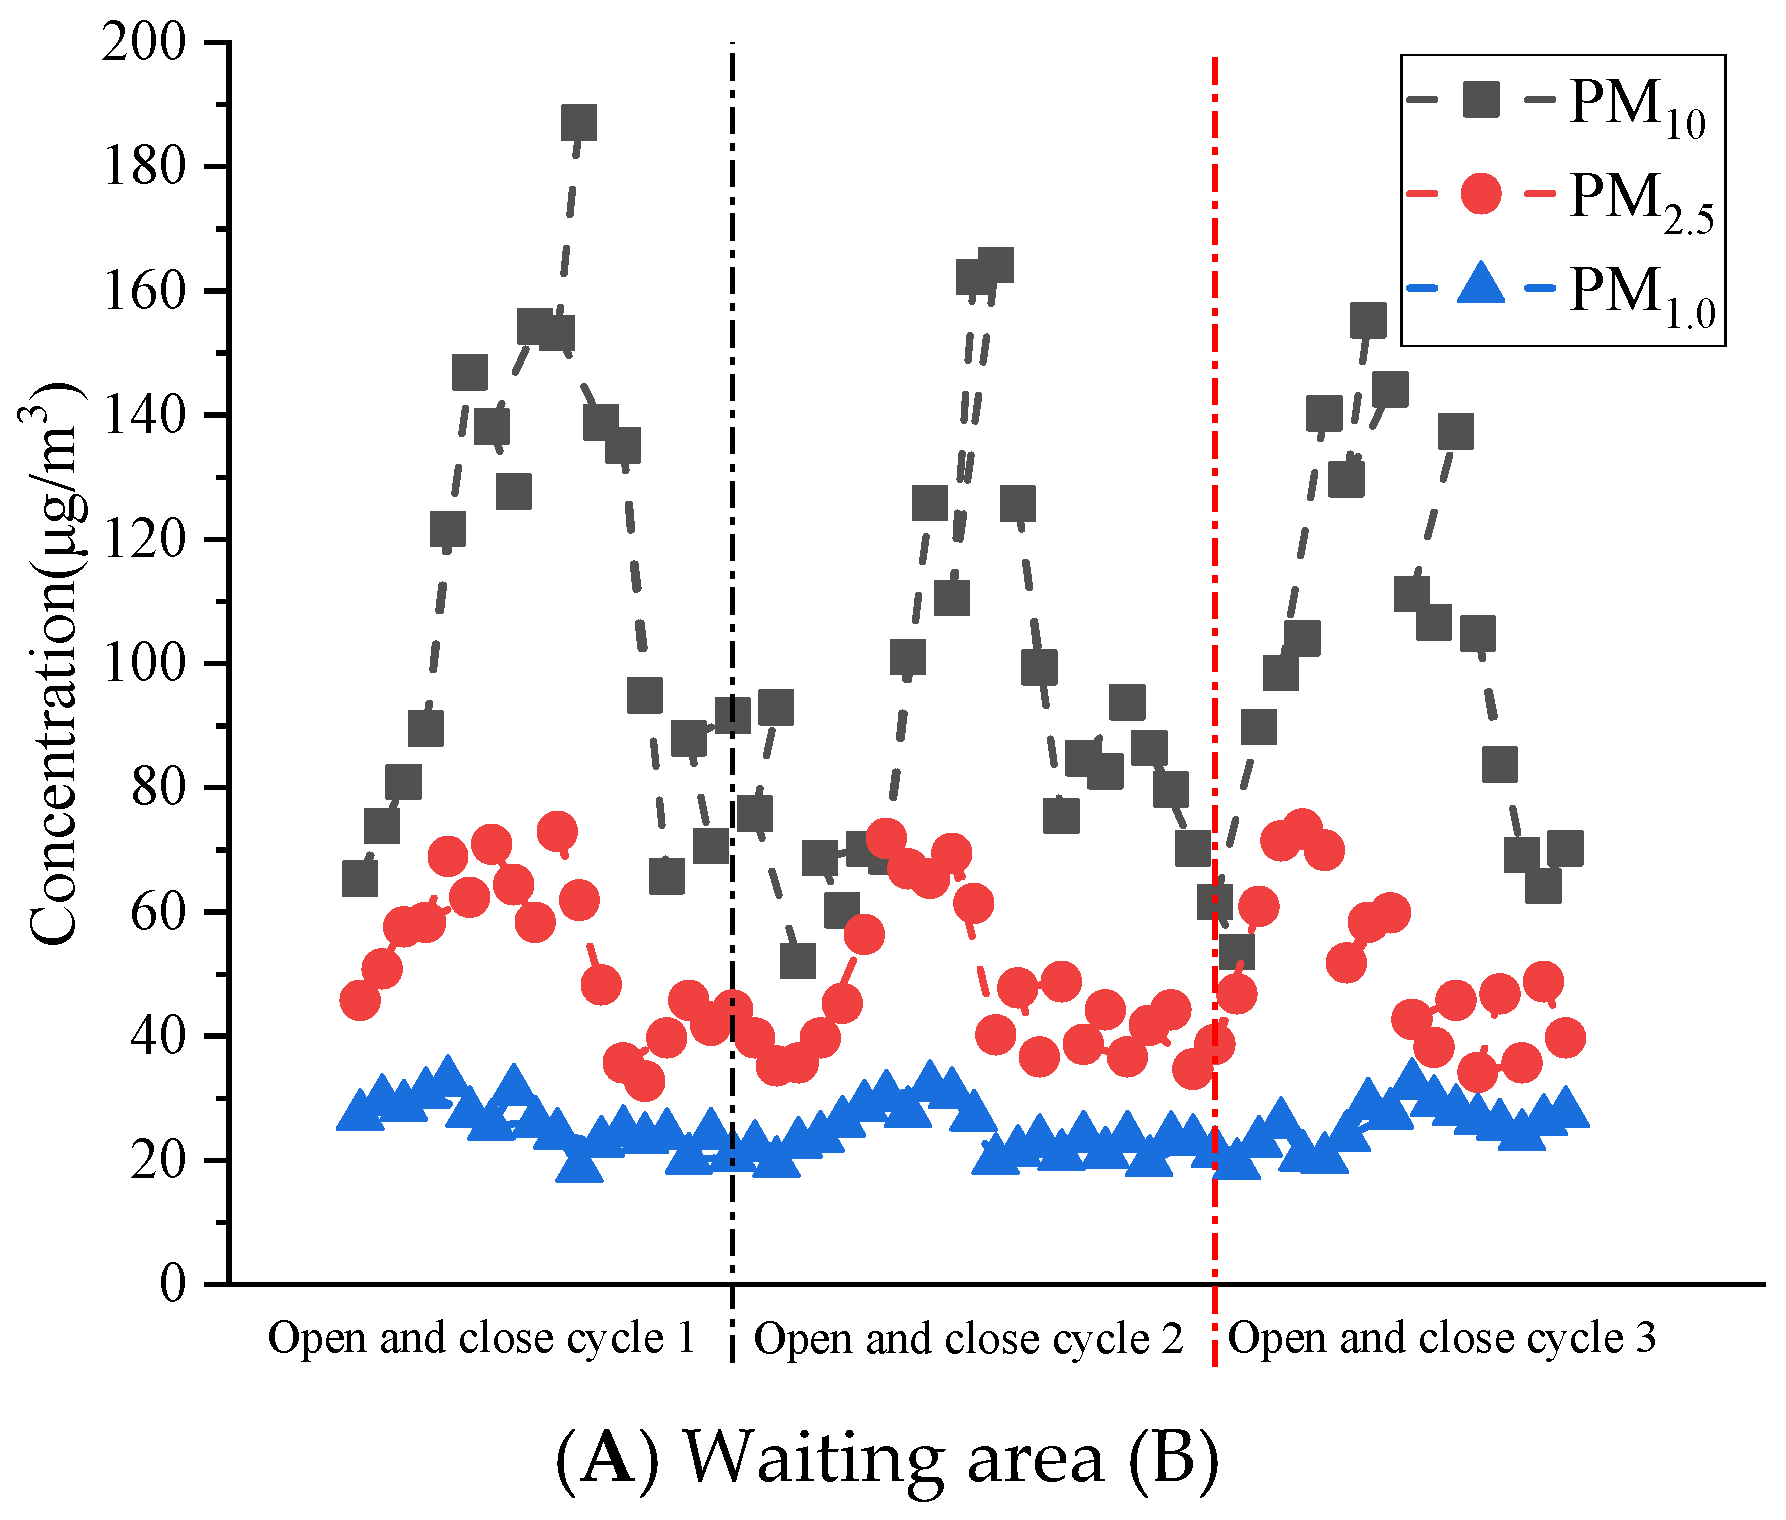
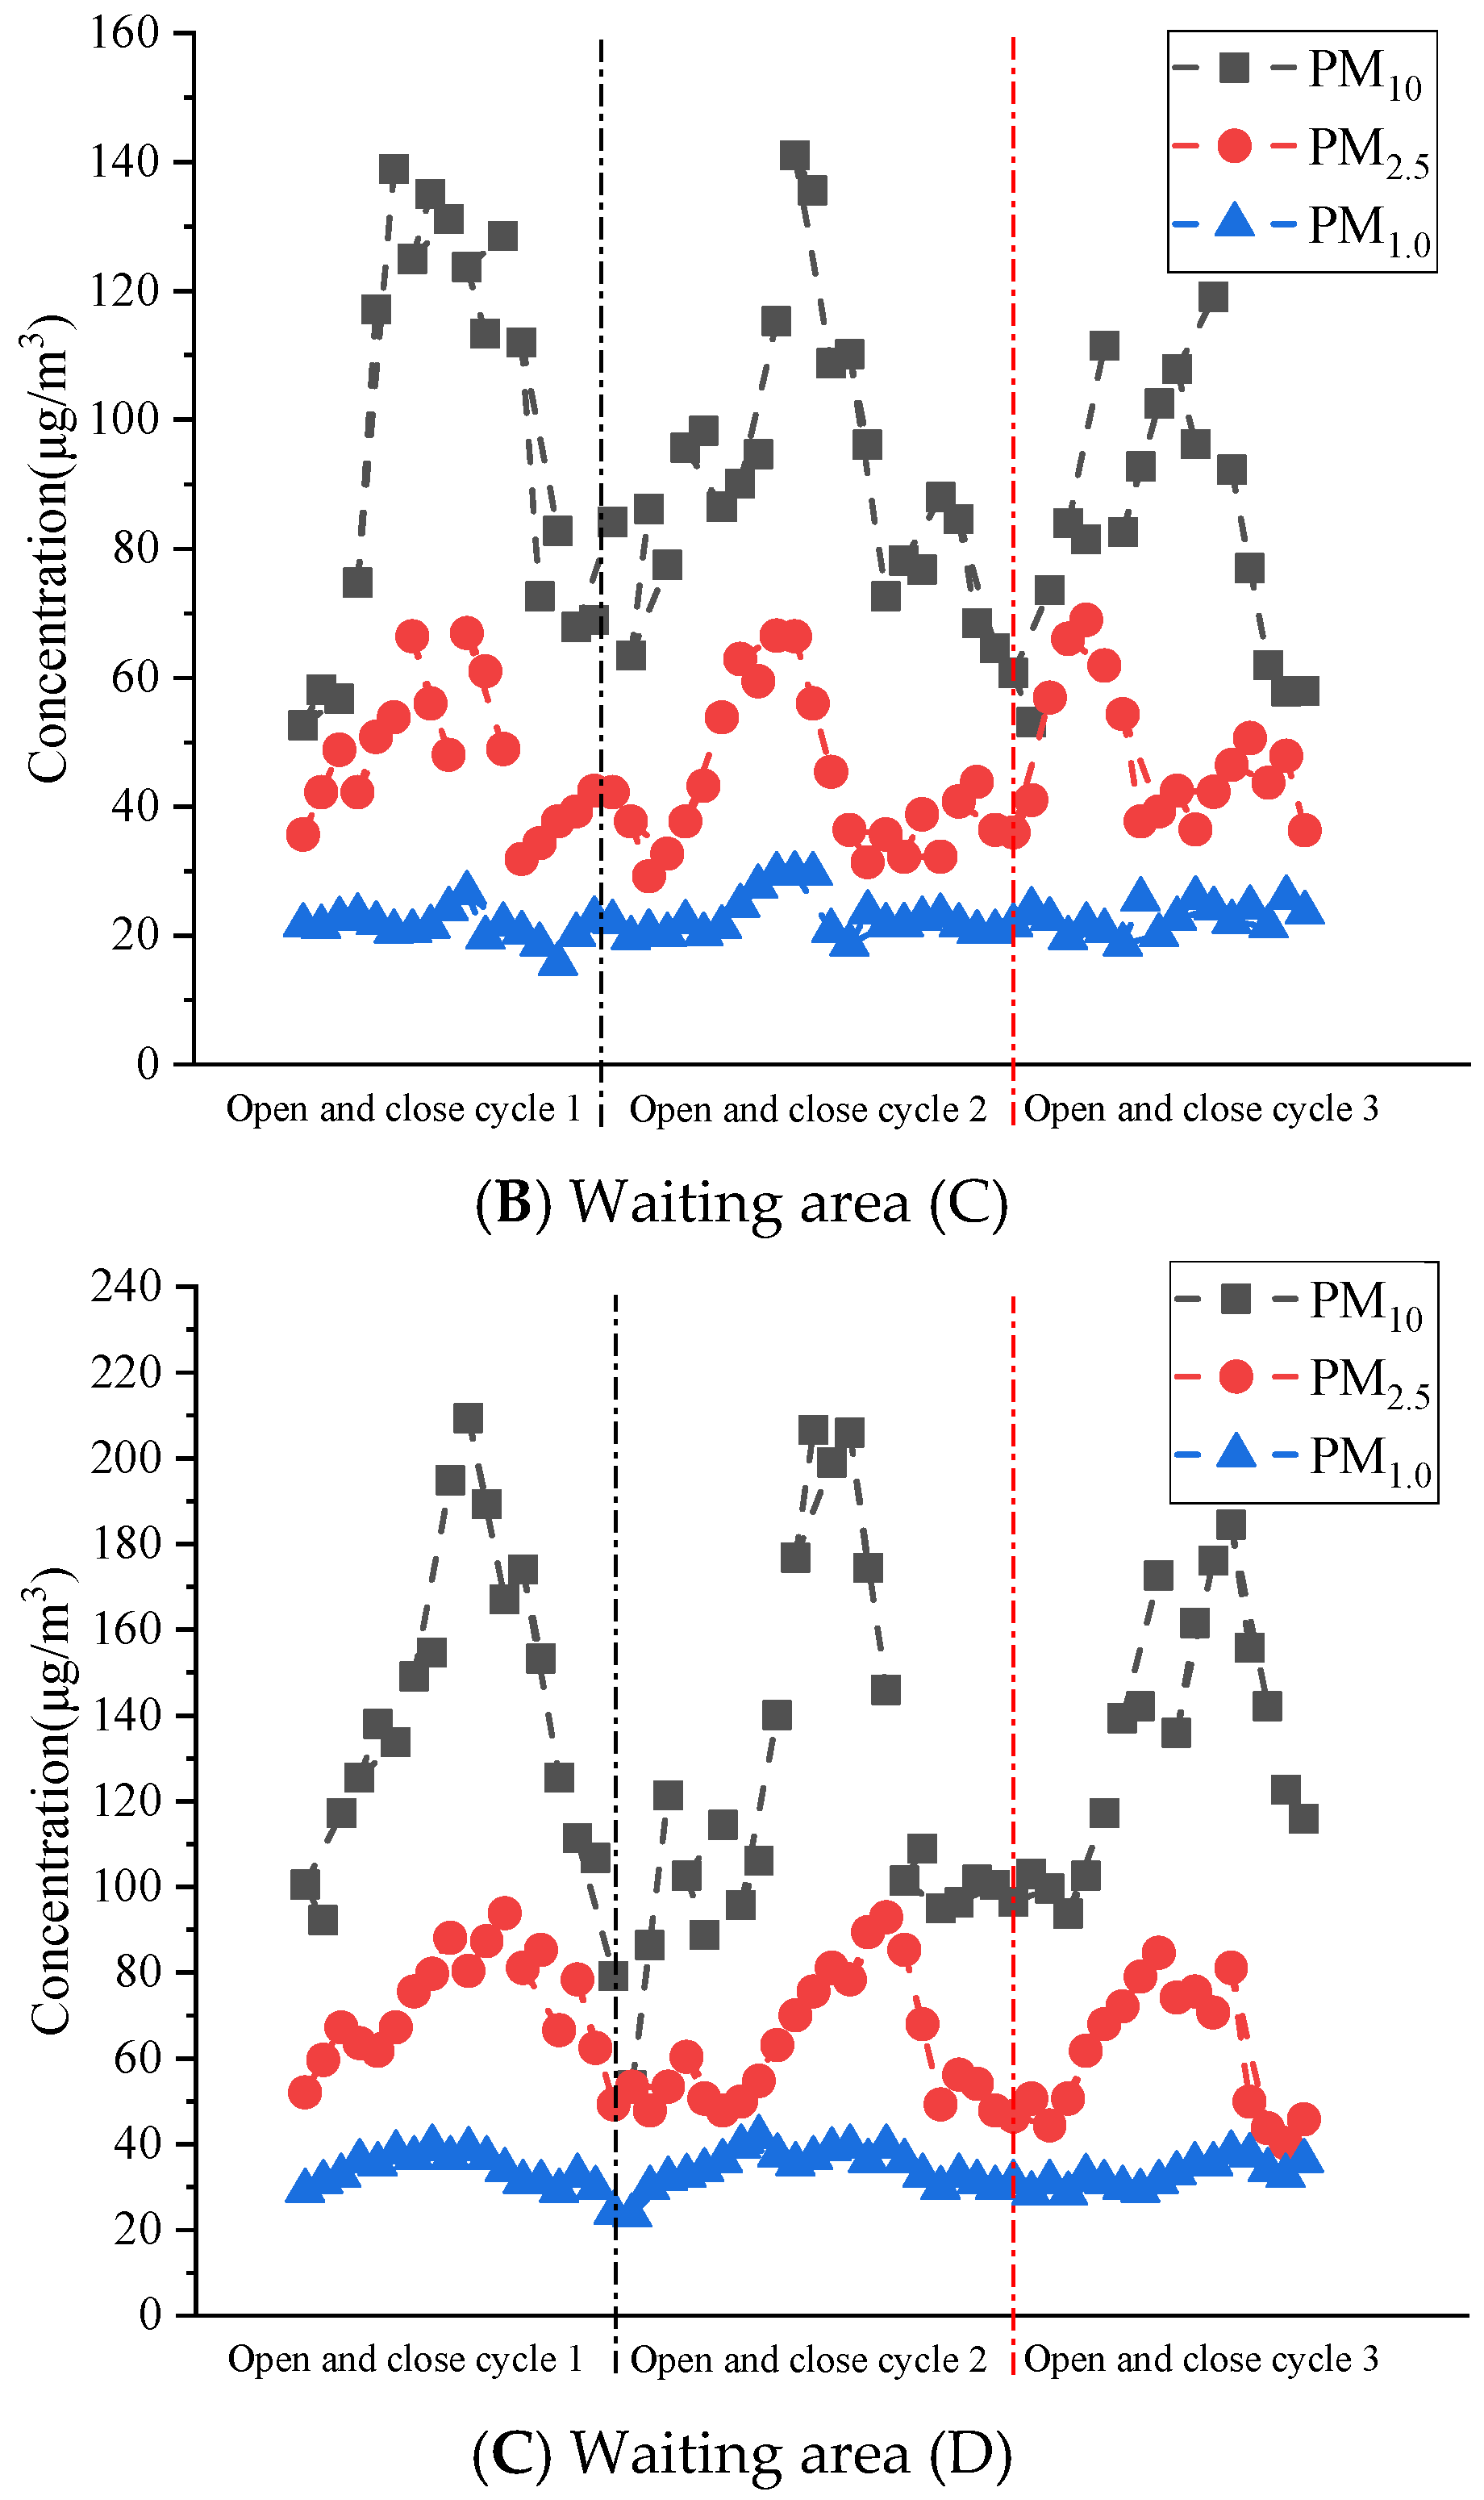
Figure 6 shows the changes in the concentration of particulate matter at the front (B), middle (C), and rear (D) of the waiting area during three consecutive PSD opening–closing cycles (evening peak). The figure uses “PSD opening–closing cycle” as the x-axis, with three cycles (Cycle 1, Cycle 2, Cycle 3) corresponding to three consecutive train arrival–departure processes (i.e., three instances of PSDs opening and closing). Each cycle includes two key stages: “PSD closed” (train not at the station) and “PSD open” (train at the station), making the concentration change law more intuitive.
As shown in Figure 6, the opening and closing of the platform screen doors has a periodic impact on the concentration of particulate matter on the subway platform. When the platform screen doors are opened, the concentration of particulate matter on the subway platform significantly increases. After the platform screen doors are closed, the train leaves the subway platform and the concentration of particulate matter on the subway platform decreases. Therefore, the concentrations of PM10, PM2.5, and PM1.0 in the waiting area show a trend of first increasing and then decreasing. The main reason for this is that when a train travels in a tunnel, it is like a piston moving. The front of the train pushes the air forward to create positive pressure, while the rear creates negative pressure, resulting in air flow. When the train enters the subway tunnel under positive pressure, the air inside the tunnel enters the platform through the gap in the screen door, increasing the concentration of particulate matter on the platform. After the train leaves the subway platform, negative pressure is formed inside the subway tunnel, which also carries away some of the air at the station, causing a periodic decrease in the concentration of particulate matter on the platform [41]. The peak average concentrations of PM10, PM2.5, and PM1.0 in the waiting area after the platform screen doors are opened increase by 70.53%, 55.81%, and 42.41%, respectively, compared to the average concentrations of PM10, PM2.5, and PM1.0 before the train enters the station. It can be seen that the opening of the platform screen doors causes a significant increase in the concentration of PM10 and PM2.5 in the waiting area, while the increase in PM1.0 concentration is relatively small. This is consistent with the findings of a relevant study [42], which found that wheel, brake, and track wear accounts for 40–73% of the total mass of PM10. As the train travels in the tunnel for a longer period of time, the amount of particulate matter generated in this part of the subway tunnel gradually increases. Therefore, a large amount of particulate matter generated in the subway tunnel will enter the platform through the opening and closing of the platform screen doors, verifying our findings.
In addition, it can be seen that the concentration in the rear of the waiting area increases fairly significantly, followed by the front, and the lowest is in the middle. At this time, the proportion of PM10, PM2.5, and PM1.0 that does not enter the waiting area after the platform screen doors are opened is 2.22%, 1.79%, and 1.22% higher than the previous period, respectively. They are 11.71%, 2.67%, and 3.12% higher, respectively, compared to the middle of the area. To further understand the differences in concentration at different locations on the subway platform, the average concentration during the entire evening peak was studied, and the results are shown in Table 1.
From Table 1, it can be observed that the PM10 concentration in the front and rear of the waiting area is higher than that in the middle by 37.85% and 57.61%, and the PM2.5 concentration is higher than that in the middle by 39.81% and 50.23%, respectively. However, no clear pattern was found for PM1.0. At the same time, it was found that the concentration of particulate matter in the rear was significantly higher than that in the front. This is consistent with the conclusion drawn by T. Moreno et al. [43]. This is because as the train enters the station, the piston wind first reaches the rear, and a large amount of particulate matter in the subway tunnel is pushed to this position. Due to the gaps in the screen doors, some particulate matter may enter the rear platform before the screen doors are opened, resulting in a higher concentration of particulate matter in the rear than in the front. Subsequently, the train stops steadily and the platform screen doors open. Due to the positive pressure inside the subway tunnel and negative pressure on the subway platform, a large amount of particulate matter in the subway tunnel is sucked into the platform area. The particulate matter at both ends of the subway tunnel first passes through the front and rear screen doors, so the particulate matter concentration in the front and rear of the waiting area is higher than that in the middle. Therefore, in order to minimize the risk of harm caused to passengers by the opening and closing of the shield doors, it is recommended that passengers wait for the train on the platform or in the middle of the waiting area. In addition, it is necessary to regularly change the work positions of platform staff and provide them with sufficient rest, and regularly clean the subway tunnel. However, this study only conducted tests on the front, middle, and rear parts of subway platforms near the platform screen doors, with relatively few testing points. Subsequent research should increase the testing sample and period, such as 10 stations studied all year round, and consider the subjective feelings of personnel to provide comprehensive reference data for designing subway environments.

4. Conclusions

This study measured the impact of opening and closing platform screen doors during morning, evening, and off-peak hours on the concentration of particulate matter (PM10, PM2.5, PM1.0) in the subway tunnel, platform center, and waiting area at Beidajie Station of Xi’an Metro Line 2 from 1 July to 31 August 2024. The main conclusions are as follows:
  • The concentrations of PM10, PM2.5, and PM1.0 followed a consistent spatial trend: subway tunnel > waiting area > platform center. PM10 concentrations exceeded the 24 h limit (100 μg/m3) specified in China’s standards for indoor air quality (GB/T18883-2022) at all three locations, while only PM2.5 at the platform center met the standard (≤50 μg/m3). Temporally, the average concentrations of PM10, PM2.5, and PM1.0 in the subway tunnel were highest during off-peak hours, followed by the morning peak, and lowest during the evening peak.
  • Pollutants in the subway tunnel, waiting area, and platform center are mainly composed of particles smaller than 1.0 μm. The high concentration of particulate matter is maintained throughout the subway tunnel, and is minimally affected by the opening and closing of the platform screen doors, with only slight fluctuations caused by the disturbance of the train piston wind.
  • After the platform screen doors are opened, the peak average concentrations of PM10, PM2.5, and PM1.0 in the waiting area increase by 70.53%, 55.81%, and 42.41%, respectively, compared to the average concentrations of PM10, PM2.5, and PM1.0 before the train enters the station.
  • The platform screen doors have a significant impact on the concentration of fine particulate matter on the platform during the evening peak. The PM10 concentration in the front and rear waiting areas is higher than that in the middle by 37.85% and 57.61%, and the PM2.5 concentration is higher than that in the middle by 39.81% and 50.23%, respectively.
According to the research results, it is recommended that passengers wait in the middle of the waiting area. During peak hours, the subway should increase the air conditioning volume appropriately to ensure the air quality inside the station. At the same time, the air purification system needs to be cleaned, disinfected, and sterilized every year to improve its operating efficiency and minimize the time that pollutants remain at the platform.

5. Limitations and Future Research Directions

This study was conducted at Beidajie Station of Xi’an Metro Line 2, with six measuring points (tunnel: E, F; platform center: A; waiting area: B, C, D). Metro systems vary significantly in line length, ventilation structure, tunnel geometry, and passenger density across different stations and lines. Additionally, this study only monitored three time periods during summer, without considering seasonal variability or weekday/weekend differences in passenger flow and train operation. The outdoor weather conditions and seasonal changes in passenger density may affect the generation, migration, and diffusion of particulate matter in subways.
In future research, we will conduct multi-station and multi-line measurements, including stations with different platform types, ventilation system designs, and passenger flow characteristics. It will also be essential to carry out year-round monitoring to capture seasonal variations in particulate matter concentrations, and add comparative analyses with weekdays/weekends. Additionally, it is necessary to integrate more advanced analytical methods to supplement chemical composition analysis of particulate matter to comprehensively evaluate health risks.

Author Contributions

Conceptualization, X.Z.; methodology, Y.Y. and X.Z.; investigation, L.X.; Resources, Y.Y. and X.Z.; writing—original draft preparation, L.X. and Y.Y.; writing—review and editing, Y.Y. and X.Z. All authors have read and agreed to the published version of the manuscript.

Funding

This research was funded by the Key Scientific Research Project of CCCC Second Highway Engineering Co., Ltd. (No. 2021X-5-21), the Independent Research and Development project of State Key Laboratory of Green Building (Project No. LSZZ-Y202422), the Natural Science Basic Research Program of Shaanxi Province (No. 2024JC-YBQN-0453), the Shaanxi Provincial Department of Education Service Local Special Plan Project (No. 24JC050), the National Natural Science Foundation of China (No. 52278122), the Zhejiang Provincial Natural Science Foundation of China (No. ZCLQN26E0801), and the Scientific Research Fund of Zhejiang Provincial Education Department (No. Y202559062).

Data Availability Statement

The data presented in this study are available on request from the corresponding author.

Conflicts of Interest

Author Liang Xian was employed by the company Tianjin Chengjian University of Architectural Design and Research Co., Ltd. Author Yonghao Yuan was employed by the company CCCC Second Highway Engineering Co., Ltd. and Research and Development Center on Construction Technology of Long Bridge and Tunnel in Mountain Areas, CCCC. The remaining author declares that the research was conducted in the absence of any commercial or financial relationships that could be construed as a potential conflict of interest.

References

  1. Wang, C.; Li, X. Improvement Measures for Air Quality in Subway Stations: Selection of Ventilation Mode. J. Build. Eng. 2025, 108, 112812. [Google Scholar] [CrossRef]
  2. Dinh, T.V.; Park, B.G.; Lee, S.W.; Choi, I.Y.; Baek, D.H.; Kim, J.C. Long-Term Evaluation of Mid-Cost Optical Particle Counters for PM2.5 Monitoring in an Underground Subway Station: Insights from a 15-Month Study. Chemosensors 2025, 13, 25. [Google Scholar] [CrossRef]
  3. Cui, J.; Nelson, J.D.; Beecroft, M.; Lin, D. Subway systems and tourism: An overview and implications. Res. Transp. Bus. Manag. 2024, 57, 101205. [Google Scholar] [CrossRef]
  4. Barros, A.P.B.G. Sustainable urban mobility:(A) synchrony between Subway Systems. J. Traffic Transp. Eng. 2024, 12, 151–161. [Google Scholar]
  5. Moreno, T.; de Miguel, E. Improving air quality in subway systems: An overview. Env. Pollut. 2018, 239, 829–831. [Google Scholar] [CrossRef]
  6. Wang, S.; Chen, Z.; Zhang, G.; Xu, Z.; Liu, Y.; Yuan, Y. Overview and analysis of ground subsidence along china’s urban subway network based on synthetic aperture radar interferometry. Remote Sens. 2024, 16, 1548. [Google Scholar] [CrossRef]
  7. Agarwal, D.; Trinh, X.T.; Takeuchi, W. Assessing the Air Quality Impact of Train Operation at Tokyo Metro Shibuya Station from Portable Sensor Data. Remote Sens. 2025, 17, 235. [Google Scholar] [CrossRef]
  8. Wei, J.; Zhou, Y.; Lin, C.; Bi, H.; Liu, K. Numerical study on natural ventilation of equipment rooms in underground subway stations. Energy Build. 2025, 351, 116741. [Google Scholar] [CrossRef]
  9. Liu, M.; Jia, S.; Li, P.; Liu, X.; Zhang, Y. Predicting GHG emissions from subway lines in the planning stage on a city level. J. Clean. Prod. 2020, 259, 120823. [Google Scholar] [CrossRef]
  10. Karim, A.S.; Malone, M.; Bruno, A.; Eggler, A.L.; Posner, M.A.; Shakya, K.M. Assessment of air quality in the Philadelphia, Pennsylvania subway. J. Expo. Sci. Environ. Epidemiol. 2025, 35, 196–204. [Google Scholar] [CrossRef]
  11. Lin, S.; Yu, T.; Huang, J. Subway openings and urban air pollution mitigation: Pathways to sustainable development in China. Sustainability 2025, 17, 4782. [Google Scholar] [CrossRef]
  12. Chen, F.; Zuo, W.; Chen, Z. Road to health: Evidence from subway construction in China. Cities 2024, 155, 105427. [Google Scholar] [CrossRef]
  13. Kim, K.H.; Ho, D.X.; Jeon, J.S.; Kim, J.C. A noticeable shift in particulate matter levels after platform screen door installation in a Korean subway station. Atmos. Environ. 2012, 49, 219–223. [Google Scholar] [CrossRef]
  14. Zhou, Y.; Wang, H.; Bi, H.; Wang, J. Experimental and numerical study of aerodynamic pressures on platform screen doors at the overtaking station of a high-speed subway. Build. Environ. 2021, 191, 107582. [Google Scholar] [CrossRef]
  15. Zhang, Y.; Luan, C.; Li, X. Analysis of CO2 concentration in subway tunnels and train carriages with platform bailout doors. Int. J. Vent. 2025, 24, 484–503. [Google Scholar]
  16. Li, Y.; Xu, D.; Wang, J.; Liu, J.; Wang, Y.; Jiang, J. Simulation of subway flood evacuation based on modified social force model. Tunn. Undergr. Space Technol. 2025, 156, 106244. [Google Scholar] [CrossRef]
  17. Izadi, T.; Mehrabian, M.A.; Sadrizadeh, S.; Olofsson, U.; Abouali, O. The effect of ventilation system with and without under-platform exhaust on the concentration of braking micro-particles inside the subway system. Tunn. Undergr. Space Technol. 2022, 128, 104638. [Google Scholar] [CrossRef]
  18. Yang, J.; Li, P.; Lu, Z. Numerical simulation and in-situ measurement of ground-borne vibration due to subway system. Sustainability 2018, 10, 2439. [Google Scholar] [CrossRef]
  19. Su, Z.; Li, X. Analysis of energy-saving for ventilation and air-conditioning system of subway stations with platform screen doors. J. Build. Eng. 2022, 59, 105064. [Google Scholar] [CrossRef]
  20. Song, J.; Zhang, Y.; Huang, Y.; Wang, P.; Yang, B. Ventilation strategy for particulate matter control in subway stations. J. Build. Eng. 2024, 98, 111323. [Google Scholar] [CrossRef]
  21. Zhang, X.; Xu, S.; Ren, X.; Li, A.; Yang, C.; Ma, J. Train-induced airflow in subway station tunnel affected by train running and key airflow channel boundary parameters. Tunn. Undergr. Space Technol. 2025, 155, 106243. [Google Scholar] [CrossRef]
  22. Lü, J.L.; Han, Q.; Wang, Z.; Tao, M.; Hu, X.; Cao, M.; Huang, Q.; Shi, M.; He, Z.; Zhao, X. Characteristics, sources, and health risks of fine particulate matter in wuhan subway, China. Sci. Total Environ. 2025, 967, 178842. [Google Scholar] [CrossRef]
  23. Li, J.; Li, A.; Hou, Y.; Zhang, C.; Yang, C.; Zhang, X.; Che, J.; Guo, J. Air distribution and thermal environment optimization on subway platform using an innovative attached ventilation mode. Build. Environ. 2021, 204, 108226. [Google Scholar] [CrossRef]
  24. Li, C.; Liu, Y. Tunnels of power: The cultural politics of the Beijing subway. Mod. Asian Stud. 2024, 58, 840–864. [Google Scholar] [CrossRef]
  25. Meng, M.; Zeng, Z.; Huo, Z. How do subway stations encourage the vitality of urban consumption amenities in Shanghai: A perspective on agglomeration. J. Transp. Land Use 2025, 18, 175–196. [Google Scholar] [CrossRef]
  26. Wu, H.; Yang, K.; Chen, K.; Zhou, W.; Yu, T.; Wang, K. GHG emission quantification and reduction pathway of subway shield tunnel engineering: A case study on Guangzhou Metro, China. Environ. Sci. Pollut. Res. 2024, 31, 54768–54784. [Google Scholar] [CrossRef]
  27. Xiu, M.; Cheng, Y.; Liu, S.; Huang, Y.; Xue, Y.; Li, Y.; Meng, Y.; Jayaratne, R.; Wang, X.; Thai, P.; et al. Characteristics, sources and risk assessment of volatile organic compounds in a subway environment—A case study in Xi’an, China. Build. Environ. 2025, 283, 113438. [Google Scholar] [CrossRef]
  28. Li, P.; Yang, Q.; Lu, W. Nonlinear relationship of multi-source land use features with temporal travel distances at subway station level: Empirical study from Xi’an city. Land 2024, 13, 1021. [Google Scholar] [CrossRef]
  29. Zhang, S.; Wang, Y.; Liu, Z.; Huang, J. Effects of built environment on metro ridership at a microscopic scale: A case study of Xi’an, China. Transp. Plan. Technol. 2024, 47, 42–61. [Google Scholar] [CrossRef]
  30. Sui, X.; Chen, S.; Han, B.; Yu, S. Evaluation of the Thermal Environment of Xi’an Subway Stations in Summer and Determination of the Indoor Air Design Temperature for Air-Conditioning. Sustainability 2023, 15, 6111. [Google Scholar] [CrossRef]
  31. Peng, J.B.; Huang, Q.B.; Hu, Z.P.; Wang, M.X.; Li, T.; Men, Y.M.; Fan, W. A proposed solution to the ground fissure encountered in urban metro construction in Xi’an, China. Tunn. Undergr. Space Technol. 2017, 61, 12–25. [Google Scholar] [CrossRef]
  32. Yu, L.; Chen, Q.; Chen, K. Deviation of peak hours for urban rail transit stations: A case study in Xi’an, China. Sustainability 2019, 11, 2733. [Google Scholar] [CrossRef]
  33. GB-T18883-2022; Sciences CAoE, Standards for Indoor Air Quality. China Environmental Science Press: Beijing, China, 2022.
  34. Azad, S.; Ferrer-Cid, P.; Ghandehari, M. Exposure to fine particulate matter in the new york city subway system during home-work commute. PLoS ONE 2024, 19, 20. [Google Scholar] [CrossRef] [PubMed]
  35. Lu, Y.; Wang, J.; Liu, T.; Yoo, C.K.; Liu, H. Integration of dynamic slow feature analysis and deep neural networks for subway indoor PM2.5 prediction. IEEE Trans. Instrum. Meas. 2024, 73, 2533209. [Google Scholar] [CrossRef]
  36. Park, Y.; Kim, L.; Choi, W. Comparison of transit user’s inhalation rates of PM2.5 between three transportation types (walk, bus, subway) in spring and summer in urban areas of busan, korea. J. Korean Soc. Atmos. Environ. 2019, 35, 577–592. [Google Scholar] [CrossRef]
  37. Mendes, L.; Gini, M.I.; Biskos, G.; Colbeck, I.; Eleftheriadis, K. Airborne ultrafine particles in a naturally ventilated metro station: Dominant sources and mixing state determined by particle size distribution and volatility measurements. Environ. Pollut. 2018, 239, 82–94. [Google Scholar] [CrossRef]
  38. Namgung, H.G.; Kim, J.B.; Kim, M.S.; Kim, M.; Park, S.; Woo, S.H.; Bae, G.N.; Park, D.; Kwon, S.B. Size distribution analysis of airborne wear particles released by subway brake system. Wear 2017, 372, 169–176. [Google Scholar] [CrossRef]
  39. Lin, Y.; Sun, Q.; Liu, X. Analysis of the mechanism of ground collapse induced by water and sand inflow during tunnel construction: A case study of xi’an Metro Line 8. Transp. Geotech. 2025, 55, 101664. [Google Scholar] [CrossRef]
  40. Wang, X.; Meng, X.; Chang, L.; Pei, F.; Wan, T.; Cui, T.; Liu, Y.; Pan, S. Concentration, composition and exposure risk assessment of particulate matter with different particle sizes in subway stations. Build. Environ. 2024, 258, 111604. [Google Scholar] [CrossRef]
  41. Sun, L.; Seyedkazemi, M.; Nguyen, C.C.; Zhang, J. Dynamics of Train–Track–Subway System Interaction—A Review. Machines 2025, 13, 1013. [Google Scholar] [CrossRef]
  42. Colombi, C.; Angius, S.; Gianelle, V.; Lazzarini, M. Particulate matter concentrations, physical characteristics and elemental composition in the Milan underground transport system. Atmos. Environ. 2013, 70, 166–178. [Google Scholar] [CrossRef]
  43. Moreno, T.; Pérez, N.; Reche, C.; Martins, V.; Miguel, D.e.E.; Capdevila, M.; Centelles, S.; Minguillón, M.C.; Amato, F.; Alastuey, A. Subway platform air quality: Assessing the influences of tunnel ventilation, train piston effect and station design. Atmos. Environ. 2014, 92, 461–468. [Google Scholar] [CrossRef]
Figure 1. Schematic diagram of measuring point location.
Buildings 16 00356 g001
Figure 2. Particle concentration at different locations.
Buildings 16 00356 g002
Figure 3. Proportion of particles at different locations.
Buildings 16 00356 g003
Figure 4. Distribution of particle counting concentration at different locations.
Buildings 16 00356 g004
Figure 5. Distribution of particulate matter at different time periods.
Buildings 16 00356 g005aBuildings 16 00356 g005b
Figure 6. Distribution of particulate matter during the cycle.
Buildings 16 00356 g006aBuildings 16 00356 g006b
Table 1. Average distribution of particulate matter.
Measurement PositionPM10 (μg/m3)PM2.5 (μg/m3)PM1.0 (μg/m3)
Front (B)155.3971.2425.48
Middle (C)96.5742.8824.89
Rear (D)227.8386.1532.65
Disclaimer/Publisher’s Note: The statements, opinions and data contained in all publications are solely those of the individual author(s) and contributor(s) and not of MDPI and/or the editor(s). MDPI and/or the editor(s) disclaim responsibility for any injury to people or property resulting from any ideas, methods, instructions or products referred to in the content.