1. Introduction
Building color is a core visual carrier of urban character. It embodies local cultural context, shapes the pedestrian experience, and contributes to residents’ place identity, making it a key element for refined control of urban character during stock-oriented renewal. Jalil et al. [
1] noted that environmental color combinations directly affect human emotional and behavioral responses. Gorzaldini [
2] further showed that the color quality of the urban appearance strongly influences the public’s overall evaluation of the urban environment, while Acking and Küller [
3] demonstrated that indoor and outdoor color perception can be traced to basic physiological mechanisms of spatial perception. Shenyang, a typical old industrial city in a cold region, has undergone multiple phases of layered development. Its built environment includes industrial plants, aging residential communities, modern commercial–residential complexes, and other forms. Together with disorderly renewal of roadside shop signs, unauthorized façade alterations, and poorly maintained finishes, these conditions have produced imbalanced light–dark contrasts, disordered palettes, weak dominant–secondary hierarchies, and disrupted color continuity within the study area. Large areas of low-lightness, low-chroma gray façades in older districts can generate depressing and boring perceptions. Commercial districts and new developments often contain uncoordinated accumulations of high-contrast colors, causing visual disorder and aesthetic overload. Traditional urban color control relies mainly on manual surveys and qualitative palette summaries and has three inherent limitations. First, limited sample coverage allows only selected districts to be assessed qualitatively, making continuous city-wide quantification difficult. Second, substantial subjective bias and inconsistent criteria for color harmony and richness leave planning guidelines with insufficient data support. Third, planning logic gives insufficient consideration to public experience and constrains palettes primarily through design aesthetics. This reduces the implementability of color-renewal strategies and promotes homogeneous district-level interventions.
Street-view big data and deep-learning semantic segmentation can decode street elements at the pixel level and automatically extract façade colors at scale, providing technical support for city-wide quantitative color research. Biljecki and Ito [
4] systematically reviewed the development of street-view imagery in urban analysis, while Yan et al. [
5], Zhang et al. [
6], and Zhong et al. [
7] used street-view images and computer-vision techniques to quantify façade colors and map their spatial distributions. However, existing theory and practice have long separated objective color measurement from subjective public perception. Studies have either mapped basic lightness, hue, and chroma indicators or conducted perception surveys independently, without establishing a hierarchical analytical system linking low-level basic color attributes, mid-level street color organization, and high-level public experience. Building a multilevel color-perception assessment framework from large-scale, continuous street-view data, accurately diagnosing color problems, and developing differentiated renewal pathways therefore remain practical challenges for Shenyang and other cold-climate old industrial cities. When the perception layer uses a cross-regional model, model-inferred results must also be distinguished from direct evaluations by local residents.
Modern urban color research is grounded in Lenclos’s geography of color. Lenclos and Lenclos [
8] argued that climate, building materials, regional cultural context, and production patterns jointly determine a city’s underlying color, providing a conceptual basis for regionally differentiated color control. European and American cities such as Paris, Venice, and Turin have used this approach to develop city-wide color plans, coordinating overall urban character through base-hue delineation, district-level palette control, and façade color-combination constraints. Early practice, however, depended on manual sampling and qualitative classification. It could describe static palettes at the district scale, but it could not quantify the dynamic color texture of continuous street interfaces or incorporate public-perception validation.
Research on color planning in China matured progressively after 2000, with studies examining palettes in different types of cities, including ancient capitals, coastal cities, and cold-climate industrial cities. Mohammadgholipour et al. [
9] demonstrated a quantitative approach to regional color research by analyzing the color palette of Naqsh-e Jahan Square in Isfahan, while Nguyen and Teller [
10] proposed a user-oriented chromatic characterization protocol and a parametric typology that provides standardized tools for systematic urban-color analysis. Existing studies of cold-climate cities in Northeast China indicate that limited winter sunlight and constraints imposed by thermal-insulation materials have led to the widespread use of low-lightness, low-chroma gray finishes, which can produce oppressive street atmospheres. Most of these conclusions, however, are based on local manual surveys, lack support from city-wide street-view data, and do not distinguish the different effects of individual façade colors and continuous street-level color organization on spatial experience.
Overall, existing research on color geography and planning emphasizes static hue control for individual buildings, overlooks the dynamic color order formed by continuous street interfaces, and separates objective color indicators from subjective public evaluations. It therefore has difficulty supporting refined, district-specific urban-character governance in the context of stock-oriented renewal.
Street-view big data has shifted urban-environment research from local sampling toward city-wide quantitative analysis. Street-view images combined with semantic-segmentation models can automatically decode buildings, vegetation, shop signs, and other spatial elements, extract color, texture, and area-proportion indicators in batches, and produce city-wide spatial maps. Zhang et al. developed a city-scale method for measuring façade color using deep learning and street-view images and incorporated building-function classification. Zhong et al. mapped façade colors at the city scale using street-view imagery and identified ring-like differentiation in urban color. Han et al. [
11] used street-view big data and deep learning to measure architectural color in Tianjin street spaces, while Ding [
12] quantitatively compared the spatial differentiation of urban color in the Xia–Zhang–Quan metropolitan area using an image-clustering algorithm.
Current street-view-based research on building color still has three major limitations. First, the indicator dimension is narrow: most studies extract only basic lightness, hue, and chroma parameters, while omitting composite indicators of color relationships, such as harmony, complexity, balance, and dominant–secondary hierarchy clarity. They therefore overlook the logic of color combinations at both façade and street scales. Second, the analytical chain is incomplete: studies often stop at objective color mapping without linking the results to subjective public perception, making it difficult to quantify differences in the aesthetic, depressing, or lively experiences produced by different color combinations. Although Yu et al. [
13] attempted to combine urban color perception with sentiment analysis, a complete perceptual transmission chain was not established. Third, the indicator hierarchy is unclear: basic pixel-level color attributes and mid-level street color organization are not distinguished and are often analyzed together, obscuring their layered mechanisms. Wang et al. [
14], for example, systematically extracted hue, lightness, and chroma from residential buildings in Shanghai, but the analysis remained focused on describing basic color features. Overall, existing studies have achieved automated extraction of basic color information but have not established a multiscale color-organization evaluation system spanning individual façades and continuous streets, leaving a clear research gap between objective color quantification and public-perception evaluation.
Quantifying public visual perception is a frontier in urban spatial computing. Developed by the MIT Media Lab, Place Pulse 2.0 provides a data and modeling basis for multi-city perception assessment. The platform collected pairwise comparisons of street-view images through online crowdsourcing and established six dimensions: wealthy, beautiful, boring, depressing, lively, and safe. Convolutional neural networks were then used to map street-view imagery to perception scores. For deep-learning semantic segmentation, SegNet proposed by Badrinarayanan et al. [
15] and the DeepLab series proposed by Chen et al. [
16] established important technical foundations for pixel-level segmentation of street-view images. Studies in China have applied related frameworks to examine perceptual effects of morphological elements such as building scale and vegetation. Li et al. [
17] developed a cognitive framework for urban building-color evaluation that combines machine learning with human perception. Song and Xiao [
18] used deep learning to examine the relationship between streetscape color and urban perception. Three issues remain. First, explanatory color variables are concentrated on basic parameters such as lightness and chroma, with limited attention to organizational indicators such as complexity, balance, and continuity. Second, cultural and geographic differences may exist between the training distribution of cross-city perception models and local scenes in Shenyang. Direct application therefore requires a clear statement of validation status and interpretive boundaries. Third, basic color attributes, street color organization, and perception assessment have rarely been examined together within a clearly layered analytical framework.
Color science has established mature standardized systems for color quantification, including CIELAB and HSV. The uniform color spaces and color-difference formulas published by the CIE [
19] provide international standards for color science and define the three basic visual dimensions of lightness, hue, and chroma. Visual-aesthetic and environmental-psychology research has derived composite indicators such as contrast, balance, complexity, and harmony, demonstrating that the order of color combinations directly affects visual comfort and psychological responses. Hasler and Süstrunk [
20] proposed the Colorfulness (CF) algorithm based on opponent-color components, and Jiang et al. [
21] introduced area weighting to this approach by converting RGB values into opponent-color components so that colors occupying larger areas contributed proportionally more to CF. For color harmony (CH), Ou and Luo [
22] established a two-color harmony model based on CIELAB color differences that integrates hue, lightness, and chroma effects, providing a theoretical basis for evaluating multicolor harmony on building façades. Li et al. [
23], Won et al. [
24], and Li et al. [
25] subsequently conducted empirical studies of façade color harmony and color preference. Zhai et al. [
26] used street-view images and deep learning to analyze the roles of façade color distribution, color harmony, and diversity in classifying street functions. For color contrast (CC), Mehdipour et al. [
27] identified the components of harmony and contrast in exterior residential-building color combinations, while Liu et al. [
28] evaluated architectural color comfort and harmony using street-view images. Yang et al. [
29] proposed a new street-view-based approach for assessing color harmony in historic buildings, and Lyu et al. [
30] quantified building-color harmony in a coastal historic and cultural district using Mojiko, Japan, as a case study. O’Connor [
31] showed through controlled experiments that high-lightness façades can reduce perceived street oppression and that façade color significantly affects judgments of building scale and harmony. Spillmann [
32] systematically discussed the methodology of architectural color design from a practical perspective. For street-level color continuity (SCS), Jiang et al. [
21] proposed a spatial-continuity measure based on color similarity between street-view images, providing a quantitative tool for evaluating the coherence of street interfaces. Porter [
33] systematically described the principles and applications of architectural color design in his classic work.
Wang et al. [
34] combined eye tracking with subjective evaluation to provide a new experimental paradigm for quantifying the visual quality of façade color combinations, offering useful insight into the perceptual effects of color attributes. Cao et al. [
35] developed a computer-vision-based multiscale evaluation system for architectural colors in Tianjin’s historic and cultural districts, and their color-attribute extraction method provided a technical reference for the CA-layer indicators in this study. Pyykkö et al. [
36] used the color-walk method to conceptualize environmental color experience and identified seven core concepts, including materials, light, views, and atmosphere. This work provides a theoretical basis for understanding how basic color attributes affect environmental experience. Wang et al. [
37] proposed a multimodal large-language-model approach for measuring color differences, offering a new route for refined extraction and comparison of building-color attributes. Dubey et al. [
38] developed a global street-view and deep-learning approach for quantifying urban perception, providing a methodological reference for linking visual features to public perception. The public Place Pulse 2.0 data cover 56 cities. The Chinese samples include Hong Kong and Macao but not Shenyang. Zhang et al. [
39] used multisource data to evaluate the effects of neighborhood color around primary schools on children’s mentalization of emotions, revealing differentiated psychological effects of basic color attributes on specific populations.
Taken together, the unresolved issue is no longer whether building color can be extracted automatically. Existing quantitative studies have not clearly distinguished and linked basic color attributes, overall street color organization, and perception assessment within the same observation units. The interpretive scope of cross-regional perception models also remains insufficiently defined when they are applied to local cities. These two gaps limit the translation of color measurements into verifiable diagnoses of street-segment types.
Three specific questions remain. First, street-view machine-vision studies have enabled city-scale extraction and spatial mapping of building color [
5,
6,
7,
11,
40]. However, basic color attributes are often mixed with, or discussed separately from, complexity, balance, continuity, and hierarchy clarity, which describe overall color relationships. The measurement levels and their associations therefore remain unclear. Second, previous studies have examined streetscape color and urban perception [
17,
18], but few have compared overall color-organization types with multiple perception dimensions in the same samples. It remains uncertain whether objective color differences correspond to perceptual differences with meaningful effect sizes. Local indicators of spatial association [
41] and theories of pedestrian-space organization [
42] support interpretations of street-segment differences and continuous-interface experience. However, they cannot replace direct tests of the relationships among CA, CO, and CP. Third, research on Chinese cities has addressed public-space color change, conservation and renewal of historic districts, and AI-assisted color planning [
43,
44,
45]. City-scale street-view studies have also emphasized road-data completeness [
46]. However, cross-city models such as Place Pulse [
38] may face differences in cultural geography, built environment, and training distribution when applied to Shenyang. Without local resident validation, their outputs should be limited to relative indicators within the study sample. Accordingly, this study asks how a clearly layered CAOP framework can be established to test associations among CA, CO, and model-inferred perception, together with their interpretive boundaries, in street-view samples from central Shenyang.
To answer these questions, we propose the Color Attribute–Organization–Perception (CAOP) framework, with three measurement layers: basic building color attributes (CA), objective color organization (CO), and public-perception evaluation (CP). The contributions and their boundaries are threefold. Conceptually, the framework distinguishes pixel-level color attributes, street-level overall color organization, and image-level model-inferred perception as related but non-interchangeable measurement layers. It tests associations among these layers without presuming a causal transmission mechanism. Methodologically, CA and CO indicators are calculated consistently for 38,274 valid street-view samples. Correlation analysis, K-means clustering, and Mann–Whitney U tests are combined with cluster-selection criteria, effect sizes, and stability measures. This design jointly evaluates overall color-type identification and corresponding differences in perception scores. Empirically, the study identifies major building-color organization patterns in street-view samples from central Shenyang. Overall color types and model-inferred perception scores provide a preliminary diagnosis of candidate street segments. Specific renewal measures still require field verification and local public evaluation.
2. Materials and Methods
2.1. Study Area and Data
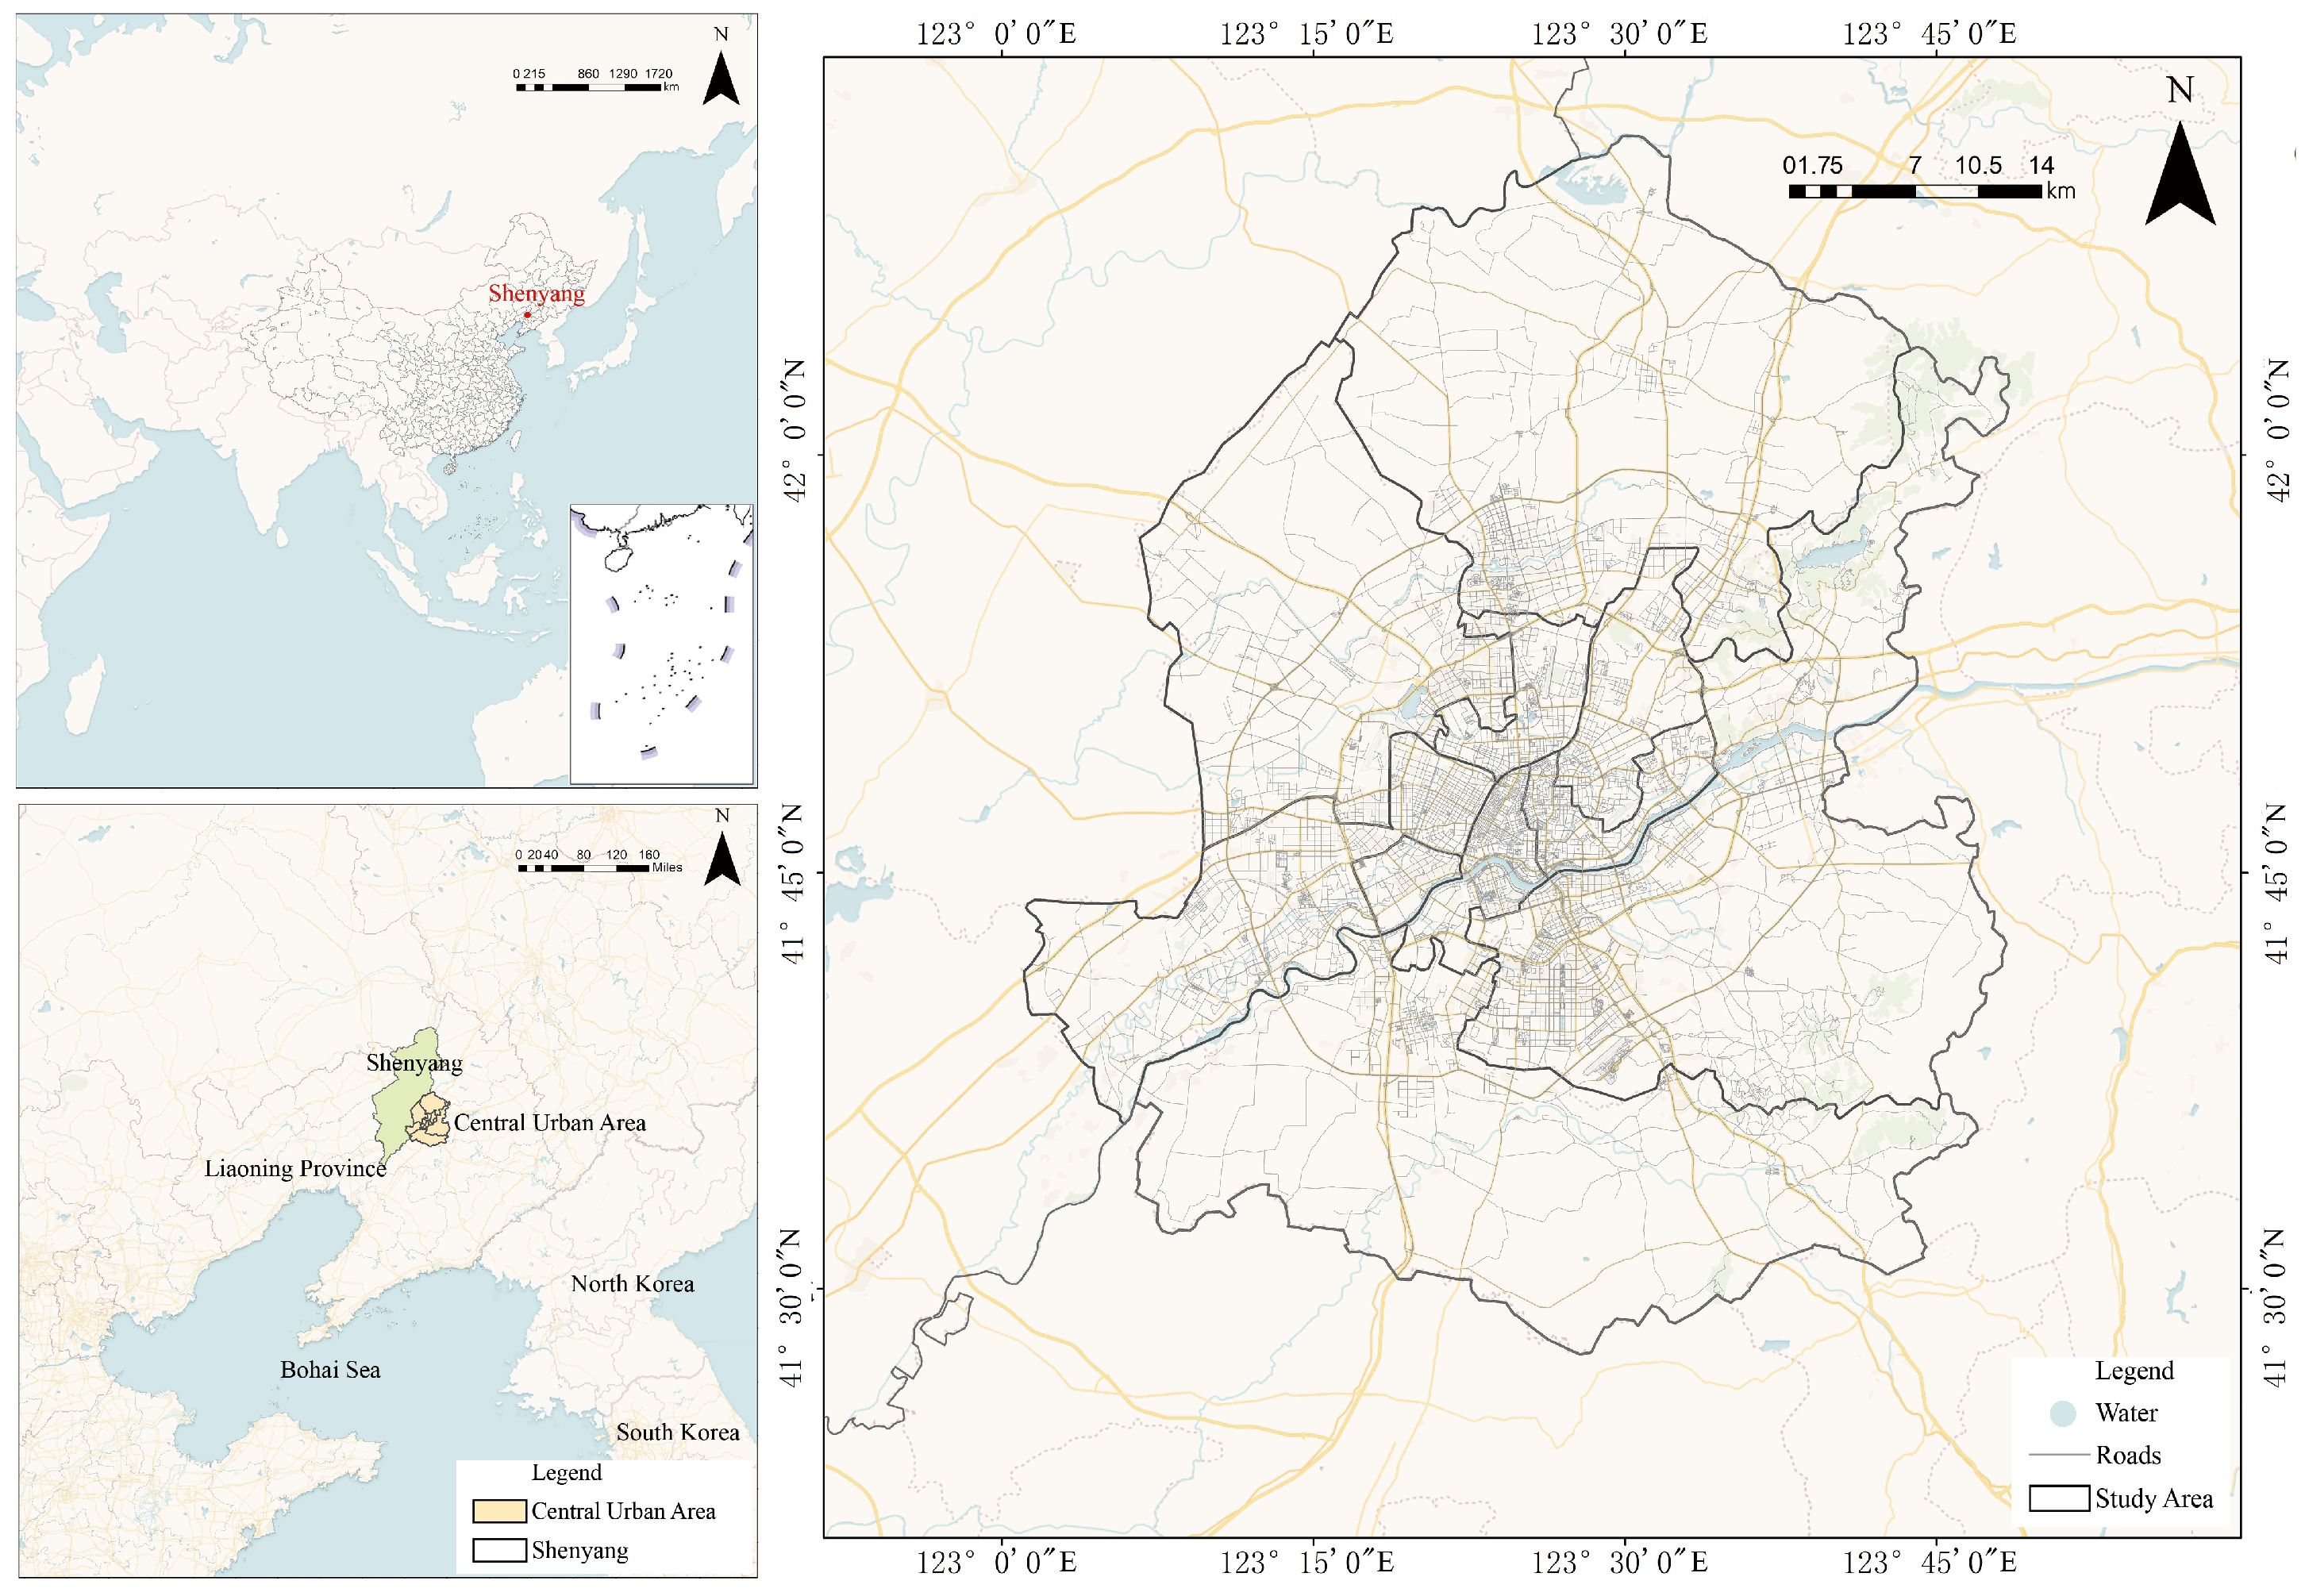
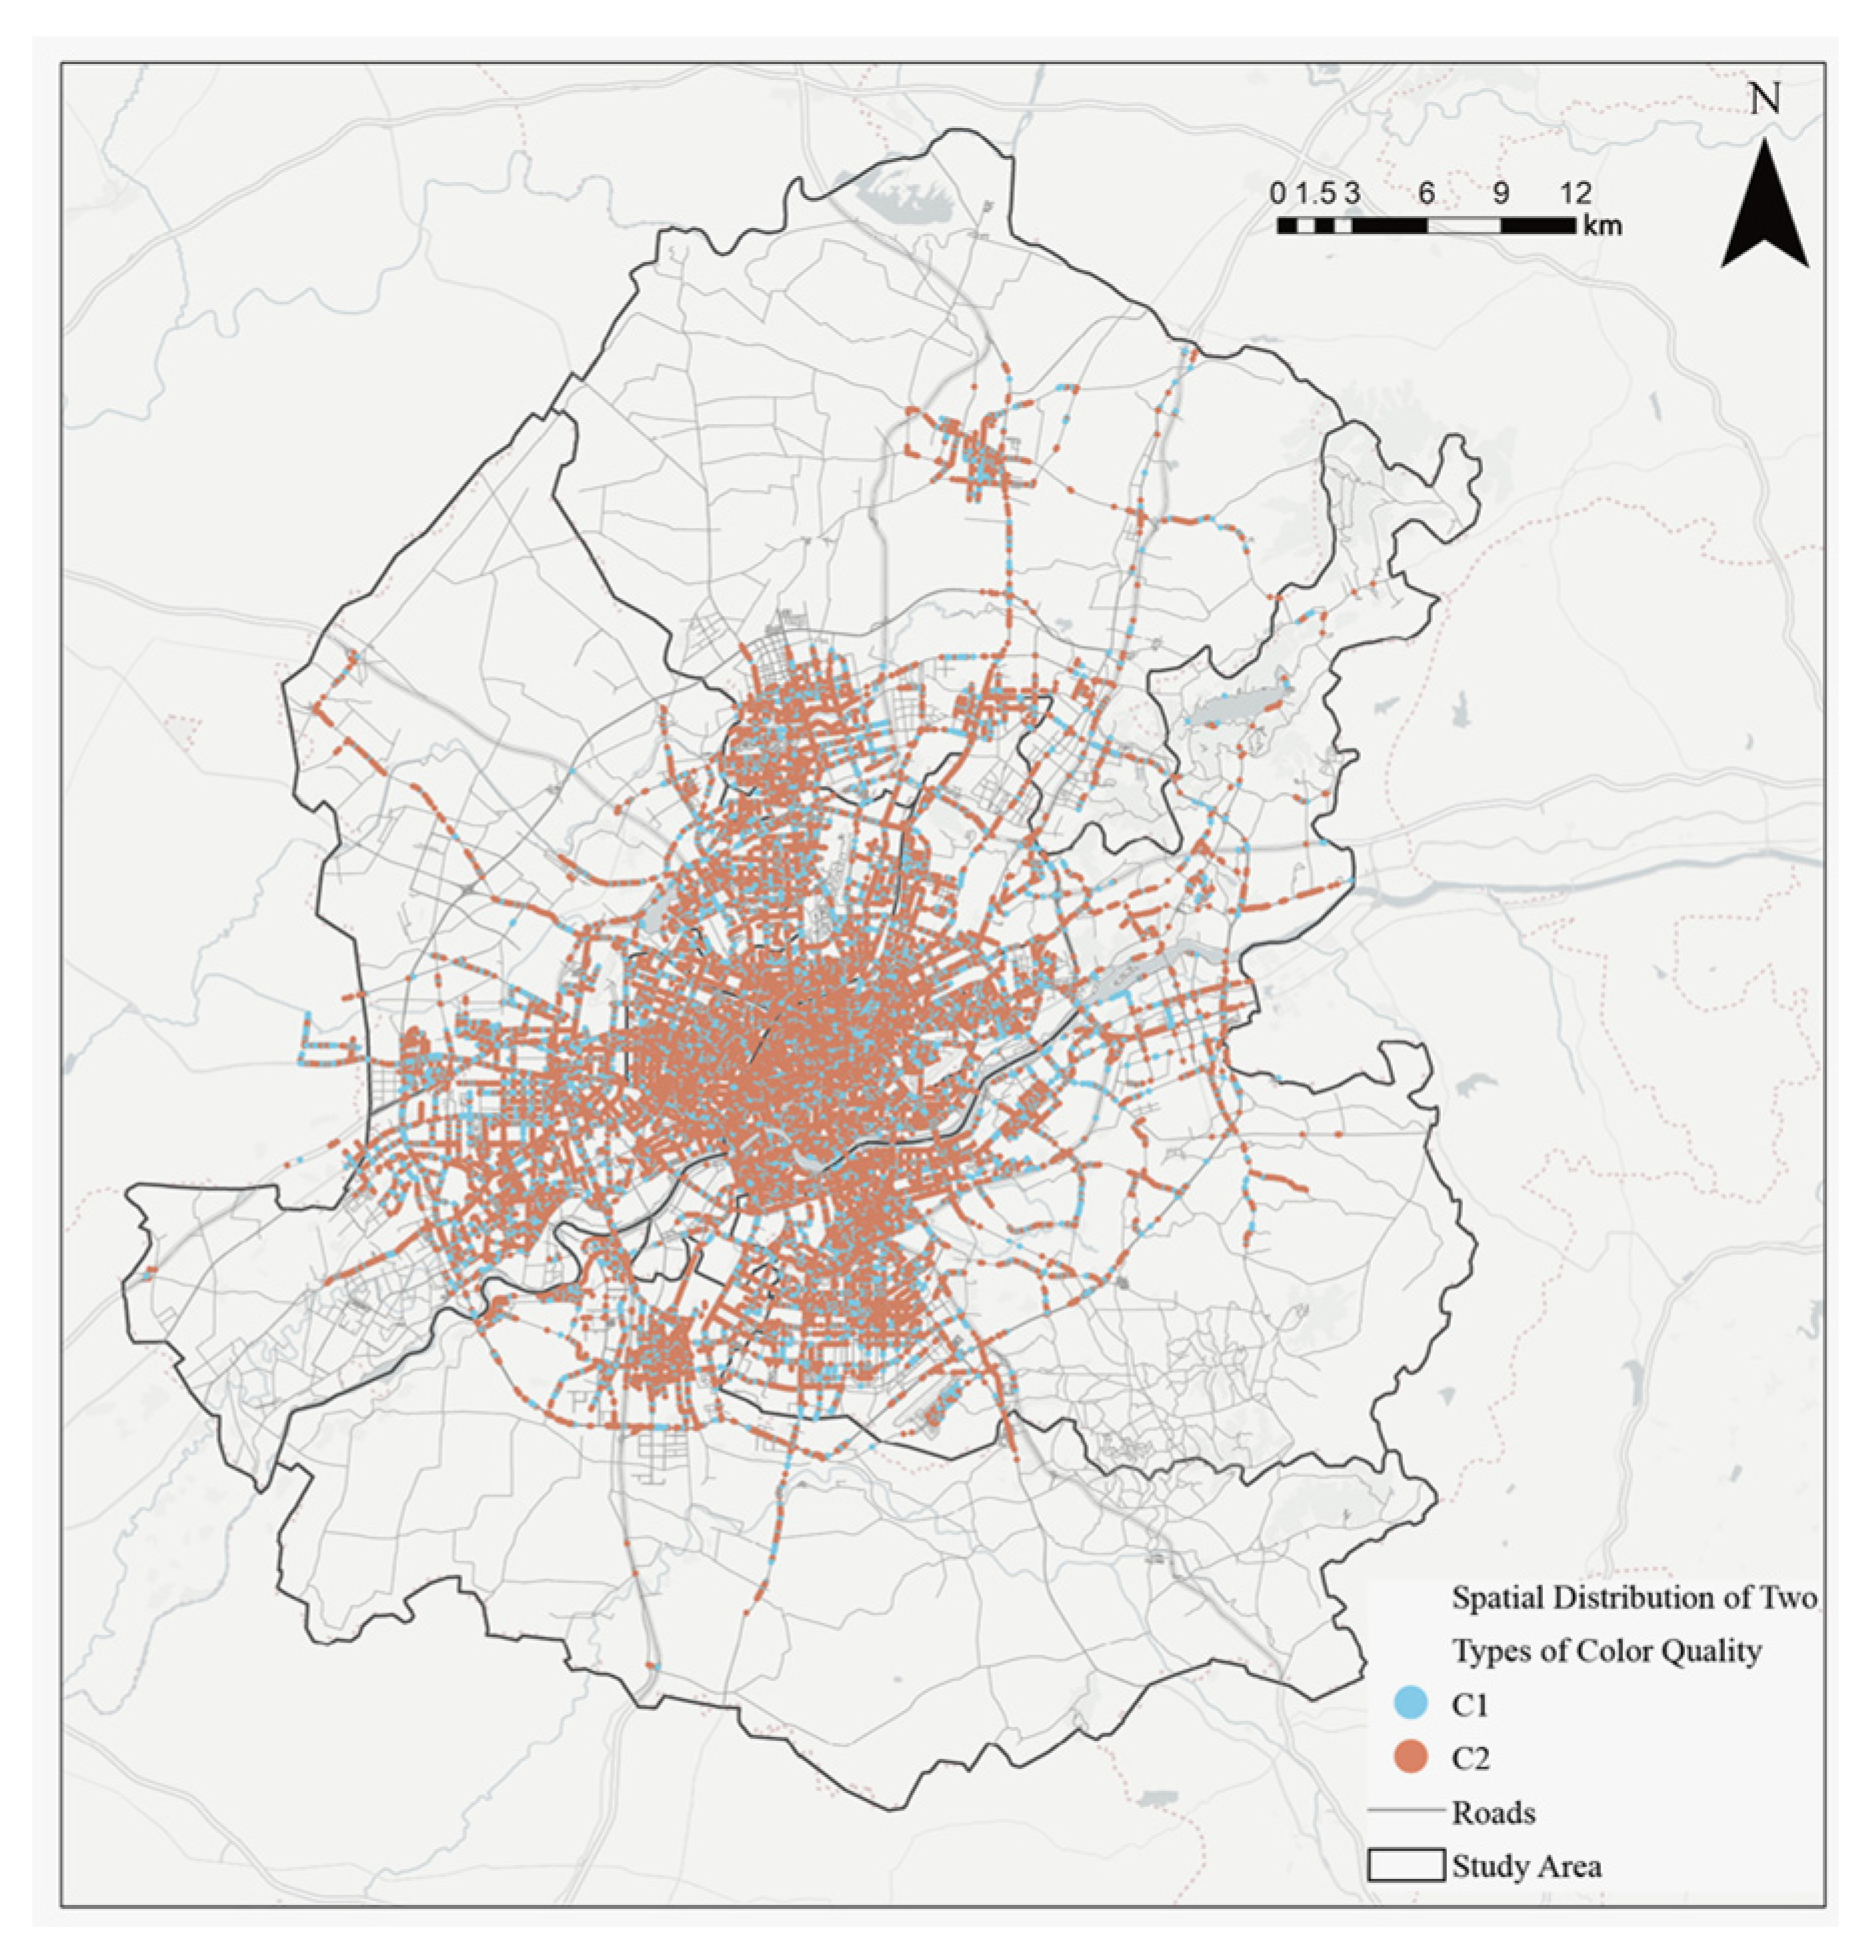
The Central Urban Area of Shenyang shown in
Figure 1 was selected as the study area. The upper-left panel locates Shenyang in Northeast China, and the lower-left panel shows its position within Liaoning Province and the boundary of the Central Urban Area. The main panel presents the study-area boundary and road network. Street-view samples were obtained only from connected roads with available Baidu Street View coverage within this boundary. They do not cover the entire administrative territory of Shenyang. The sample includes the high-density urban core, traditional industrial and residential districts, and peripheral expansion areas. Shenyang is an important central city in Northeast China. Its urban space has developed through several stages, including the formation of a traditional industrial city, old-city renewal, and peripheral new-district expansion. The resulting built environment contains historic neighborhoods, danwei communities, industrial-heritage areas, traditional commercial districts, and modern residential areas. Differences in building materials, façade forms, and color use across construction periods provide a rich sample for examining spatial differentiation in urban building color and perception assessment.
The dataset comprised street-view images, image coordinates, and model-inferred public-perception scores. Street-view images were collected from Baidu Street View in March 2026. A sampling point was established every 50 m along the road network within the study area, yielding 56,520 panoramic street-view images. Road-group identifiers, longitude, latitude, and capture time were recorded. Data acquisition applied consistent seasonal and weather criteria to the included images, followed by uniform color correction of all retained images.
To obtain valid building-color information, we used the SegFormer semantic-segmentation model to identify building pixels and generate segmentation images and lossless binary masks. RGB pixels within the masks were then extracted and converted to the CIELAB and CIELCh color spaces. For quality control, images in which no buildings were identified were labeled as having no buildings, and images containing fewer than 100 building pixels were labeled as low-building-pixel samples. Missing values were retained when color indicators could not be fully calculated. After quality screening and a completeness check of the 14 objective color indicators, 38,274 image records entered the clustering analysis.
The public-perception data comprised six scores inferred by a Place Pulse 2.0-derived model: wealthy, beautiful, boring, depressing, lively, and safety. No survey of Shenyang residents was used for local retraining, calibration, or external validation. These scores were therefore used only for relative comparisons within the study sample and do not represent direct evaluations by Shenyang residents. The resulting integrated database contained longitude and latitude, building-pixel count, building-area proportion, 14 objective color indicators, and six public-perception indicators.
2.2. Research Framework
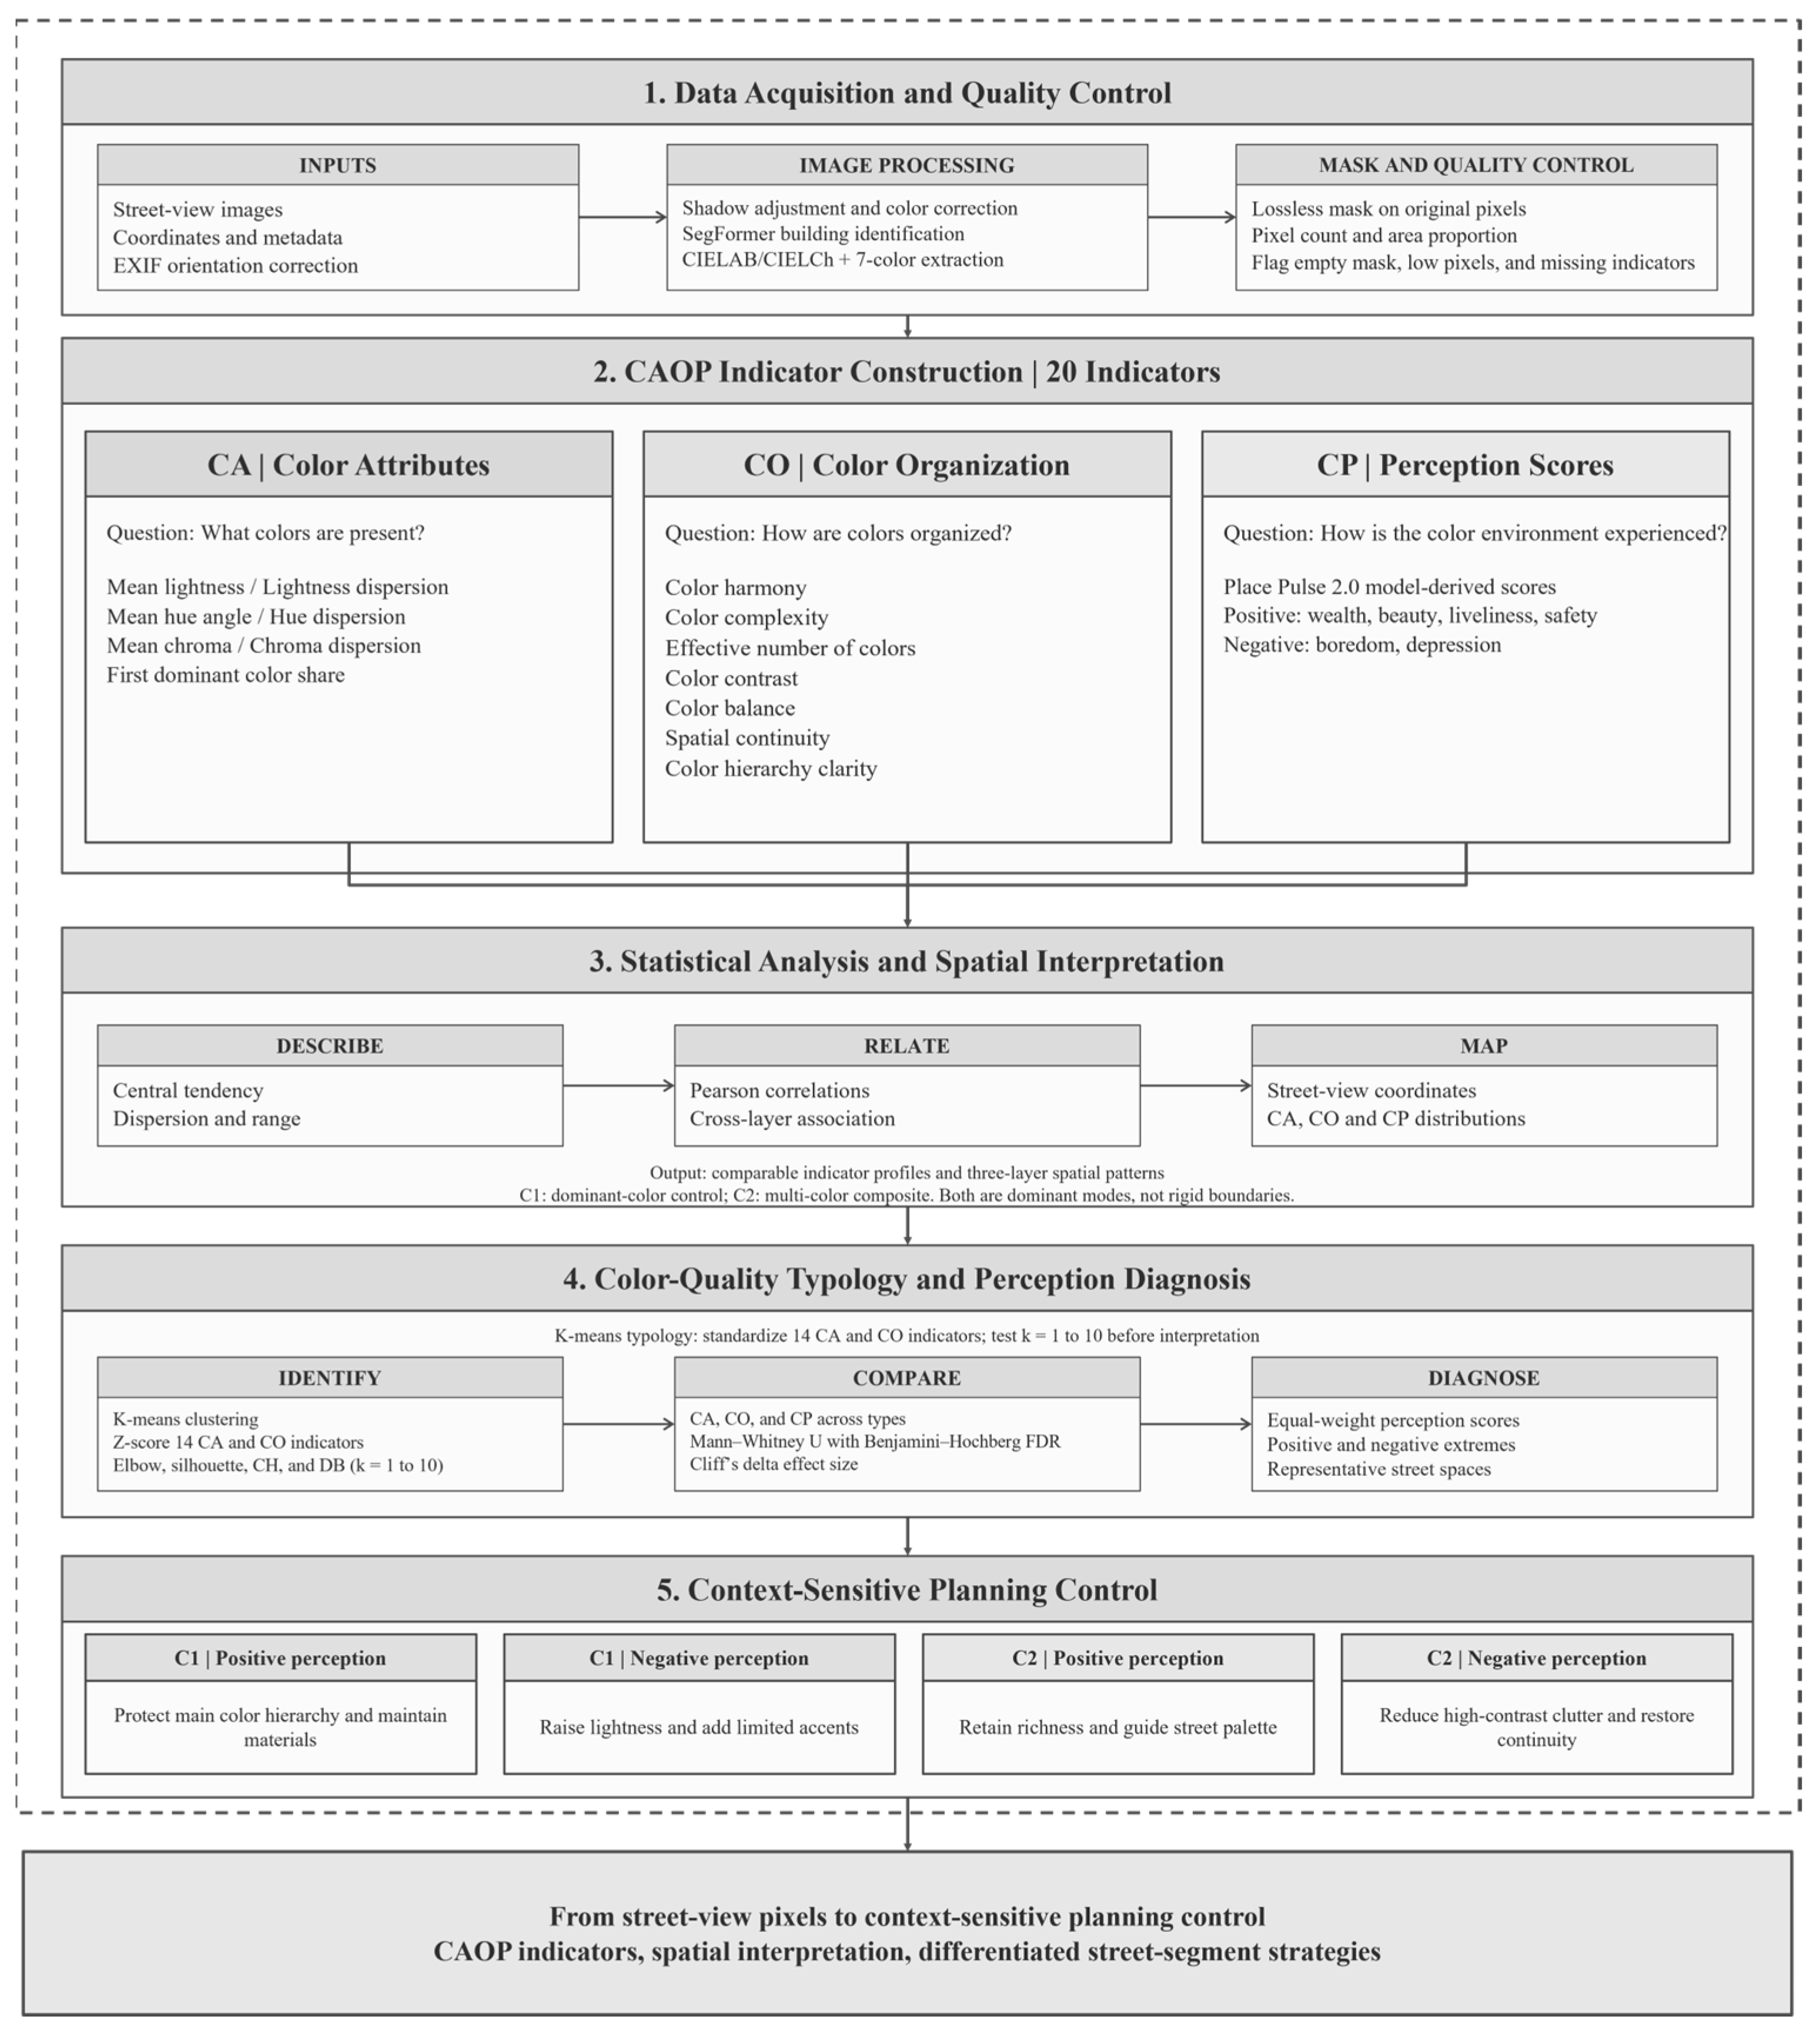
We developed a CAOP research framework comprising basic building color attributes, objective color organization, and public-perception evaluation, with the perception layer represented by model-inferred scores. The framework follows the technical pathway of data acquisition, building identification, indicator measurement, spatial analysis, typology identification, and classification control. It thereby translates street-view pixel information into progressively refined urban color-planning strategies (
Figure 2).
The first stage involved data acquisition and preprocessing. Street-view images were organized, shadow-adjusted, and color-corrected. The SegFormer model was then used to identify building classes, generate façade masks, and calculate building-pixel counts and building-area proportions. To ensure stable color measurement, all indicators were calculated from the building pixels corresponding to the lossless masks in the original images. Empty masks, low-building-pixel samples, and samples with missing indicators were recorded as separate quality categories.
The second stage involved constructing the three CAOP indicator layers. The CA layer describes what colors are present in buildings and includes seven indicators: mean lightness, lightness dispersion, mean hue angle, hue dispersion, mean chroma, chroma dispersion, and dominant color share. The CO layer describes how different colors are combined and organized and includes seven indicators: color harmony, color complexity, effective number of colors, color contrast, color balance, spatial continuity, and color hierarchy clarity. The CP layer represents six public-perception dimensions using Place Pulse model scores: perceived wealth, perceived beauty, perceived boredom, perceived depression, perceived liveliness, and perceived safety. The 20 indicators correspond to machine-recognized attributes, visual organization, and model-inferred perception, linking basic color information to urban spatial perception.
The third stage involved statistical analysis and spatial interpretation. Descriptive statistics were first used to characterize the central tendency, dispersion, and range of the 20 indicators, and Pearson correlation analysis was used to diagnose relationships among them. The indicators were then mapped to street-view coordinates to compare the spatial distributions of the CA, CO, and CP layers. K-means clustering was subsequently applied to the 14 standardized CA and CO indicators. The number of clusters was determined jointly using the elbow method, silhouette coefficient, Calinski–Harabasz index, and Davies–Bouldin index. Finally, differences across the three layers were compared among color types, and representative spaces were identified from positive and negative perception extremes. These results informed candidate strategies for protecting, optimizing, remediating, and guiding different color-quality and perception conditions.
2.3. Methods
Street-view images were used as the basic observation units. We constructed a CAOP framework comprising basic building color attributes (CA), objective color organization (CO), and public-perception evaluation (CP). The method chain consisted of façade semantic segmentation, color-space conversion, dominant-color extraction, calculation of the three indicator layers, linkage of perception scores, and cluster validation. It converted pixel-level color information into comparable image-level and continuous street-level variables. The CP layer describes associations between Place Pulse model outputs and objective color indicators; it does not replace a survey of Shenyang residents.
2.3.1. Building Façade Extraction and Color Preprocessing
We first performed semantic segmentation using a SegFormer model with ADE20K-trained weights [
47,
48]. The model was not retrained or fine-tuned using Shenyang samples. After EXIF orientation correction, the original images were converted to RGB and input to the model at 1024 × 512 pixels. ImageNet means (0.485, 0.456, 0.406) and standard deviations (0.229, 0.224, 0.225) were used for normalization. The model output was restored to the original resolution by bilinear interpolation, and the class with the maximum probability was selected. According to the model configuration, only pixels assigned to class 1, building, were labeled as building pixels. Adjacent classes such as wall, house, skyscraper, and windowpane were not incorporated into the mask. Evaluation against locally annotated samples yielded a building-class IoU of 0.75, an F1-score of 0.82, and an overall mIoU of 0.71. Comparison of color parameters between manually annotated and model-segmented regions showed an acceptable mean color difference overall. However, local segmentation errors may still propagate to the color indicators. The binary building mask was denoted by M, and the building-pixel count and its proportion were defined as follows:
where H and W are the height and width of the original image, respectively; M equals 1 for a building pixel and 0 otherwise.
Images with zero building pixels were labeled as having no buildings, and their color indicators were left blank. Images with 1–99 building pixels were labeled as low-building-pixel samples; their original calculated values were retained but excluded from the main clustering analysis. Color calculations reread the original image and the lossless mask to avoid bias from background pixels in black-background façade images and from secondary compression.
Street-view images were processed in standard sRGB. Each channel was first divided by 255 and subjected to inverse gamma correction:
The resulting linear RGB values were then converted to XYZ under the D65 white point:
After normalization by the standard white point (0.95047, 1.00000, 1.08883), CIELAB and CIELCh values were calculated:
Seven dominant colors were extracted from the Lab samples of each image. Deterministic initialization was used: samples were first shuffled, initial centers were selected at equal intervals, and 10 Lloyd updates were performed. The center of the k-th dominant color was represented by (L, a, b), and its area weight was defined as the proportion of pixels assigned to that cluster among all sampled pixels:
Clusters with area weights of at least 0.01 were defined as valid colors and were renormalized within the valid set to obtain q for the calculation of harmony, complexity, effective number of colors, and contrast. Mean hue and hue dispersion were calculated only from dominant colors with chroma of at least 5 to reduce errors caused by unstable hue angles near neutral colors.
2.3.2. CAOP Indicator Construction and Calculation
The CAOP framework defines 20 indicators according to the logic of what colors are present, how colors are organized, and what perception tendencies the model infers. The CA layer contains seven basic color attributes, the CO layer contains seven objective color-organization indicators, and the CP layer contains six scores from a Place Pulse-derived model.
Table 1 provides the operational definitions of all indicators.
(1) Effective Hue Weights and the Color-Palette Dictionary
For dominant colors with chroma of at least 5, the original area weights were renormalized within the effective-hue set, and the weighted horizontal and vertical components on the unit circle were calculated. This yielded the circular mean and the resultant-vector length and prevented 359° and 1° from being incorrectly treated as 358° apart:
Balance and continuity require comparisons of color distributions across different spatial units. To make the probability vectors comparable in dimension, we constructed a fixed 180-bin Lab color-palette dictionary, with lightness divided into five intervals and a and b each divided into six intervals. Samples from each image and from its left and right halves were mapped to the common palette and normalized as probability vectors. Balance was left blank when either side contained fewer than 20 samples.
(2) Harmony, Contrast, and Spatial Organization
Objective color harmony was calculated using the Ou–Luo two-color harmony model [
22]. For each pair of valid dominant colors, the composite chroma difference, lightness sum, lightness difference, and hue effect were first calculated and then weighted by the normalized product of the two dominant colors’ area weights. Following the experimental modeling of two- and three-color combinations by Szabó et al. [
49], the Ou–Luo two-color harmony value was averaged pairwise according to dominant-color area weights and extended to multicolor combinations. Color complexity was normalized according to Shannon entropy theory [
50], color contrast was calculated using the CIEDE2000 color-difference formula [
51], spatial continuity followed the street-view color-similarity measure proposed by Jiang et al. [
21], and color balance was used to quantify the difference between the left and right façade palettes based on Jensen–Shannon divergence [
52]. The two-color harmony value was defined as follows:
Dominant-color contrast was calculated using the CIEDE2000 color difference, with all parametric factors set to 1. The implementation followed the standard algorithm reported by Sharma, Wu, and Dalal and was checked against published test color pairs. The calculated value, 2.04245968, agreed with the standard value of 2.0425. The core form was:
Both balance and continuity were based on Jensen–Shannon divergence. If M is the mean of two probability distributions, then:
Balance compared the left and right color palettes of building pixels within the same image, whereas continuity compared adjacent street-view images whose sequence numbers differed by one within the same road group. For an individual image, continuity was calculated as the mean similarity of the available preceding and following neighbors. No adjacency was established across roads, when sequence numbers were missing, when the building mask was empty, or when no valid neighboring pair was available.
(3) Public-Perception Evaluation and Composite Orientation
The wealthy, beautiful, boring, depressing, lively, and safety scores in the CP layer were inferred from Shenyang street-view images using a Place Pulse 2.0-derived model [
38]. The public Place Pulse 2.0 data cover 56 cities, including Hong Kong and Macao in China but not Shenyang. The local application adapted the workflow rather than the model parameters. First, each street-view image that passed uniform quality control and color correction was entered into the derived model to obtain six scores. Second, the scores were matched one-to-one with the CA and CO indicators by image filename. Complete-case screening and outlier checks then retained 38,274 valid samples. Third, the continuous distributions and spatial variation of the six scores were examined. Mann–Whitney U tests and Cliff’s δ were used to evaluate between-group differences in the two overall color patterns. These procedures established whether the model outputs could be integrated consistently with the Shenyang street-view sample for within-sample ranking, spatial representation, and between-group comparison. Because no survey of Shenyang residents was used for local retraining, calibration, or external validation, this workflow does not validate local resident perception. The six scores are not interpreted as direct evaluations by Shenyang residents. In this paper, “public perception” is shorthand for these six model-inferred dimensions. Perceived wealth, beauty, liveliness, and safety were treated as positive indicators, whereas perceived boredom and depression were treated as negative indicators. Representative spaces were selected using the following equally weighted composite score:
2.3.3. Data Integration, Standardization, and Cluster Validation
Building pixels, building proportion, the 14 CA and CO indicators, and the six CP indicators were first merged into an image-level database. The full dataset contained 56,520 rows, including 47,065 normal-quality samples with at least 100 building pixels. Requiring all 14 CA and CO indicators to be non-missing yielded 38,274 clustering samples. The remaining 18,246 rows comprised 8095 images with no buildings, 1360 low-building-pixel images, and 8791 images with incomplete indicators. Noncomputable values were retained as missing. K-means clustering was then applied to the 14 standardized CA and CO indicators [
53], and the number of clusters was determined jointly using the elbow method, silhouette coefficient [
54], Calinski–Harabasz index [
55], and Davies–Bouldin index [
56]. Differences across the three indicator layers were subsequently compared among color types, and representative spaces were identified from positive and negative perception extremes to formulate differentiated strategies for protection, optimization, remediation, and guidance. K-means used only the 14 CA and CO indicators. Because the indicators had different scales, each was first Z-standardized across the 38,274 complete samples:
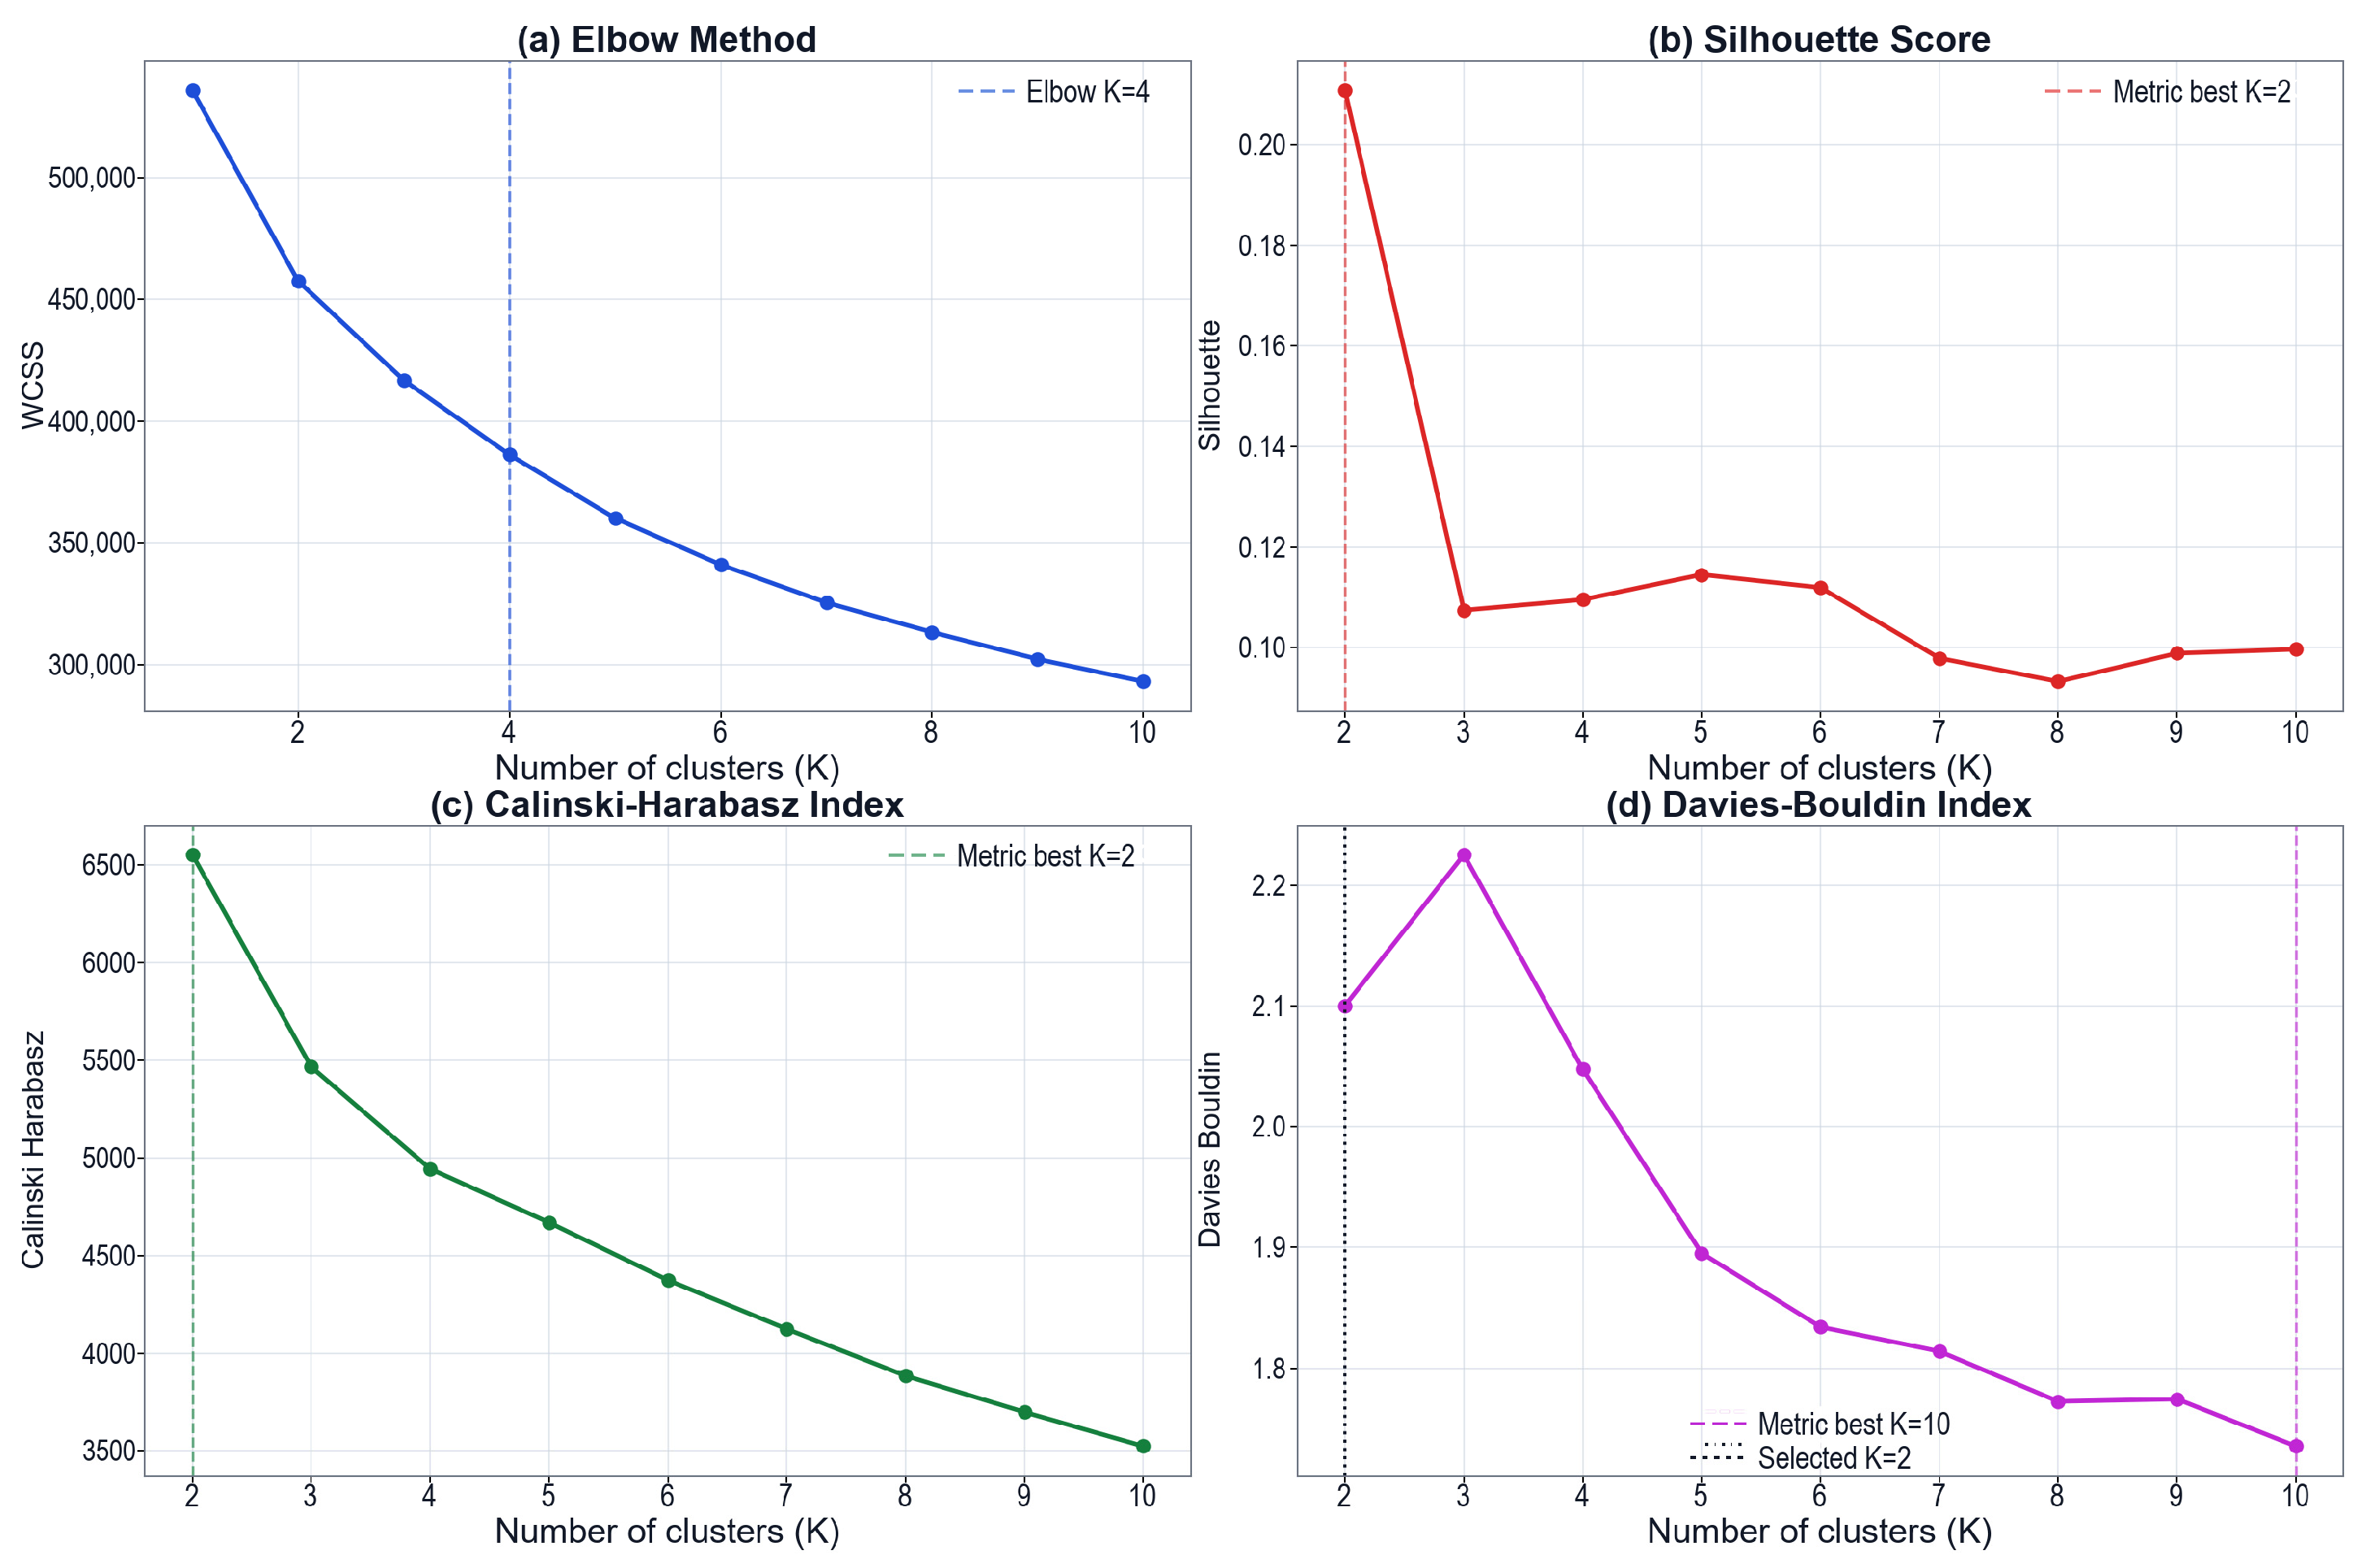
The candidate number of clusters ranged from 1 to 10. Each candidate model used random seed 42, 20 initializations, and a maximum of 500 iterations; the final model used 50 initializations. The evaluation criteria did not indicate the same solution. The elbow method indicated approximately K = 4, while the silhouette coefficient and Calinski–Harabasz index were optimal at K = 2. The Davies–Bouldin index generally decreased as K increased and reached its minimum at K = 10. Equal-weight rank aggregation produced a tie between K = 2 and K = 5. Following the rule that favors the more parsimonious model in a tie, and considering the mean ARI of 0.944 ± 0.026 across 50 subsample tests, we used K = 2 as a broad typology. This choice summarizes the main differences in the sample; it does not imply that K = 2 was uniquely optimal under every statistical criterion. The within-cluster sum of squares and the silhouette coefficient for an individual sample were defined as follows:
3. Results
3.1. Data Overview and Indicator Statistics
We conducted a statistical overview of street-view data for which façade semantic segmentation, color-indicator calculation, and Place Pulse model-score matching had been completed. The compiled dataset contained 56,520 records. After quality labeling, outlier checks, and complete-case screening, 38,274 valid samples remained. These samples were defined consistently with the subsequent clustering analysis, and the effective sample size for each of the 20 indicators was 38,274.
Table 2 reports the mean, standard deviation, minimum, 25th percentile, median, 75th percentile, and maximum to characterize each indicator’s central tendency and dispersion.
In the machine-vision information layer, mean façade lightness was 44.864, with a standard deviation of 13.765; the middle 50% of samples ranged from 35.342 to 53.400, indicating substantial variation in the lightness of Shenyang’s façades. The mean hue angle was 145.789°, with a standard deviation of 102.209° and a wide interquartile range, indicating considerable diversity in hue composition. Mean chroma was 5.939, showing an overall tendency toward low-chroma colors. The mean dominant color share was 0.249 and the median was 0.238, indicating that most façades were not absolutely dominated by a single color but instead contained composite color structures.
In the objective color-feature layer, mean color complexity was 0.940 and the mean effective number of colors was 6.226, indicating that most façades contained relatively rich color compositions. Mean color contrast was 25.354, suggesting appreciable visual differences among dominant colors. The medians of color balance and spatial continuity were 0.884 and 0.845, respectively, indicating generally high levels. Color hierarchy clarity had a mean of only 0.054, and its mean exceeded its median, indicating a right-skewed distribution in which a small number of samples had pronounced dominant–secondary color contrasts.
In the public-perception layer, the Place Pulse model-inferred means for wealth, beauty, boredom, depression, liveliness, and safety were 38.242, 11.588, 57.167, 56.468, 30.481, and 34.811, respectively. Perceived beauty had a standard deviation of 11.407 and ranged from −22.238 to 54.040, showing substantial variation among model outputs. Perceived wealth and safety were more concentrated, whereas the mean values for boredom and depression were comparatively high. These results describe the distribution of model predictions, not a sample distribution of attitudes among Shenyang residents.
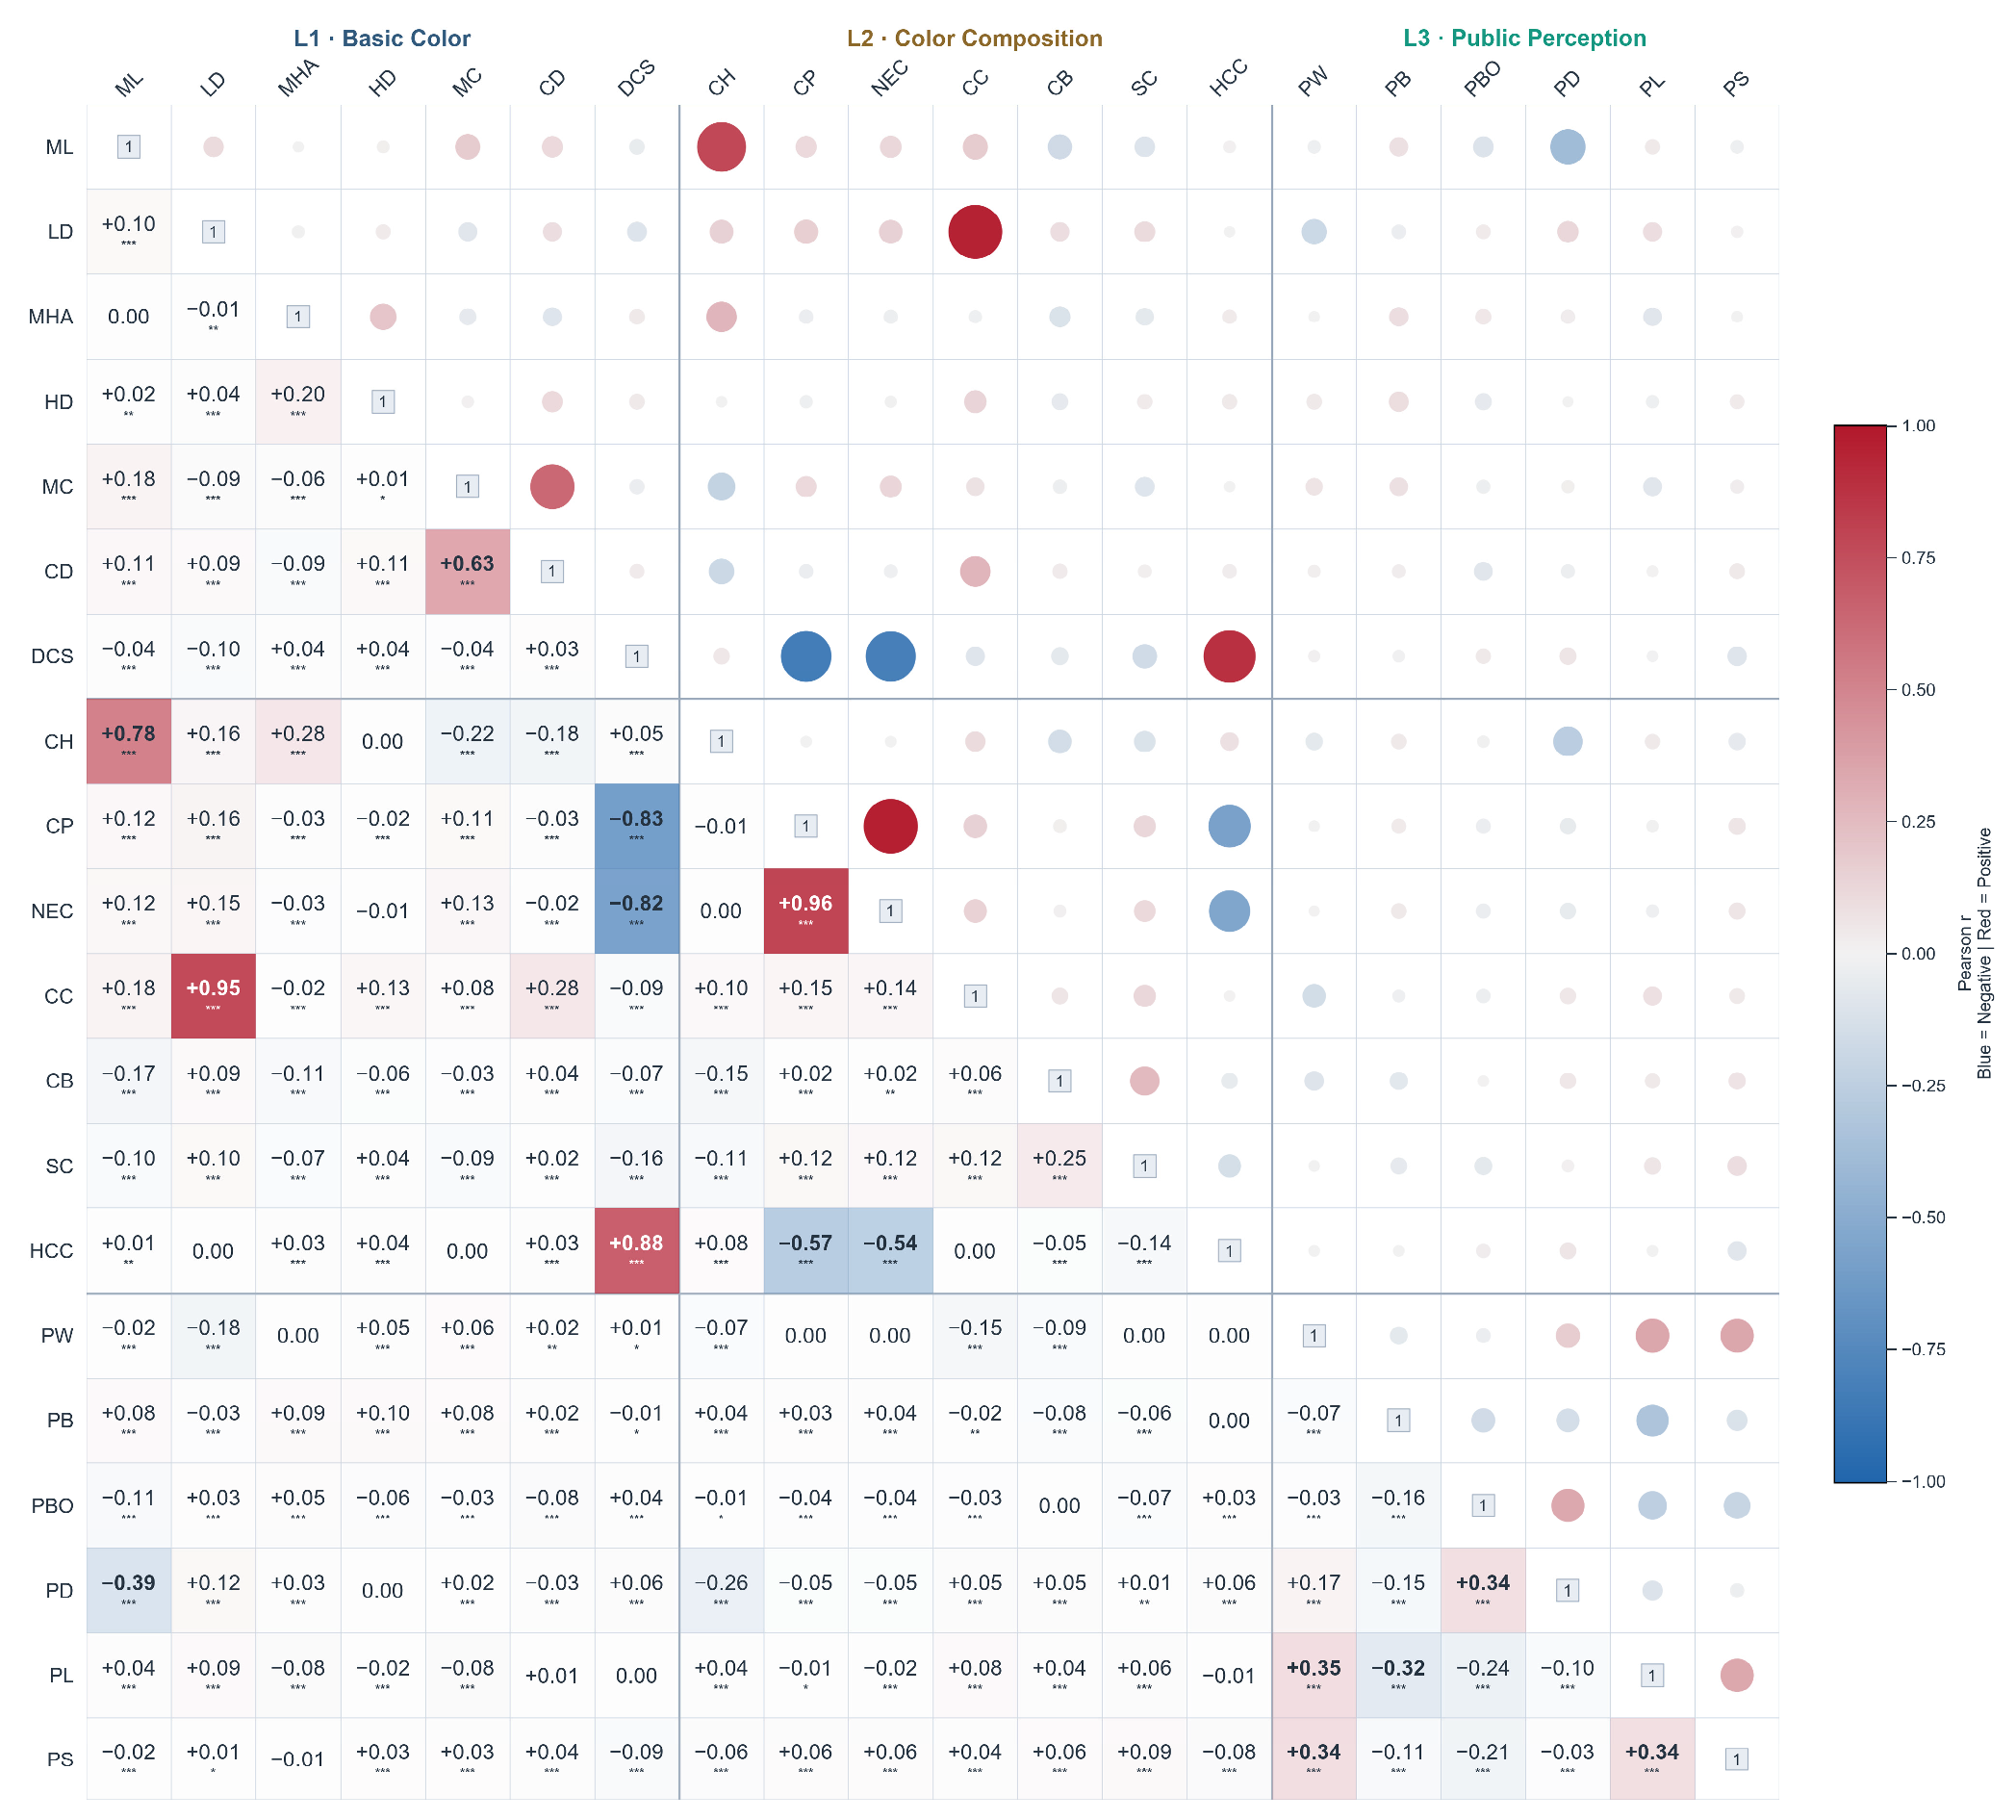
Pearson correlation analysis was conducted for the 20 indicators across the three layers (
Figure 3). In the upper triangle of the correlation matrix, circle size represents the absolute value of the correlation coefficient and color represents its direction; the lower triangle reports the coefficients and significance levels. The framework was informed by the hierarchical building-color-quality evaluation framework beyond dominant colors proposed by Guo et al. [
57], the deep-learning-based assessment of streetscape aesthetic and design quality proposed by Ma et al. [
58], the CEP–KASS framework for perception of urban street color environments proposed by Chen et al. [
59], and the eye-tracking-based synthesis of color-perception measurement methods and mechanisms proposed by Bortolotti et al. [
60].
Several strong structural relationships were observed between the machine-vision information layer and the objective color-feature layer. Color complexity had the strongest correlation with the effective number of colors (r = 0.961), indicating that an increase in the effective number of colors was usually accompanied by greater façade color complexity. Lightness dispersion was strongly and positively correlated with color contrast (r = 0.947), showing that light–dark variation was an important source of overall color contrast. Dominant color share was strongly positively correlated with color hierarchy clarity (r = 0.884) but strongly negatively correlated with color complexity and the effective number of colors (r = −0.834 and −0.817, respectively). Thus, a more concentrated dominant-color area was associated with clearer color hierarchy but lower overall color richness. Mean lightness was also positively correlated with color harmony (r = 0.777), and mean chroma was positively correlated with chroma dispersion (r = 0.631).
Correlations among the public-perception indicators were generally weak. Perceived wealth showed weak-to-moderate positive correlations with perceived liveliness and safety (r = 0.351 and 0.344, respectively). Perceived liveliness was positively correlated with safety (r = 0.343), and perceived boredom was positively correlated with depression (r = 0.337). The strongest relationship between objective color and model-inferred perception was the negative correlation between mean lightness and perceived depression (r = −0.387). This was followed by the negative correlation between color harmony and perceived depression (r = −0.261). Higher lightness and harmony were therefore associated with lower model-inferred depression scores, but these correlations do not establish causality.
3.2. Spatial Distribution of Building Colors in Shenyang
3.2.1. Basic Building Color Attributes (CA Layer)
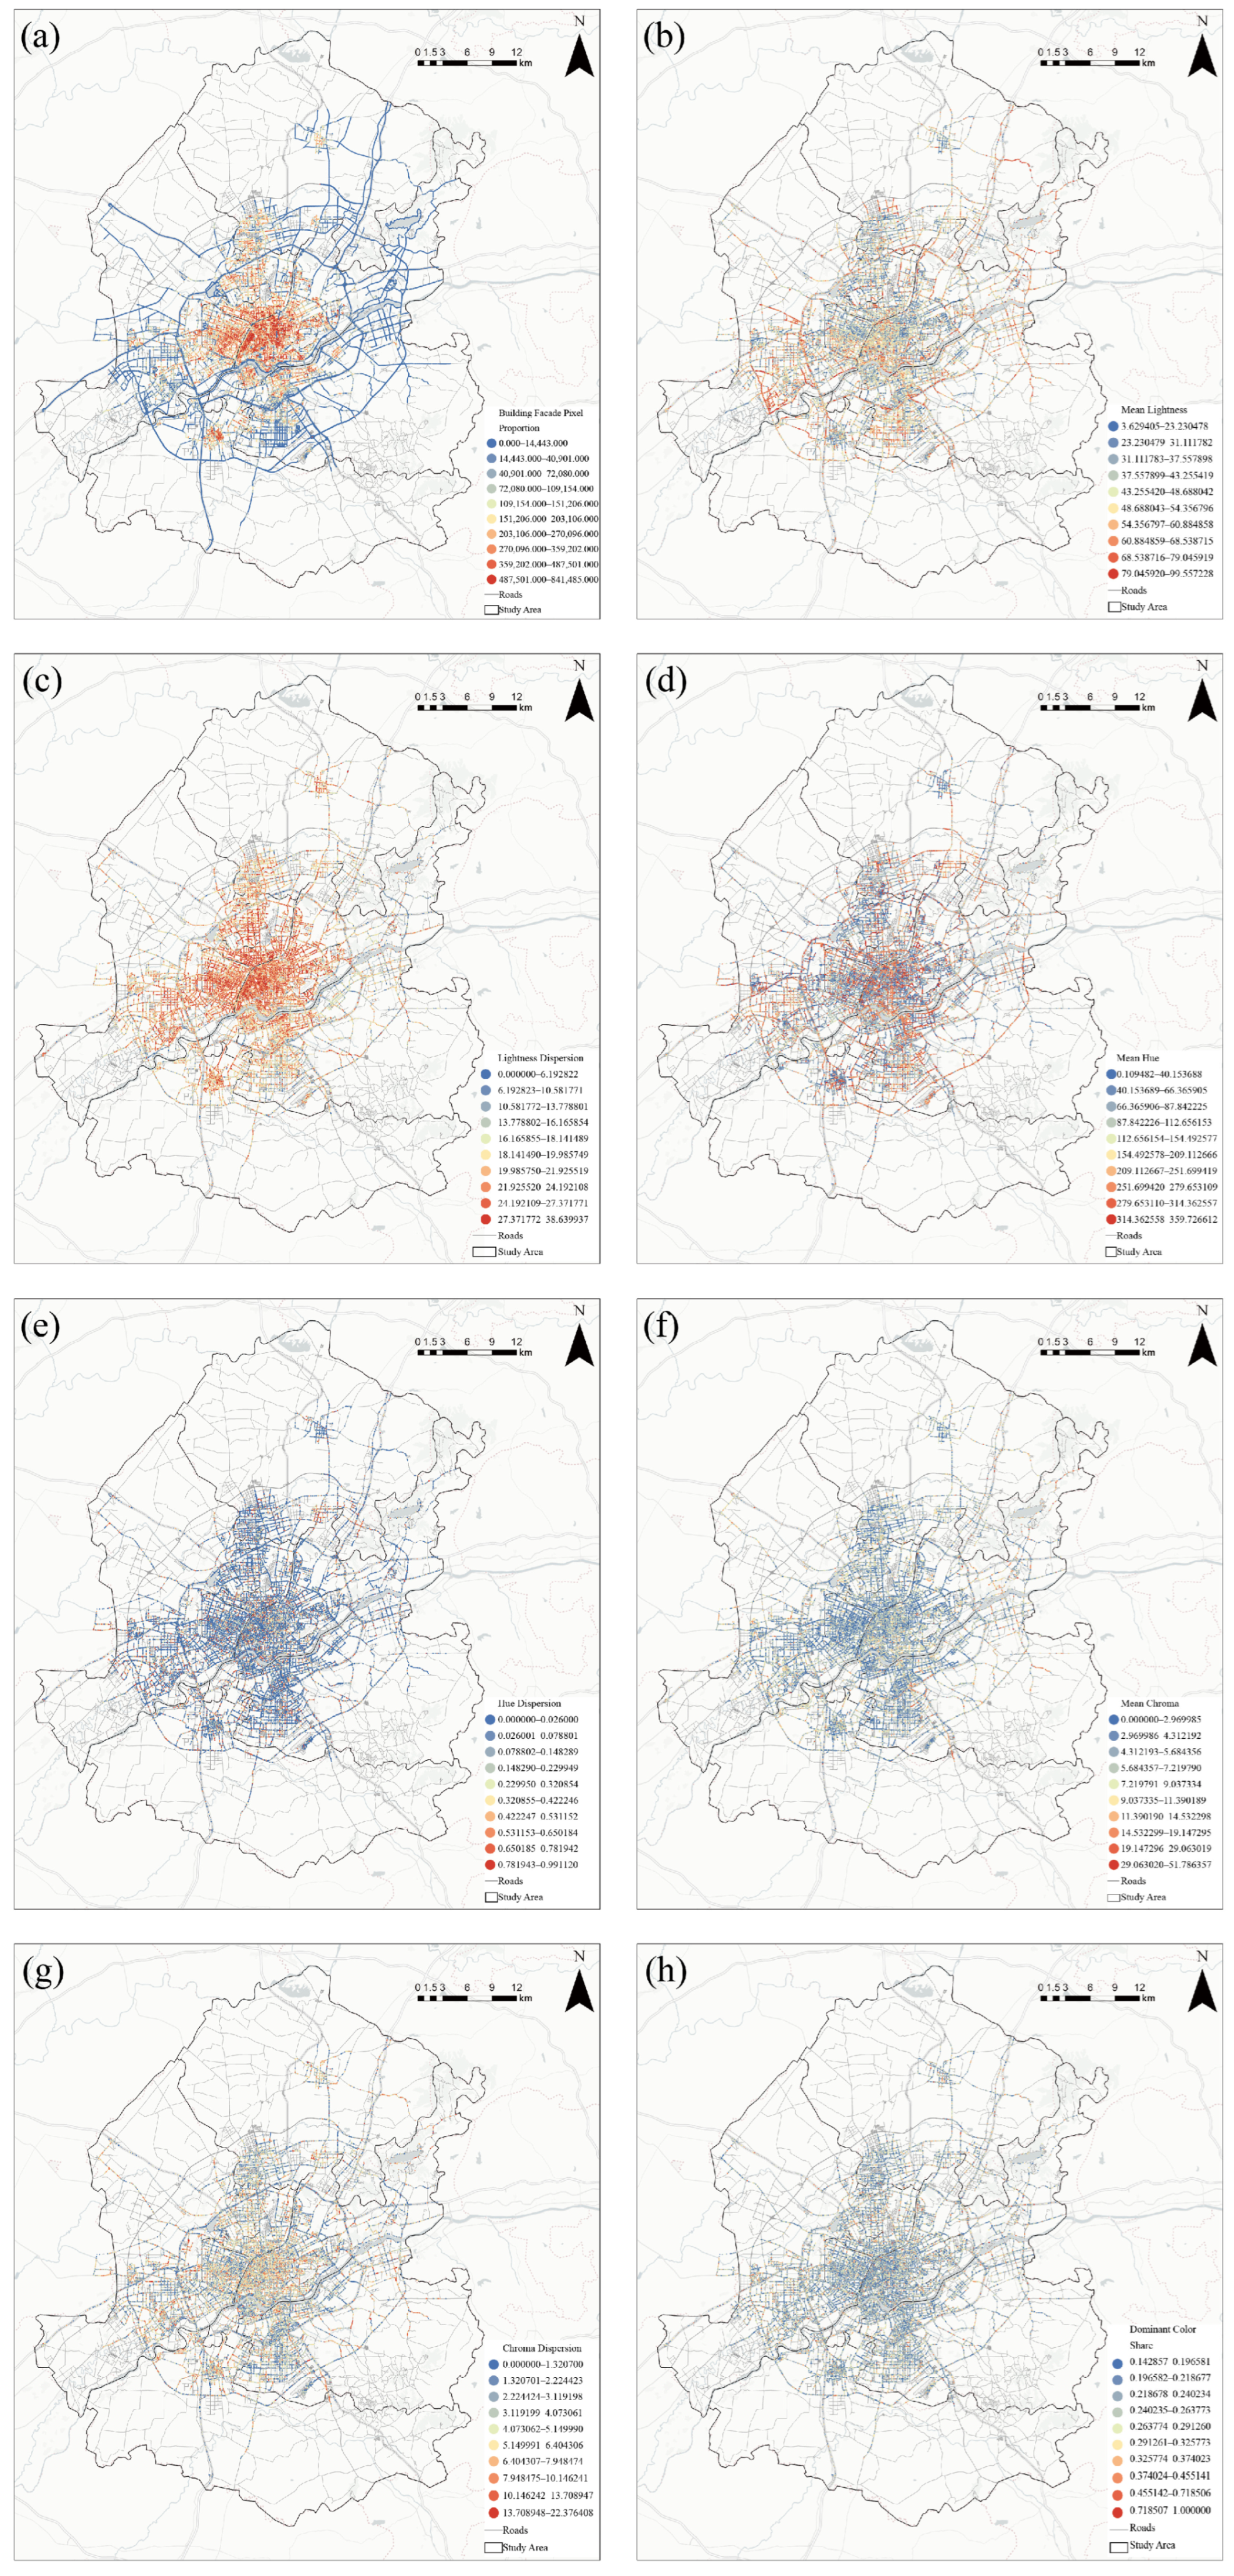
Building façade pixel proportion showed a clear center-clustered and peripheral-declining pattern (
Figure 4). High-value road segments were concentrated in the dense road network of the central urban area and extended outward along major transport corridors, indicating more continuous building interfaces and greater street enclosure in the center. Peripheral areas generally had low values, possibly because of larger road widths, building setbacks, open space, and increased vegetation. Mean lightness, by contrast, showed a strongly patchy pattern: high and low values were interspersed in the central area rather than forming a simple concentric gradient. Some peripheral new districts had relatively high lightness, possibly because of the use of light-colored coatings, stone, and glass curtain walls.
High values of lightness dispersion were concentrated in the central urban area and its peripheral transition zones and formed continuous patterns along some arterial roads. The overall tendency weakened from the center toward the periphery. This suggests that the central area had richer light–dark variation within and between building façades, possibly owing to commercial shop signs, glass reflections, building components, and the juxtaposition of old and new façades. Lightness variation was more gradual in peripheral areas, where building materials and construction periods may have been more homogeneous.
Mean hue angle formed a road network of alternating high and low values in the central urban area, with relatively weak spatial continuity, indicating clear differences in dominant hue among streets. Hue angle has a circular property in which 0° and 360° are adjacent; its high and low values therefore cannot be interpreted simply as an increase or decrease in an ordinary linear variable. Hue dispersion was generally low across the study area. Most roads were dominated by blue and blue-green hues, with scattered high values only at the edge of the central area and on some peripheral roads. This indicates that the hue composition of most façades was relatively concentrated rather than broadly mixed across many hues.
Mean chroma was generally low, with low-value road segments dominating both the central and peripheral areas. Shenyang’s façades were mainly composed of gray-white, gray, and low-chroma cool and warm colors, producing a generally subdued color character. Medium- and high-chroma road segments appeared mainly as point clusters or short corridors and may correspond to commercial nodes, public buildings, or streets that had undergone color renewal. Chroma dispersion was relatively high in the central area and in inner–outer transition zones, indicating that locally vivid colors were interspersed within low-chroma backgrounds and therefore produced stronger visual differences.
Dominant color share was generally at medium-to-low levels, with high values scattered along some peripheral roads and local central streets. This indicates that most façades were not absolutely controlled by a single color but were composed of several colors with similar areas. Overall, the basic color attributes of Shenyang showed a spatial pattern of dense central interfaces, pronounced light–dark variation, generally low chroma, and local diversity, reflecting the combined effects of construction period, building materials, street form, and the extent of façade renewal.
3.2.2. Objective Building Color Organization (CO Layer)
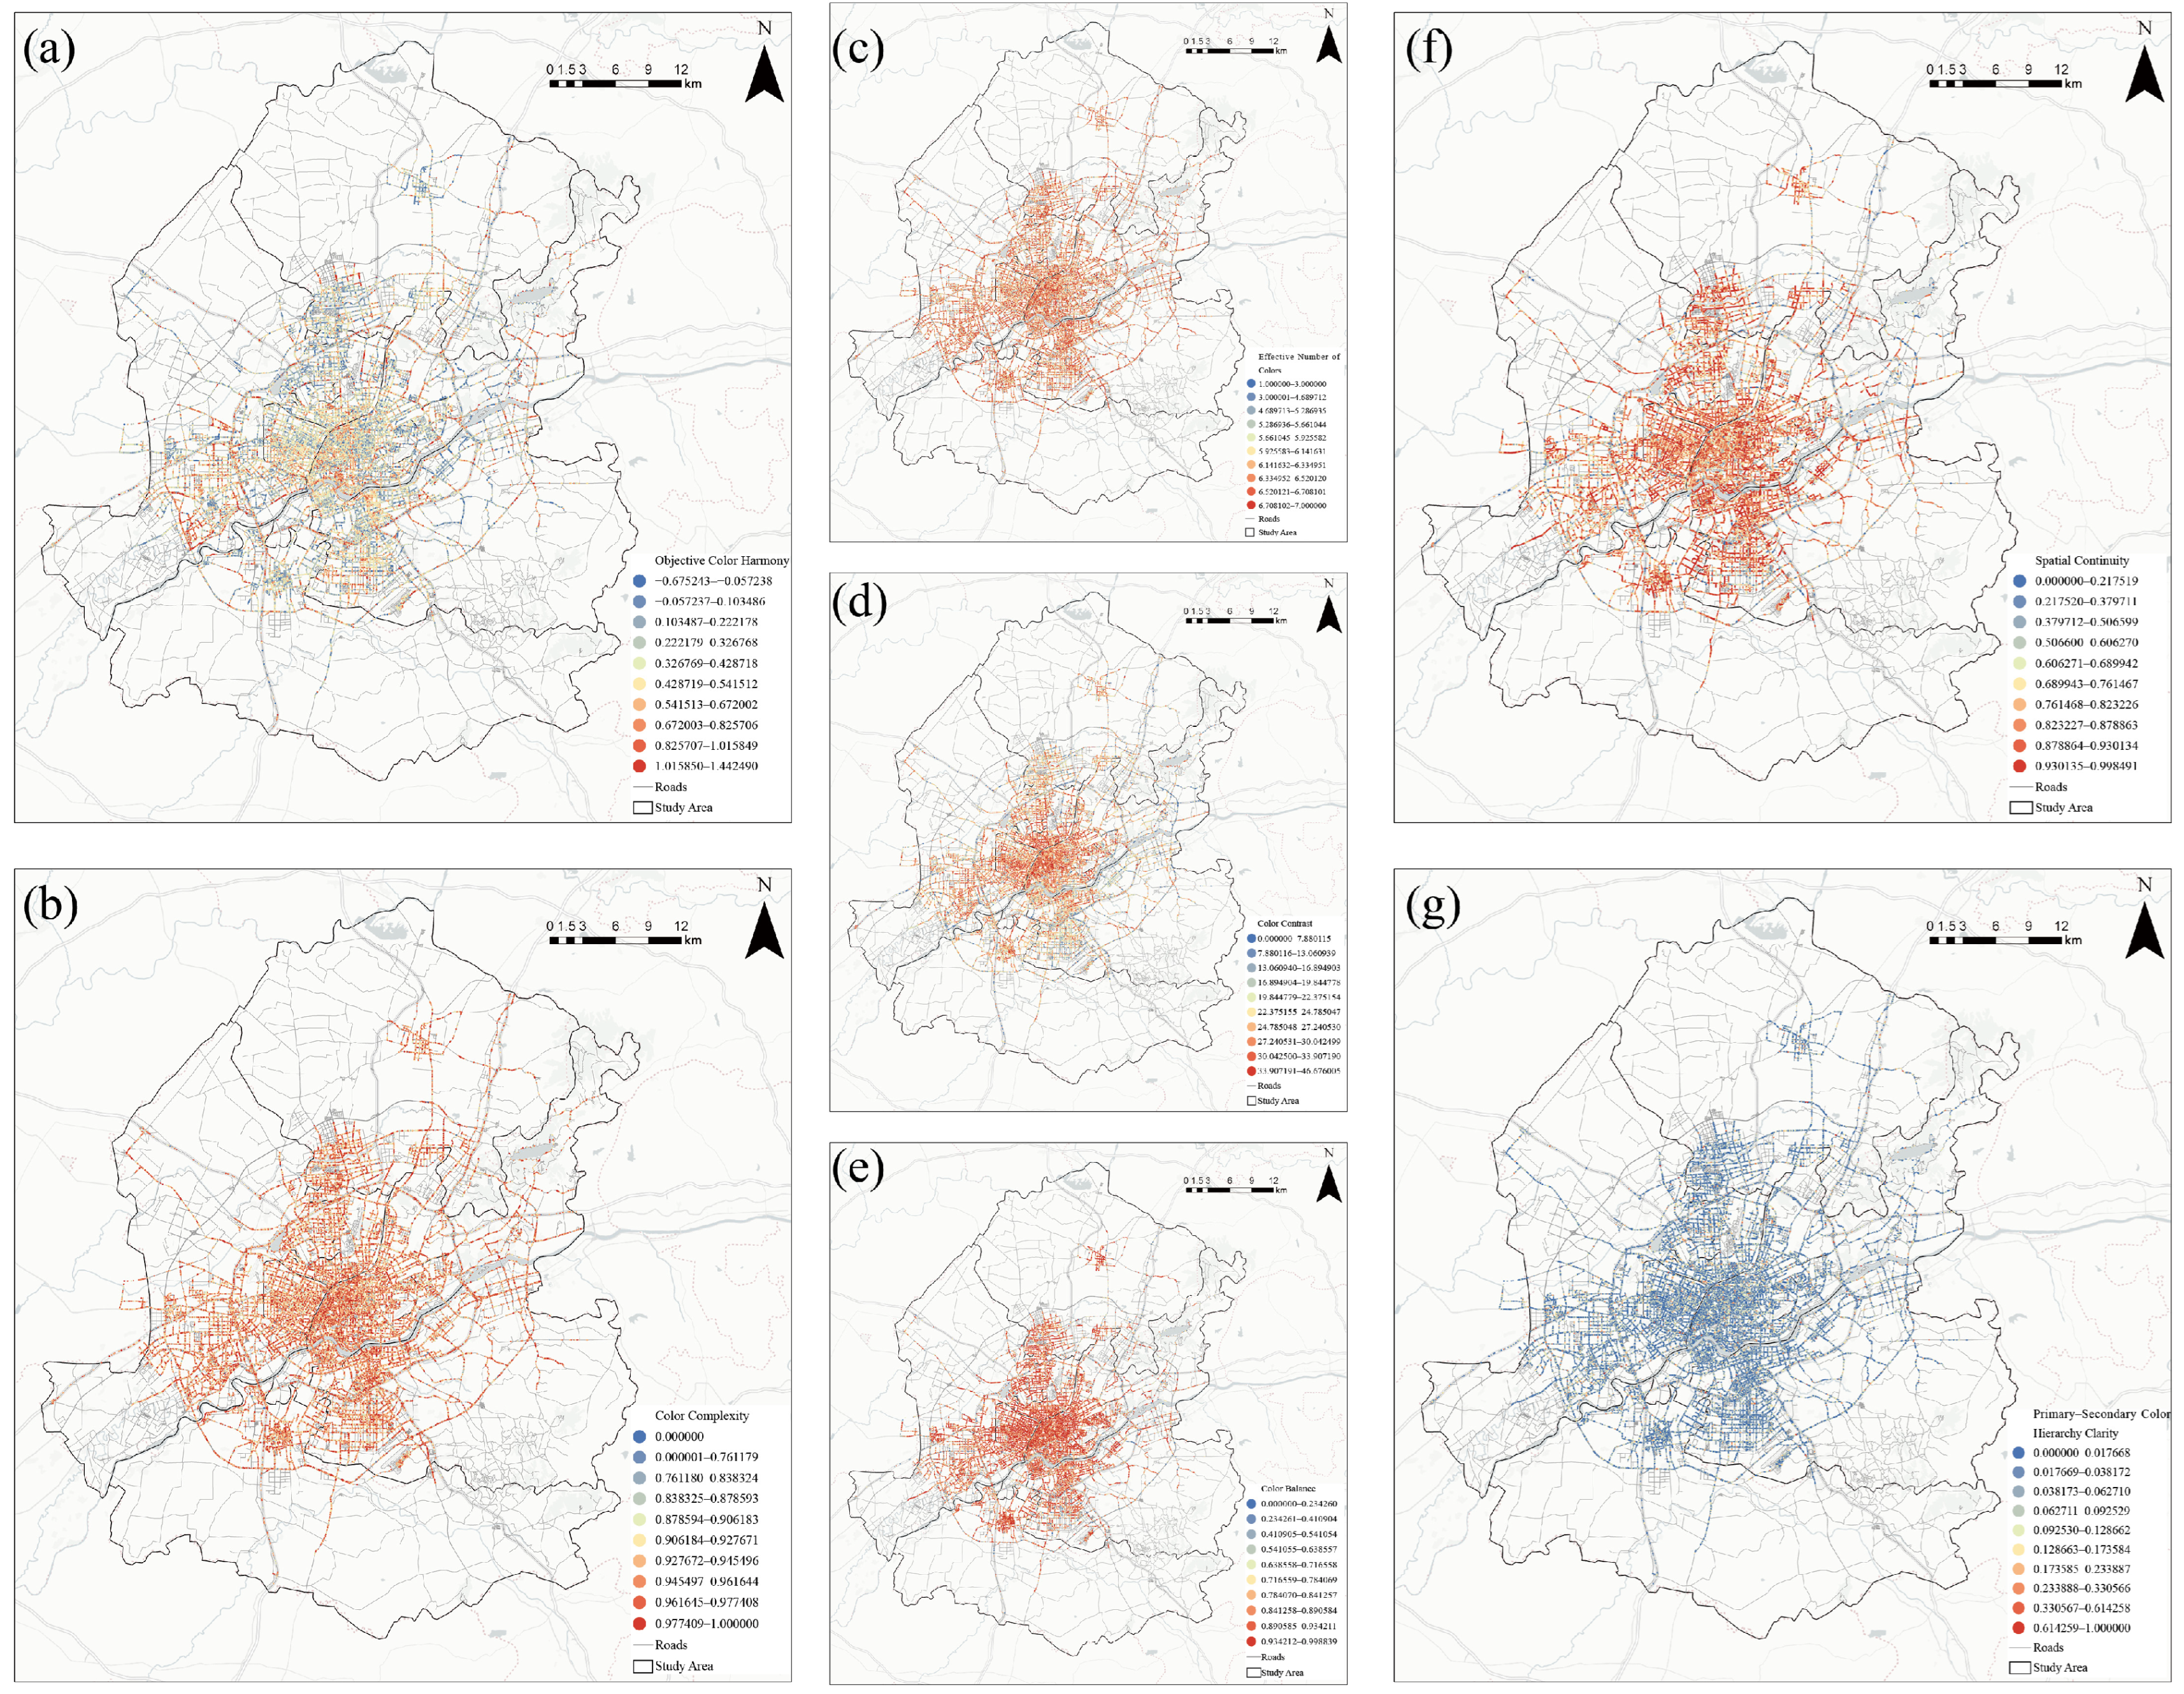
The objective building color-organization layer further analyzes how different colors are combined on façades and across continuous street spaces on the basis of the basic color attributes. It addresses the question of how building colors are organized. We matched color harmony, complexity, effective number of colors, contrast, balance, spatial continuity, and color hierarchy clarity to street-view coordinates and mapped their spatial distributions along the road network (
Figure 5).
Color harmony showed a pronounced patchy distribution, with high- and low-value road segments interspersed in both the central and peripheral areas and no continuous monocentric or ring-like structure. Some major roads and peripheral new districts had relatively high harmony, indicating comparatively coordinated relationships among lightness, chroma, and hue. Low-value road segments may contain juxtaposed old and new buildings, large material differences, or abrupt local color changes. Overall color harmony depends not only on the number of colors but also on their area proportions and mutual color differences; a complex color composition therefore does not necessarily imply disharmony.
Color complexity was generally high in the study area. Medium- and high-value roads were widely distributed in the central urban area and extended outward along major transport corridors. The central area had dense roads and relatively continuous high-value segments, indicating that façades were commonly composed of multiple colors with different area proportions. The effective number of colors showed a highly similar spatial pattern, with high values concentrated in the central area and inner–outer transition zones and lower values on low-density peripheral roads. Their spatial agreement indicates that an increase in color categories was an important source of greater façade color complexity in Shenyang.
Medium-to-high color-contrast values were concentrated in the central urban area and along some radial roads, showing a degree of central clustering and corridor extension. This indicates pronounced overall color differences among dominant, secondary, and decorative colors in the central area, possibly owing to commercial shop signs, glass curtain walls, different building materials, and the juxtaposition of old and new façades. Peripheral areas had generally lower contrast and more subdued, uniform color combinations. This distribution also corresponded to the higher lightness dispersion in the central area, indicating that light–dark differences were an important component of overall color contrast.
Color balance was generally high. High-value road segments formed a relatively continuous network in the central urban area and extended to some streets in the west, south, and north. Although the central area had richer color categories and overall color differences, the areas occupied by different colors on façades were generally stable, without marked large-area imbalance. Low values were scattered mainly in peripheral areas and on some local streets and may have resulted from isolated high-chroma components, advertising colors, or local façade renewal.
Spatial continuity showed a clear tendency toward central clustering. High-value roads were concentrated in the dense central road network and formed continuous corridors along major roads, indicating relatively stable color compositions and palette changes between adjacent street views. Low-continuity segments were located mainly in peripheral areas and at transitions between urban functions, where they may have been affected by changes in land use, differences in building age, and interruptions in street interfaces.
Compared with the other organizational indicators, color hierarchy clarity was generally low across the study area. Most roads were represented by blue and blue-green tones, with only a few high-value segments scattered locally. This indicates that although most façades contained relatively rich color compositions, the hierarchy between dominant and secondary colors was not sufficiently pronounced and lacked visual control established by a clear dominant color.
Overall, objective building color organization in Shenyang was characterized by relatively high complexity, a rich number of colors, good balance and continuity, but weak dominant–secondary hierarchy. The central urban area had the richest overall color relationships and also relatively high contrast and continuity. Peripheral street color organization was simpler, although some new and renewed districts contained nodes with high harmony and balance. In addition to controlling the number of colors and overall color differences, future color planning should therefore strengthen the dominant palette and dominant–secondary hierarchy to prevent rich color compositions from becoming redundant visual information.
3.2.3. Public-Perception Evaluation (CP Layer)
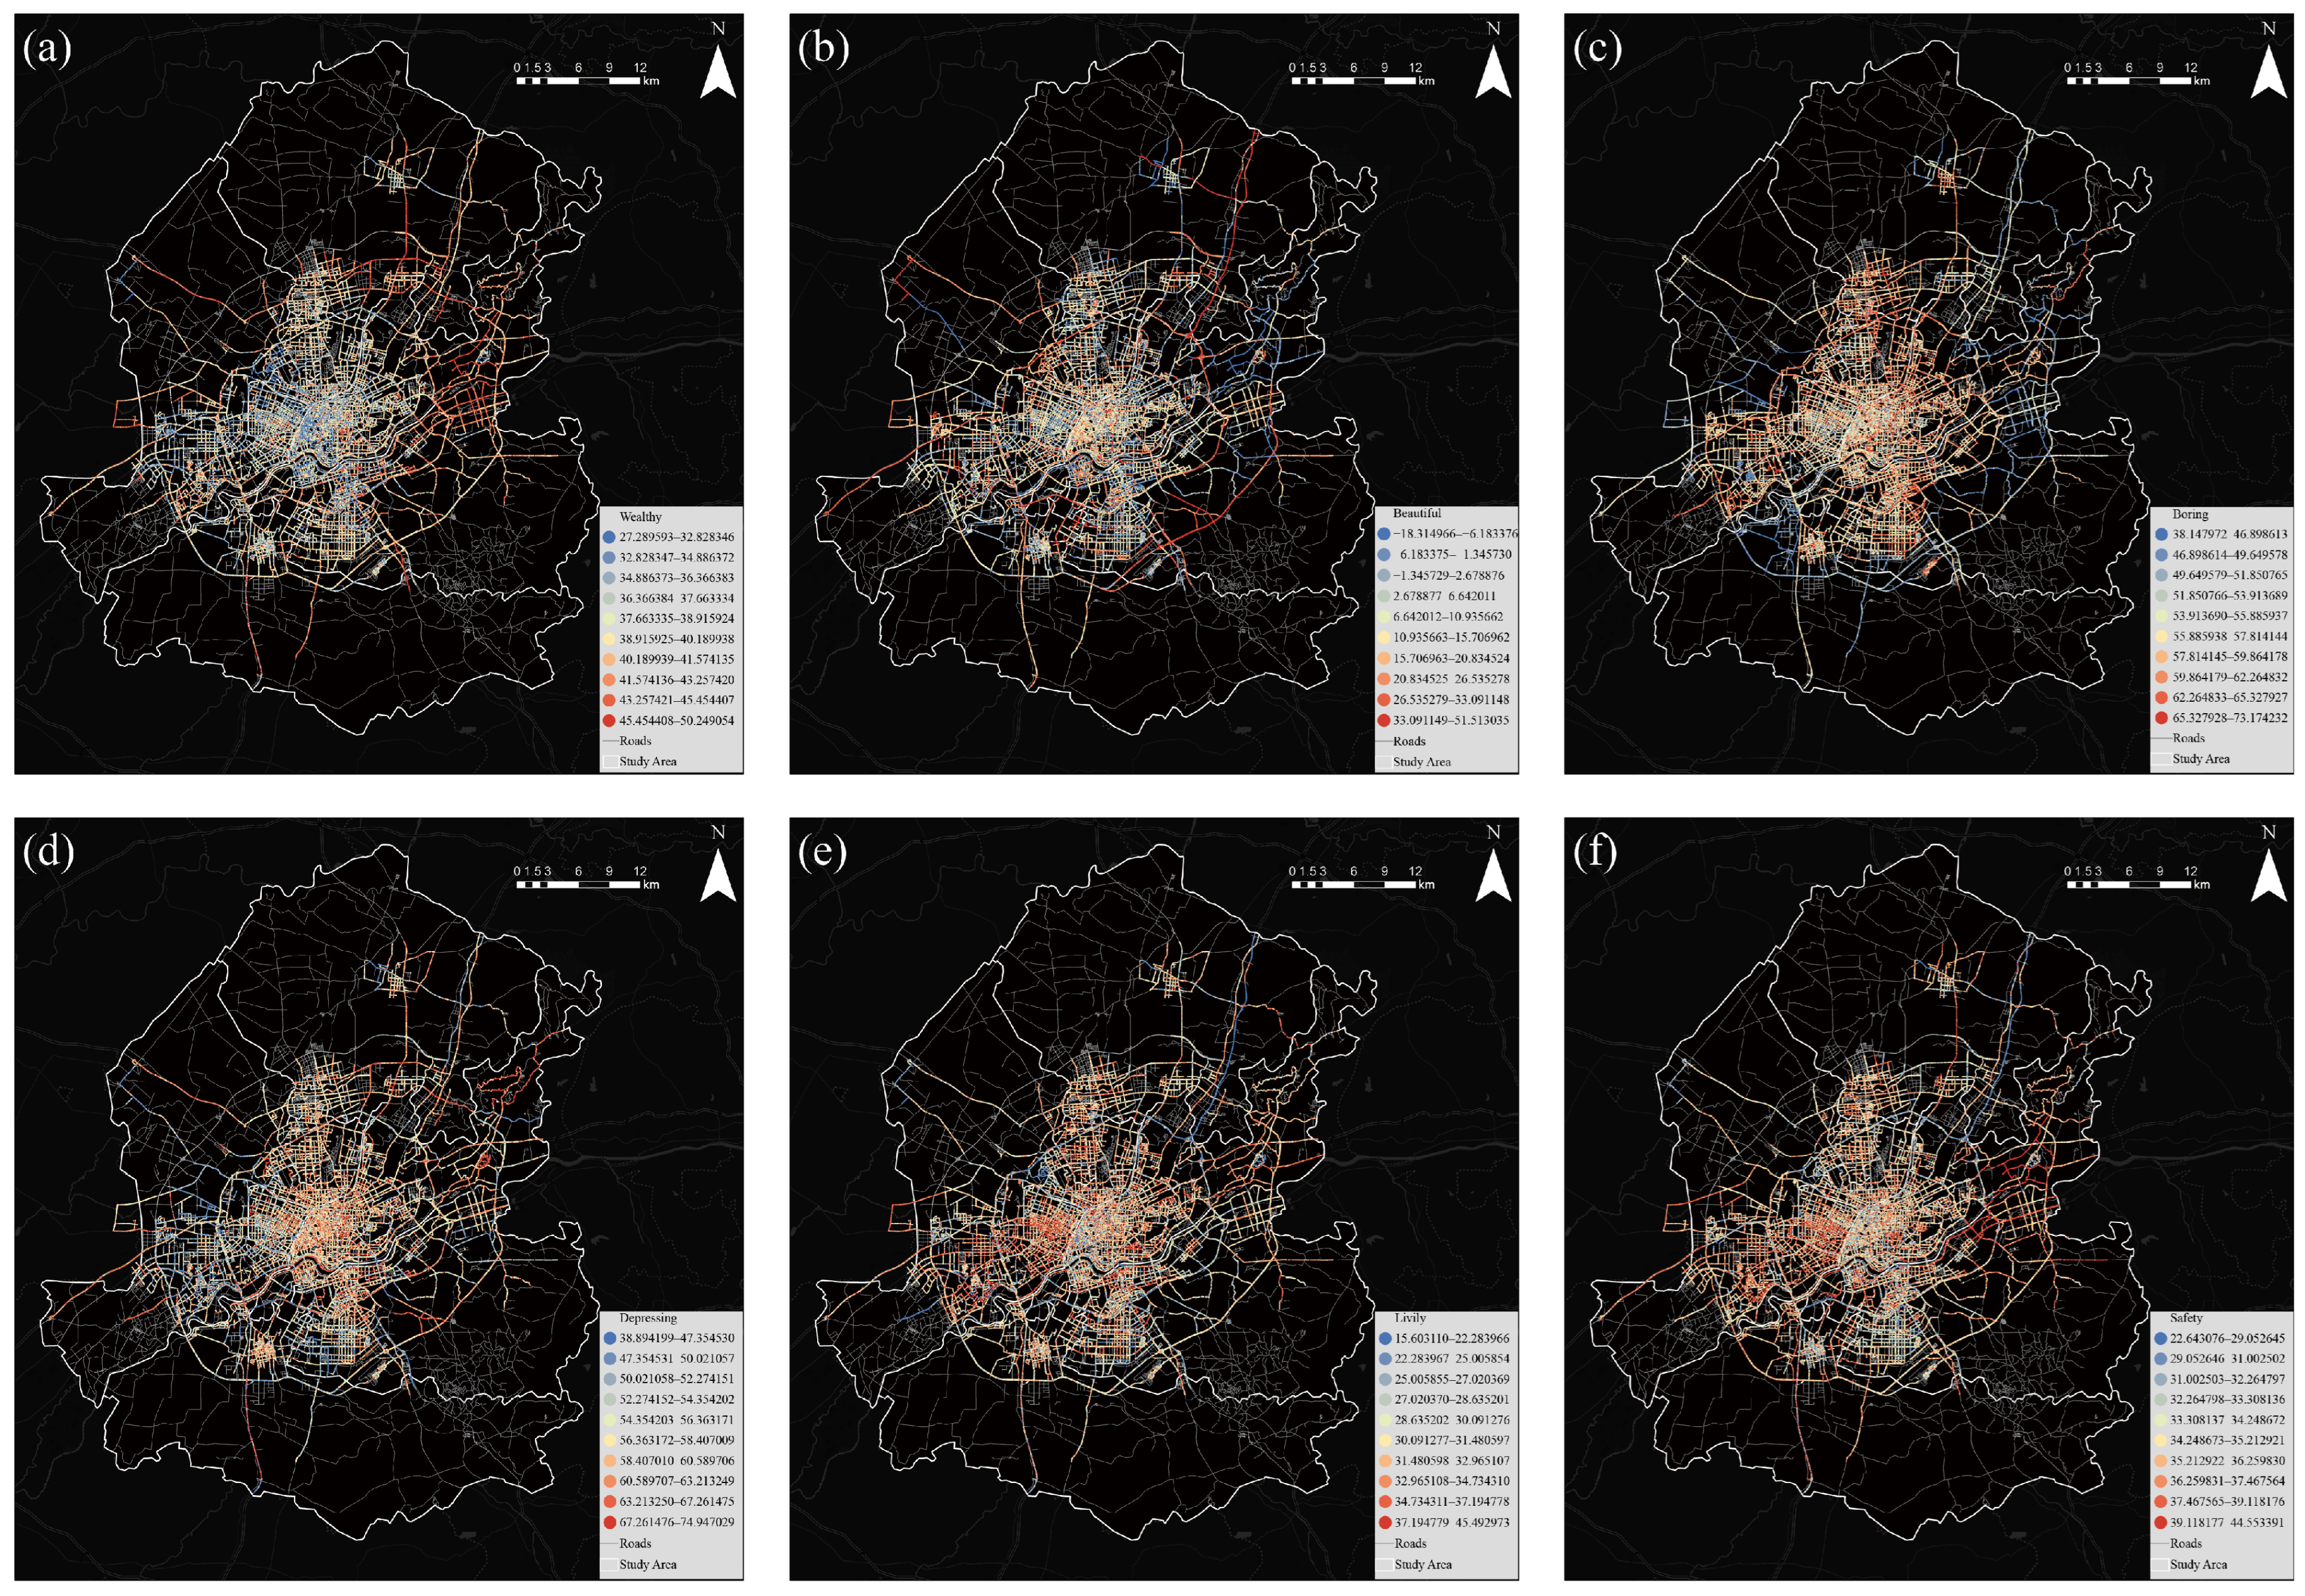
We matched the public-perception scores inferred by the Place Pulse model to the spatial coordinates of the street-view images. Their spatial distributions were described across six dimensions: perceived wealth, beauty, boredom, depression, liveliness, and safety (
Figure 6). These scores were used for comparisons within the study sample and do not represent direct evaluations by Shenyang residents.
Perceived wealth showed a pattern of central mixing and local peripheral highs. The central urban area was dominated by medium-to-low-value street segments with pronounced alternation between high and low values. Higher model-inferred wealth scores occurred mainly along roads and in new districts in the east, northeast, and parts of the west. This pattern may be related to the use of more complete, brighter, and more modern materials in new housing, commercial complexes, and renewed façades. Although some traditional built-up areas had high building density, their model-inferred wealth scores were relatively low where façades were older, darker, or embedded in more complex street interfaces.
Perceived beauty had the most fragmented spatial distribution, with both high and low values in the central area and on peripheral roads and no clear monocentric gradient. High values occurred mainly along major roads, urban expansion axes, and locally renewed streets. Continuous façade improvement, relatively coordinated color combinations, and more complete street interfaces therefore corresponded to higher model-inferred beauty scores. Low values were concentrated on roads with disordered interfaces, discontinuous color organization, or a mixture of old and new buildings. The broad range of this indicator also shows stronger place-based variation in model-inferred beauty scores.
Perceived boredom and depression showed a degree of spatial consistency. Their medium-to-high values were concentrated mainly in the central urban area and parts of the dense northern road network. They also formed continuous distributions along several major roads. Low values appeared more often in the southwest, south, and some peripheral roads. Some central street segments had continuous building interfaces, but prolonged use of low-chroma, low-lightness, or highly repetitive façade colors may correspond to higher model-inferred boredom and depression scores. Perceived depression may also be affected by street height-to-width ratio, building obstruction, sky visibility, and vegetation, and therefore cannot be attributed entirely to building color. The spatial similarity between boredom and depression was consistent with their positive statistical correlation.
High model-inferred liveliness scores were concentrated mainly along roads in the west, southwest, and parts of the central periphery. Local clusters also occurred on streets with stronger commercial activity or greater color variation. The central core and some peripheral roads showed medium-to-low values, indicating that a high-density built environment does not necessarily generate a high liveliness score. Façade color vividness, shop-sign information, mixed functions, and street activity may jointly influence the model output.
Model-inferred safety generally showed medium-to-high values clustered along major roads and in new districts, with pronounced patterns in the west, east, and parts of the south. Many medium-to-low-value segments remained inside the central urban area. Continuous, bright, and well-maintained building interfaces may strengthen spatial order and legibility and correspond to higher model-inferred safety scores. Wealth, liveliness, and safety scores overlapped spatially in some areas, consistent with their positive correlations.
Overall, the six public-perception scores inferred by the Place Pulse model showed marked spatial heterogeneity. High positive scores occurred more often along renewed areas, major roads, and urban expansion axes. High negative scores were relatively concentrated in some traditional built-up areas and high-density streets. These distributions may also reflect building form, vegetation, road function, maintenance condition, and image-acquisition conditions, and cannot be attributed only to building color.
3.3. Color-Quality Clustering
To identify typical patterns of façade color quality in Shenyang, the 14 CA and CO indicators were Z-score standardized and analyzed using K-means clustering (
Figure 7). Across K = 1–10, we compared the within-cluster sum of squares, silhouette coefficient, Calinski–Harabasz index, and Davies–Bouldin index. The elbow method indicated approximately K = 4, while the silhouette coefficient and Calinski–Harabasz index supported K = 2. The Davies–Bouldin index favored larger K values, and equal-weight rank aggregation produced a tie between K = 2 and K = 5. Following the rule that favors the more parsimonious model in a tie, and considering repeated-subsample stability, we selected K = 2 as a coarse-grained classification. It was not the uniquely optimal solution under every criterion.
C1 accounted for 24.8% of the samples and can be summarized as the “dominant-color control–clear hierarchy” type (
Figure 8). Its dominant color share and color hierarchy clarity were relatively high, at 0.319 and 0.113, respectively, whereas color complexity, effective number of colors, and color contrast were relatively low, at 0.892, 5.652, and 23.260, respectively. This type was characterized by a prominent dominant color and a relatively concentrated color composition.
C2 accounted for 75.2% of the samples and can be summarized as the “multicolor composition–continuous richness” type. Its color complexity and effective number of colors reached 0.956 and 6.416, respectively. It also had higher lightness dispersion, color contrast, balance, and spatial continuity, indicating richer façade colors and more continuous color organization along street interfaces. The harmony values of the two types were both approximately 0.383 and differed little, indicating that harmony was not a major factor distinguishing the two types.
Cluster validation yielded a silhouette coefficient of 0.214 for K = 2, indicating substantial transition and overlap between the two types. However, the mean ARI across 50 subsample tests reached 0.944 ± 0.026, indicating high stability of the broad classification. The ARI between K-means and Ward clustering was 0.211, and 27.8% of samples had a maximum fuzzy-membership value below 0.6. K = 2 was therefore more suitable as a stable coarse-grained division of color types than as discrete categories with sharply defined boundaries. Descriptive comparisons showed slightly higher model-inferred beauty and safety scores and slightly lower depression and boredom scores in C2, but the differences were small.
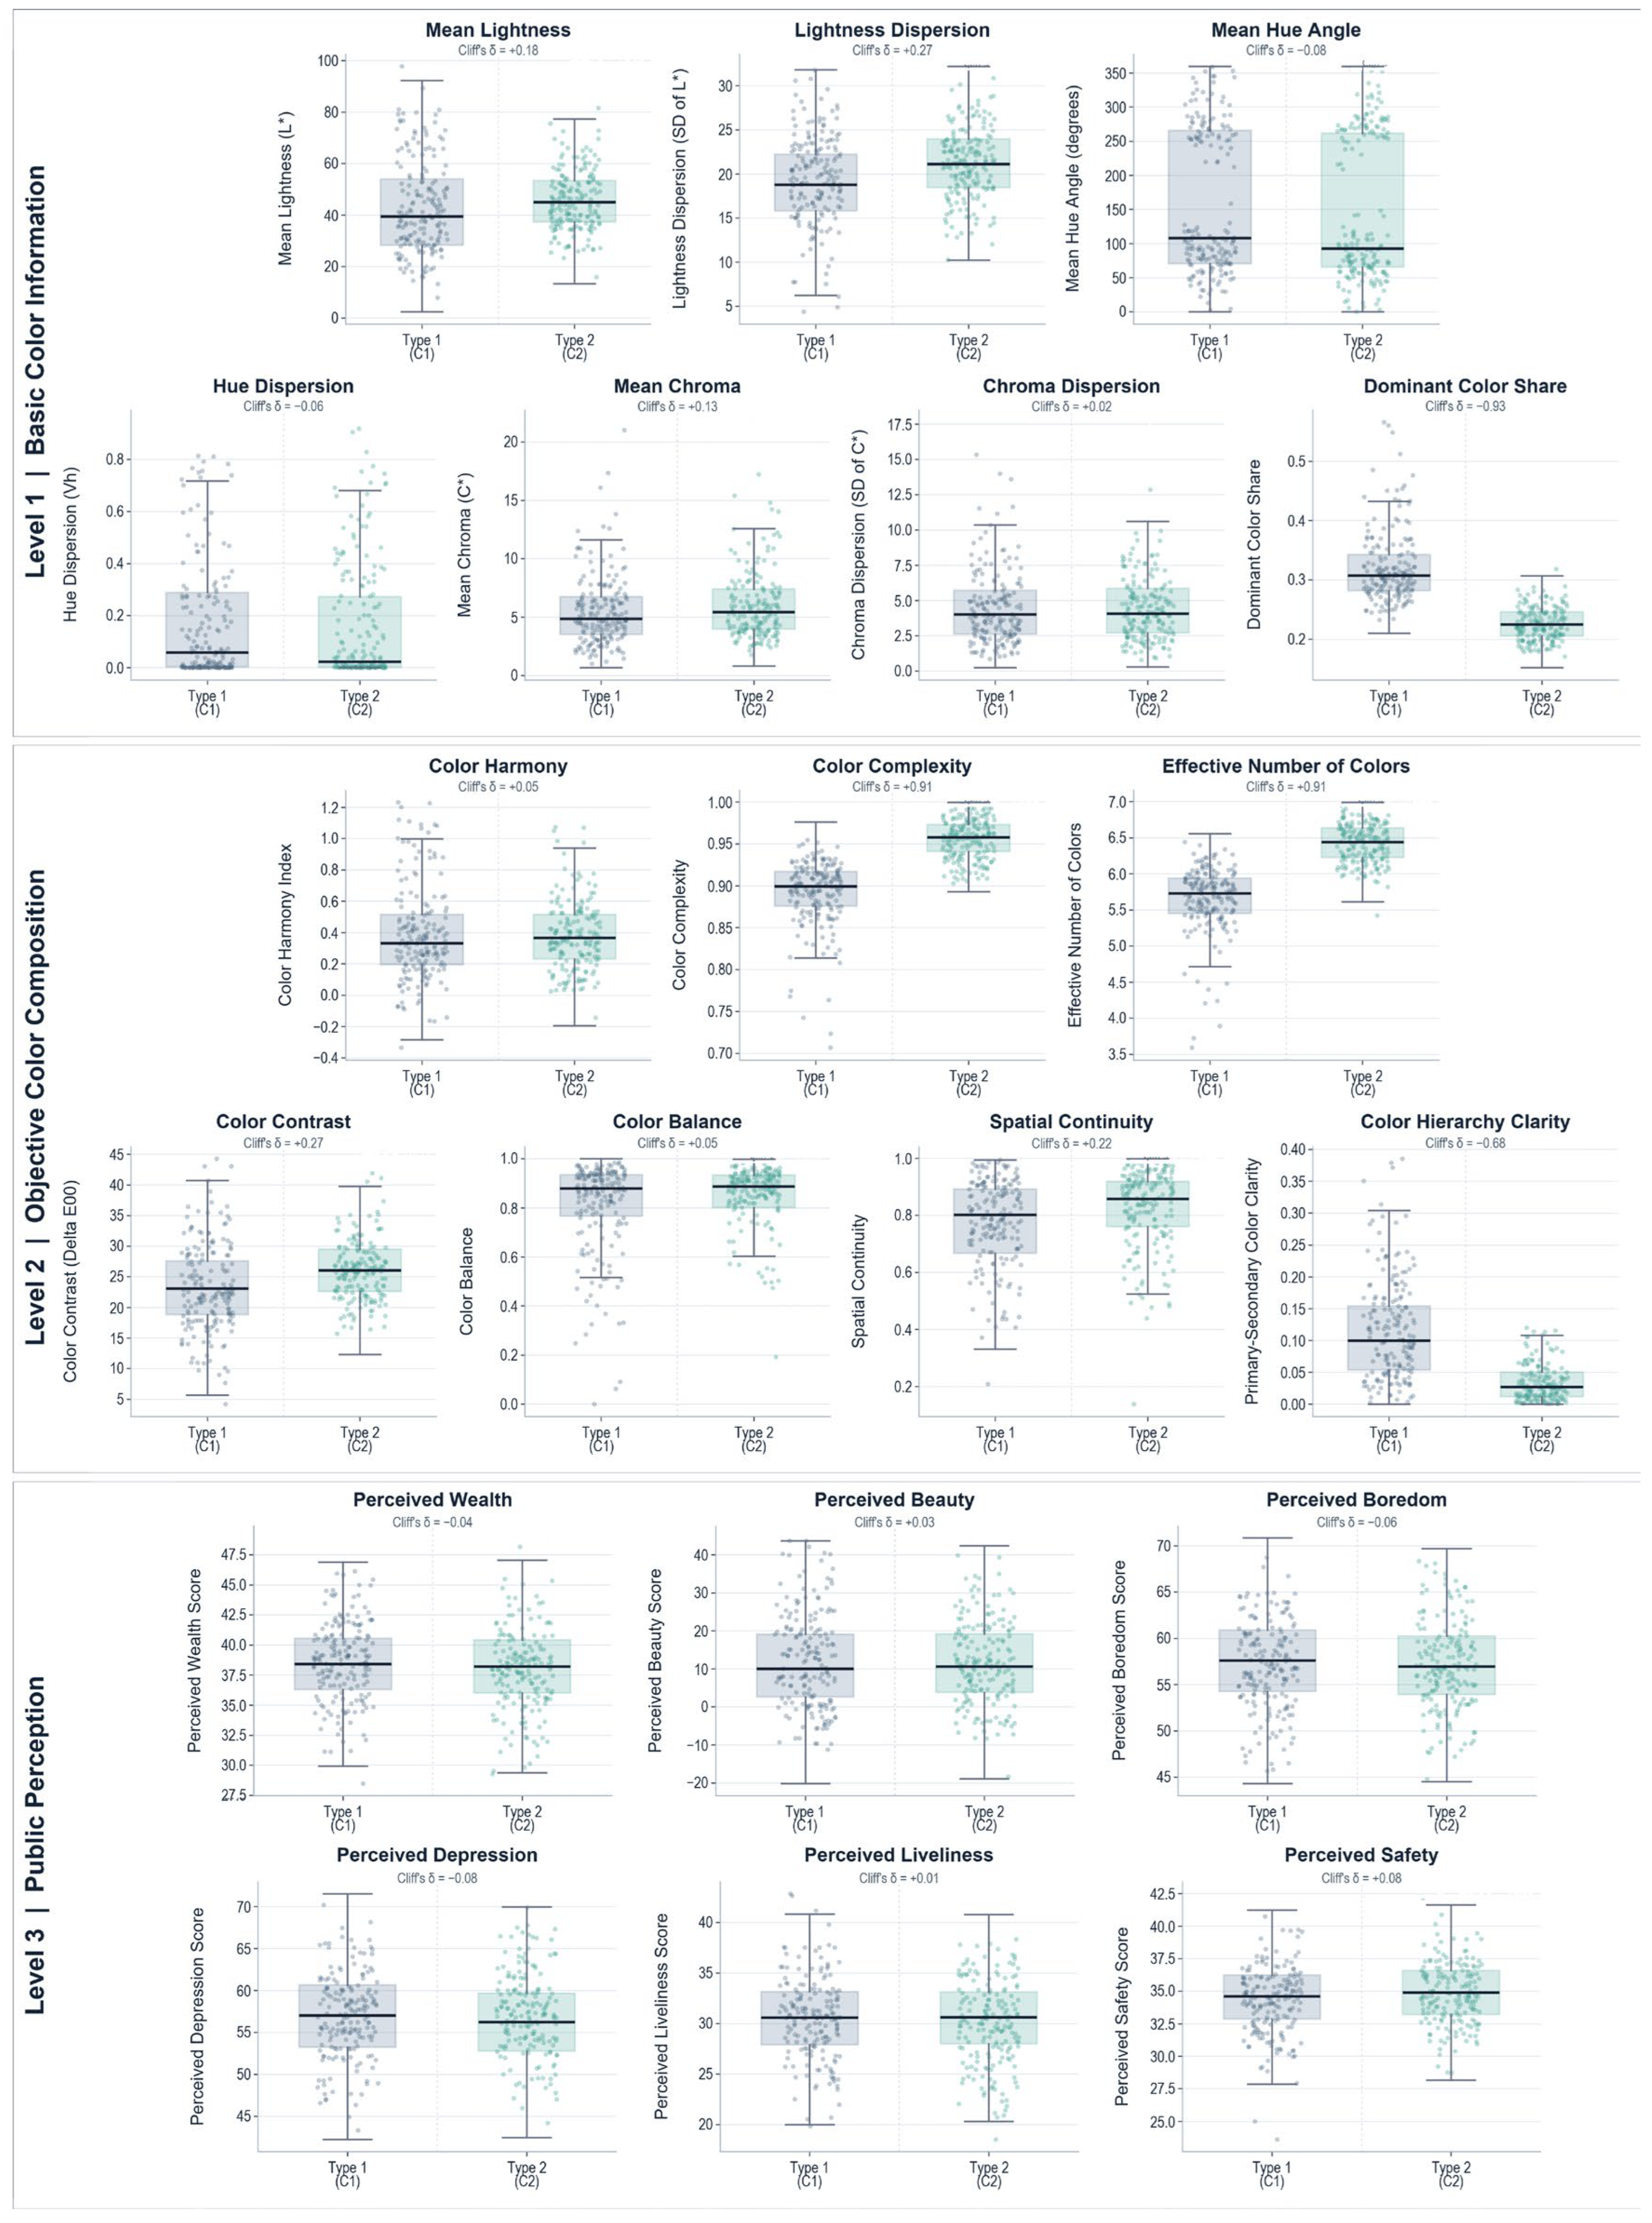
We compared the differences between the two color-quality clusters across the three levels of machine-vision information, objective color organization, and public perception (
Figure 9). The Mann–Whitney U test was used, multiple comparisons were corrected using the Benjamini–Hochberg method, and Cliff’s δ was used to evaluate the effect size of the differences. The results showed clear structural differentiation between the two street-view types in the first and second layers, whereas differences in the third-layer perception indicators were relatively limited.
In the machine-vision information layer, the median mean lightness of C2 was 44.95, higher than the 39.34 observed for C1. Lightness dispersion also increased from 18.78 to 21.10, indicating that C2 façades were generally brighter and had richer light–dark variation. Mean chroma was slightly higher in C2, indicating a relatively more vivid color tendency. Meanwhile, mean hue angle decreased from 107.59° to 92.52° and hue dispersion decreased from 0.057 to 0.022, indicating a more concentrated overall hue direction. The most pronounced difference between the two types was dominant color share: 0.307 in C1 and only 0.225 in C2, with a Cliff’s δ of −0.934, a large effect. C1 therefore showed clear control by a single dominant color, whereas C2 contained more secondary colors with similar areas. Apart from dominant color share, mean lightness and lightness dispersion showed small effects, and the practical effects of the remaining basic color indicators were weak.
In the objective color-feature layer, color complexity increased from 0.899 in C1 to 0.958 in C2, and the effective number of colors increased from 5.73 to 6.44. The corresponding Cliff’s δ values were 0.912 and 0.908, both large effects, indicating a richer color composition in C2. Overall color contrast increased from 23.03 to 26.03, and spatial continuity increased from 0.801 to 0.857; both represented small effects. Color harmony and balance were also slightly higher in C2, but their effect sizes were negligible. In contrast, color hierarchy clarity was 0.100 in C1, significantly higher than the 0.027 in C2, with a Cliff’s δ of −0.685, a large effect. Thus, C1 contained fewer colors but a clearer dominant-color hierarchy, whereas C2 formed its overall color organization through more colors, higher contrast, and stronger continuity. C1 can therefore be summarized as the “dominant-color control–clear hierarchy” type and C2 as the “multicolor composition–continuous richness” type.
Between-group differences in the public-perception layer were markedly weaker than those in the first two layers. C2 had slightly higher beauty and safety scores and slightly lower boredom and depression scores, whereas C1 had a slightly higher wealth score. However, the absolute Cliff’s δ values for all perception indicators were below 0.08, indicating negligible effects. The medians of model-inferred liveliness were nearly identical, and the difference was not statistically significant (q = 0.396). Marked differentiation in objective color structure therefore corresponded to only weak differences in model-inferred perception scores. The richer, brighter, and more continuous color organization of C2 corresponded to slightly higher beauty and safety scores. However, model outputs may also reflect noncolor factors such as building form, street environment, vegetation, and spatial function. Objective color indicators can effectively identify urban building-color types, but they cannot independently explain model-inferred perception scores or replace local public evaluation.
3.4. Classification Control Based on Color Quality and Perception Evaluation
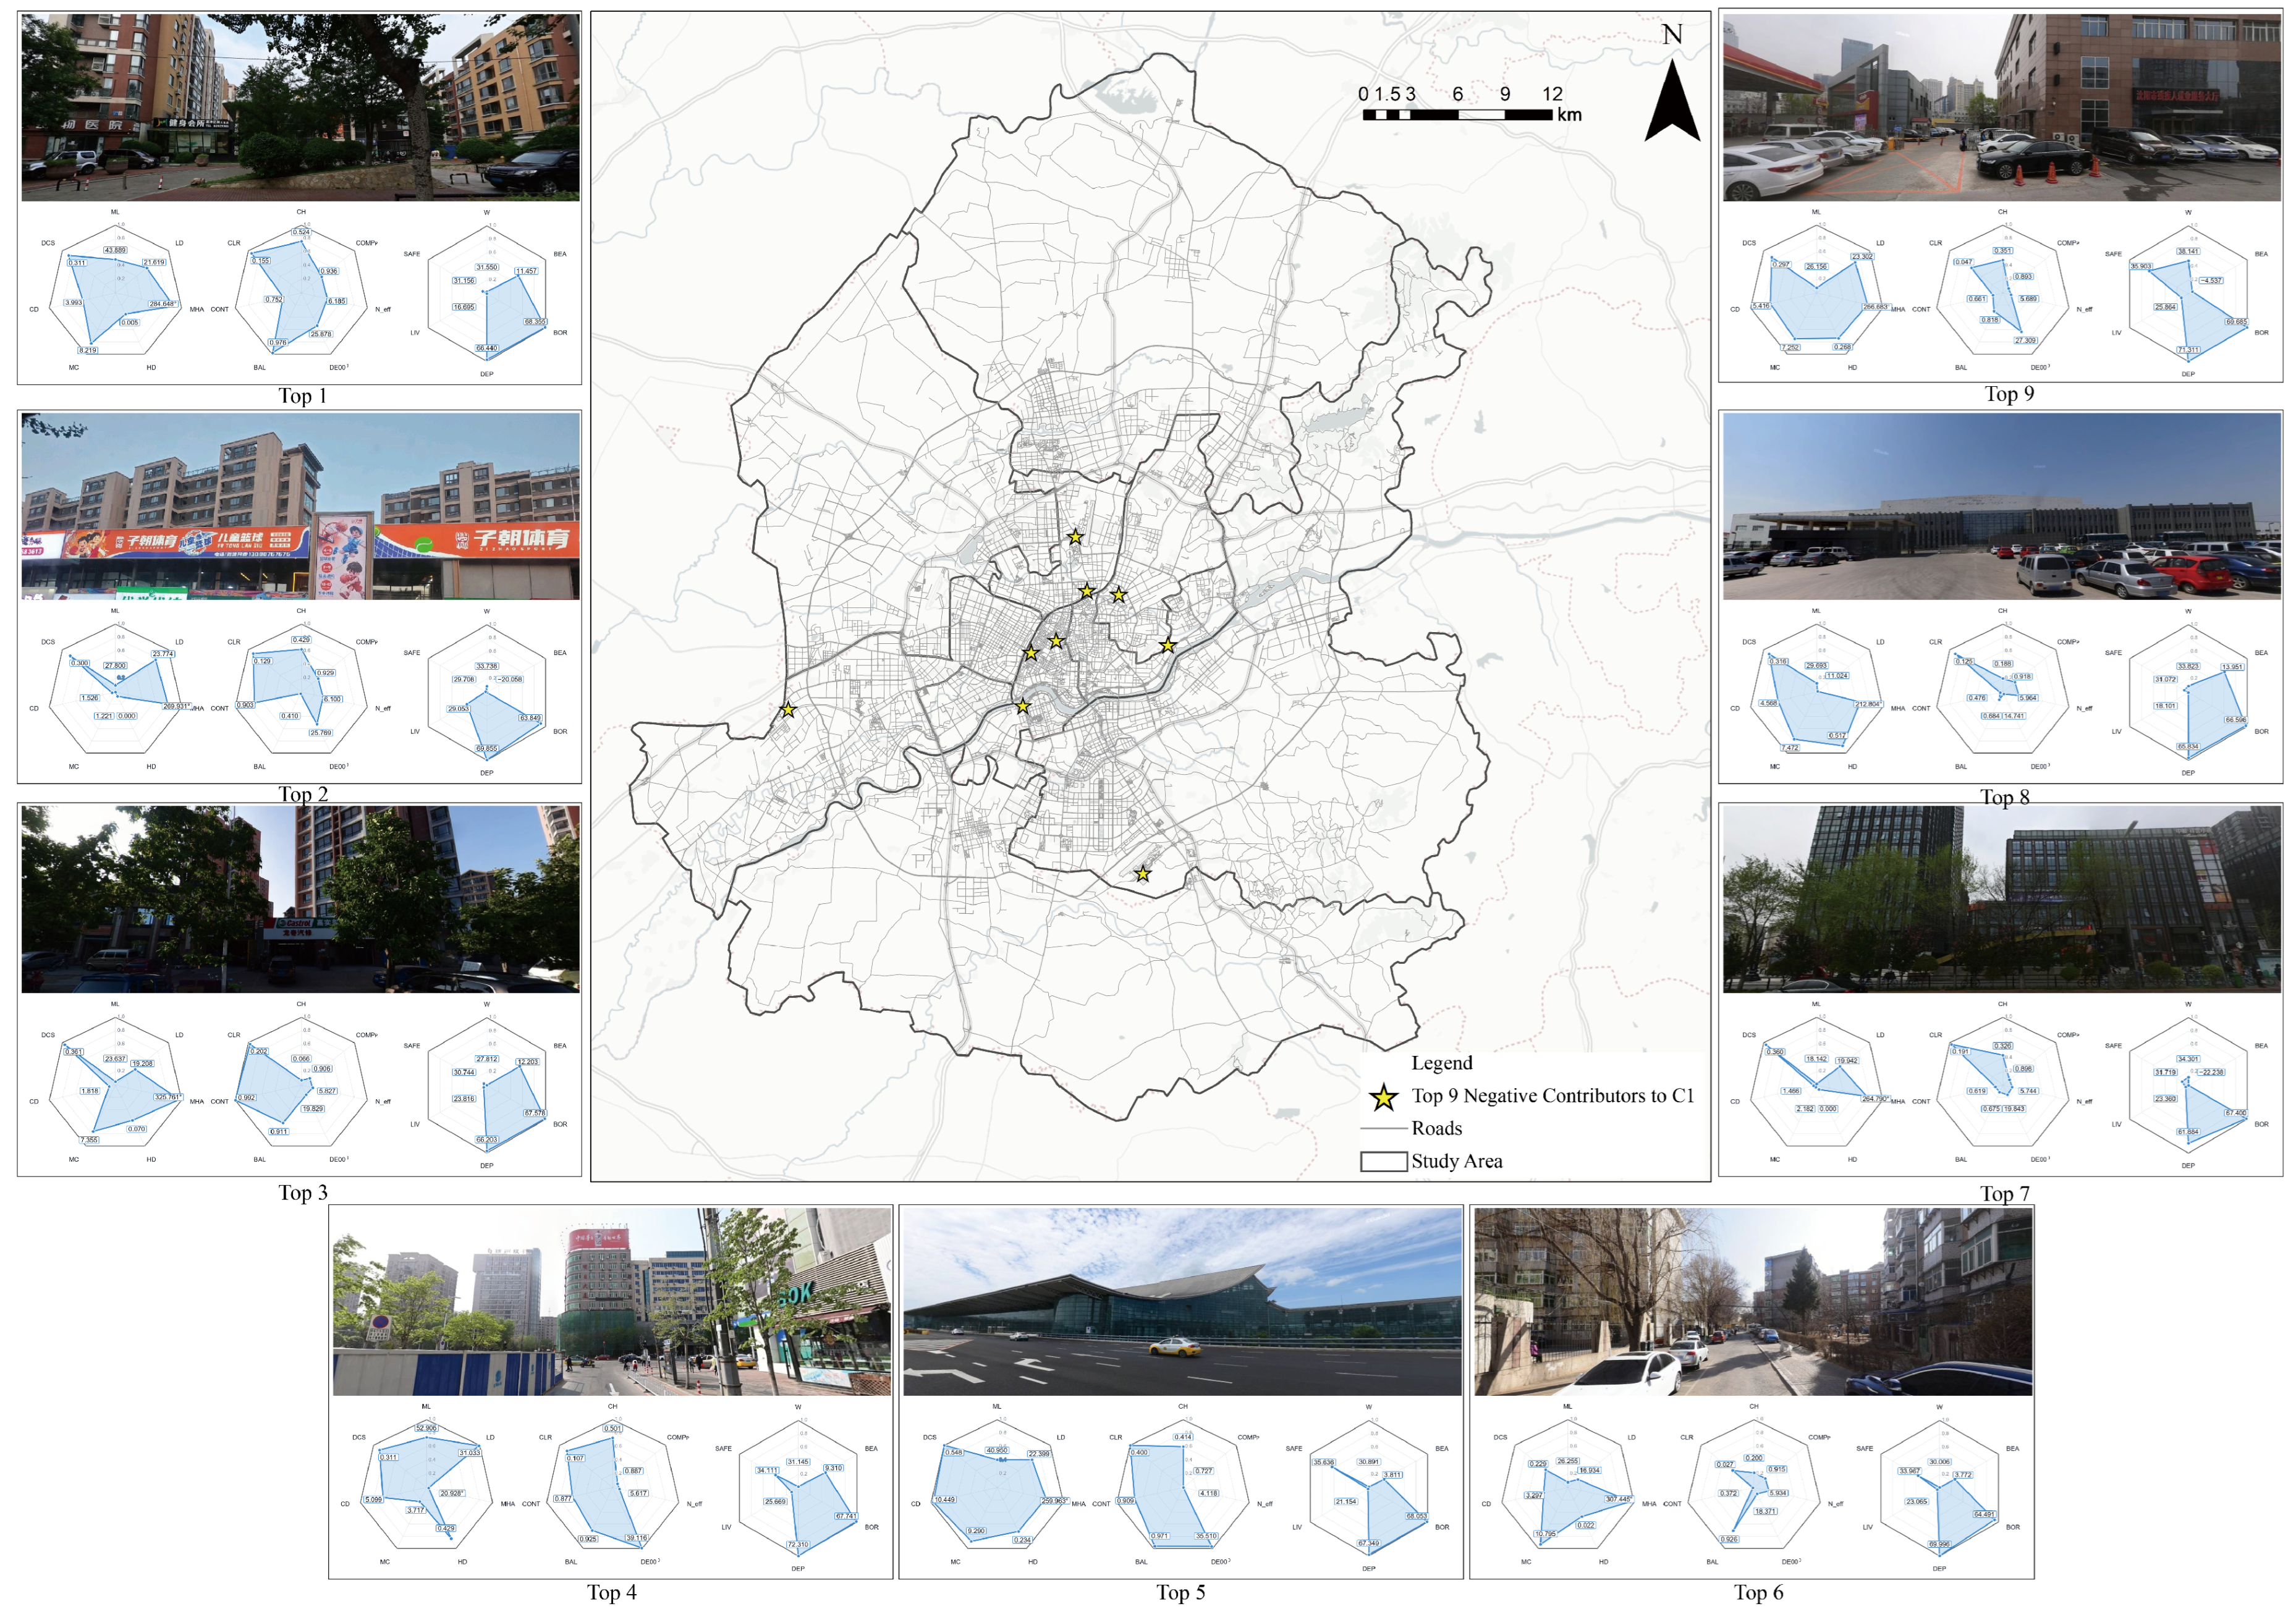
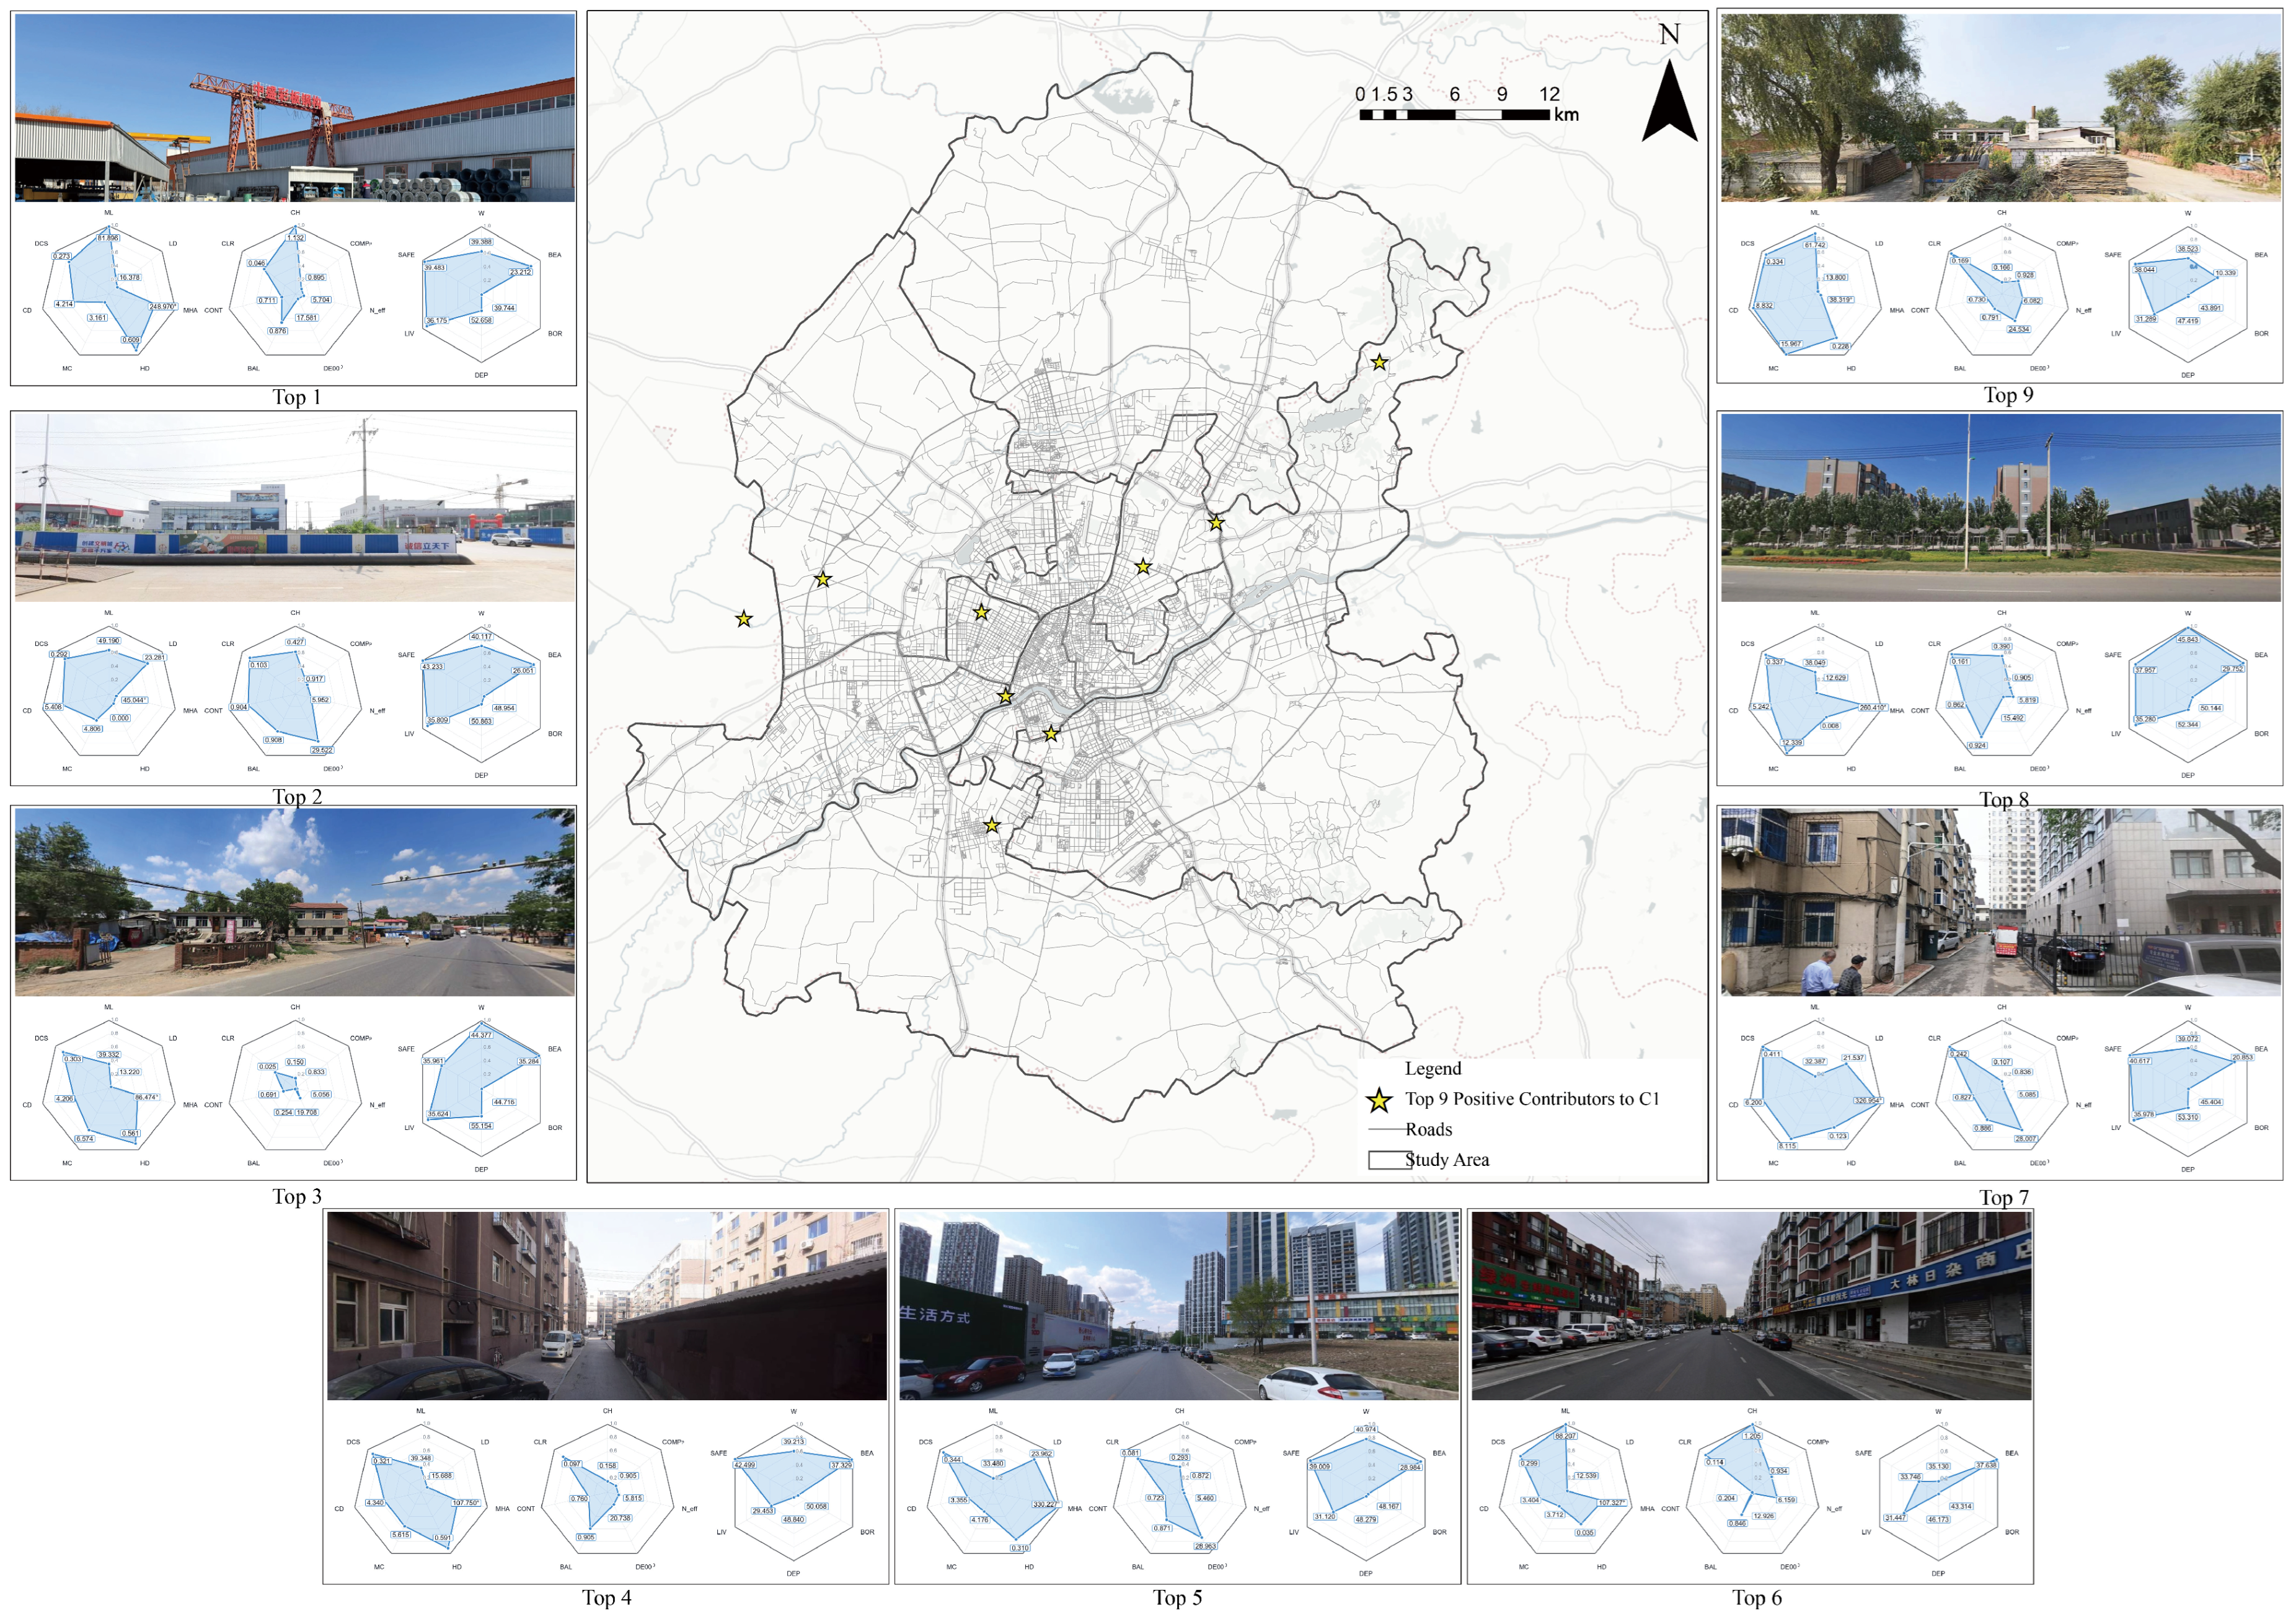
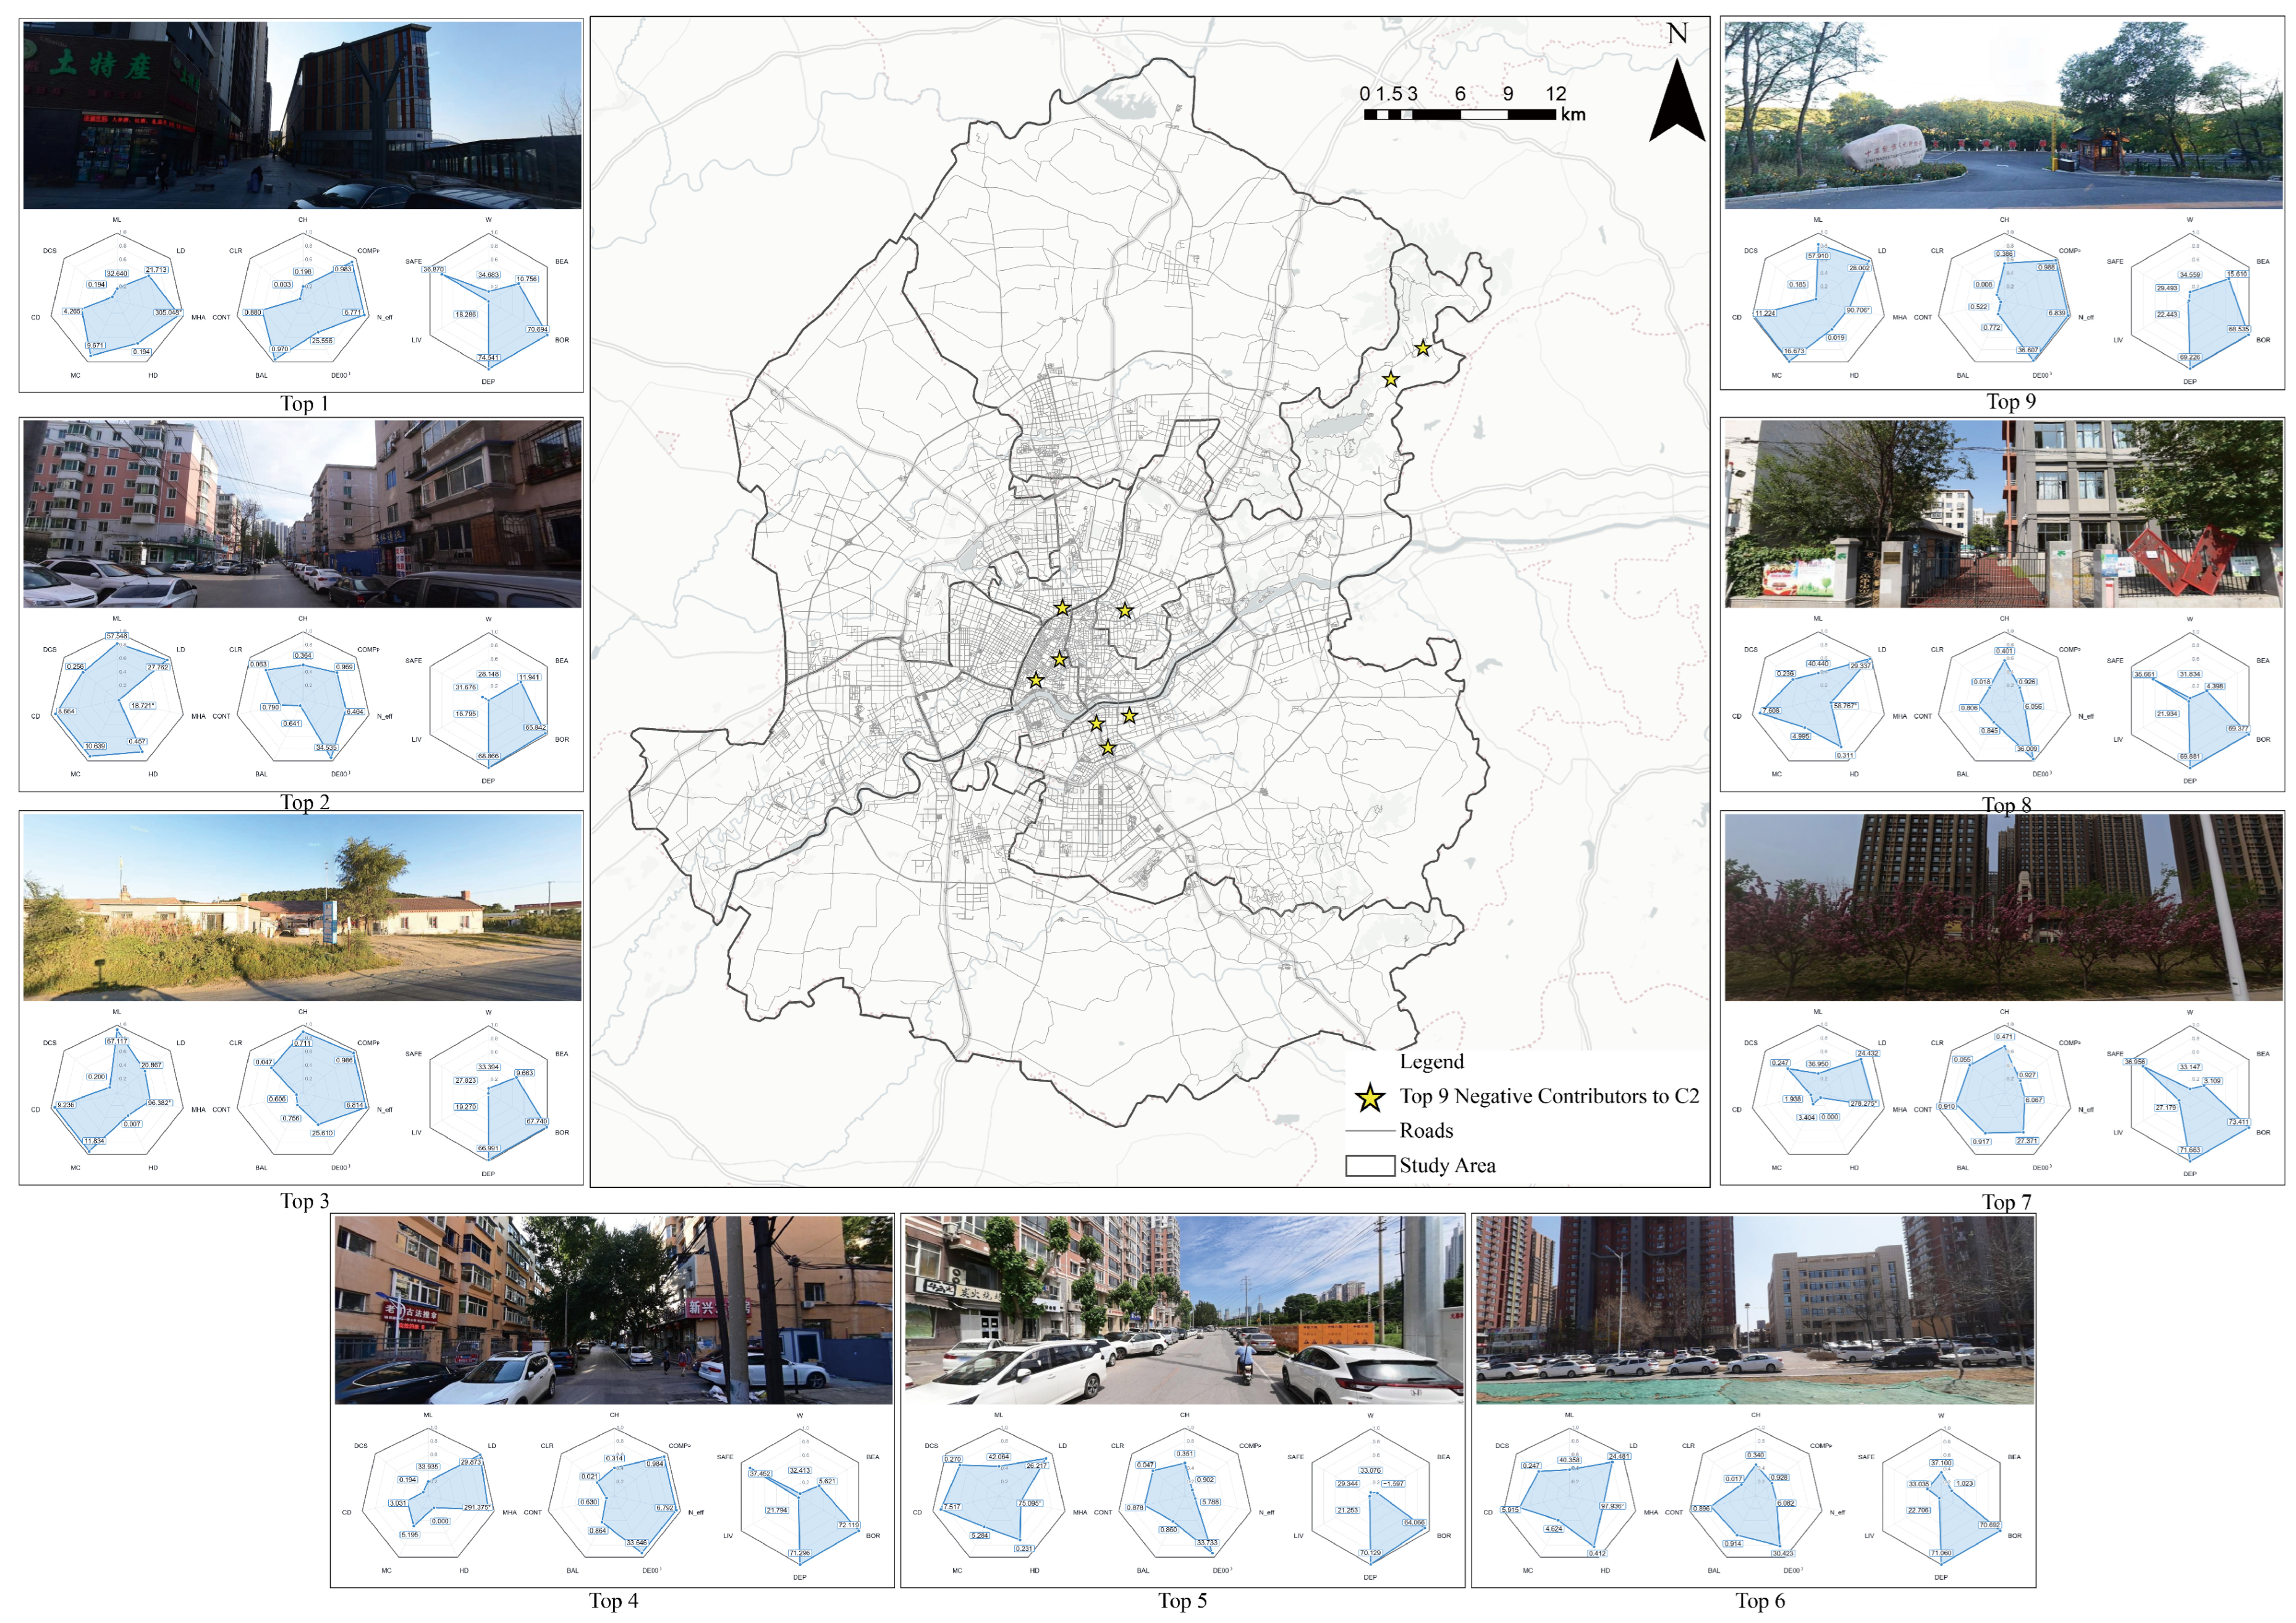
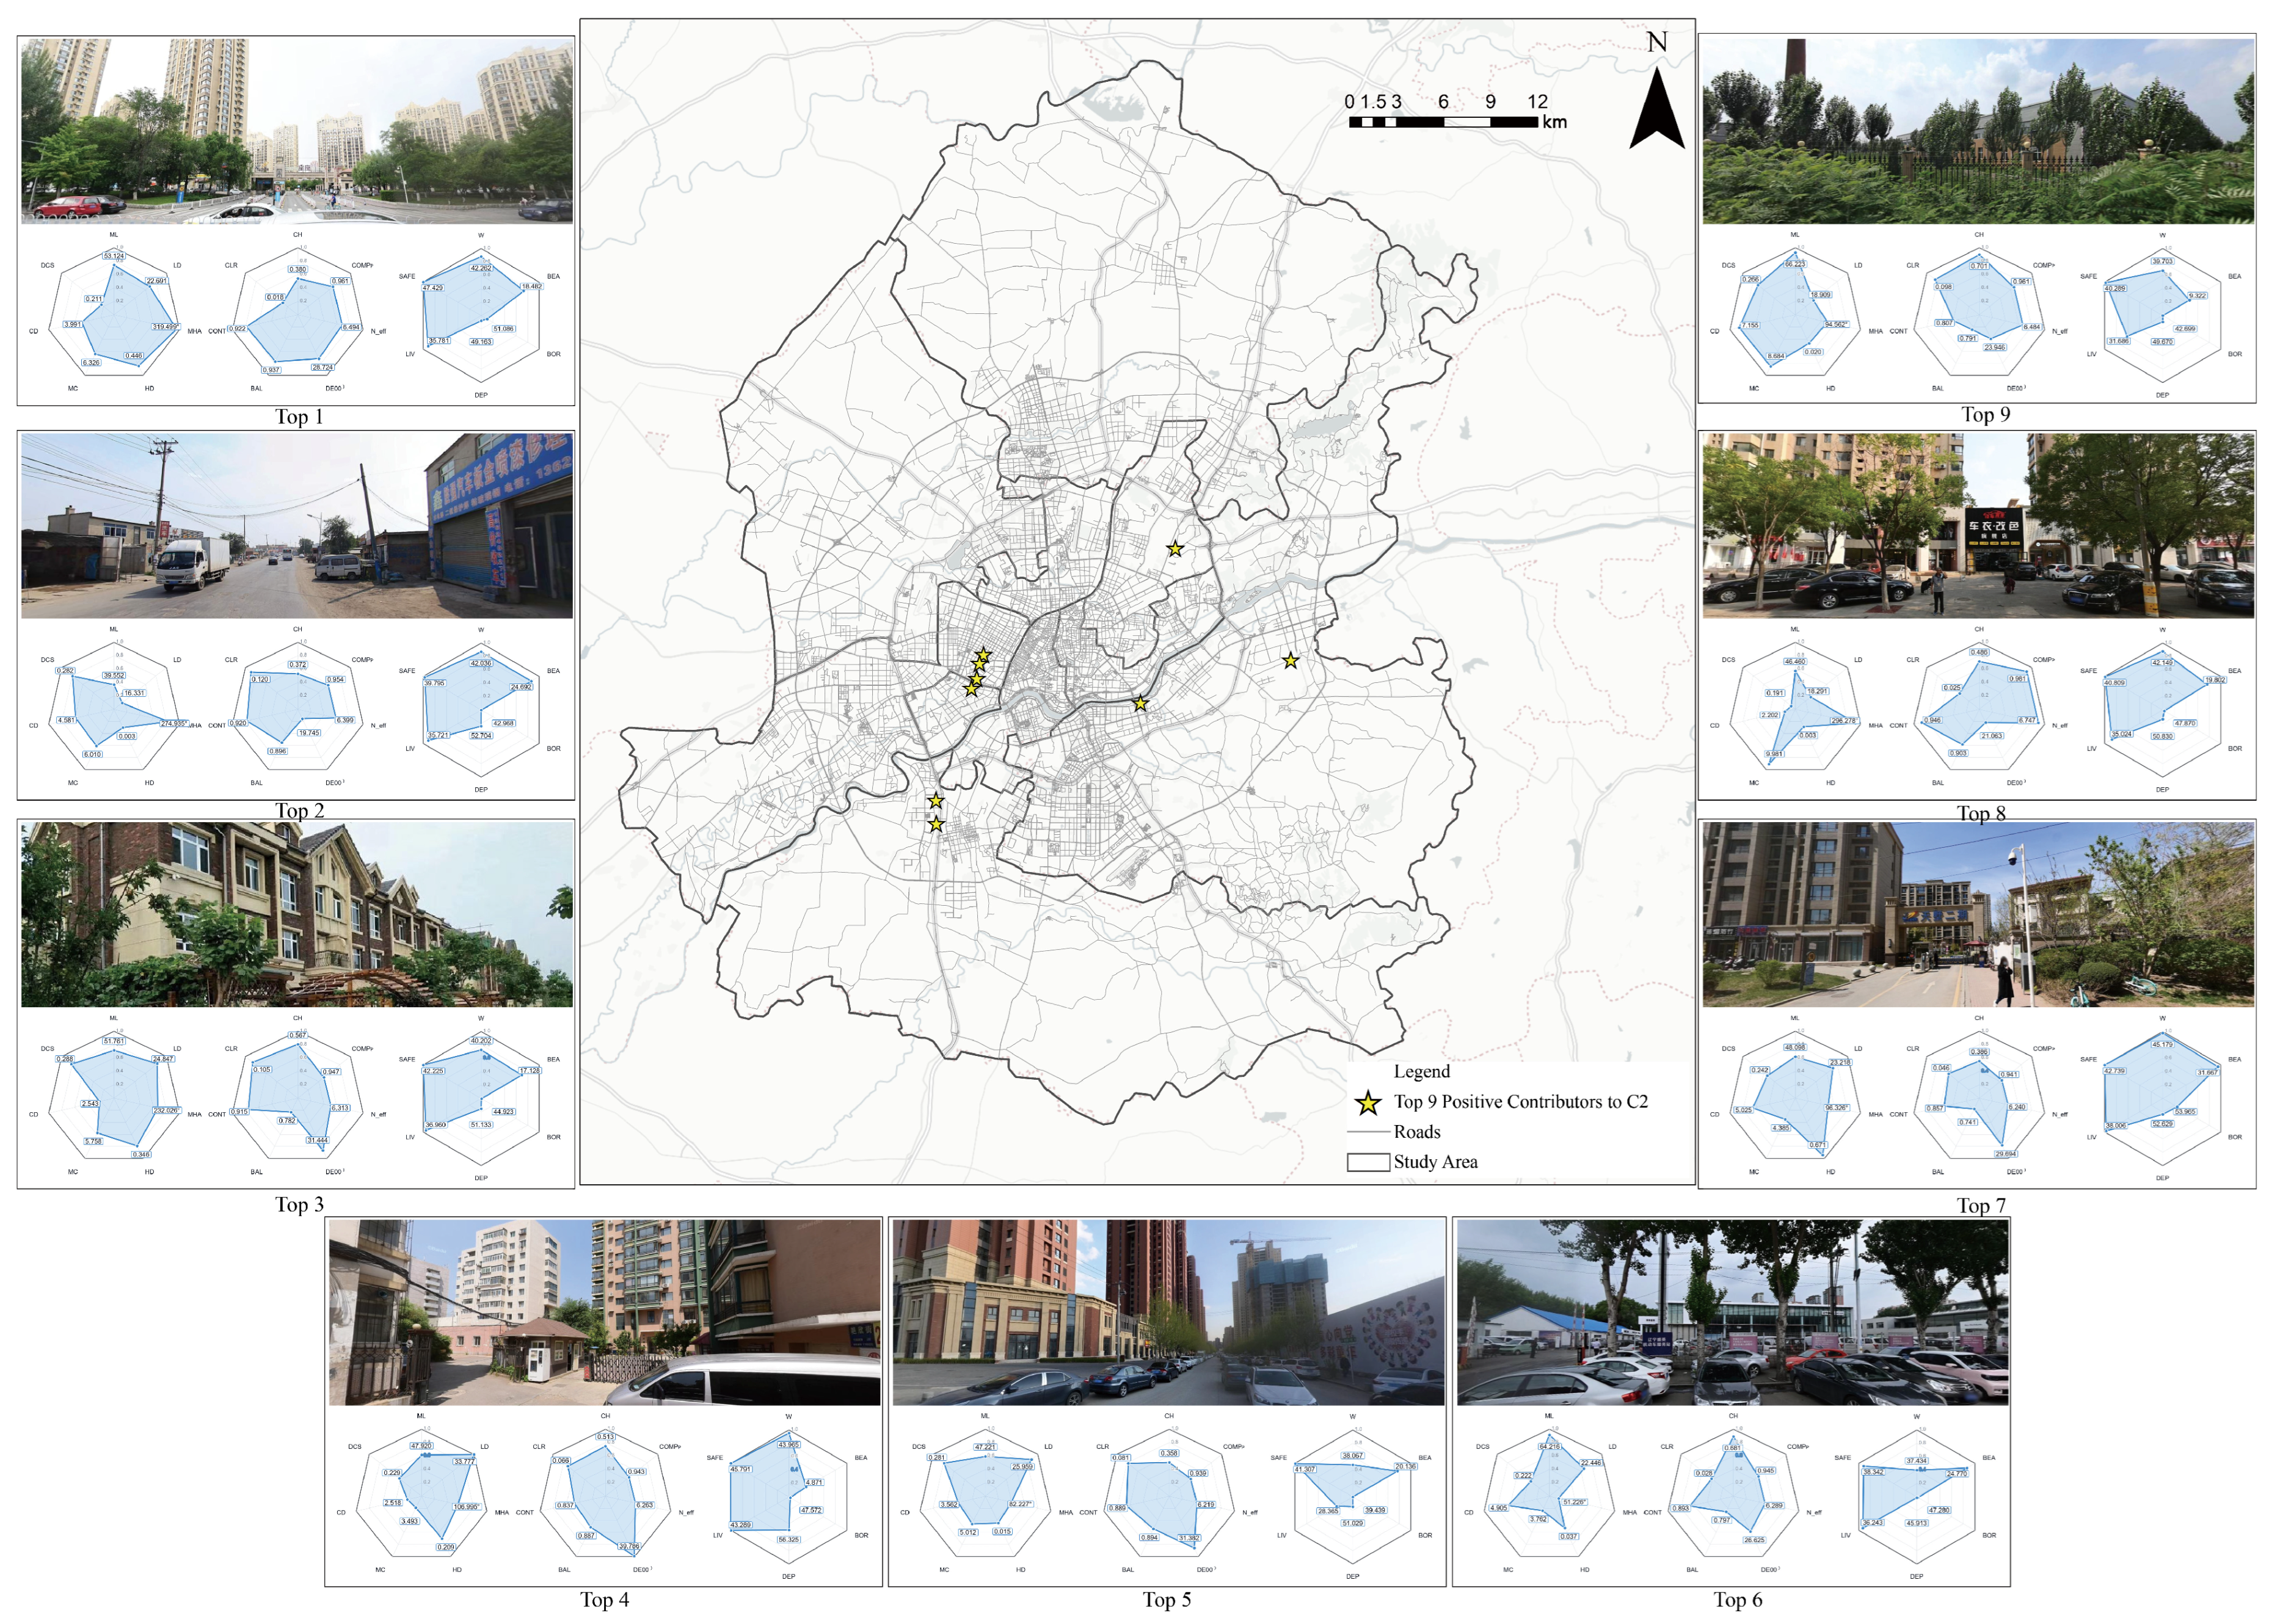
Based on the K-means results and positive- and negative-perception advantage scores, we divided typical building-color spaces into four types: C1-negative, C1-positive, C2-negative, and C2-positive. Nine locations with the most pronounced perception tendency were selected for each type (
Figure 10,
Figure 11,
Figure 12 and
Figure 13). Here, positive and negative perception refer only to relative Place Pulse model scores and do not indicate spatial quality confirmed by local residents.
C1 is the “dominant-color control–clear hierarchy” type. In C1-negative spaces, dominant color share and color hierarchy clarity were approximately at the 86th and 84th percentiles, respectively, whereas mean lightness was only at the 23rd percentile. Color complexity and the effective number of colors were at the 18th and 19th percentiles, respectively. Model-inferred boredom and depression scores were both close to the 97th percentile, while wealth and liveliness scores were below the 10th percentile. A clear dominant color therefore did not necessarily correspond to higher positive model scores. Dark, monotonous interfaces with limited secondary colors may coincide with higher negative scores. “Brightening and moderate diversification” can be considered a candidate strategy. Following field verification, this strategy could increase base-color lightness; use low- to medium-chroma warm gray, off-white, or light brown; and add small amounts of secondary color at entrances, window frames, and street-corner nodes. The dominant-color proportion and hierarchy should be retained to avoid uncontrolled color addition.
C1-positive spaces also had relatively high dominant color share and color hierarchy clarity, but mean lightness increased to the 55th percentile, while lightness dispersion remained low. Model-inferred beauty and safety scores reached the 87th and 86th percentiles, respectively. These spaces can be prioritized for verification and considered for “protective control”. A stable primary color and limited secondary-color area could be maintained, while material repair, façade cleaning, and component renewal preserve the clear and orderly color structure. Color numbers should not be increased indiscriminately during renewal, as this could undermine their simple and stable visual advantage.
C2 is the “multicolor composition–continuous richness” type. In C2-negative spaces, lightness dispersion and color contrast reached the 83rd and 81st percentiles, respectively. Color complexity and the effective number of colors were also relatively high, but hierarchy clarity was low. Model-inferred boredom and depression scores were close to the 98th and 99th percentiles, respectively, while liveliness was only at the 4th percentile. Rich colors and strong contrast without clear order may therefore coincide with higher negative model scores. “Subtractive remediation” can be considered a candidate strategy. Following field verification, this strategy could unify the building base color, reduce high-contrast areas, coordinate advertisements, shop signs, and night-time lighting, and strengthen proportions among dominant, secondary, and accent colors. Continuity between adjacent interfaces could also be improved.
C2-positive spaces had high lightness, harmony, and spatial continuity, with model-inferred safety and liveliness scores at the 98th and 83rd percentiles, respectively. These spaces can be considered candidate street segments for “coordinated diversity”. Overall order could be maintained through controls on street-segment palettes, material textures, and continuous interfaces while retaining color richness. This approach supports four preliminary strategies: brighten and optimize C1-negative spaces, protect and maintain C1-positive spaces, reduce color noise in C2-negative spaces, and guide C2-positive spaces as demonstrations. The classification-control system can be updated dynamically using street-view monitoring, field investigation, and local public evaluation.
4. Discussion
4.1. Multilevel Associations and Spatial Heterogeneity of Building Colors
Using a three-layer framework of basic building color attributes, objective color organization, and public-perception evaluation, this study analyzed stratified associations among pixel attributes, spatial organization, and model-inferred perception in Shenyang. The spatial distributions did not form a simple center-to-periphery gradient. Instead, continuous road-based distributions coexisted with local clusters in a mosaic pattern. The central urban area contained more diverse construction periods, building functions, and façade materials and had relatively high color complexity, effective number of colors, and contrast. Peripheral areas were dominated by relatively continuous residential or industrial spaces, but local high values remained around new districts, commercial nodes, and transport corridors.
The correlation analysis further showed structural associations between basic color attributes and objective organizational characteristics. Lightness dispersion was strongly correlated with color contrast (r = 0.947), indicating that internal light–dark variation on façades changed together with visual contrast. Mean lightness was strongly positively correlated with color harmony (r = 0.777), showing that samples with higher mean lightness generally had higher harmony. Dominant color share was significantly positively correlated with hierarchy clarity (r = 0.884) but negatively correlated with complexity and the effective number of colors (r = −0.834 and −0.817, respectively). A more concentrated dominant color was therefore associated with clearer color hierarchy but may also reduce color richness. Building-color quality is not determined by brightness, richness, or uniformity alone, but by a dynamic balance among identifiability, complexity, continuity, and order.
At the level of Chinese urban research, the observed road dependence and spatial heterogeneity are broadly consistent with street-segment differences reported in quantitative studies of building color in Macao [
5], multiscale evaluation of historic districts in Tianjin [
35], and hierarchical assessment of building color in Macao [
57]. This study differs by separating basic color attributes from overall color organization across continuous-road samples in central Shenyang. It also tests the relationships between color-organization types and six model-inferred perception scores. Internationally, environmental color experience is shaped jointly by materials, light, views, and atmosphere [
36], while global street-view perception models support relative inference at scale [
38]. The small perception effect sizes between the two overall color patterns are consistent with evidence that building-exterior and urban-perception evaluations also depend on function, age, location, and other built-environment factors [
61,
62]. Song and Xiao [
18] reported clearer relationships between streetscape color and urban perception, whereas the effects observed here were weaker. This difference may reflect distinct outcome definitions: their study examined specific color features, while ours compared coarse-grained types jointly formed from 14 CA and CO indicators. Differences in urban context, analytical units, covariate control, and model-training distributions may also affect effect sizes. Overall color-organization type can therefore support environmental diagnosis, but the strength of its perceptual interpretation depends on local context and model applicability.
Relative to existing research on Chinese urban color, this study explicitly separates basic building color attributes from overall color organization. Continuous-road street-view samples are then used to examine spatial patterns, typology stability, and between-type differences in perception. This provides evidence at the scale of central Shenyang for a cold-climate old industrial city. Relative to international urban-perception research, the study provides a cross-regional model application with explicit interpretive boundaries. Place Pulse-derived scores can support relative ranking and between-group comparisons within a consistent street-view sample, but they cannot replace local public evaluation without validation by local residents. These contributions support a transferable methodological principle: objective color measurement should be distinguished from model-inferred perception, and the strength of planning interpretation should match the degree of local validation.
4.2. Formation Mechanisms of the Two Color-Quality Patterns
The clustering results divided the samples into two major color-organization patterns. For interpretation, C1 can be summarized as “dominant-color control–clear hierarchy”, and C2 as “multicolor composition–continuous richness”. C1 contained 9487 samples, or 24.8% of the total. Its median dominant color share was 0.307, clearly higher than the 0.225 observed for C2, and its color hierarchy clarity was also substantially higher. At the same time, C1 had lower color complexity, effective number of colors, contrast, and spatial continuity than C2, indicating that it used fewer colors to establish a relatively clear dominant–secondary relationship. C2 contained 28,787 samples, or 75.2%, and had higher lightness, complexity, effective number of colors, and continuity, reflecting the predominance of overall palettes and multicolor combinations in Shenyang’s existing building interfaces.
In terms of effect size, the differences between the two types were concentrated mainly in dominant color share, complexity, effective number of colors, and hierarchy clarity, whereas differences in overall color harmony, balance, and hue were small. The clusters therefore did not represent two extremes of harmony versus disharmony or high versus low quality; rather, they represented two distinct color-organization logics. Cluster stability was high, with a mean ARI of 0.944 ± 0.026 across repeated subsampling, but the silhouette coefficient was only 0.214 and 27.8% of samples had a maximum fuzzy-membership value below 0.6, indicating a broad transition zone between the two types. C1 and C2 are therefore better understood as dominant patterns along a continuous color spectrum than as urban-space types with absolutely clear boundaries.
4.3. Weak Coupling Between Objective Color Features and Public Perception
Differences between the two color patterns in public perception were substantially smaller than differences in their objective indicators. Compared with C1, C2 had median beauty and safety scores that were higher by 0.615 and 0.295, respectively, while boredom and depression scores were lower by 0.630 and 0.802. However, the effect sizes of these differences were negligible. The difference in liveliness was only 0.039 and was not statistically significant (q = 0.396). The wealth score was instead 0.233 lower in C2, also without a practical effect. Streets with more complex, brighter, or more continuous colors therefore did not necessarily receive higher model-inferred wealth, beauty, or liveliness scores.
This result suggests that public perception of the street environment is jointly shaped by overall color, building form, façade maintenance, vegetation, street scale, commercial facilities, traffic conditions, and the social environment. Color can alter the visual atmosphere, but its effects are often moderated by spatial context. Rich colors with clear order and good maintenance may increase attractiveness. In contrast, rich colors accompanied by cluttered advertising, aging materials, and fragmented interfaces may create a visual burden. A unified dominant color may produce a solemn and stable place image, but low lightness and limited variation may also generate monotony. The results do not support predicting public evaluation directly from a single color indicator or inferring a simple causal relationship. Building age and maintenance may affect both façade color and visual cues such as newness and wealth. Street height-to-width ratio and sky visibility may affect both lighting conditions and depression or safety scores. Green-view ratio may influence both the overall palette and beauty or safety scores. Land use, shop signs, and traffic activity may also correspond to both color complexity and liveliness or wealth scores. Larkin et al. [
61] found that visible streetscape elements and GIS or remote-sensing variables explain only part of the variation in urban perception. Liang et al. [
62] showed that evaluations of building exteriors are influenced by contextual factors including function, age, and location. Because the present database does not contain these covariates, we report unadjusted associations and do not identify an independent color effect. Future research can integrate building age, street morphology, green-view ratio, and land-use data and apply multivariable or spatial models.
4.4. Implications for Classification Control Based on Color Quality and Perception Evaluation
The results indicate that building-color control should not set C1 or C2 as a single universal optimization target. Differentiated strategies should instead combine cluster type with positive and negative perception. C1-positive spaces can be prioritized for verification and considered for retaining stable dominant colors and clear hierarchy, without introducing excessive competing colors during renewal. In C1-negative spaces, field verification and local evaluation should precede measures that increase façade lightness, improve material maintenance, add small proportions of accent colors, or optimize night-time lighting. These measures may address monotony and oppression while preserving the existing overall color order.
C2-positive spaces can be prioritized for verification and considered for preserving overall color richness and street continuity. Liveliness may be maintained by coordinating shop-sign dimensions, material textures, and the range of the overall palette. In C2-negative spaces, field verification should precede efforts to reduce disorderly color competition, define area proportions among dominant, secondary, and accent colors, and limit large high-chroma advertisements and abrupt changes between adjacent façades. Because many transitional samples exist between the two types, practical governance should use gradual regulation rather than mechanically dividing space with rigid thresholds. Management units can expand from individual buildings to continuous street segments, using overall color continuity as an objective evaluation basis and incorporating local public evaluation. Color governance should therefore shift from prescribing a particular color to controlling relationships among colors within an adjustable framework for regional character, visual order, and public experience.
4.5. Limitations
First, the CP layer uses a Place Pulse 2.0-derived model trained on data from multiple cities. The public Chinese samples include Hong Kong and Macao but not Shenyang. This study did not conduct a survey of Shenyang residents, local retraining, or external validation. CP results therefore represent relative model-inferred perception tendencies and cannot be generalized as evaluations by Shenyang residents. Differences between the model-training distribution and Shenyang’s cultural-geographic context may affect local interpretation of the scores.
Second, the analysis did not include potential confounders such as building age and maintenance, street height-to-width ratio, sky visibility, green-view ratio, land use, shop signs, and traffic activity. It therefore identifies only unadjusted associations between overall color types and model-inferred perception scores, not an independent effect of color.
Third, data acquisition applied consistent seasonal and weather criteria and uniform color correction to the included images. Historical platform imagery may nevertheless retain residual differences caused by acquisition time, illumination, white balance, shadows, occlusion, and road accessibility. Previous research indicates that weather conditions can systematically affect street-view-based perception measurement [
63]. Although local evaluation showed usable SegFormer accuracy, boundary errors may still propagate to the color parameters.
5. Conclusions
Using street-view images from the Shenyang study area, we applied the SegFormer semantic-segmentation model to extract façade pixels and constructed a three-layer indicator system comprising basic building color attributes (CA), objective color organization (CO), and public-perception evaluation (CP). The CP layer was represented by scores inferred by the Place Pulse model. The CA layer included seven indicators: mean lightness, lightness dispersion, mean hue angle, hue dispersion, mean chroma, chroma dispersion, and dominant color share. The CO layer included seven indicators: color harmony, complexity, effective number of colors, contrast, balance, spatial continuity, and hierarchy clarity. The CP layer included six model-inferred indicators: perceived wealth, perceived beauty, perceived boredom, perceived depression, perceived liveliness, and perceived safety. After processing 56,520 street-view images, we conducted spatial, correlation, and cluster analyses on 38,274 quality-controlled valid samples and obtained the following main conclusions.
First, the colors of Shenyang’s building façades showed pronounced spatial heterogeneity and road dependence rather than a simple center-to-periphery decline. The central urban area had generally higher color complexity, effective number of colors, and contrast because of greater diversity in construction periods, building functions, façade materials, and commercial activity. Peripheral areas were relatively stable, but local high values remained around new districts, transport corridors, and functional nodes. Basic color attributes formed a clear mosaic distribution along continuous street spaces, indicating that urban building color results from the combined effects of historical development, functional layout, and renewal activity.
Second, basic color attributes were significantly associated with objective color organization. Lightness dispersion was highly correlated with color contrast, and mean lightness was strongly positively correlated with overall color harmony. Dominant color share was positively correlated with hierarchy clarity but negatively correlated with overall color complexity and the effective number of colors. A higher dominant color share was therefore associated with greater interface identifiability and clearer overall color order, but it may also reduce color richness. Overall color quality cannot be determined by a single indicator; it should be assessed by jointly considering light–dark differences, the number of colors, dominant–secondary relationships, spatial continuity, and balance.
Third, K-means clustering identified two major patterns of overall color organization. C1, accounting for 24.8% of the samples, was the “dominant-color control–clear hierarchy” type, with a higher dominant color share and clearer overall color hierarchy but lower complexity, effective number of colors, contrast, and continuity. C2, accounting for 75.2%, was the “multicolor composition–continuous richness” type, with higher overall color complexity, effective number of colors, lightness, and spatial continuity. The clustering had high repeated-sampling stability, but the silhouette coefficient was 0.214 and a number of boundary samples remained, indicating that the two types were dominant patterns along a continuous color spectrum rather than rigidly separated categories.
Fourth, differences between the two overall color patterns were generally weak across the public-perception indicators inferred by the Place Pulse model. C2 had slightly higher model-inferred beauty and safety scores and slightly lower boredom and depression scores. However, all six effect sizes were negligible, and the difference in liveliness was not statistically significant. Objective overall color structure therefore cannot independently explain model-inferred perception scores or replace direct evaluations by Shenyang residents. Building form, maintenance, vegetation, street scale, commercial facilities, and the social environment may all affect the results. Building-color governance should avoid equating overall color richness or dominant-color uniformity with high quality and should instead apply differentiated control based on the specific place and local perception feedback.
Overall, this study connected basic building color attributes, overall color organization, and model-inferred perception through distinct measurement layers and tested their associations using a large street-view sample. For research on Chinese urban color, CAOP provides a quantitative workflow for measuring building color, identifying overall color types, and screening candidate street segments along continuous roads in the Central Urban Area. For international urban-perception research, the Shenyang case shows that a cross-regional model can support relative comparisons within a consistent street-view sample. Without local resident validation, however, its outputs should not be interpreted as local public evaluations. In planning applications, objective color types and model-inferred perception scores can serve as preliminary diagnostic evidence. Renewal measures should then be determined through field verification and local public surveys. These conclusions apply to the street-view coverage of the Central Urban Area of Shenyang shown in
Figure 1. Cross-city transferability and the validity of public-perception interpretations require further testing in other cities and through local surveys.