1. Introduction
Air-entraining agents (AE) have long been added to concrete for one main reason: they make fresh concrete easier to place and hardened concrete far more resistant to freeze–thaw cycling, usually without sacrificing much strength [
1,
2]. The mechanism is fairly well understood: AEs are amphiphilic molecules that stabilize a network of fine, discrete air bubbles throughout the paste, which refines the pore structure and lowers the degree of saturation the concrete can reach [
3]. Anionic surfactants dominate commercial use, mainly because they are inexpensive and their performance is predictable [
4].
What is less well understood is how that same air void network behaves when the concrete is exposed not to frost, but to fire. Concrete does not burn, but it degrades substantially when heated, losing strength, stiffness, and impermeability, and it can spall or even collapse progressively during a severe fire, at a cost measured in lives as well as money [
5,
6]. Despite this, the specific question of how air entrainment changes fire performance has received comparatively little direct study [
7,
8].
Recent studies on thermally damaged geomaterials have demonstrated that macroscopic performance losses should be interpreted together with microstructural damage evolution. Investigations of red sandstone subjected to high-temperature exposure and subsequent cooling have shown that physicochemical transformations, pore development, and thermally induced cracking collectively govern macroscopic deterioration [
9]. Similarly, computed tomography-based examination of high-temperature granite exposed to liquid nitrogen thermal shock has demonstrated the importance of quantitatively characterizing internal crack initiation, propagation, and connectivity [
10]. Although the material composition and thermal boundary conditions of natural rocks differ from those of cement-based composites, these studies provide a relevant methodological framework for connecting temperature-induced macroscopic degradation with microscale damage. For air-entrained concrete, such an approach is particularly important because entrained pores may modify local stress concentrations, vapor pressure development, and crack trajectories during heating and cooling.
Recent investigations have demonstrated that the deterioration of thermally exposed geomaterials should be interpreted by considering the combined evolution of their physical, mechanical, and mineralogical characteristics. Lin et al. [
9] reported that high-temperature exposure and subsequent cooling substantially affected the mass, volume, P-wave velocity, strength, elastic modulus, and mineralogical characteristics of red sandstone. These results indicate that macroscopic performance losses are closely associated with temperature-induced changes in mineral structure and internal damage. Using X-ray computed tomography, skeletonization, and texture analysis, Li et al. [
10] further demonstrated that thermal shock promoted the development of initially isolated cracks into increasingly tortuous and interconnected fracture networks in high-temperature granite. Although natural rocks differ compositionally from cement-based materials, these findings highlight the importance of combining macroscopic property measurements with microstructural and three-dimensional damage characterization.
Part of the difficulty is that concrete’s response to heat is not simple. Cement paste, water, and aggregate each react differently: aggregate tends to expand upon heating while hardened paste tends to shrink beyond a certain temperature, and the resulting mismatch drives internal stress and cracking [
11,
12]. Aggregate type matters a great deal here; sandstone, for instance, shrinks and can partly offset the expansion of quartz, but this often comes at the cost of considerable strength loss [
11,
13], whereas lightweight aggregates such as pumice or expanded clay tend to resist fire better and conduct less heat than denser mixes [
11,
14,
15].
FEM and ANNs represent two complementary modeling approaches. FEM solves heat transfer and mechanical equilibrium equations to determine the spatial and temporal response of concrete during fire. However, it requires temperature-dependent thermal and mechanical properties, boundary conditions, and experimental calibration. An ANN directly establishes nonlinear relationships between measured inputs and outputs but does not explicitly represent the underlying physical mechanisms. In this study, an ANN was selected because the objective was to predict six residual material properties using temperature and air content, rather than to simulate the transient thermo-mechanical response of a structural member. Therefore, the developed ANN models complement but do not replace physics-based FEM analysis.
The broader literature backs this up with fairly consistent numbers. High-performance mortars have shown marked strength loss after exposure to 600 °C, particularly when cooled in water [
16,
17]; normal- and high-strength concretes have lost more than 60% of their compressive strength by 800 °C, with the modulus of elasticity following a similar path downward [
18,
19]; and flexural strength has repeatedly come out more temperature-sensitive than compressive strength [
16]. Left unaddressed, this kind of deterioration can shorten a structure’s service life considerably, which is why material selection and insulation are usually the first lines of defense [
20,
21,
22,
23].
Given how nonlinear this behavior is, and how little is known specifically about air-entrained mixes, this study characterizes six thermal, physical, and mechanical properties of air-entrained concrete: thermal conductivity, compressive strength, flexural strength, dynamic modulus of elasticity, ultrasonic pulse velocity, and dry unit weight, after exposure to temperatures up to 700 °C under two cooling regimes. A dedicated ANN model is then built for each property, with the aim of giving engineers a fast, non-destructive way to estimate the residual performance of this type of concrete after a fire.
2. Materials and Methods
Ordinary Portland cement (CEM I 42.5) from the Aşkale Cement Plant in Erzurum, Turkey, was used throughout, meeting EN 197-1 [
24] with a specific surface of 3410 cm
2/g and a specific gravity of 3.13; its full chemical and physical profile is given in
Table 1. The air-entraining agent was Sika AER (properties in
Table 2), and a Sika superplasticiser (SP) was added at 1% of the cement mass, compatible with ASTM C494 Type F [
25].
All mixtures used a water-to-cement ratio of 0.35. River sand (specific gravity of 2.31) and crushed stone (2.40) served as fine and coarse aggregates.
Table 3 lists the full proportions for each of the three mixes. Batching was carried out in a laboratory counter-current mixer, with 5 min of continuous mixing per batch. In addition to the unheated 23 °C reference, seven target temperatures were used: 100, 200, 300, 400, 500, 600, and 700 °C, to trace how AE content affects concrete performance as exposure severity increases.
The adopted constant-rate heating and immediate cooling procedure was designed to provide controlled and comparable laboratory conditions; it does not, however, reproduce the non-linear heating rate, thermal gradients, variable fire duration, and prolonged natural cooling stage associated with real building fires or standard fire curves, and the present exposure regime should therefore be regarded as a laboratory thermal treatment scenario rather than a direct simulation of an actual structural fire.
The investigated mixtures were designed to have nominal total fresh-concrete air contents of approximately 2%, 4%, and 6%. The control mixture contained no intentionally added air-entraining agent; its approximately 2% air content resulted from naturally entrapped air generated during mixing and placement. The AE-4 and AE-6 mixtures contained intentionally entrained air, achieved using AE addition rates of 0.386 and 0.795 kg/m3, respectively. Thus, the labels AE-4 and AE-6 denote nominal total fresh-concrete air contents and not AE dosages expressed as percentages of cement or binder mass.
The nominal air contents of 4% and 6% were selected to represent moderate and relatively high air-entrainment levels relative to the control concrete. The 6% level was adopted as the upper experimental boundary because further increases in air content were expected to cause a progressively greater reduction in effective load-bearing area and ambient mechanical strength. It is not proposed as a universal maximum for structural concrete, since the acceptable air content depends on strength requirements, exposure conditions, aggregate size, workability, air void characteristics, and the applicable specification.
The control mixture contained no intentionally added air-entraining agent. Its approximately 2% total air content represents naturally entrapped air generated during mixing, placement, and compaction. The AE-4 and AE-6 mixtures contained AE addition rates of 0.386 and 0.795 kg/m3, respectively, and were designed to achieve nominal total fresh-concrete air contents of approximately 4% and 6%. Accordingly, “control” refers to zero intentional AE addition rather than zero total air content.
The total air content of the fresh concrete was not independently measured using a pressure method such as ASTM C231/C231M [
26]. Consequently, the air content levels of approximately 2%, 4%, and 6% are reported as nominal experimental levels rather than measured values. The control mixture contained no intentionally added AE, whereas AE was added at rates of 0.386 and 0.795 kg/m
3 in the AE-4 and AE-6 mixtures, respectively.
The experimental matrix was not fully factorial with respect to air content and cooling regime. Both air and water cooling were investigated for the control concrete, whereas the concretes with nominal air contents of 4% and 6% were tested only after air cooling. Accordingly, the direct effect of cooling regime can be evaluated only for the control mixture. The present data cannot be used to determine an interaction effect between cooling regime and entrained-air content.
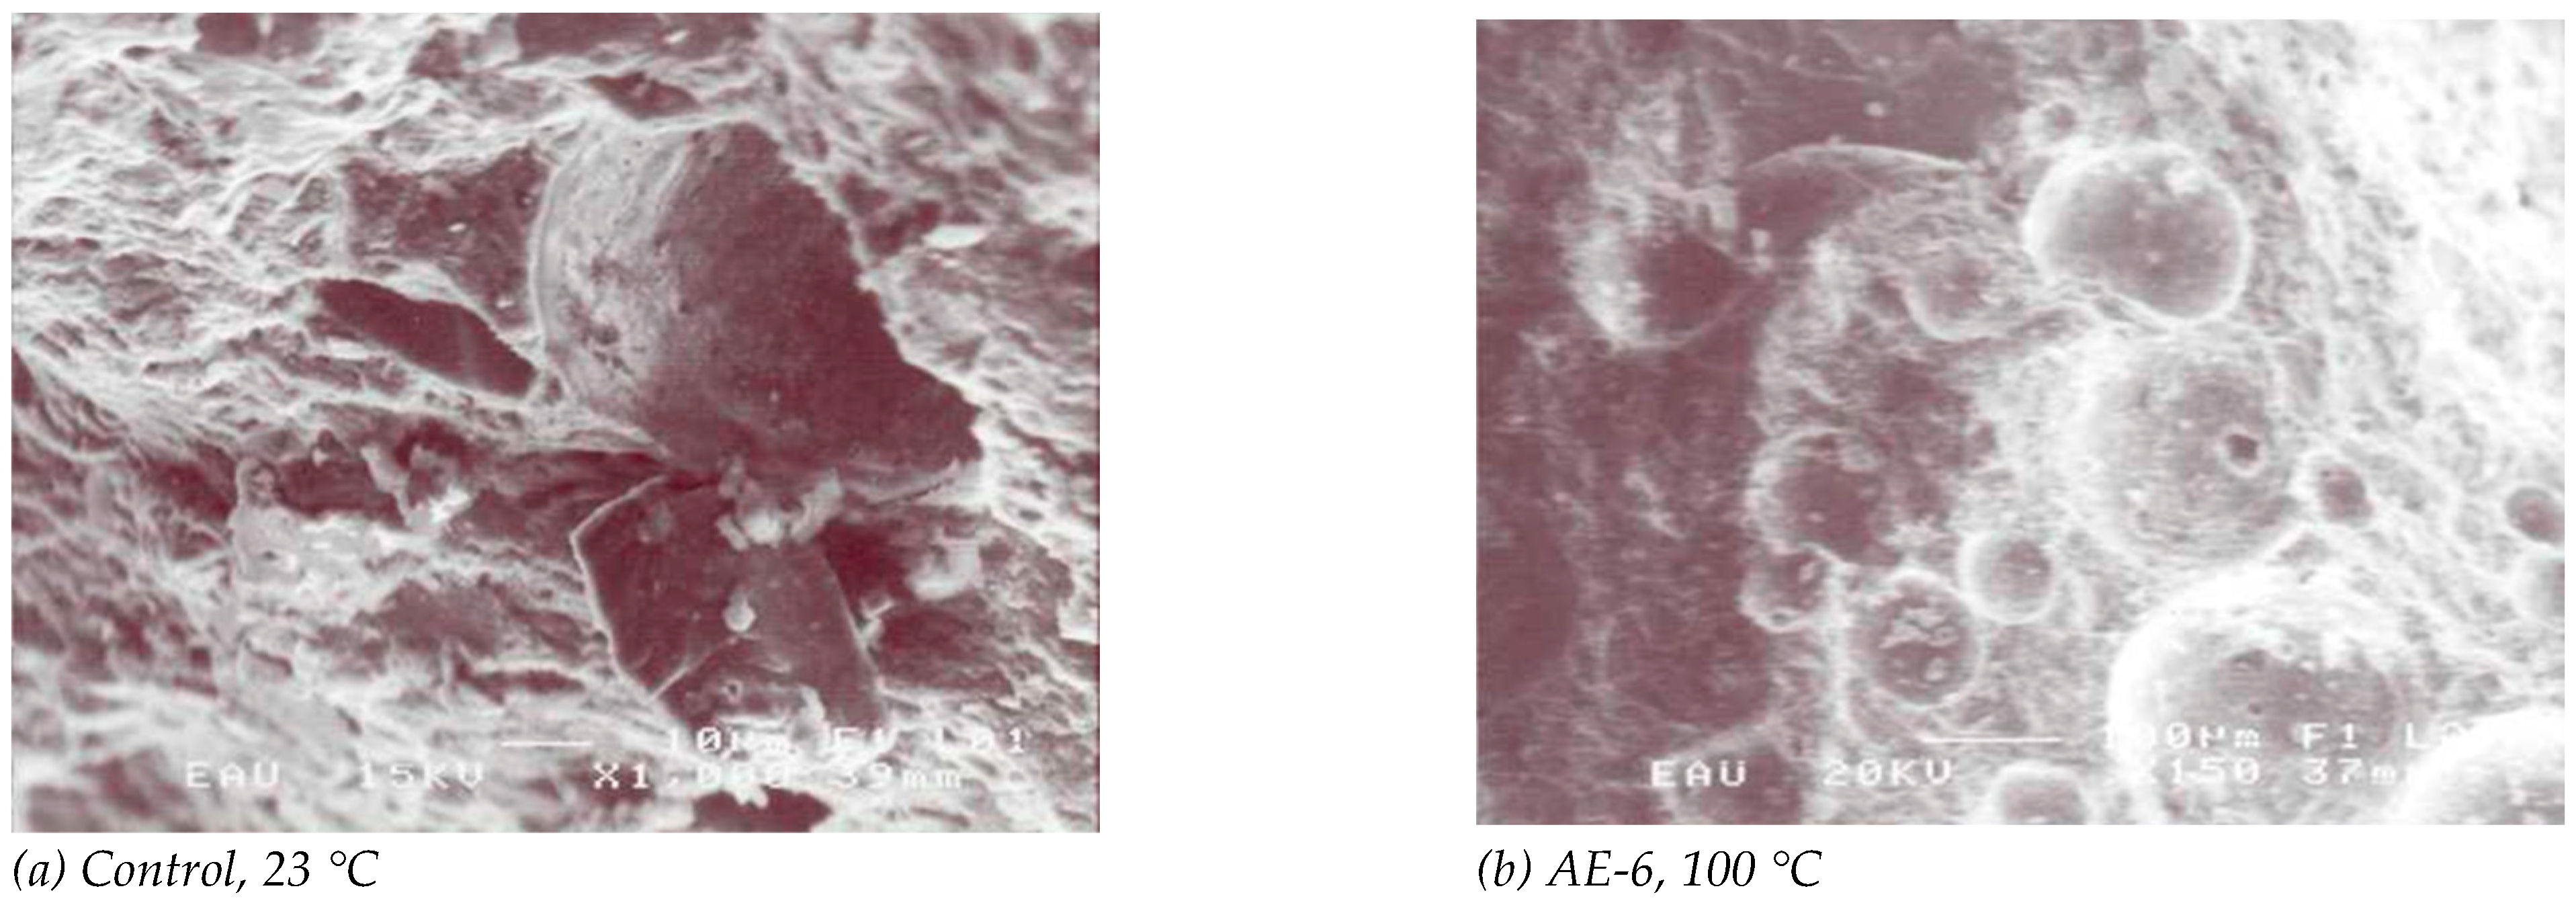
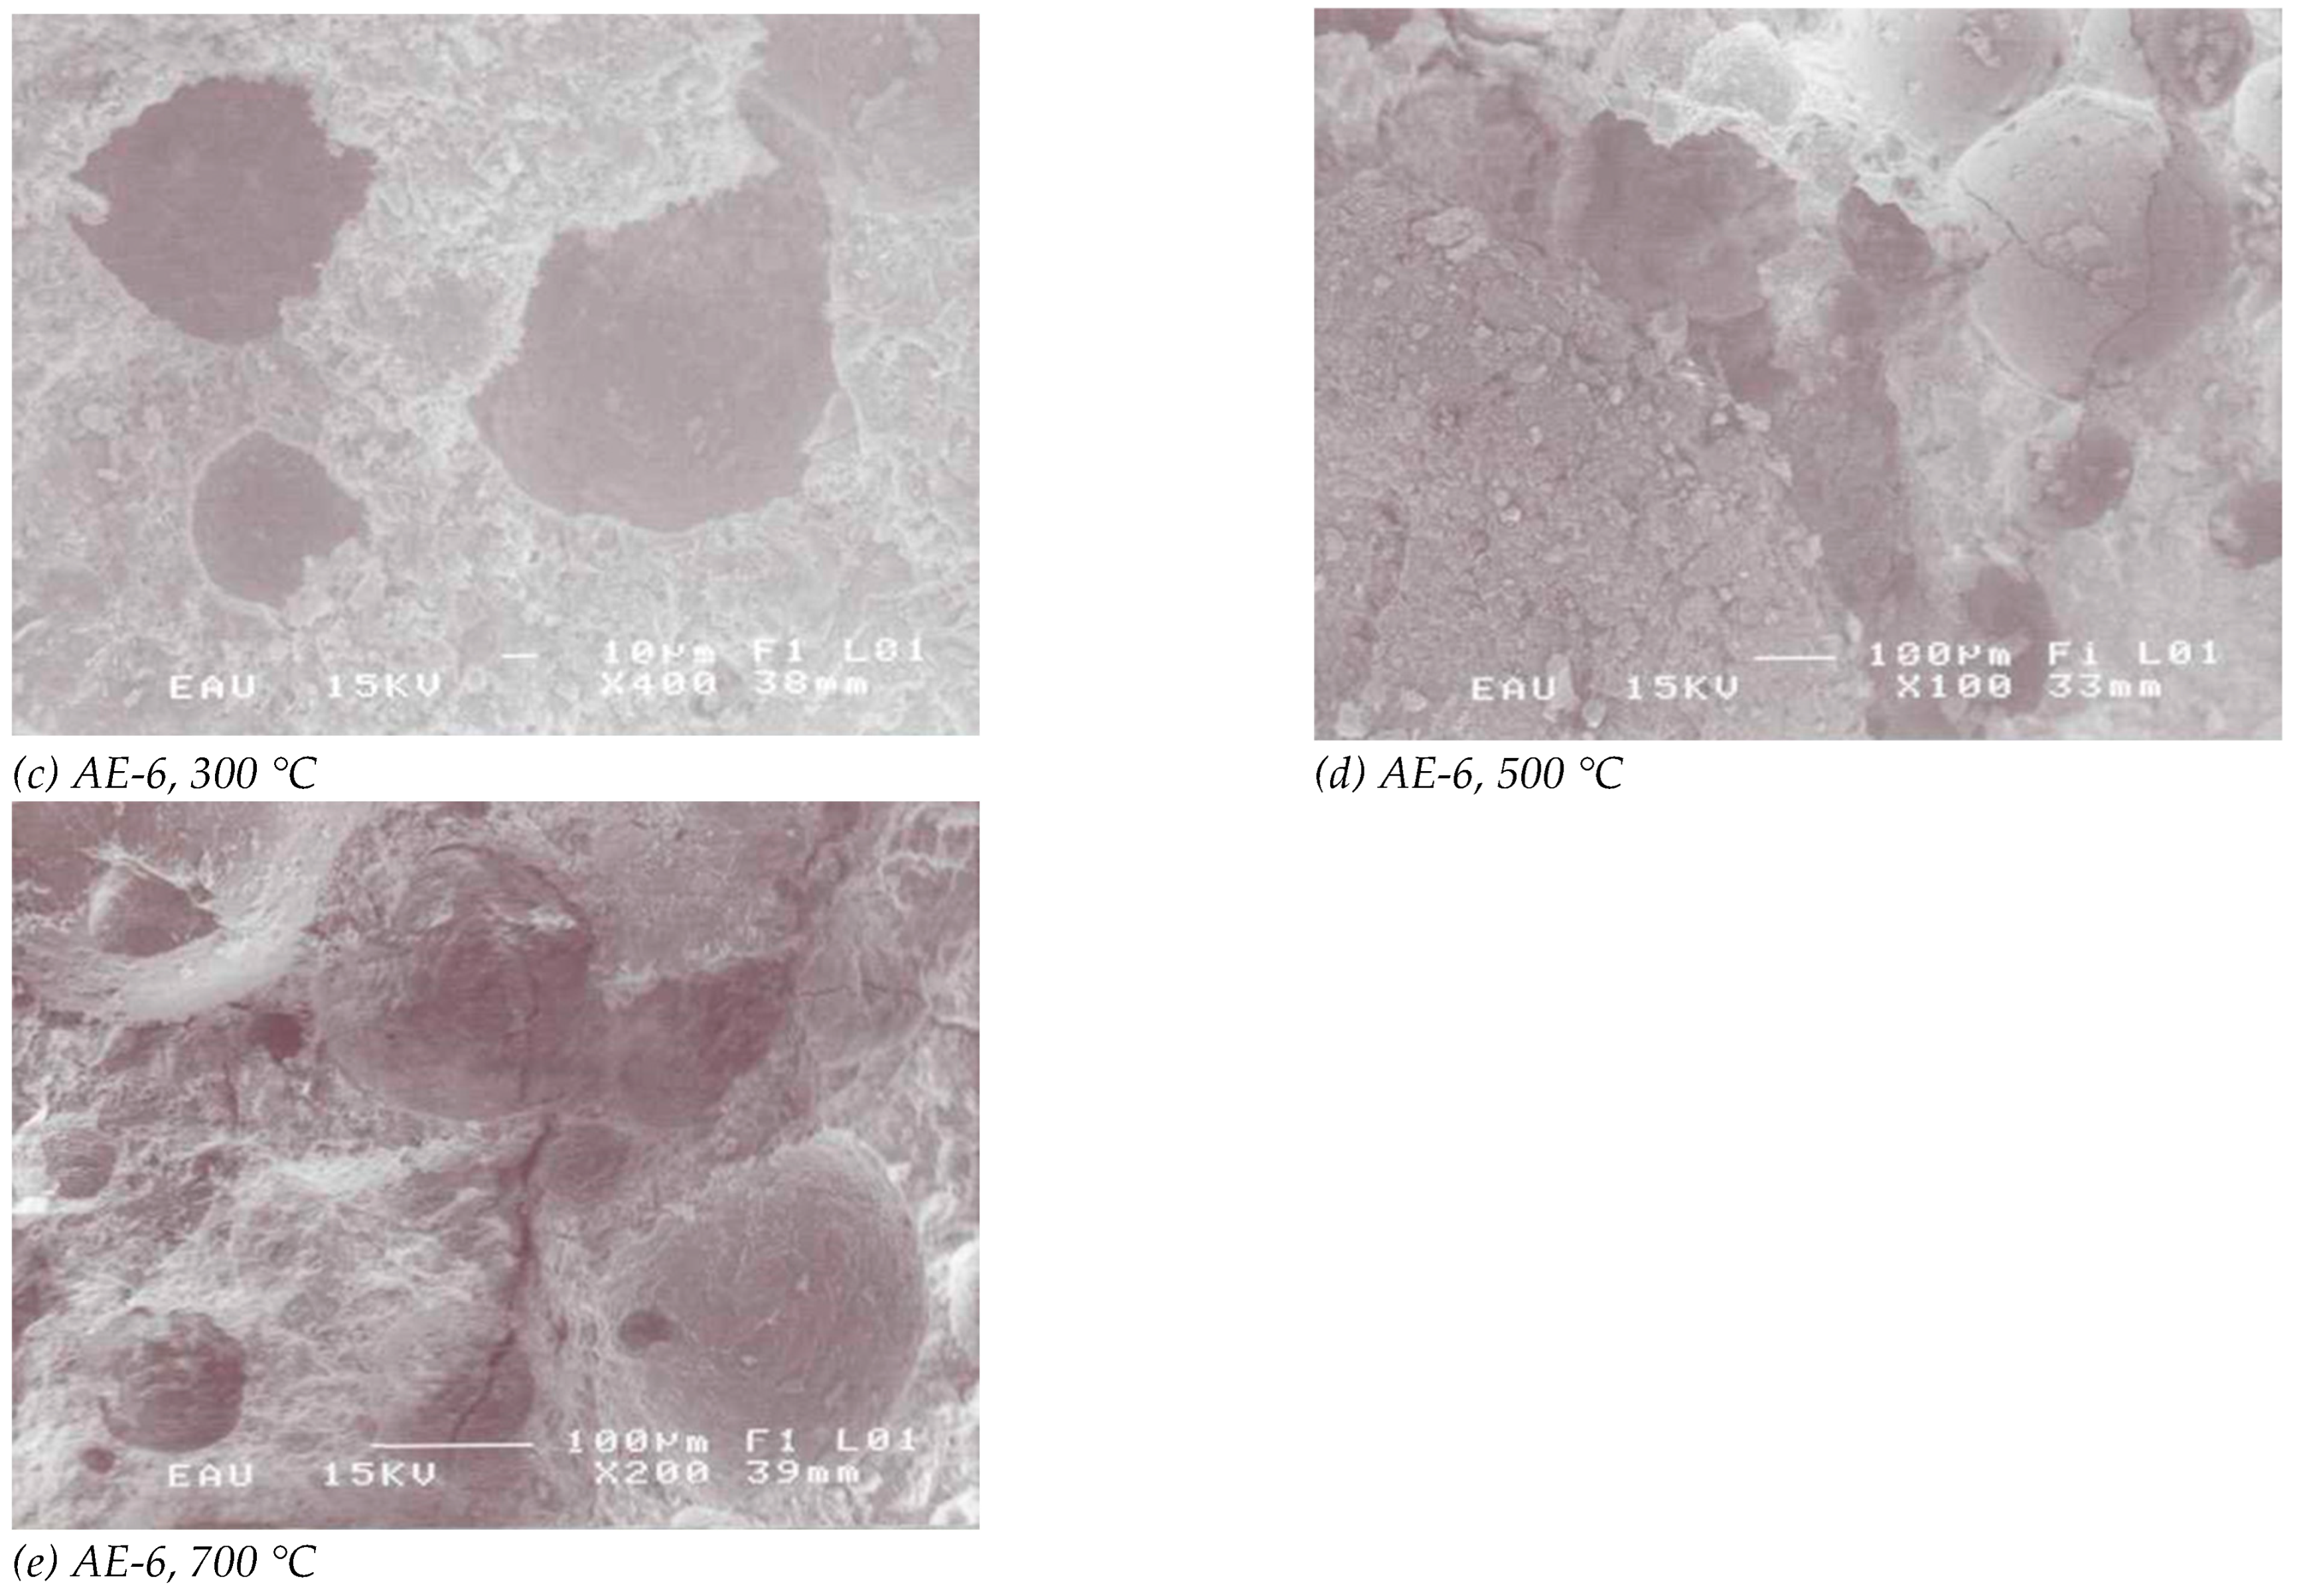
SEM examinations were conducted on both the control concrete and the concrete containing AE-6 at selected exposure temperatures. Small fragments were collected from representative interior regions of the specimens, avoiding visibly contaminated and excessively loose surface material. The specimens were initially vacuum-dried and subsequently coated with gold–palladium (Au–Pd) for 75 s. Liquid carbon was applied between each specimen and the specimen holder to improve electrical conductivity. SEM observations were performed using a JEOL JSM-6400 microscope (Japan Electron Optics Laboratory Co., Ltd., Tokyo, Japan) at the R&D Laboratory of the Department of Mechanical Engineering, Faculty of Engineering, Atatürk University. Images were obtained at comparable magnifications to qualitatively evaluate matrix deterioration, pore morphology, microcrack development, and possible interactions between cracks and entrained pores. The SEM assessment was qualitative; crack density, crack width, pore size distribution, and three-dimensional crack connectivity were not quantitatively determined.
Three 70 × 70 × 280 mm prisms and three 100 × 200 mm cylinders were cast per mix. Specimens were moist-cured for one day, then stored in lime-saturated water at 23 ± 1 °C. Following high-temperature exposure and the specified cooling procedure, the specimens assigned to thermal conductivity testing were oven-dried at 110 ± 10 °C until the daily mass loss was less than 0.5%. The specimens were then tested immediately after oven-drying. This conditioning procedure was applied only before the thermal conductivity measurement to minimize the influence of residual moisture and did not represent the moisture condition of the specimens at the beginning of heating [
27]. Surfaces were smoothed before testing, and conductivity was measured with a QTM-500 quick thermal-conductivity meter (Kyoto Electronics Manufacturing Co., Kyoto, Japan), which applies the hot-wire method specified in ASTM C1113-90 and offers a working range of 0.0116–6 W/mK, with ±5% precision and ±3% reproducibility [
28].
After casting, the specimens were moist-cured for the first 24 h. They were then demolded and cured in lime-saturated water at 23 ± 1 °C until the age of 28 days. No oven-drying procedure was applied before high-temperature exposure. The high-temperature tests commenced at a specimen age of 28 days. However, the internal moisture content of the specimens was not directly measured immediately before heating.
At 28 days, specimens were heated to their target temperature (100–700 °C) over 2 h at a rate of 10–20 °C/min. Two cooling regimes were then applied: laboratory air cooling or direct immersion in water, in both cases down to 20 °C. To isolate the effect of the cooling method from that of AE content, the two regimes were compared side by side only for the control mixture; the 4% and 6% AE mixes were evaluated under air cooling alone. Once cooled, prisms were tested for compressive and flexural strength following ASTM C39 and ASTM C348, respectively.
The furnace program was designed as a controlled material characterization procedure rather than as a simulation of a complete compartment fire. Accordingly, it does not reproduce the non-linear time–temperature history, thermal gradients, loading, restraint, or cooling phase of an actual structural fire. The specimens were heated to the target temperature under a non-constant heating regime, with a relatively high initial heating rate that gradually decreased as the target temperature was approached. The target temperature was then maintained for 2 h before the specified cooling regime was applied.
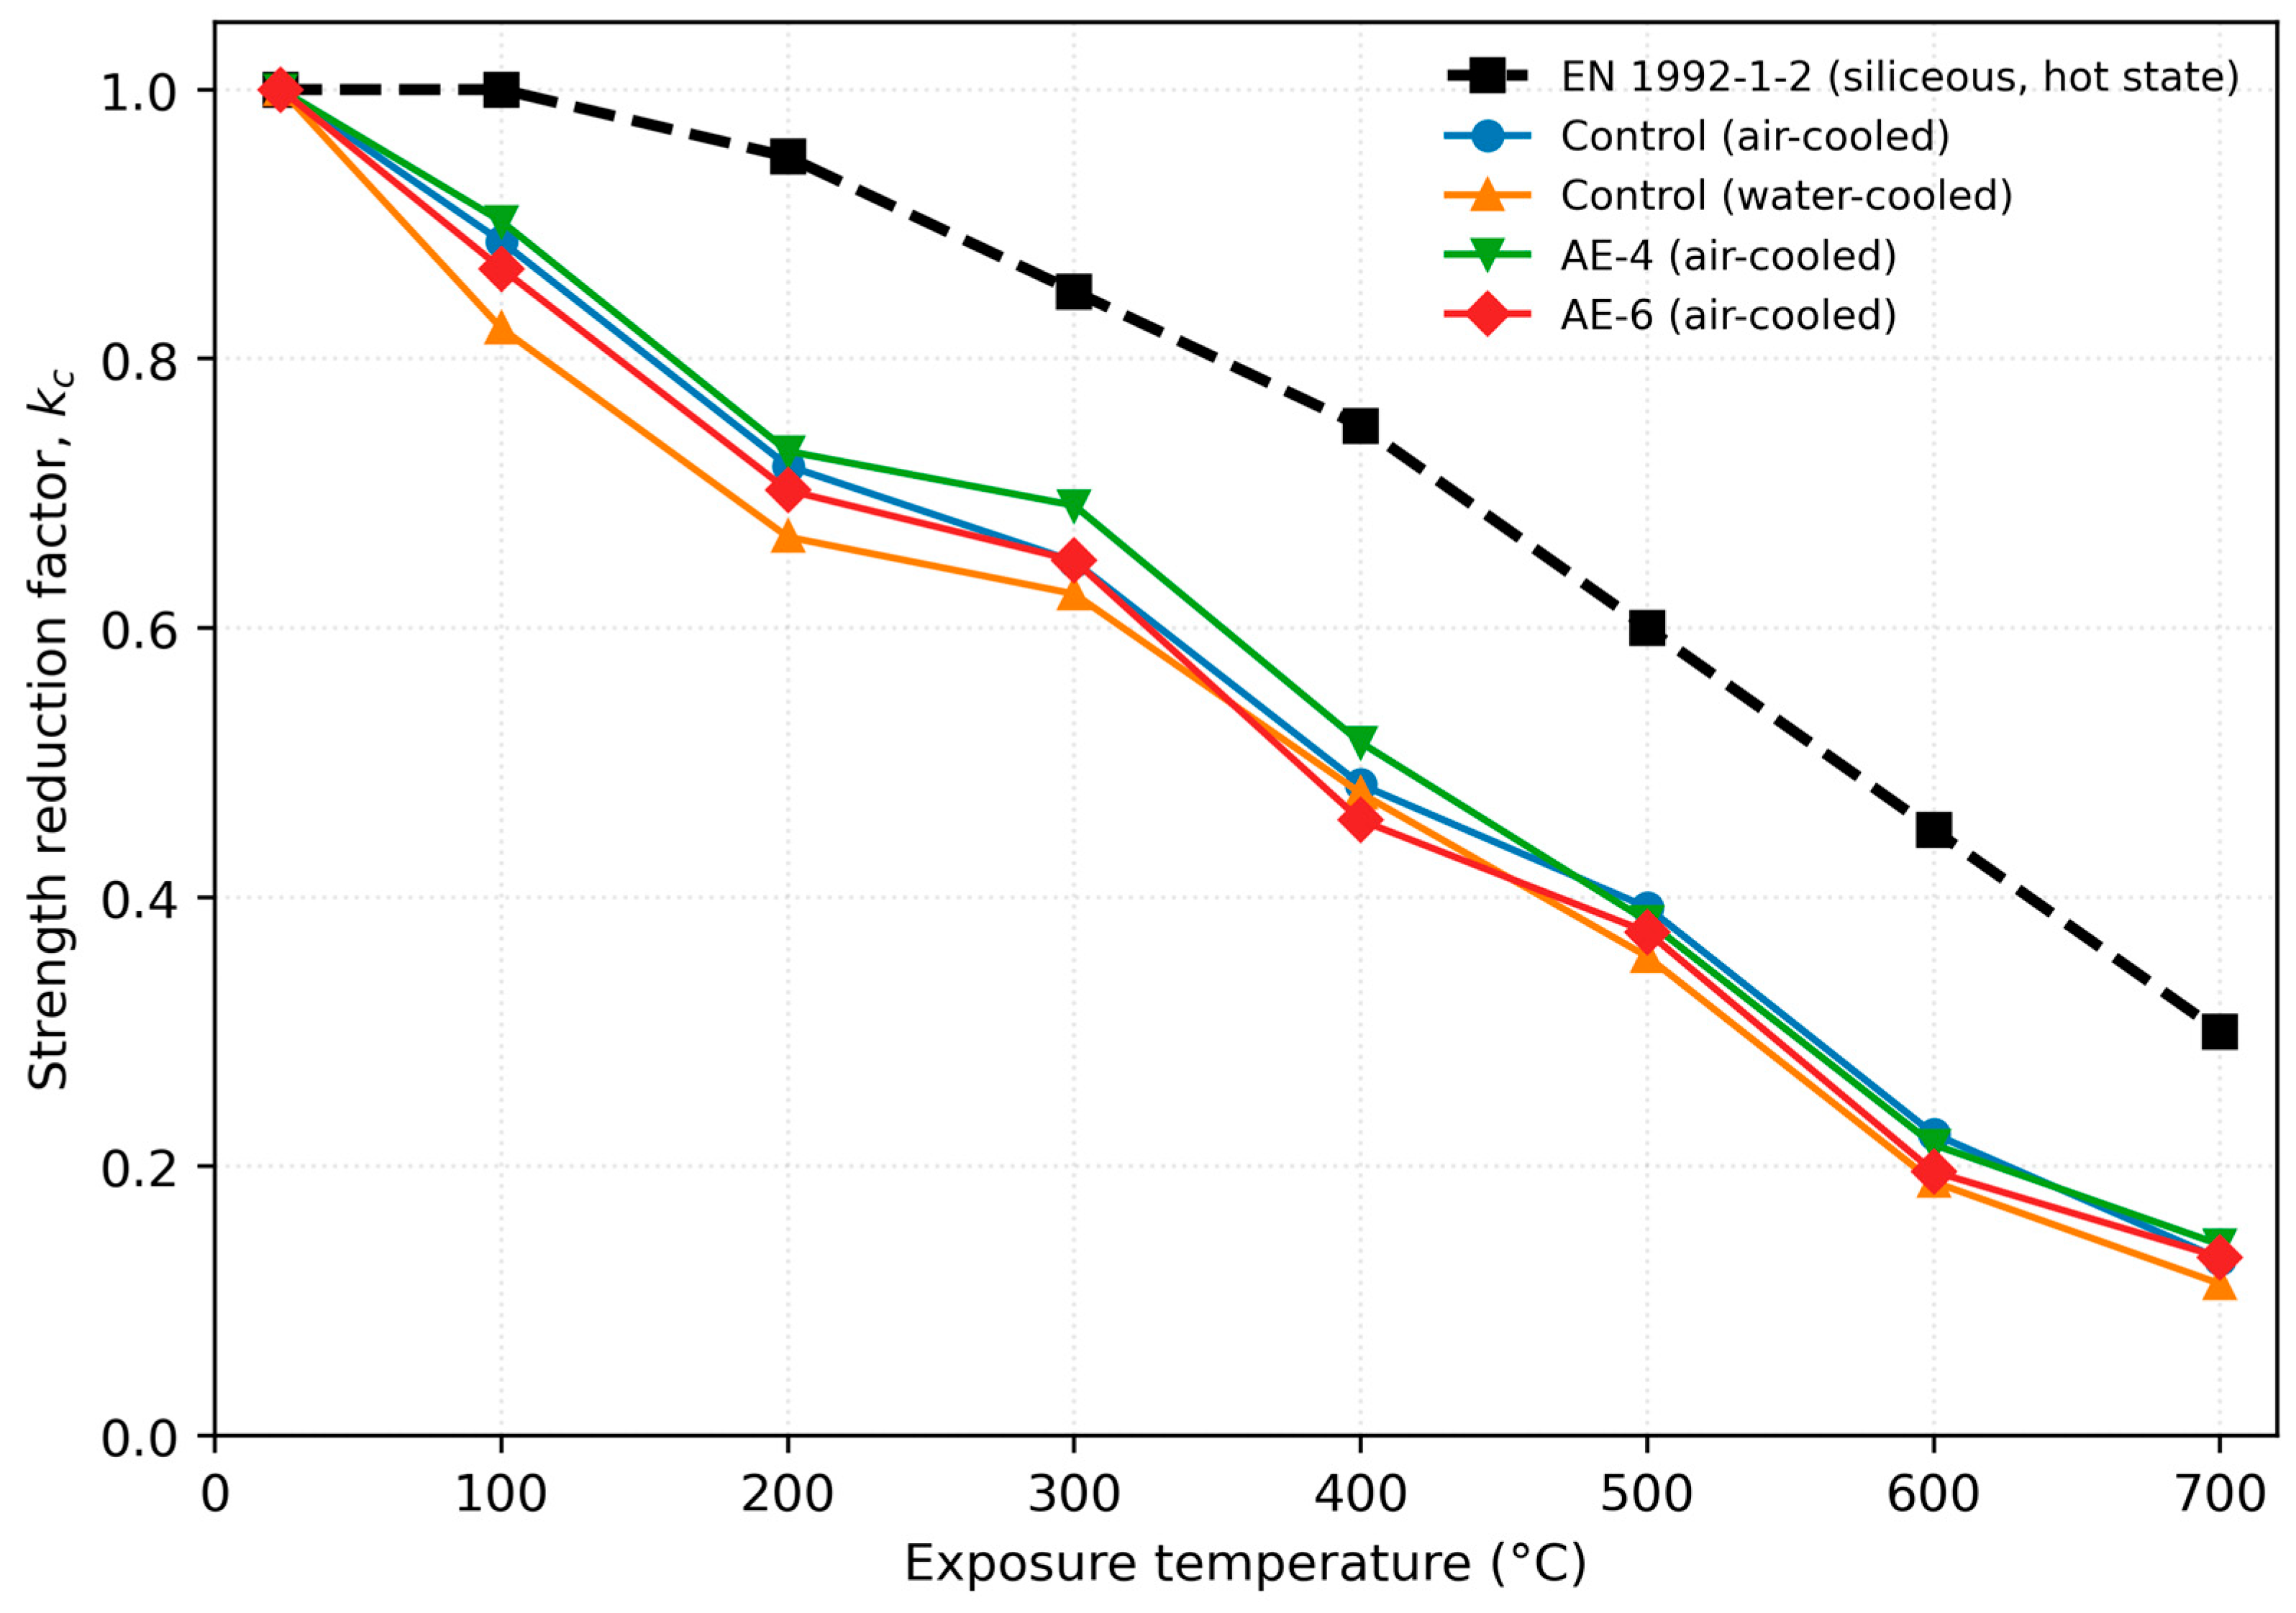
The experimental compressive strength reduction factor was calculated as kc,exp(T) = fc,T/fc,23, where fc,T is the residual compressive strength after exposure to temperature T, and fc,23 is the corresponding strength at 23 °C. The reduction factors were subsequently compared with the temperature-dependent relationships given in EN 1992-1-2 [
29] for normal-weight concrete (
Section 3.10).
To compare the temperature sensitivity of the investigated properties independently of their different units and initial values, the residual property ratio was calculated as follows:
where R
p(T) is the residual value of property (P
t) after exposure to temperature (T), expressed as a percentage; (P
t) is the measured value after exposure to temperature (T); and (P
23) is the corresponding value measured at 23 °C for the same concrete mixture and cooling condition.
The 23 °C value was used as the reference for thermal conductivity, compressive strength, flexural strength, and UPV. Because measurements at 23 °C were unavailable for dynamic modulus and dry unit weight, their values at 100 °C were used as the respective references.
2.1. Application of the Artificial Neural Network Model
Exposure temperature and nominal air content level were selected as the two ANN input variables, while thermal conductivity, compressive strength, flexural strength, UPV, and dynamic modulus of elasticity were modeled separately as output variables. The nominal air content input represents the experimental mixture classes of approximately 2%, 4%, and 6%, and not the AE addition rate. The water-to-cement ratio, binder composition, aggregate system, curing procedure, and exposure duration were maintained as constants and were therefore not included as model inputs. Because these parameters were not independently varied, their effects cannot be identified by the present models. The ANN models were developed using the air-cooled dataset because both cooling regimes were not available for every nominal air content level. Water-cooled control results were excluded from ANN training to avoid treating observations obtained under different cooling conditions as equivalent when the cooling regime was not included as an input variable.
Several algorithms exist for training artificial neural networks, including standard backpropagation, conjugate gradient descent, quasi-Newton methods, fast propagation, and the Levenberg–Marquardt (LM) algorithm. Backpropagation is probably still the most common choice, but its gradient-descent variants can be slow to converge and often need very small learning rates to remain stable [
30]. LM, a Newton-type method built specifically to minimize sums of squared nonlinear residuals, gave the best results here and was used to train every model in this study.
Before training, every input and output variable was rescaled to the [0, 1] range using the min–max transform in Equation (1), where H
max and H
min are the maximum and minimum of a variable H, and H′ is its normalized value.
All networks were built and trained in Statistica. Because the available datasets comprise 24 observations (21 for the dynamic modulus of elasticity), a fixed partition into training, validation, and test subsets would leave too few observations in each subset for the resulting statistics to be stable. Model selection and accuracy assessment were therefore carried out using leave-one-out cross-validation. Each observation was predicted in turn by a network trained on the remaining observations, and the min–max normalization limits of Equation (2) were recomputed within each training fold so that no information from the held-out observation entered the scaling. The number of hidden neurons was varied from 1 to 10 for every property, and the final architecture was selected as the smallest network whose cross-validated root mean square error was within 5% of the minimum obtained across the sweep. This criterion favors the simplest model consistent with the data and avoids selecting network complexity on the basis of fitting performance alone. Both fitting and cross-validated statistics are reported in
Table 4. The cooling regime could not be included as a third input variable because water cooling was applied only to the control concrete; a cooling regime input would therefore be confounded with nominal air content over most of the design space. All ANN models consequently apply to air-cooled specimens only.
2.2. Evaluation of Artificial Neural Network Models
Three metrics were used to judge each model: the coefficient of determination (R2), the root mean square error (RMSE), and the mean square error (MSE), all defined in Equation (3), where tmi and tgi are the ith measured and predicted values, and N is the number of data points.
Root mean square error (RMSE):
3. Results and Discussion
3.1. Dry Unit Weight
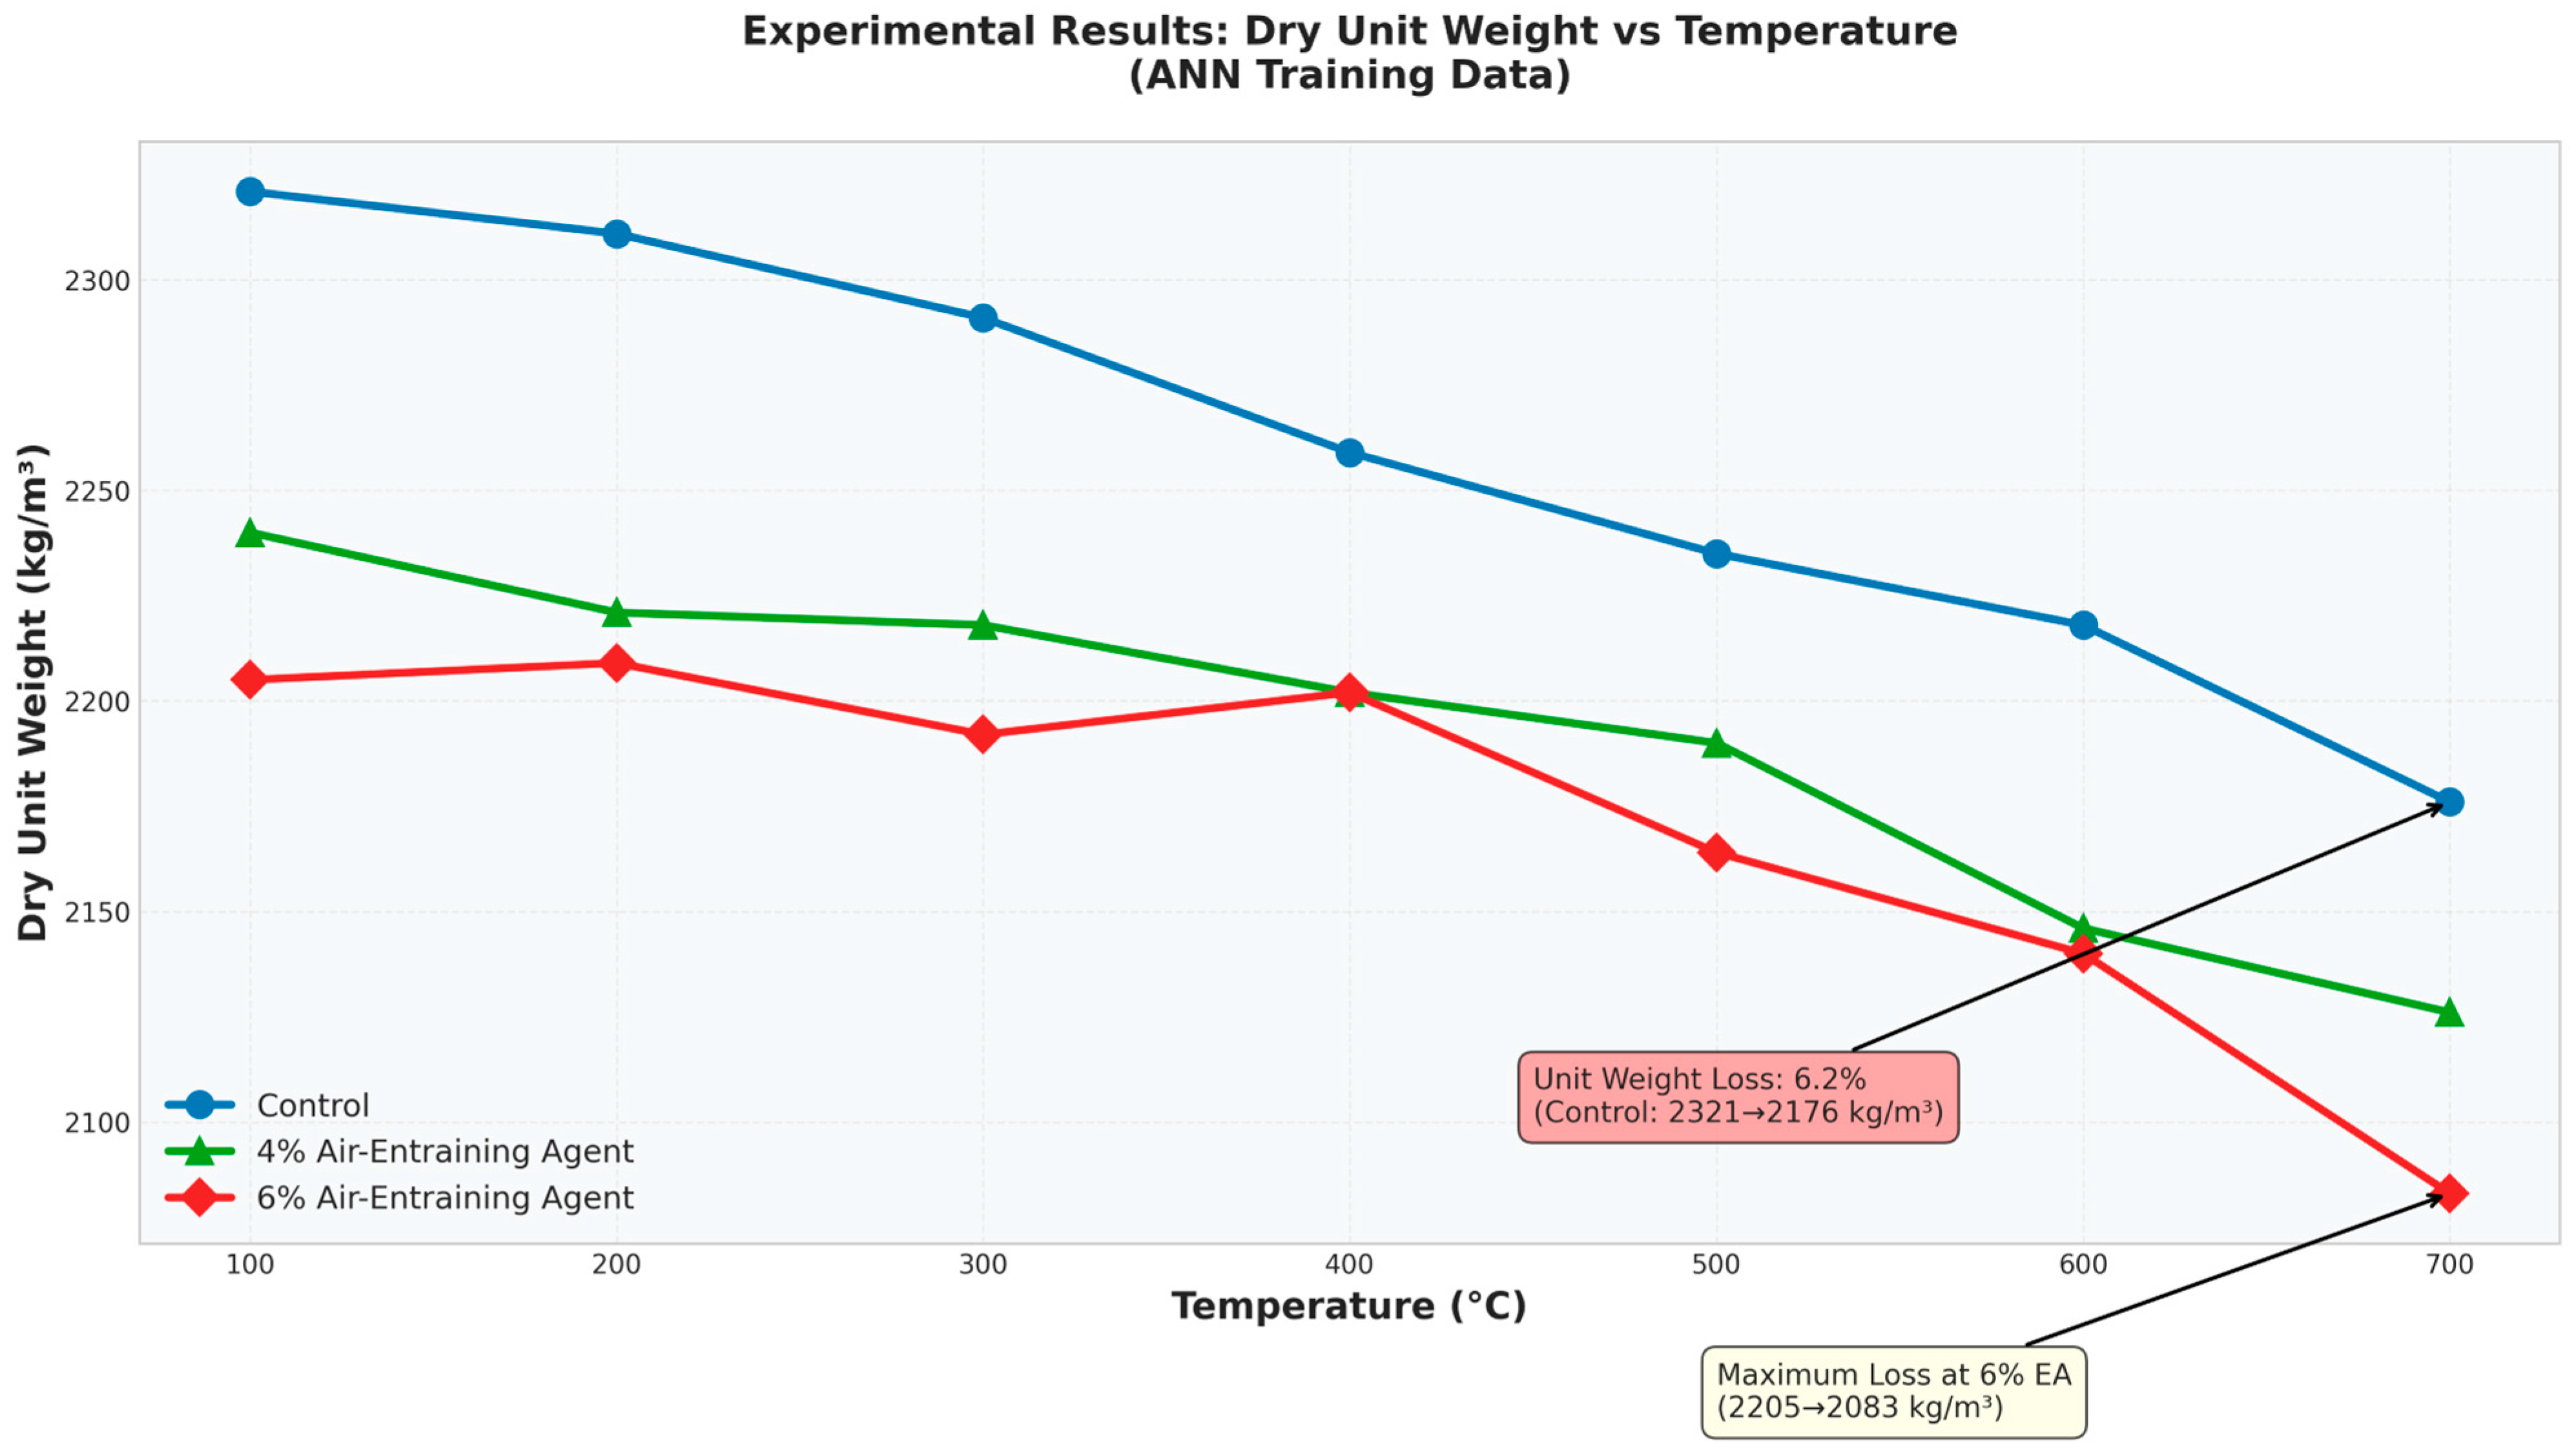
Dry unit weight fell steadily with temperature across all three mixes, from roughly 2321 kg/m
3 for the control at 100 °C down to 2176 kg/m
3 at 700 °C, a drop of about 6.2%. This loss reflects the physical departure of free and chemically bound water as hydration products break down; because the solid skeleton does not shrink nearly as fast as mass is lost, bulk density has nowhere to go but down. AE-containing mixes sat below the control at every temperature, which is exactly what one would expect once a stable network of air voids, inherently far less dense than any solid or liquid phase in the mix, is introduced [
1,
3]. Interestingly, the gap between the control and the AE mixes barely changes across the full temperature range: whatever density penalty the entrained air imposes seems to be set almost entirely at mixing, with high-temperature exposure adding relatively little on top of it. The AE-6 mix reached 2083 kg/m
3 by 700 °C, the lowest value recorded in this study. The measured dry unit weights are plotted against temperature in
Figure 1 and listed in
Table 5.
3.2. Thermal Conductivity
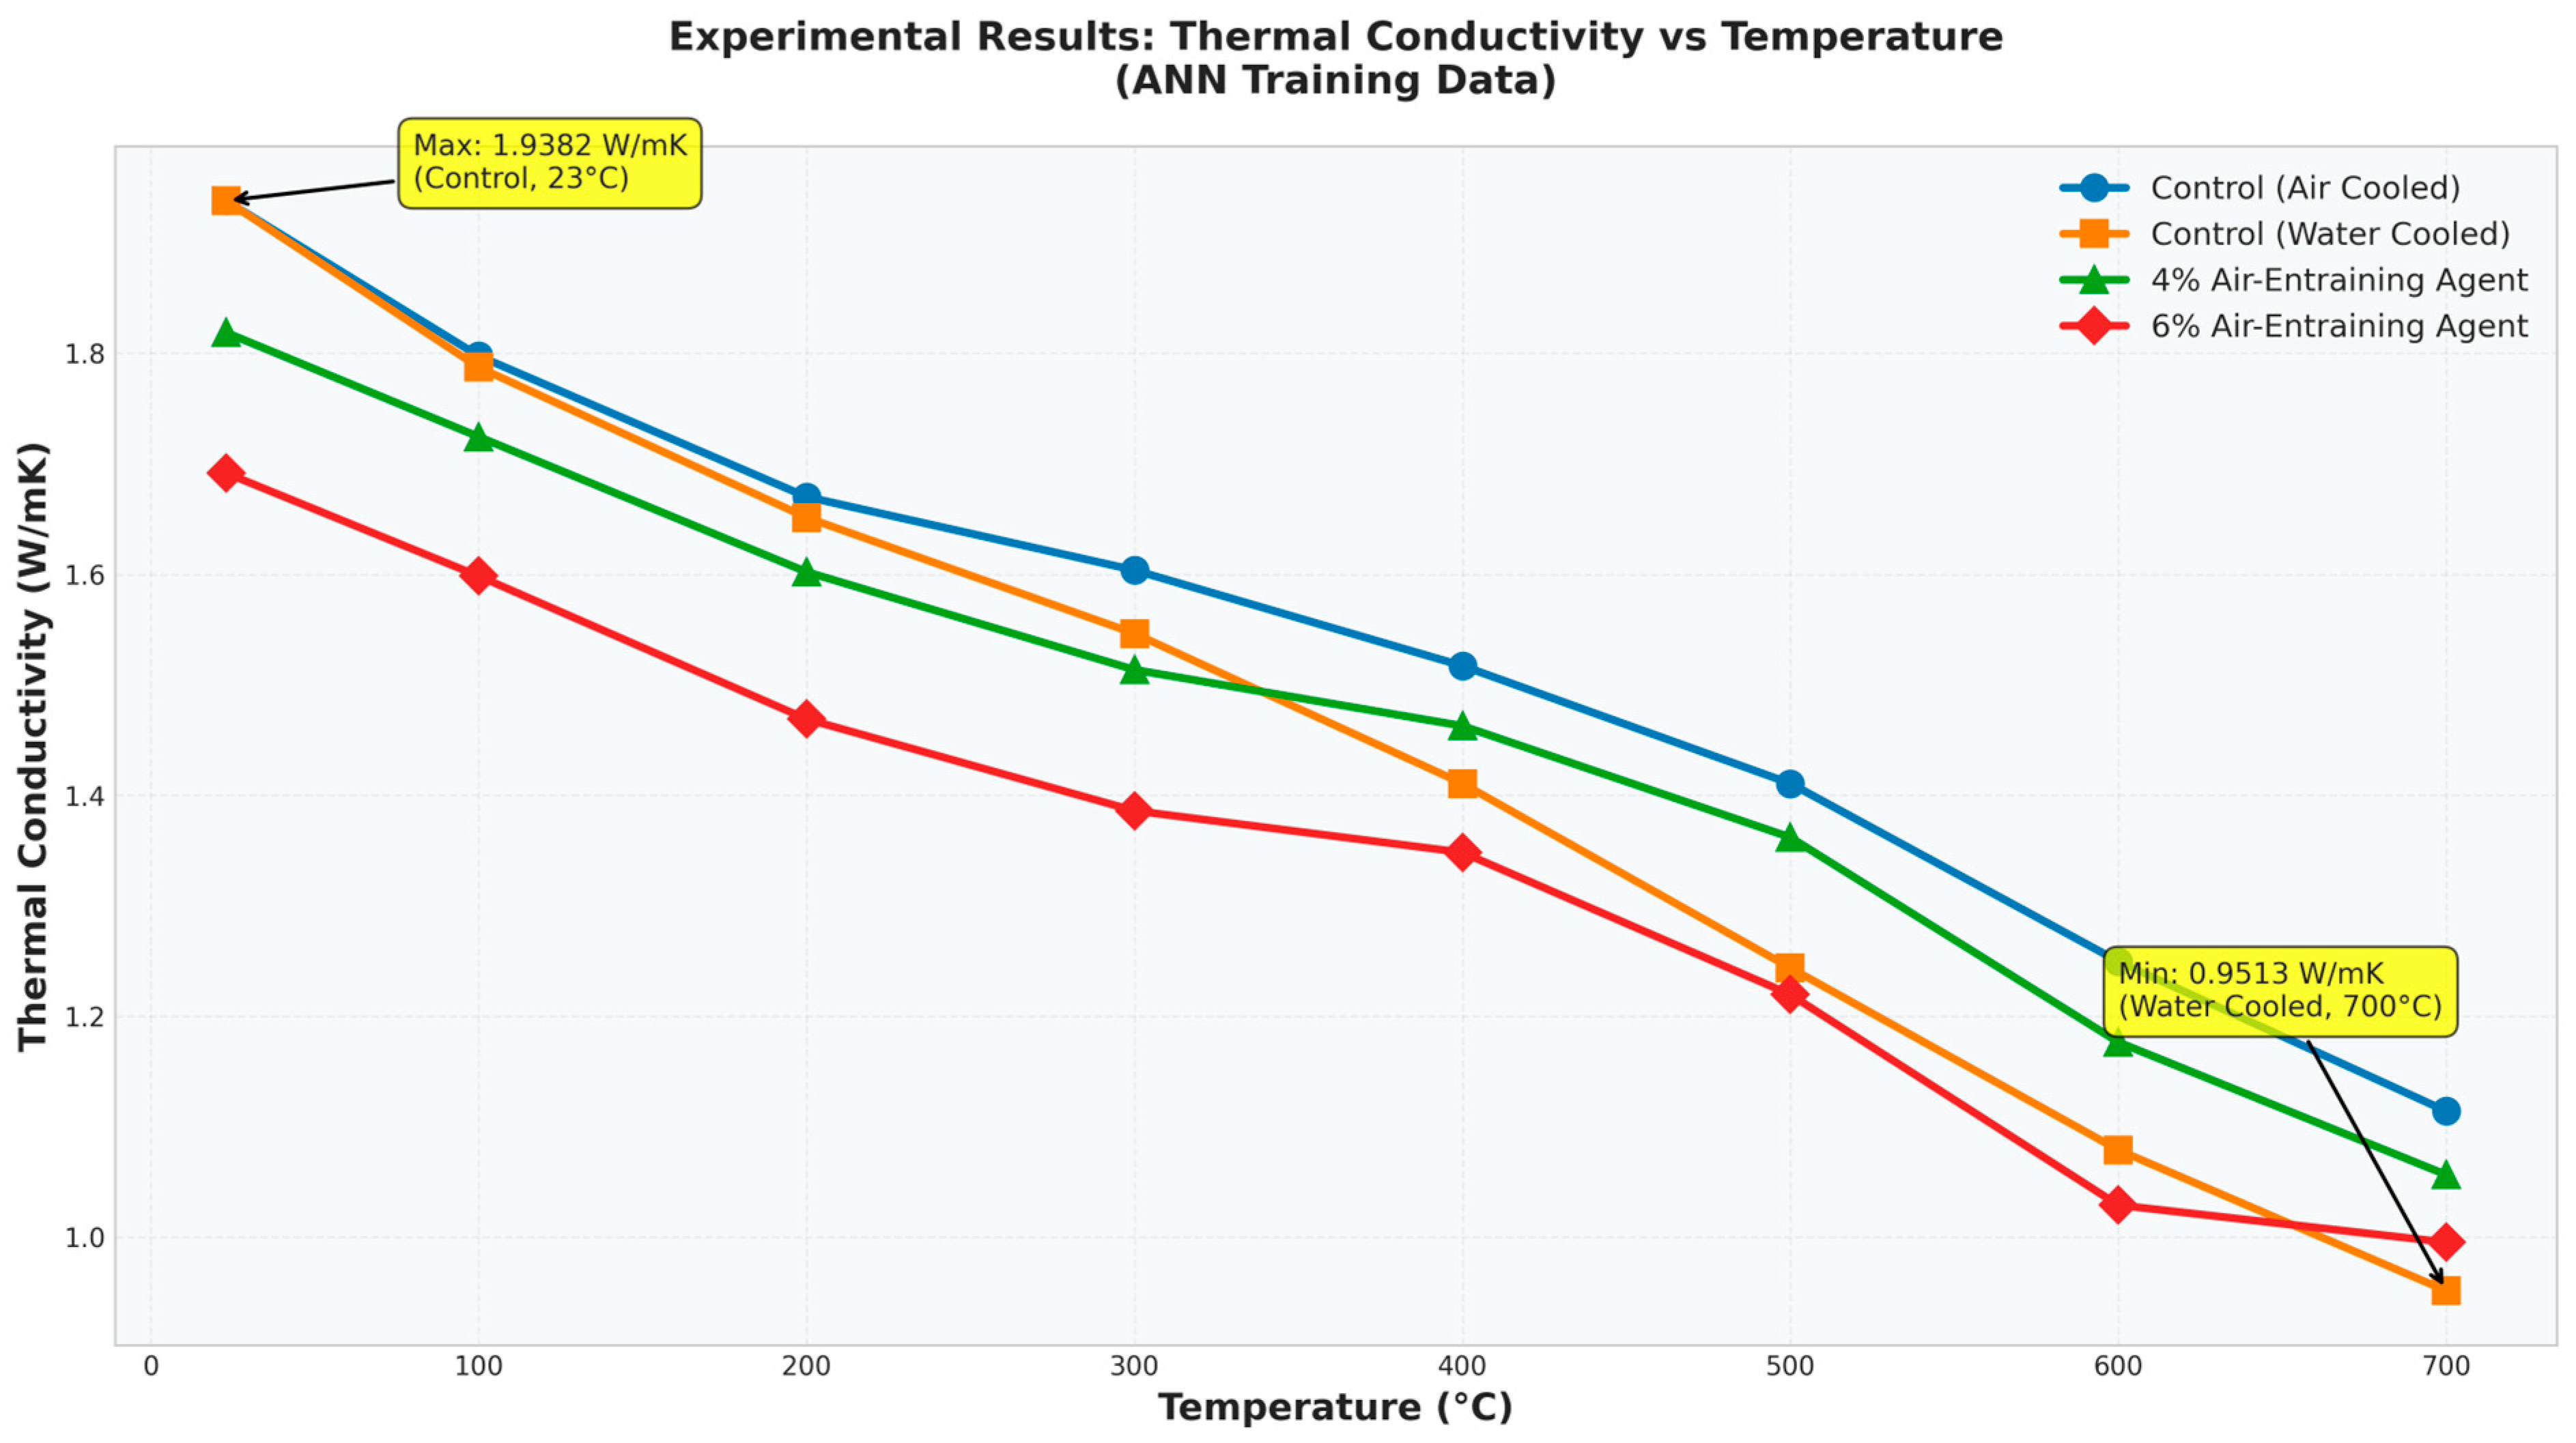
Thermal conductivity dropped with both rising temperature and rising AE content. The control mix moved from 1.9382 W/mK at ambient down to 1.1139 W/mK at 700 °C, a reduction of roughly 42.5%. Two things are happening here at once: dehydration steadily removes the free and bound water that would otherwise conduct heat efficiently through the paste, and the microcracking that accompanies heating adds more air-filled discontinuities to a path heat would otherwise cross more directly. Entrained air compounds this second effect from the outset, since air conducts heat far more poorly than solid paste; simply adding more of it lowers bulk conductivity independent of temperature. Across the same 23–700 °C range, the AE-6 mix spanned only 1.6916 to 0.9952 W/mK, consistently below the control, which lines up with earlier work showing that porosity and moisture content, not temperature alone, are what really control conductivity in cement-based composites [
27,
31,
32,
33,
34,
35,
36]. Cooling method left a smaller but still visible fingerprint: water-cooled control specimens measured slightly lower than air-cooled ones at 700 °C (0.9513 vs. 1.1139 W/mK), plausibly because rapid quenching opens additional microcracks that air cooling does not. Although the curing regime was controlled, the internal moisture content was not quantitatively measured immediately before heating. Therefore, the contribution of initial moisture and vapor pressure development to the observed thermal damage could not be independently quantified. However, because water cooling was applied only to the control concrete, the observed differences between the cooling regimes cannot be generalized to the mixtures containing 4% and 6% entrained air. Consequently, the available results do not permit evaluation of a possible interaction between entrained-air content and cooling regime. The measured thermal conductivities are plotted against temperature in
Figure 2 and listed in
Table 6.
3.3. Compressive Strength
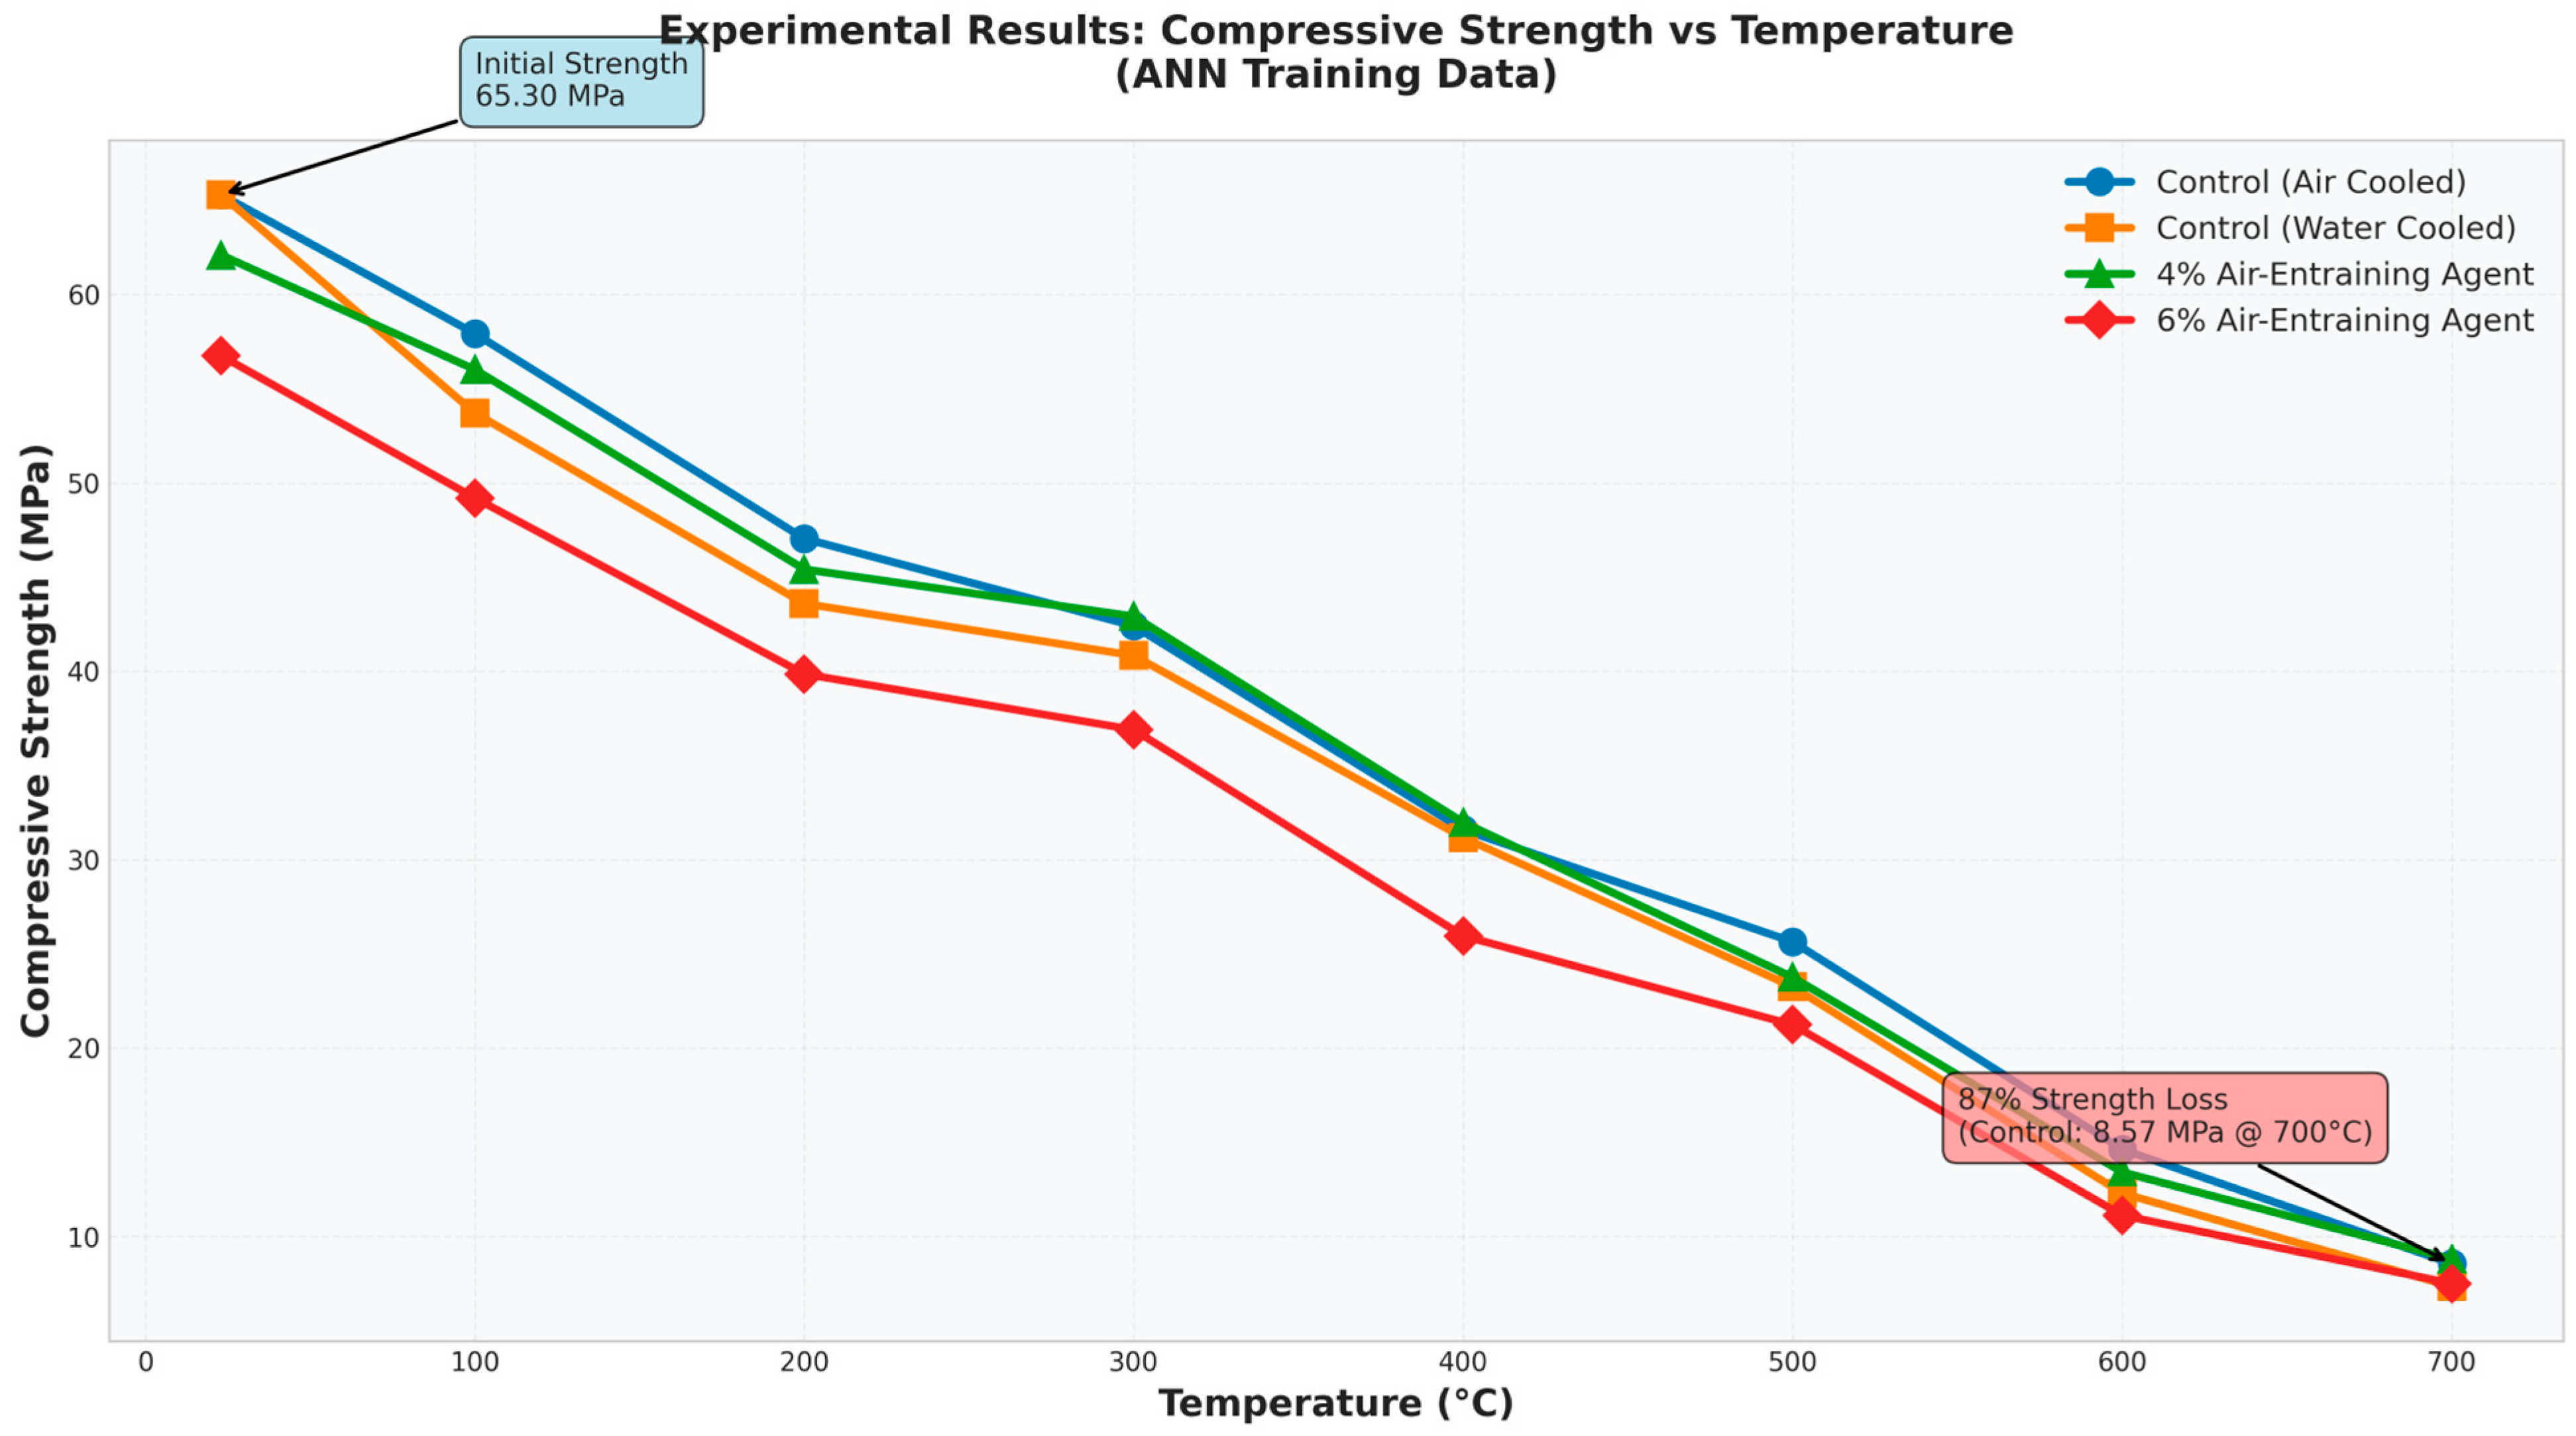
Compressive strength of the control mix dropped from 65.30 MPa at ambient to 8.57 MPa at 700 °C, an 87% loss. About two-thirds of that decline was already locked in by 500 °C (25.63 MPa, a 61% loss from ambient), which fits the well-known picture of major calcium silicate hydrate decomposition setting in around this temperature and the associated dehydration reactions accelerating sharply above it. The loss recorded here is somewhat steeper than the >60% reduction reported at 800 °C for high-performance concrete by Chan et al. [
18] and by Felicetti and Gambarova [
19]; one plausible reason is that the higher air content in these mixes, while beneficial in several other respects, also means a more porous starting matrix with less material to lose before reaching a given relative strength [
37]. At 700 °C, the residual compressive strength ratios of the control and AE-6 concretes were 13.1% and 13.3%, respectively. However, the corresponding absolute strengths were 8.57 and 7.52 MPa. The nearly identical residual ratios indicate that the AE-6 concrete did not exhibit a meaningful improvement in relative strength retention, while its absolute residual strength remained lower because of its lower initial strength. Consequently, the possible high-temperature role of entrained pores should be interpreted as local damage modification rather than strength enhancement. Cooling method again mattered for the control mix: air-cooled specimens outperformed water-cooled ones by about 16% at 700 °C (8.57 vs. 7.36 MPa) and about 10% at 500 °C (25.63 vs. 23.24 MPa), consistent with the additional thermal shock and crack formation that rapid water quenching is known to induce [
38,
39]. Among the AE mixes, AE-4 tracked the control almost exactly above 300 °C, and even edged slightly ahead by 700 °C (8.81 vs. 8.57 MPa), while AE-6 ran below the control at every temperature, including ambient (56.75 vs. 65.30 MPa), a reminder that higher air content, while good for durability, does cost some strength even before any heat is applied.
At 23 °C, the compressive strength of the AE-6 concrete was 56.75 MPa, compared with 65.30 MPa for the control concrete, corresponding to a reduction of approximately 13.1%. This difference demonstrates the initial mechanical penalty associated with increased air void content. The additional pores reduce the effective load-bearing area and may act as local stress concentrators under compression. Therefore, air entrainment should not be interpreted as intrinsically increasing the compressive strength of concrete.
The experimental compressive strength reduction factors were compared with the temperature-dependent relationships provided in EN 1992-1-2 for normal-weight concrete. The comparison indicates the relative severity of the measured deterioration with respect to a recognized structural fire design reference. Nevertheless, the experimental values represent post-cooling residual strength, whereas the Eurocode [
29] factors are primarily intended for concrete at elevated temperatures during fire design calculations. Therefore, agreement or deviation should be interpreted comparatively rather than as direct validation.
The residual property ratios may support preliminary comparison of concrete produced with comparable materials after a known thermal exposure. However, these ratios are specific to the investigated mixtures, specimen dimensions, heating program, and cooling regimes. They should not be used directly as structural fire resistance ratings, performance reduction coefficients for design, or pass/fail safety criteria.
For regulatory comparison, the experimental compressive strength reduction factors, calculated as kc,exp(T) = fc,T/fc,23, were qualitatively evaluated against the temperature-dependent relationships given in EN 1992-1-2 for normal-weight concrete. However, a direct numerical validation was not attempted because the Eurocode relationships primarily describe concrete properties during fire exposure, whereas the present results represent residual properties measured after heating and cooling. In addition, the Eurocode model does not explicitly consider the investigated air contents and cooling regimes.
The experimental residual strength trends were discussed with reference to EN 1992-1-2, and the limitations of directly applying Eurocode reduction factors to post-cooling residual measurements were clarified. The measured compressive strengths are plotted against temperature in
Figure 3.
The numerical comparison with EN 1992-1-2 is presented in
Section 3.10. The measured compressive strengths are listed in
Table 7.
3.4. Flexural Strength
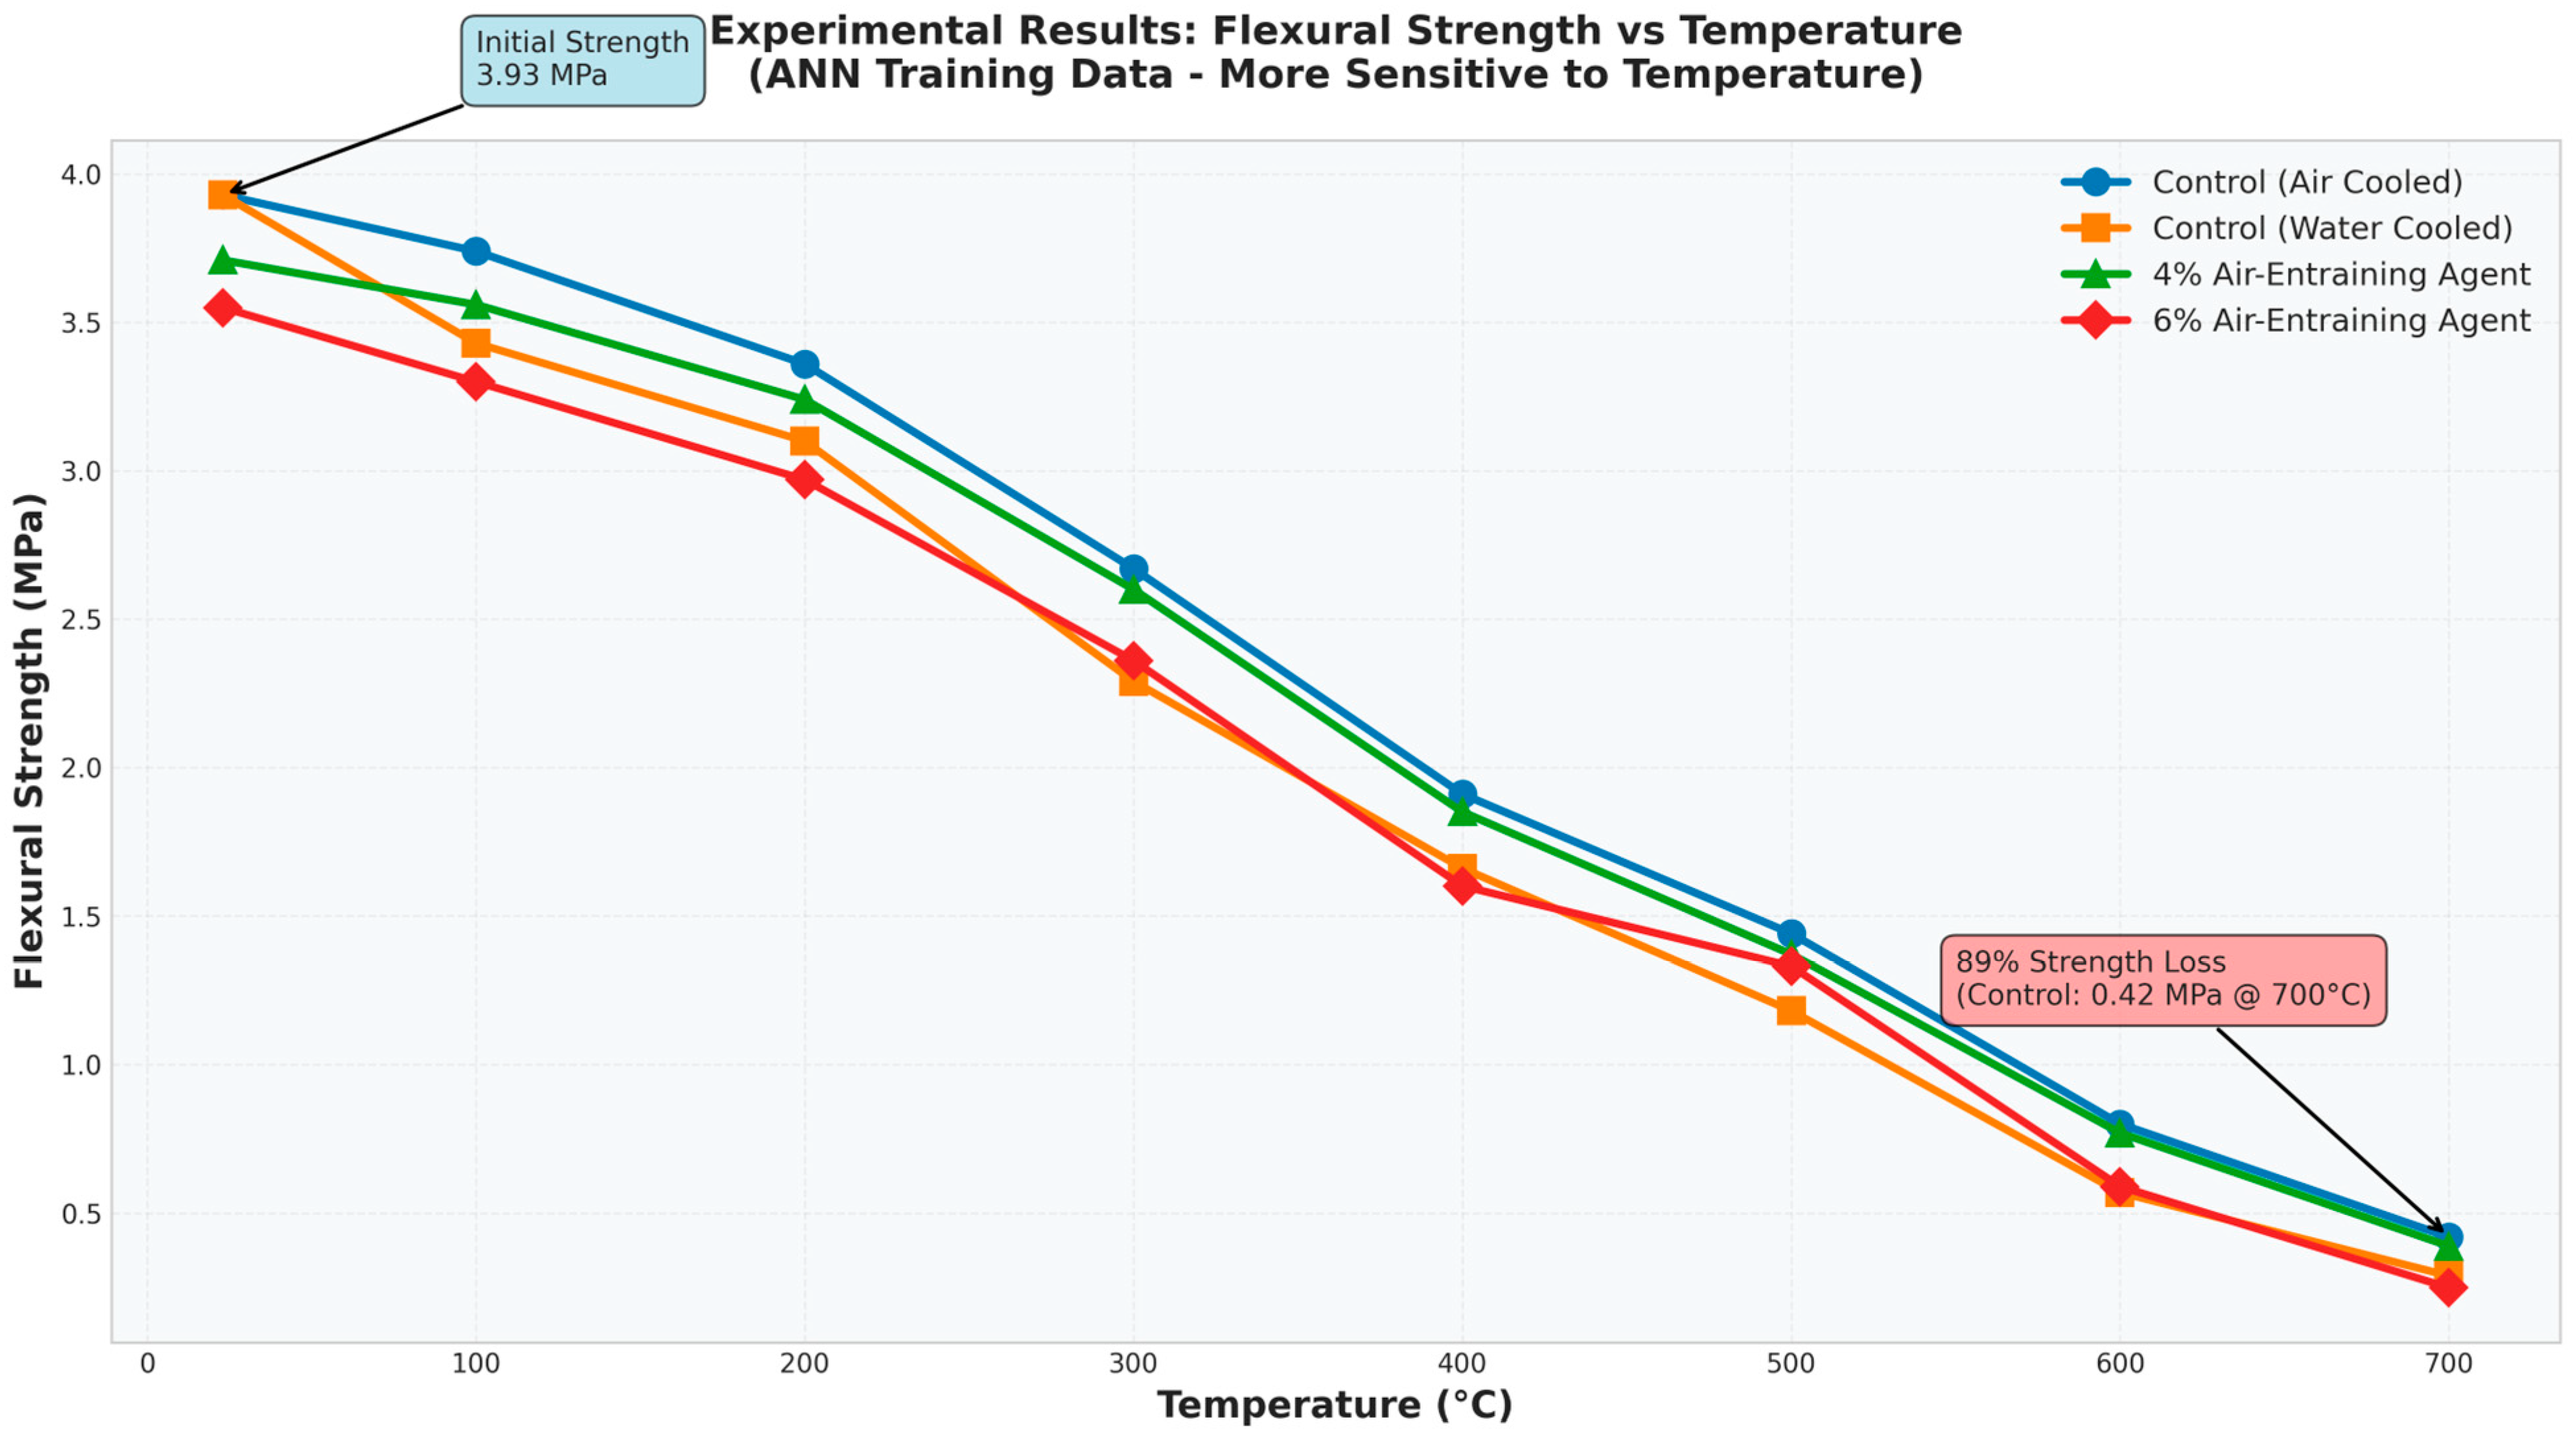
Flexural strength lost more of its value, relatively speaking, than any other property measured here, from 3.93 MPa at ambient to just 0.42 MPa at 700 °C, an 89% reduction. That flexural strength should suffer more than compressive strength is not surprising: a specimen in bending fails in tension, and tensile failure starts wherever a crack already exists, without the crack-closing confinement a compressive stress field provides. Cülfik and Özturan reported the same ordering in high-performance mortar [
16], and the present results reinforce it. Cooling method mattered here too, and arguably more visibly than for compressive strength: water-cooled control specimens lost noticeably more flexural capacity than air-cooled ones at both 700 °C (0.29 vs. 0.42 MPa) and 500 °C (1.18 vs. 1.44 MPa), consistent with flexural strength’s greater sensitivity to the fine surface cracking that thermal shock tends to produce [
38,
39]. The measured flexural strengths are plotted against temperature in
Figure 4 and listed in
Table 8.
3.5. Ultrasonic Pulse Velocity
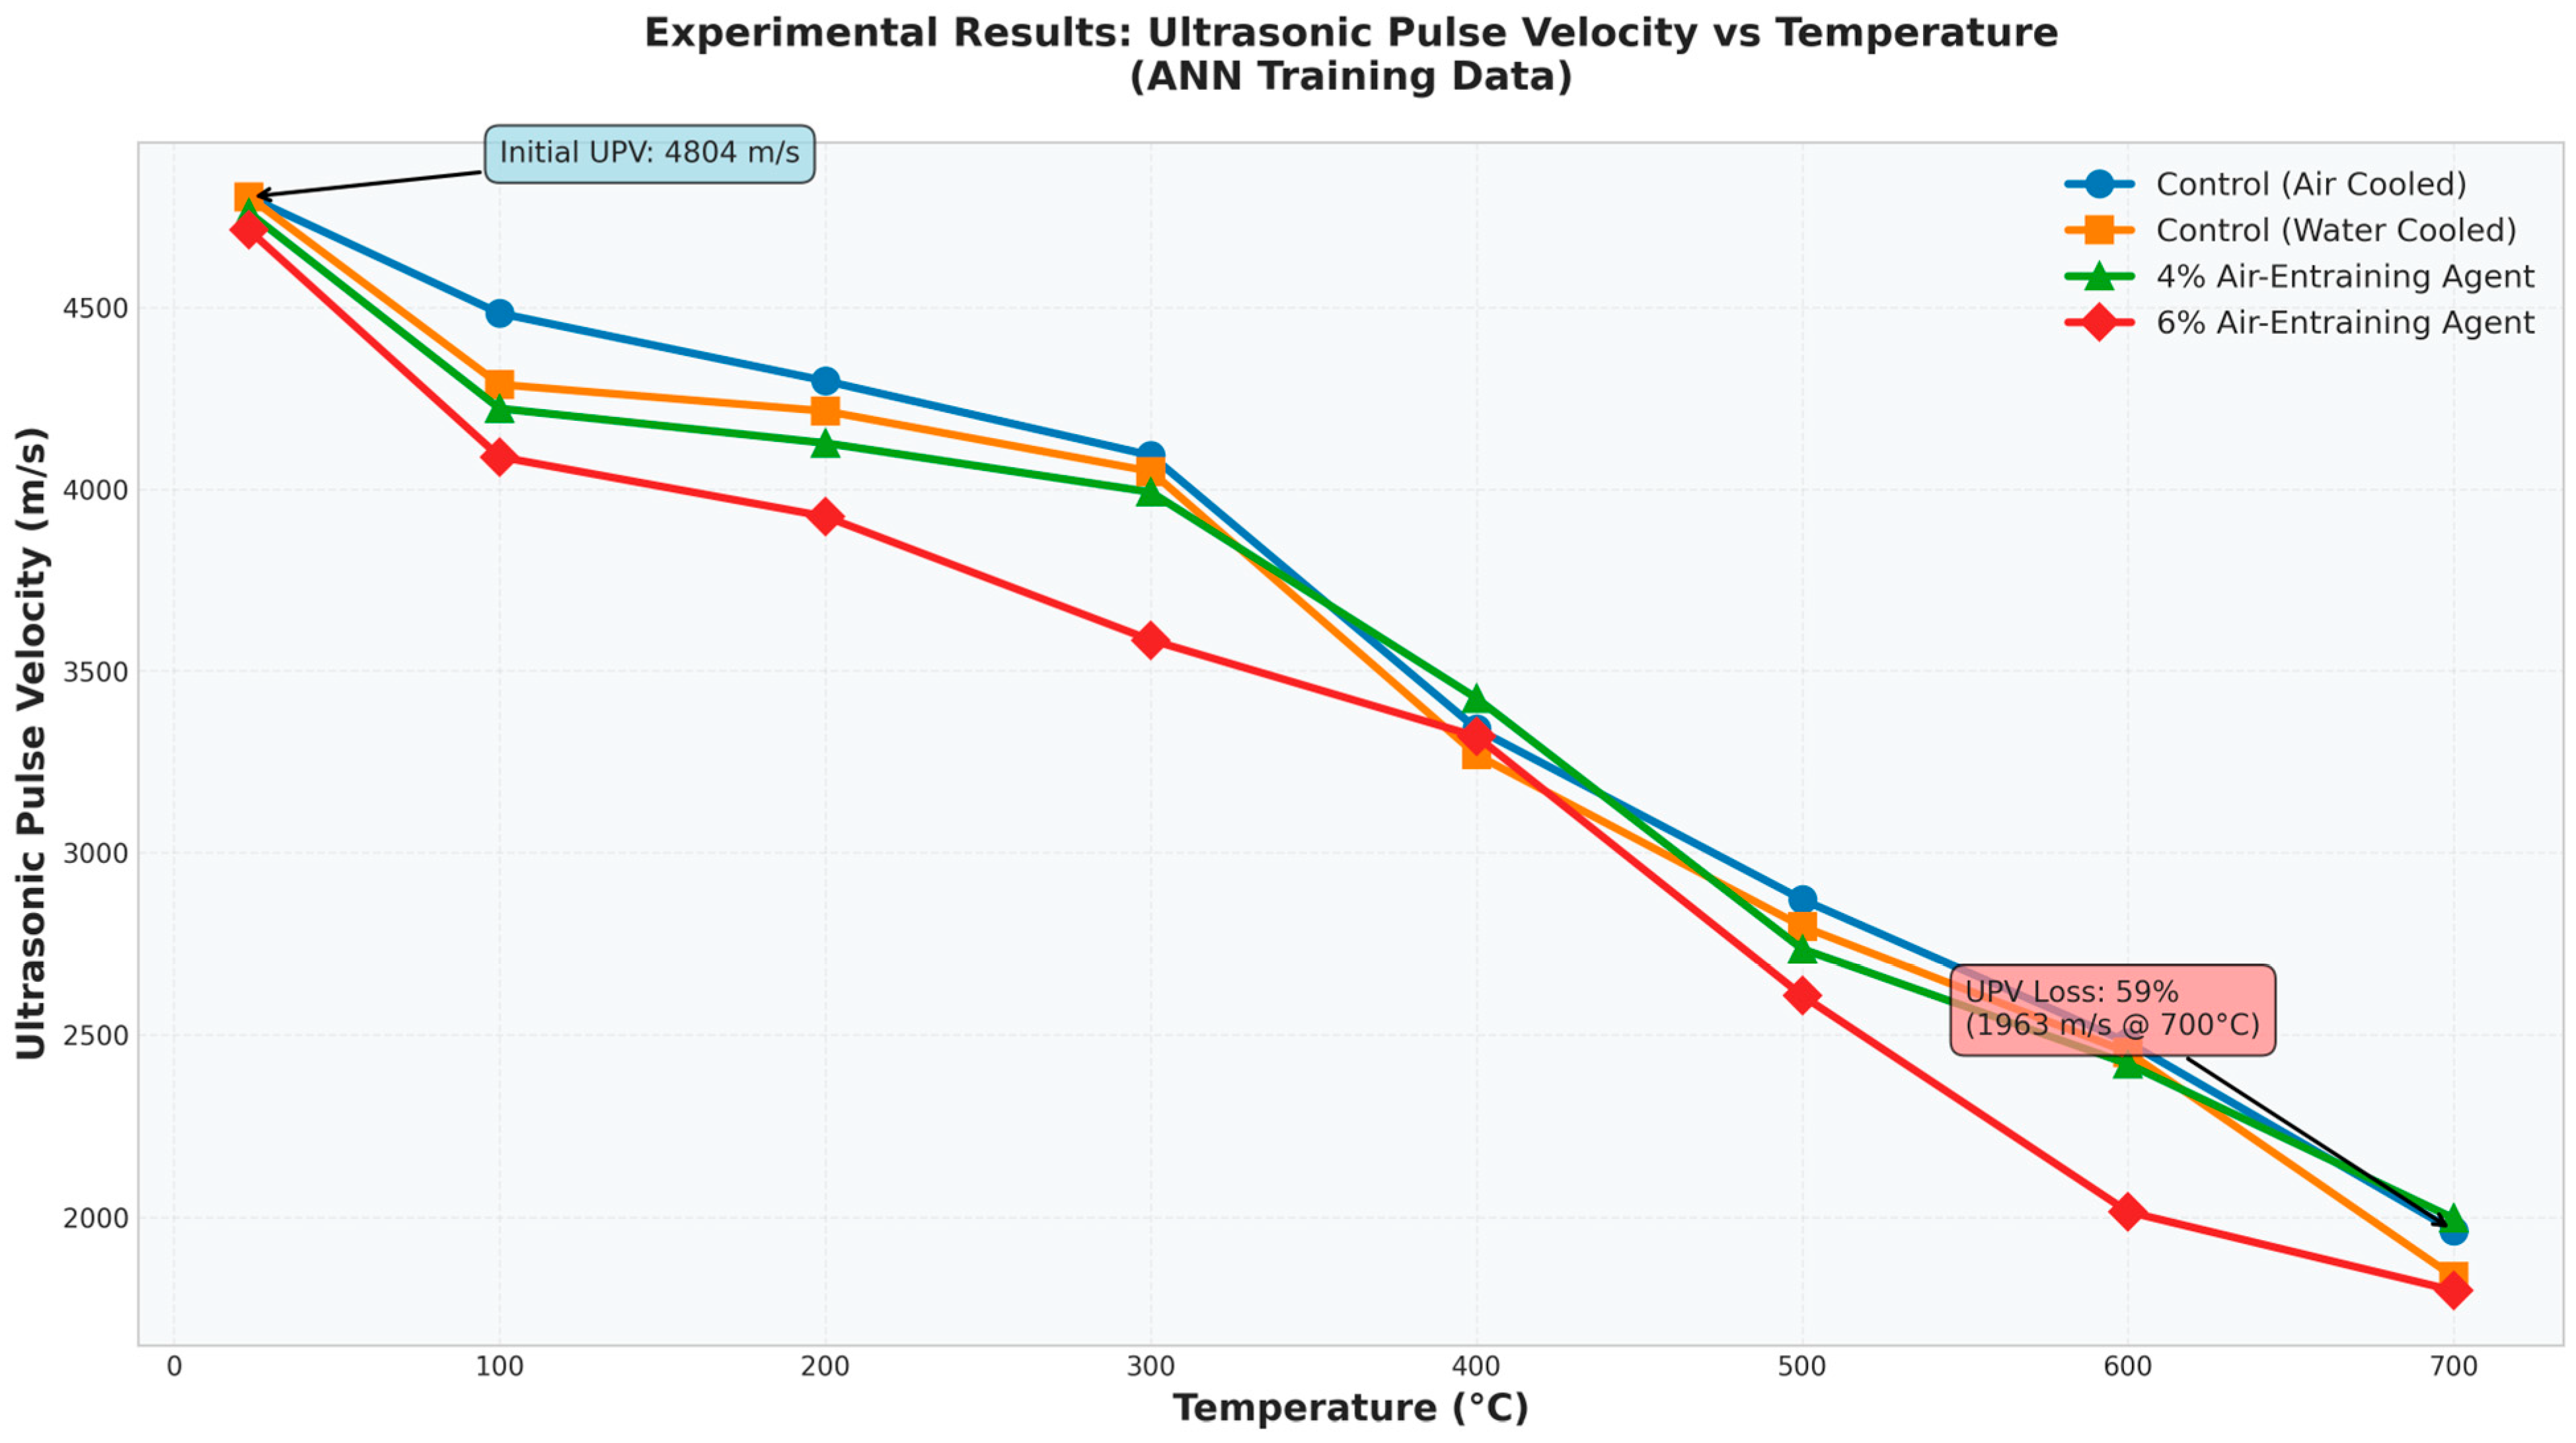
UPV fell for every mix as temperature rose, from 4804 m/s for the control at ambient to 1963 m/s at 700 °C, a 59% reduction. Ultrasonic pulse velocity is essentially a measure of how easily a stress wave travels through the material without being scattered or delayed, so this decline tracks the growing population of microcracks and connected voids inside the concrete as temperature rises, a pattern also reported in other post-fire cracking studies of cement-based materials [
40,
41,
42]. As with the strength properties, cooling method left its signature: water-cooled control specimens read lower than air-cooled ones at every temperature above ambient, including at 700 °C (1837 vs. 1963 m/s), again pointing to the additional microcracking that rapid cooling appears to introduce. The measured pulse velocities are plotted against temperature in
Figure 5 and listed in
Table 9.
3.6. Dynamic Modulus of Elasticity
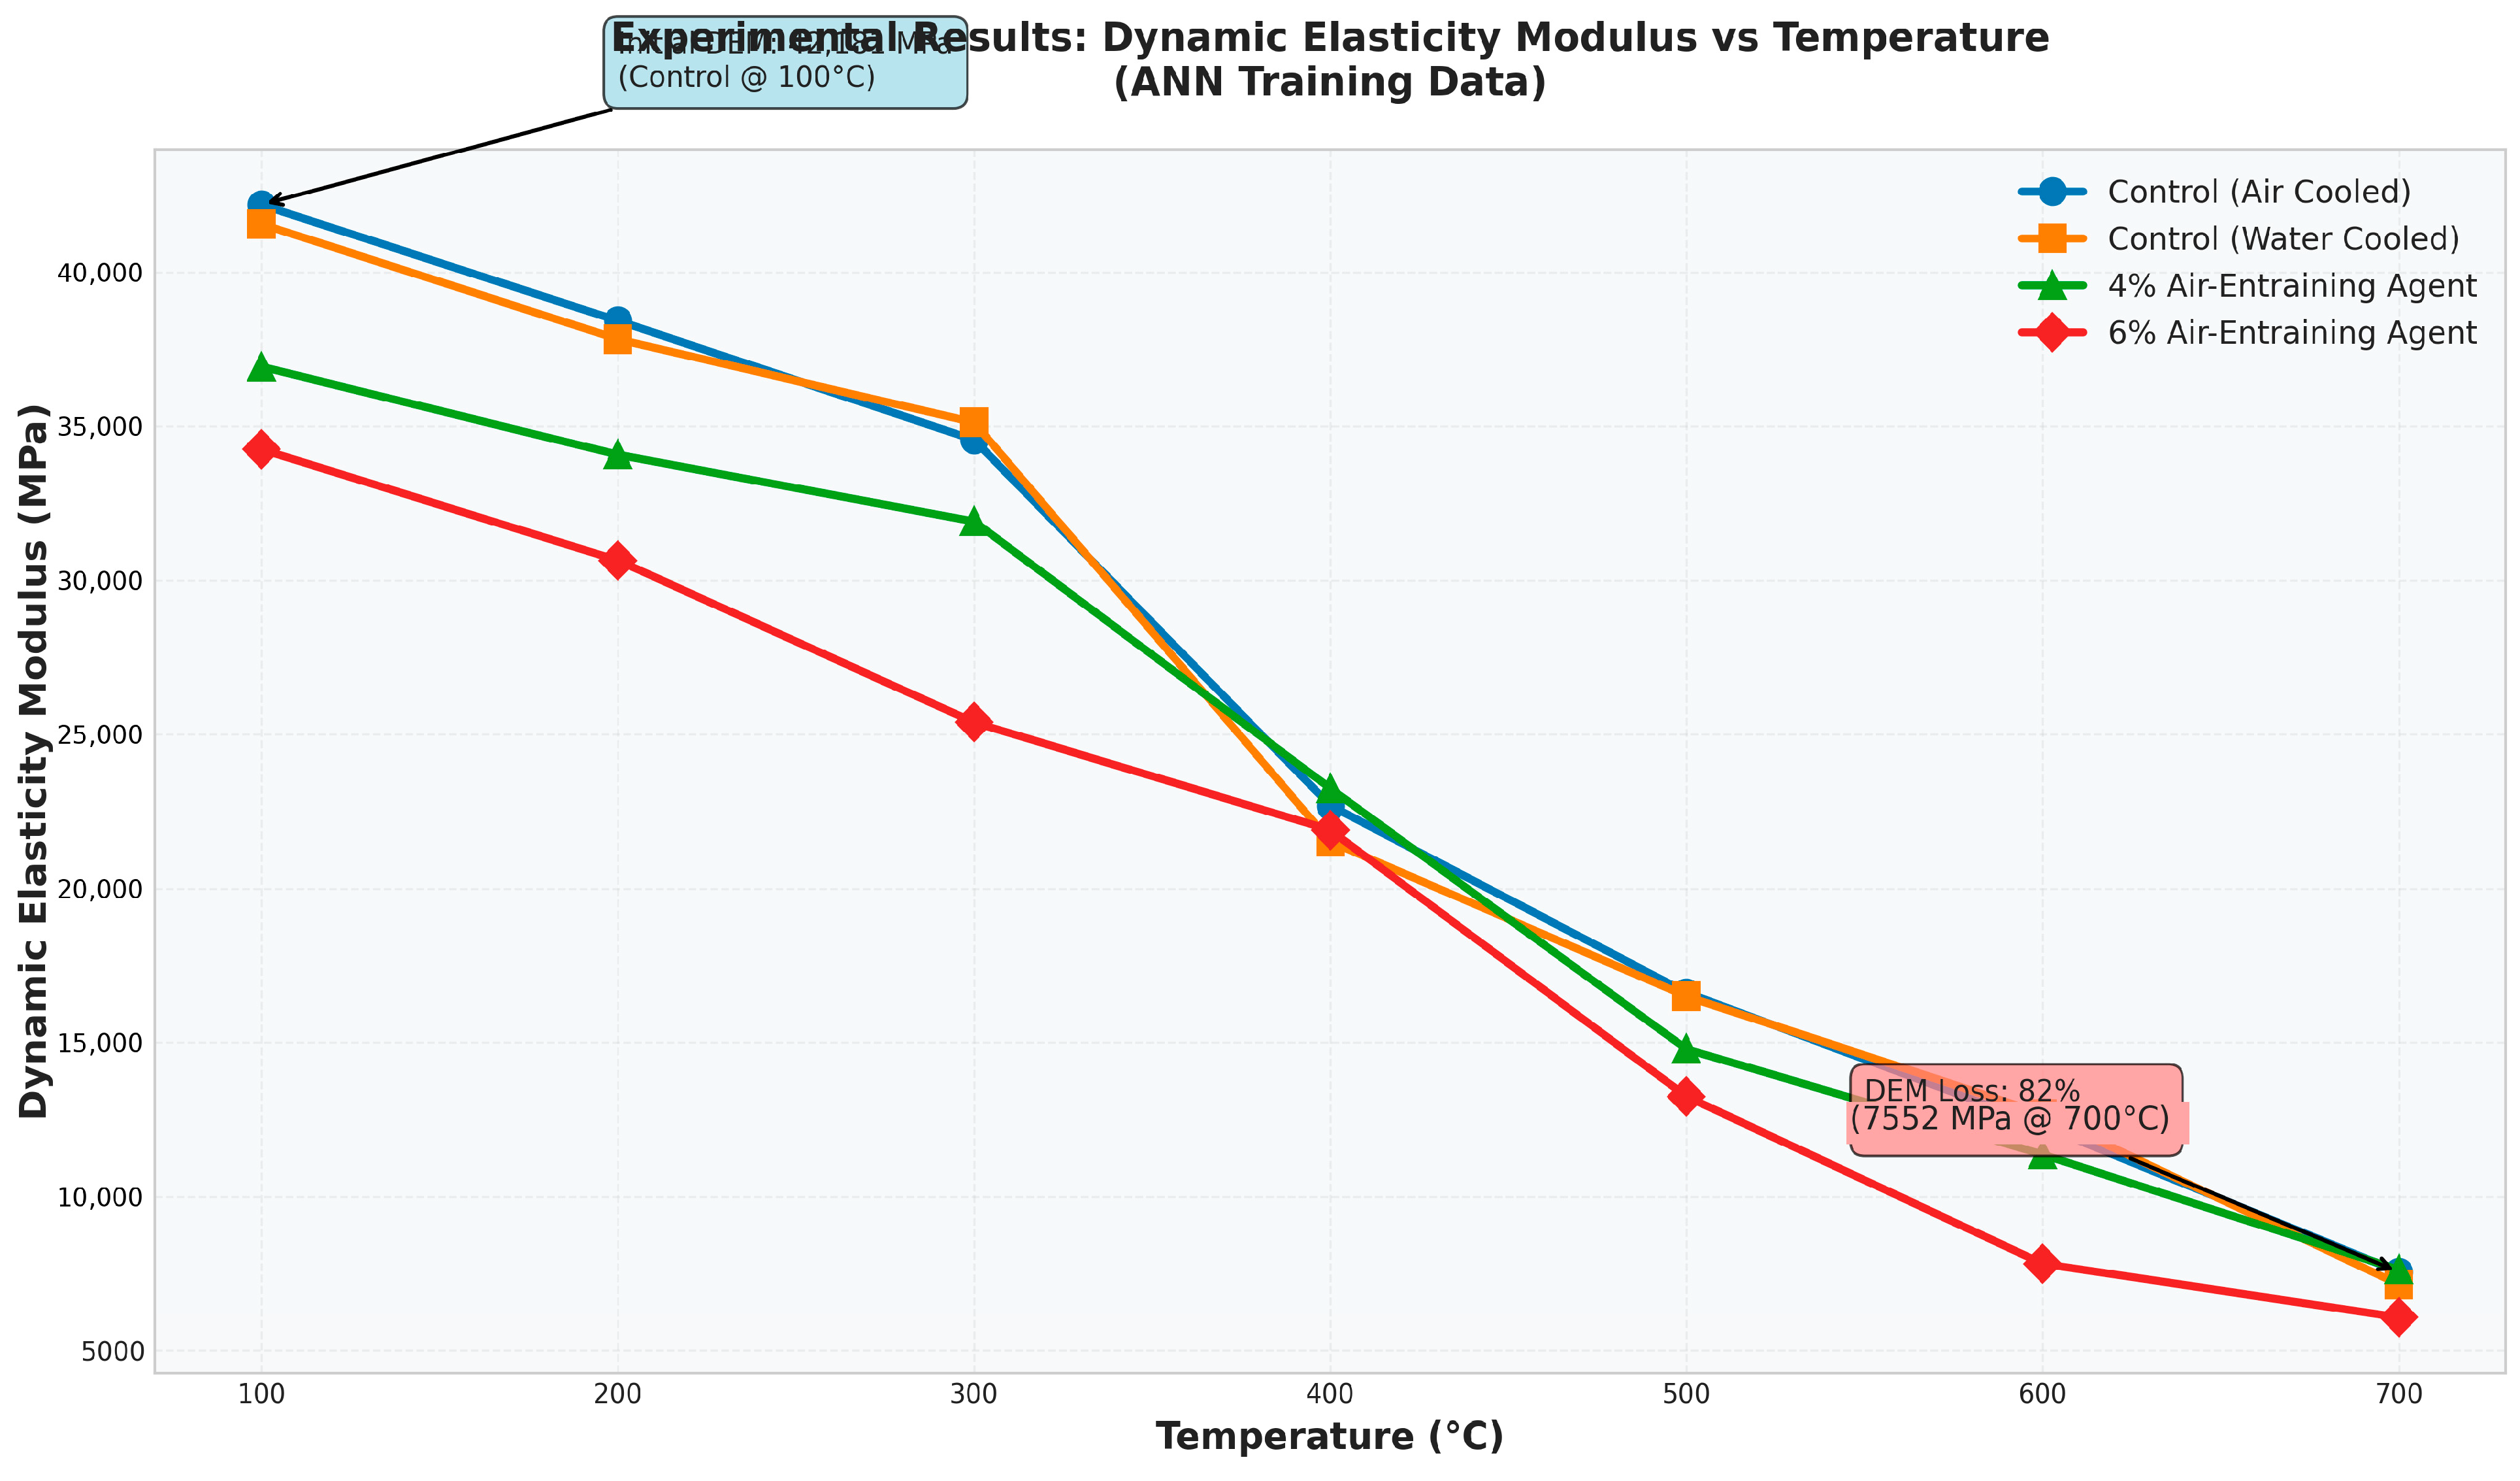
Dynamic modulus of elasticity (DEM) is the stress-to-strain ratio measured under vibratory loading, one of three moduli commonly used in dynamic concrete analysis alongside the static modulus and the long-term, creep-adjusted sustained modulus, and it matters directly for structural analysis under dynamic actions such as earthquake loading. DEM fell sharply with temperature across all mixes, from 42,181 MPa for the control at 100 °C to 7552 MPa at 700 °C, an 82% reduction over that range, broadly matching the scale of the compressive strength loss and consistent with earlier reports that modulus of elasticity degrades alongside strength rather than independently of it after fire exposure [
18,
19,
38]. Once again, water-cooled control specimens ended up with lower retained stiffness than air-cooled ones at the higher temperatures (7144 vs. 7552 MPa at 700 °C). DEM was measured from 100 °C upward; no ambient (23 °C) value was recorded for this property. The measured dynamic moduli are plotted against temperature in
Figure 6 and listed in
Table 10.
3.7. Summary of ANN Model Performance
A separate feed-forward ANN was built for each of the five properties above, using AE content and target temperature as the only two inputs, the Levenberg–Marquardt algorithm for training, and a hyperbolic tangent activation function in the hidden layer. A logistic (log-sigmoid) activation function was used in the output layer rather than a linear one, so that predictions remain bounded by the range of the training data and the models cannot return physically implausible values outside it. All outputs were min–max scaled before training and rescaled afterwards.
Table 4 brings together the architecture, accuracy, and sensitivity results for all five models in one place.
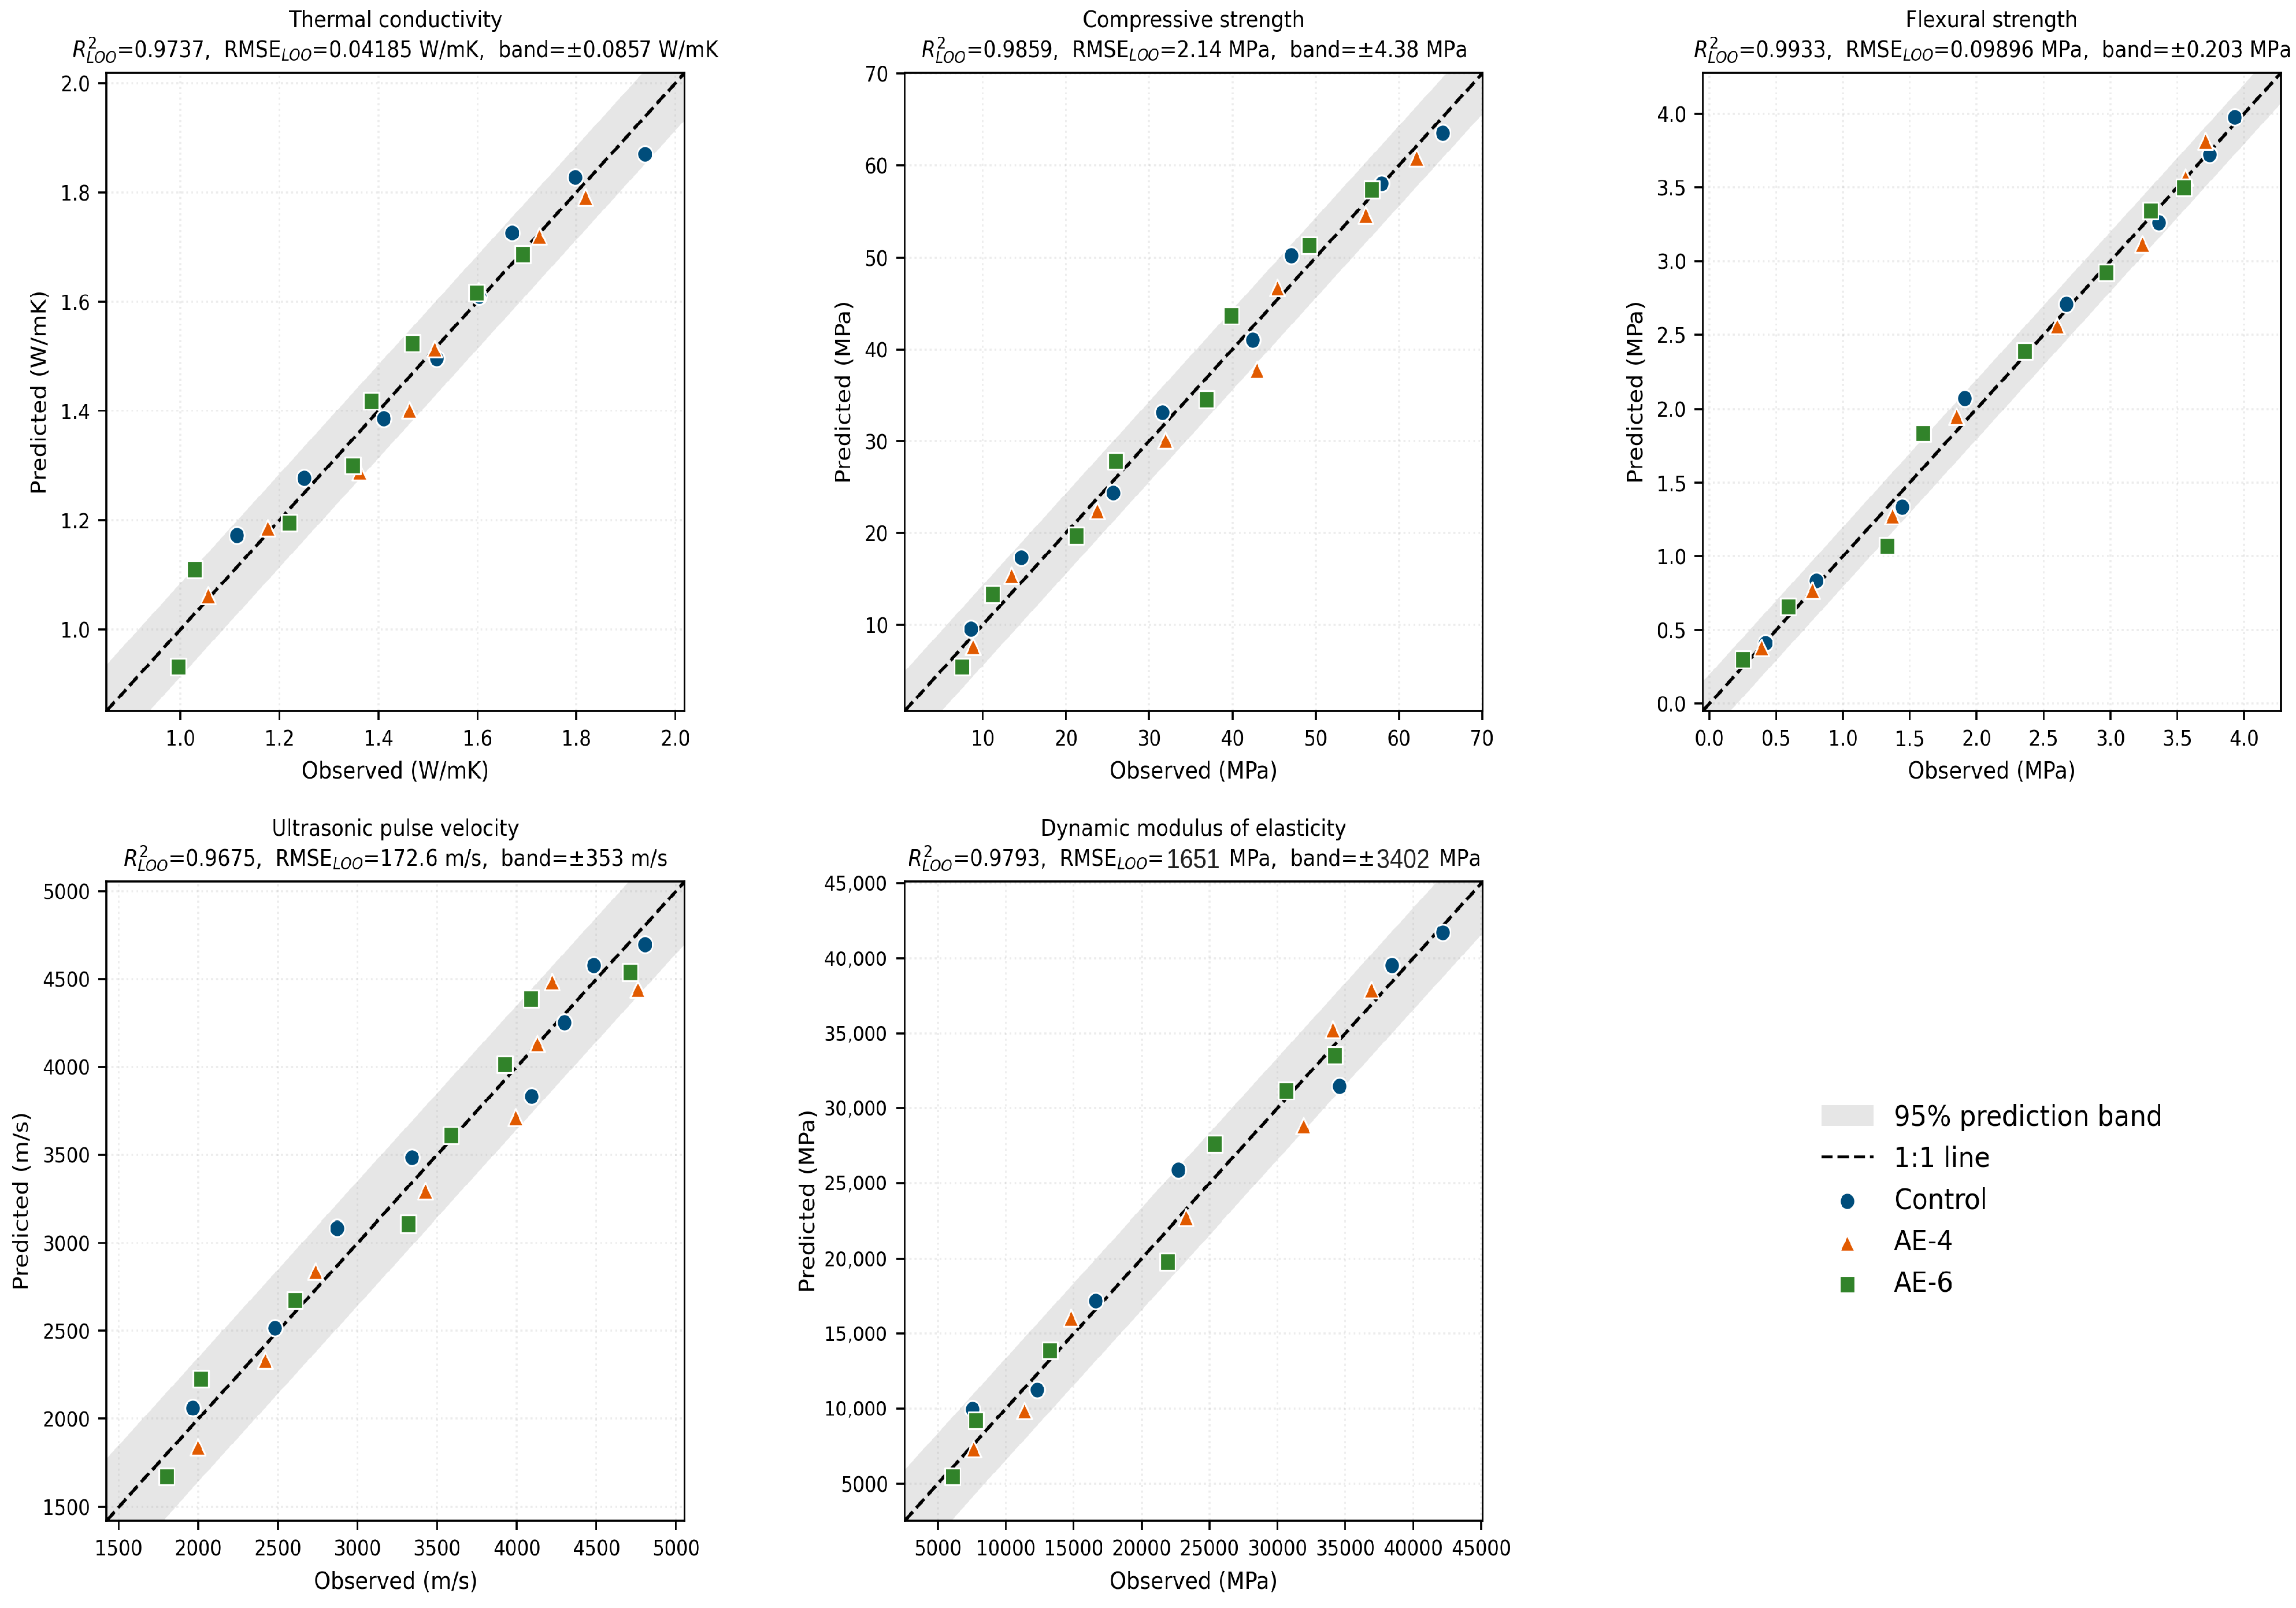
Model accuracy was consistently high and, critically, was sustained under cross-validation: the leave-one-out coefficients of determination ranged from 0.9647 (UPV) to 0.9933 (flexural strength), against fitting values of 0.9810 to 0.9968. The small difference between the two indicates that the revised models are not overfitted within the investigated input domain, and the values lie within the range typically considered acceptable for ANN models of concrete behavior under thermal loading [
43,
44].
Figure 7 shows this agreement directly. The plotted values are the cross-validated predictions, so each point was produced by a network that had not seen that observation during training, and the shaded band is the 95% prediction interval derived from the cross-validated residuals. The bands are ±0.0857 W/mK for thermal conductivity, ±4.38 MPa for compressive strength, ±0.203 MPa for flexural strength, ±353 m/s for UPV, and ±3402 MPa for the dynamic modulus of elasticity. Almost all observations fall inside the band, and the residuals show no systematic curvature or dependence on air content, which indicates that the discrepancies are due to scatter rather than model bias. The band widens in proportional terms at the lower end of the thermal conductivity and compressive strength ranges, where the absolute values involved are small enough that a modest prediction error becomes proportionally more noticeable. The band expresses the predictive uncertainty of the models; it does not represent the experimental repeatability of the underlying measurements.
Sensitivity analysis tells a consistent story across every model: exposure temperature is always the more influential input. Holding temperature at its mean inflates the model error by a factor of 7.2 to 17.5, whereas holding air content at its mean inflates it by a factor of 1.3 to 2.8, so that within each model, temperature outweighs air content by between 2.8 (thermal conductivity) and 8.3 (flexural strength). Air content is never irrelevant; its own contribution is largest for thermal conductivity and the dynamic modulus of elasticity and smallest for UPV. Because each ratio is normalized by the error of the model it belongs to, these figures rank the two inputs within a model but cannot be used to rank the properties against one another. Where such a comparison is wanted, the measured data provide it directly: between ambient and 700 °C, the mean values change by a factor of 10.6 for flexural strength, 7.4 for compressive strength, 5.3 for the dynamic modulus, 2.5 for UPV, and 1.7 for thermal conductivity. Practically, this means that in any residual strength assessment tool built from this dataset, exposure temperature should carry the greatest weight by far, with air content acting mainly as a secondary correction.
To establish whether the ANN formulation is warranted for a dataset of this size, six alternative regression methods were evaluated under an identical leave-one-out protocol: linear regression, second- and third-order polynomial regression, support vector regression with a radial basis function kernel, random forest regression, and a regression tree. The results are given in
Table 11. The ANN achieved the best cross-validated accuracy for compressive strength and dynamic modulus of elasticity and was close to the best method for the remaining three properties, but it did not outperform all alternatives uniformly: support vector regression was marginally more accurate for thermal conductivity, third-order polynomial regression was better for flexural strength, and a regression tree was better for UPV, while linear regression performed competitively throughout. With only two input variables and a monotonic response over the investigated range, a substantial accuracy advantage for a neural network should not be expected, and none is claimed here. The justification for the ANN formulation is that it represents the curvature of the temperature response and the temperature–air-content interaction without requiring a functional form to be specified in advance, and that a single modeling framework applies consistently to all five properties.
Leave-one-out cross-validation establishes that the models are internally consistent, but it withholds only a single observation at a time and therefore always leaves the neighboring exposure levels available to the network. To demonstrate the practical functioning of the models under the conditions in which they would actually be used, a stricter test was carried out in which an entire exposure level was removed from the training set: all three mixtures at one temperature were withheld, the network was retrained on the remaining levels, and the withheld level was then predicted. This reproduces the situation of a post-fire assessment at an exposure temperature for which no measurement exists. The test was repeated for every interior temperature; the ambient and 700 °C levels were excluded because withholding a range endpoint would require extrapolation rather than interpolation. The results are given in
Table 12. Mean absolute percentage errors over the withheld levels were 2.68% for thermal conductivity, 4.72% for UPV, 6.48% for flexural strength, 8.38% for compressive strength, and 8.63% for the dynamic modulus of elasticity. For the withheld 400 °C level, for example, compressive strength was predicted as 33.03, 30.59, and 27.56 MPa for the control, AE-4, and AE-6 concretes against measured values of 31.58, 31.97, and 25.94 MPa. Accuracy is lowest at the upper end of the range, where the property curves are steepest: the largest single error occurred for compressive strength at the withheld 600 °C level (20.52%). The models therefore reproduce unmeasured intermediate exposure levels to within roughly 3–10% on average, which is adequate for preliminary screening but not for verification of structural capacity.
Although the ANN models showed high predictive accuracy within the experimental dataset, they were not developed as directly callable structural assessment tools. Their use is currently limited to the investigated input ranges and materials. External validation using independent concrete mixtures, specimen geometries, and realistic fire histories is required before implementation in an engineering application. The developed ANN models should be regarded as preliminary research-level prediction models rather than directly callable structural safety-assessment tools. Their application is restricted to the AE contents, temperature range, materials, and heating conditions represented in the training dataset. Predictions outside these ranges, or for concrete exposed to standard fire curves and different cooling regimes, may be unreliable. Accordingly, ANN predictions should be supported by visual inspection, non-destructive testing, core testing, and code-based structural analysis before making repair or replacement decisions.
3.8. Scope and Limitations of the ANN Models
The two-input ANN structure constitutes a deliberate but restrictive representation of the present experimental matrix. It captures the relationships of the measured properties with exposure temperature and nominal air content level, while the water-to-cement ratio, binder composition, aggregate type, curing procedure, and exposure duration remain fixed. Accordingly, the models cannot quantify the independent effects of these parameters and should not be extrapolated to concretes with substantially different compositions or thermal histories.
The models should be used only for interpolation within the investigated ranges and for concrete systems comparable to the present mixtures. For thermal conductivity, compressive strength, flexural strength, and UPV, the investigated temperature range was 23–700 °C, whereas the dynamic-modulus model was based on measurements between 100 and 700 °C because no value was available at 23 °C. Predictions outside these ranges constitute extrapolation and are not supported by the present dataset.
Although the leave-one-out cross-validation results indicate good predictive performance within the available dataset, establishing that the revised models are not overfitted within the investigated input domain, they assess internal predictive consistency only and do not constitute external validation. A more general model would require an independent multi-source database in which water-to-cement ratio, binder composition, aggregate mineralogy, moisture condition, specimen geometry, heating history, exposure duration, cooling regime, and nominal air content are systematically varied.
3.9. Microstructure Development
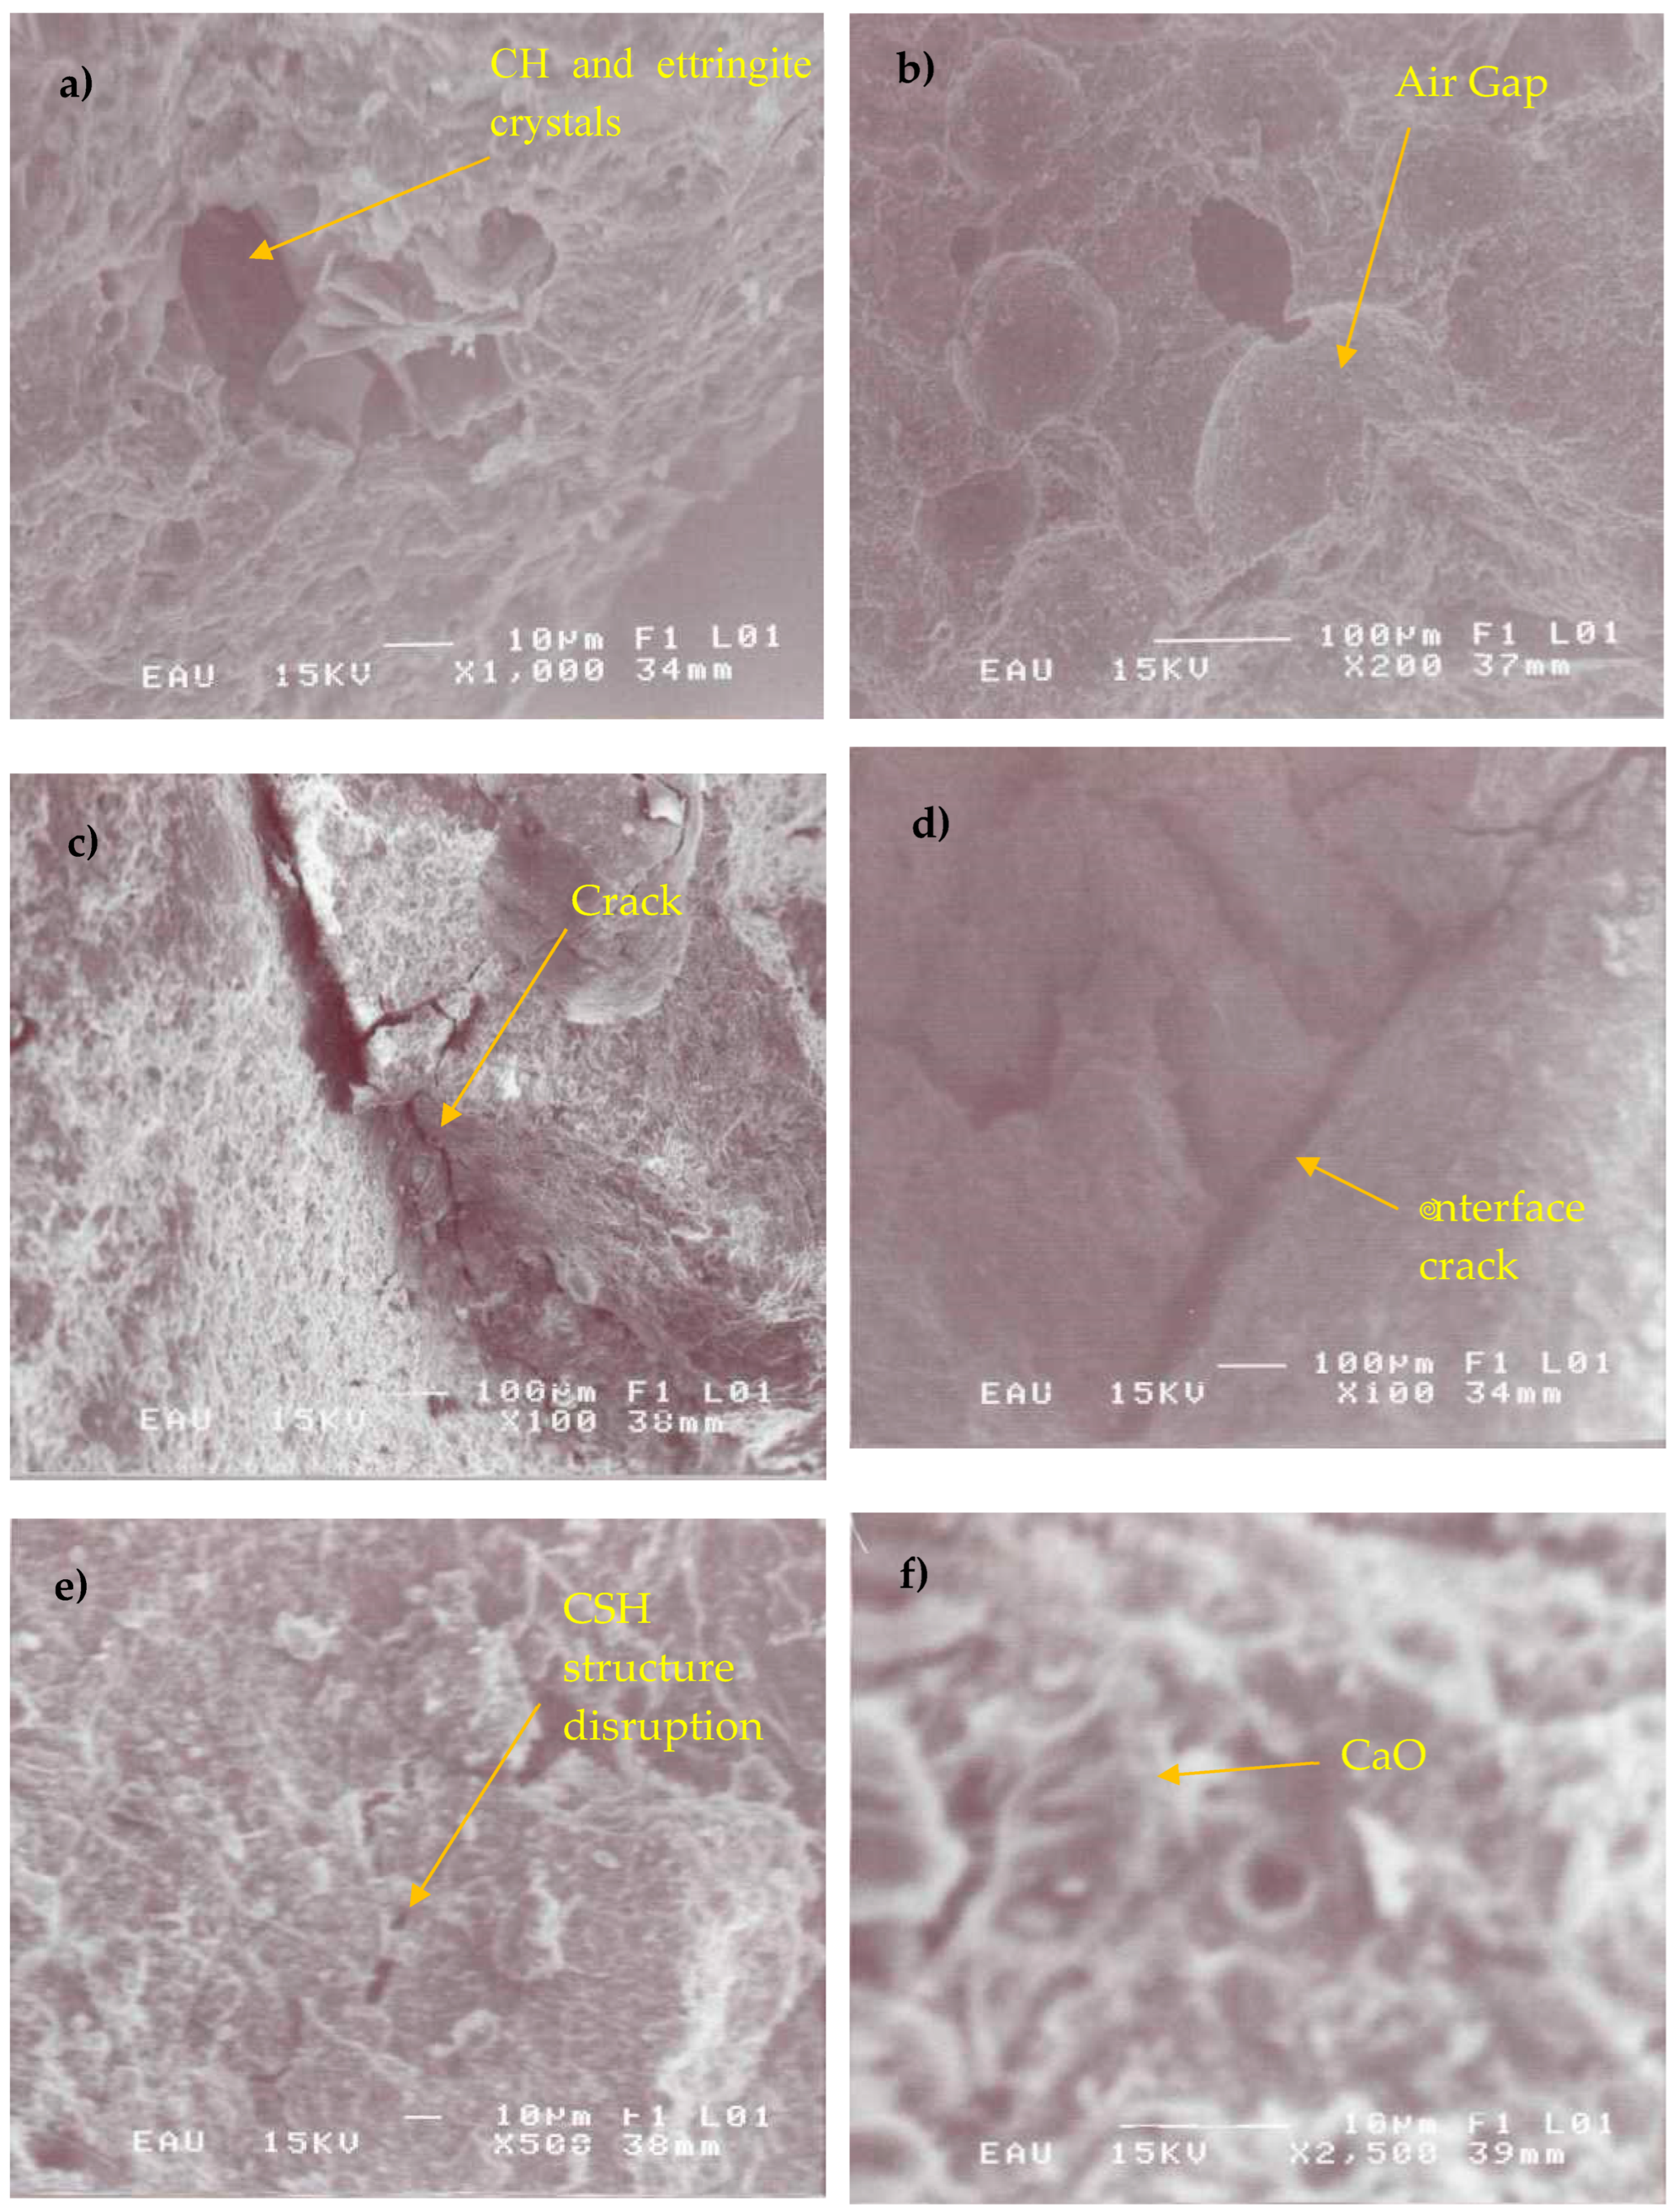
Six scanning electron micrographs of the control specimens, taken after air cooling from 100 °C, 300 °C, and 700 °C, the last at three magnifications, trace how the internal structure of the paste changes as exposure temperature rises (
Figure 8a–f).
At 100 °C (
Figure 8a, ×1000), the paste still looks largely intact. At 100 °C, the cementitious matrix remained relatively compact and contained plate-like and acicular crystalline features commonly associated with hydrated cementitious products. However, these features were not assigned to specific phases because their chemical compositions were not confirmed by location-specific EDS or XRD and were reasonably ordered, much as one would expect in a properly hydrated 28-day paste that has barely been disturbed by heat.
Concrete is a heterogeneous and porous material composed of cement paste, aggregates, and interfacial transition zones. Entrained air voids generally reduce density and may decrease ambient strength when their volume becomes excessive. However, under thermal exposure, these voids may provide local pressure relief spaces and interrupt or deflect thermally induced cracks. The residual response therefore depends on the balance between the negative effect of initial porosity and the potential damage mitigation effect of entrained pores [
45].
By 300 °C (
Figure 8b, ×200), the picture starts to change: air voids and a visibly more open, porous texture appear throughout the matrix, and well-defined CH crystals become harder to find. Silica fume, present in all three mixes (
Table 3), consumes calcium hydroxide through the pozzolanic reaction during normal curing, and it is plausible that elevated temperature accelerates whatever CH depletion this reaction had already begun, a pattern broadly consistent with the reduced CH visibility reported elsewhere in high-temperature microstructural studies of cement paste [
46].
At 500 °C (
Figure 8c, ×100), the deterioration is harder to miss. Voids that were once isolated begin linking up into open, interconnected networks, and the bonds holding the paste together are visibly weaker. This is the temperature range where two processes overlap: gel and capillary water finish evaporating, and the C–S–H gel itself starts to break down, freeing further void space as it goes.
The three 700 °C micrographs (
Figure 8d–f) capture the endpoint of that process. At the lowest magnification (
Figure 8d, ×100), the paste is laced with macro-level cracks running between the interconnected voids, and the reduced occurrence of well-defined crystalline features and the increasingly porous and cracked matrix are consistent with progressive dehydration and thermal degradation of cementitious products. However, the specific phases involved cannot be conclusively identified from SEM morphology alone. At higher magnification (
Figure 8e), the matrix exhibited a highly disrupted and porous morphology. An acicular or elongated feature was also observed within the examined region. However, this feature was not identified as ettringite because ettringite is expected to decompose at temperatures substantially below 700 °C, and morphology alone cannot provide definitive phase identification. In the absence of location-specific EDS and complementary XRD confirmation, its chemical and mineralogical composition remains uncertain [
47]. This does not change the overall picture of a severely degraded matrix. At ×2500 (
Figure 8f), the fine cracking pattern linking the voids is at its clearest, tying the macro-level damage seen in
Figure 8d to the gel-level breakdown inferred from
Figure 8e.
One thread runs through all six images: cracks tend to stop at, rather than cut through, the air voids introduced by the AE. This is consistent with what entrained air is meant to do: by giving internal vapor pressure somewhere to escape into, the voids appear to blunt crack propagation rather than let it run continuously through the paste, which is one plausible reason air-entrained concrete tends to avoid the more violent, explosive spalling that plain concrete is prone to at these temperatures.
The potential high-temperature role of entrained pores must be separated from their ambient-temperature strength penalty. At ambient temperature, increased porosity reduces the effective load-bearing area and consequently lowers compressive strength. During heating, however, the same pores may provide local accommodation space for vapor expansion and thermally induced deformation and may alter local crack trajectories. These mechanisms could potentially moderate internal pressure accumulation or crack coalescence without increasing absolute strength.
This possible effect may be more relevant to damage development or susceptibility to explosive spalling than to residual compressive strength. However, explosive spalling was not specifically monitored or quantitatively evaluated in the present study. Therefore, no conclusion can be drawn regarding the ability of the investigated air contents to prevent spalling.
Figure 9 compares the microstructural evolution of the control and AE-6 concretes at the selected temperatures. At ambient temperature, the control concrete exhibited a relatively compact cementitious matrix, whereas the AE-6 concrete contained a greater number of approximately rounded and discrete pores attributable to the air-entrainment process. These pores were distributed within the matrix and were distinguishable from the irregular voids associated with incomplete compaction.
Increasing temperatures produced progressive matrix deterioration in both concretes. The control concrete exhibited widening microcracks and a more continuous crack pattern at the higher exposure temperatures. The AE-6 concrete also showed matrix cracking and thermal decomposition; however, in several examined regions, cracks approaching entrained pores either terminated locally or followed a deviated trajectory around the pore boundaries. These observations suggest that entrained pores may locally modify crack propagation by interrupting or redirecting the crack path. Nevertheless, some pores were also associated with interfacial cracking and local matrix weakening, particularly at the highest temperature. Therefore, the SEM observations do not indicate that entrained pores completely prevent cracking; rather, they demonstrate a more complex crack–pore interaction whose effect depends on temperature, pore geometry, and local matrix condition. These two-dimensional observations do not demonstrate that entrained pores universally interrupt crack growth throughout the concrete; the effect is local, and its overall mechanical significance cannot be quantified from the present qualitative SEM images.
The newly added SEM observations provide partial microstructural support for interpreting the macroscopic response of the air-entrained concrete. Compared with the control specimen, the AE-6 concrete exhibited discrete entrained pores that locally interacted with thermally induced cracks. Such pores may provide limited space for vapor expansion and may reduce local stress concentration by altering the crack trajectory. This interpretation is qualitatively consistent with the differences observed in the measured residual properties. However, the pores may also reduce the effective load-bearing area and introduce locally weak regions, explaining why their influence cannot be regarded as uniformly beneficial.
Accordingly, the original assertion that entrained pores “block crack propagation” has been revised. The SEM evidence indicates only that the pores may locally arrest, interrupt, or deflect some cracks within the examined two-dimensional regions. A definitive mechanism would require quantitative measurements of crack density, crack width, pore-size distribution, and crack connectivity. The importance of such quantitative and three-dimensional characterization is also demonstrated by recent high-temperature studies employing physicochemical analyses and X-ray computed tomography for red sandstone and granite [
9,
10].
The progressive microcracking observed in the present SEM images is consistent with the general damage mechanisms reported for high-temperature geomaterials. Lin et al. [
9] associated the deterioration of the physical and mechanical properties of red sandstone with thermally induced mineralogical and internal structural changes. It demonstrated through X-ray CT analysis that thermal shock can transform isolated cracks into more tortuous and interconnected fracture networks. In the present study, the observed interactions between cracks and entrained pores suggest that these pores may locally alter or deflect crack trajectories. However, because SEM provides two-dimensional observations from limited regions, the three-dimensional crack connectivity and the proposed crack-modifying effect of entrained pores cannot be conclusively established without quantitative image analysis or X-ray CT examination.
An important limitation of this study is that water cooling was applied only to the control concrete. Therefore, the interaction between cooling regime and entrained-air content could not be statistically isolated. The findings concerning the 4% and 6% air content mixtures are limited to air-cooling conditions and should not be extrapolated to rapid water cooling. A full factorial program incorporating both cooling regimes at every air-content level is required to establish whether entrained air mitigates or intensifies cooling-induced thermal damage.
The SEM observations provide qualitative evidence of matrix cracking, pore development, and progressive loss of microstructural continuity. They do not provide definitive mineralogical identification. Confirmation of individual calcium-bearing or silicate phases would require complementary XRD and location-specific SEM–EDS analyses.
3.10. Engineering Assessment of Residual Performance
The numerical comparison is given in
Figure 10 and
Table 13. The measured residual reduction factors lie systematically below the EN 1992-1-2 values for siliceous-aggregate normal-weight concrete, and the discrepancy widens with temperature: for the air-cooled control concrete, the deviation increases from approximately 11% at 100 °C to 36% at 400 °C and 56% at 700 °C, reaching 62% for the water-cooled control at 700 °C. This indicates that the Eurocode reduction factors, which describe concrete during fire exposure, would substantially overestimate the capacity remaining after heating and cooling. The comparison therefore supports the distinction between hot-state design values and post-cooling residual properties, and reinforces the conclusion that Eurocode factors should not be applied directly to post-fire residual assessment of the concretes investigated here.
For engineering-oriented interpretation, the residual performance ratio was calculated as RT = PT/P23, where RT is the residual performance coefficient at temperature T, PT is the measured property after thermal exposure, and P23 is the corresponding value at 23 °C. Based on the observed deterioration trends, the exposure range was classified as low-temperature exposure (23–200 °C), moderate thermal damage (200–400 °C), and severe thermal damage (400–700 °C). These coefficients provide a preliminary indication of performance loss but are applicable only to the mixtures and thermal exposure conditions investigated in this study.




 ,
,