1. Introduction
Subway systems have become one of the most heavily relied-upon components of urban transportation infrastructure, and the safe and rapid evacuation of passengers during a disaster is directly tied to the survivability of large numbers of people confined within an enclosed, multi-level structure. As underground stations continue to be constructed at greater depths and with more complex vertical configurations, the demand for reliable evacuation route planning has grown correspondingly, and this demand has motivated a substantial body of research applying seismic risk assessment, structural damage modeling, and evacuation simulation to underground facilities [
1,
2,
3,
4,
5]. Fire is one of the most critical emergency scenarios in underground stations because smoke accumulation, reduced visibility, and limited vertical egress can rapidly reduce the available safe evacuation time [
6,
7,
8]. In such confined and multi-level spaces, even small differences in route allocation can alter local congestion near stairways and exits, thereby affecting the required safe egress time estimated by evacuation simulations [
9,
10,
11,
12].
Among the various components required to build an evacuation model, the pathfinding algorithm that determines the route along which each occupant is guided plays a decisive role, since it is this algorithm that ultimately produces the maximum evacuation time used to judge whether a station design satisfies a given safety criterion. Dijkstra’s algorithm, an uninformed search method that guarantees the true shortest path by exhaustively evaluating every reachable route, and the A* algorithm, its heuristic-guided counterpart, remain the two most widely adopted baseline methods for evacuation route generation [
13,
14]. Building on or benchmarking against these two algorithms, a substantial body of work has proposed refinements for specific hazard contexts: comparative evaluations against alternative shortest-path formulations such as Bellman–Ford [
15]; smoke-aware and hazard-aware variants of A* for subway and building fires [
16,
17]; applications to wildland and forest fire evacuation combining improved A* with remote-sensing data [
18,
19]; swarm- and metaheuristic-based route planners for underground mine fires [
20,
21]; hybrid ant-colony and cellular-automaton formulations for crowd-scale evacuation [
22]; congestion-aware k-shortest-path and multi-path allocation strategies [
23]; capacity-constrained variants of Dijkstra’s algorithm coupled with dynamic exit signage [
24]; distributed, cyber–physical implementations of path planning [
25]; and combined route–departure-time optimization under traffic control [
26]. In the specific context of subway and metro stations, simulation-based studies have further examined how station geometry, passenger flow, and real-time data affect achievable evacuation performance [
27,
28], and reinforcement-learning-based routing has recently been explored as an alternative to fixed shortest-path guidance [
29]. Across this literature, Dijkstra’s algorithm is consistently treated as a stable, reproducible baseline against which more sophisticated methods are compared. A parallel body of work formulates evacuation as a mathematical programming problem rather than a routing problem, representing the facility as a time-expanded network and solving for system-optimal flows using linear and mixed-integer linear programming [
30,
31,
32,
33]. These macroscopic formulations yield provably optimal clearance times and are well suited to capacity allocation across a whole facility, but they assign aggregate flows to links rather than generating the individual route each occupant follows, and their computational cost grows rapidly with the size of the time-expanded network. For station-scale simulations in which each occupant must be routed at every time step, shortest-path methods therefore remain the standard choice, and it is the behavior of these methods that the present study examines.
However, the treatment of Dijkstra’s algorithm as inherently reproducible rests on an assumption that is rarely examined directly, namely that the shortest path between a given origin and destination is unique. This assumption does not generally hold in networks with substantial structural regularity [
34,
35,
36]. Underground stations are frequently modeled as graphs composed of repeating horizontal concourse nodes and vertical stair nodes arranged in a symmetric layout, and in such networks it is common for two or more distinct routes to accumulate exactly the same total cost. When a standard implementation of Dijkstra’s algorithm encounters this kind of tie, the decision of which route to retain is resolved by whichever candidate happens to be processed first in the algorithm’s internal search order [
34], a decision that in practice is governed by an arbitrary implementation-dependent rule, such as node ordering or priority-queue insertion order, rather than by any criterion related to safety or route quality. Because this decision is repeated at every tied comparison throughout the search, the specific evacuation route ultimately assigned to each occupant, and by extension the maximum evacuation time computed for the network as a whole, is capable of varying between separate executions of the algorithm on the identical network, even though every such execution produces a path of equal, and therefore equally “optimal,” cost. The consequences of leaving this choice unspecified are well recognized in network engineering, where explicit and consistent tie-breaking rules have had to be standardized so that shortest-path forwarding is reproducible in symmetric topologies [
37].
This source of variability has a close parallel in the broader evacuation modeling literature, although it has not previously been examined in this particular form. Repeated Monte Carlo simulation has long been used to characterize evacuation performance in the presence of uncertainty, and studies resampling occupant-level parameters such as walking speed, pre-movement delay, and exit choice have shown that a single simulation run can differ substantially from the statistically expected outcome, with reliable estimates only emerging after a sufficient number of repeated trials [
38,
39,
40,
41,
42]. In these studies, however, the randomness originates from the behavior of the occupants being simulated, while the routing algorithm that assigns paths is treated as a fixed, deterministic component of the model [
43]. The situation examined in the present study is essentially the reverse of this: the occupant population, the station geometry, and the disaster conditions are all held fixed, and the sole source of randomness lies within the pathfinding algorithm’s own internal tie-breaking behavior.
Three gaps therefore remain. First, the non-uniqueness of shortest paths in structurally regular station networks has not been treated as a source of uncertainty in evacuation modeling, even though such networks are precisely the ones for which equal-cost routes are unavoidable. Second, the rule that resolves this non-uniqueness is left implicit in standard implementations of Dijkstra’s algorithm and is therefore neither reported nor controlled, so that an evacuation time obtained from one implementation cannot be assumed to be reproducible in another. Third, although the number of repeated runs required to characterize occupant-level randomness has been examined in detail, no equivalent guidance exists for randomness originating within the routing algorithm itself.
The aim of this study is to quantify how much the maximum evacuation time of an underground station varies solely as a result of equal-cost path selection, and to determine how many repeated executions are required before that variability is adequately characterized. The three gaps are addressed as follows. To address the first, a six-level underground station network in Seoul comprising 720 nodes and 2222 edges is used as the test case, since its uniform 3 m grid and repeated vertical connections generate equal-cost paths in large numbers. To address the second, the tie-comparison step of Dijkstra’s algorithm is modified so that ties are resolved by a seeded random draw rather than by an unexamined implementation artifact, which makes the decision explicit, controllable, and reproducible for a given seed. To address the third, the evacuation simulation is executed repeatedly under independently generated seeds, with the station geometry, occupant population, and movement parameters held fixed, and the resulting maximum evacuation times and route sets are analyzed as a function of the number of repetitions. The intended contribution of this work is a quantified account of how far a single Dijkstra execution can depart from the outcome obtained by repeated sampling, together with an indication of how many repetitions are required before an estimate can be regarded as stable, so that evacuation assessments in underground stations can state the basis on which their reported evacuation time rests.
The remainder of this paper is organized as follows.
Section 2 describes the role of Dijkstra’s algorithm in the evacuation model, the modification made to its tie-comparison step, and the simulation model built around it.
Section 3 presents the underground station network, the pedestrian movement and congestion parameters, and the iteration cases analyzed.
Section 4 reports the maximum evacuation times and the evacuation routes obtained across the repeated executions.
Section 5 discusses the implications of these results for evacuation assessment and for design practice, and
Section 6 summarizes the conclusions.
2. Randomized Dijkstra Algorithm and Evacuation Simulation Model
This section describes the two components on which the analysis rests: the randomized Dijkstra algorithm and the evacuation simulation model built around it. The first part explains the role of Dijkstra’s algorithm as the routing engine of the evacuation model, the reasons for adopting it as the sole routing method, and the way the tie-breaking step was modified so that the choice between equal-cost predecessors is made explicitly through a seeded random draw rather than left to the internal processing order of the priority queue. The second part describes how this randomized algorithm was embedded in a time-stepped evacuation simulation, including the data structures used, the alternation between route computation and passenger movement, and the outputs recorded from each run. Together, these two components make it possible to isolate the variability in evacuation outcomes that is attributable solely to equal-cost path selection.
2.1. Role of Dijkstra’s Algorithm in the Evacuation Model
In the evacuation model used in this study, Dijkstra’s algorithm serves as the routing engine that assigns each group of evacuees its next movement at every second of the simulation. Unlike a one-time shortest-path computation, the algorithm is re-executed for every occupied node at every time step, using edge travel times that reflect the congestion present at that moment. The maximum evacuation time reported for a station is therefore the cumulative product of many thousands of individual routing decisions, and any indeterminacy in those decisions propagates directly into the reported safety indicator. Dijkstra’s algorithm was adopted as the sole routing method because it is an exhaustive, uninformed search that evaluates every reachable path before finalizing a node and is therefore guaranteed to return a cost-optimal route [
13]; it is also the most widely used baseline in evacuation-routing studies [
14,
15,
16,
17,
18,
19,
20,
21,
22,
23,
24,
25,
26], so that any variability inherent to it is directly relevant to that body of work. Heuristic methods such as A* were deliberately excluded, not because of any limitation in their routing performance, but because they cannot isolate the property examined here. Quantifying the effect of equal-cost path selection requires that the set of tied candidates at each node be complete and determined solely by the network and the cost function, which an exhaustive uninformed search guarantees. In A*, the heuristic prunes the search, so whether a given equal-cost alternative is generated at all depends on the admissibility and tightness of the heuristic and on the expansion order of the open set. Variability observed under A* would therefore combine tie-breaking effects with heuristic-dependent differences in enumeration, which cannot be separated within a single run. Dijkstra’s algorithm is also the baseline against which A* and its variants are defined and validated [
14,
16,
17,
18,
19], so variability inherent to it bears directly on the heuristic methods built upon it.
In its standard form, Dijkstra’s algorithm assigns every node a tentative cost, initialized to infinity except at the start node, and repeatedly finalizes the unvisited node of lowest tentative cost. Each time a node is finalized, the algorithm examines its neighbors and computes, for each, a candidate cost equal to the finalized node’s cost plus the connecting edge’s travel time. The neighbor’s tentative cost and its recorded predecessor are updated only if this candidate cost is strictly lower than the value already stored. Once all nodes have been finalized, the route is recovered by tracing predecessors back from the destination. The strict inequality in this update rule is the point at which the present study intervenes.
The property in question arises from how the algorithm treats equal-cost candidates. The standard procedure updates a node’s tentative cost and predecessor only when a strictly lower cumulative cost is found; when a newly computed cost is exactly equal to the existing tentative cost, the node is left unchanged, and its predecessor remains whichever candidate happened to reach it first in the priority-queue processing order [
34]. In an irregular network this situation is rare and inconsequential. In the network examined here, however, it is pervasive by construction: every horizontal edge carries the same 3 s travel time, every vertical edge the same 12 s, and concourse and stairway nodes are arranged in a repeating grid across six stacked levels. Under these conditions, a platform node and an exit node are connected by a large number of geometrically distinct paths of identical cumulative cost, and which of them the algorithm returns is decided not by the cost function but by an implementation artifact—node numbering, adjacency-list order, or queue insertion order—that has no relation to route quality or safety.
To make this hidden decision explicit and controllable, the tie-comparison step was modified so that, whenever a candidate path’s cumulative cost exactly equals a node’s current tentative cost, the algorithm draws from a seeded pseudo-random number generator and, with equal probability, either retains the existing predecessor or replaces it with the new candidate. This is the sole modification made to the standard procedure; cost initialization, node selection, and the strict-inequality update rule are unchanged. Because the draw is taken from a seeded stream, a given seed reproduces an identical sequence of tie-breaking decisions and hence an identical evacuation outcome, while changing the seed alters those decisions in a controlled way. Equal probability was used because equal-cost candidates are by construction indistinguishable under the cost function, so that any unequal weighting would introduce a preference which neither the network nor the objective supplies. The rule is a sampling device rather than a model of any deployed implementation: real implementations resolve ties deterministically and return the same route on every execution, and what varies is which route different implementations return, so that randomizing the decision converts a quantity fixed and unexaminable within a single implementation into one that can be sampled. It should also be noted that applying a probability of 0.5 at each individual tie does not yield a uniform distribution over all complete equal-cost routes, since routes passing through more tie points are reached through more successive draws; the objective is to sample the space of equally optimal outcomes broadly enough to characterize the resulting variability, not to sample it with uniform weight.
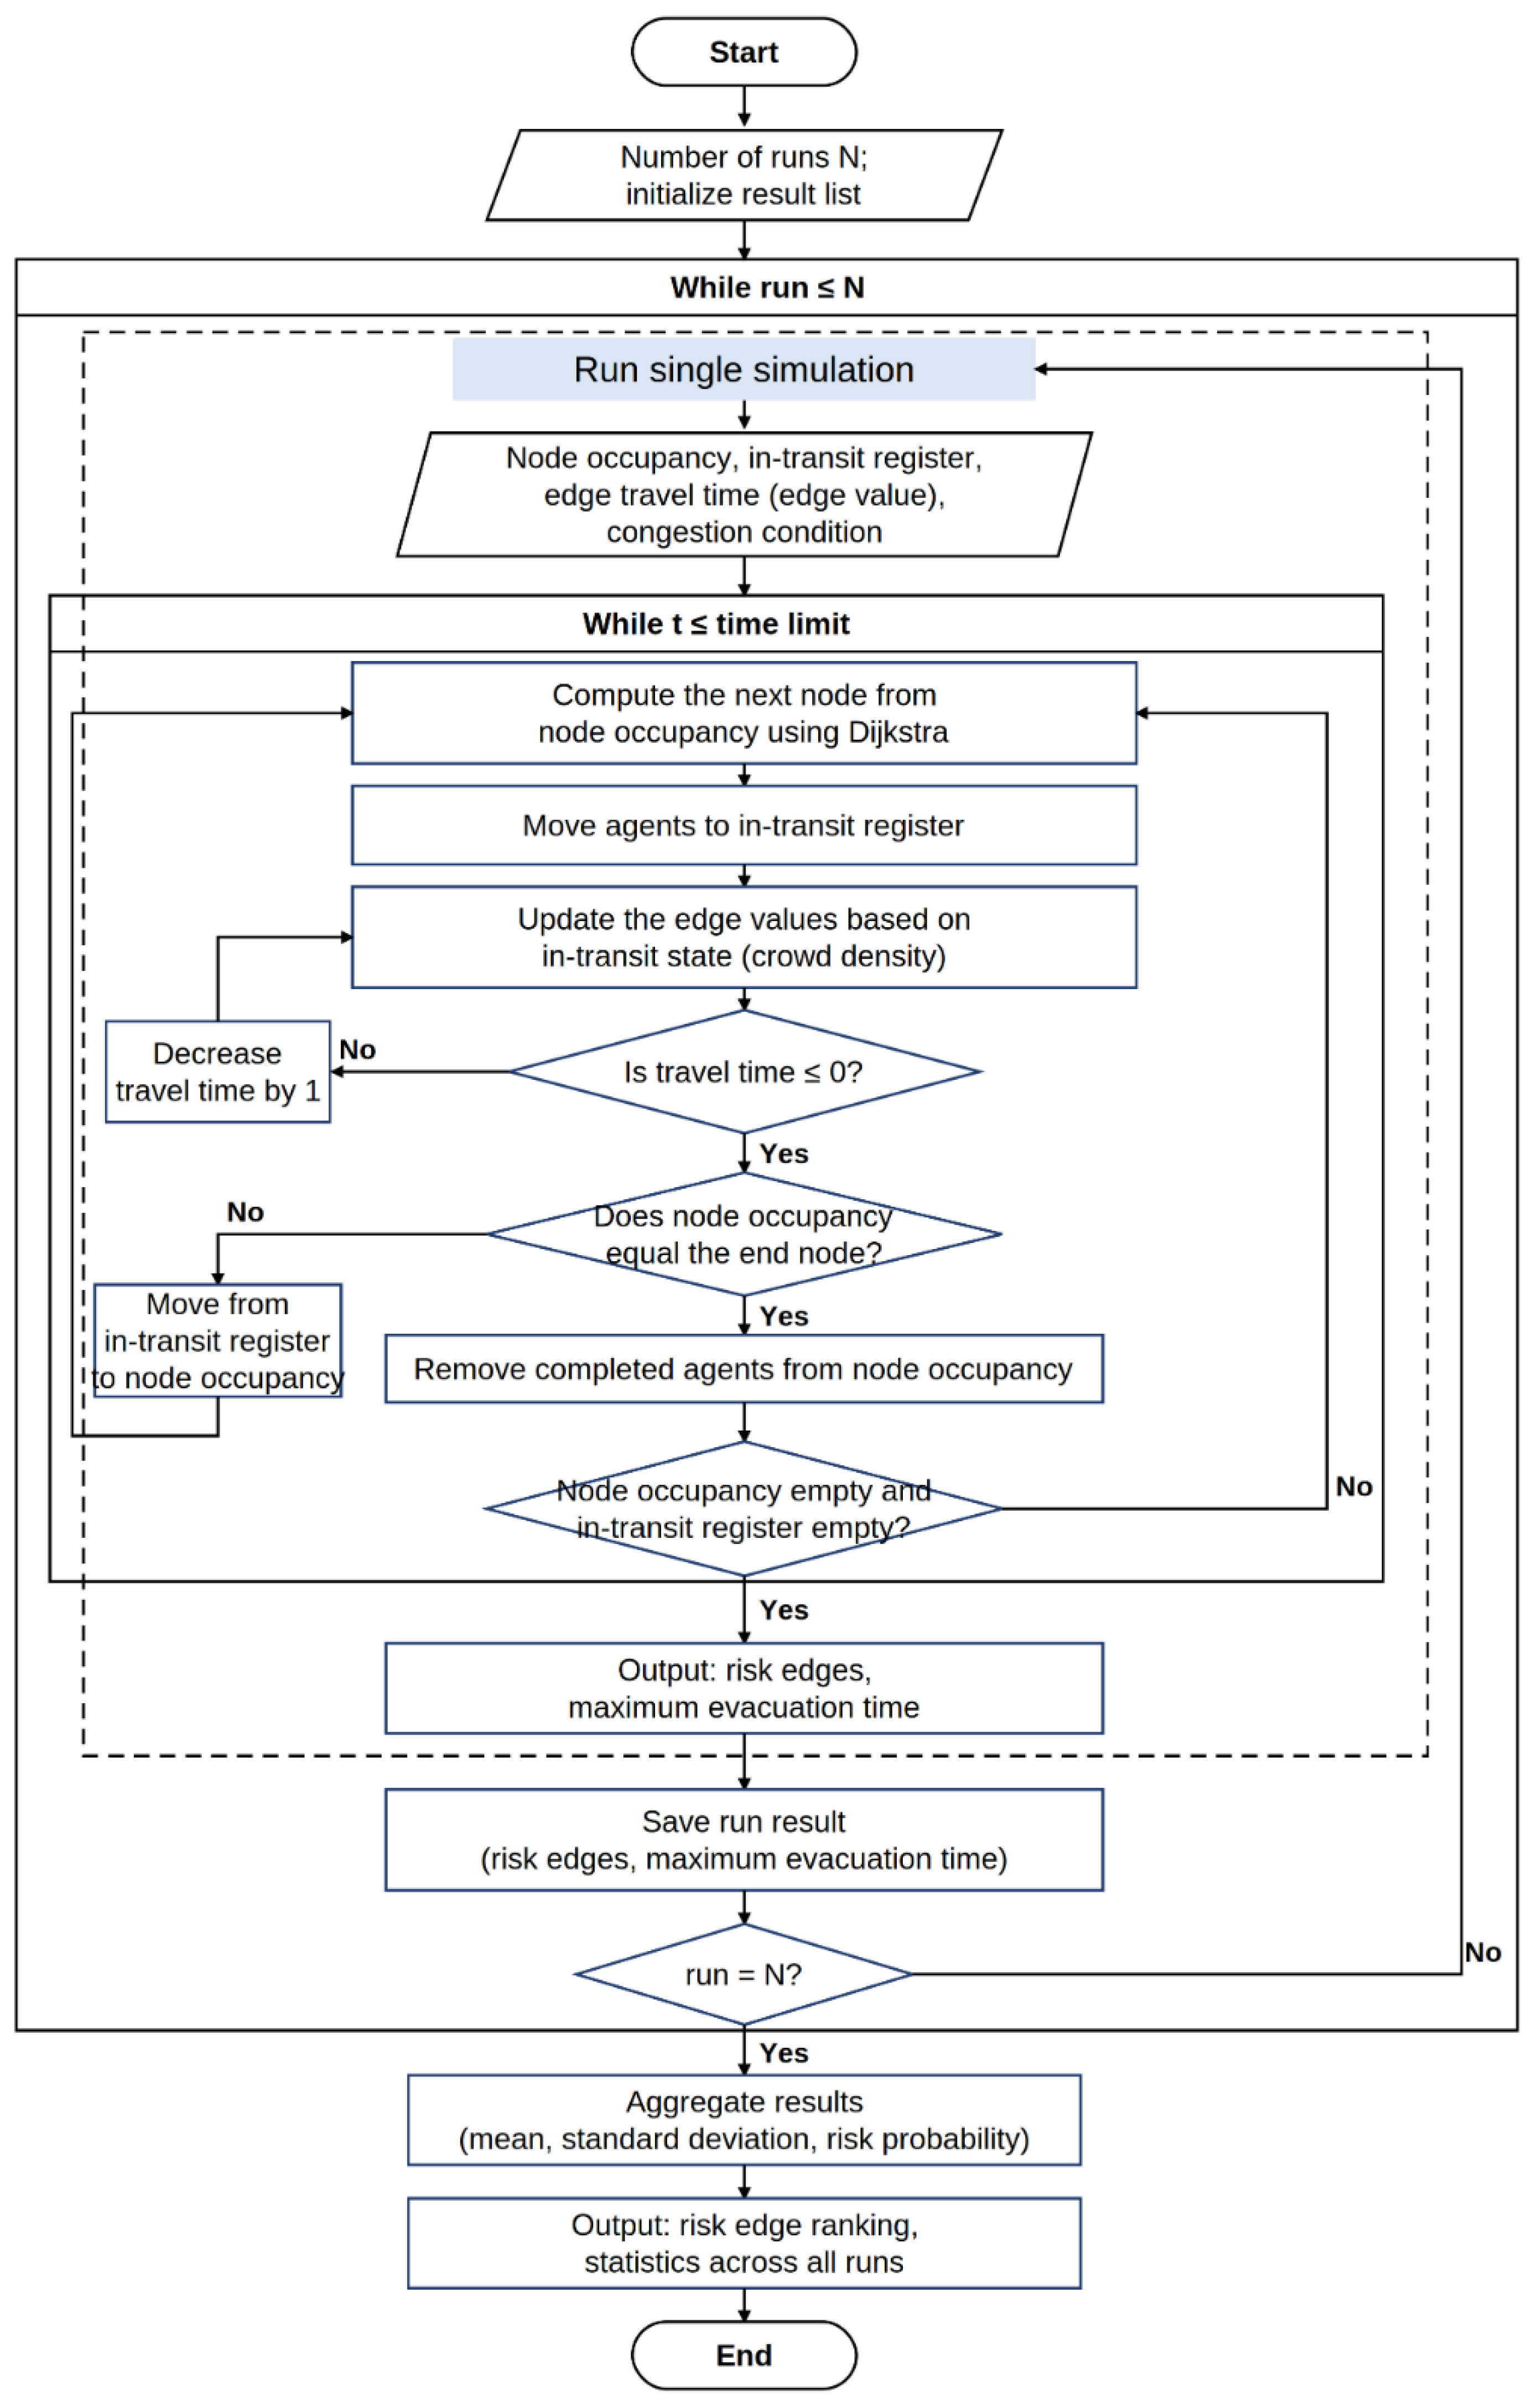
Figure 1 shows how this randomized routing step is embedded in the overall evacuation simulation: at every time step of a run, the modified Dijkstra algorithm is executed for each occupied node to determine the next movement of the evacuees located there, and the complete run is then repeated under independently seeded random streams to obtain the distribution of outcomes analyzed.
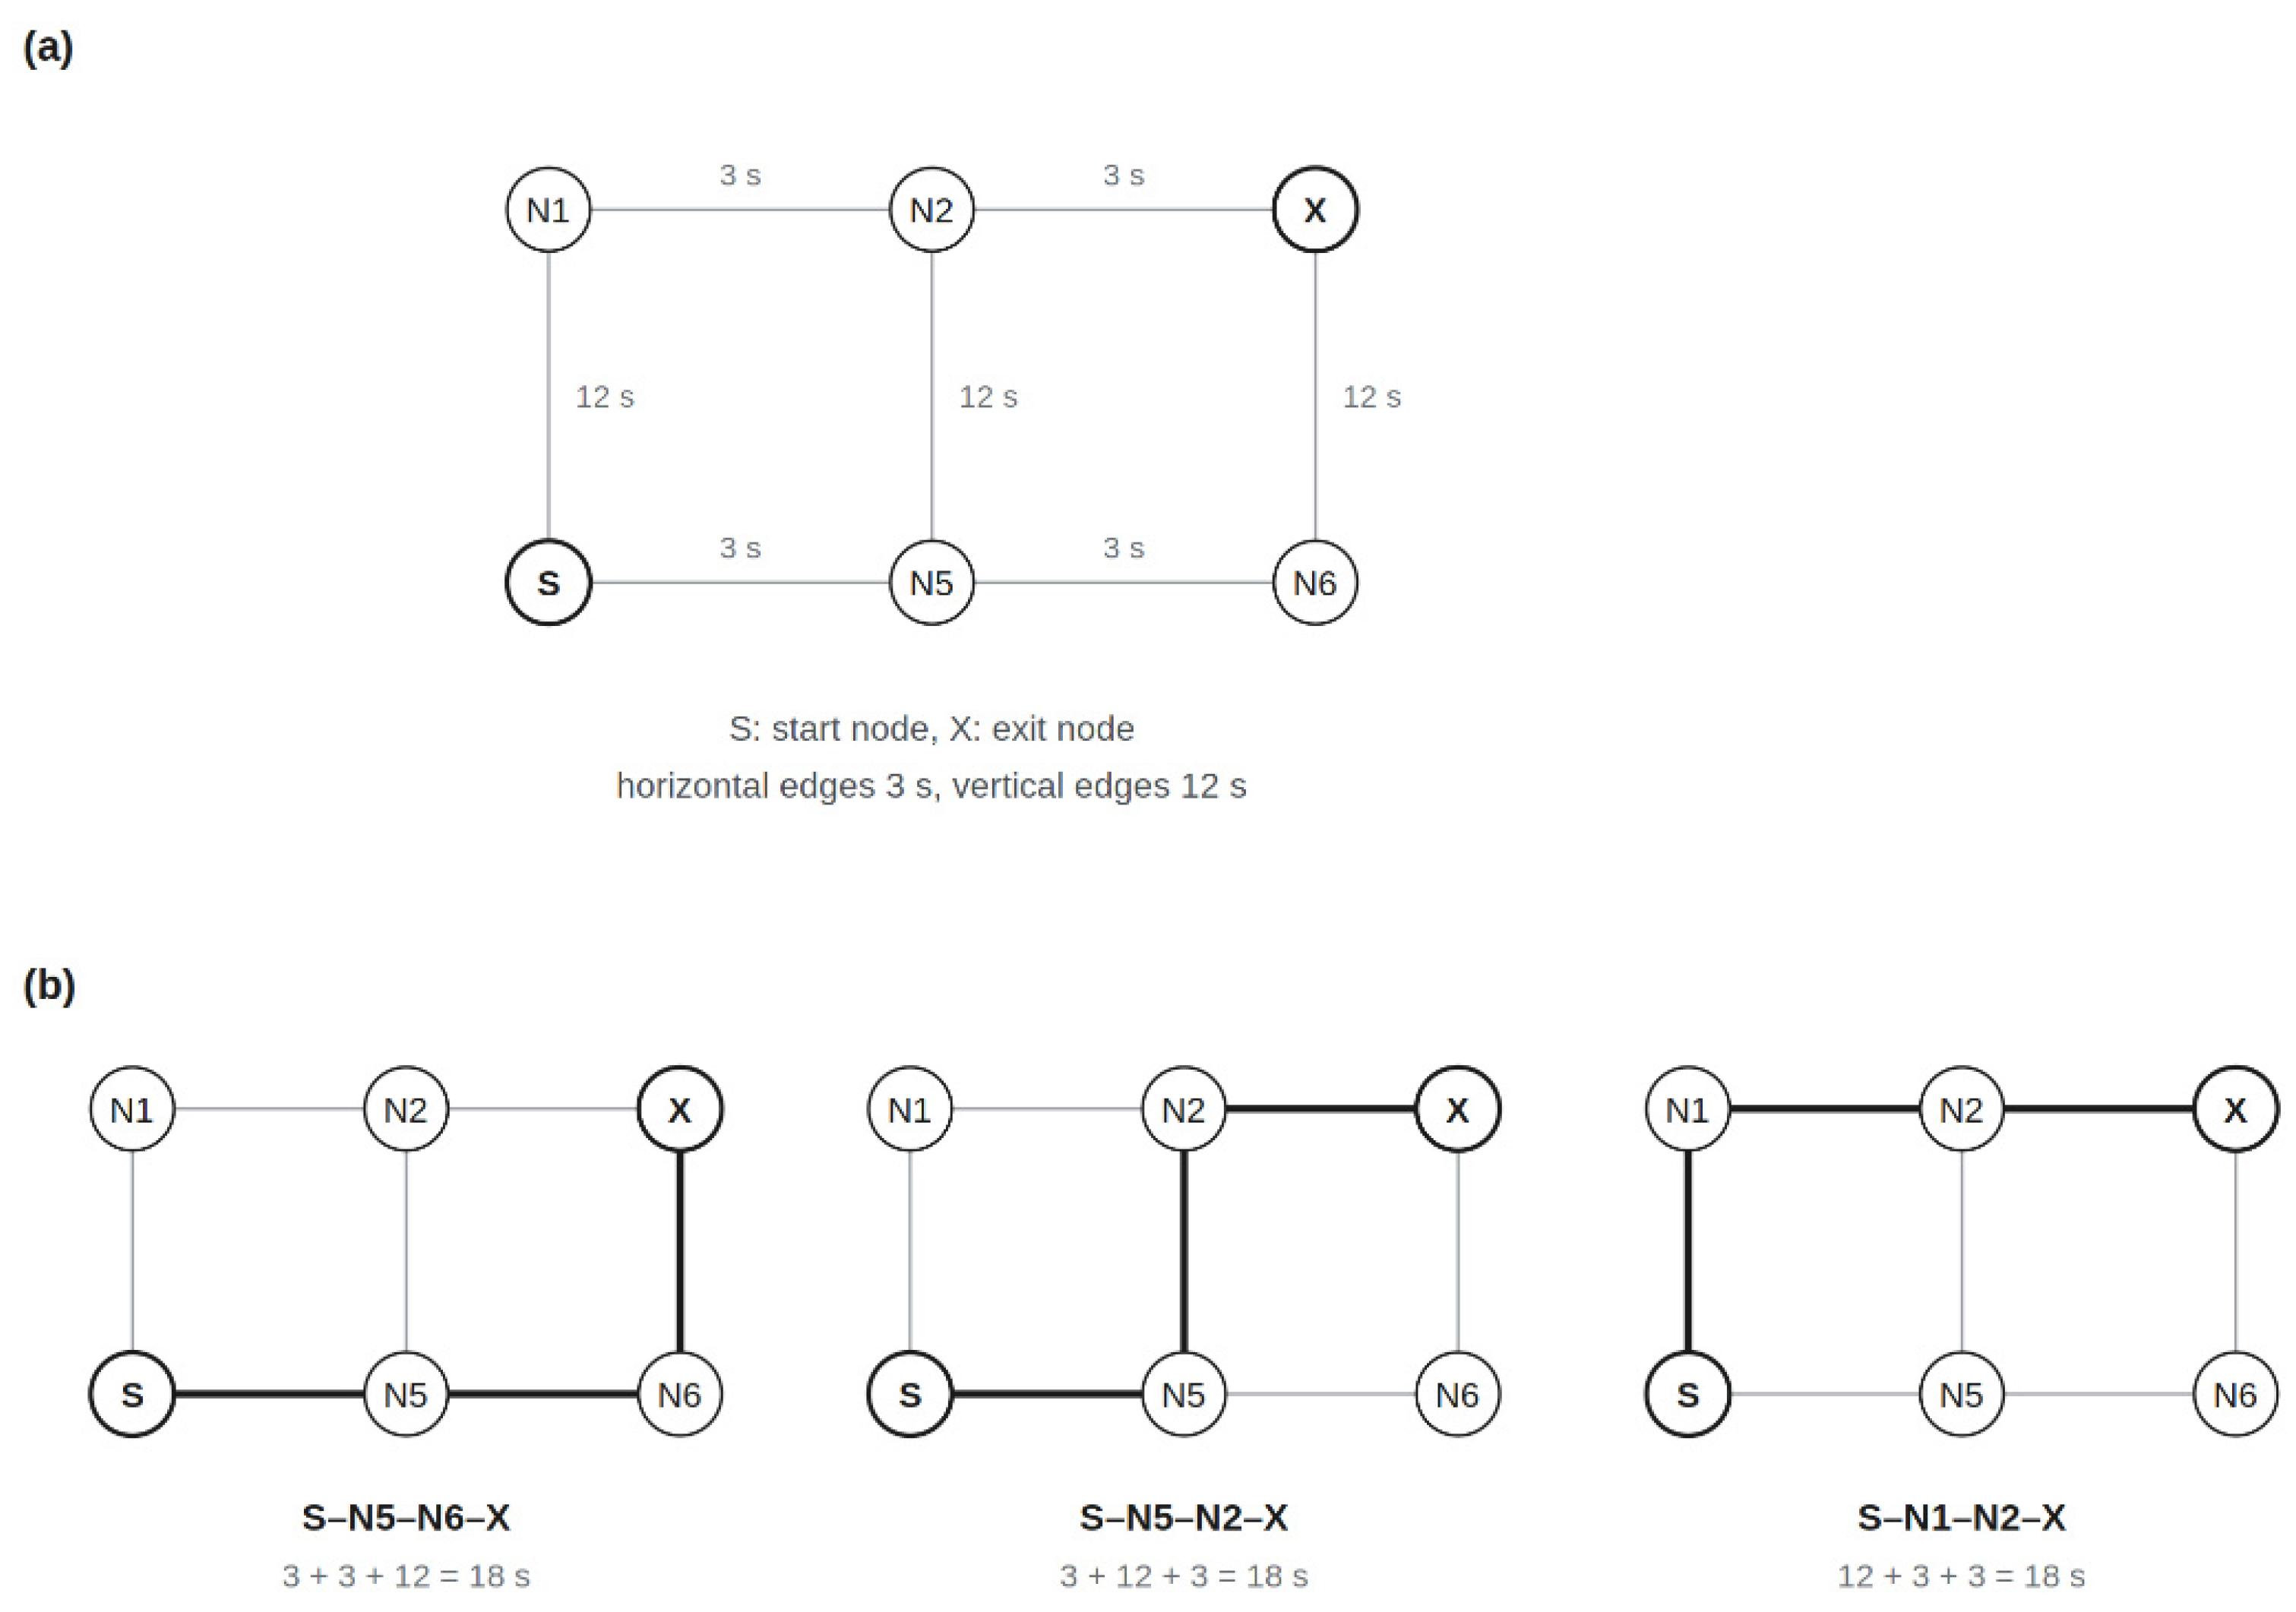
Figure 2 illustrates the behavior described above on a small network that reproduces the relevant features of the station model: a uniform horizontal edge cost of 3 s, a uniform vertical edge cost of 12 s, and a repeated grid arrangement. Three geometrically distinct paths connect the start node S to the exit X, and all three cost 18 s: S–N5–N6–X (3 + 3 + 12), S–N5–N2–X (3 + 12 + 3), and S–N1–N2–X (12 + 3 + 3).
Starting from S, the neighbors N5 and N1 receive tentative costs of 3 s and 12 s. N5 is finalized first and assigns N6 a cost of 6 s and N2 a cost of 15 s, recording itself as the predecessor of both. N6 is finalized next and assigns X a cost of 18 s. When N1 is finalized, it computes a candidate cost for N2 of 12 + 3 = 15 s, exactly equal to the value N2 already holds. The strict inequality fails, so nothing is changed and N2 retains N5 as its predecessor solely because N5 was processed first. When N2 is finalized in turn, it computes a candidate cost for X of 15 + 3 = 18 s, again exactly equal, and the predecessor of X is again left unchanged. The algorithm therefore returns S–N5–N6–X, and the other two paths are never returned despite being equally optimal; which of the three is returned is decided by the processing order of N5, N1, and N6, that is, by node numbering and priority-queue behavior rather than by the cost function.
Under the modified rule, each of these two equalities triggers a draw from the seeded random number generator, and the predecessor is replaced with probability 0.5, so that all three paths are returned with non-zero probability across repeated runs. In a six-node example, the choice among three equal-cost paths is immaterial. In the station network of
Section 3, however, the corresponding choice is made many times within every routing pass and at every time step, distributing evacuees differently among stairways and exits, so that congestion, and hence the maximum evacuation time, differs between realizations even though every route selected is cost-optimal.
2.2. Evacuation Simulation Model
An evacuation simulation model was then built around this randomized algorithm, using the same six-level underground station, in order to see how much variation the tie-breaking mechanism introduces into the evacuation outcomes. The baseline edge weights in the network were held fixed across all runs, while the effective travel time during evacuation was modified only by the congestion rule applied identically to every random seed. Therefore, differences observed between runs can be attributed to tie-breaking-induced route allocation and the resulting congestion development, rather than to changes in the underlying station topology or fire-hazard condition. Python 3.12.0 was used to implement the simulation.
The evacuation simulation advances in discrete steps of 1 s and is driven by three state variables, defined in
Table 1. The node occupancy records the number of evacuees present at each node at the current time step and is used both to determine which nodes require a routing decision and to evaluate the congestion factor applied at that node. The in-transit register holds every group of evacuees currently moving along an edge, together with its origin node, destination node, and remaining travel time. The edge travel time stores the baseline time required to traverse each edge under unobstructed conditions.
At the start of each time step, the randomized Dijkstra algorithm is executed for every node with non-zero occupancy, using edge travel times adjusted by the congestion factor corresponding to the current occupancy of each node. The evacuees at that node are then transferred from the node occupancy to the in-transit register, with a remaining travel time equal to the adjusted travel time of the selected edge. The remaining travel time of every group in the in-transit register is then decremented by 1 s; groups whose remaining travel time reaches zero are transferred back into the node occupancy at their destination node. Groups arriving at an exit node are removed from the simulation and their arrival time is recorded. Because routing is performed at every time step for every occupied node, and because the routing algorithm consults the same seeded random stream throughout a run, a single simulation involves a very large number of individual tie-breaking decisions whose cumulative effect determines the routes actually followed.
The simulation terminates when the node occupancy and the in-transit register are both empty. The maximum evacuation time is defined as the arrival time of the last evacuee at an exit node, and the set of routes actually traversed is retained for analysis. Because each run is initialized with an independently seeded random stream, repeated execution under different seeds yields a distribution of maximum evacuation times and route sets for the same station and evacuee population rather than a single fixed value.
3. Analysis Condition
This section sets out the conditions under which the simulations were carried out. The six-level underground station used as the case study is described first, including its node–link representation and exit configuration. The pedestrian evacuation speeds used to convert edge lengths into travel times are then presented, followed by the congestion-dependent speed reduction and the initial distribution of evacuees across the station. Finally, the analysis cases are defined in terms of the number of random seeds examined. All of these conditions were held identical across every run, so that any difference observed between runs can be attributed to tie-breaking alone.
3.1. Underground Station Model
The evacuation simulation was carried out on a six-level underground station located in Seoul, represented as a graph of 720 nodes and 2222 edges built from the station’s actual layout [
44]. Nodes fall into three categories: 662 horizontal nodes covering platform, concourse, and corridor areas; 56 vertical nodes representing the stairways connecting adjacent levels; and 2 exit nodes marking the points of egress to the surface. Edges connect adjacent nodes and are weighted by the travel time required to move across that segment.
This station was selected for two reasons. First, at six underground levels it is deep enough that evacuation is governed by vertical movement through stairways, and the resulting evacuation times are long enough for differences in route allocation to accumulate into a measurable difference in the maximum evacuation time. Second, the station has a limited number of exits serving a regular internal layout, so that evacuees from all levels must converge on a small number of egress points while the uniform grid and repeated stairway geometry generate equal-cost paths throughout the network rather than at isolated locations. These two properties make the station a case in which congestion governs the outcome and in which the routing decision that distributes evacuees among stairways can be observed clearly; a shallower station, or one with abundant exits or irregular geometry, would generate fewer equal-cost paths and weaker congestion-driven interaction between routes. The station is therefore not presented as representative of underground stations in general, but as a case in which the mechanism under study is present in a form that can be measured.
Horizontal nodes were spaced 3 m apart, with the platform level made up of 41 such nodes spanning 120 m in total. Vertical nodes representing the stairways connecting adjacent levels were spaced at the same 3 m interval. Every edge in the network, whether connecting two horizontal nodes or two vertical nodes, therefore corresponds to the same 3 m × 3 m unit cell, and this uniform spacing was applied consistently across all six levels of the station.
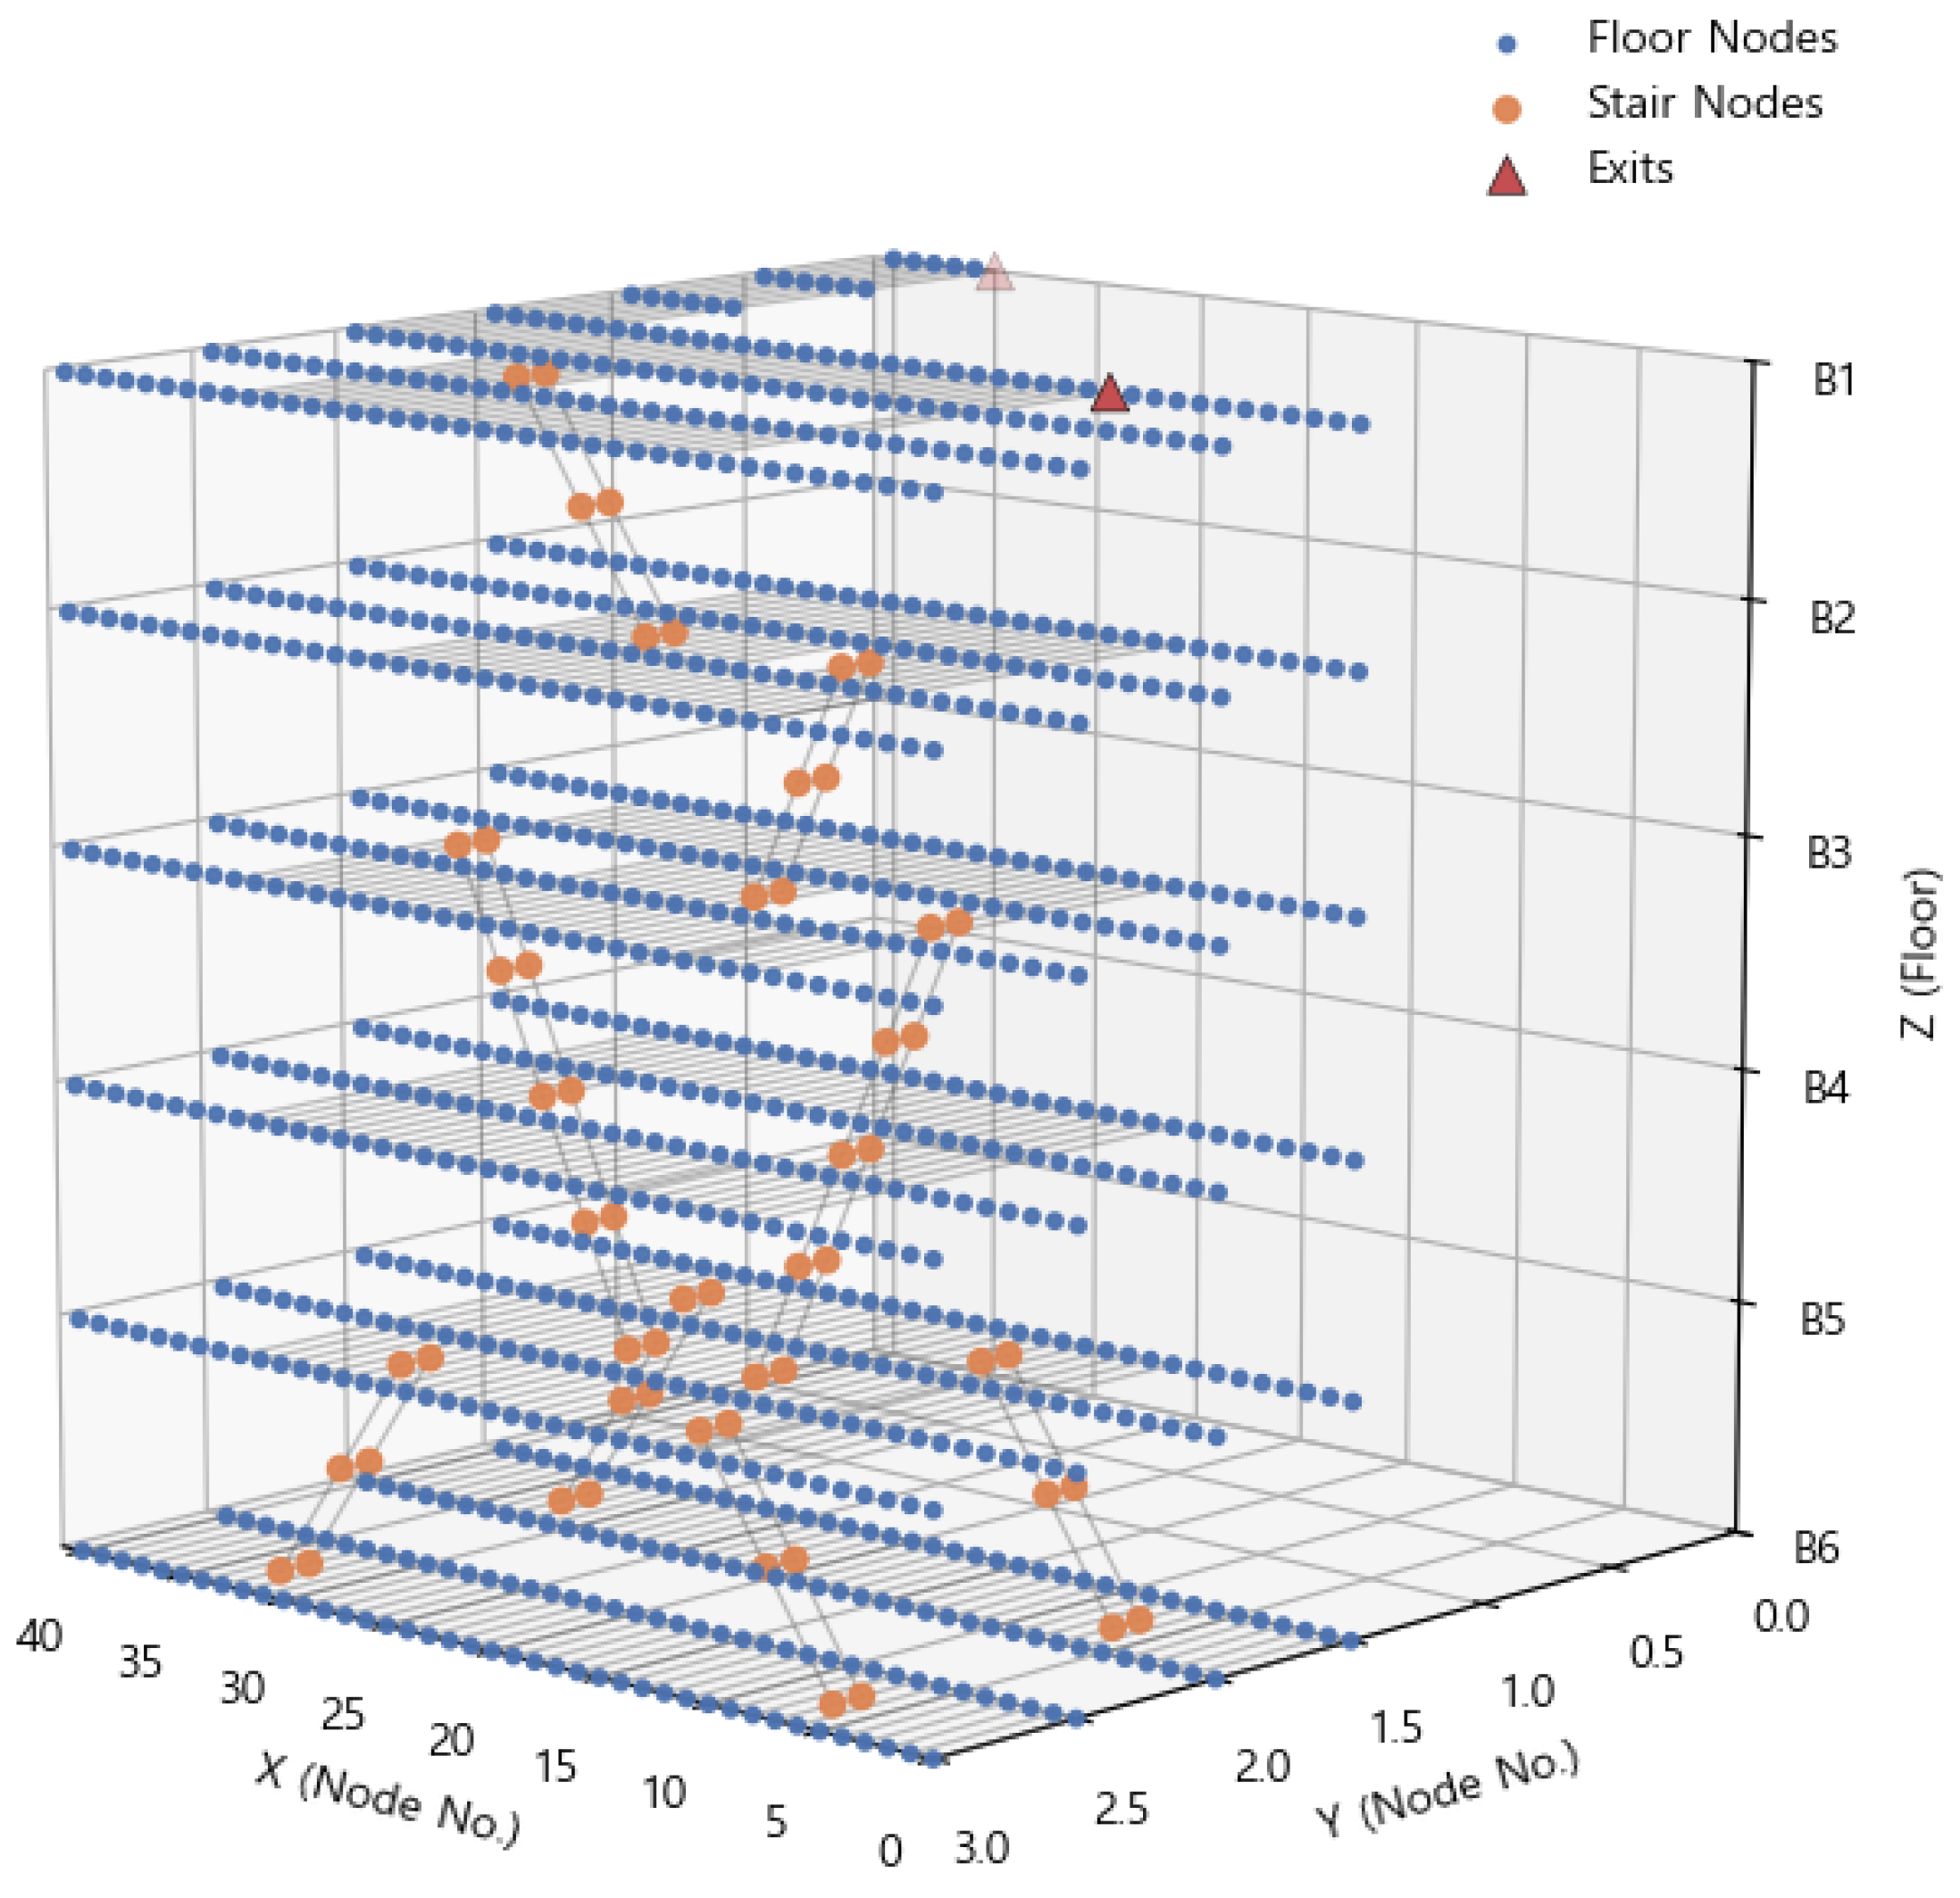
Table 2 summarizes the resulting node and edge counts, and
Figure 3 shows the three-dimensional layout of the modeled station, with horizontal nodes in blue, stair nodes in orange, and exit nodes shown as red triangles.
The station has six underground levels with a uniform floor-to-floor height of 3.0 m and the exit nodes are located at ground level. Adjacent levels are connected by straight stairways with a width of 6.0 m, an inclined length of 6.0 m, and a slope angle of 30° to the horizontal, giving a horizontal projection of approximately 5.2 m per flight and a vertical rise equal to the 3.0 m floor height. Each platform is 120 m long and is discretized into 41 horizontal nodes at 3 m intervals along its centerline; concourse and corridor areas on the intermediate levels are discretized on the same 3 m grid. The vertical node spacing of 3 m is measured along the inclined length of the stairway, so that each flight between adjacent levels is represented by two vertical edges. Combined with the stairway movement speed of 15 m/min, this yields a travel time of 24 s per flight, or 120 s for the five flights between the lower platform level and the surface under unobstructed conditions. The horizontal and vertical dimensions described here are those on which all edge travel times in the network are based, and
Figure 3 shows the resulting three-dimensional layout.
The present study focuses on the route-generation component of underground-station fire evacuation analysis. To isolate the effect of algorithmic tie-breaking, smoke spread, thermal exposure, structural damage, and hazard-induced route blockage were not introduced in the baseline simulations. Accordingly, the station topology and baseline edge travel times were kept identical across all random seeds, while differences in evacuation outcomes arose from tie-breaking-induced route allocation and the resulting congestion patterns.
3.2. Pedestrian Evacuation Speed
Converting the network’s edge weights from spatial distance to travel time required a defined pedestrian movement speed, and this study adopted the values recommended in the design guidelines published by the Korean Ministry of Land, Infrastructure and Transport (MOLIT) [
45]. Horizontal movement, covering platform, concourse, and corridor areas, was set at 60 m/min, while vertical movement along stairways was set at 15 m/min. These two figures represent the standard reference speeds used in Korean design practice for assessing evacuation performance in urban railway stations.
Applying these speeds to the node spacing gives the travel time assigned to each edge type. For horizontal edges, a spacing of 3 m combined with a speed of 60 m/min, equivalent to 1 m/s, produces a travel time of 3 s. For vertical edges, the same 3 m spacing combined with a speed of 15 m/min, equivalent to 0.25 m/s, produces a travel time of 12 s, so that a single flight of stairs between adjacent levels, represented by two vertical edges, requires 24 s. These two values, 3 s for horizontal edges and 12 s for vertical edges, form the complete set of baseline edge weights used throughout the network; no other travel-time values appear in the model.
These baseline edge weights represent movement under unobstructed fire-evacuation routing conditions before the introduction of smoke-induced visibility loss, thermal exposure, or route blockage. They were intentionally kept fixed to isolate the route-selection uncertainty caused by Dijkstra tie-breaking. During the evacuation simulation, the effective travel time was modified only by the congestion rule, and this rule was applied identically for all random seeds. Therefore, differences in evacuation time among repeated runs can be attributed to the interaction between tie-breaking-induced route allocation and congestion development, rather than to changes in the underlying fire-hazard condition.
3.3. Crowd Density and Evacuee Distribution
Two further inputs complete the baseline fire-evacuation simulation: a congestion-dependent adjustment to travel time and an initial distribution of evacuees across the station.
Every edge in the network occupies the same 3 m × 3 m unit cell established, giving each node a floor area of 9 m
2. Congestion thresholds were derived from this area together with a domestic crowd-safety criterion stating that movement becomes effectively impossible once density reaches 5 persons/m
2 [
46] which translates into an upper limit of 45 persons for a single 9 m
2 node. Below that limit, occupancy was divided into four density bands, each assigned a speed-reduction factor: 9 persons or fewer produced no reduction, 9 to 18 persons produced a factor of 2, 18 to 27 persons a factor of 2.5, and more than 27 persons a factor of 5, as summarized in
Table 3.
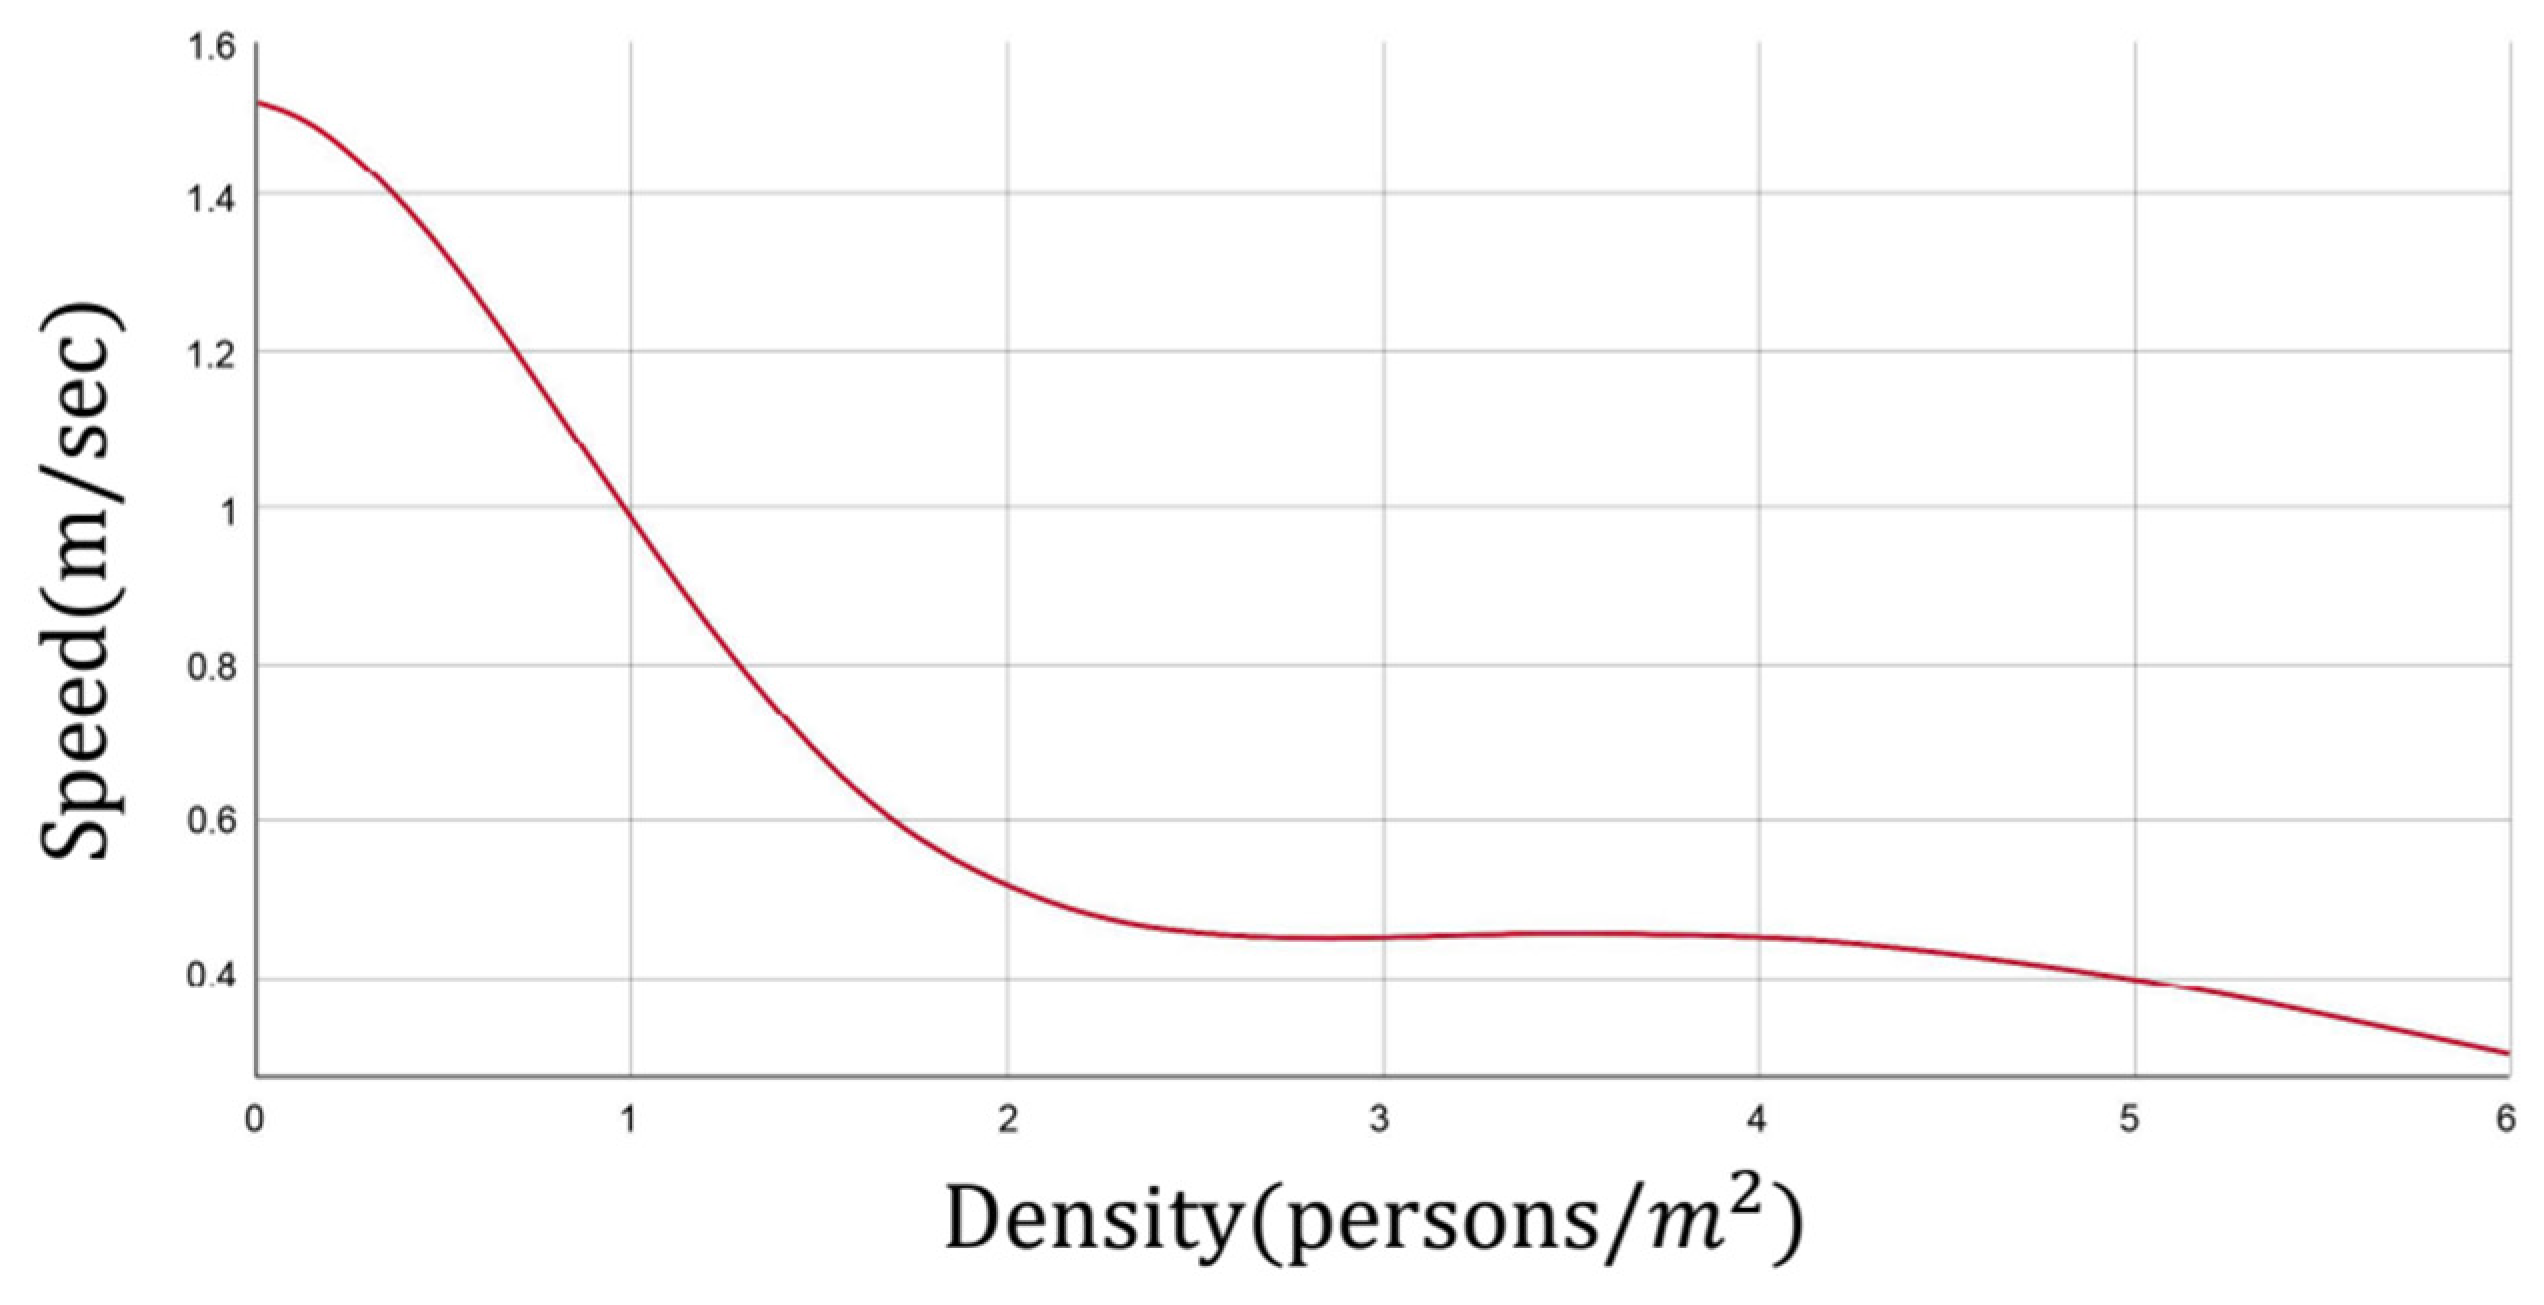
The shape of this reduction was informed by the relationship between occupant density and walking speed reported by Zhou et al. [
47], shown in
Figure 4, which shows walking speed falling sharply between roughly 1 and 2 persons/m
2 before leveling off at higher densities. The congestion factor was applied as a divisor to the baseline walking speed at every node, at every second of every run, identically regardless of which random seed was in use, so that congestion never becomes a confounding variable when comparing outcomes across different seeds.
Evacuees were placed on the two platform levels of the station, with 410 passengers assigned to the upbound platform and 410 to the downbound platform, for a total of 820 evacuees. Passengers were distributed evenly across the platform nodes, with 5 evacuees placed at each node. This starting population was kept identical across every random seed, and any difference between simulation runs therefore comes down to the sequence of tie-breaking decisions the algorithm happens to make during that particular run. The evacuee distribution was held fixed across all executions as an experimental control rather than as an assumption about how occupants are distributed in practice. Varying the initial distribution between runs would generate variability in the maximum evacuation time irrespective of how equal-cost paths were resolved, and the two contributions could not then be separated; holding it fixed ensures that the spread reported in
Section 4 is attributable to the tie-breaking realization alone.
3.4. Analysis Case
The central question this study sets out to answer is how much the maximum evacuation time reported for a single execution of Dijkstra’s algorithm can be trusted, given that the algorithm’s tie-breaking behavior is random rather than fixed. Answering this required moving away from the conventional practice of running the simulation once and treating its output as the network’s evacuation performance, and instead building a sampling design capable of revealing how that output behaves across many independent executions.
A pool of 1000 random seeds was generated, each seed initializing an independent pseudo-random number stream that governs every tie-breaking decision made throughout one complete simulation run, from the first second of evacuation until the last passenger reaches an exit. Two runs drawing on different seeds may diverge the moment they encounter their first tied comparison, after which the routes assigned to individual evacuees, and the congestion patterns those routes create, can develop in entirely different directions even though the station, the passenger count, and baseline edge weights remain identical between the two runs. Conversely, two runs sharing the same seed reproduce one another exactly, down to the last second of evacuation.
Rather than running all 1000 seeds as a single undifferentiated batch, they were organized into six cases distinguished only by how many of the 1000 seeds were used: 1, 10, 25, 50, 100, and 1000 iterations. Each case draws its seeds from the same underlying pool, and every run within every case applies the identical station network, edge weights, pedestrian speeds, congestion thresholds, and evacuee distribution; the seed value is the only thing that changes from one run to the next, and the number of seeds used is the only thing that changes from one case to the next. This nesting is what allows the six cases to be read as successive snapshots of the same underlying distribution of outcomes, rather than as six unrelated experiments.
The 1-iteration case reproduces, deliberately, the situation an analyst faces when running Dijkstra’s algorithm once and reporting the result as though it were a fixed property of the network—this is the default practice this study is built to interrogate, and treating it as its own case rather than folding it into the larger samples makes it possible to compare that single number directly against everything the larger samples reveal. Moving from 10 to 25 to 50 iterations increases the sample gradually, at a point where each additional run remains cheap to compute; 100 iterations pushes the sample an order of magnitude further while still well within reach computationally; and 1000 iterations, the largest case examined, stands in for the closest approximation available here to the full distribution of outcomes the random tie-breaking mechanism is capable of producing. Whether 10 or 25 or 100 iterations turns out to be “enough” is treated as an empirical question to be answered by the results themselves, not as something decided in advance.
Every run within every case yields two outputs that were retained for analysis: the maximum evacuation time, taken as the elapsed time at which the last of the 820 evacuees reaches an exit node, and the full evacuation route assigned to every origin node under that run’s particular sequence of tie-breaking outcomes. From the maximum evacuation times collected within each case, the mean, standard deviation, minimum, maximum, median, and 75th percentile were computed. Reporting these six statistics separately, rather than collapsing them into a single summary figure, matters here specifically because a source of randomness can leave the center of a distribution largely undisturbed while still stretching its tails considerably, or the reverse, and which of these two patterns actually occurs has very different implications for how the resulting evacuation time should be used in practice. For the five cases carrying enough runs to support it—10, 25, 50, 100, and 1000 iterations—the empirical probability density of the maximum evacuation time was additionally constructed, in order to see whether the variability introduced by tie-breaking settles into a stable, recognizable shape as more runs accumulate, or whether it continues to behave erratically no matter how many times the simulation is repeated. To assess convergence quantitatively rather than by inspection of the tabulated statistics, the 1000 executions were additionally treated as an empirical population from which 10,000 bootstrap resamples were drawn at each iteration count. For each resample the mean maximum evacuation time was computed, giving a 95% confidence interval of the mean, together with the expected observed minimum and maximum at that iteration count. The procedure requires no additional simulations and makes no distributional assumption.
4. Results
Table 4 summarizes the mean, standard deviation, minimum, maximum, median, and 75th percentile of the maximum evacuation time obtained from the six cases of 1, 10, 25, 50, 100, and 1000 randomly seeded executions of the randomized Dijkstra algorithm.
Bootstrap resampling quantifies this convergence, and the results are given in
Table 5. The half-width of the 95% confidence interval of the mean falls from ±14.7 s at 10 iterations to ±9.5 s at 25, ±6.6 s at 50 and ±4.7 s at 100, thereafter declining slowly to ±1.5 s at 1000. Relative to a mean of 780 s, 10 iterations therefore locate the mean to within approximately ±1.9% and 25 iterations to within approximately ±1.2%, while beyond 50 iterations the interval narrows in proportion to the inverse square root of the number of runs, so that a tenfold increase from 100 to 1000 iterations improves the precision only by a factor of about three. The expected observed range behaves in the opposite way, widening monotonically from 73 s at 10 iterations to 95 s at 25, 129 s at 100 and 180 s at 1000 with no indication of an asymptote. This is the expected behavior of sample extrema, whose expectation increases with sample size, and it confirms that the observed minimum and maximum are not convergent estimates at any iteration count. Upper percentiles, by contrast, are well determined: the 95th percentile of the 1000-run distribution is 818 s with a bootstrap 95% confidence interval of [814, 820] s, and the 90th percentile is 809 s with an interval of [807, 811] s.
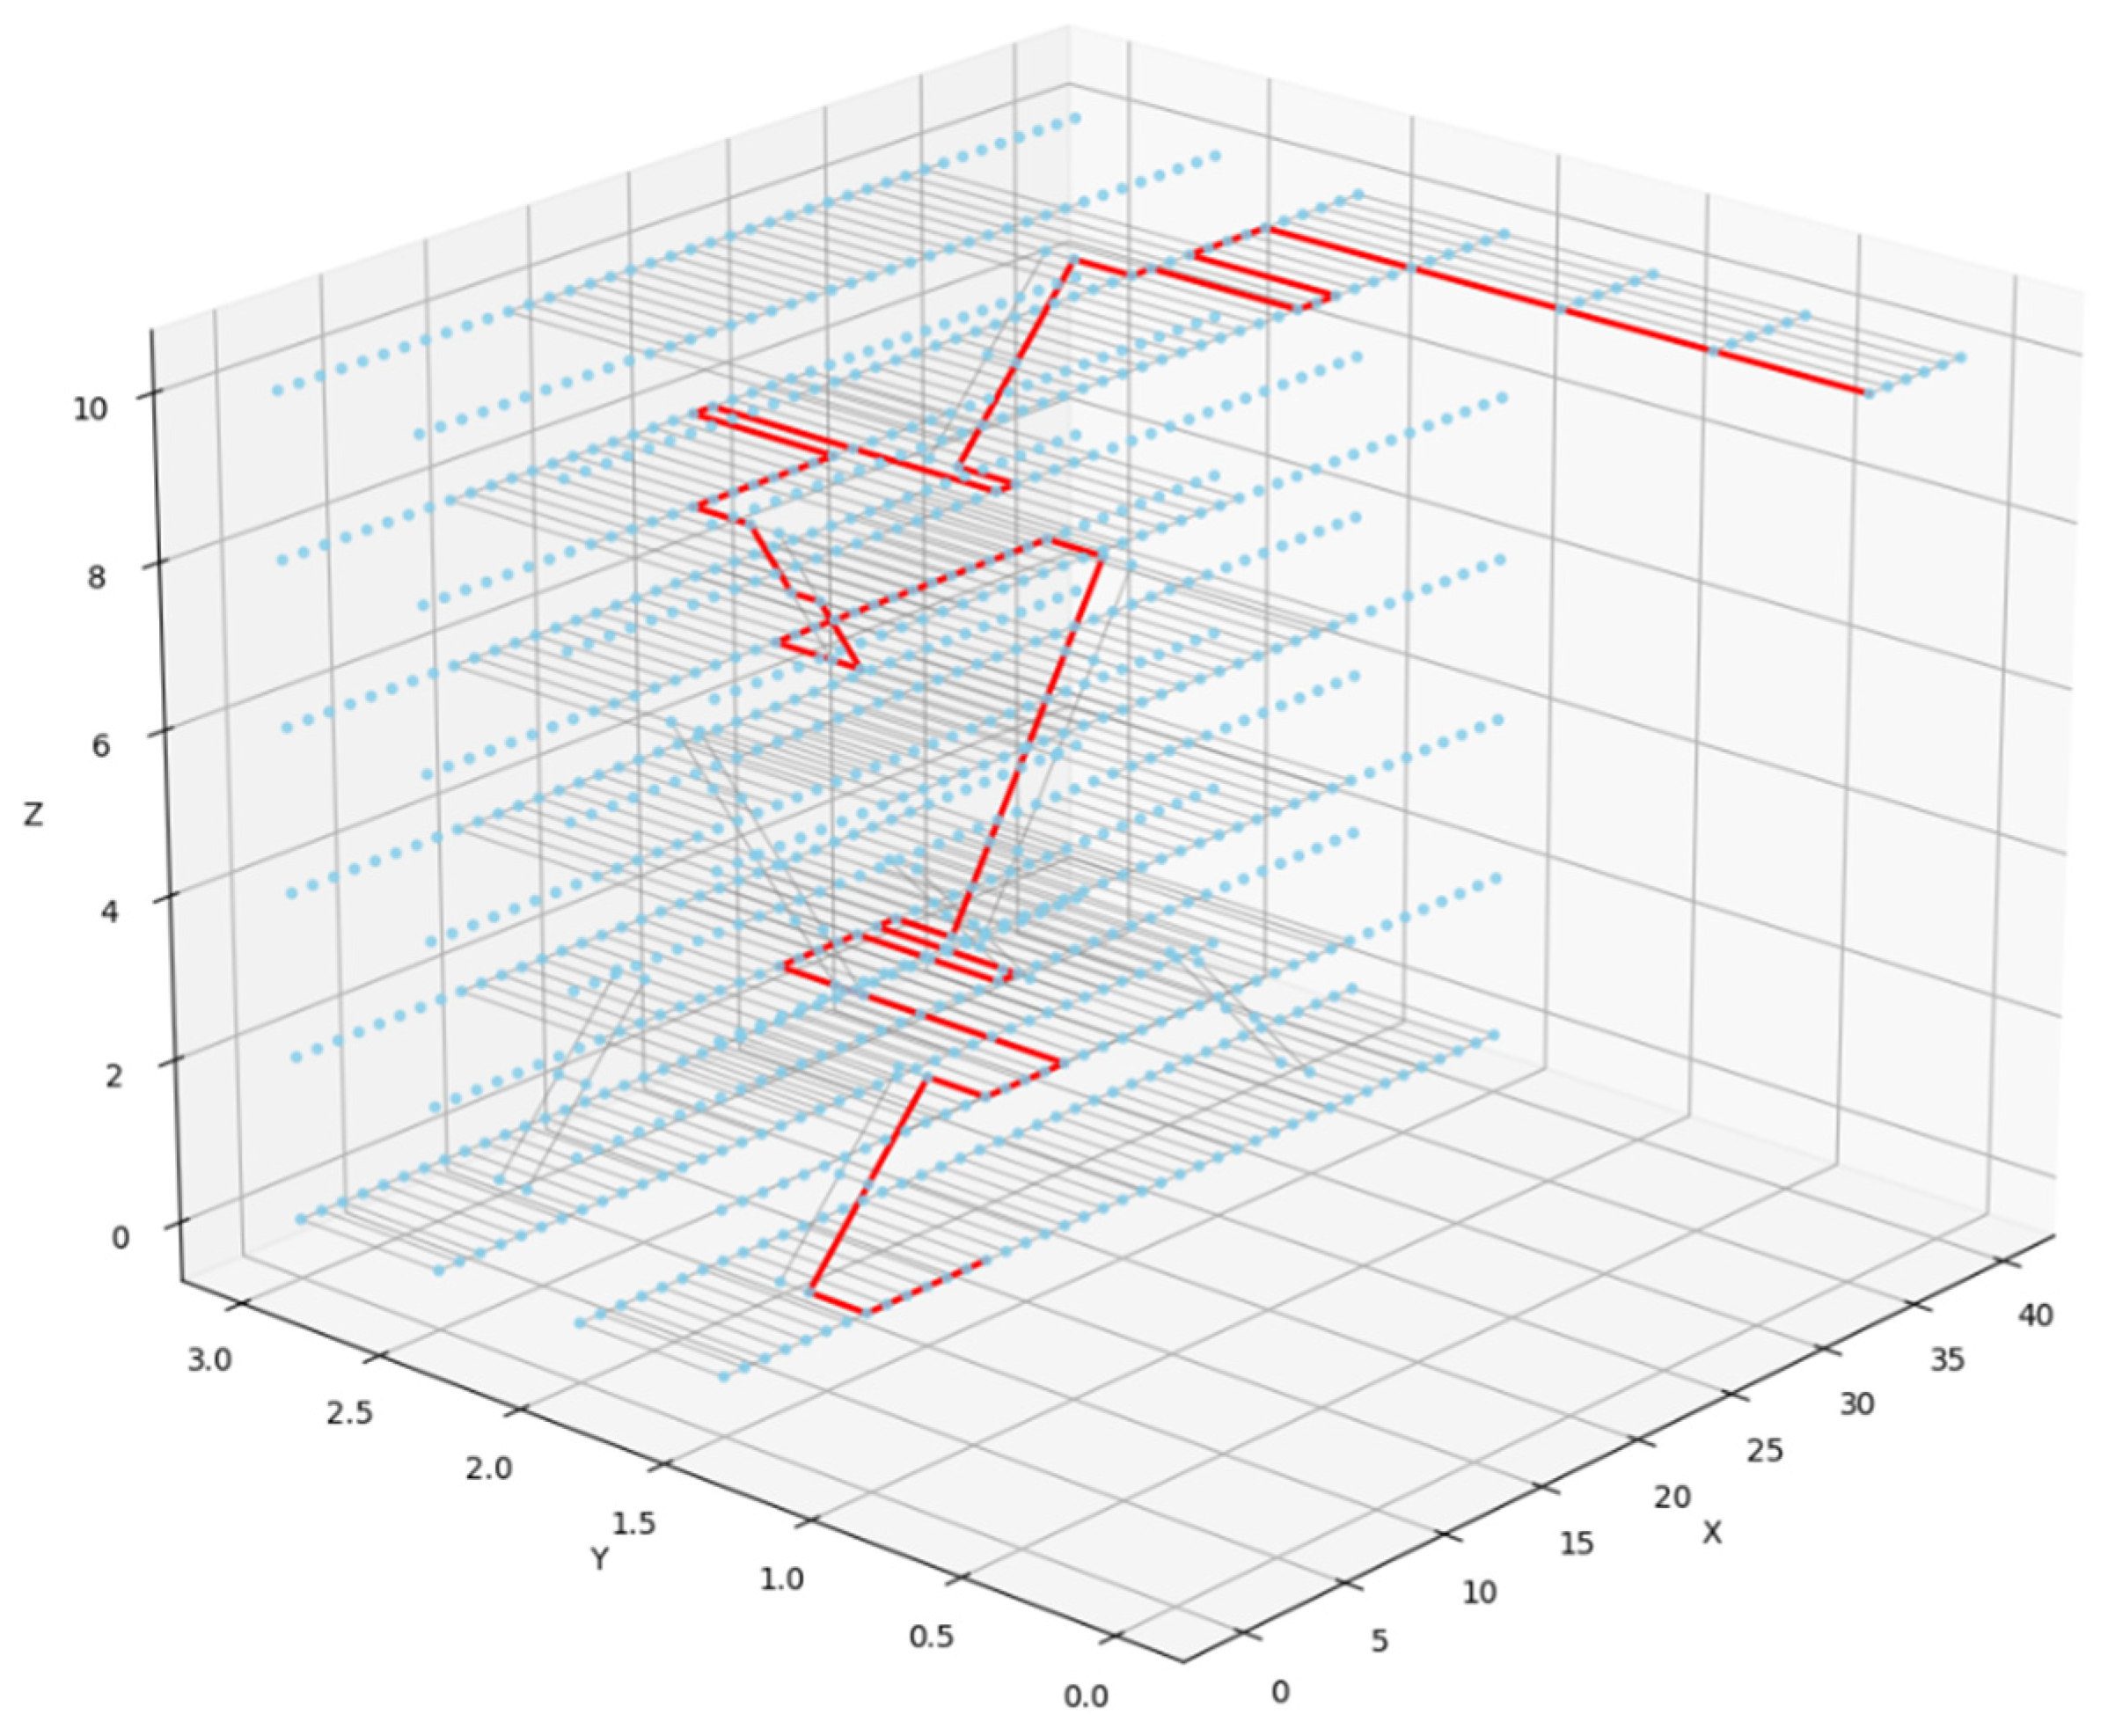
With a single execution, the algorithm returned a maximum evacuation time of 782 s, and the corresponding evacuation route is shown in
Figure 5. Under the conventional practice of running Dijkstra’s algorithm once and reporting the result as the network’s evacuation performance, this 782 s figure is exactly what would be obtained, with no indication from the single run itself of the variability underlying it.
As the number of repeated executions increased, the mean and median settled into a narrow band of approximately 772 to 786 s from 10 iterations onward, and the standard deviation similarly stabilized at around 22 to 25 s. The minimum and maximum, in contrast, did not converge over the same range. The observed maximum rose steadily with the number of iterations, from 807 s at 10 to 864 s at 1000, while the observed minimum fell from 742 s to 671 s over the same range; the individual values are given in
Table 4 The single-run result of 782 s lies close to the eventual central tendency of the distribution but far from either extreme value the network produced once a larger number of seeds was sampled.
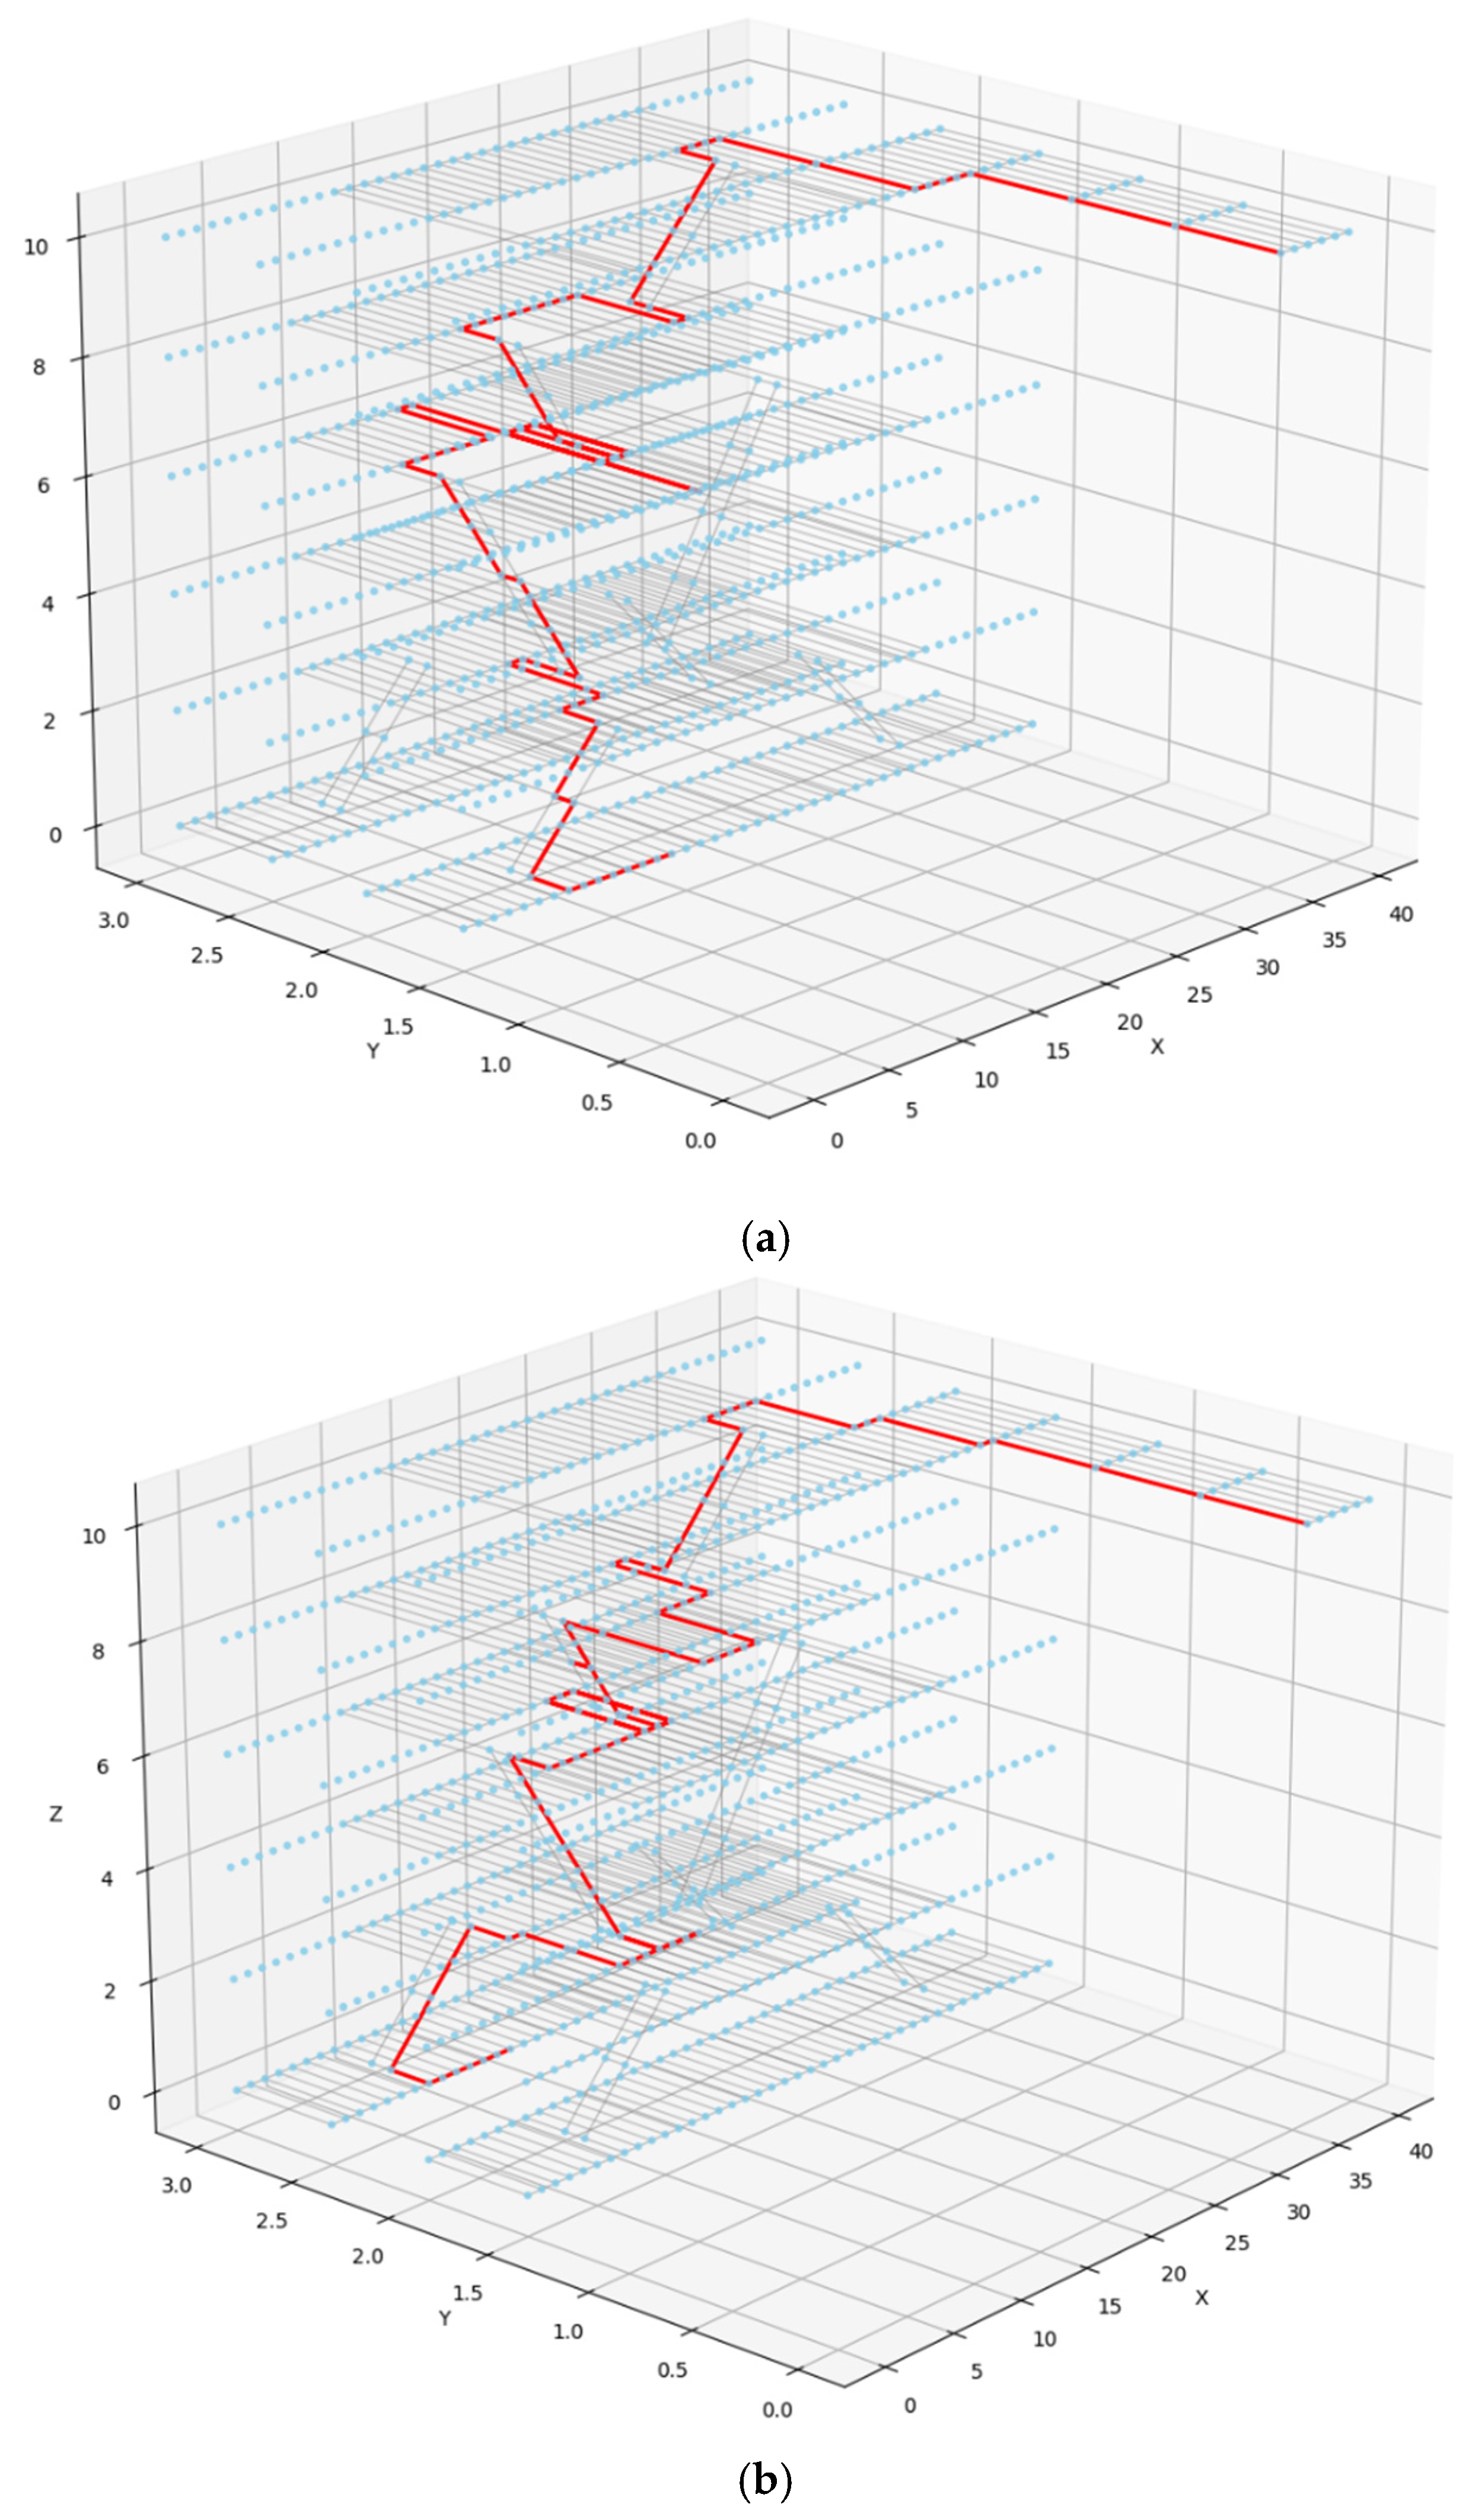
Figure 6 shows the evacuation routes corresponding to the lowest maximum evacuation time identified within the 100-iteration case (
Figure 6a) and the 1000-iteration case (
Figure 6b). These two routes differ from each other, and both differ from the route obtained from the single execution in
Figure 5. This difference is attributable to the interaction between tie-breaking and congestion. Because the walking speed applied at each node depends on the number of evacuees occupying that node at a given moment, a tie-breaking decision made early in a run—determining which of two equal-cost neighbors a group of evacuees is routed through—alters how congestion accumulates at every downstream node for the remainder of that run. A seed that routes a group of evacuees through a given stairwell slightly earlier or later than another seed may cross a congestion threshold that the other run does not, and once that threshold is crossed, the walking speed multiplier applied at that node changes, altering the cost values the algorithm uses in every subsequent route recalculation. This effect compounds over the full duration of the evacuation, so that seeds differing in only a small number of early tie-breaking outcomes can produce substantially different evacuation routes by the time the last passenger reaches an exit. Consequently, the specific route associated with the lowest maximum evacuation time within a sample of 100 seeds is not necessarily the same route associated with the lowest maximum evacuation time within a sample of 1000 seeds.
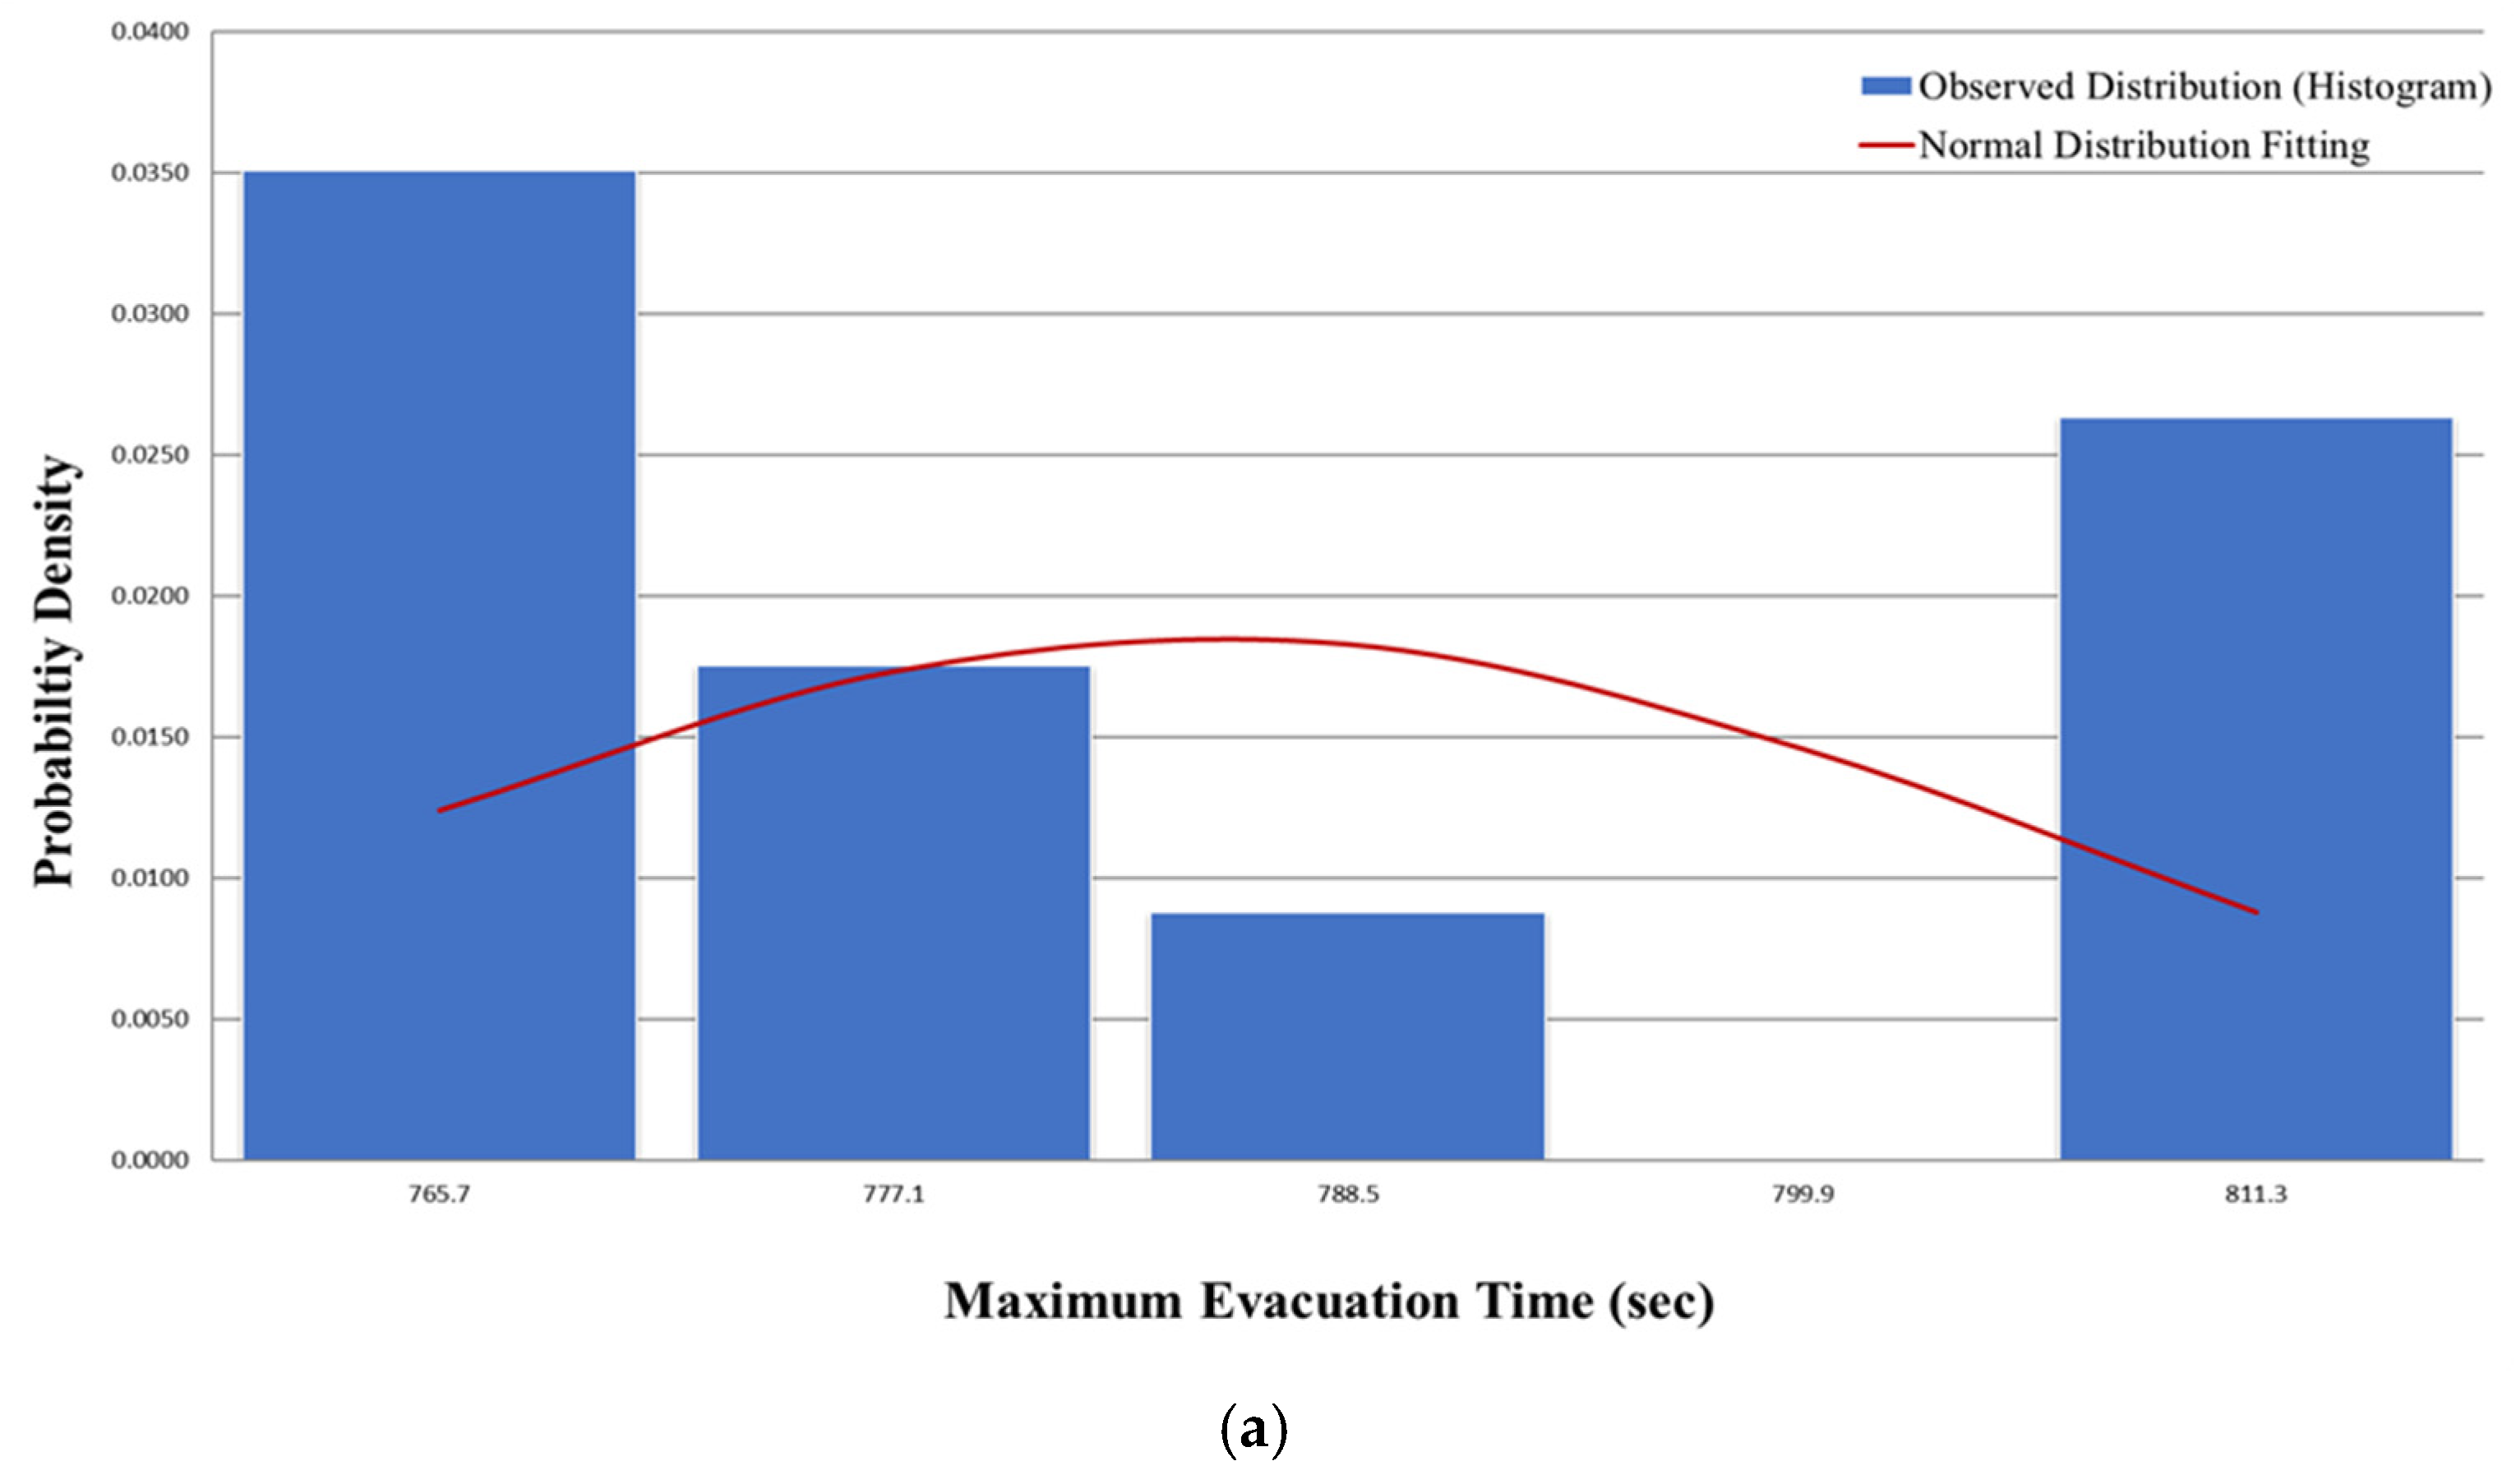
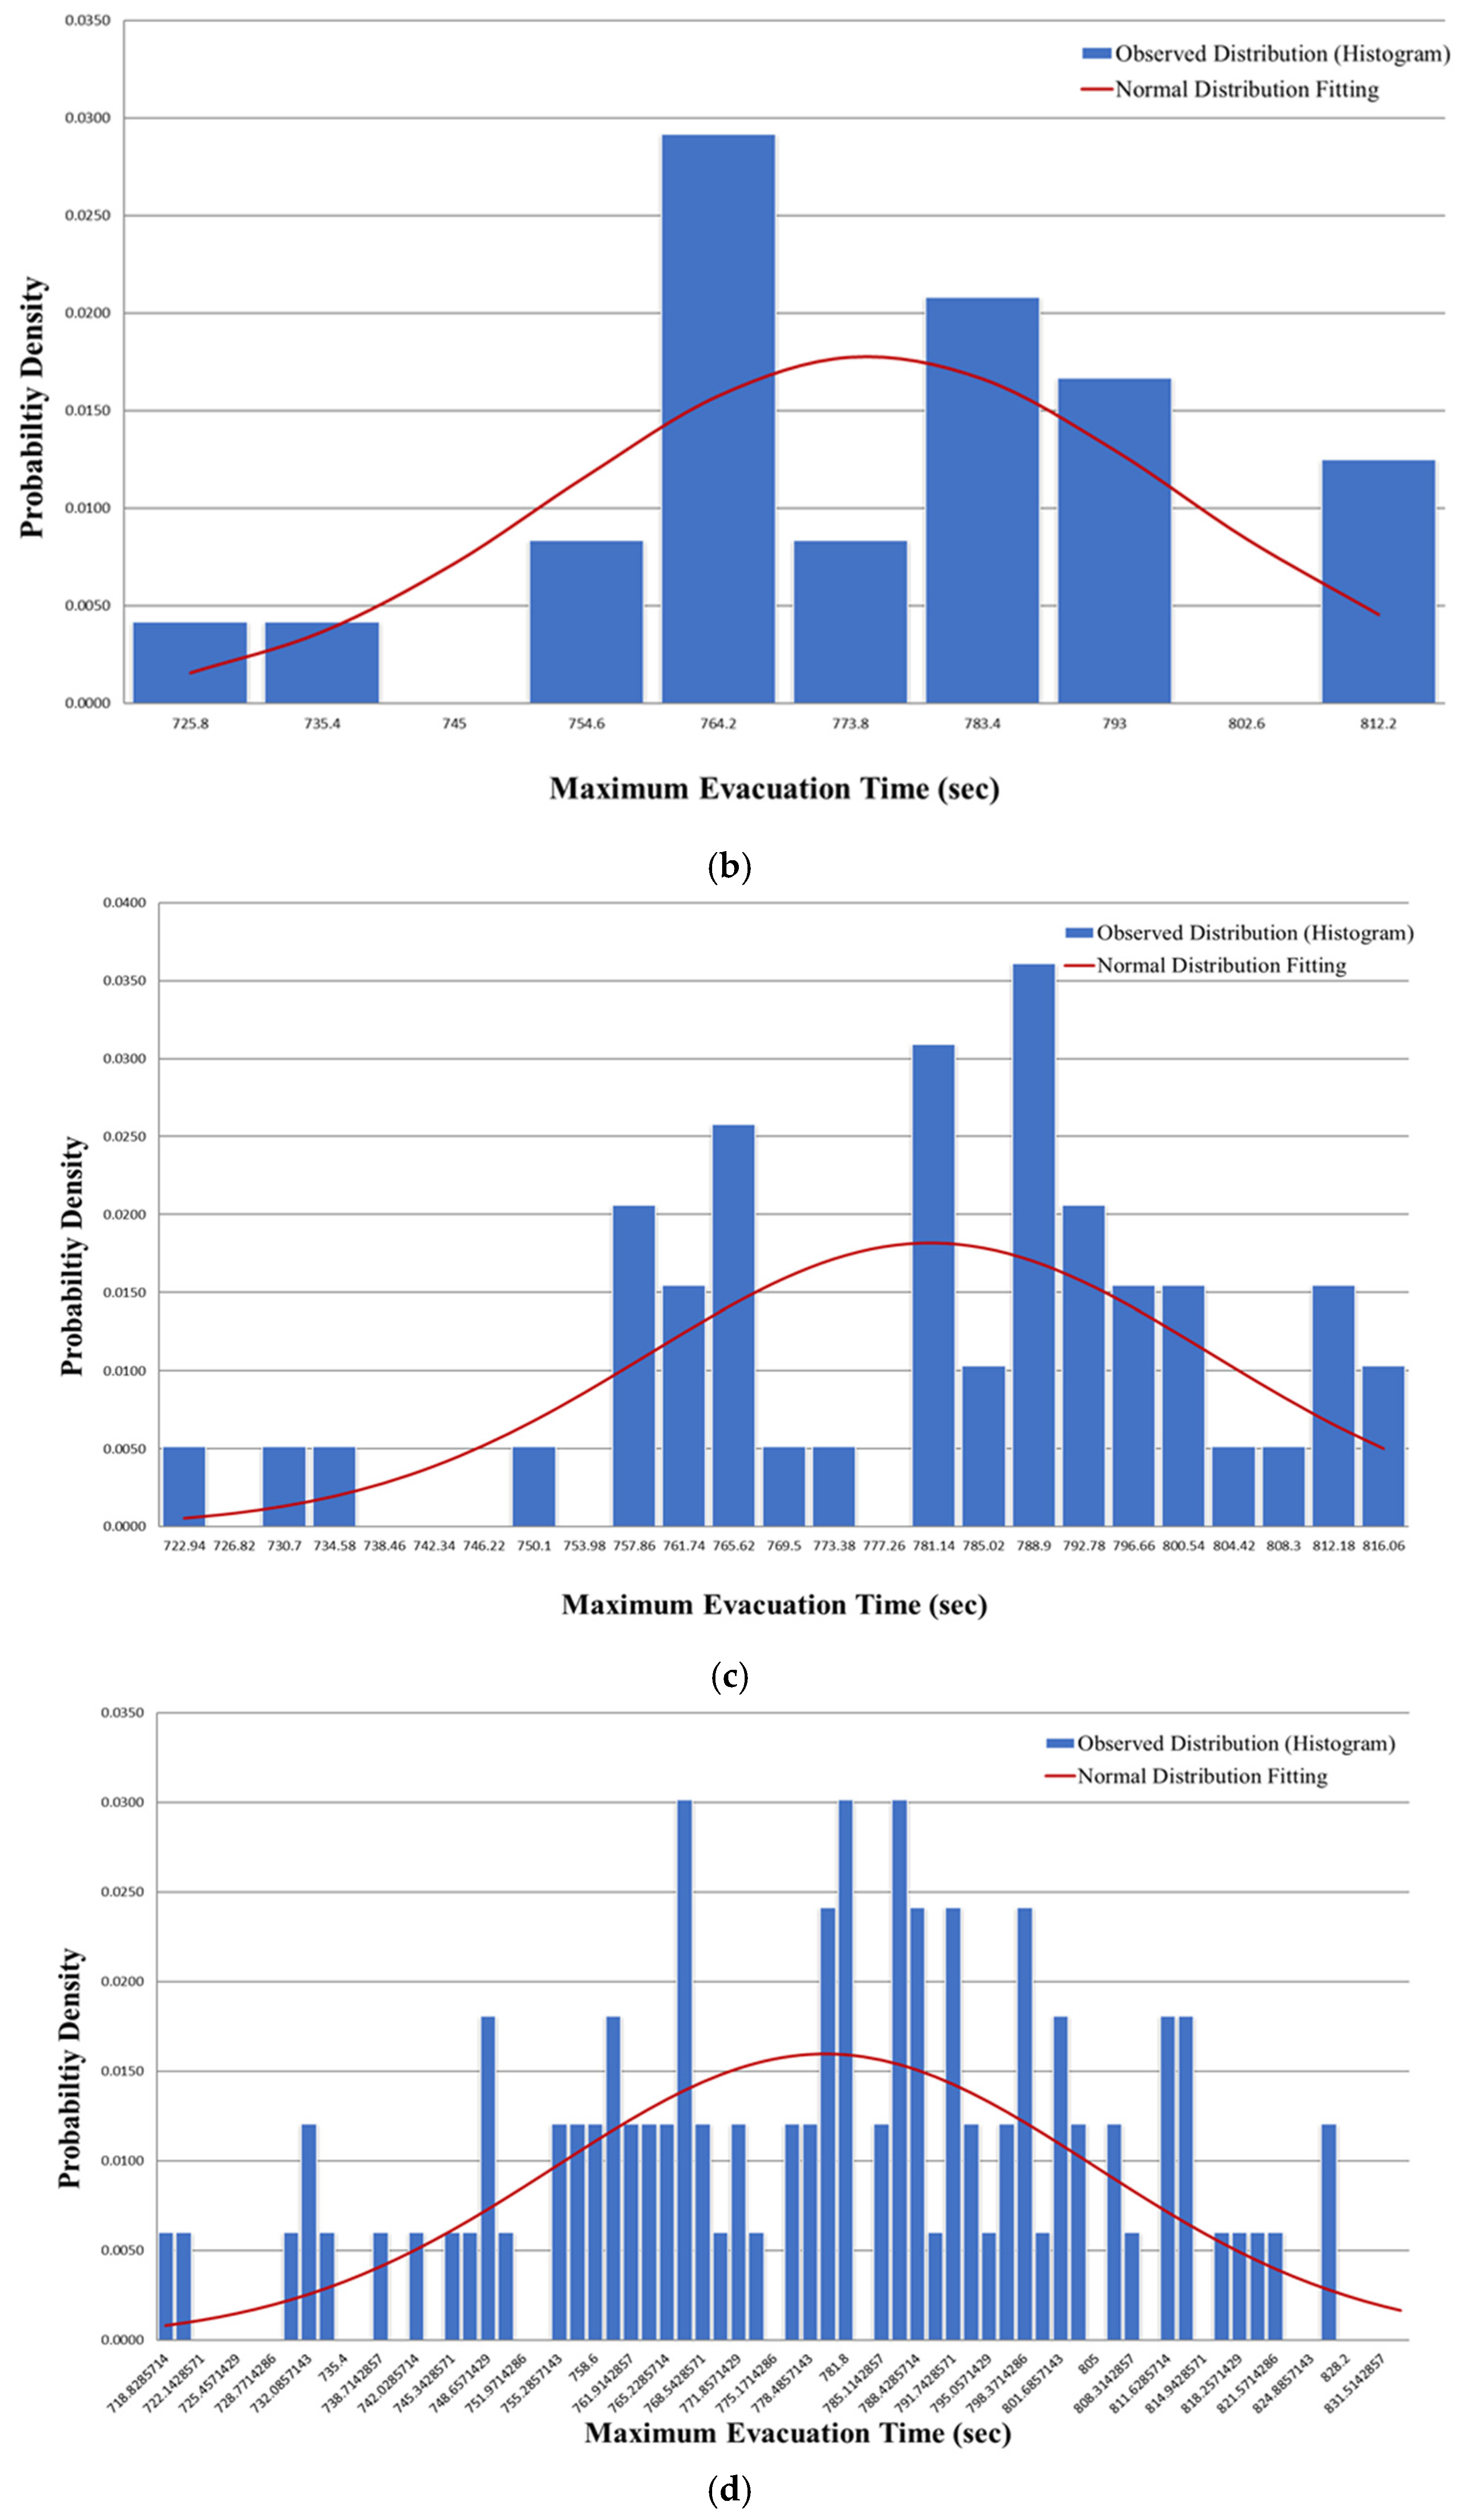
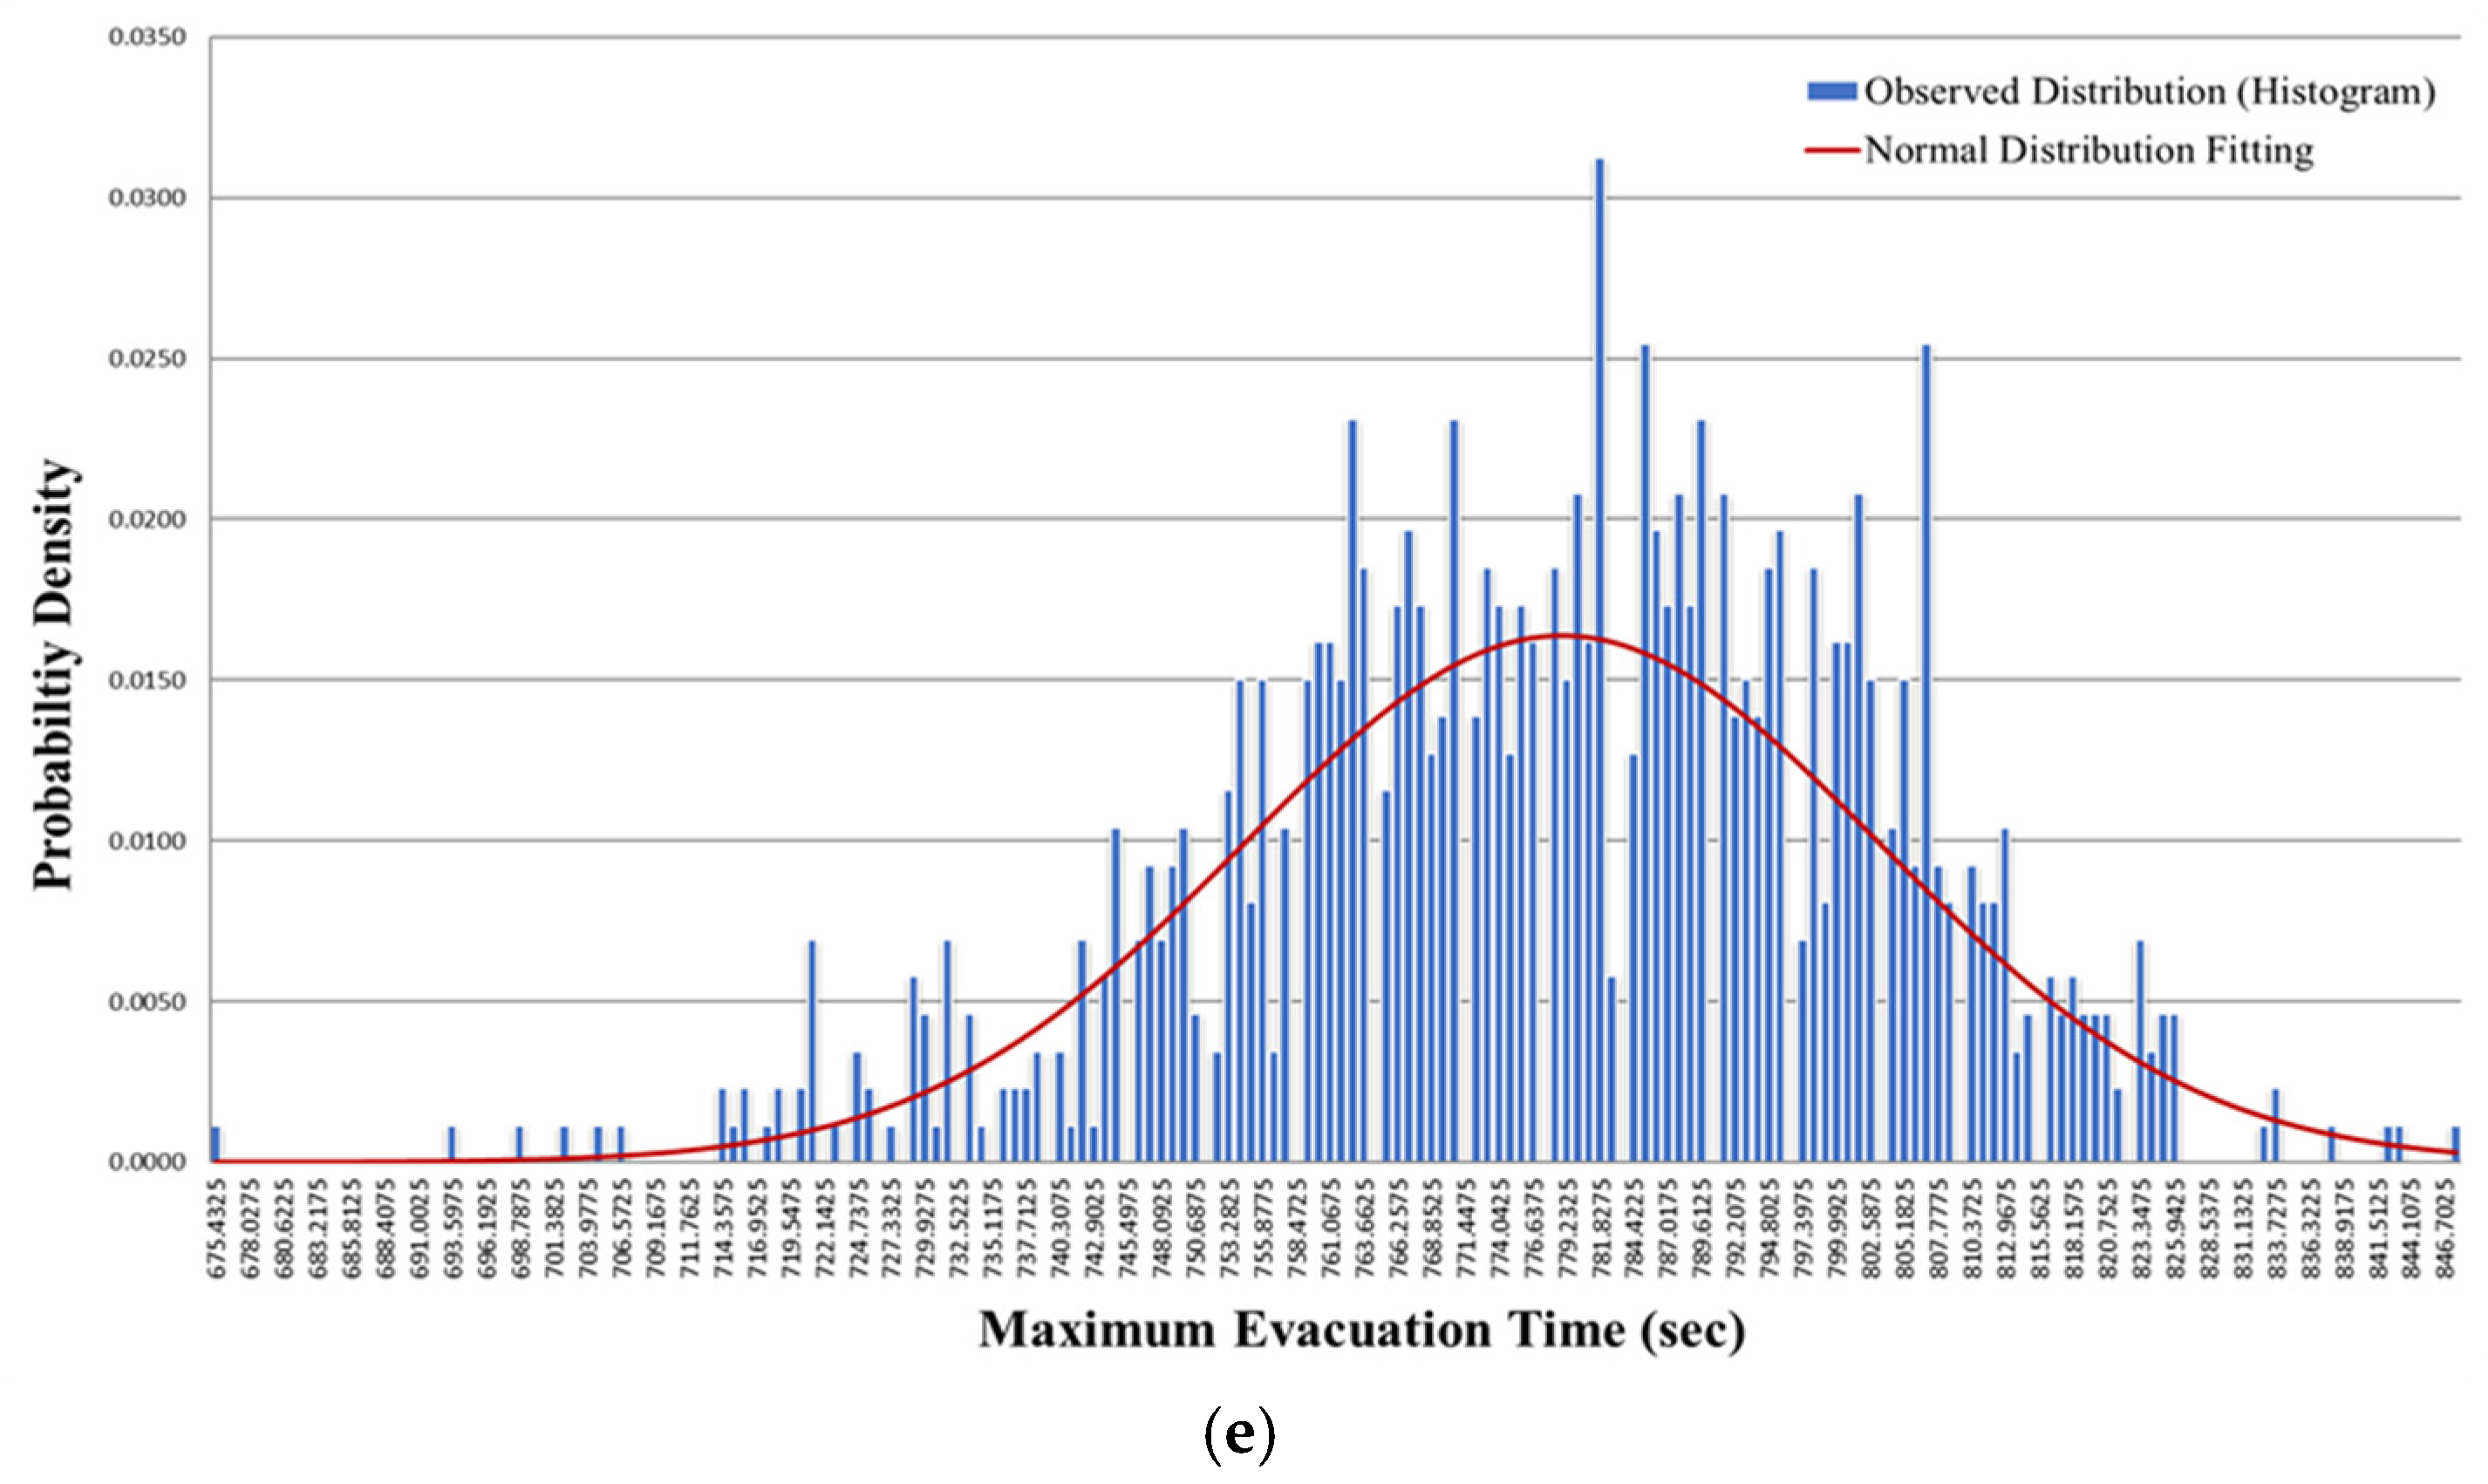
Figure 7 shows the fitted probability density of the maximum evacuation time for the 10-iteration (
Figure 7a), 25-iteration (
Figure 7b), 50-iteration (
Figure 7c), 100-iteration (
Figure 7d), and 1000-iteration (
Figure 7e) cases. At 10 and 25 iterations, the fitted density is irregular and sparsely defined, consistent with the small number of samples available; as the number of iterations increases, the density becomes progressively smoother and better resolved.
The shape of the 1000-iteration distribution was assessed by formal test rather than by inspection. Normality is rejected by the Shapiro–Wilk test (W = 0.994,
p = 0.00065), the Anderson–Darling test (A
2 = 1.123 against a 5% critical value of 0.751), and the D’Agostino–Pearson omnibus test (K
2 = 19.66,
p = 5.4 × 10
−5), although the Kolmogorov–Smirnov test does not reject (D = 0.034,
p = 0.19). The distribution is unimodal with a slight negative skew (−0.235) and positive excess kurtosis (0.621), indicating tails heavier than those of a normal distribution. No distributional assumption is therefore made in this study: the statistics reported in
Table 4 are empirical, and the confidence intervals in
Table 5 are obtained by bootstrap resampling. The heavier tails are themselves relevant to the argument developed here, since a normal approximation would understate the probability of the extreme evacuation times that are most consequential for life-safety assessment. What the progression in
Figure 7 shows is therefore not convergence towards a particular parametric form, but that the variability introduced by random tie-breaking follows a stable and describable distribution rather than behaving as unstructured noise, and that this distribution becomes reliably observable only once a sufficient number of seeds have been sampled.
5. Discussion
The results indicate that the assumption of reproducibility commonly attached to Dijkstra’s algorithm does not hold once a network contains a meaningful number of equal-cost paths. The single-run result of 782 s obtained in this study illustrates this directly: it is neither an outlier nor a representative worst case, but one realization among many equally valid outcomes that the same algorithm, applied to the same network, could just as easily have produced under a different random seed.
The contrast between how the central statistics and the extreme statistics behaved as the number of iterations increased is the most consequential finding of this analysis. The mean and median stabilized quickly, settling into a narrow range within 10 to 25 iterations, while the minimum and maximum continued to diverge through 1000 iterations without showing any sign of leveling off. This distinction matters because evacuation planning intended to support life-safety decisions is generally concerned with conservative rather than average outcomes. A single execution of Dijkstra’s algorithm is reasonably likely to land near the center of the underlying distribution, simply because central values are the most probable outcomes of any single draw, and it is therefore likely to fall below the upper portion of the distribution that a conservative assessment requires. The observed minimum and maximum, however, should not be used to characterize that upper portion. As shown in
Table 5, the expected observed range widens monotonically with the number of executions and gives no indication of approaching a limit, which is the expected behavior of sample extrema; the observed maximum is accordingly a function of how many runs were performed rather than an estimate of a worst case, and a comparison against the available safe egress time based upon it would be arbitrary in its stringency.
Upper percentiles provide the appropriate alternative, and are well determined at the iteration counts examined here. The 95th percentile of the 1000-run distribution is 818 s with a bootstrap 95% confidence interval of [814, 820] s, and the 90th percentile is 809 s with an interval of [807, 811] s; both are fixed to within a few seconds, whereas the observed maximum varies across tens of seconds depending on the number of runs. Since the maximum evacuation time is commonly used as a surrogate for the required safe egress time, a single Dijkstra execution that happens to select a favorable set of equal-cost routes may return a value below the 95th percentile of what the same model can produce, and the design may appear acceptable on that basis. Deterministic single-run route generation may therefore give a non-conservative estimate of evacuation performance in underground stations with symmetric layouts, and where a conservative value is required it should be taken as a stated upper percentile reported together with its confidence interval and with the number of executions on which it is based. This implies that deterministic single-run route generation may provide a non-conservative estimate of evacuation performance in underground stations with symmetric layouts.
The difference between the evacuation routes obtained from the single execution and from the 100- and 1000-iteration cases points to the same conclusion from a different angle. Because walking speed at each node is governed by how many evacuees currently occupy it, an early tie-breaking decision does not stay contained to the two nodes it directly affects; it reshapes the congestion pattern, and therefore the cost structure, of every node downstream for the remainder of the simulation. Two seeds differing in only a small number of early tie-breaking outcomes can accordingly diverge into evacuation routes that share little in common by the time the last passenger reaches an exit. This coupling between tie-breaking and congestion means that the route producing the lowest maximum evacuation time within one sample of seeds carries no guarantee of remaining the lowest within a larger sample, which is consistent with the different minimum-time routes identified at 100 and 1000 iterations.
The variability observed across seeds is not unstructured noise but a statistically describable property of the network and algorithm combination, as the tests. This is broadly consistent with the practice, well established in Monte Carlo–based evacuation modeling, of treating any source of randomness in a simulation as something to be sampled repeatedly rather than accepted from a single run [
38,
39,
40,
41,
42]. The variability examined here, however, originates from a different kind of source than occupant-level resampling: it comes from the tie-breaking rule embedded in the pathfinding algorithm itself, a source that is entirely a function of the implementation and therefore fully within the control of whoever builds the simulation, yet one that a single-run evaluation leaves completely unexamined. The convergence criteria developed in that literature for deciding how many repeat runs are needed [
40,
42] could be applied directly to tie-breaking realizations, which is a natural extension of the present work.
From a practical standpoint, these findings suggest that evacuation risk assessments relying on Dijkstra’s algorithm in networks with substantial structural symmetry should not treat a single execution as sufficient, particularly when the reported evacuation time is intended to inform life-safety design decisions or regulatory compliance. A moderate number of repeated executions, on the order of 10 to 25 in the network examined here, appears sufficient to obtain a stable estimate of typical performance. Characterizing the tail behavior relevant to worst-case planning, however, appears to require a substantially larger number of iterations, since the observed extremes had not stabilized even at 1000 repetitions. This asymmetry between the convergence behavior of central and extremal statistics carries a direct practical implication: the number of repetitions an analyst needs depends on whether the goal is to estimate typical performance or to bound worst-case performance, and these two goals cannot be satisfied by the same sample size.
Taken together, these results indicate that fire evacuation assessments using Dijkstra-based route generation should report the variability of maximum evacuation time across multiple tie-breaking realizations, rather than accepting the result of a single execution as definitive. When the objective is to explore favorable route-allocation patterns, the best-performing result among sampled seeds can be reported as a sampled lower-bound outcome, but it should not be interpreted as a guaranteed global optimum. The mechanism described here is not specific to Dijkstra’s algorithm. Any deterministic routing method that resolves equal-cost candidates by an unspecified internal ordering is subject to the same indeterminacy, including heuristic searches such as A* when two candidates share both cost and heuristic value. Characterizing this behavior in heuristic search is a distinct problem, since the set of tied candidates there depends on the heuristic itself rather than on the network alone, and is left for further work. The randomization used here also bears on how tie resolution is handled in practical routing software, where the rule is not specified by the user but follows from data structures—node insertion order, adjacency-list ordering, and priority-queue behavior—so that two correct implementations of the same algorithm on the same network may report different evacuation times without either being in error. The same problem required deterministic tie-breaking rules to be standardized in network engineering, where shortest-path forwarding must be reproducible across independently built devices [
37]; evacuation modeling has no comparable convention. Fixing such a rule would deliver reproducibility but would not indicate how far the reported evacuation time could have differed under an equally valid alternative, and the two approaches are therefore complementary: a documented deterministic rule may be used for routine reporting while repeated tie-breaking realizations establish the spread that the fixed rule conceals.
It should be made explicit what is being compared in this study. The analysis does not set Dijkstra’s algorithm against alternative routing methods, because the question addressed is not which method produces a shorter evacuation time but whether the evacuation time obtained from a given method is uniquely determined when many routes share an identical cost. A comparison across methods would confound this property with differences in the methods themselves, since each carries its own route-selection behavior. The comparison made here is instead between the single deterministic execution that evacuation assessments conventionally report and the distribution obtained when the identical model is executed repeatedly under different tie-breaking realizations, with every other input held fixed. The value of the repeated-execution approach lies in what a single execution cannot show: that the spread of maximum evacuation times is a stable statistical property of the model rather than random noise, that its central tendency converges within a small number of repetitions, and that its upper tail does not. Neither of the latter two findings is accessible from one run, and it is on this basis, rather than on any performance advantage over an alternative algorithm, that the approach is proposed. A related limitation should be stated. The evacuation model itself has not been validated against field observations or experimental data. The movement speeds follow the design guidelines of the Ministry of Land, Infrastructure and Transport [
45], the density-dependent speed reduction follows the relationship reported by Zhou et al. [
47], and the congestion threshold follows the guidance of the Ministry of the Interior and Safety [
46], but adopting established parameters is not equivalent to validating the model against observed evacuation behavior, and the absolute evacuation times reported here should accordingly not be read as predictions of how long an evacuation of this station would take. Because the geometry, movement parameters, occupant distribution, and time step are identical across all executions, a change in those parameters would shift the absolute times without altering the finding that repeated execution of the identical model returns a distribution rather than a single value. Validation against field or experimental data would nonetheless be required before this model were used to predict evacuation performance rather than to characterize routing variability.
These findings have a direct bearing on design practice. In performance-based evaluation of underground stations, the maximum evacuation time obtained from a route-generation model is commonly adopted as the required safe egress time and compared against the available safe egress time determined from fire and smoke analysis. Where this comparison is made using a single Dijkstra execution, the margin between the two may be overstated whenever the run happens to fall near the center of the distribution shown in
Figure 7. For platform and concourse layouts with repeating geometry, in which equal-cost paths are unavoidable, the results of this study suggest a simple design-stage procedure: execute the routing simulation under a moderate number of independently seeded tie-breaking realizations, report the mean or median as the expected evacuation performance, and report a high percentile of the maximum evacuation time as the value to be checked against the available safe egress time. In the network examined here, on the order of 10–25 repetitions was sufficient for the former, whereas the latter required considerably more; the appropriate number should therefore be selected according to the purpose of the assessment rather than fixed in advance. The same procedure can also be used to compare alternative platform or stairway configurations, since a layout that produces a narrower distribution of maximum evacuation time under repeated tie-breaking is less sensitive to route allocation and can be regarded as more robust for evacuation planning.
6. Conclusions
This study examined whether Dijkstra-based route generation produces a unique and reproducible evacuation outcome in an underground-station network containing multiple equal-cost paths. A random tie-breaking rule was implemented within Dijkstra’s algorithm and applied to a six-level underground station network consisting of 720 nodes and 2222 edges. The evacuation simulation was repeated across six sample sizes, ranging from a single execution to 1000 independently seeded executions, while the station topology, baseline movement speeds, congestion thresholds, and evacuee distribution were held fixed.
The results showed that a single execution produced a maximum evacuation time of 782 s, whereas the 1000-iteration case produced a wider range of outcomes from 671 s to 864 s. The mean and median maximum evacuation times stabilized within approximately 10 to 25 iterations, indicating that a small number of repeated runs may be sufficient to estimate typical evacuation performance. In contrast, the minimum and maximum values continued to expand as the number of iterations increased, showing that upper-tail evacuation outcomes relevant to fire life-safety assessment cannot be reliably captured by a single execution or by a small number of runs.
The route-level comparison further showed that different tie-breaking realizations produced different congestion patterns and, consequently, different maximum evacuation times. Because walking speed was adjusted according to local crowd density, early tie-breaking decisions affected downstream congestion development throughout the evacuation process. This means that even when multiple routes are equally optimal in terms of Dijkstra path cost, they can lead to different evacuation outcomes once congestion is considered.
These findings indicate that Dijkstra-based fire evacuation assessments for underground stations should not rely only on a single deterministic execution when maximum evacuation time is used as a safety indicator. Instead, repeated simulations using multiple tie-breaking realizations should be reported to quantify the variability of evacuation outcomes. For typical-performance assessment, central statistics such as the mean and median may be sufficient; however, for conservative fire life-safety evaluation, upper-tail statistics such as the maximum or high-percentile evacuation time should also be considered.
These conclusions are bounded by the baseline fire-evacuation routing conditions considered in this study. Smoke spread, thermal exposure, and hazard-induced route blockage were not modeled, because the objective was to isolate the uncertainty introduced by equal-cost path tie-breaking within the route-generation process. Future research should couple the proposed Monte Carlo tie-breaking framework with time-dependent fire and smoke propagation models, visibility-dependent walking-speed reduction, and hazard-induced route blockage to examine whether algorithmic route variability is amplified or suppressed under dynamically changing fire conditions.