Article

Layout Regeneration Design and Structural Verification of Aging Residential Buildings for the Transformation into Public Rental Housing


1
School of Architecture and Art Design, Hebei University of Technology, Tianjin 300130, China
2
Key Laboratory of Healthy Human Settlements in Hebei Province, Tianjin 300130, China
3
School of Architecture and Planning, Hunan University, Changsha 410082, China
*
Author to whom correspondence should be addressed.
Buildings 2026, 16(18), 3729; https://doi.org/10.3390/buildings16183729 (registering DOI)
Submission received: 29 July 2026 / Revised: 10 September 2026 / Accepted: 12 September 2026 / Published: 19 September 2026
(This article belongs to the Section Building Energy, Physics, Environment, and Systems)

Abstract

The conversion of aging residential buildings into public rental housing is considered a potential future application scenario. In response to the challenges of adapting the layouts of public rental housing to contemporary lifestyles, an integrated renovation approach for aging residential buildings to be transformed into public rental housing is presented in this study. The approach is composed of modular layout regeneration design, multi-performance optimization, and structural strengthening with seismic verification. First, based on the user profiles for public rental housing, functional rooms were defined, and spatial layouts were regenerated for diverse household types. Subsequently, a multi-performance optimization of indoor daylighting and thermal performance, air quality, and energy consumption for aging residential buildings after the layout regeneration was conducted. Finally, based on the optimal design parameters, structural strengthening design and seismic verification for aging residential buildings with masonry structures were carried out. Specifically, two prototypical aging residential buildings in Tianjin, China, were renovated, with Building A adopting the co-living mode and Building B adopting the unit integration mode. After the layout regeneration design, the performance of the optimized aging residential buildings was assessed against the baselines of the regenerated layouts prior to optimization. The results indicated that useful daylight illuminance was improved by 12.52% for Building A and 4.15% for Building B. The predicted percentage of dissatisfied exhibited the most significant improvement, decreasing by 24.08% for Building A. Indoor carbon dioxide concentration was substantially reduced by 27.83% for Building B. As for energy use intensity, both buildings achieved reductions, with decreases of 12.5% and 8.1% for Building A and Building B. Both buildings satisfied seismic codes after strengthening. It is demonstrated by the findings that indoor environmental quality can be synergistically improved, energy consumption can be reduced, and structural safety can be ensured through integrated layout regeneration, performance-driven optimization, and structural verification. The framework is proposed to provide a systematic technical pathway for the sustainable renovation of aging residential buildings into public rental housing in the cold zone of China.

1. Introduction

Affordable housing policies have been implemented to address the housing needs of urban low-to-middle-income groups. Meanwhile, as part of these efforts, the conversion of aging residential buildings into public rental housing has been a research focus, through which the supply of affordable housing is expanded and aging residential buildings are revitalized [1,2]. However, a clear mismatch is therefore evident between the outdated layouts and degraded performance of aging residential buildings and the user profiles and quality requirements of public rental housing. To bridge this gap, an integrated renovation approach that concurrently addresses layout upgrading, performance-driven optimization, and structural safety is urgently needed.

1.1. Literature Review

Research on public rental housing design has been progressively conducted by scholars worldwide. In China, Li [3] carried out planning and layout modifications for public rental housing in Shanghai, with a primary focus on interior space design. Zhu et al. [4] analyzed the residential needs of small and medium-sized households in Guangzhou, concentrating on spatial configuration at the design stage. Internationally, modular design strategies have been employed to achieve spatial flexibility in social housing. For instance, standardized unit modules are utilized in Germany to accommodate households of varying sizes [5], and similar modular approaches have been explored for public rental housing remodeling in South Korea [6]. These studies have primarily concentrated on the detailed design of interior spaces at the design stage or on modular strategies for new construction, with limited attention paid to layout regeneration as a means of adapting existing aging residential buildings to diverse household structures.
In the domain of building performance optimization for residential renovation, Gong et al. [7] studied green design strategies for residential buildings in the cold zone of China, with an emphasis on creating favorable indoor environments through optimized design strategies. Ge et al. [8] proposed green technical strategies focusing on the suitability of building technologies for affordable housing projects. More recently, multi-objective optimization approaches have been widely applied to balance daylighting, thermal comfort, and energy consumption in residential buildings. Wu et al. [9] developed a multi-objective optimization framework for residential building energy consumption, daylighting, and thermal comfort using machine learning and genetic algorithms. Yao et al. [10] conducted an optimization design of layout dimensions for residential buildings weighing daylighting, thermal comfort, indoor air quality, and low-carbon decision-making. A simulation-based multi-objective optimization workflow for residential design in hot-arid climates was developed, demonstrating that early-stage architectural design decisions significantly influence long-term energy use, daylight performance, and indoor environmental quality [11]. These studies have largely focused on envelope parameters of existing residential buildings, whereas layout-related design variables resulting from spatial regeneration, such as door dimensions and partition adjustments, have rarely been incorporated into the optimization framework.
Regarding structural retrofitting of aging residential buildings, Caprili et al. [12] conducted integrated research on seismic strengthening and energy-saving retrofits of masonry structures, and a design calculation method for the load-bearing capacity of external walls was proposed. Furtado et al. [13] performed an experimental characterization of seismic plus thermal energy retrofitting techniques for masonry infill walls, with the investigation concentrated on performance evaluation at the component level. The external steel-meshed mortar layer has been recognized as a widely adopted technique for improving the seismic performance of existing masonry structures [14]. Studies have demonstrated that steel mesh and mortar overlays can effectively enhance the resistance, deformation capacity, and energy dissipation of masonry walls under seismic loads [12]. These investigations have been primarily focused on local components or individual strengthening techniques, with limited attention paid to the structural implications of layout modifications, such as wall openings and removals, within a holistic retrofitting framework. Meanwhile, recent studies have begun to explore integrated retrofit frameworks that combine multiple optimization objectives with structural considerations [15,16].
Based on the above review, three research gaps can be identified. First, existing studies on public rental housing renovation have primarily concentrated on interior space design at the design stage or on modular strategies for new construction, with limited attention paid to layout regeneration strategies that adapt existing aging residential buildings to diverse household structures. Second, while multi-performance optimization has been applied to building envelope and system design, layout-related design variables resulting from spatial reconfiguration have rarely been incorporated into the optimization framework, nor have the combined effects on daylighting, thermal comfort, air quality, and energy consumption been systematically addressed for the aging residential buildings after the regeneration of the layouts. Third, structural strengthening and seismic verification have been largely conducted independently of layout modifications for aging residential buildings, and most existing research has focused on local components or individual techniques, without considering the structural consequences of layout changes such as wall openings and removals.

1.2. Research Objectives

To address the above gaps, an integrated renovation approach for aging residential buildings transformed into public rental housing was proposed in this study. The approach is composed of three interrelated components: (1) modular layout regeneration design based on resident profiling, through which residential functions are decomposed and reconfigured to accommodate diverse household types; (2) multi-performance optimization of regenerated layouts, in which layout-related design variables, including door dimensions, window-to-wall ratios, envelope insulation, and occupant behavior, are simultaneously optimized with the objectives of daylighting performance, thermal comfort, indoor air quality, and energy consumption; and (3) structural verification of masonry structures following optimization, for which strengthening design is carried out to ensure that the post-renovation structural safety was rigorously validated in close coordination with layout modifications. The novelty of this integrated approach lies in the systematic coupling of layout regeneration, performance optimization, and structural verification within a unified framework, particularly the emphasis on structural verification as an integral component following optimization, which has been largely overlooked in previous studies. The methodology was applied to two prototypical aging residential buildings in Tianjin, China, located in a cold climate zone, to demonstrate the feasibility and effectiveness of the proposed framework.

2. Methodology

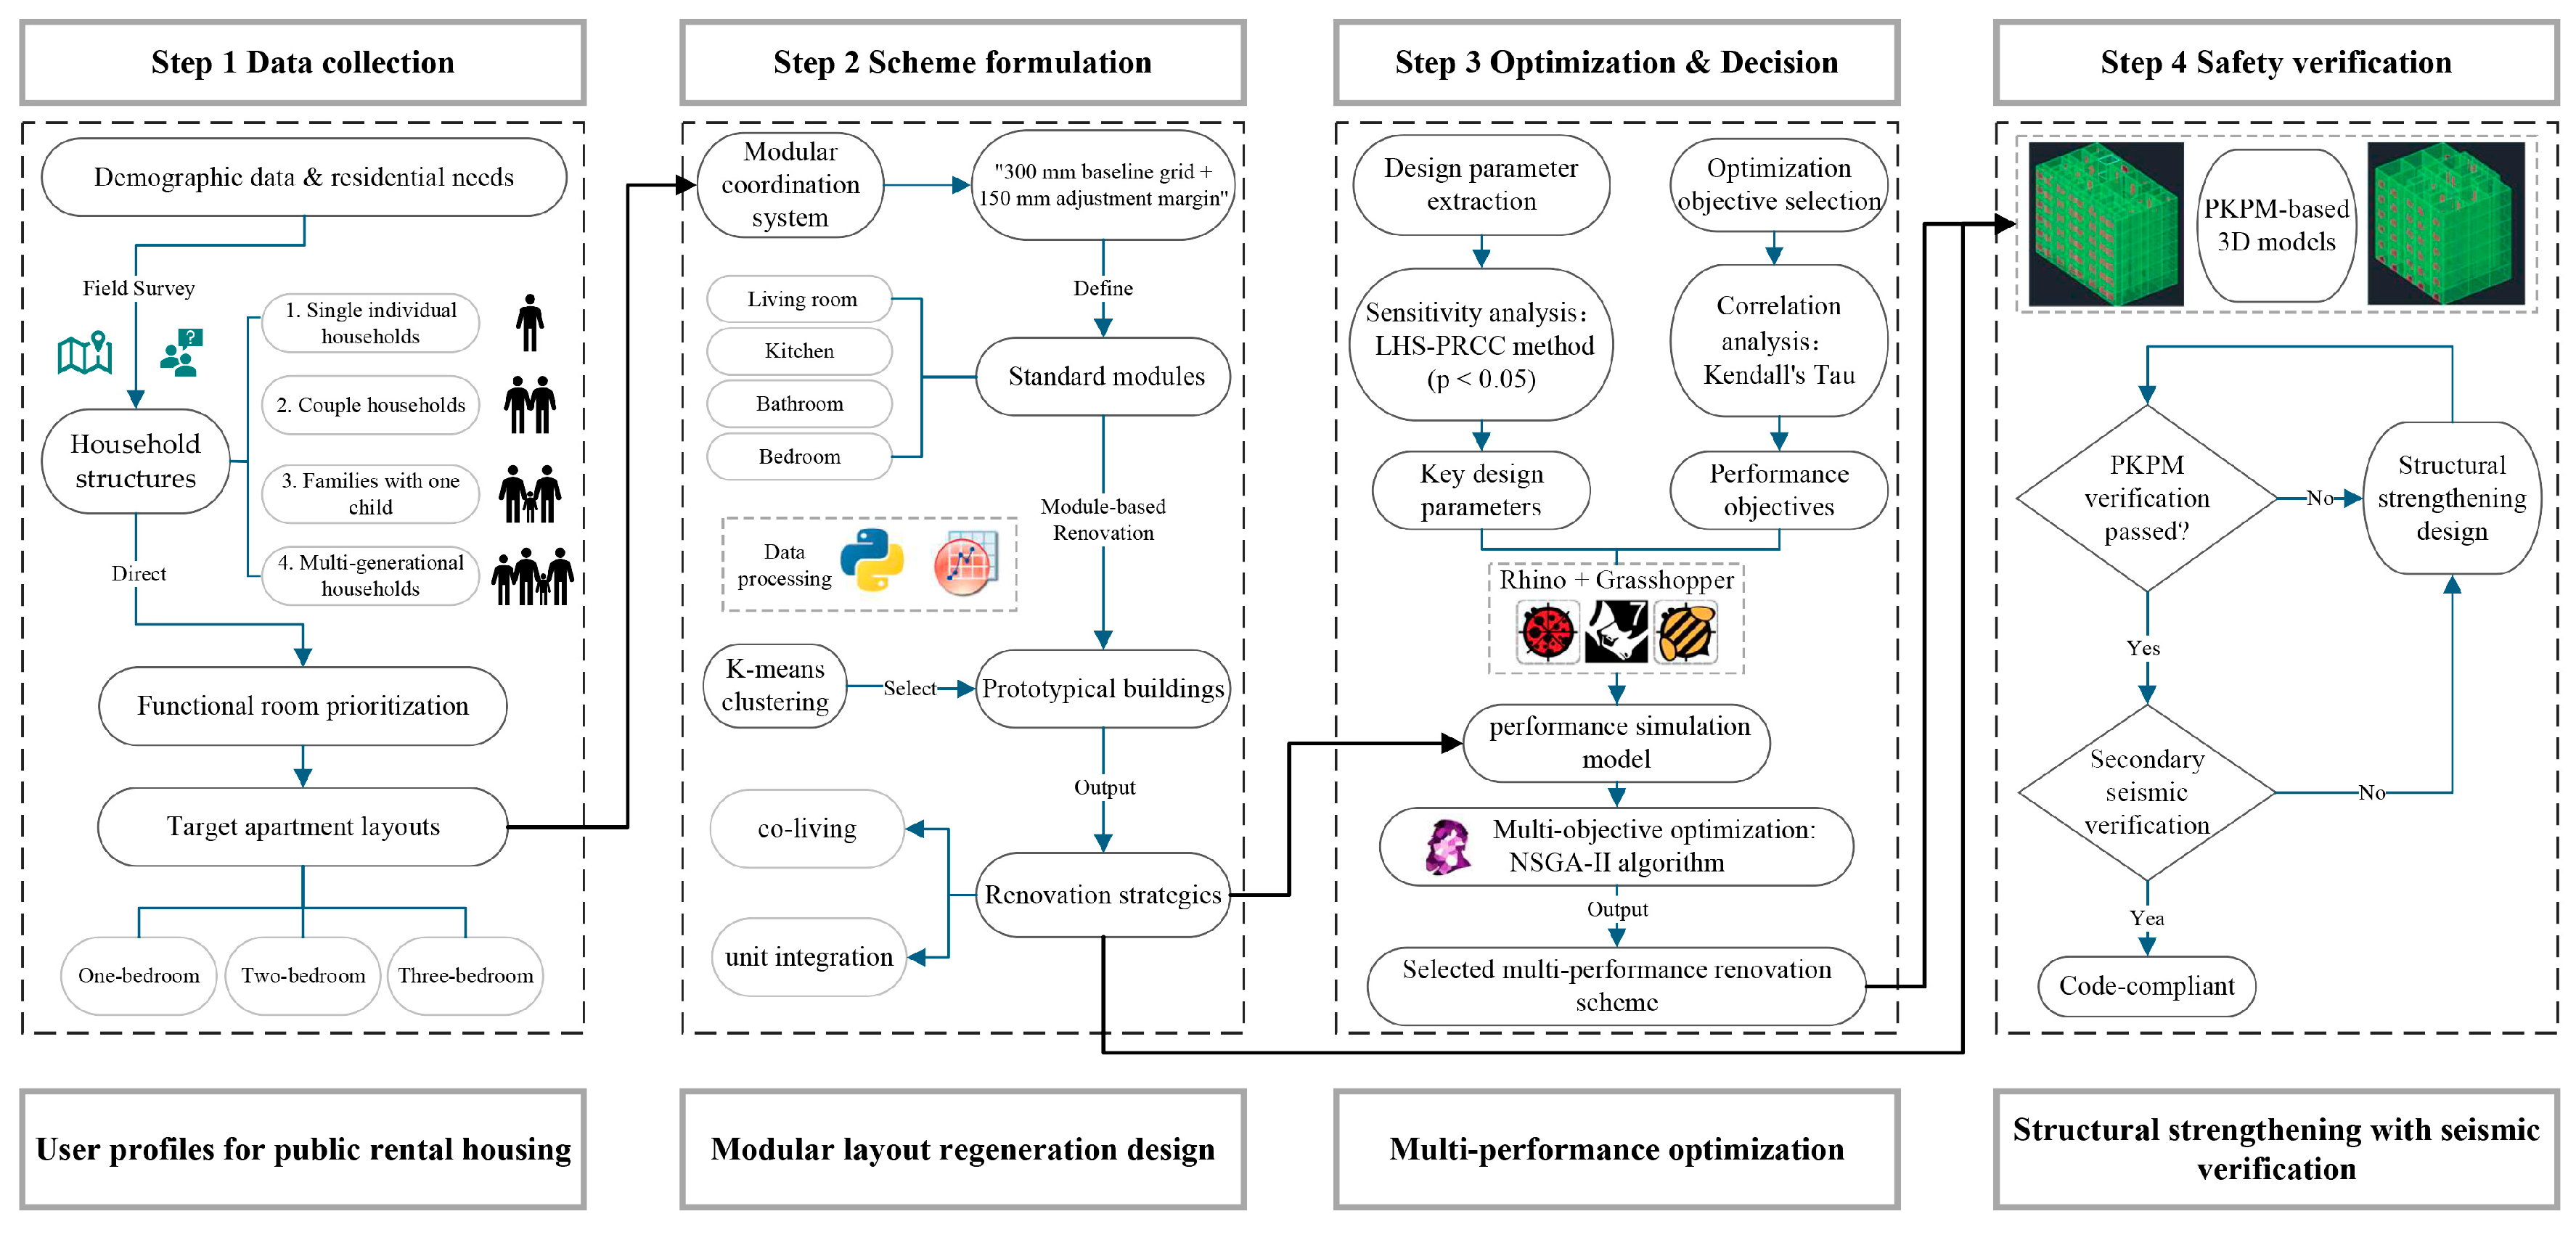
In this section, the comprehensive methodology developed for the renovation of aging residential buildings into public rental housing is presented. As shown in Figure 1, the methodology of the study includes modular layout regeneration design, multi-performance optimization, and structural strengthening with seismic verification, ensuring that the renovation of aging residential buildings for the transformation into public rental housing satisfies both functional and safety requirements. The procedure is organized into four interrelated steps.
Firstly, resident profiling was carried out for public rental housing occupants, through which household structures were classified into four typical categories. Furthermore, baseline area requirements for different unit types were established as design criteria. Second, modular layout regeneration design was performed for aging residential buildings, where functional rooms were defined and tailored spatial layouts were developed for different target occupant groups of public rental housing. Third, a multi-performance optimization problem was formulated for the regenerated aging residential buildings, in which four performance objectives were defined and key design parameters were selected via sensitivity analysis. The Pareto solution sets were then generated through multi-objective optimization, and the final optimal design parameters were identified using a multi-criteria decision-making method. Finally, structural strengthening design and seismic verification were carried out for the regenerated aging residential buildings with masonry structures, ensuring that the post-renovation structural performance satisfies the code requirements.

2.1. User Profiles for Public Rental Housing

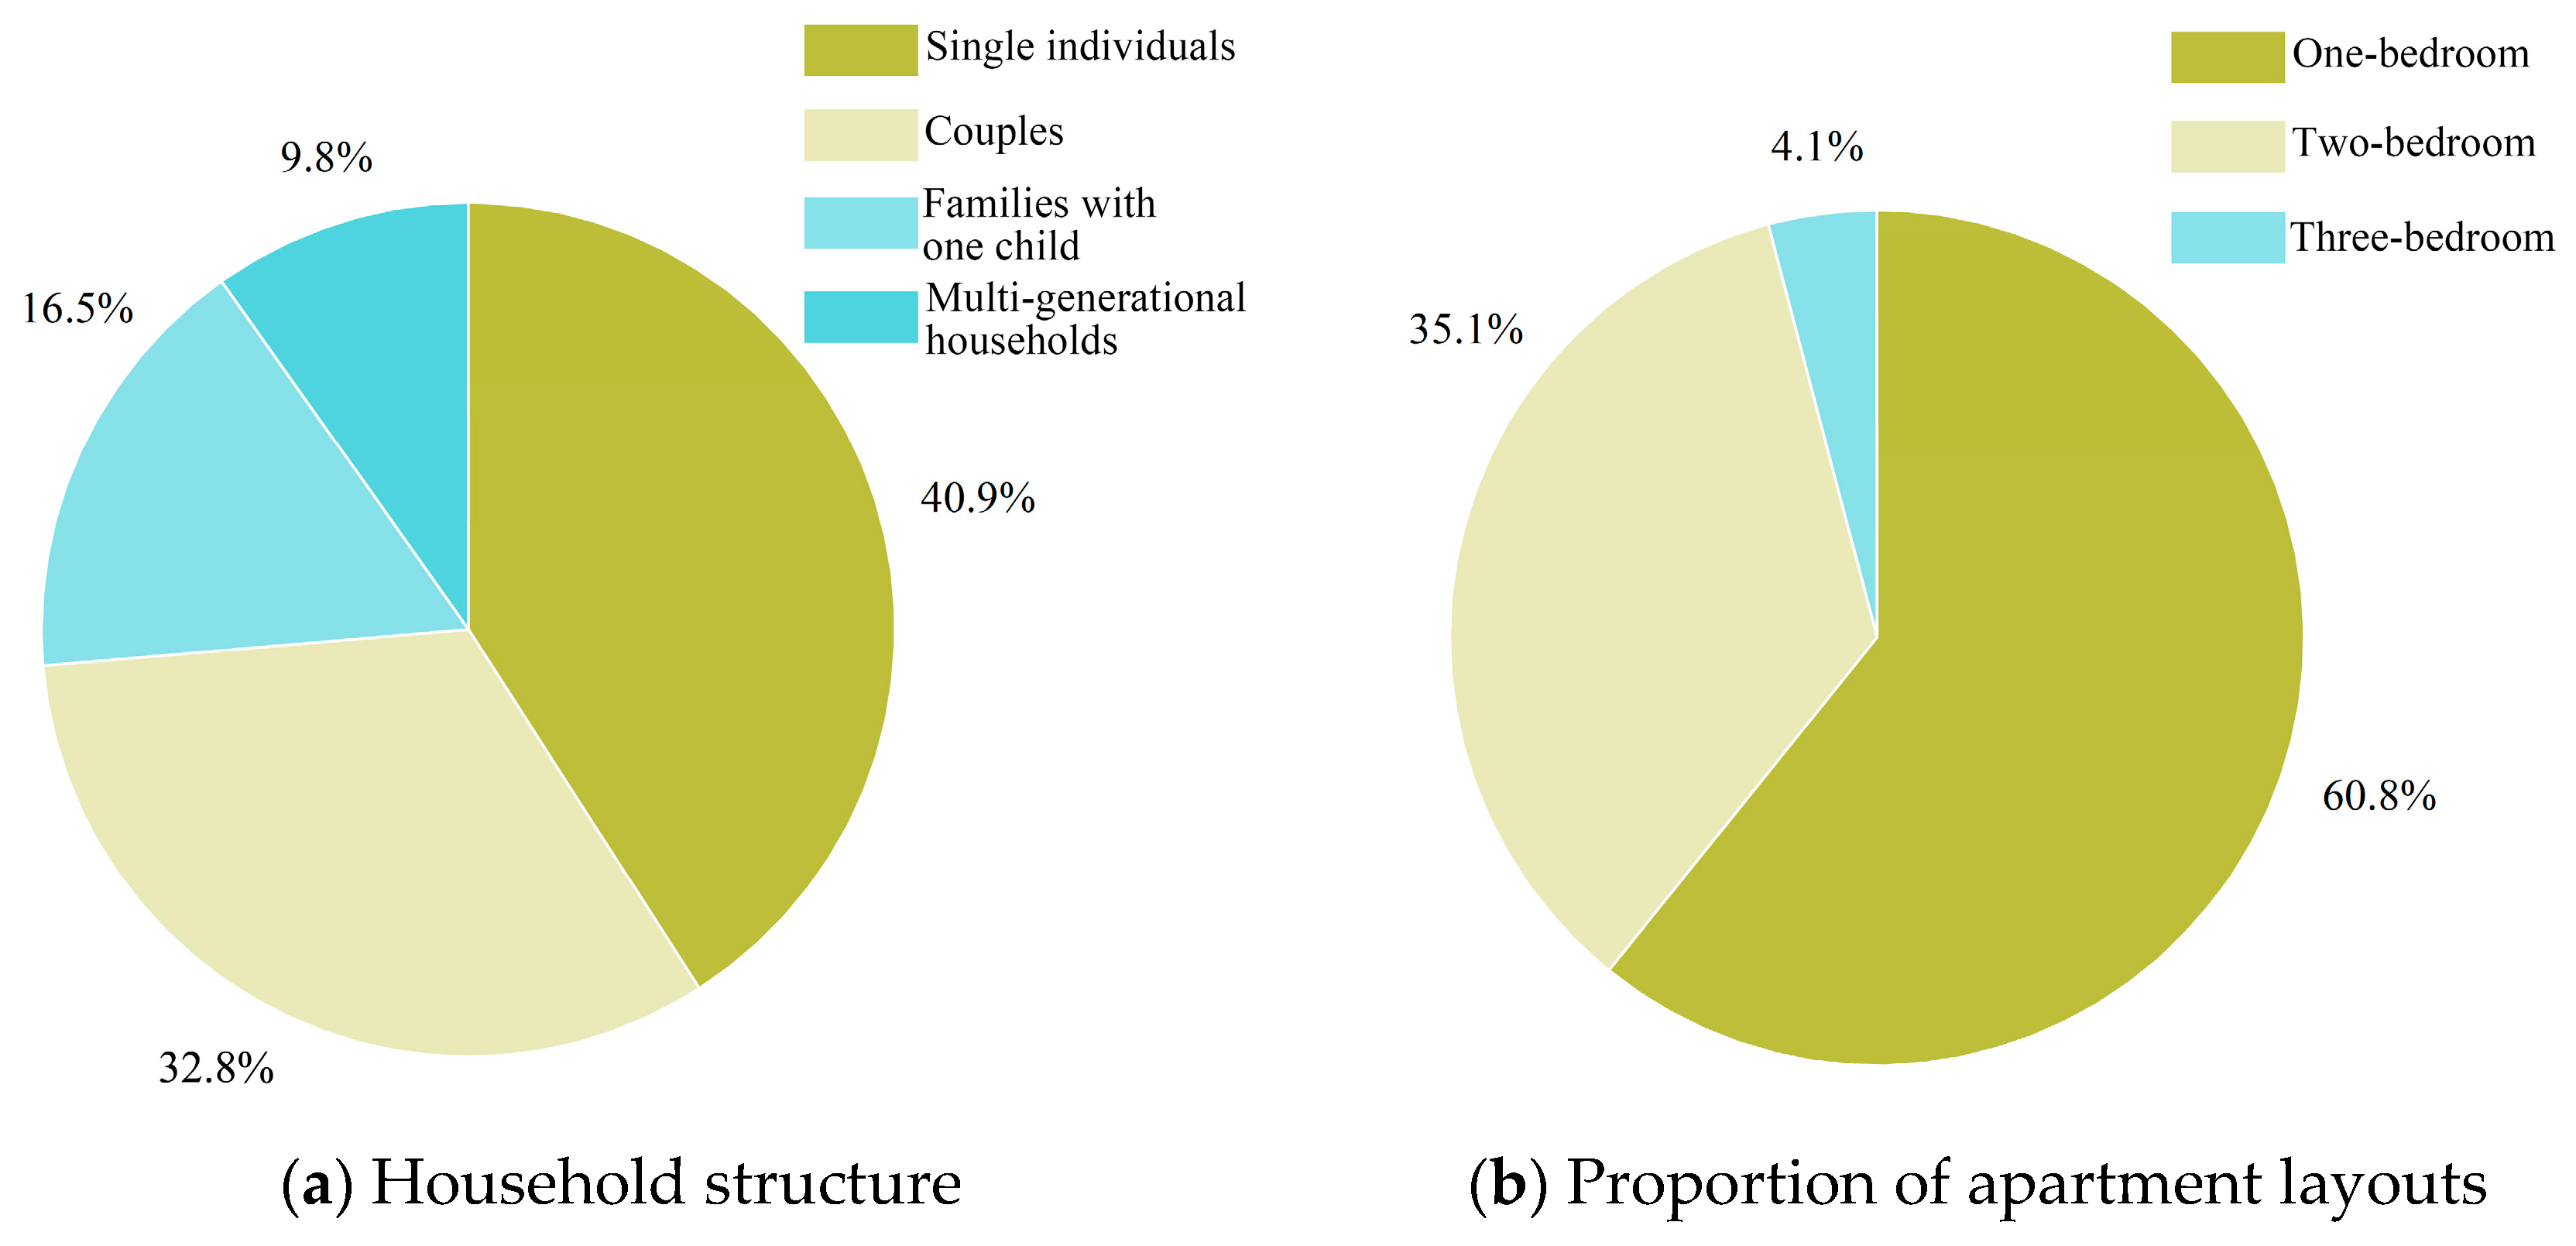
The household structure characteristics and residential needs of public rental housing occupants were analyzed based on 128 valid questionnaire responses and statistical data on the actual occupant distribution in Tianjin, China, so as to identify key aspects of layout restructuring. Occupant groups can be categorized into four types as shown in Figure 2, namely single individuals, couples, families with one child, and multi-generational households, which typically consist of 5 to 6 family members in the context of Chinese public rental housing. These four categories represent the predominant household types identified in the survey, covering the majority of public rental housing occupants in Tianjin. The layout demands of these four categories can be classified into three types: one-bedroom, two-bedroom, and three-bedroom units.
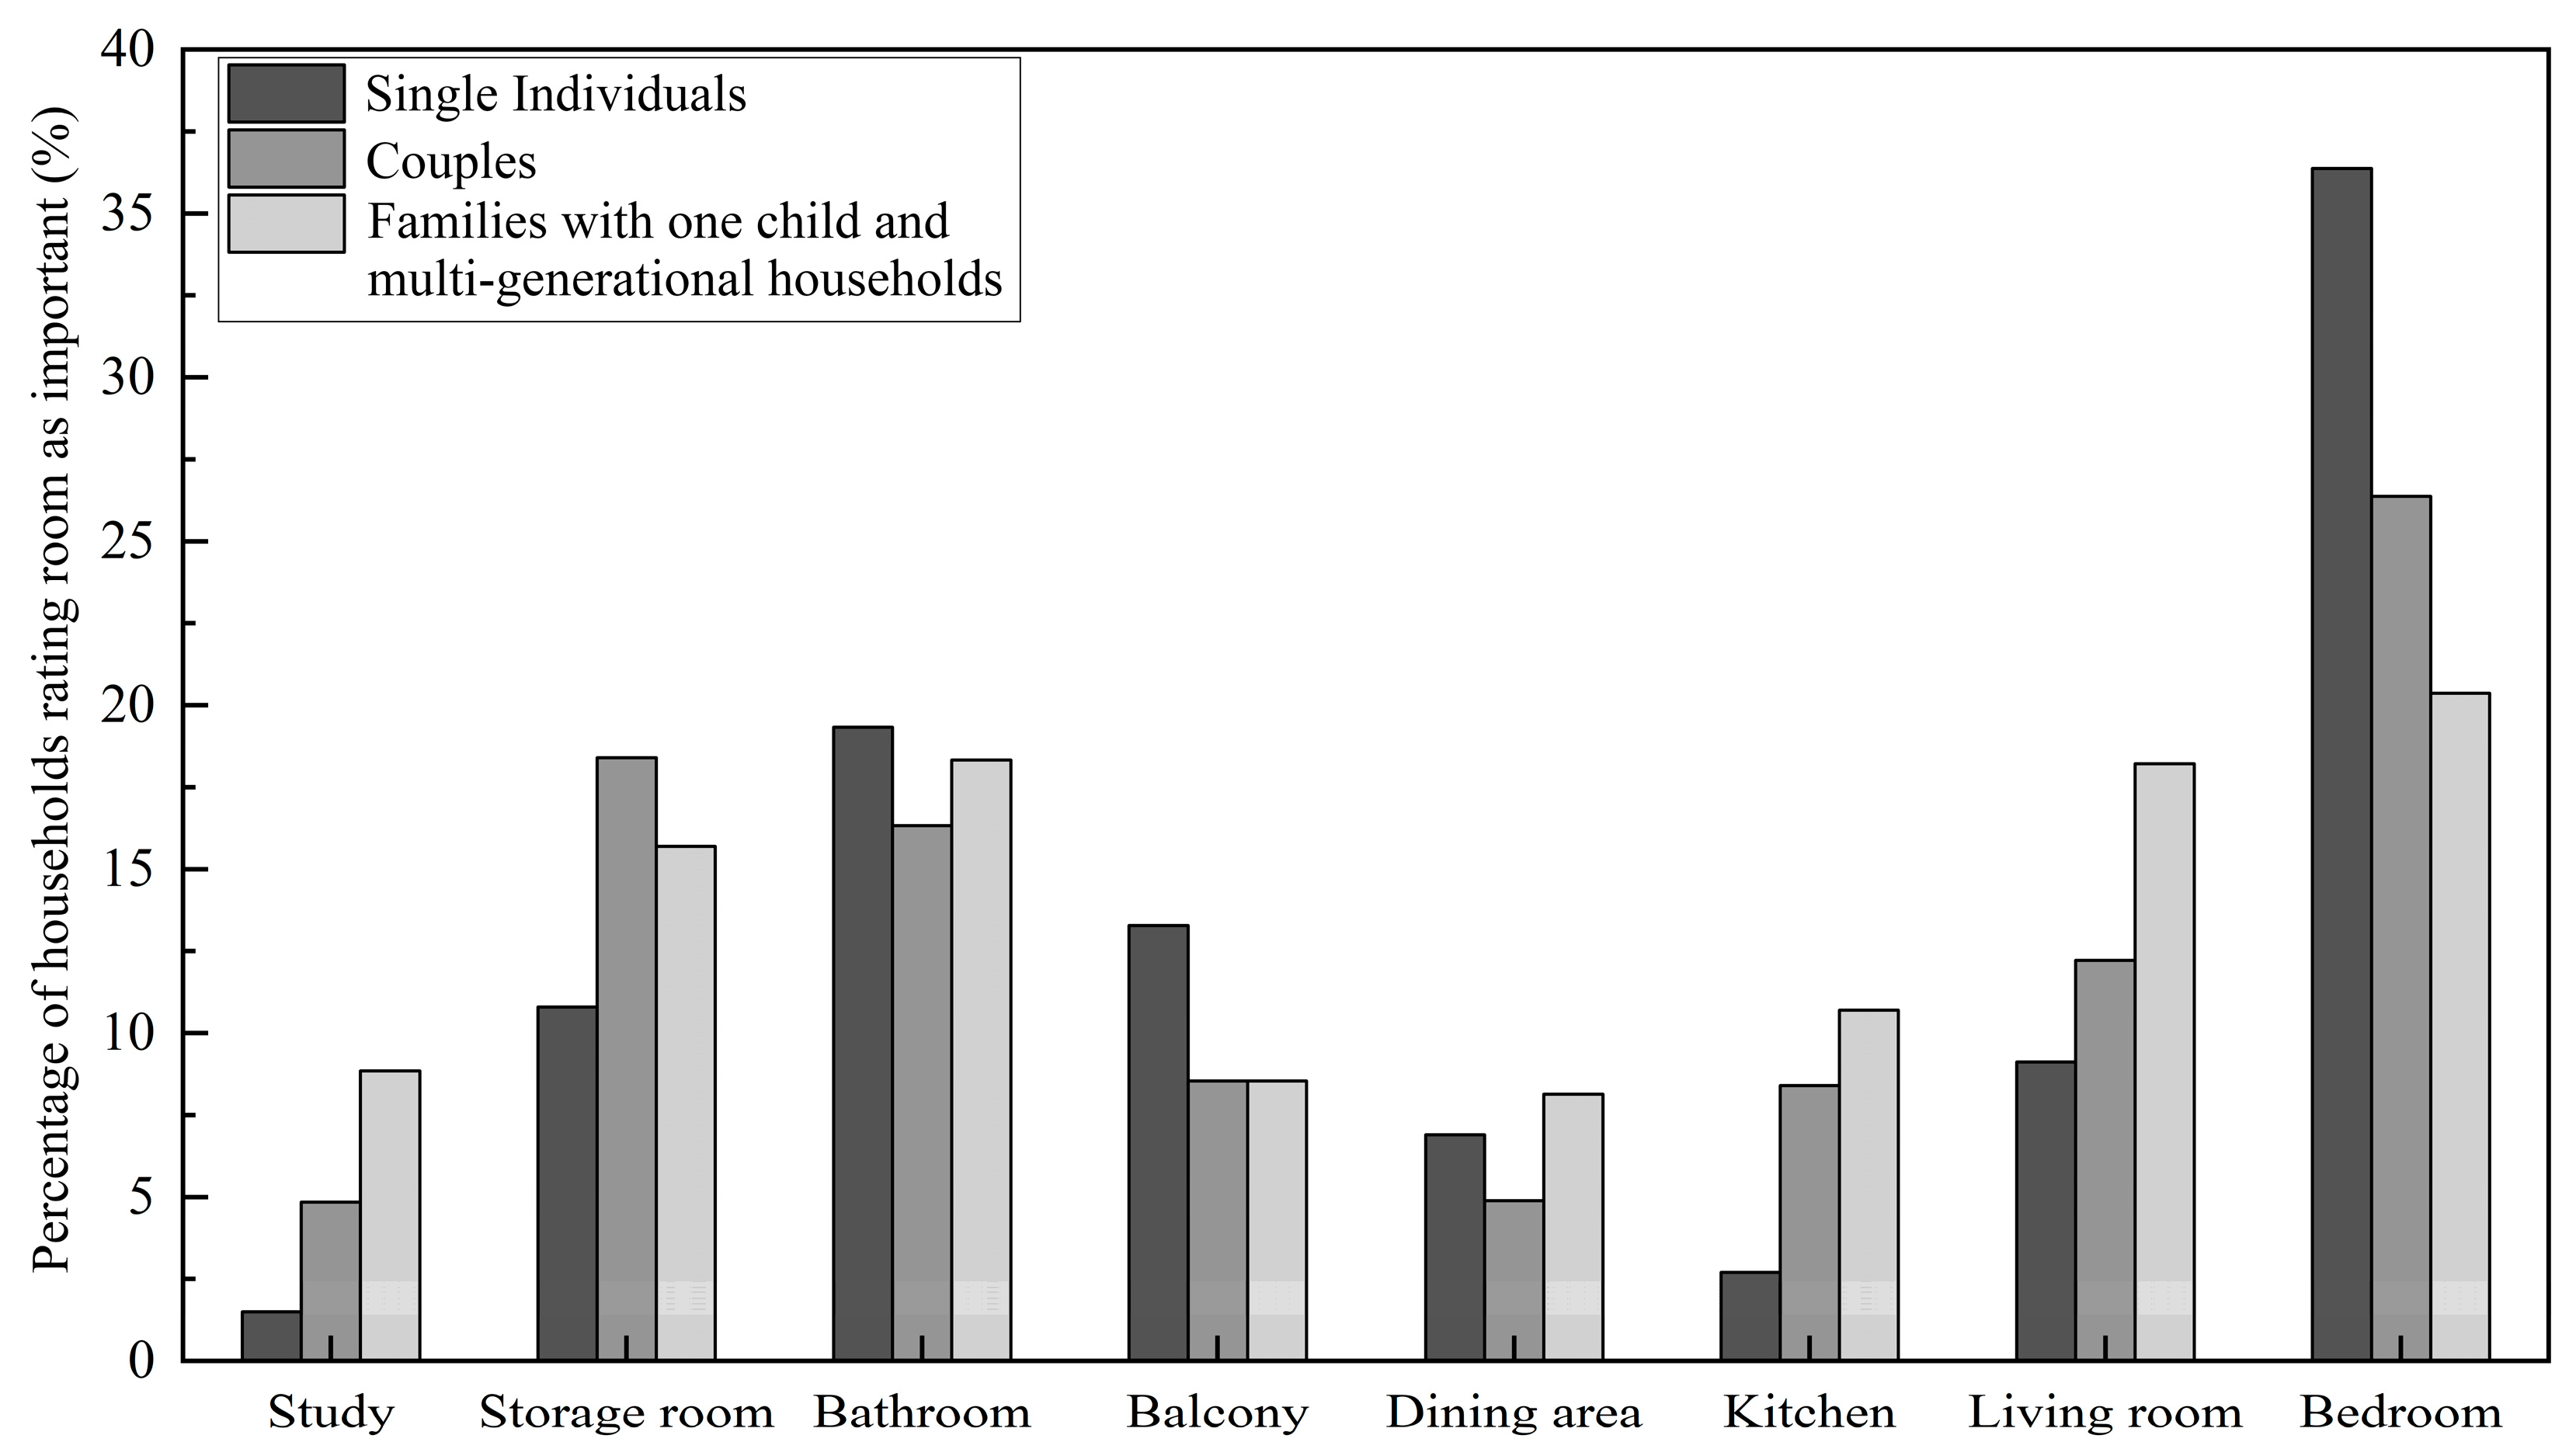
The importance of functional rooms differed across different household types, as shown in Figure 3, with bedrooms, bathrooms, and kitchens being universally prioritized functional rooms. For single individuals and couples, the bedroom is regarded as the primary space, while the demand for kitchens is observed to increase among couple households. For families with one child and multi-generational households, spatial needs are found to be more comprehensive, with bedrooms, living rooms, and bathrooms being assigned the highest importance, while the demand for other functional rooms is distributed more evenly.
Based on the spatial requirements of different household types, the area data for three unit types were compiled by reviewing public rental housing design standards and case studies, as presented in Appendix A Table A1, Table A2 and Table A3. The average floor area of the one-bedroom unit is 35 m2. A multifunctional composite area integrating dining, living, and sleeping functions is approximately 14.5 m2, accounting for 41.5% of the total area, while the kitchen is 3.6 m2, representing 10.4%. Single occupants primarily consist of migrant workers and recent graduates entering the workforce. This group rarely engages in cooking, and the kitchen usage rate is generally low. Consequently, a simplified cooking facility configuration was proposed, and the kitchen area was optimized and repurposed as a communal space. For couple households, an integrated design was adopted for the kitchen and dining area, through which space was saved and basic living requirements were satisfied.
The average total area of the two-bedroom unit is 53.05 m2. The secondary room is designated as a multifunctional room rather than a third bedroom to reflect its flexible usage; it may serve as a child’s room, a study, a temporary residence for elderly family members, or a storage area, depending on the specific needs of the household. This designation aligns with the dynamic allocation management practice of public rental housing, where household composition may change over time. The dining room and living room are 11.37 m2, accounting for 21.43%. The master bedroom is 9.38 m2, representing 17.69%, and the kitchen is 4.36 m2, representing 8.21%. The two-bedroom unit is suitable for families with one child, and the living space is more frequently used for gatherings, dining, and other activities. Therefore, the functions of the living room and dining area were combined.
The average floor area of the three-bedroom unit is 58.1 m2. This space is designated as a multifunctional room rather than a third bedroom to reflect its flexible usage; it may serve as a child’s room, a study, a temporary residence for elderly family members, or a storage area, depending on the specific needs of the household. This designation aligns with the dynamic allocation management practice of public rental housing, where household composition may change over time. The area proportions of the main functional rooms are as follows: dining room 5.96%, living room 11.74%, master bedroom 16.42%, kitchen 6.78%, and bathroom 5.92%. This spatial configuration ensures the independence of each functional zone while maintaining overall coherence.

2.2. Modular Layout Regeneration Design of Aging Residential Buildings

2.2.1. Definition of Functional Rooms

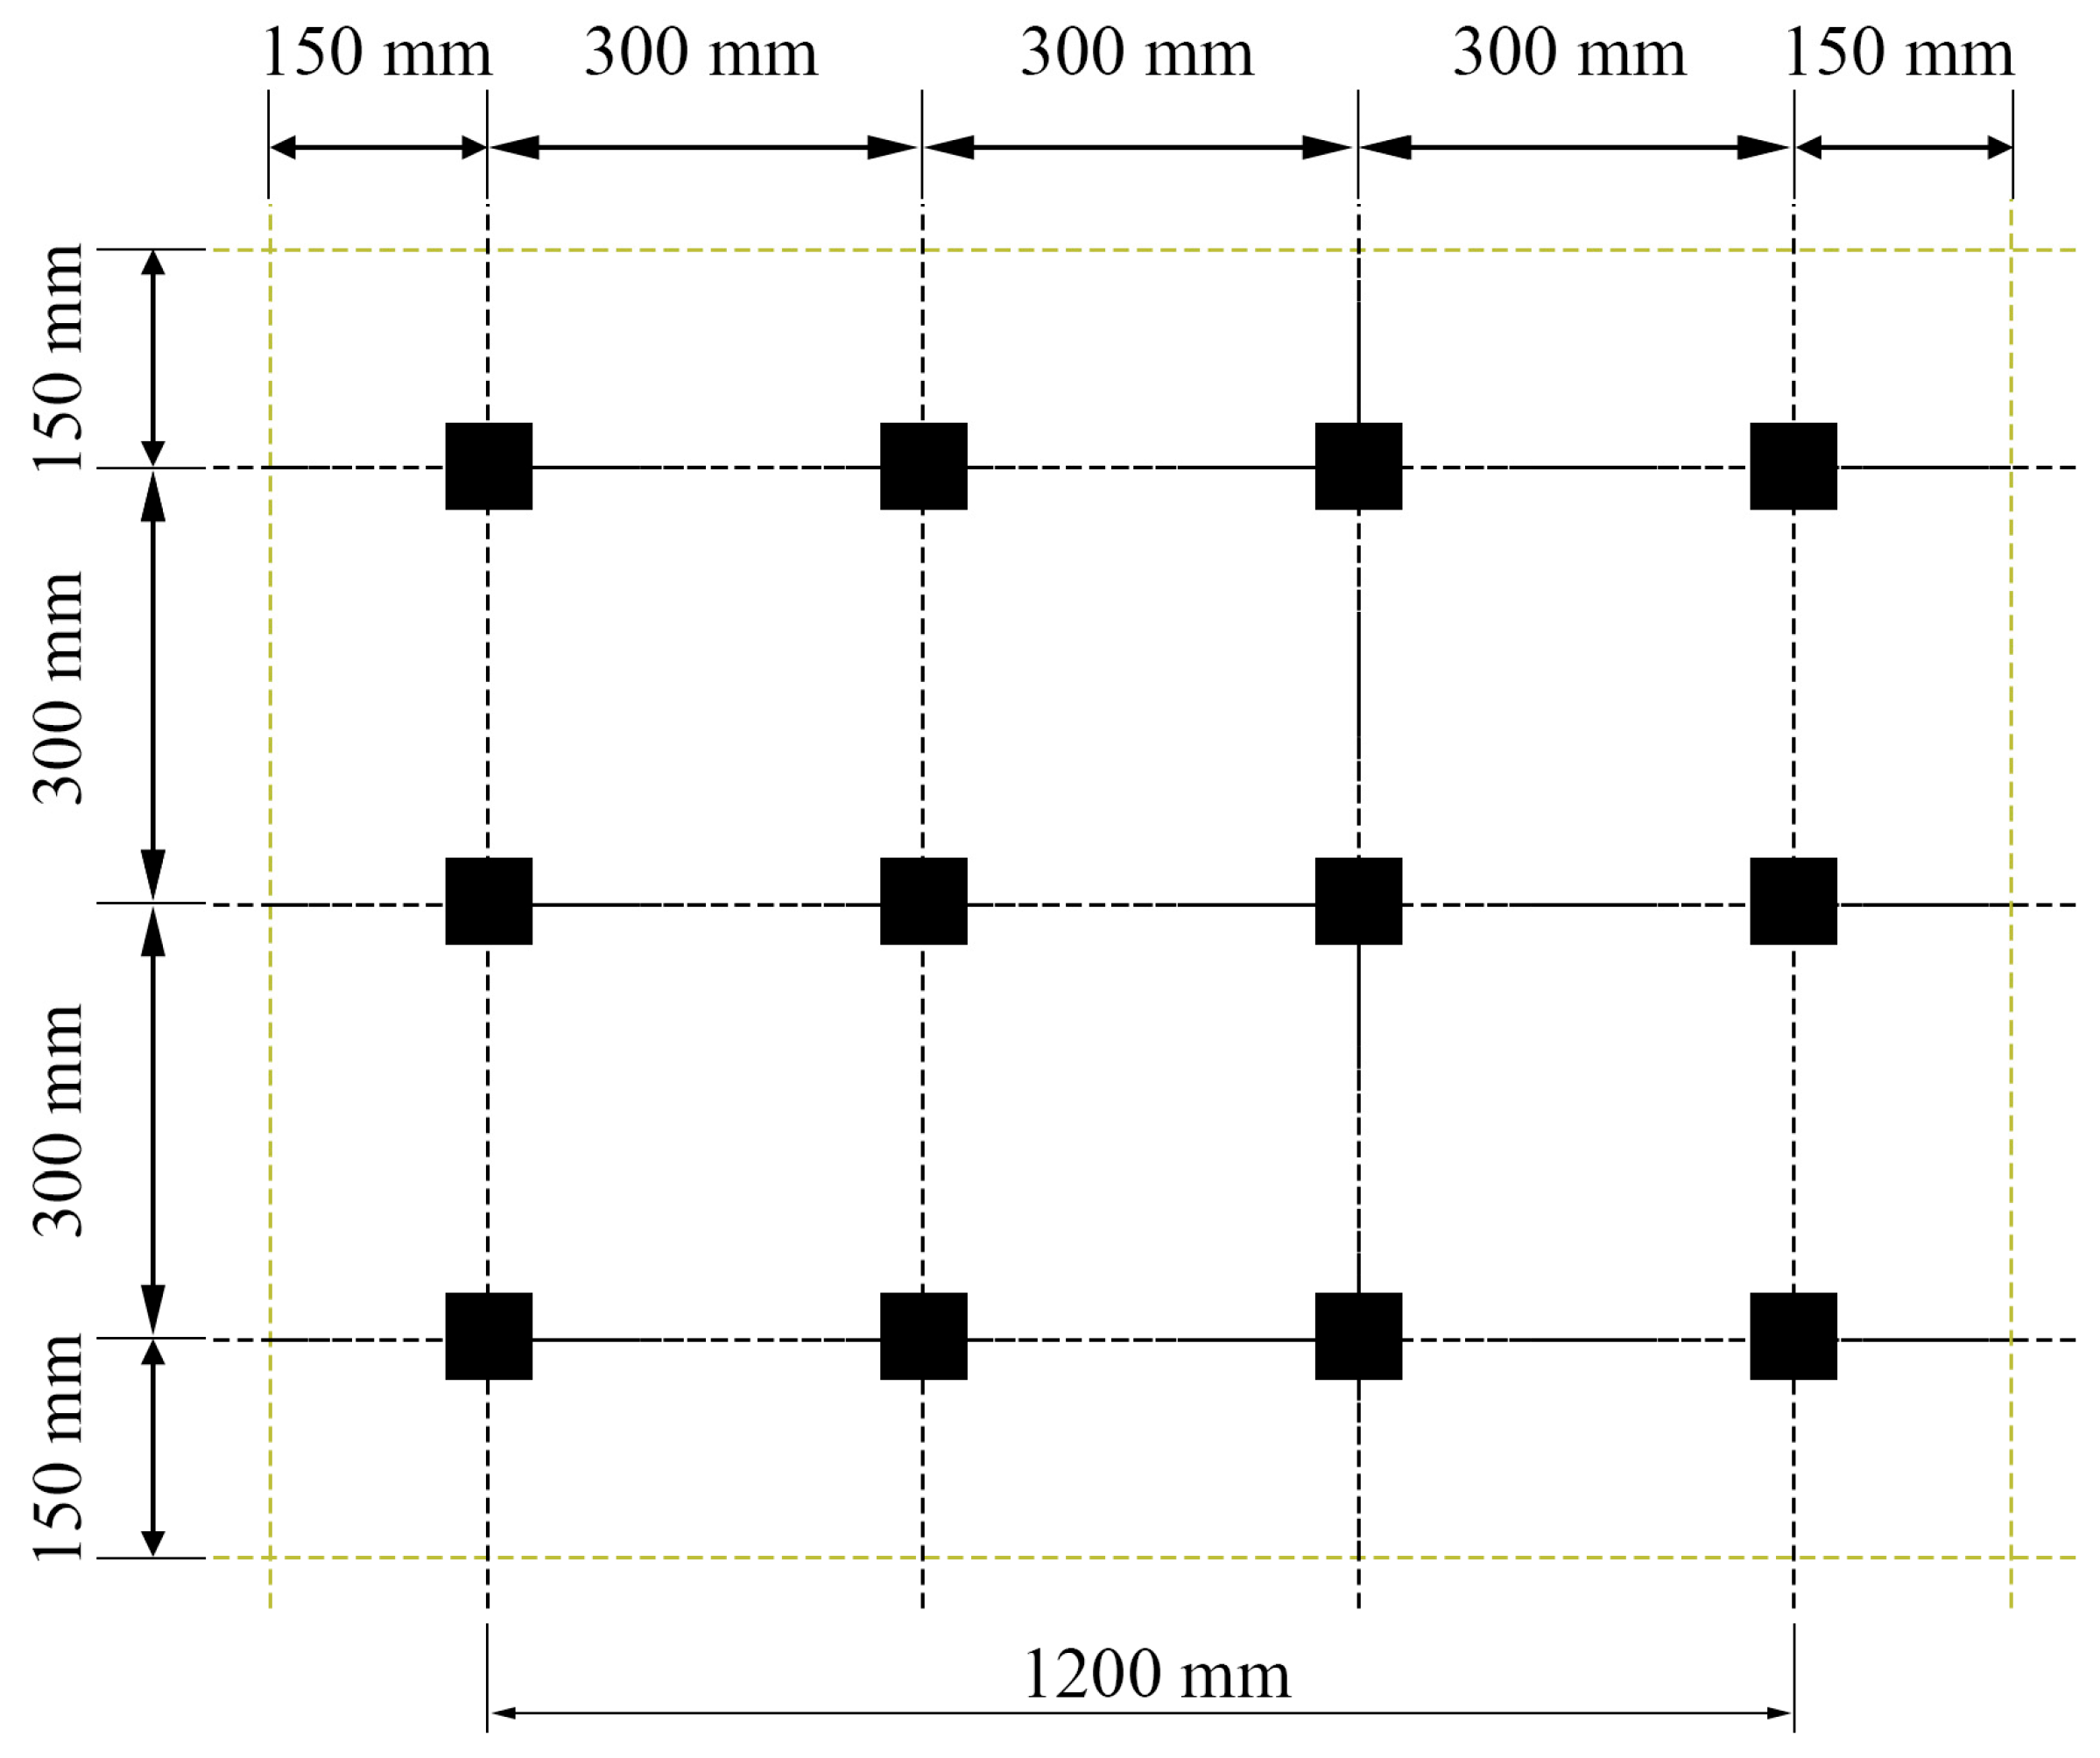
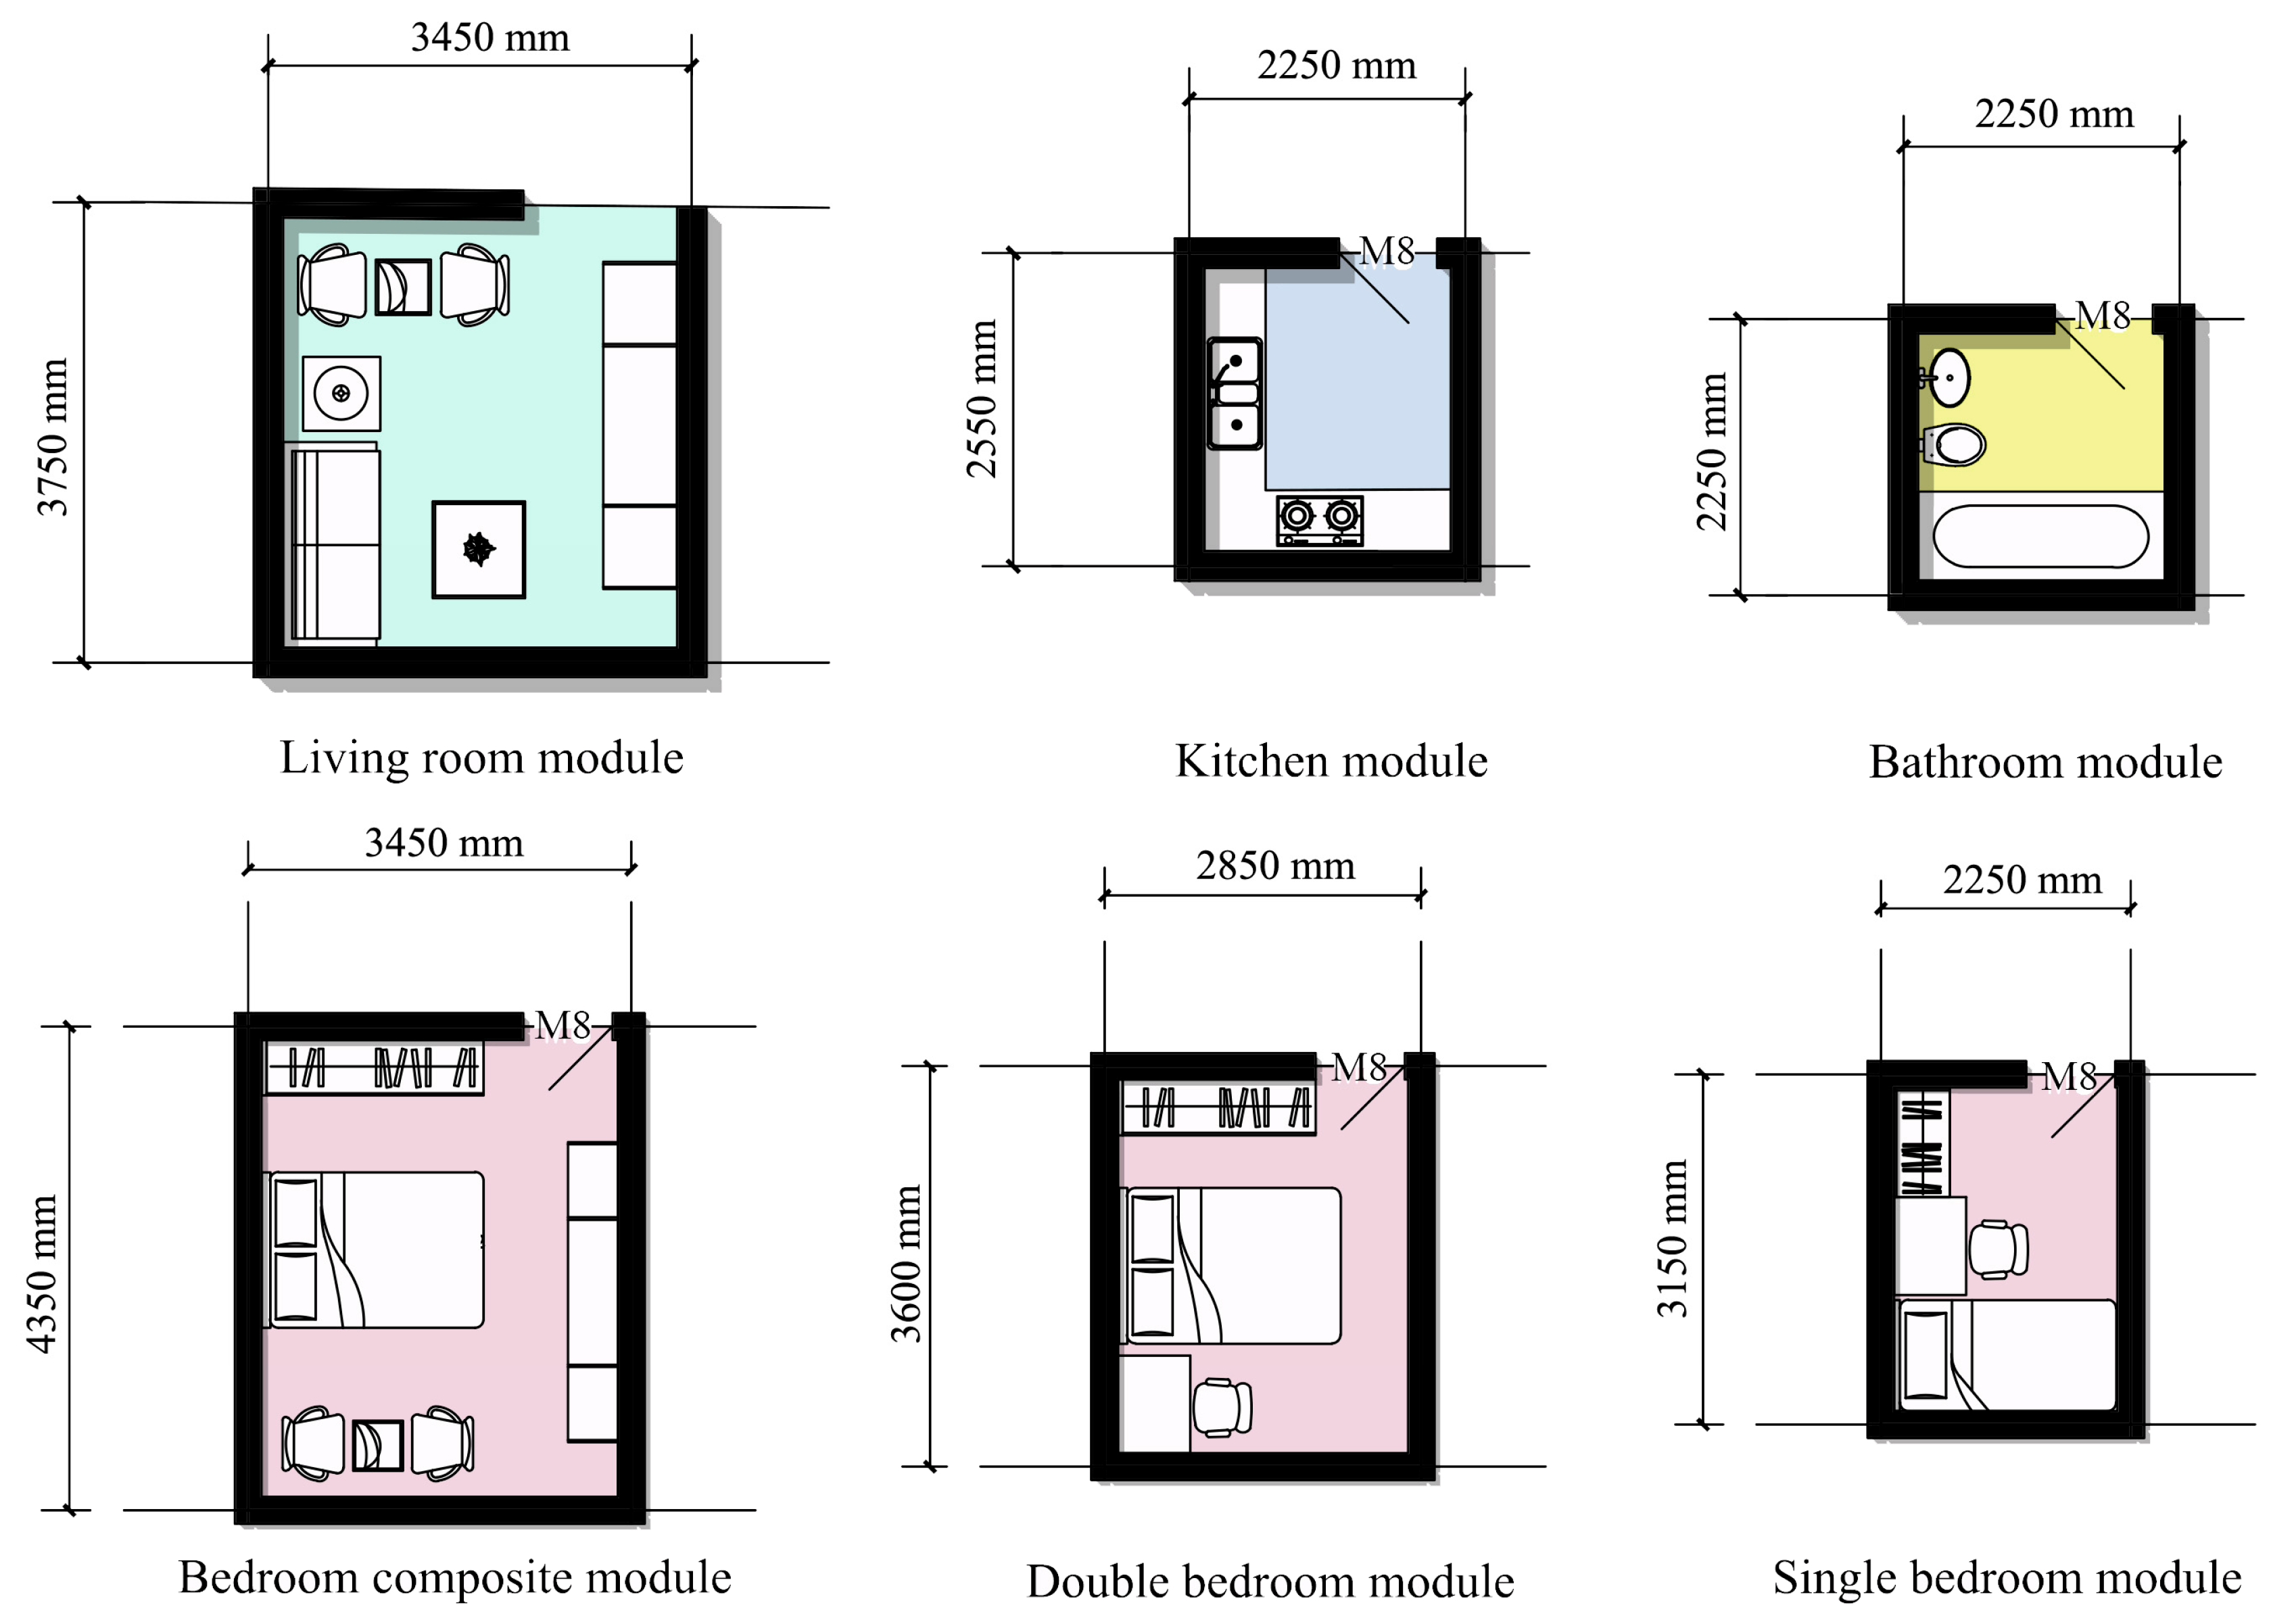
A modular design approach for the regeneration design of aging residential buildings was adopted to achieve efficient spatial organization. In modern residential design, 300 mm is regarded as the basic modular standard. However, a 150 mm modular system is considered more appropriate for small-sized public rental housing units. Meanwhile, the feasibility of using PKPM 2025, a widely used software for building design and seismic verification, for structural reinforcement should be fully considered, and necessary provisions should be made. Therefore, as shown in Figure 4, “300 mm baseline grid + 150 mm adjustment margin” is adopted in the modular coordination system, and the schematic diagram of the dimensions for each functional room is presented in Figure 5.
The living room module was designed to accommodate simple entertaining and leisure activities. The kitchen module was centrally located in the common area to allow for more living space, and was designed as an open counter, with spatial definition achieved through visual partition techniques. The bathroom area was controlled within a reasonable range of 4–6 m2 to ensure comfort, with each independent living unit equipped with a bathroom. The bedroom module was differentially designed to accommodate various household types. For single individuals or couples, an open design concept was adopted, creating a multifunctional composite space. For family-oriented households, such as families with one child or multi-generational households, a “master bedroom + secondary bedroom + common activity area” layout was implemented, ensuring privacy and family interaction spaces.
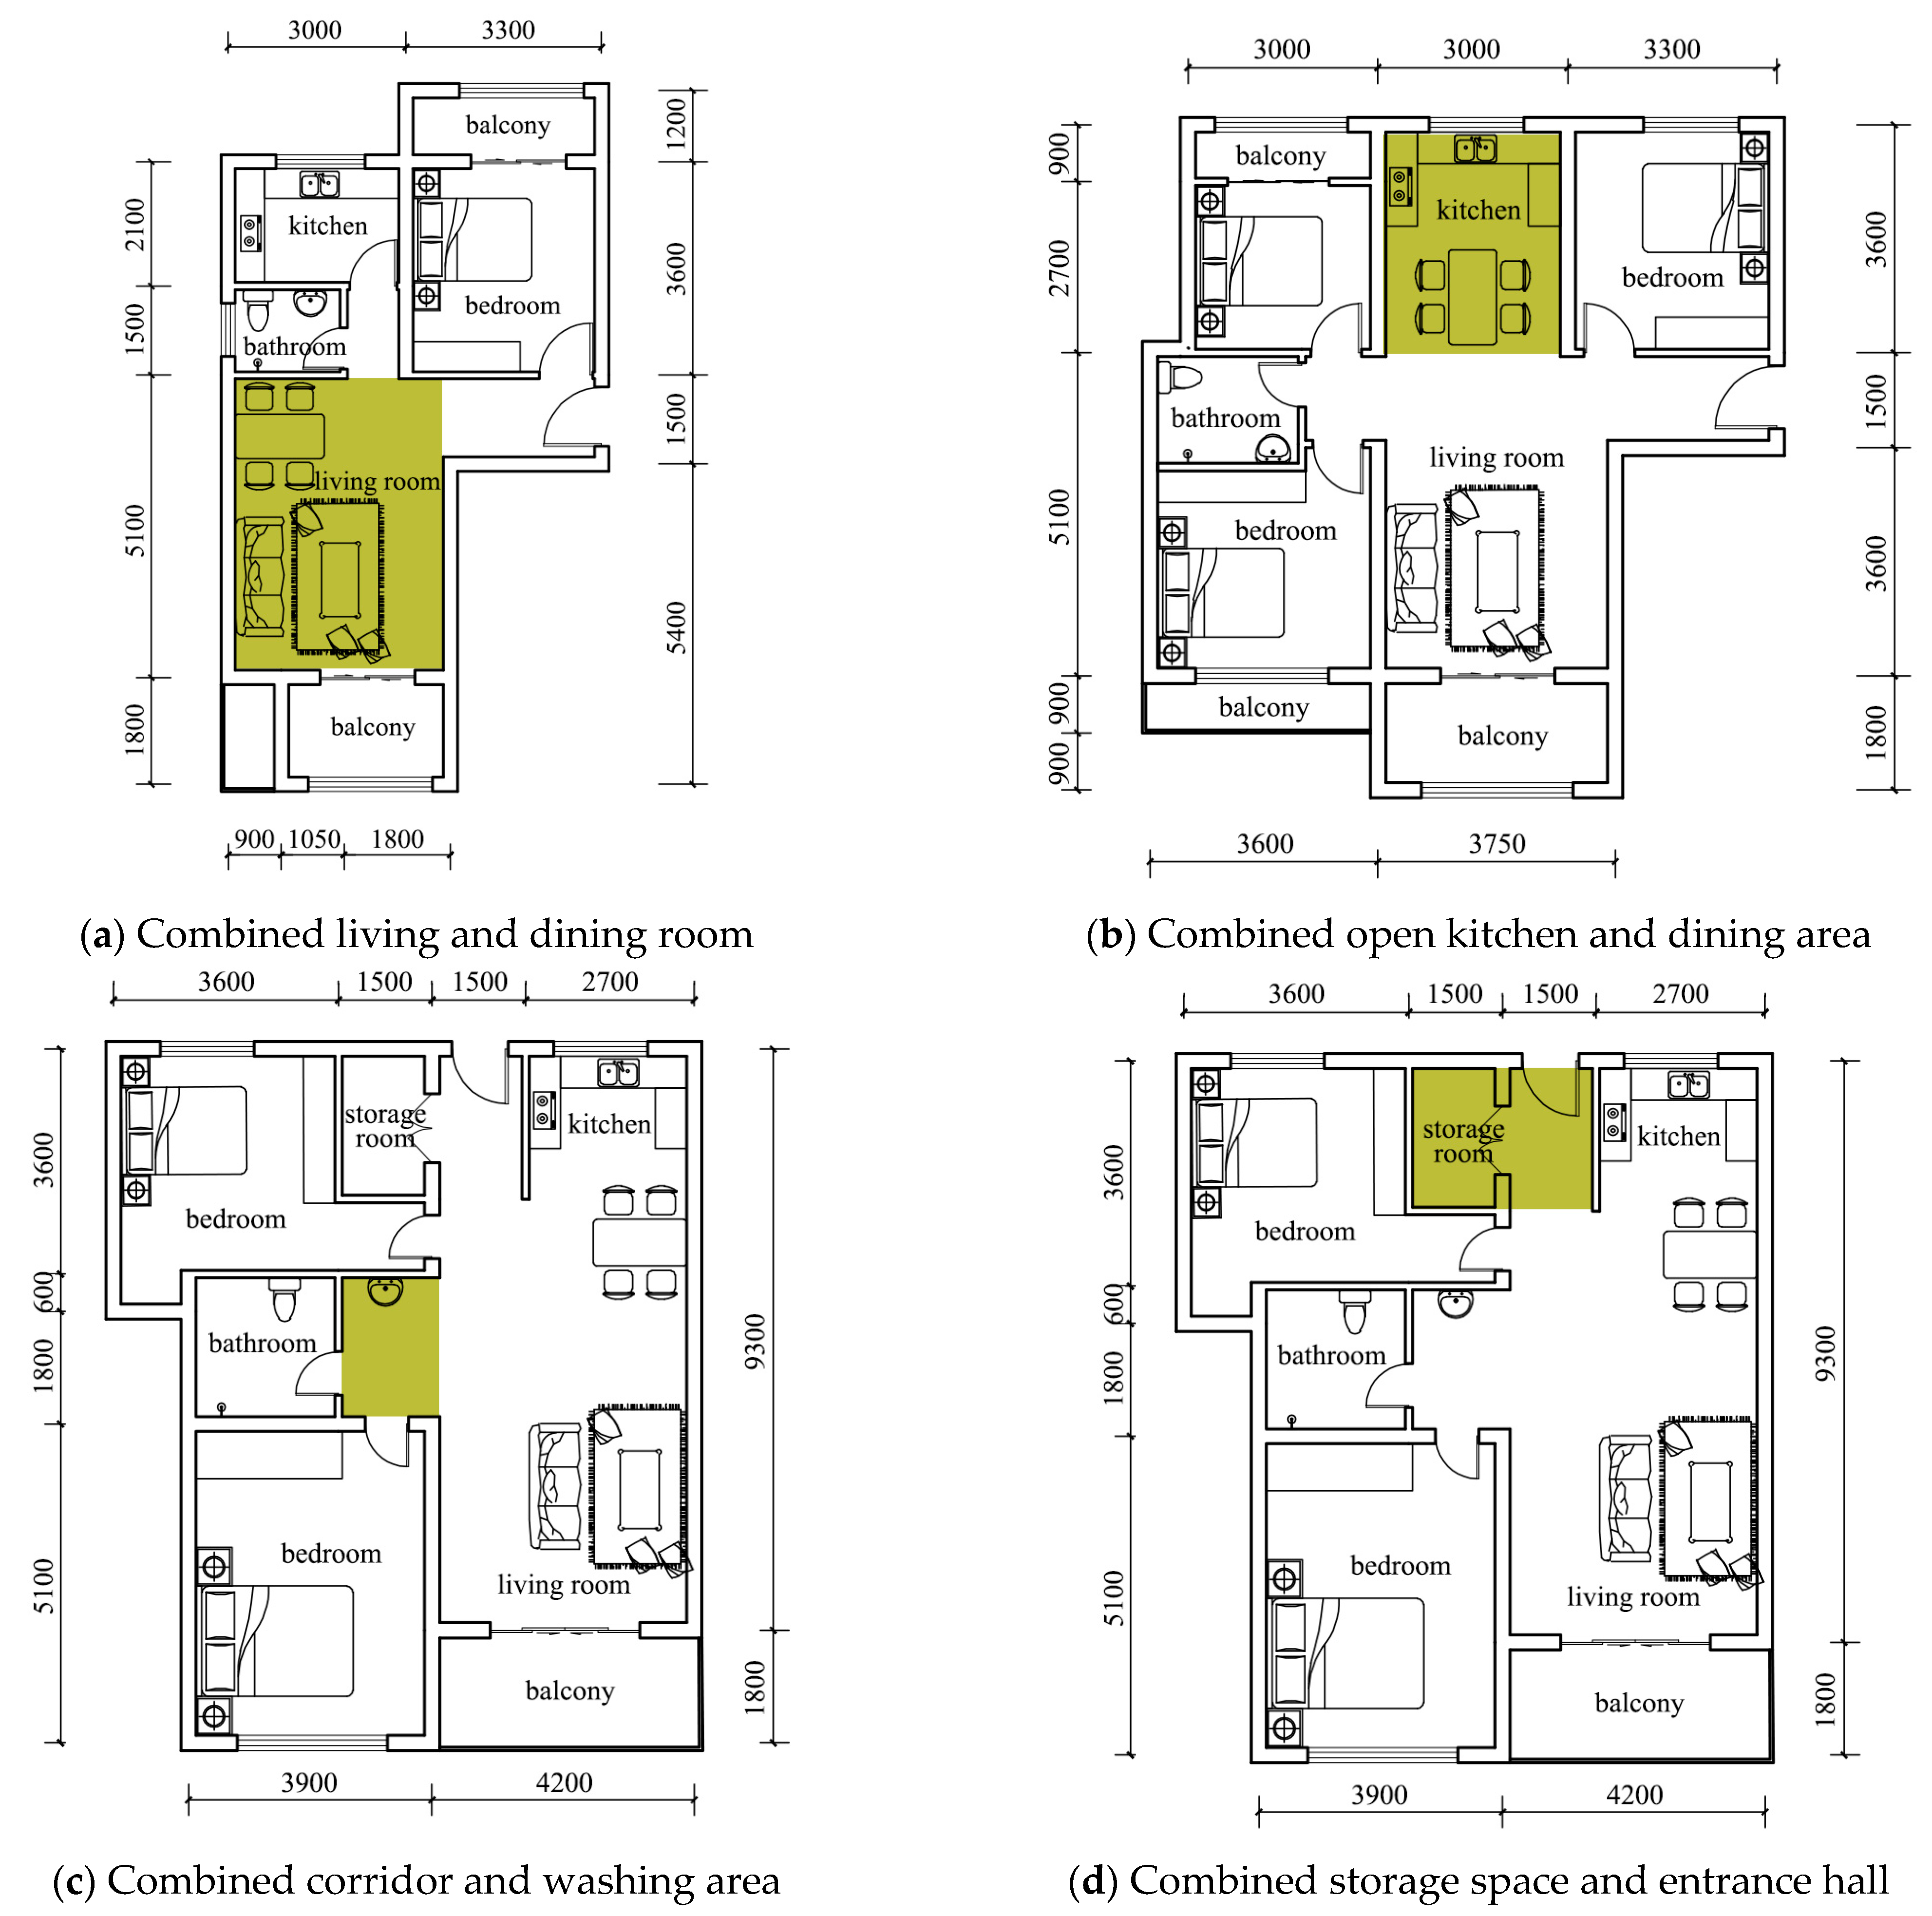
In the regeneration design of layouts for aging residential buildings, priority should be given to increasing the number of single-bedroom layouts, with a corresponding reduction in the proportion of multi-bedroom layouts, as public rental housing is primarily designed for highly mobile resident groups such as new urban employees. Multifunctional composite design strategies were adopted, such as integrating the living and dining areas, and combining corridors with washing zones. Meanwhile, intensive space utilization solutions were implemented, incorporating storage areas at the entrance and adopting integrated kitchen-dining designs, to enhance spatial efficiency. The schematic diagram is illustrated in Figure 6, where all dimensions of values are mm.
It should be noted that the household classification described above focuses on the predominant types identified in the survey, with the aim of extracting general design principles applicable to the majority of public rental housing occupants. In actual practice, household compositions may exhibit greater heterogeneity than the four categories presented. Therefore, it is recommended that flexible spatial partitioning be reserved in the layout design to accommodate non-standard or evolving household combinations, thereby enhancing the practical adaptability of the proposed modular system.

2.2.2. Strategies of Layout Regeneration Design

In the study, two renovation modes, namely “co-living” and “unit integration” were introduced to adapt aging residential buildings for public rental housing and address common issues such as limited floor area and irrational functional zoning.
Under the co-living mode, openings were created in the intervening wall between two adjacent units to form a shared space that centrally incorporates the kitchen area. The regenerated layout units were designed for collective use by three to four single individuals or couple households, while private bedrooms and bathrooms were retained for each household. The shared living space served both recreational and social functions. Shared kitchen facilities contributed to reduced living costs through equipment sharing and enhanced interaction among residents.
For existing small-sized units, structural connections were created between two or more adjacent layouts, through which spatial integration was carried out to form new residential layouts with appropriate floor areas and functional zones. Through the unit integration mode, living, dining–kitchen, and bathroom areas were planned according to the needs of public rental housing occupants.
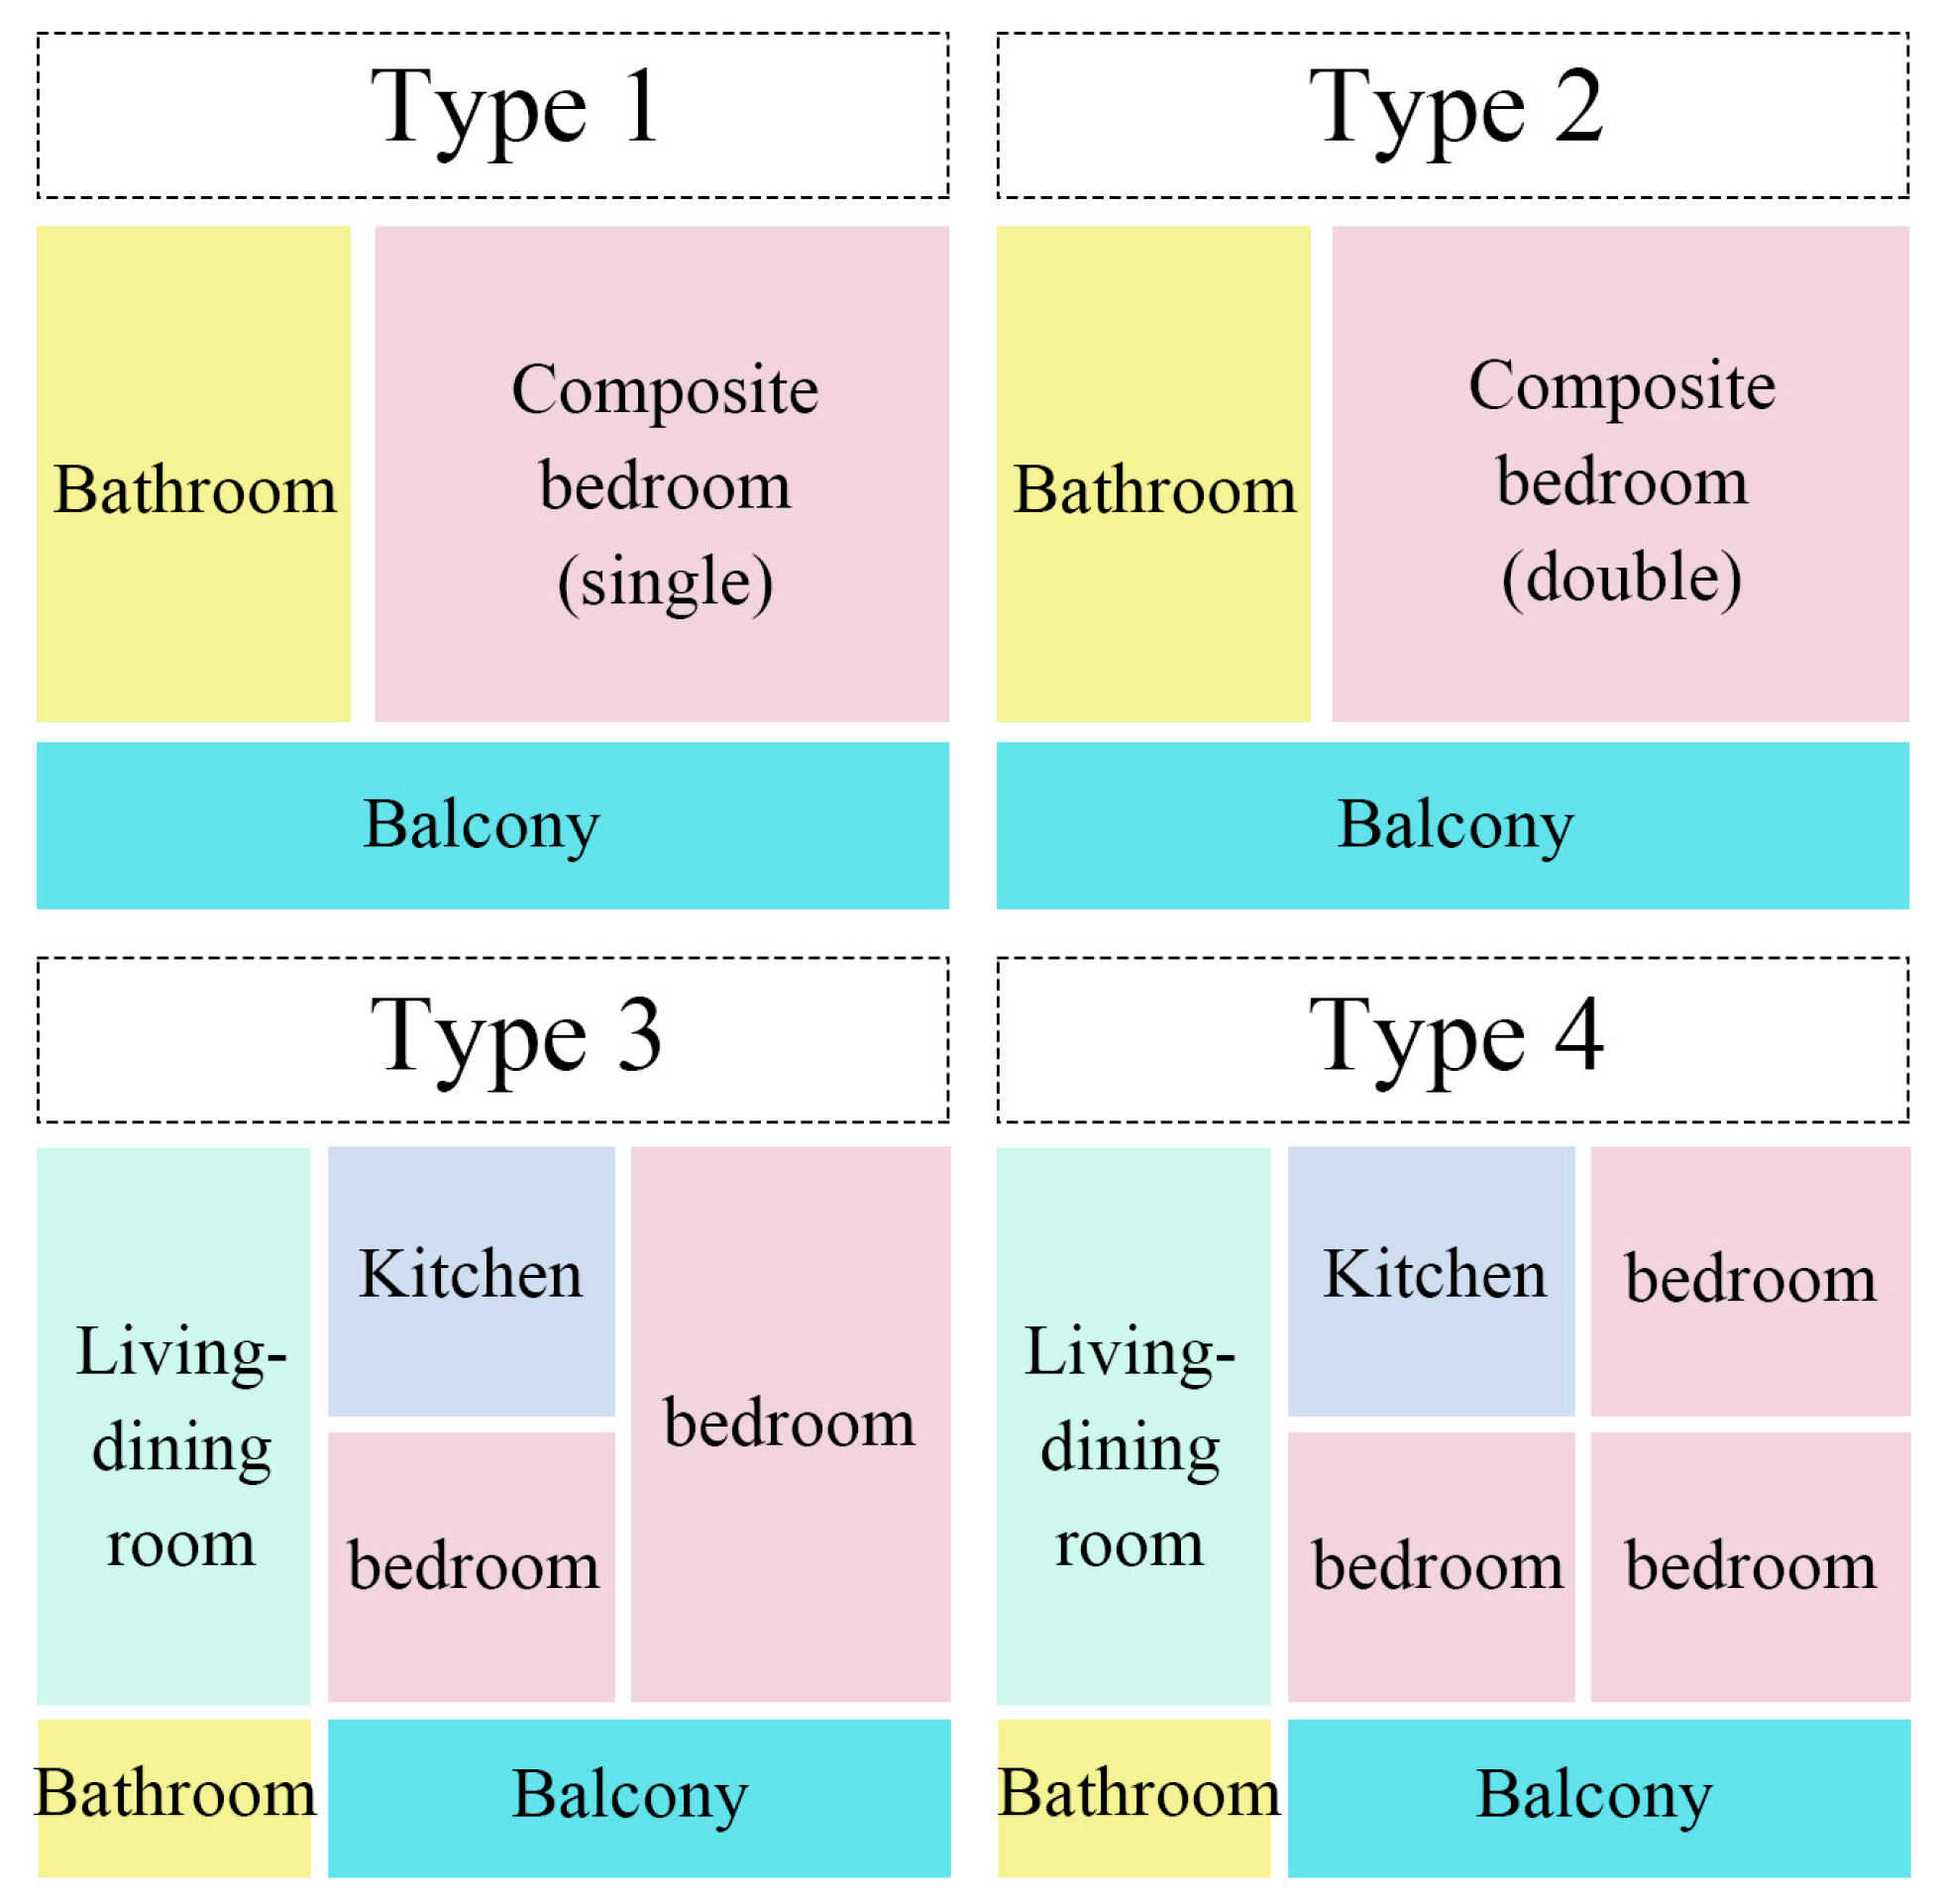
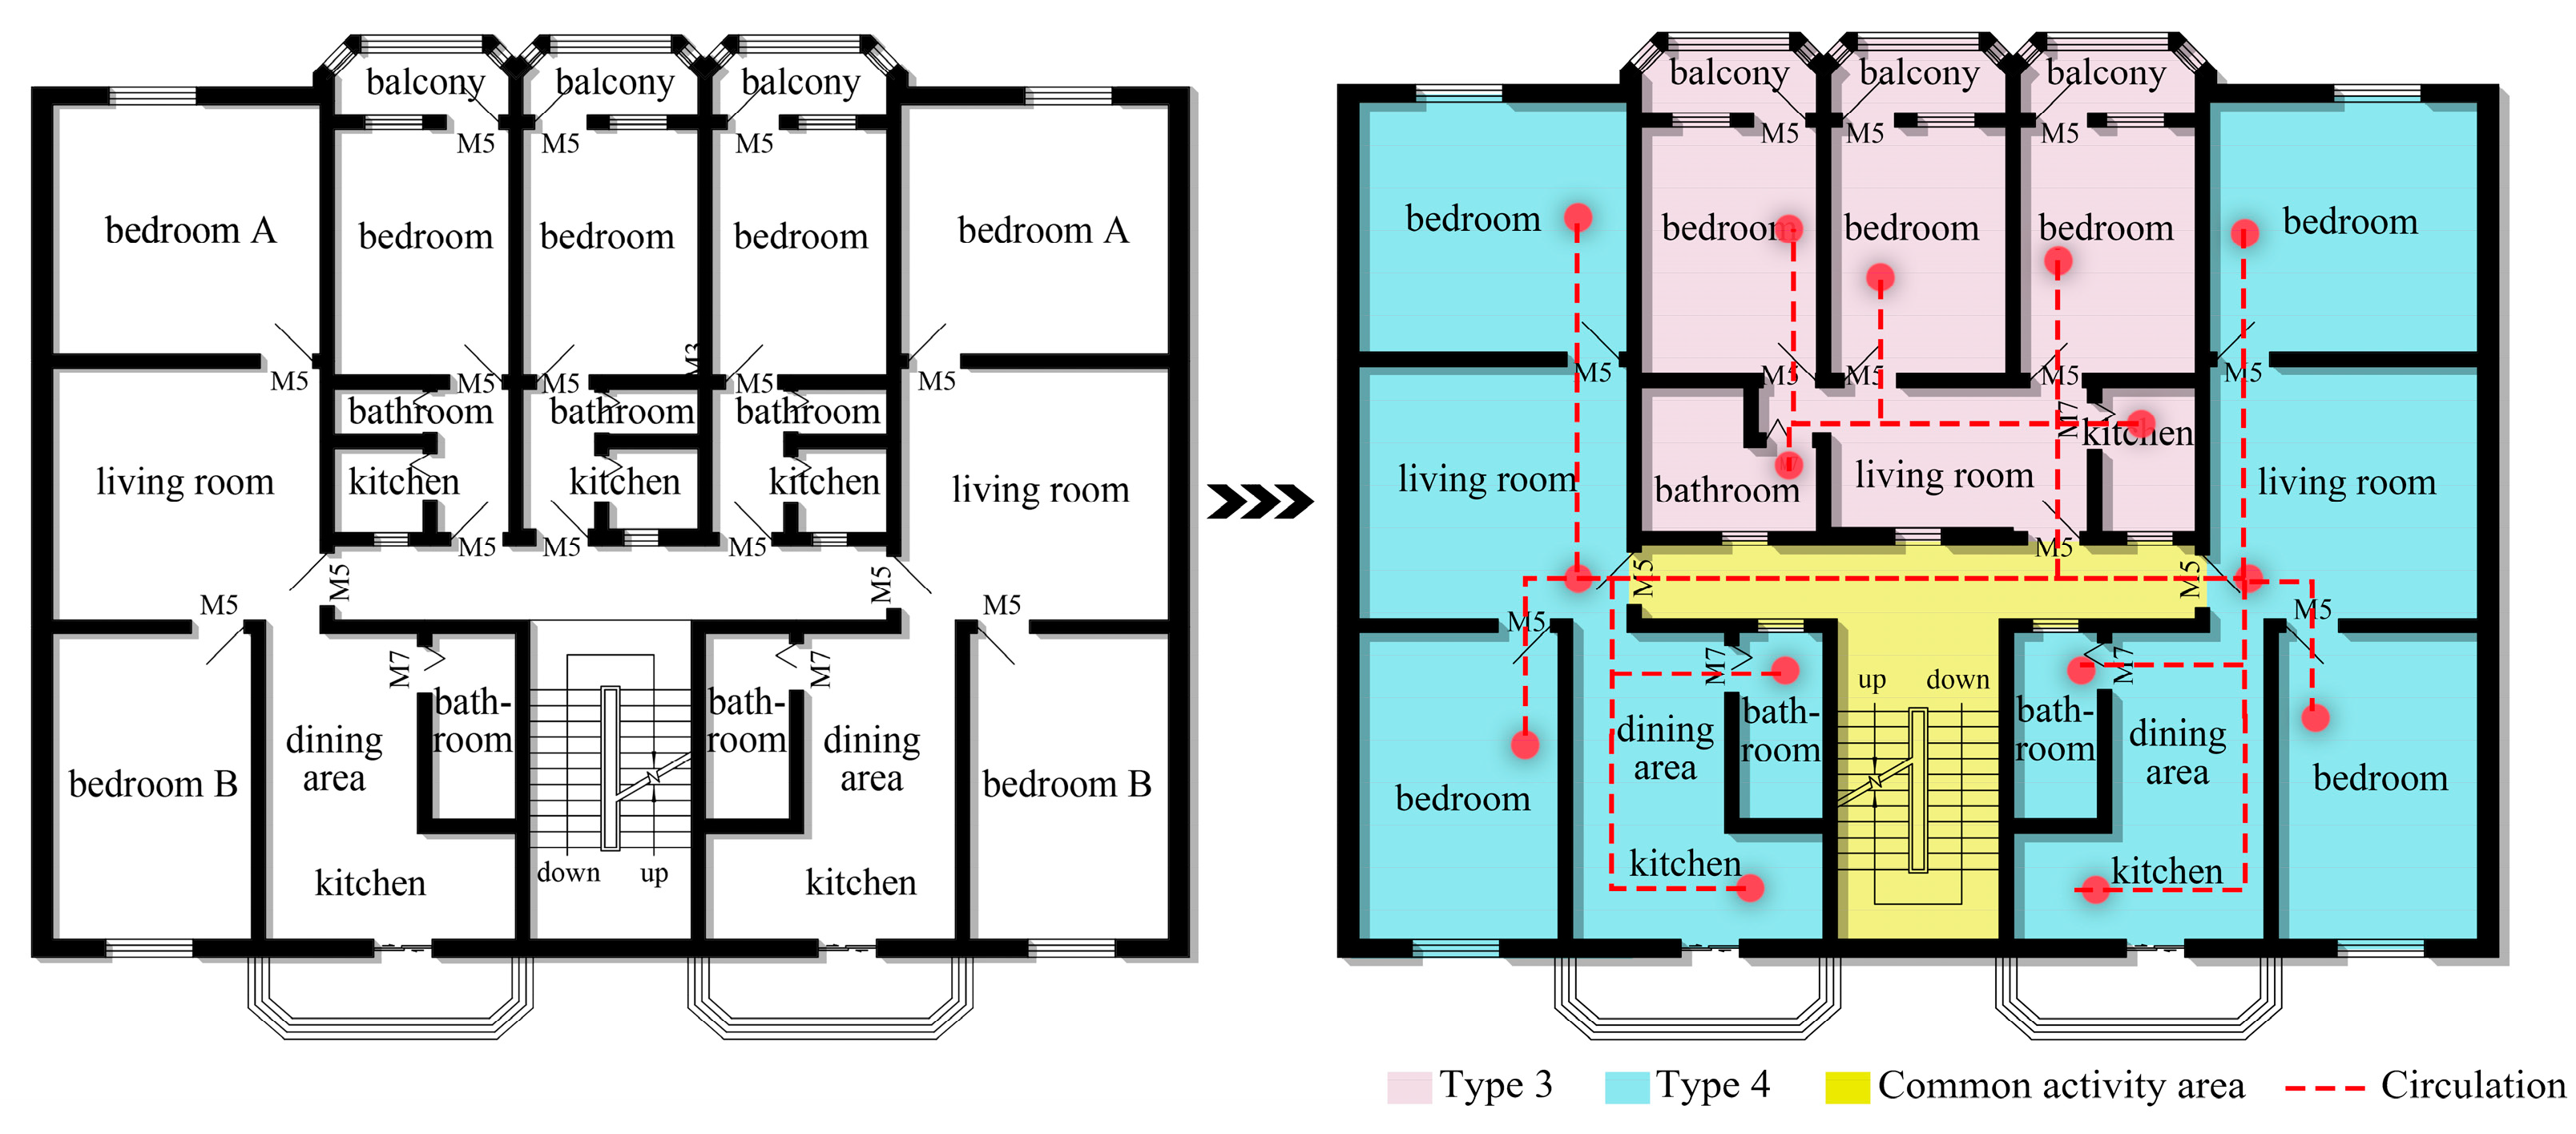
The corresponding functional rooms, applicable floor areas, and type of layout units were tailored according to different household structures shown in Table 1 and Figure 7.

2.3. Multi-Performance Optimization for the Regenerated Aging Residential Buildings

The multi-performance optimization problem was defined by the optimization objectives, the key design parameters subject to their specified value ranges, and the non-domination constraints of the Pareto solutions.

2.3.1. Multi-Performance Optimization Objectives

For the renovation of aging residential buildings, four categories of performance indicators were prioritized for optimization, namely, daylighting performance, thermal comfort, indoor air quality, and building energy consumption. These indicators were selected as the optimization objectives based on their critical influence on occupant well-being and building operational efficiency [9]. Daylighting performance was evaluated using the useful daylight illuminance (UDI), which quantifies annual work-plane illuminance occurrence within the 100–2000 lx range [17,18]. Thermal comfort was assessed by the predicted percentage of dissatisfied (PPD), which is derived from the predicted mean vote (PMV) model—a seven-point thermal sensation scale ranging from −3 (cold) to +3 (hot) with 0 as neutral [19,20]. A PMV value between −0.5 and +0.5 generally indicates that over 90% of occupants find the thermal conditions acceptable [21]. The calculation is shown as follows:
P P D = 100 95 e ( 0.03353 P M V 4 + 0.2179 P M V 2 )
P M V = ( 0.303 e 0.036 M + 0.0275 ) L
L = H 3.054 × ( 5.765 0.007 H P a ) - 0.42 × ( H 58.15 ) 0.0173 M × ( 5.87 P a ) 0.0014 M × ( 34 t a ) 3.9 × 10 8 f cl ( T cl 4 T r 4 ) f cl h c × ( t cl t a )
where L is the thermal load on the body, defined as the difference between metabolic heat production and heat loss (W/m2), H denotes the net heat gain by the body (W/m2), M is the metabolic rate per unit area (W/m2), P a is the partial vapor pressure (kPa), t a is the air temperature (°C), f cl is the clothing area factor, T r is the mean radiant temperature (K), h c is the convective heat transfer coefficient (W/(m2·°C)), T cl is the surface temperature of clothed body (K), and t cl is the mean surface temperature of clothed body (°C).
For indoor air quality evaluation, indoor carbon dioxide concentration (ICDC) was adopted as a key indicator, which can be obtained as follows:
I C D C = P × R × T V × 1000
where P is the number of occupants, R is the CO2 exhalation rate per person (L/h), T is the time duration (h), and V is the room volume (m3).
The energy use intensity (EUI) defined as the total annual building energy consumption per unit floor area, served as an overall assessment of the energy consumption of buildings, and can be calculated as follows:
E U I = E U I h + E U I c + E U I l + E U I e
where E U I is the annual heating energy consumption per unit floor area (kWh/m2), E U I h is the annual heating energy consumption per unit floor area (kWh/m2), E U I c is the annual summer cooling energy consumption per unit floor area (kWh/m2), E U I l is the annual lighting energy consumption per unit floor area (kWh/m2), and E U I e is the annual electrical equipment energy consumption per unit floor area (kWh/m2), excluding heating, cooling, and lighting energy.
Correlation analysis was used to determine whether conflicts exist among different optimization objectives. Meanwhile, Kendall’s Tau coefficient, a non-parametric rank-based statistic that does not assume a linear relationship between variables and is robust to outliers, was selected to analyze the association degree between optimization objectives [22].

2.3.2. Selection of Key Design Parameters

Four categories of design parameters for aging residential buildings were identified as having substantial impacts on the optimization objectives. These include: (1) the thermal insulation performance of external walls and roofs, which governs the overall heat transfer coefficient of the building envelope and directly affects heating and cooling loads [23]; (2) the window-to-wall ratio (WWR), glazing type, and construction details of exterior windows, which determine solar heat gain, daylight admission, and heat loss through transparent envelopes [24]; (3) door opening dimensions resulting from layout regeneration design, which influence indoor airflow paths and inter-zone ventilation [25]; and (4) occupant window-opening behavior, which affects natural ventilation rates and indoor air quality [26].
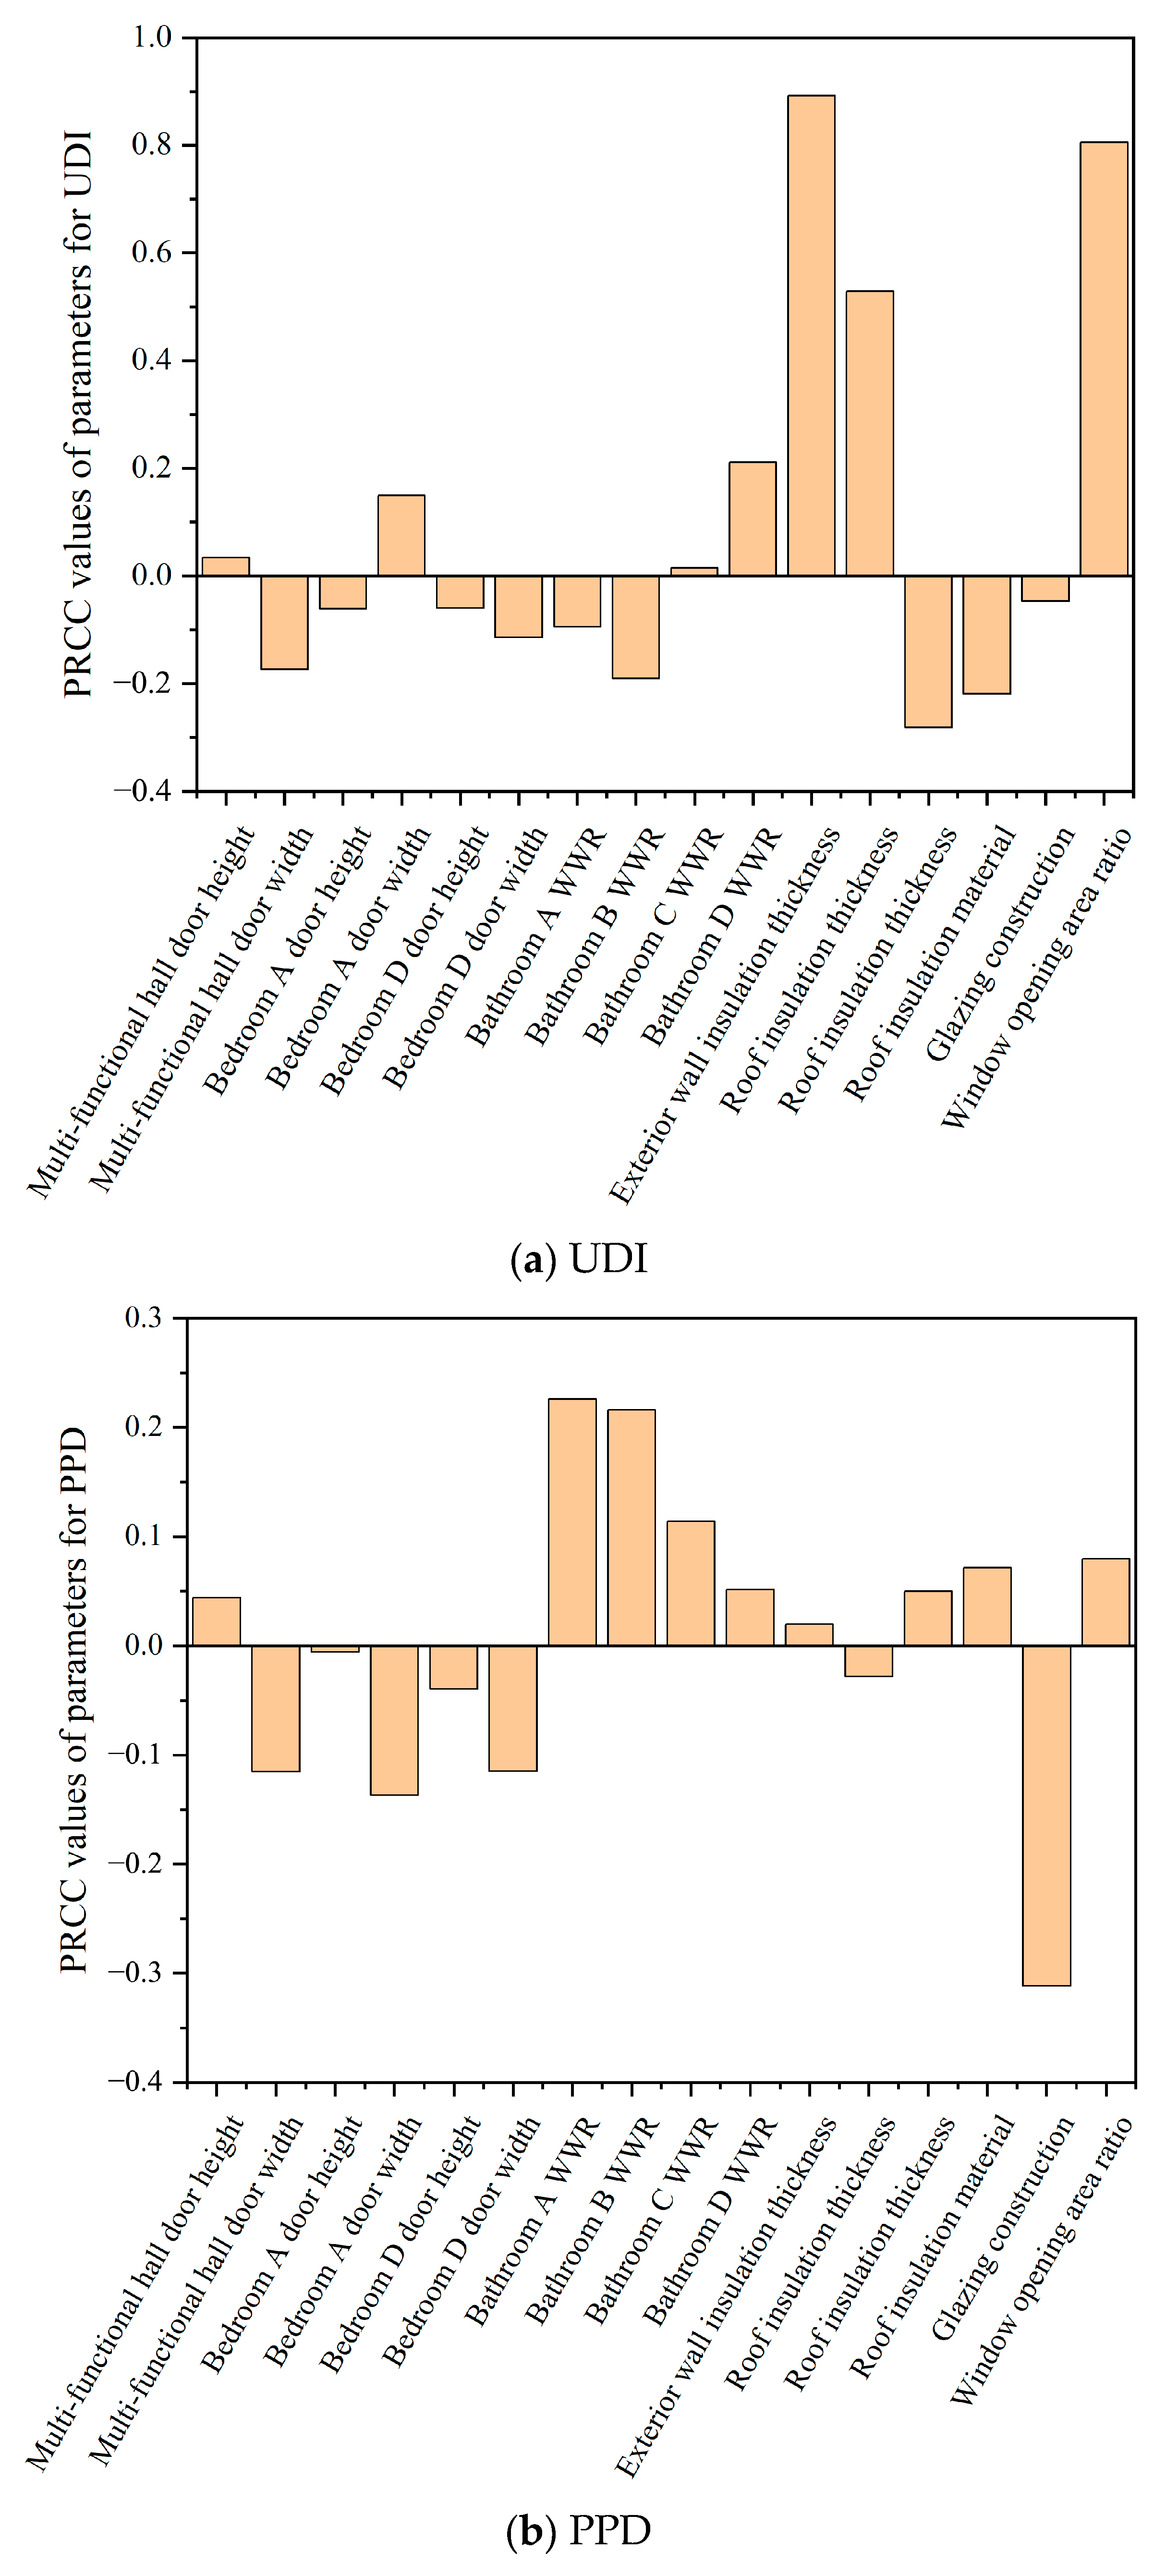
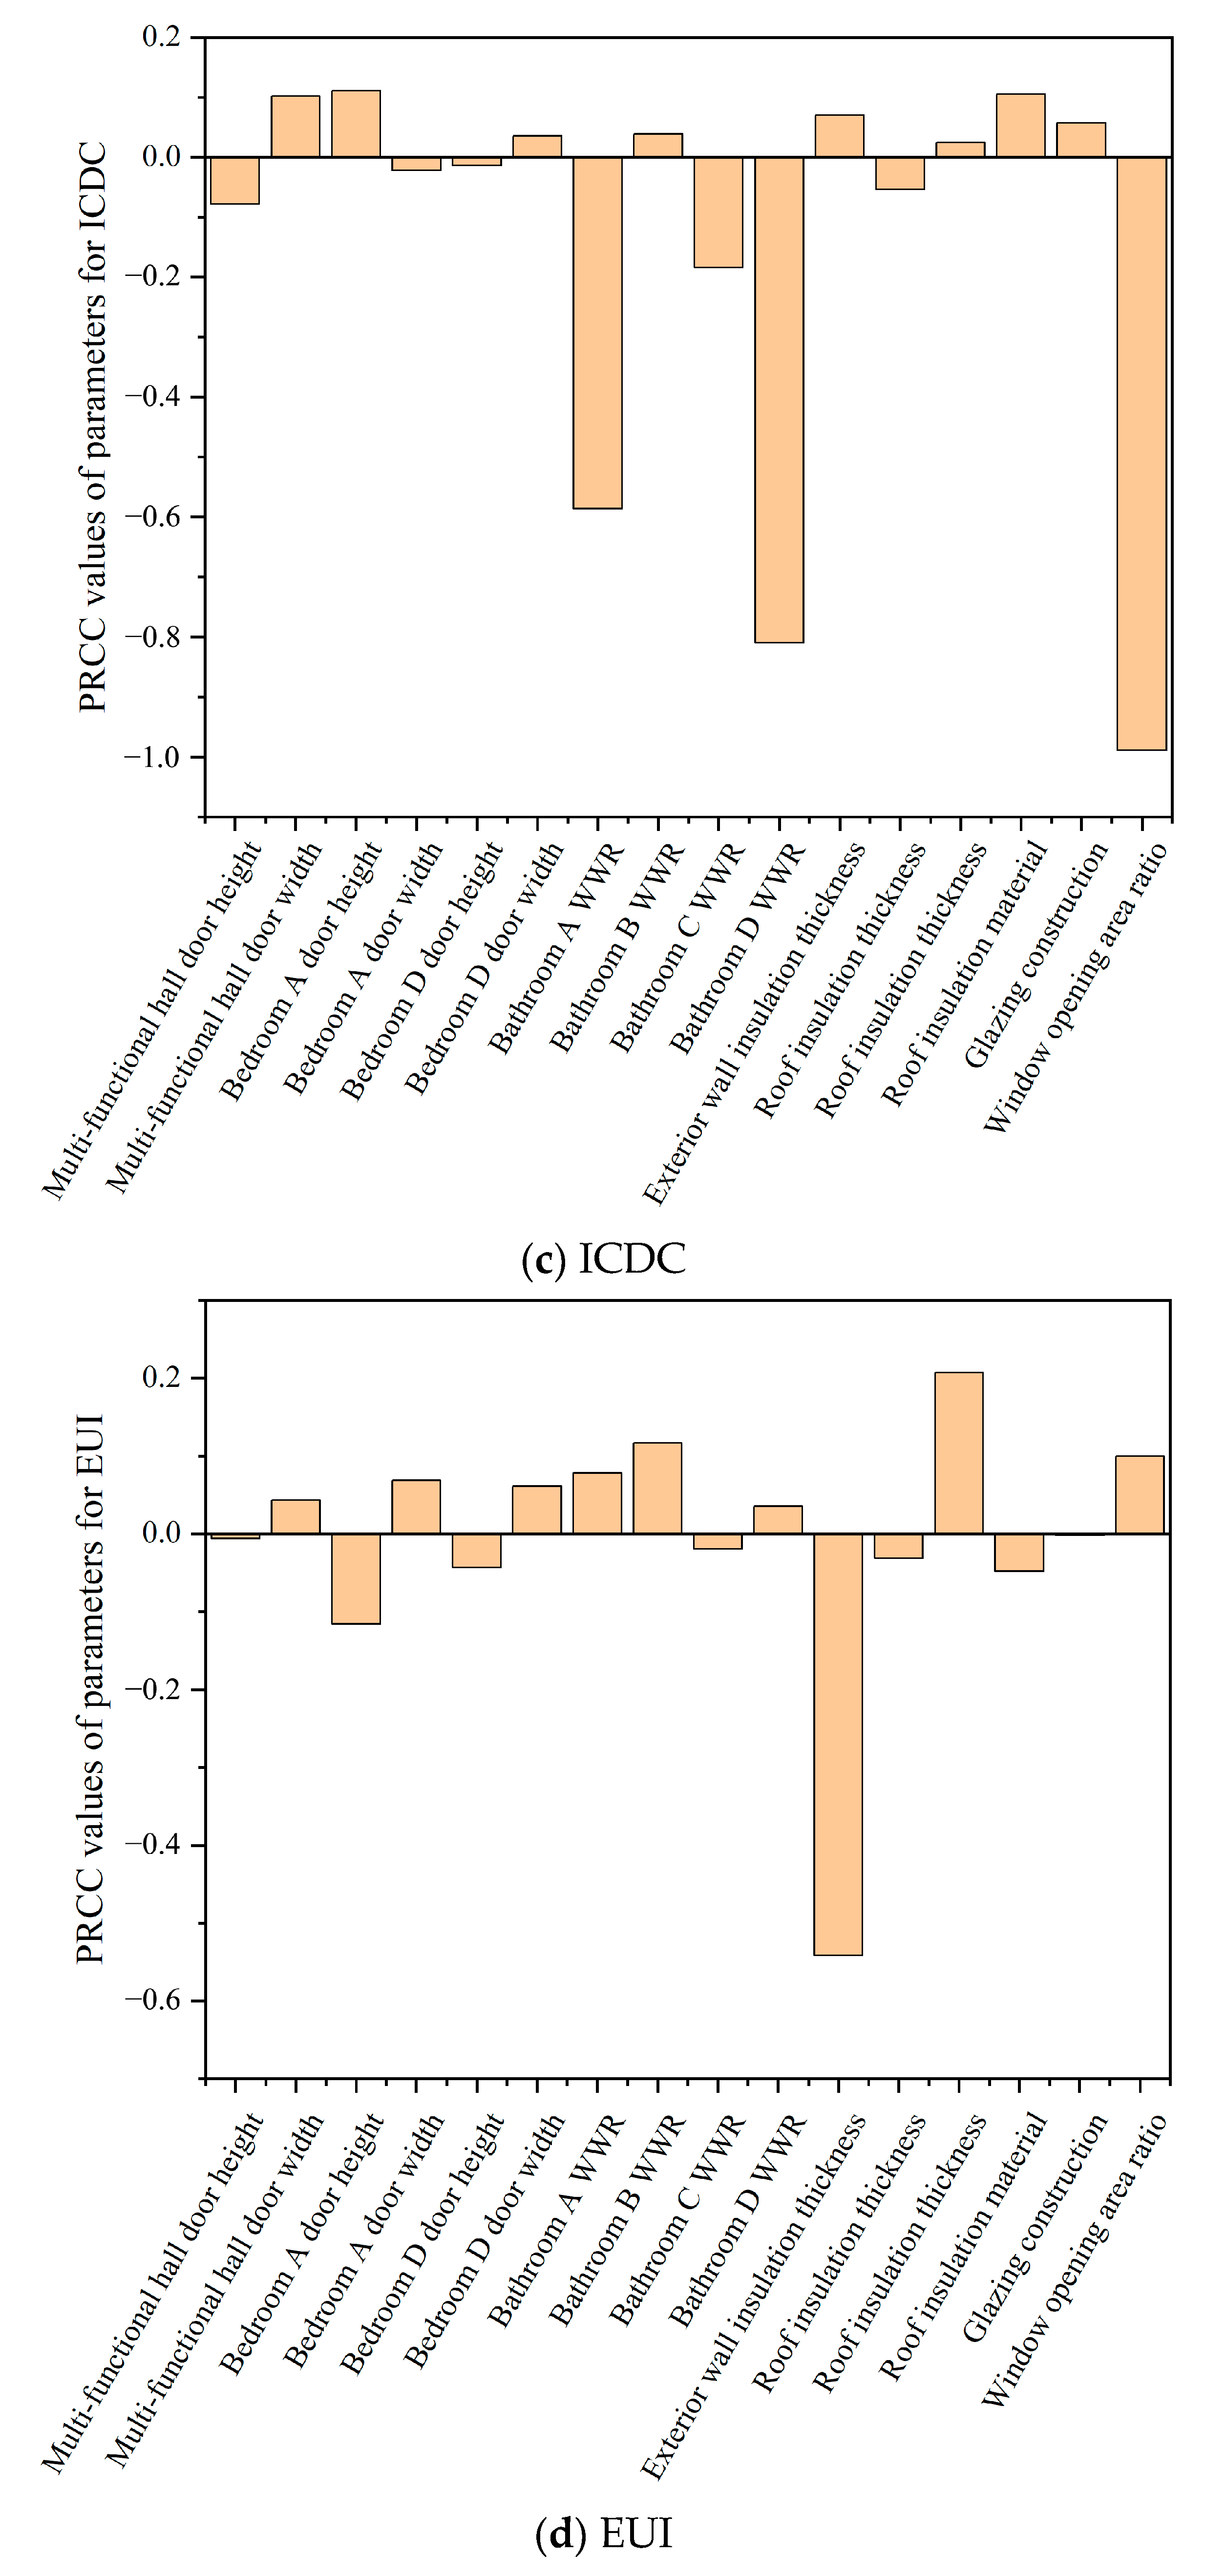
A global sensitivity analysis was conducted to further identify the most influential design parameters for aging residential buildings. First, sample data were generated by Latin hypercube sampling (LHS), which is recognized as a sampling method widely applied in sensitivity analysis and neural network model construction [27]. A more uniform distribution of samples can be obtained by this method [28]. Then, the partial rank correlation coefficient (PRCC) was adopted as a global sensitivity analysis indicator to quantify the degree of influence of a single input parameter on a specific output objective, while the interference from other parameters was excluded [29].
The PRCC calculation was performed using the sensitivity analysis module of the Octopus plugin within the Grasshopper platform [30]. The significance of each PRCC value was determined based on its p-value, with “p < 0.05” considered statistically significant. Thus, the key design parameters that most significantly affect building performance were identified and retained for subsequent multi-performance optimization.

2.3.3. Optimization and Decision-Making Method

The hypervolume indicator was selected in this study, which is recognized as a performance assessment method for multi-criteria decision-making problems, serving as the ‘judge’ to evaluate the quality of Pareto solution sets. In multi-objective optimization, a Pareto solution set, also known as the Pareto front, consists of non-dominated solutions representing the optimal trade-offs among conflicting objectives, where no single solution can be improved in one objective without degrading another [31]. The NSGA-II algorithm was employed in this study to generate the Pareto solution sets [32].
In contrast, entropy-weighted TOPSIS method served as the ‘decision-maker’, ranking alternatives based on their proximity to the positive ideal solution and distance from the negative ideal solution [33], and was used to select the final implementation plan from the high-quality solution sets. The calculation steps are outlined as follows:
First, normalization should be performed on the non-dominated set, as follows:
U D I i n = U D I i min 1 k m U D I k max 1 k m U D I k min 1 k m U D I k
P P D i n = P P D i min 1 k m P P D k max 1 k m P P D k min 1 k m P P D k
I C D C i n = I C D C i min 1 k m I C D C k max 1 k m I C D C k min 1 k m I C D C k
E U I i n = E U I i min 1 k m E U I k max 1 k m E U I k min 1 k m E U I k
where U D I i n , P P D i n , I C D C i n and E U I i n represent the q-th normalized values of UDI, PPD, ICDC, and EUI in the non-dominated solutions, respectively. The weights for these four indices UDI, PPD, ICDC, and EUI can be calculated as follows:
W UDI = 1 E UDI ( 1 E UDI ) + ( 1 E PPD ) + ( 1 E ICDC ) + ( 1 E EUI )
W PPD = 1 E PPD ( 1 E UDI ) + ( 1 E PPD ) + ( 1 E ICDC ) + ( 1 E EUI )
W ICDC = 1 E ICDC ( 1 E UDI ) + ( 1 E PPD ) + ( 1 E ICDC ) + ( 1 E EUI )
W EUI = 1 E EUI ( 1 E UDI ) + ( 1 E PPD ) + ( 1 E ICDC ) + ( 1 E EUI )
The information entropy for each objective can be obtained calculated as follows:
E UDI = k q = 1 30 x UDI , q q = 1 30 x UDI , q ln ( x UDI , q q = 1 30 x UDI , q )
E PPD = k q = 1 30 x PPD , q q = 1 30 x PPD , q ln ( x PPD , q q = 1 30 x PPD , q )
E ICDC = k q = 1 30 x ICDC , q q = 1 30 x ICDC , q ln ( x ICDC , q q = 1 30 x ICDC , q )
E EUI = k q = 1 30 x EUI , q q = 1 30 x EUI , q ln ( x EUI , q q = 1 30 x EUI , q )
where E UDI , E PPD , E ICDC and E EUI represent the information entropy of the four objectives respectively. Furthermore, the weight factors are calculated as follows:
V UDI , q = W UDI × U D I q n
V PPD , q = W PPD × P P D q n
V ICDC , q = W ICDC × I C D C q n
V EUI , q = W EUI × E U I q n
The positive and negative ideal solutions can be determined as (1, 1) and (0, 0), representing the maximum and minimum values of each normalized index, respectively.
d + = ( 1 V UDI , q ) 2 + ( 1 V PPD , q ) 2 + ( 1 V ICDC , q ) 2 + ( 1 V EUI , q ) 2
d = ( 0 V EUI , q ) 2 + ( 0 V PPD , q ) 2 + ( 0 V ICDC , q ) 2 + ( 0 V EUI , q ) 2
The relative closeness coefficient of each non-dominated solution to the ideal solution can be defined as follows:
C q = d d + + d
A larger value of C q indicates a better solution. Therefore, the optimal design parameters from the multi-dimensional optimization of aging residential areas in the cold zone of China were obtained by balancing the daylighting and thermal performance, air quality, and building energy consumption [34,35].

2.4. Structural Strengthening with Seismic Verification

Following the layout regeneration design of aging residential buildings with masonry structures, it was considered necessary to implement a strengthening design and conduct seismic performance verification.

2.4.1. Structural Strengthening Design

To address the loss of shear capacity caused by openings in load-bearing walls during the layout regeneration design of aging residential buildings, the double-layer steel-mesh mortar surface layer reinforcement method was adopted, and the shear capacity of walls was increased. For the torsional effect induced by the removal of load-bearing walls, reinforced concrete structural columns were added and, in combination with ring beams, a local restraint system was formed, by which the structural torsional stiffness was improved. Additionally, H-shaped steel beams were embedded at the locations where walls were removed, thereby reconstructing the load transfer path.

2.4.2. Seismic Performance Verification

Information regarding the building’s shear capacity and capacity ratios was obtained through modal analysis of the building structure. The dynamic response of the structure under seismic action was better evaluated based on its dynamic characteristics. The seismic response of a structure is determined by both the characteristics of the ground motion and the dynamic properties of the structure [36]. For masonry structures, seismic actions in the two principal horizontal directions of the building are generally considered.
Shear capacity is the ability of a story to resist shear failure under horizontal seismic action. It is typically determined by the load-bearing capacity of lateral force-resisting elements such as walls, structural columns, and ring beams. The equation for the shear capacity of a brick wall is given by [37]:
V R = f v A w
where V R is the shear capacity of the wall, f V is the shear strength of the masonry, A W is the horizontal cross-sectional area of the wall.
The capacity ratio λ is defined as the ratio of the story shear capacity to the design seismic shear force as shown in Equation (26), which is used to assess whether the story meets seismic requirements. The capacity ratio is required to satisfy λ ≥ 1.0 [38].
λ = V R V E
where λ is the capacity ratio, V R is the story shear capacity, and V E is the design seismic shear force.
In actual engineering practice, a first-level assessment is required to be conducted. A secondary assessment procedure is required to be initiated when any of the following conditions is encountered: the spacing between adjacent load-bearing walls exceeds the allowable limit, the total building width exceeds the specified limit, or both limits are exceeded simultaneously. For brick masonry structures under an 8-degree fortification intensity, the maximum spacing between adjacent load-bearing walls is 7 m for precast reinforced concrete floors [38], and the height-to-width ratio is required to be no greater than 2.2 [39]. Since the present study was conducted based on simulation software, the first-level assessment could not be performed on site. Therefore, the secondary assessment was adopted directly. In such cases, the average seismic performance index of the story is required to be calculated according to the given formula as the basis for assessment [39]:
β i = A i / ( A b i ξ 0 i α )
where β i is the overall seismic performance value for transverse or longitudinal walls on the i-th story, A i is the total net cross-sectional area at half the story height of seismic walls in the longitudinal or transverse direction on the i-th story, A b i is the plan area of the i-th story, ξ 0 i is the benchmark area ratio for shear walls in the transverse and longitudinal directions on the i-th story, α is the seismic influence coefficient, which is taken as α = 2.0 for a fortification intensity of 8 degrees.
The comprehensive seismic capacity index for a story is defined as the result obtained by multiplying the average value of the seismic performance data for the story by the structural influence coefficient, as shown follows [39]:
β c i = φ 1 φ 2 β i
where β c i is the overall seismic performance value for the transverse or longitudinal walls on the i-th story, φ 1 is the system influence coefficient, φ 2 is the local influence coefficient.
The calculation of the comprehensive seismic capacity index for the longitudinal and transverse walls in a story is performed by combining the seismic performance data of the wall segment with the structural influence coefficients expressed as follows:
β c i j = β i j
β i j = A i j / A b i j ξ o i λ
where β c i j is the overall seismic performance value for the j-th wall segment on the i-th story, β i j is the seismic performance value for the j-th wall segment on the i-th story, A i j is the net cross-sectional area at half the building height for the j-th wall segment on the i-th story, and A b i j is the tributary area of the j-th wall segment on the i-th story, considering the stiffness of the floor slab.

3. Case Study

In this study, two prototypical aging residential buildings in Tianjin, China were selected as case studies to validate the proposed integrated renovation approach. The application of the methodology was demonstrated through modular layout regeneration design, multi-performance optimization, and structural strengthening with seismic verification.

3.1. Prototypical Model of Aging Residential Buildings

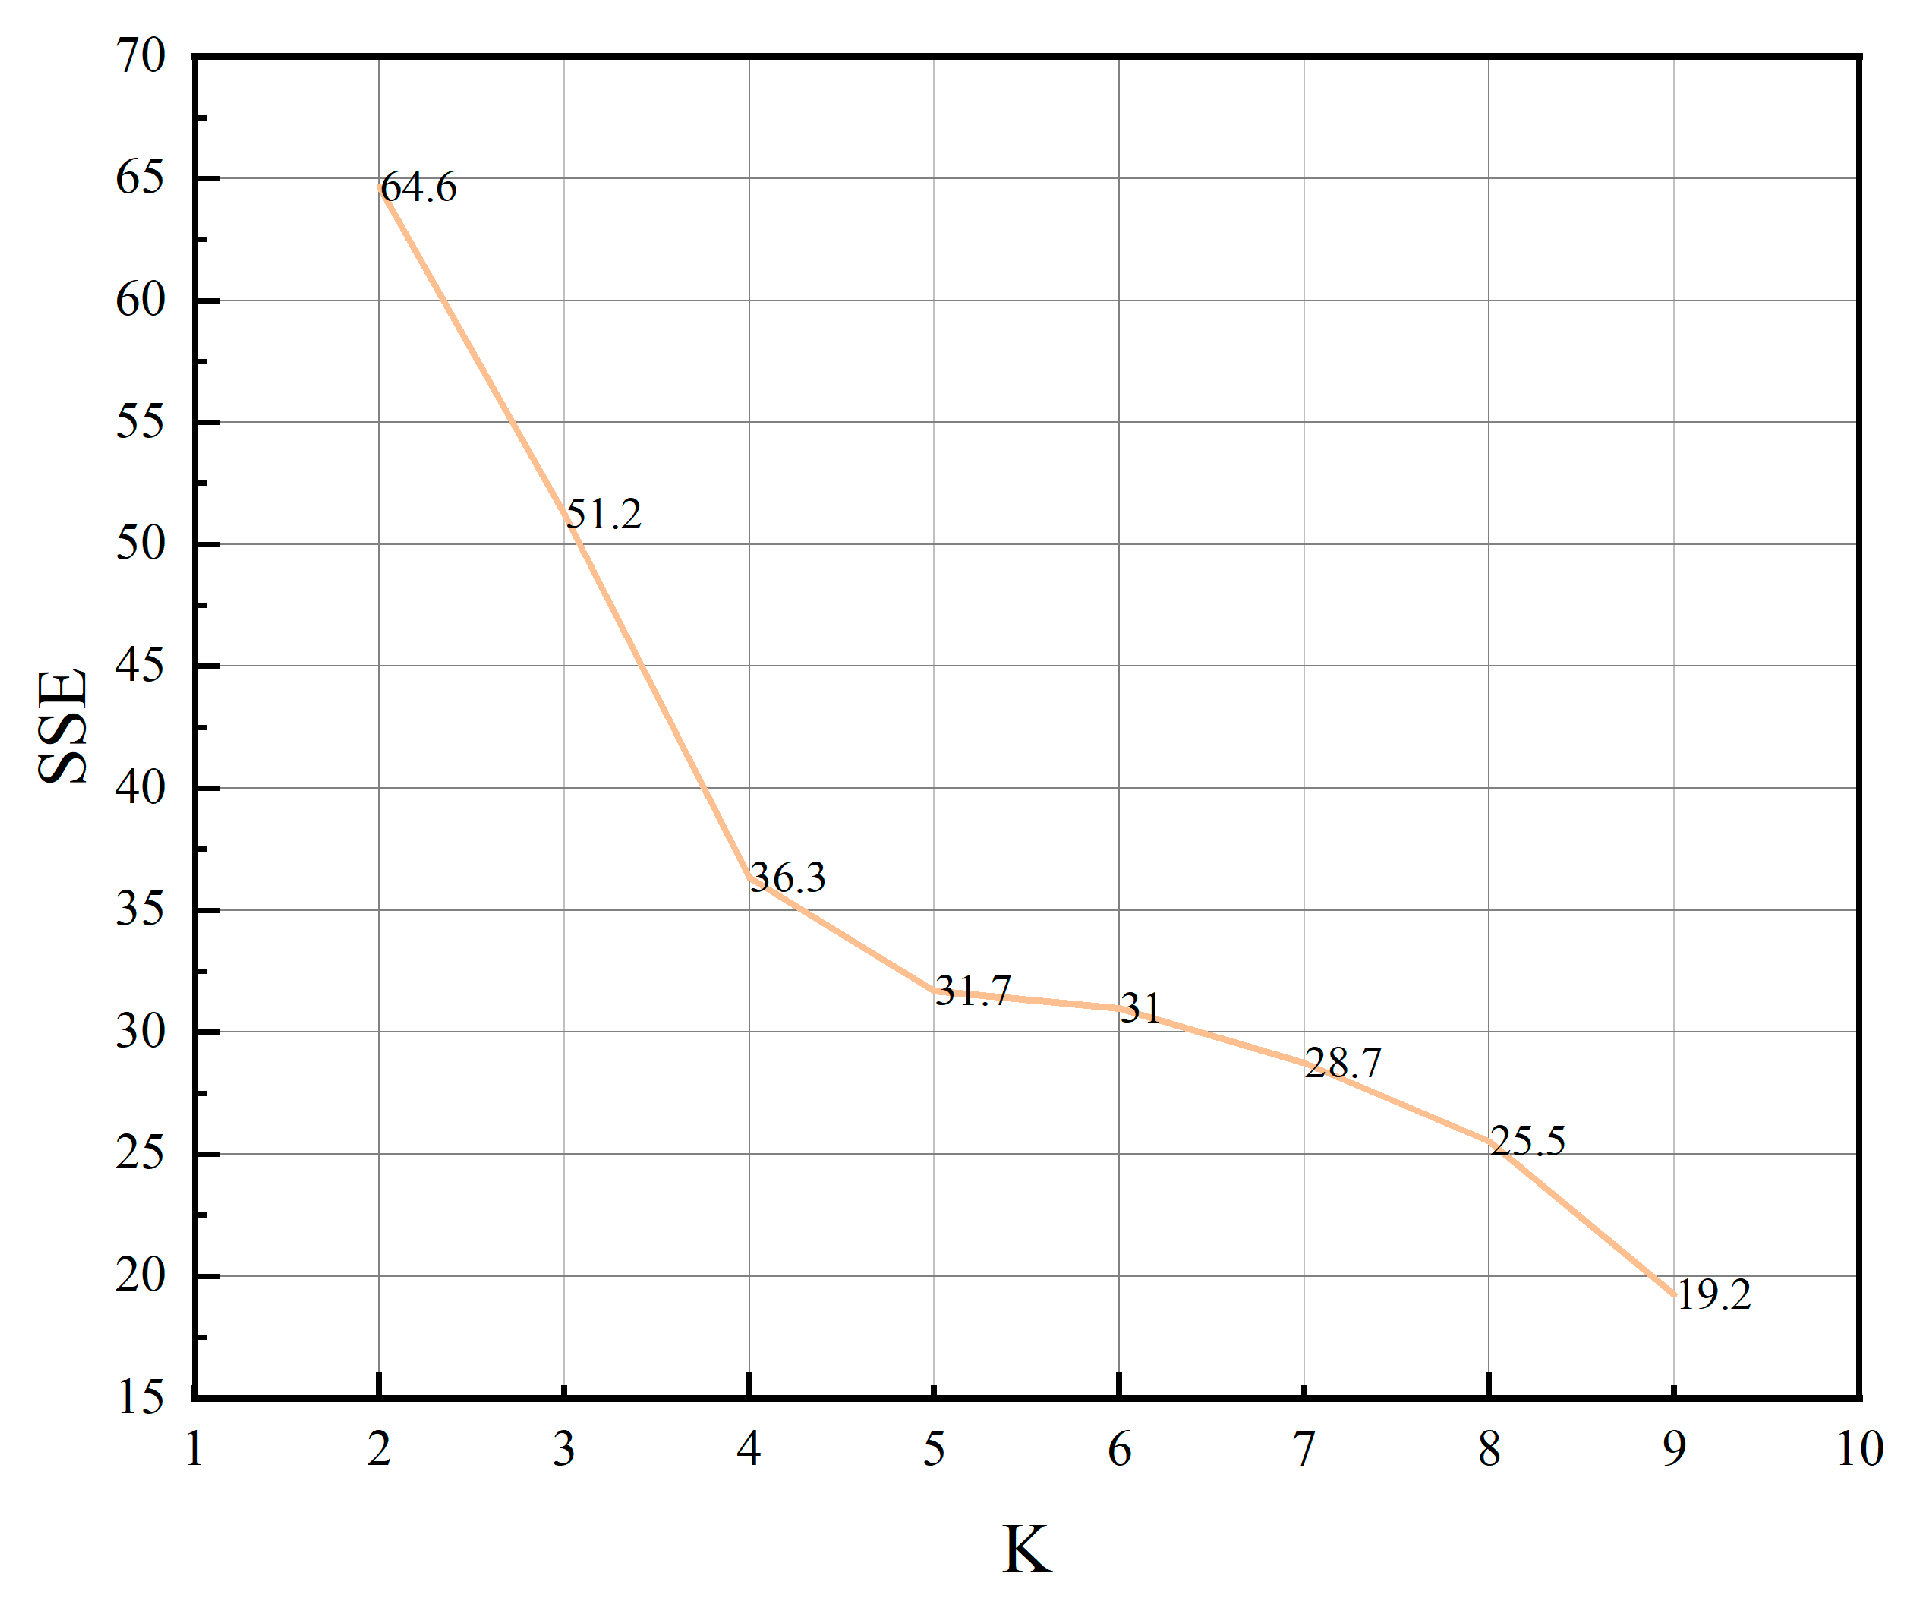
Tianjin (39°08′ N, 117°12′ E) was selected as a representative city in the cold climate zone of China for this study. Publicly available rental listing data were collected and organized from rental websites using the Selenium WebDriver automated browser testing framework [40]. Prototypical building models for aging residential buildings were identified through K-means clustering analysis. Euclidean distances were calculated between data points and their respective cluster centers from Cluster I to IV, and the samples closest to the center points were screened as research objects. Consequently, as shown in Figure 8. Finally Building 15 of Community A (labeled “Building A”) and Building 3 of Community B (labeled “Building B”) were identified as the prototypical models of aging residential buildings, as presented in Table 2. Detailed characteristics of the two communities are shown in Appendix A Table A4.
The two prototypical buildings were selected based on the clustering analysis described above, and their baseline performance was established through simulation models for subsequent layout regeneration and multi-performance optimization.

3.2. Boundary Conditions

3.2.1. Form and Envelope Parameters

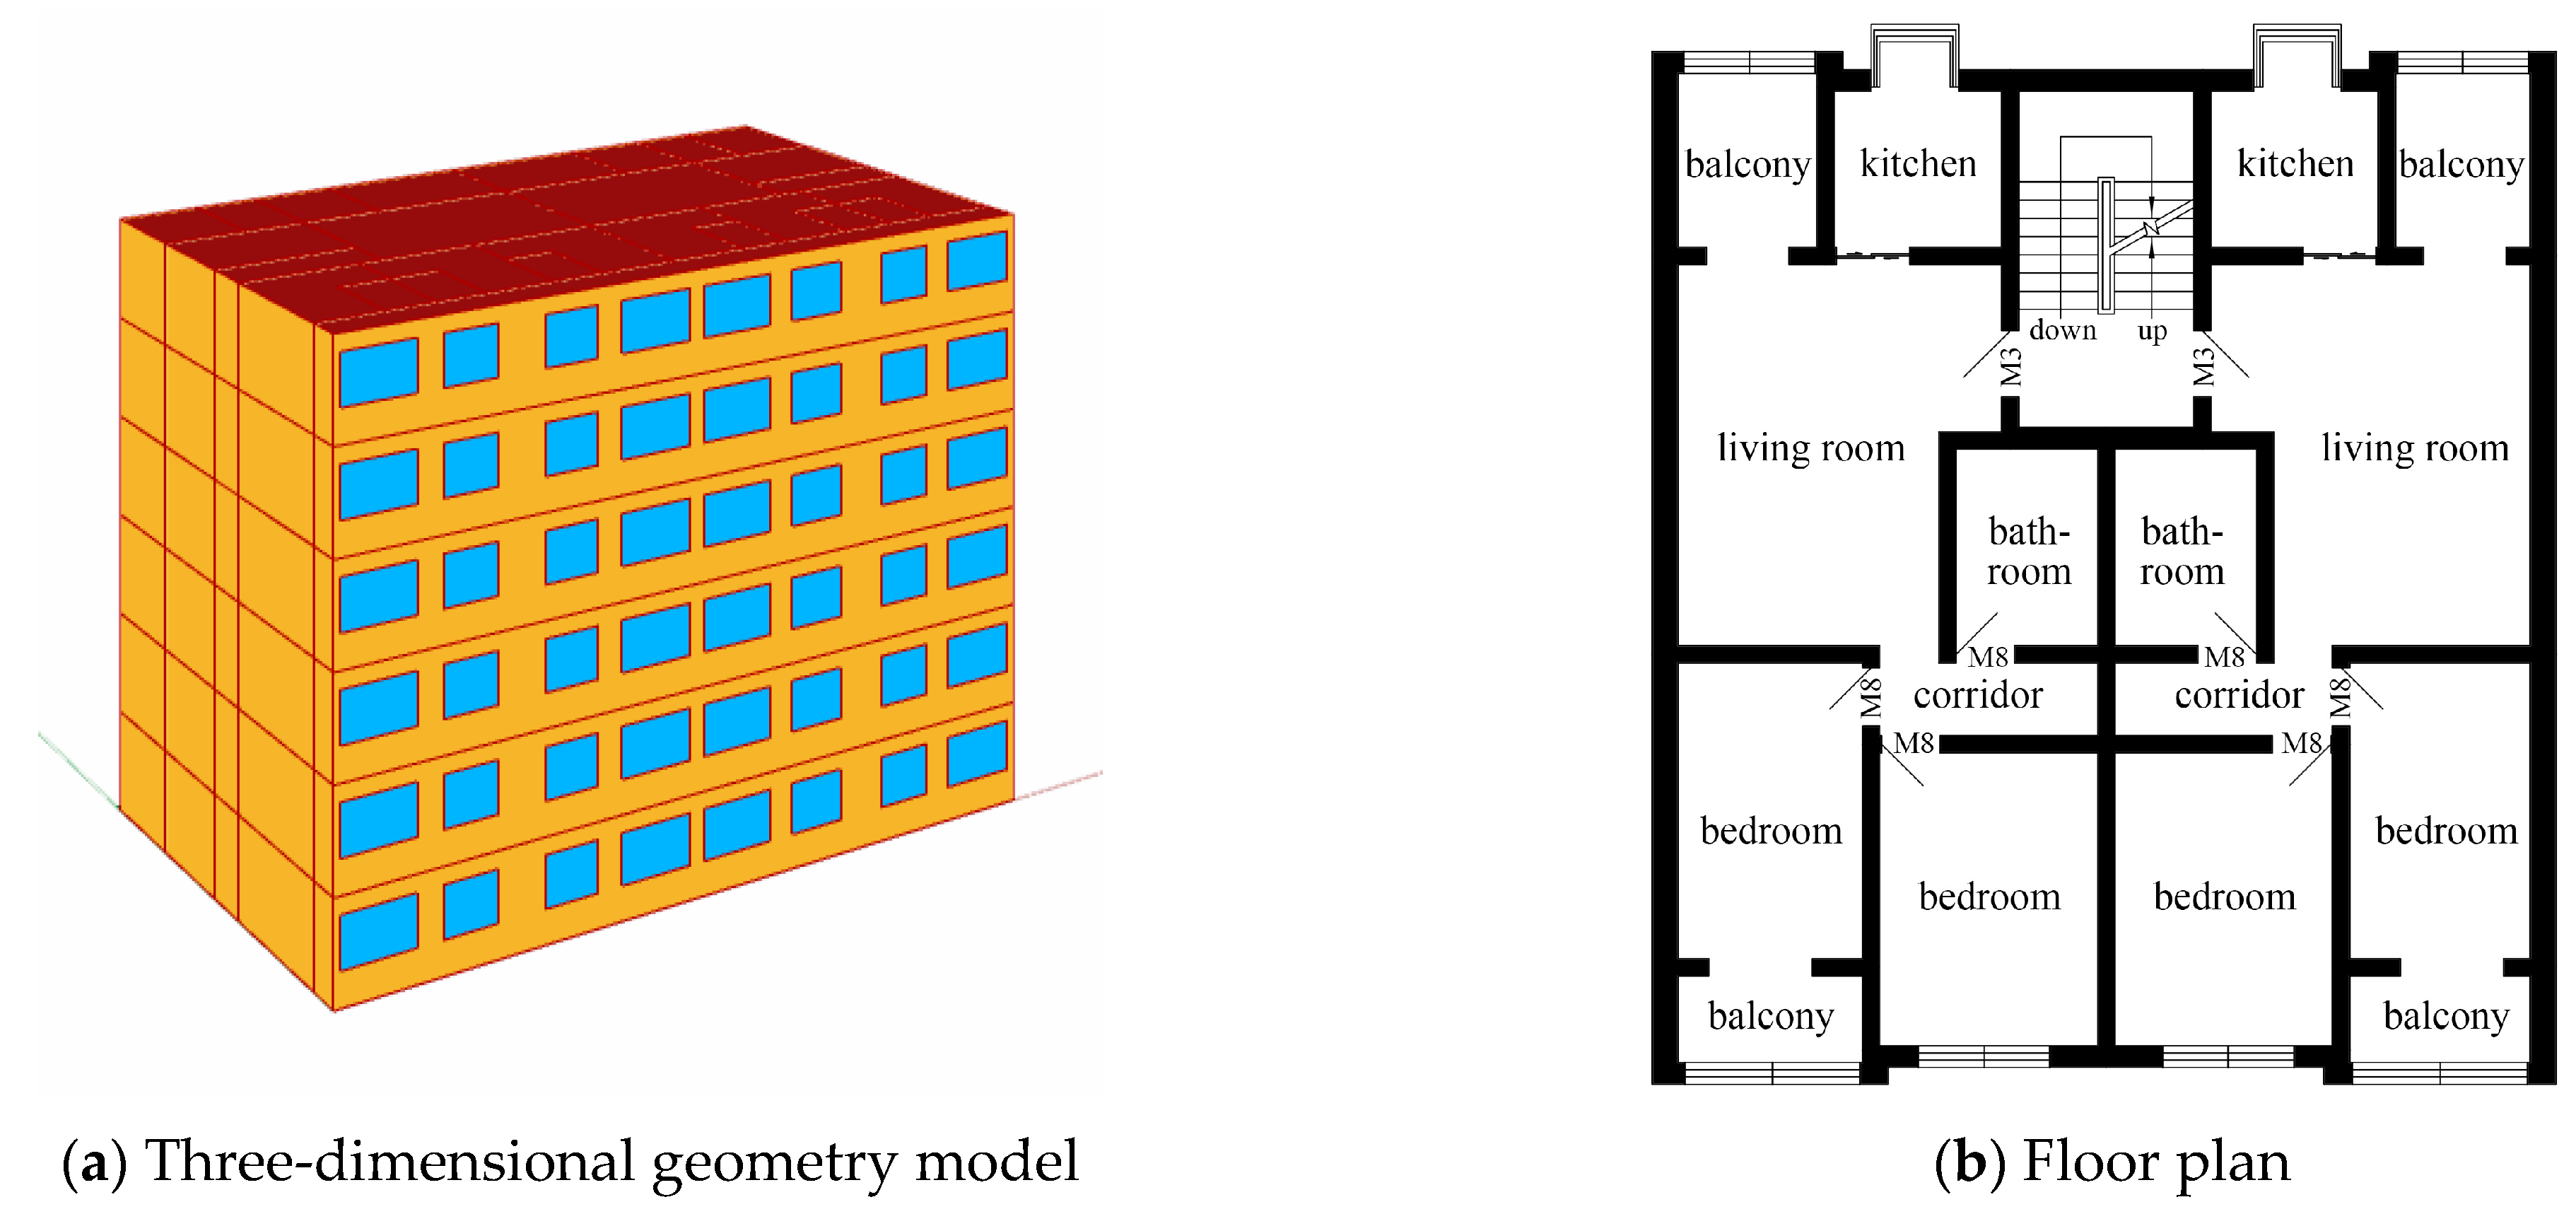
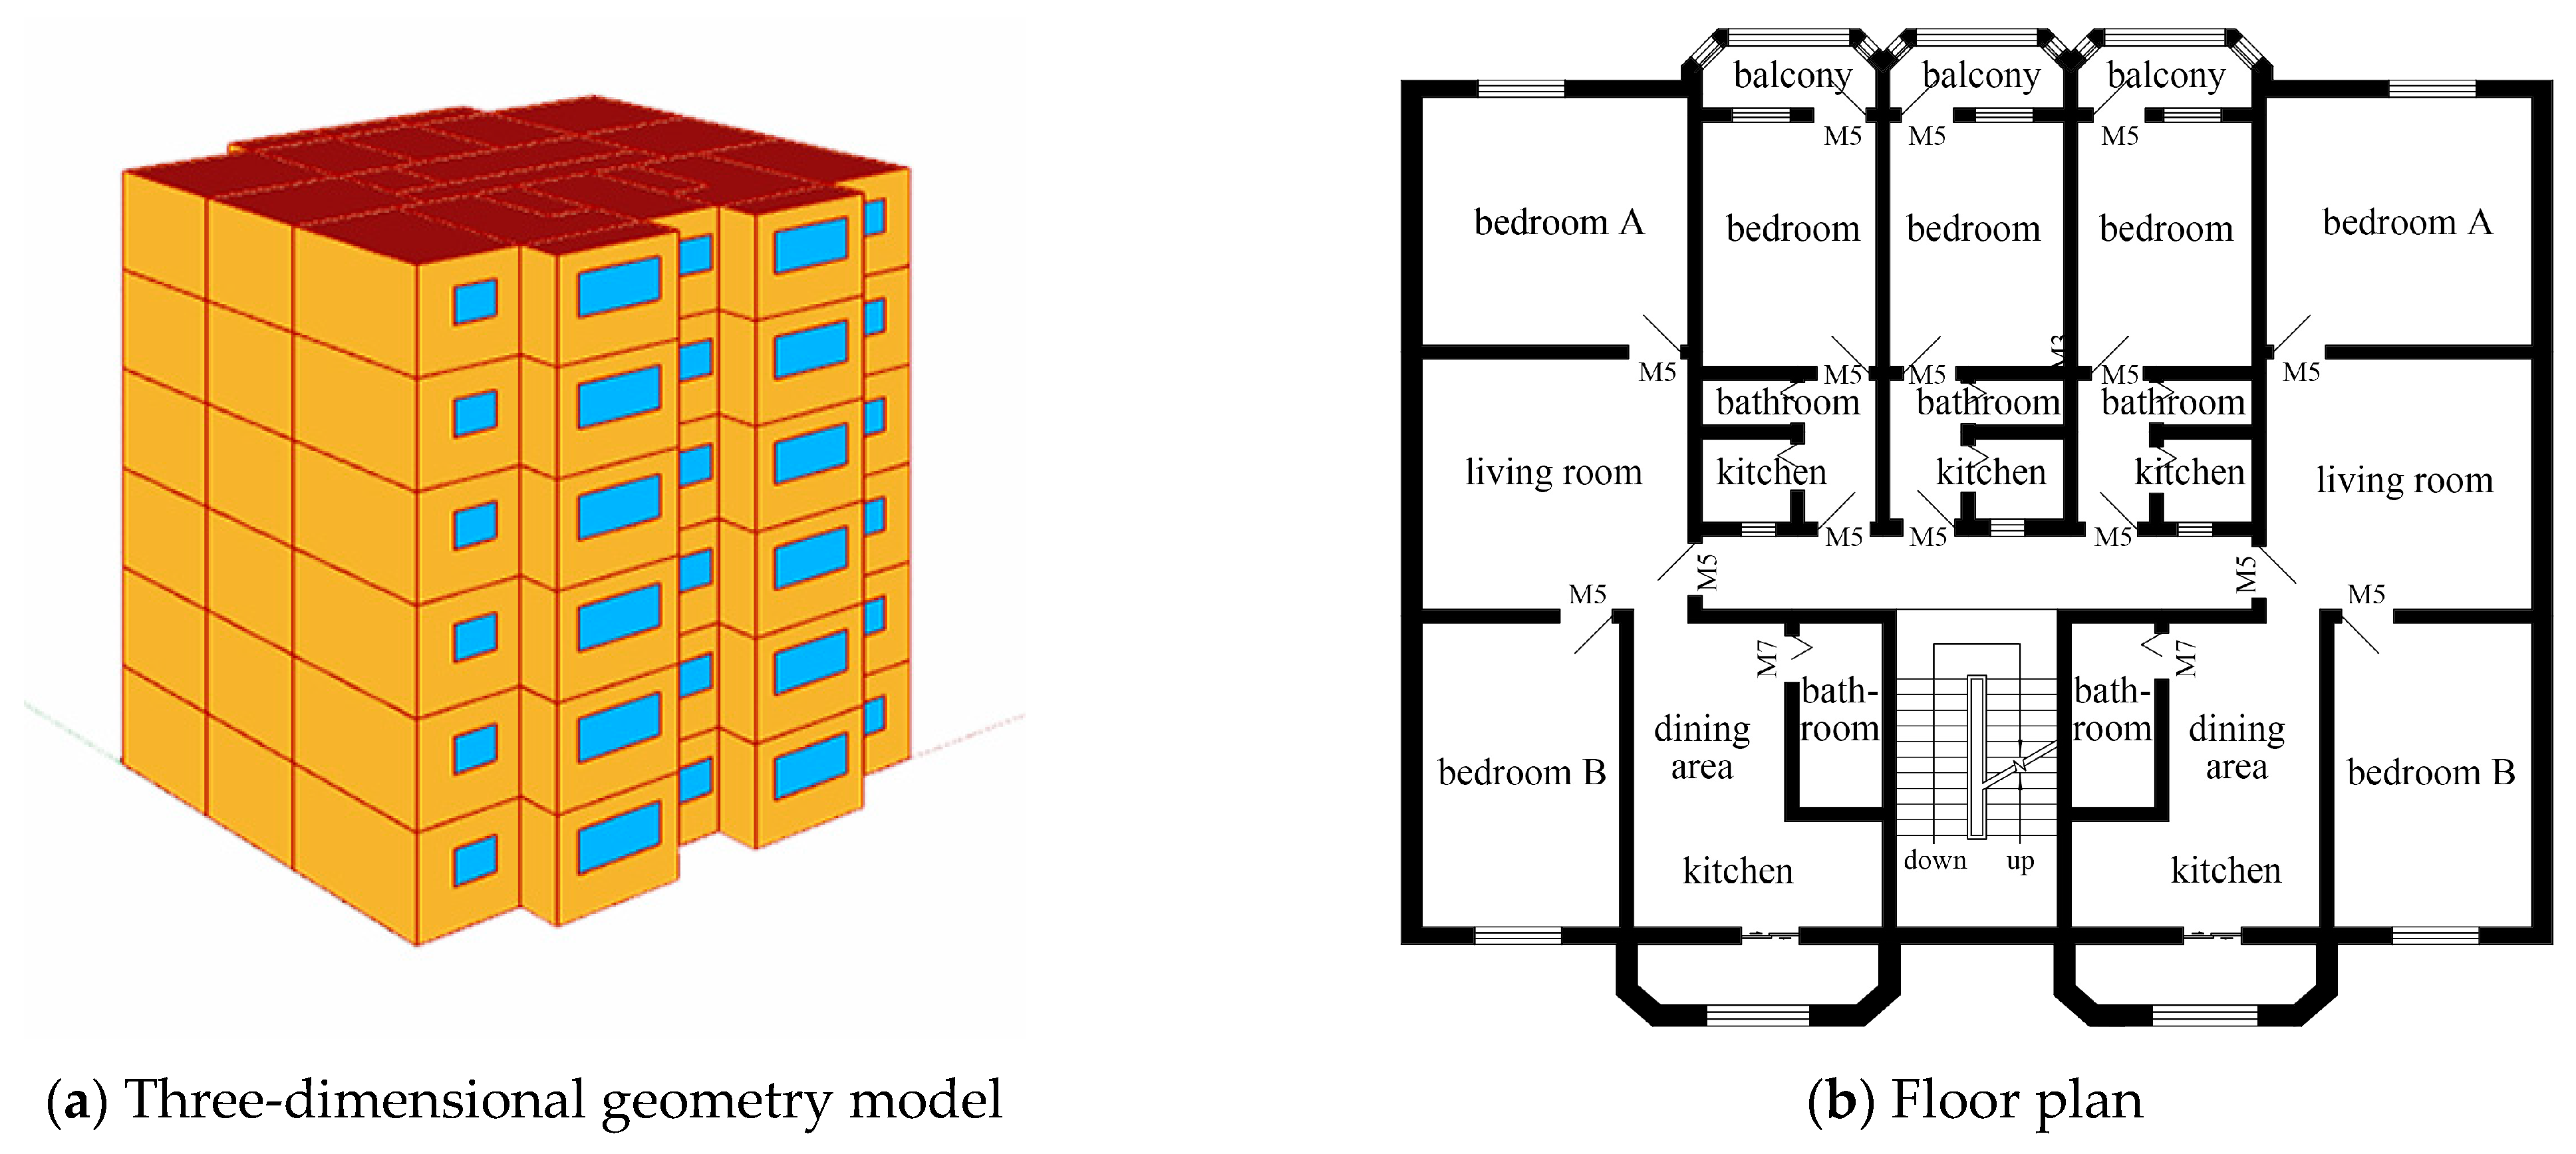
Both Building A and Building B are six-story buildings. The related information on their exterior wall and roof details is presented in Appendix A Table A5. The performance simulation models for Building A and Building B were developed using the Rhino + Grasshopper performance simulation platform, Rhinoceros 3D Version 7 [41] with Grasshopper [42]. Their three-dimensional geometry models and floor plans are presented in Figure 9 and Figure 10. The three-dimensional models of Building A and Building B were simplified by abstracting architectural details such as balcony extrusions into the main facade for performance simulation, following standard modeling practice. Reflectance values for opaque envelope components were set as follows: walls (white latex paint) 0.8, ceilings 0.8, and floors (marble tiles) 0.6 [43].

3.2.2. Operational Parameters

The building operational parameters are divided into three categories: heating and summer air-conditioning schedules, thermal comfort-related parameters, and the selection of interior building materials. The configuration of these parameters directly influences building energy intensity and carbon emission levels.
The cooling period was set from 15 June to 15 September, with a design indoor temperature of 26 °C. The heating period was set from 15 November to 15 March of the following year, with a design indoor temperature of 18 °C, and the heating system was configured to operate continuously for 24 h per day. The air change rate was set at 0.5 per hour [44], the occupant density was taken as 0.025 persons/m2 [45], and internal heat gains were primarily influenced by occupants, equipment, and lighting. Indoor equipment and lighting power densities were set according to the requirements [46], and occupancy rates, equipment usage rates, and lighting operation rates are presented in Appendix A Table A6, Table A7 and Table A8. Clothing thermal resistance was set at 0.5 clo in summer, 1.5 clo in winter, and 0.75 clo in transitional seasons; a metabolic rate of 70 W/m2 and an indoor air velocity of 0.15 m/s were assigned [20]. For the performance simulation models in Grasshopper, the daylighting grid was divided with a measurement point spacing set at 0.8 m × 0.8 m, and the working plane was selected as a horizontal surface 0.8 m above the floor [47]. The illumination threshold for activating artificial lighting was set at 300 lx [48].

3.2.3. Structural Parameters

Structural analysis models for the prototypical models of aging residential buildings with masonry–concrete, Building A and Building B, were established using PKPM structure analysis software (Version 2025) [49]. A reduction factor of 0.8 was applied for brick strength, and a reduction factor of 0.7 was applied for mortar strength. Other key parameter settings are presented in Table 3.

4. Results and Discussion

4.1. Regenerated Layout of Aging Residential Building

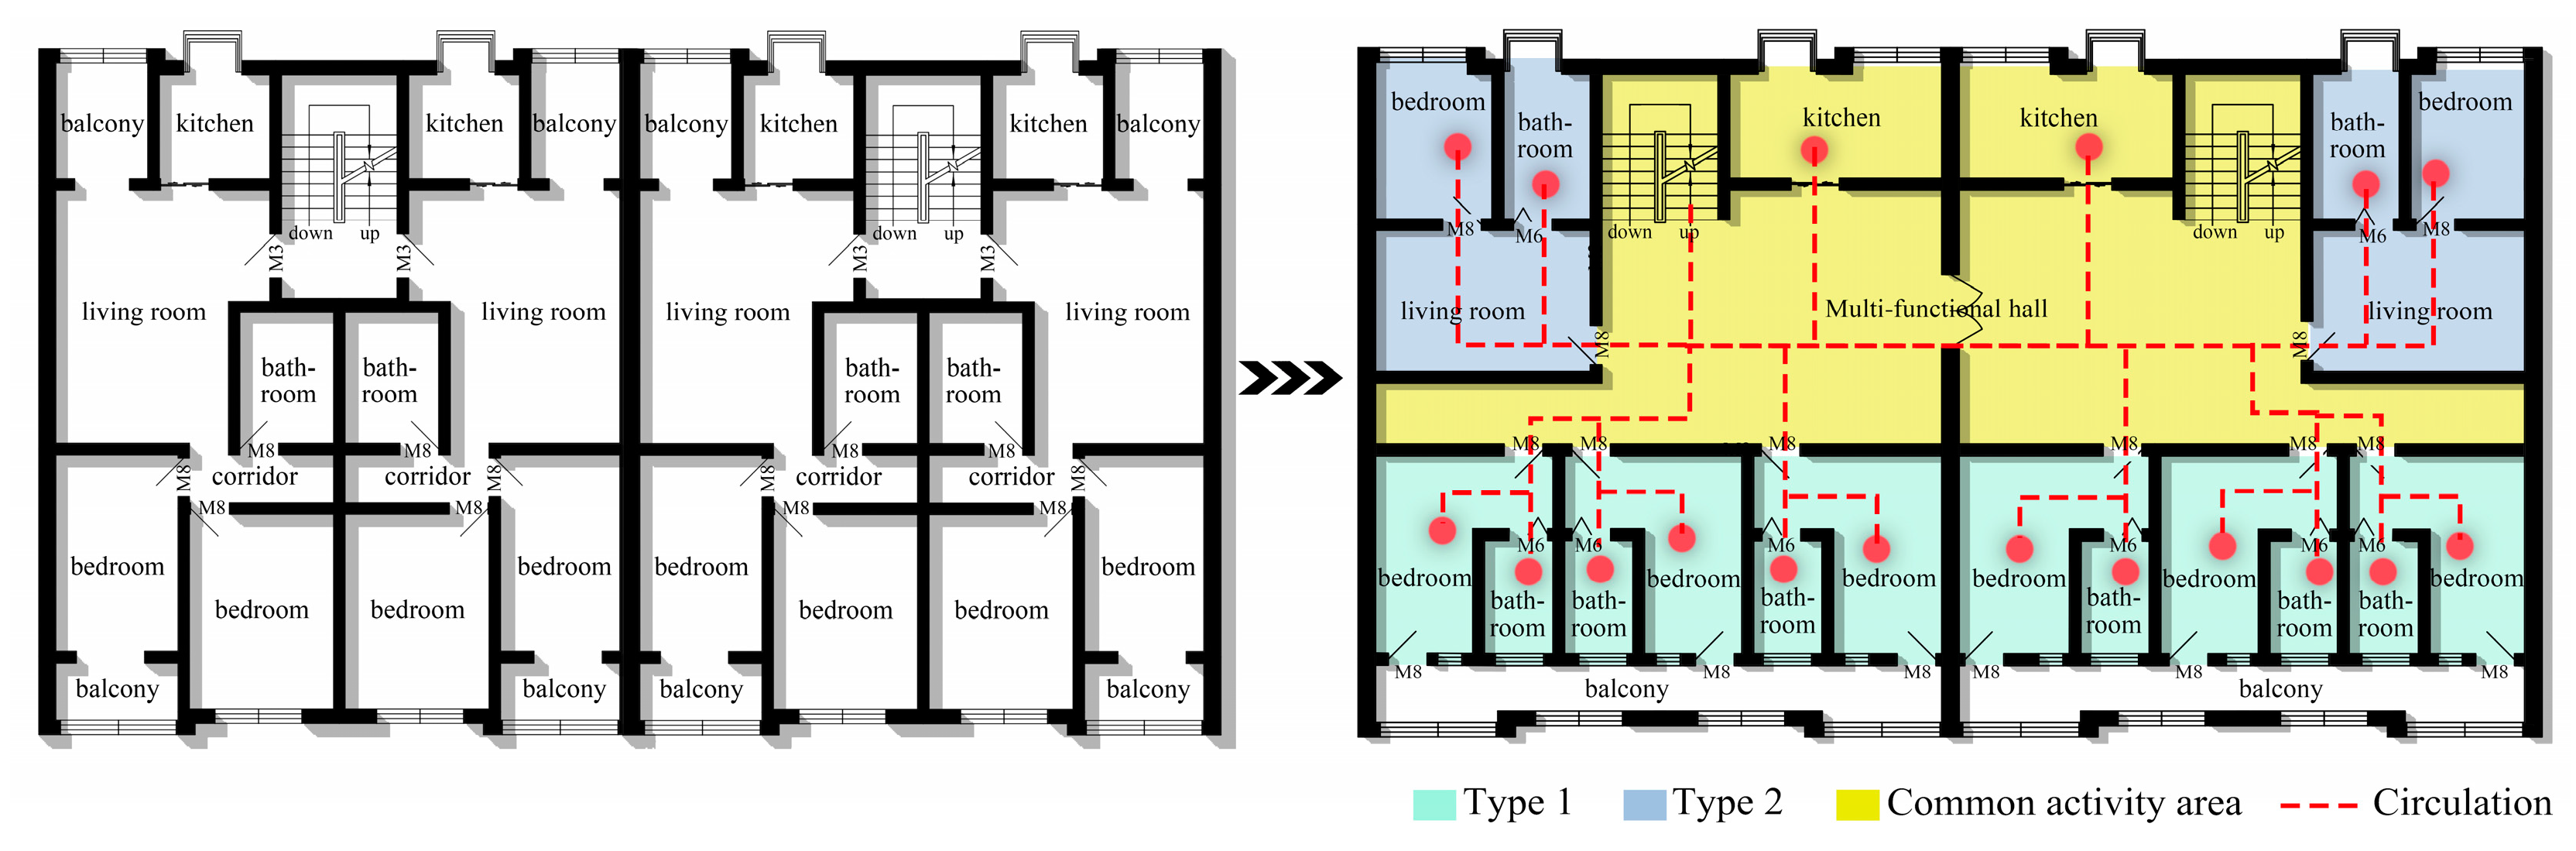
The co-living mode of layout regeneration design was adopted for Building A. As shown in Figure 11, the partition wall between the two units was removed, forming two large, connectable multi-functional halls. Two shared kitchens were centrally arranged on the north side. The remaining walls were slightly adjusted, resulting in the formation of two Type 2 layouts and six Type 1 layouts.
For Building B, the unit integration mode shown was adopted. As shown in Figure 12, the original two Type 3 units were retained, while three adjacent small-sized residential units were structurally connected and merged into one Type 4 unit with appropriate floor area and well-designed functions. Through this approach, the spatial dimensions of the existing residences were effectively improved, the housing functions were enriched, and the living comfort was significantly enhanced.

4.2. Optimal Design Parameters of Aging Residential Buildings with Regenerated Layouts

4.2.1. Determination of Performance Objectives and Design Parameters

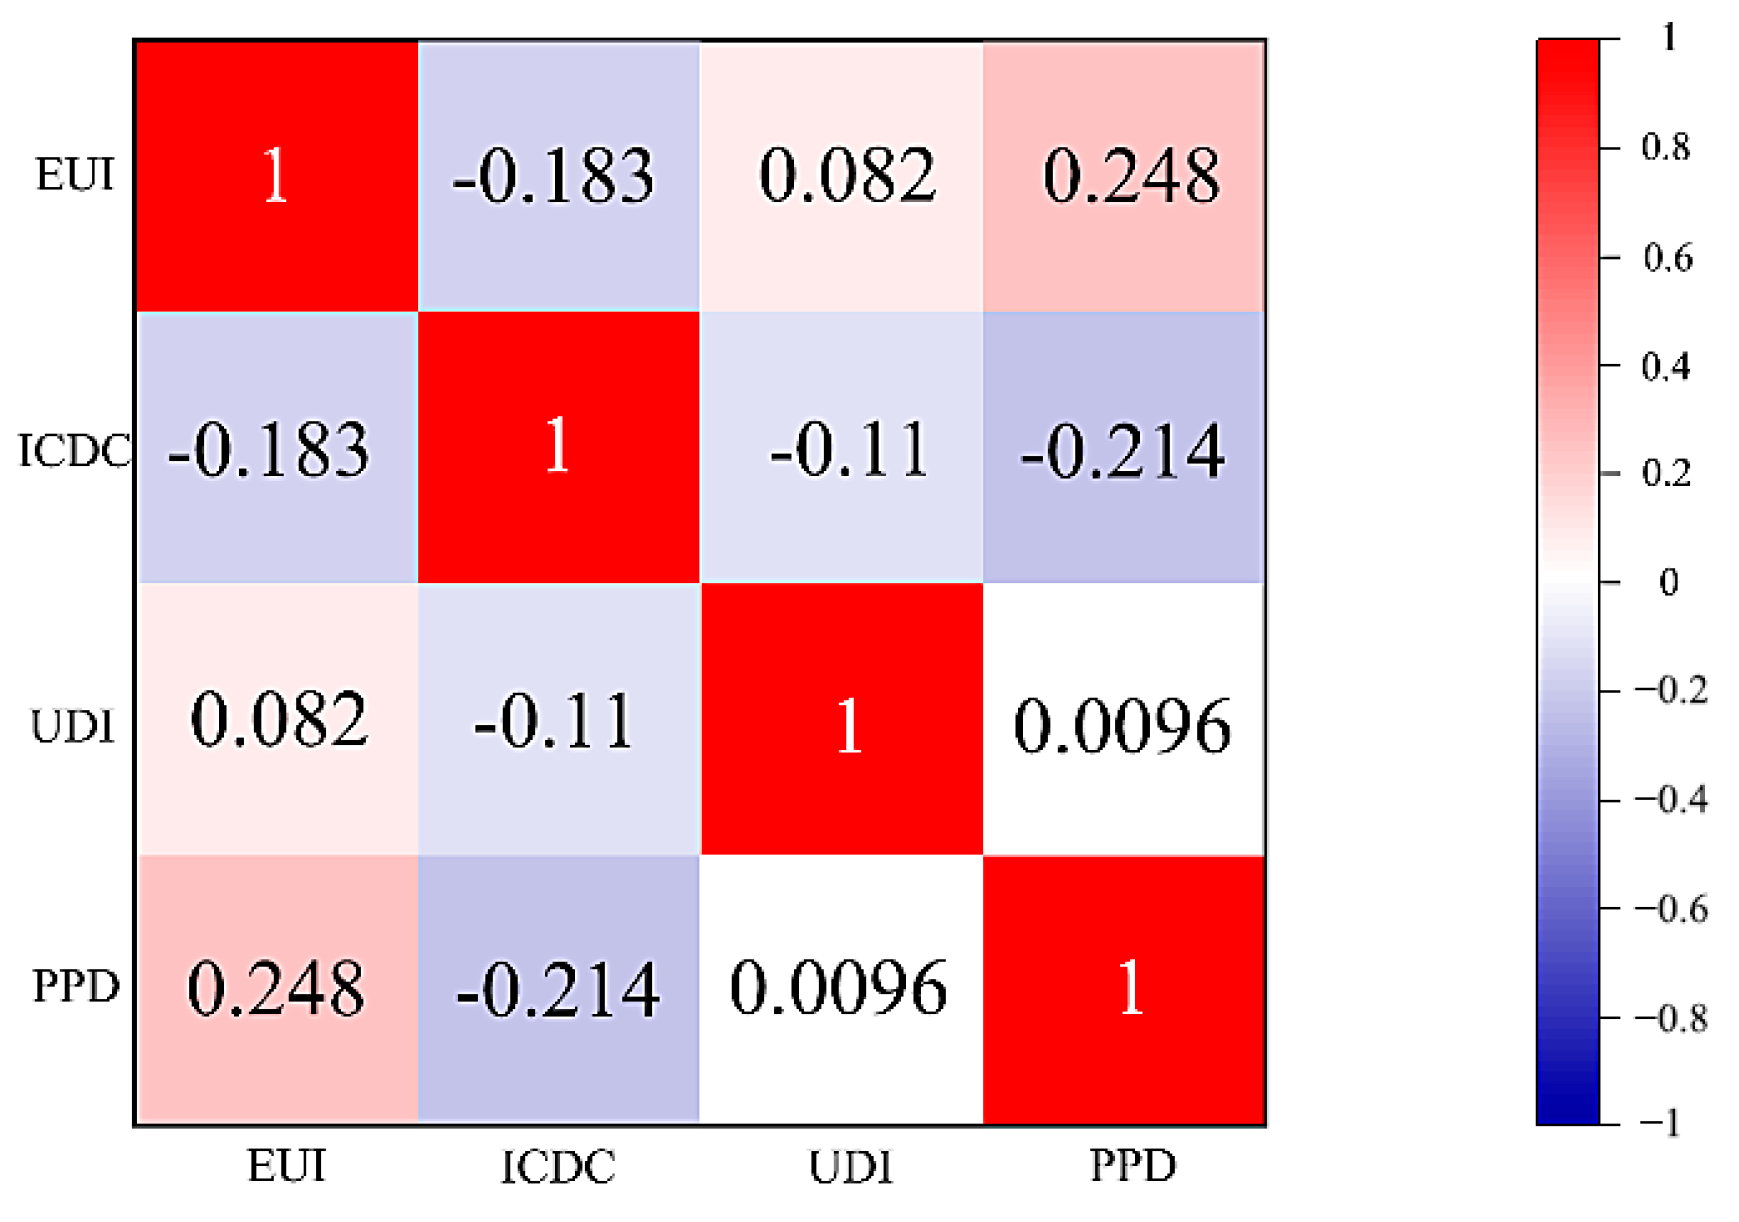
Building A, representing the Community A prototypical model, was selected for conducting objective correlation analysis and parameter sensitivity analysis. The initial design parameters and their value ranges for Building A are presented in Table 4. As shown by the correlation analysis in Figure 13, no optimization objectives with significantly high correlations requiring merging were identified. Therefore, all objectives were retained.
As indicated by the parameter sensitivity analysis in Figure 14, the influence of door height on the four optimization objectives was found to be relatively insignificant and could be excluded from the subsequent optimization process.
For Building B, the value ranges for the design parameters are presented in Table 5, and the thermal parameters of the insulation and glazing were established according to standard design specifications [50].

4.2.2. Optimal Design Parameters for Regenerated Layouts

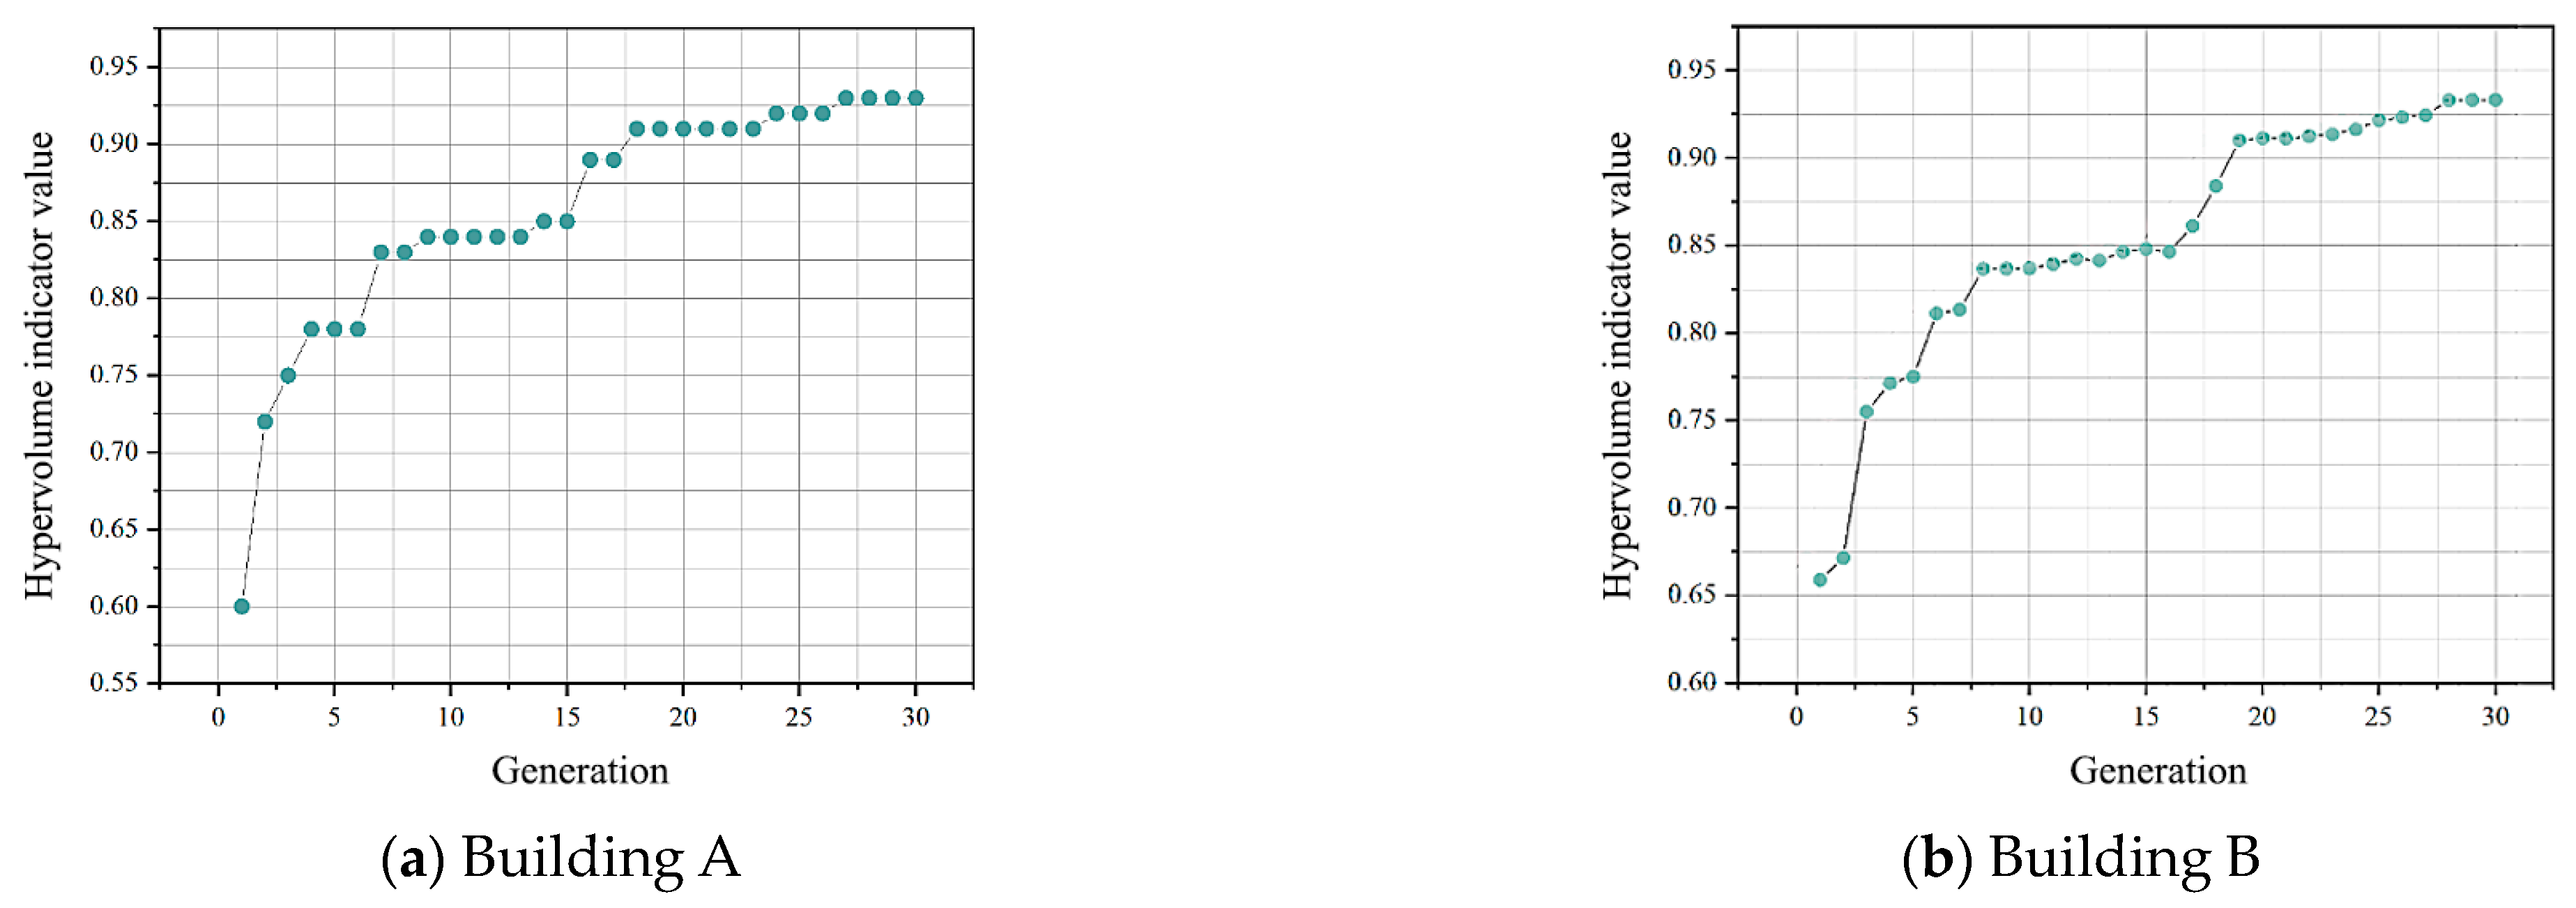
The quality of the optimized solutions for Building A and Building B was evaluated. The hypervolume indicator for Building A stabilized after iteration 16, while for Building B, it began to stabilize around iteration 19, as shown in Figure 15, indicating good solution set quality.
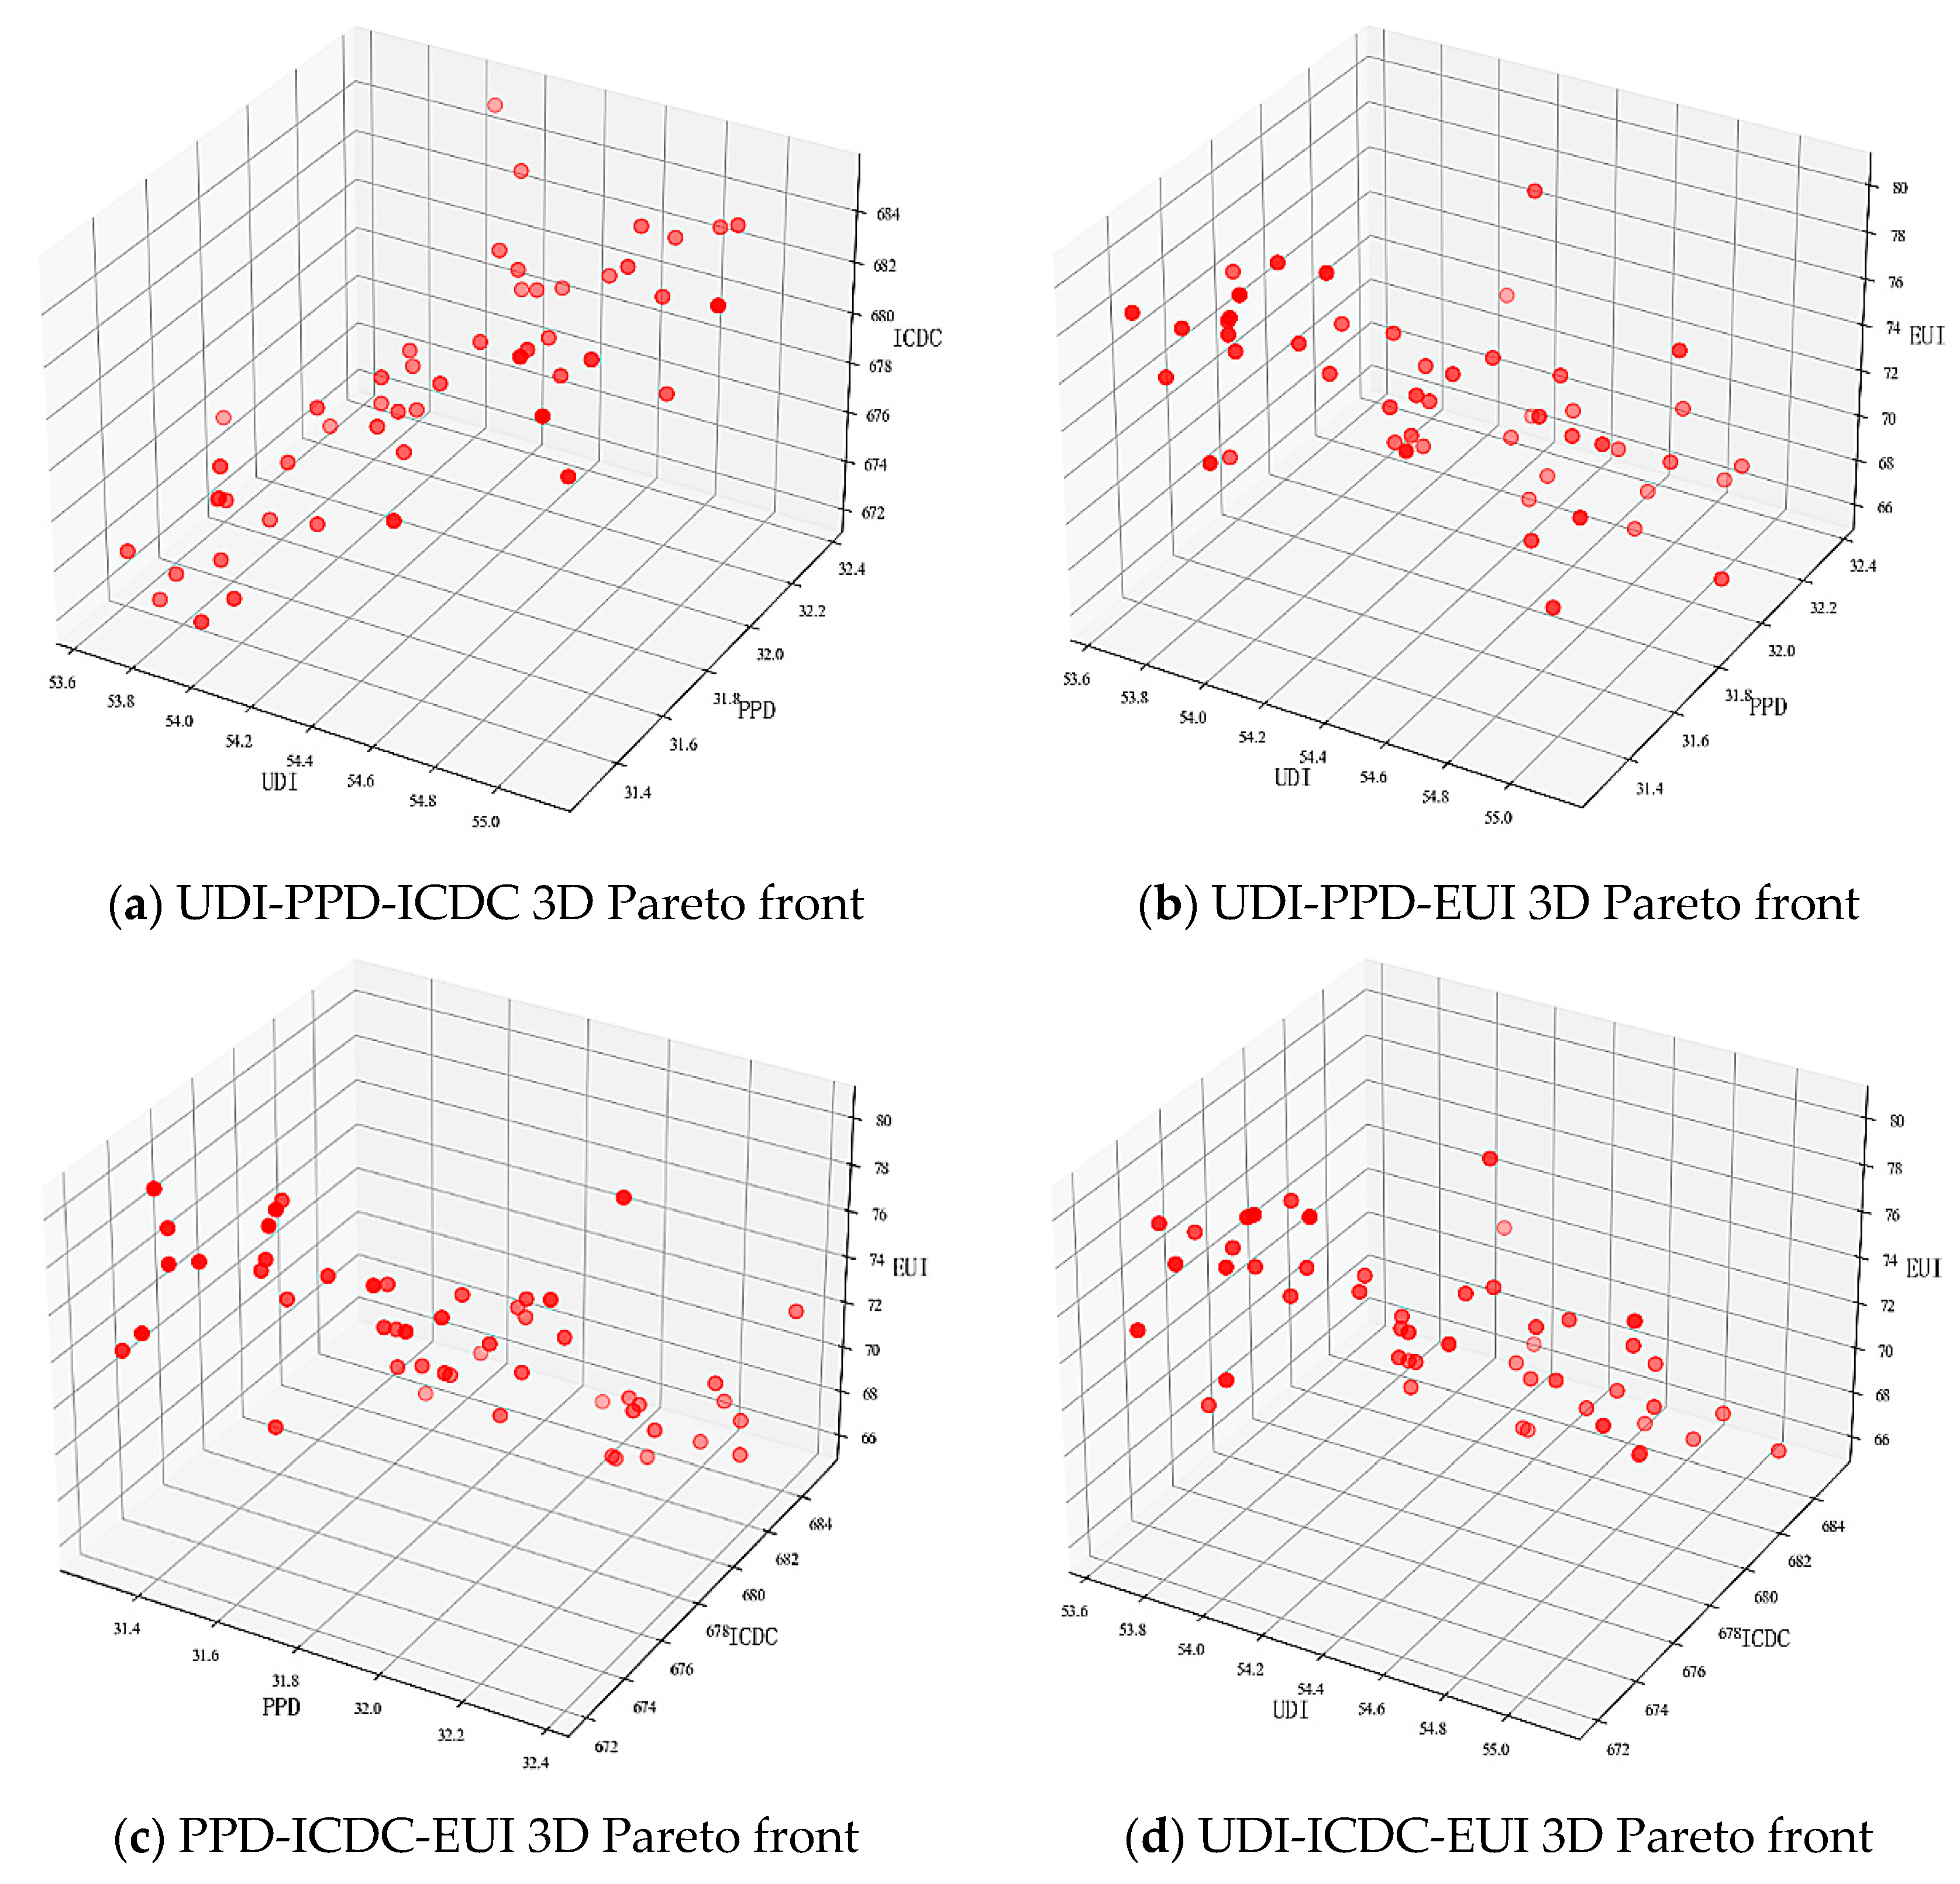
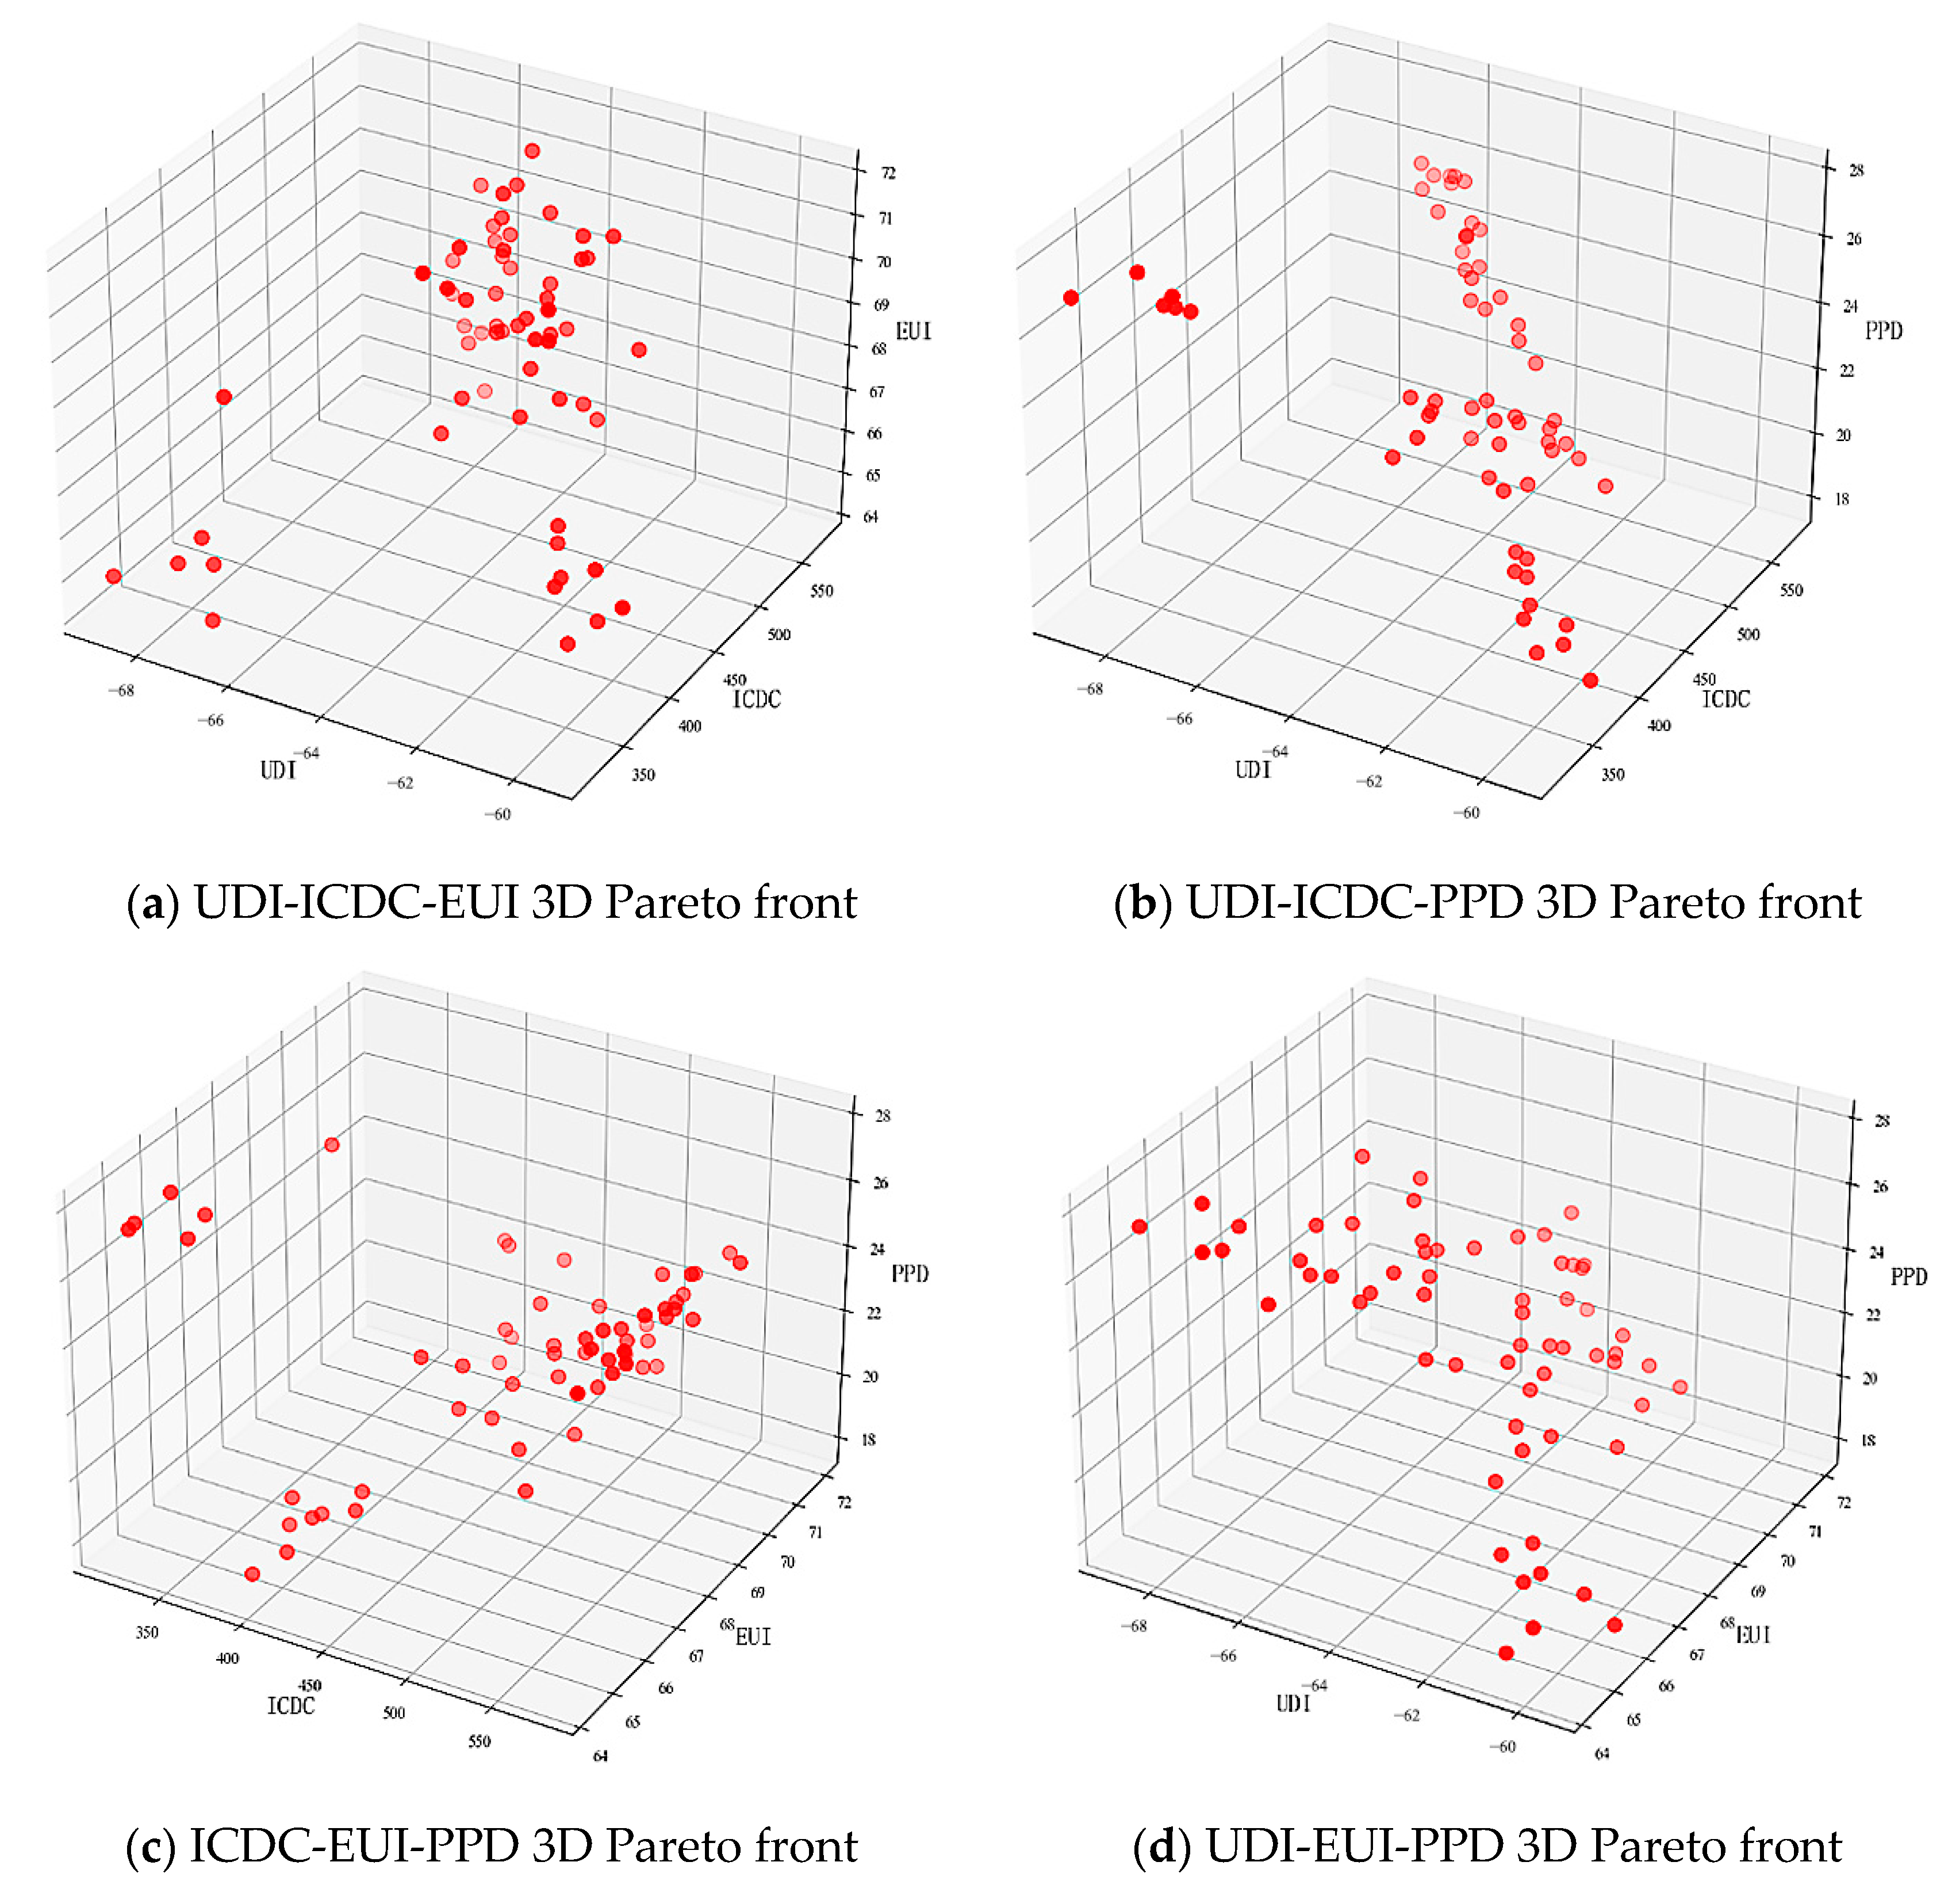
Aiming at improving the daylighting and thermal environment, air quality, and energy efficiency of aging residential buildings after the regeneration of their layouts, multi-objective optimization was employed using a genetic algorithm, and the entropy-weighted TOPSIS method was used for decision-making on the non-dominated solution set. For the two prototypical buildings, the distributions of non-dominated solutions for Building A and Building B are shown in Figure 16 and Figure 17, respectively.
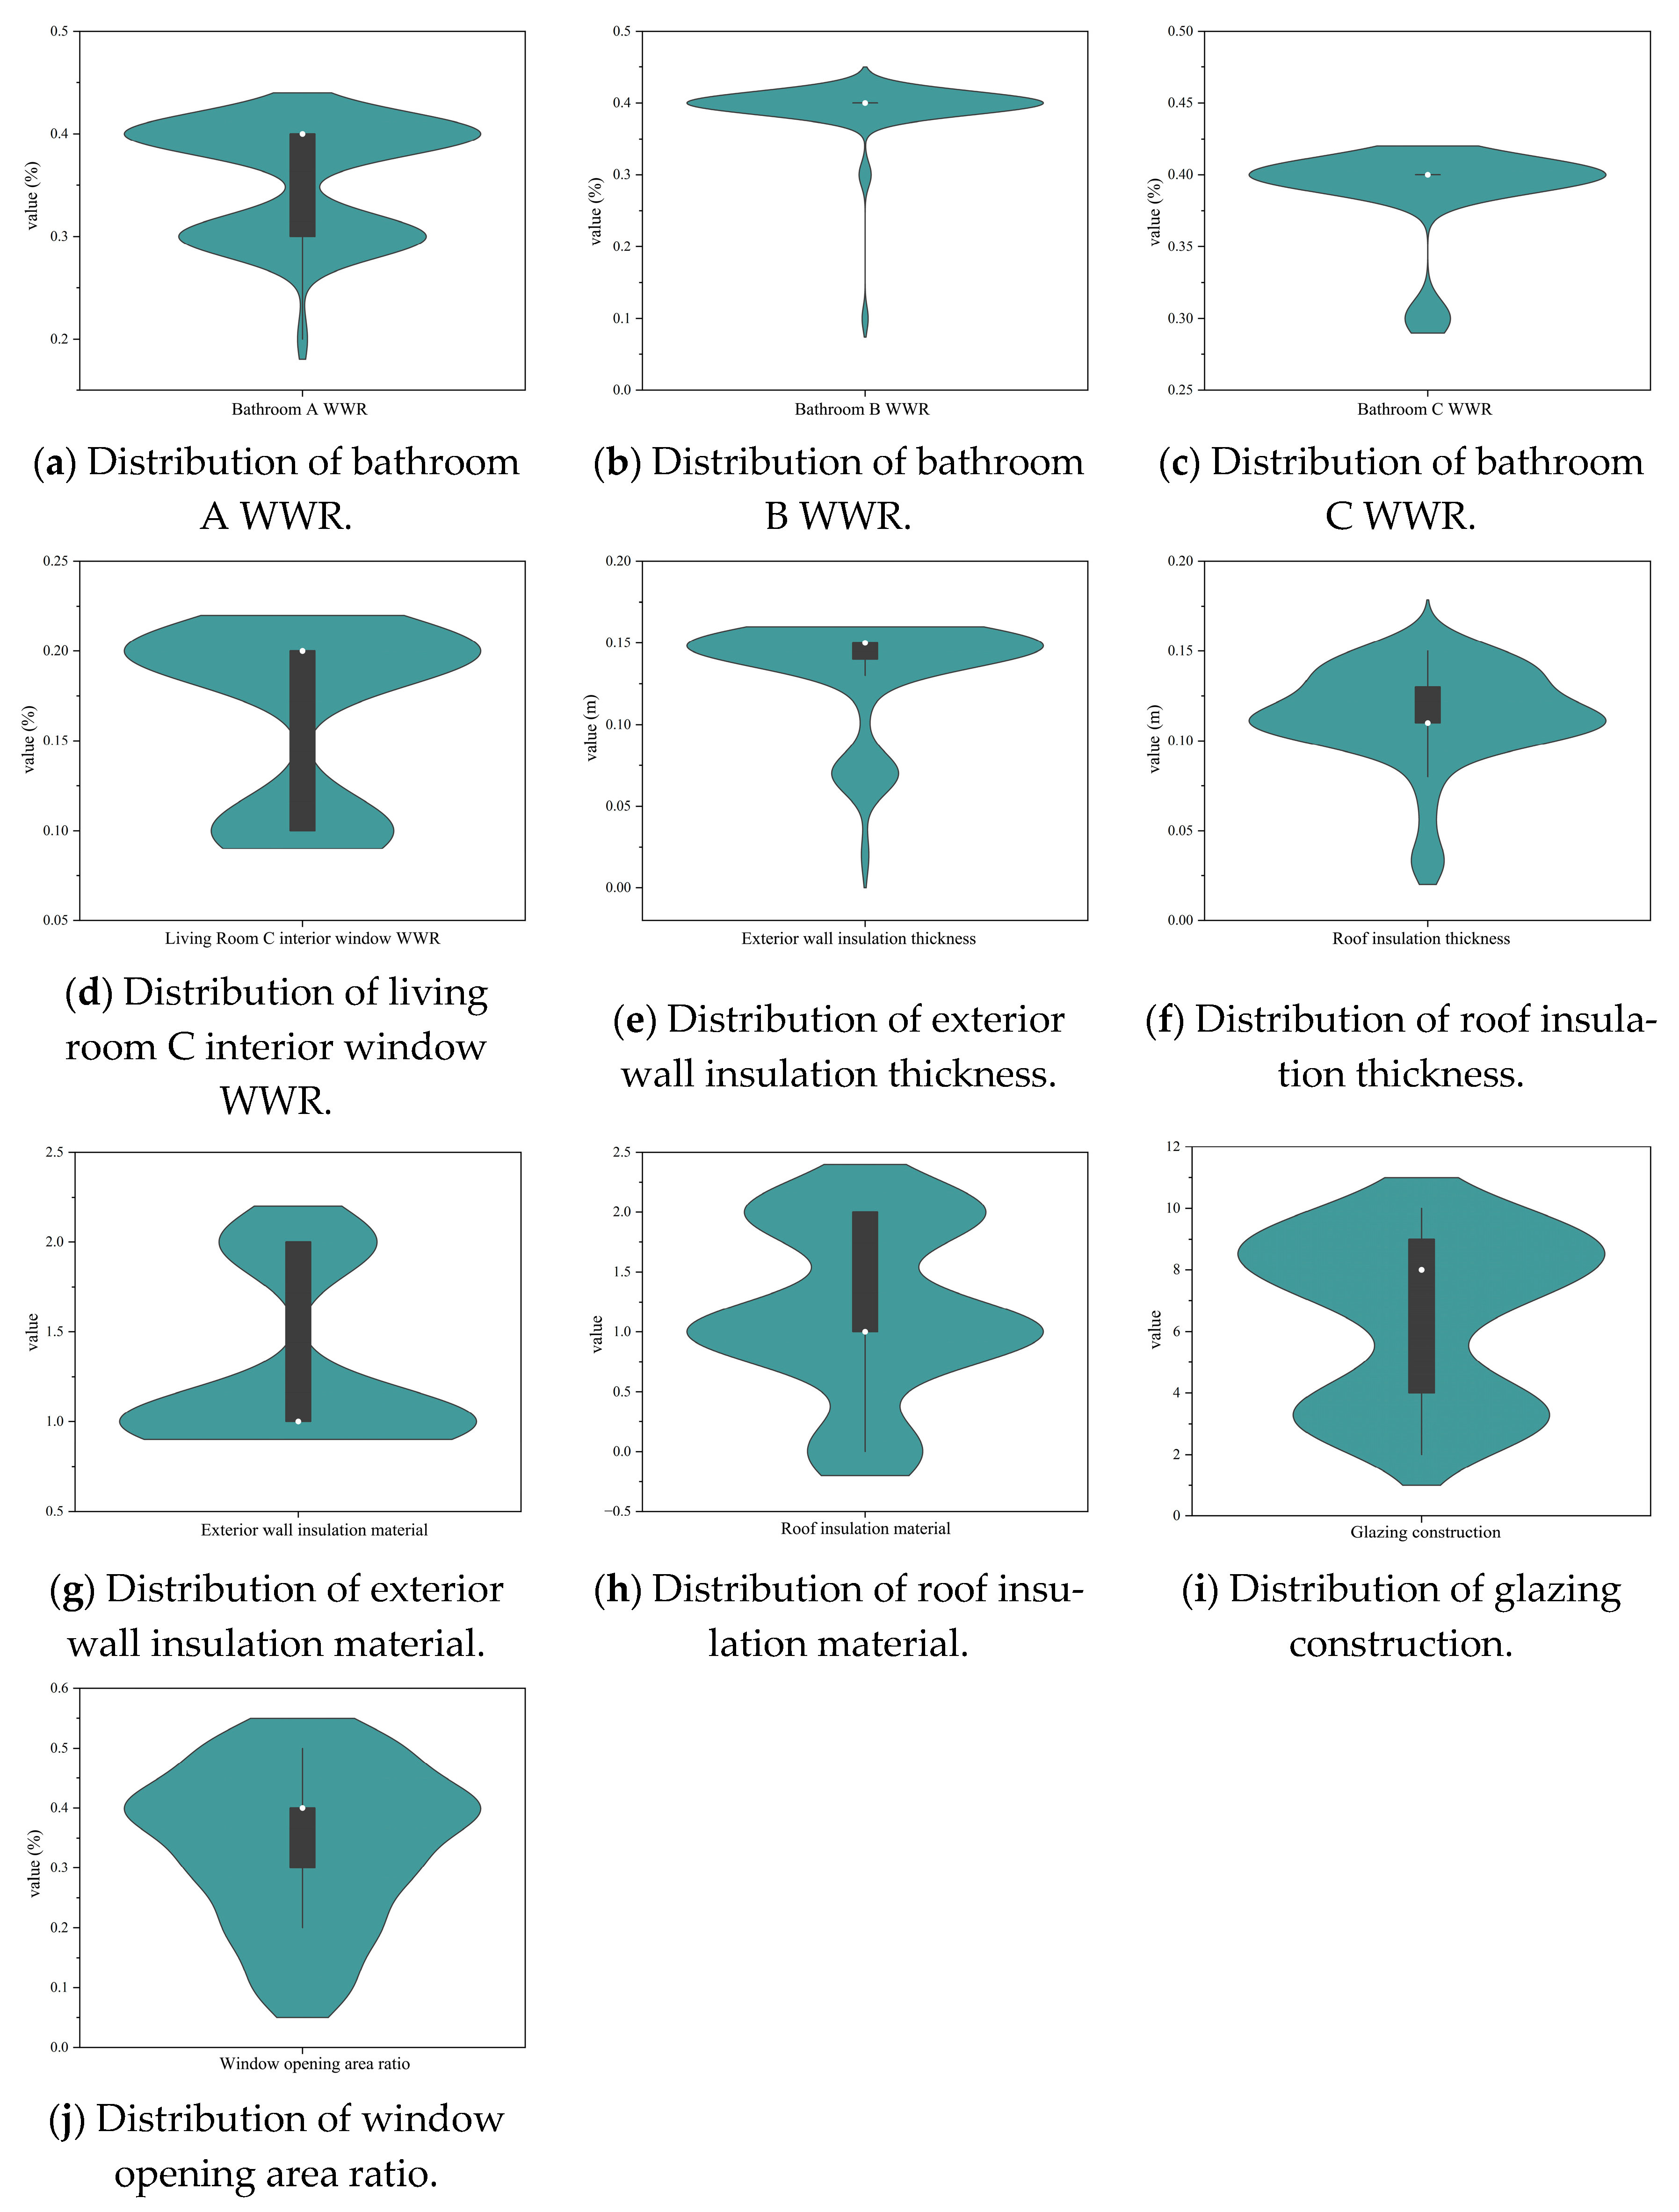
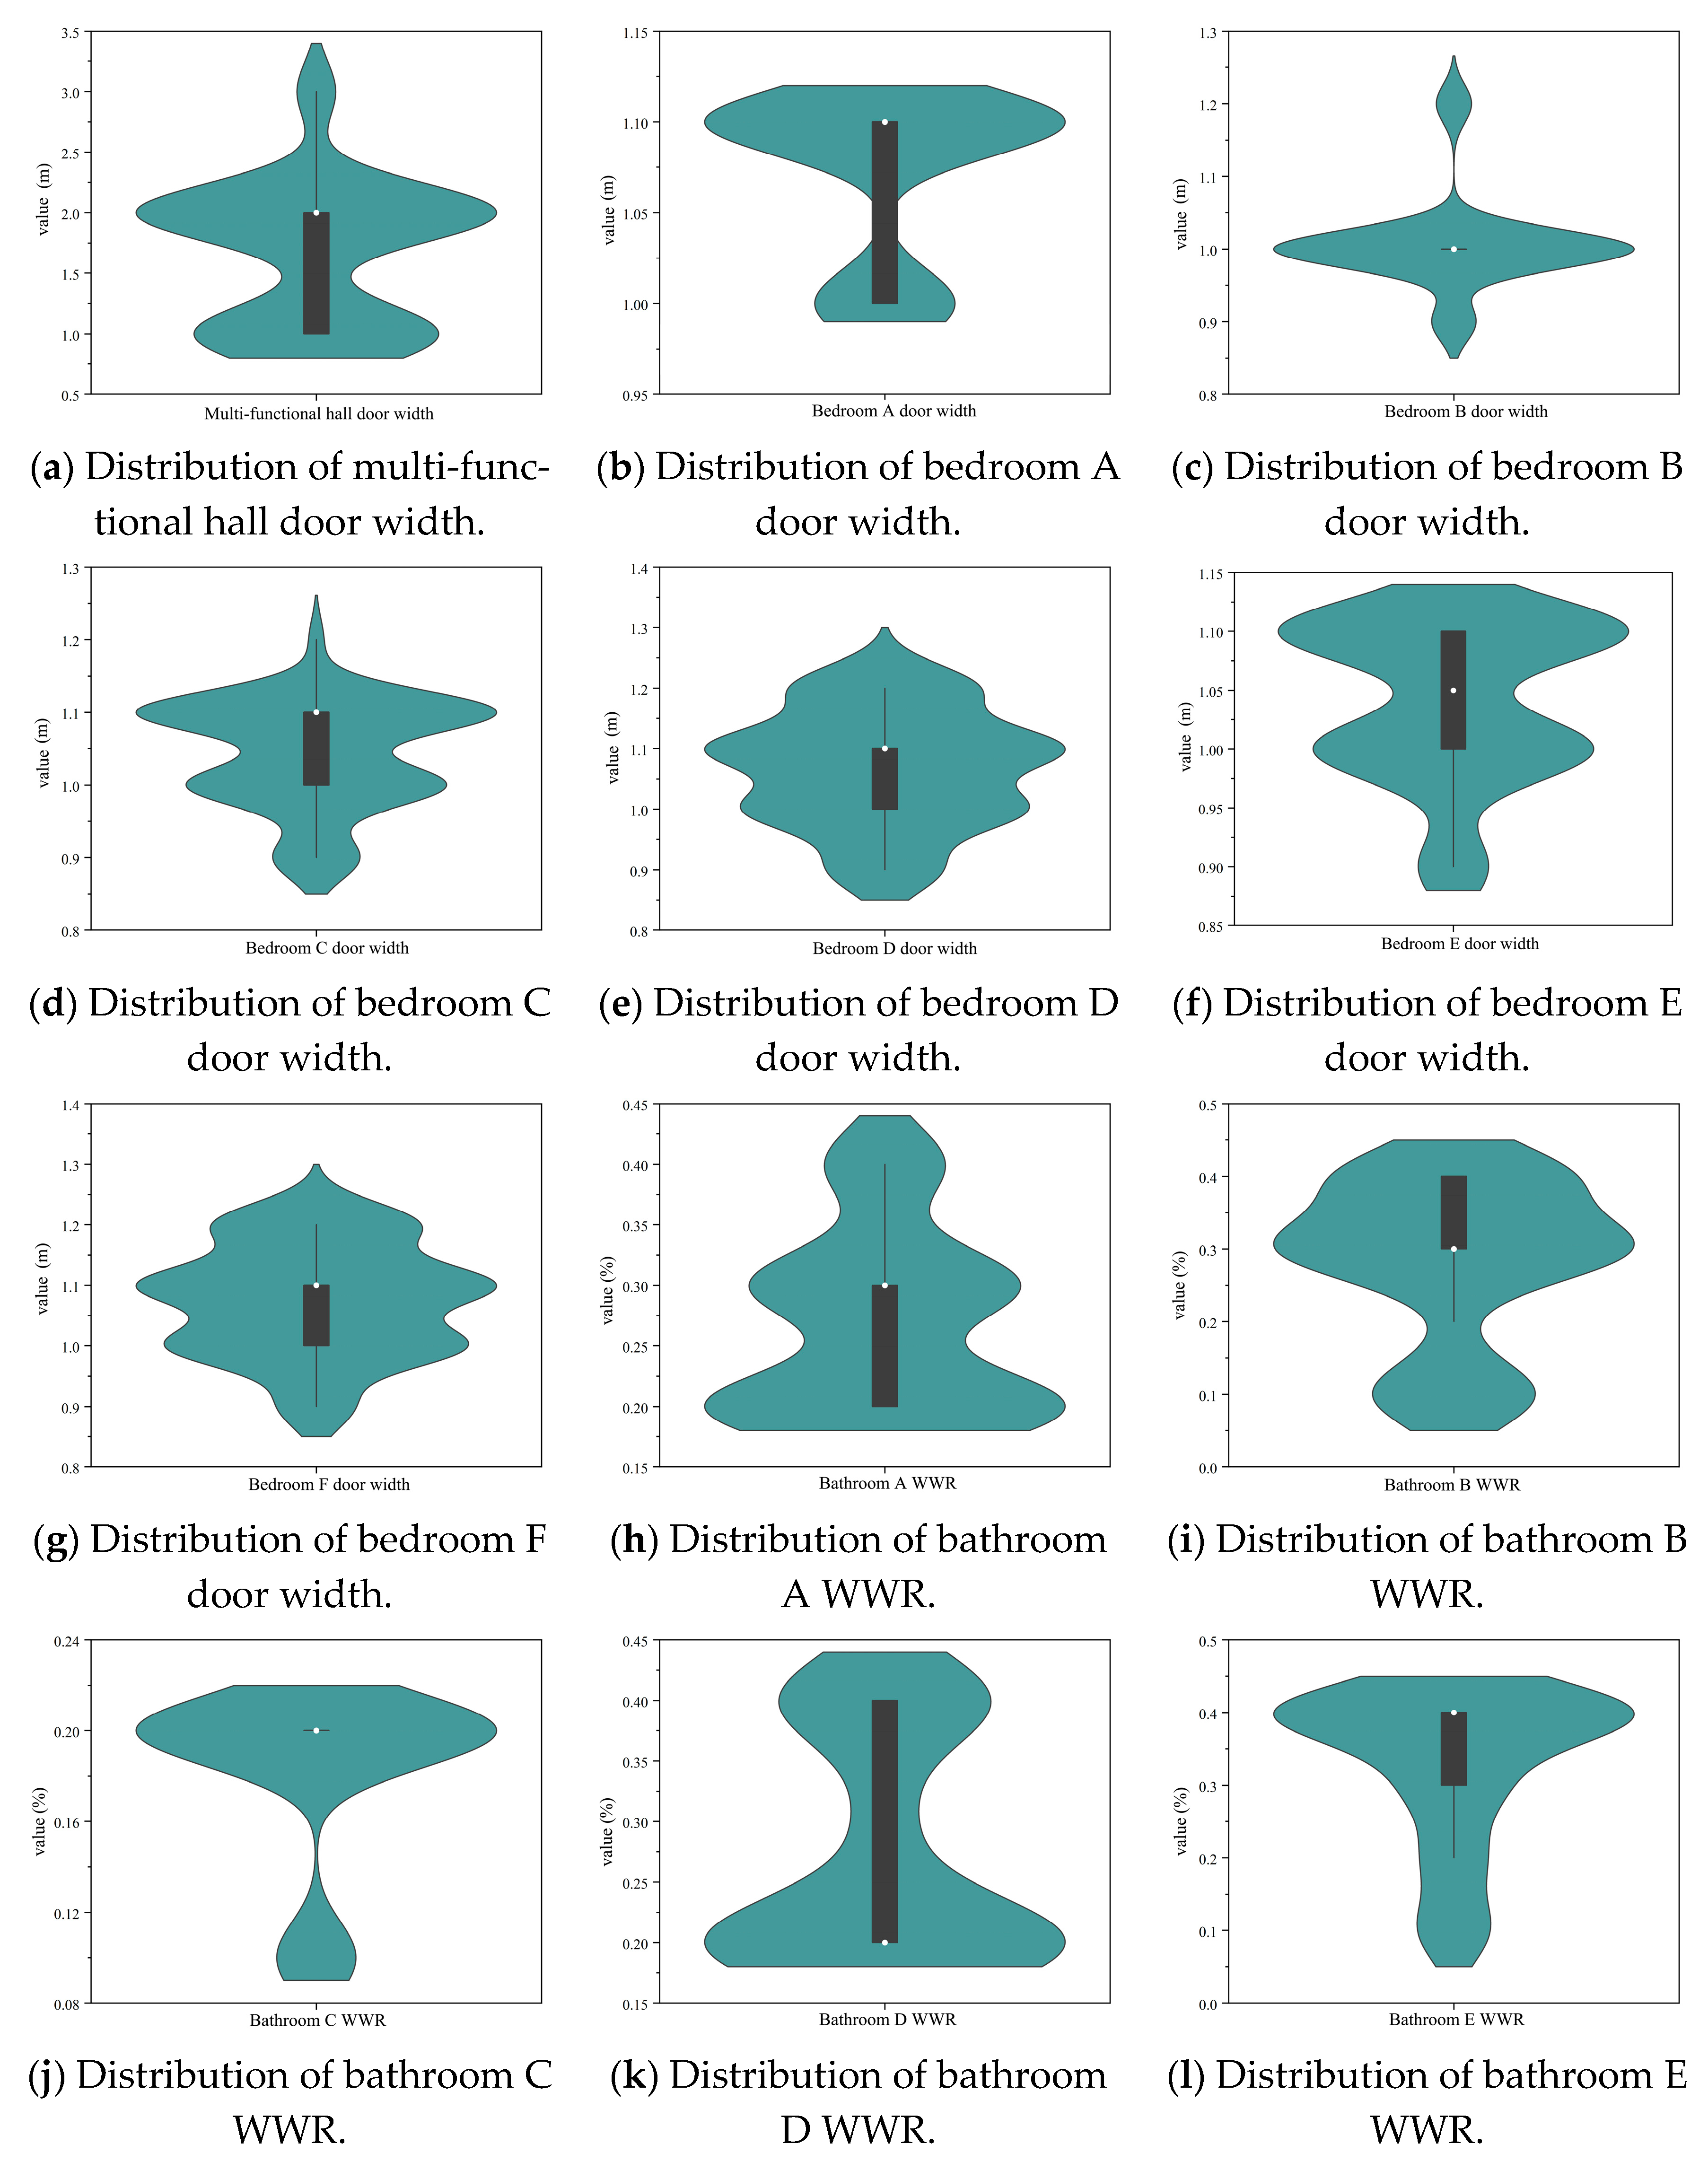
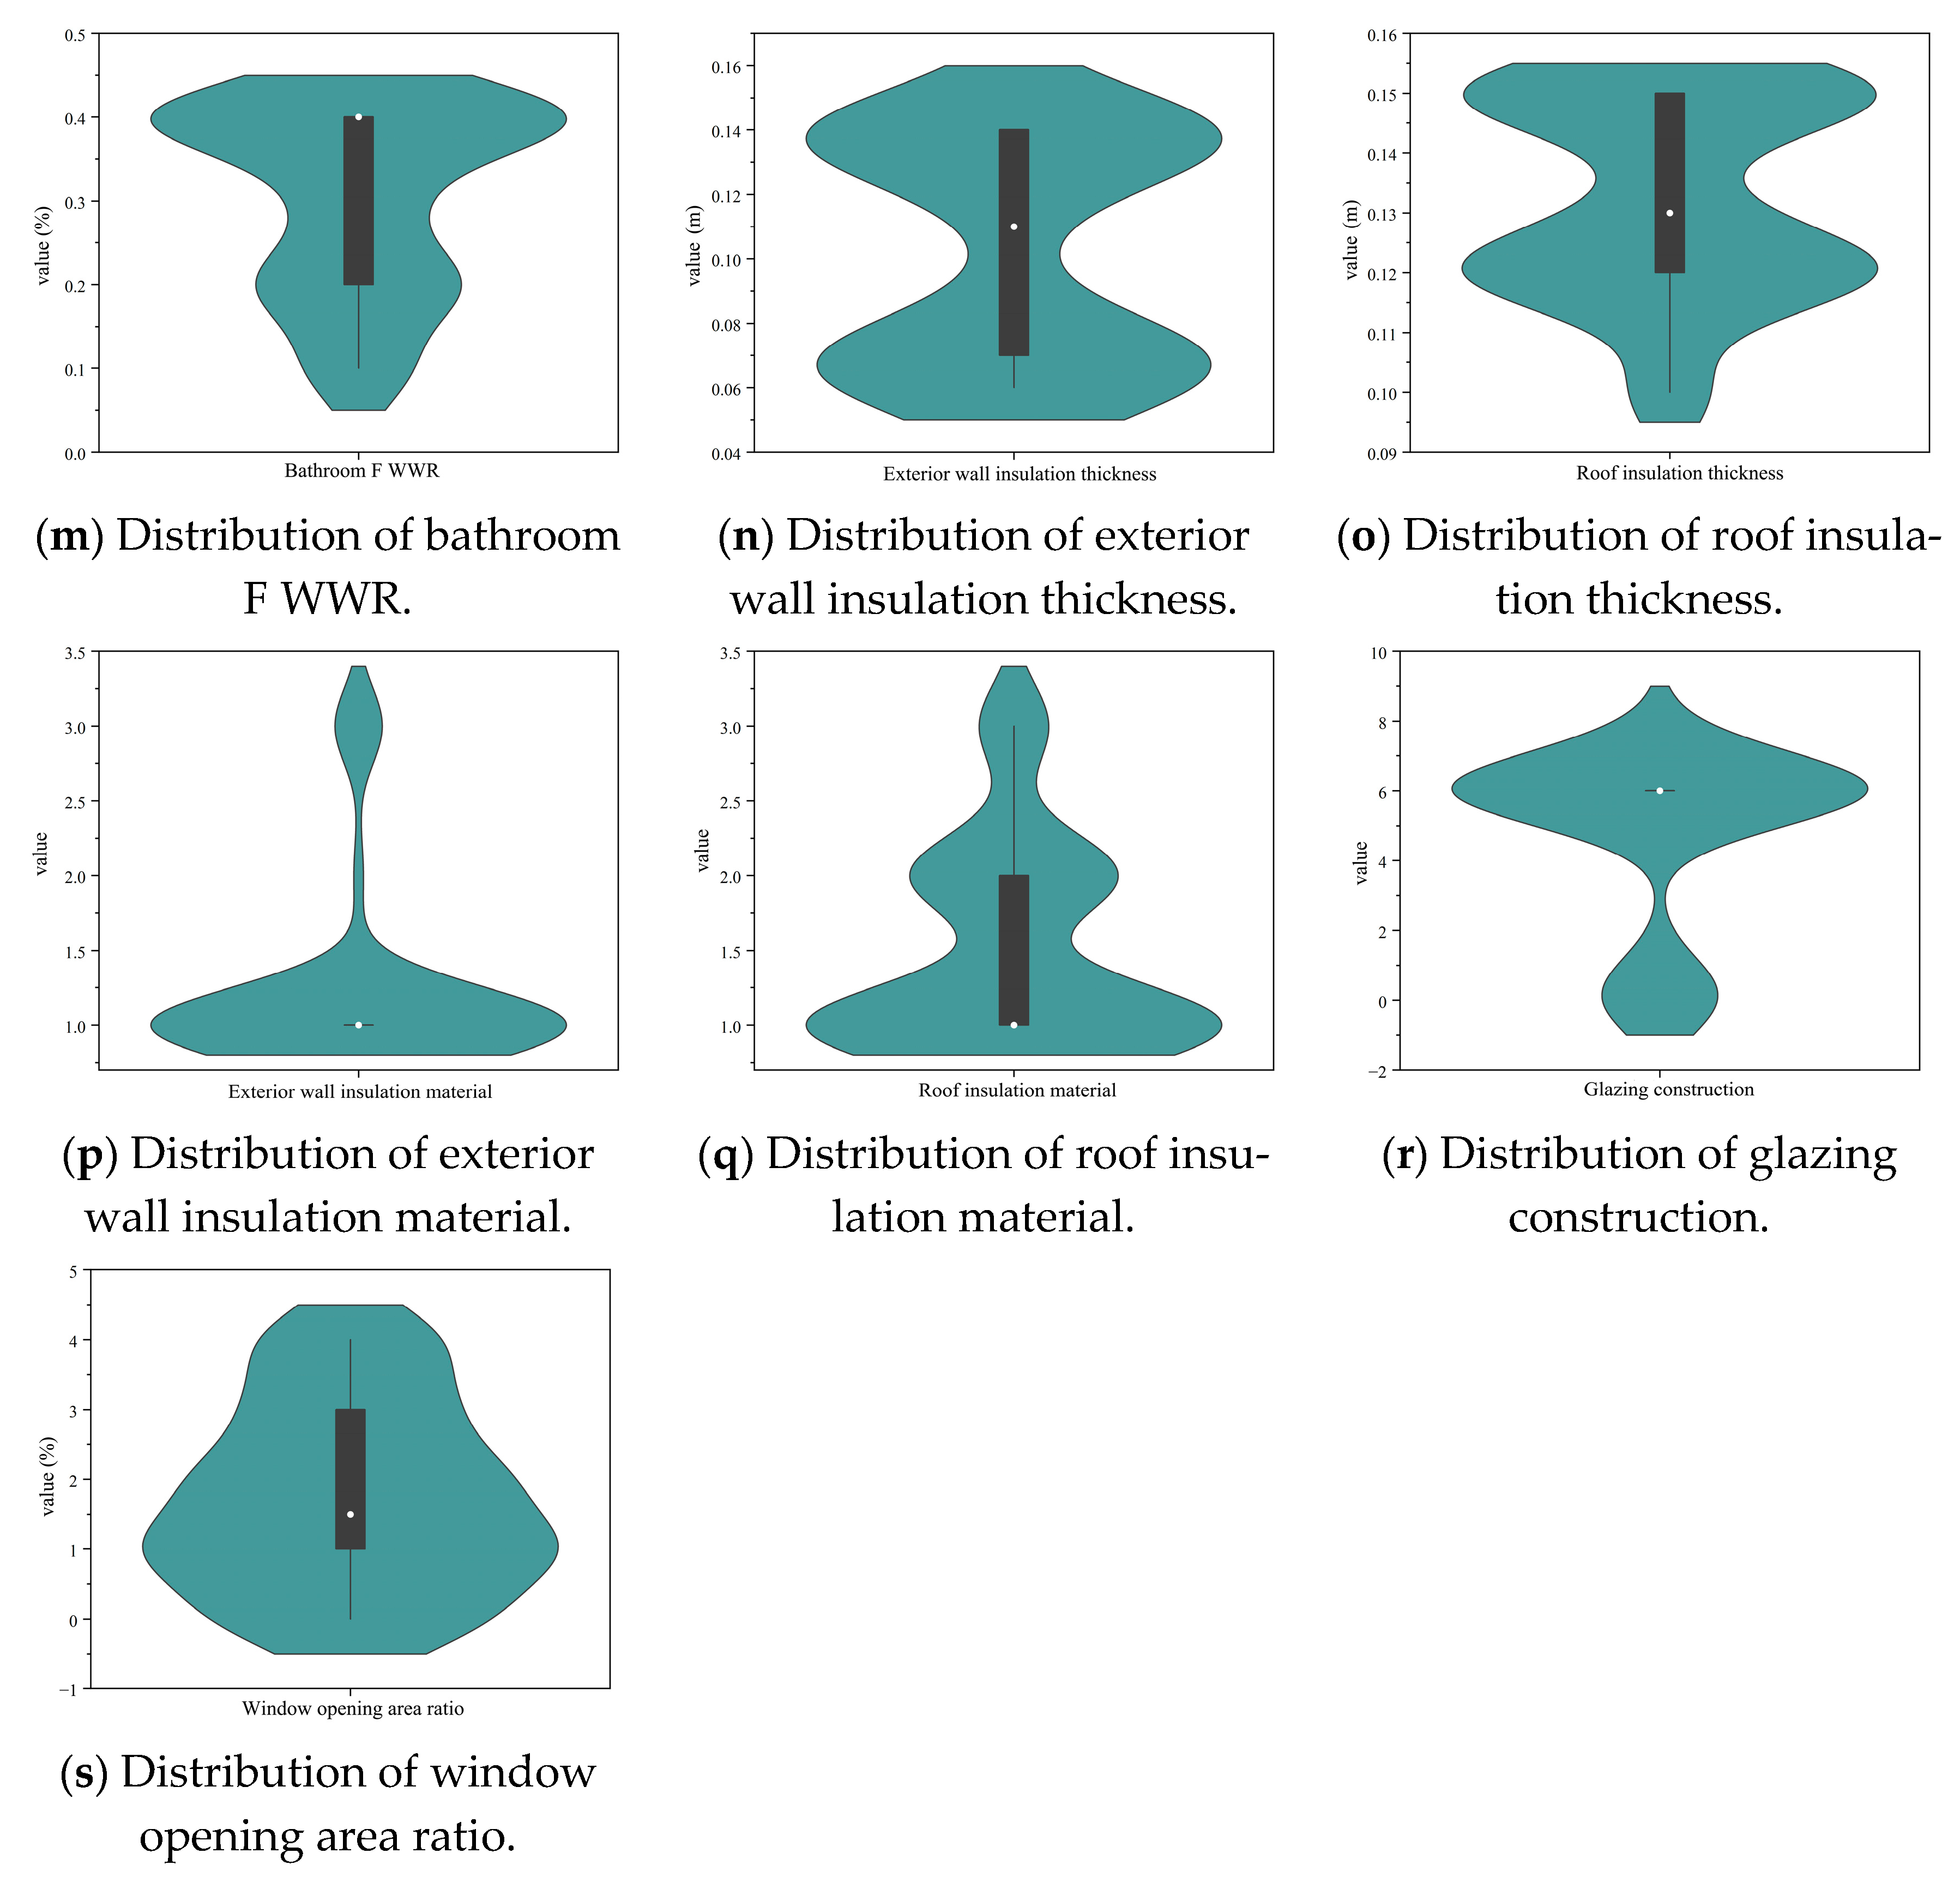
The violin plots of design parameters for the non-dominated solution sets of Building A and Building B are presented in Figure 18 and Figure 19. Significant convergence in the value ranges of all design parameters was observed compared to the original constraints. For Building A, the multi-functional hall door width was concentrated at 1 m and 2 m. Bedroom A door width was distributed at 1 m and 1.1 m, Bedroom B door width stabilized at 1 m, and the door widths for Bedrooms C, D, E, and F were concentrated within the range of 0.9–1.1 m. The bathroom window-to-wall ratios are as follows: A is 0.2, B is 0.4, C is 0.1–0.2, D is 0.1, E is 0.4, and F is 0.2–0.3. EPS insulation material is adopted for the exterior walls with a thickness of 0.07 m. The roof insulation consisted primarily of rock wool panels and XPS, with a thickness of 0.12 m. The glazing constructions were mainly “high-light-transmittance heat-reflective glass” and “medium-light-transmittance heat-reflective + A + clear”. The window opening area ratio was concentrated at 0.1 and 0.2. The recommended ranges for key design parameters in Building A are listed in Table 6.
For Building B, WWRs for bathrooms A, B, and C are mainly distributed at 0.3 and 0.4. The interior window WWR of Living Room C was concentrated at 0.1 and 0.2. The exterior wall insulation materials were primarily XPS and SEPS, with thicknesses concentrated at 0.07 m, 0.14 m, and 0.15 m. The roof insulation materials are mainly rock wool panels and XPS, with thicknesses ranging from 0.1 to 0.15 m. The glazing constructions were primarily “medium-light-transmittance heat-reflective + A + clear”, “low-light-transmittance heat-reflective + A + clear”, and “high-transmittance low-E + A + clear”. The window opening area ratio is concentrated in the range of 0.3–0.5. The recommended ranges for key design parameters are given in Table 7. The PRCC sensitivity analysis revealed that window-related variables, including the window-to-wall ratio and window opening area ratio, along with insulation thickness, exerted a considerably higher influence on the optimization objectives than door dimensions. This is because windows serve as the critical interface between indoor and outdoor environments, simultaneously affecting daylighting, heat loss, and natural ventilation, whereas door dimensions primarily influence internal airflow paths with limited direct impact on overall thermal and daylighting performance.
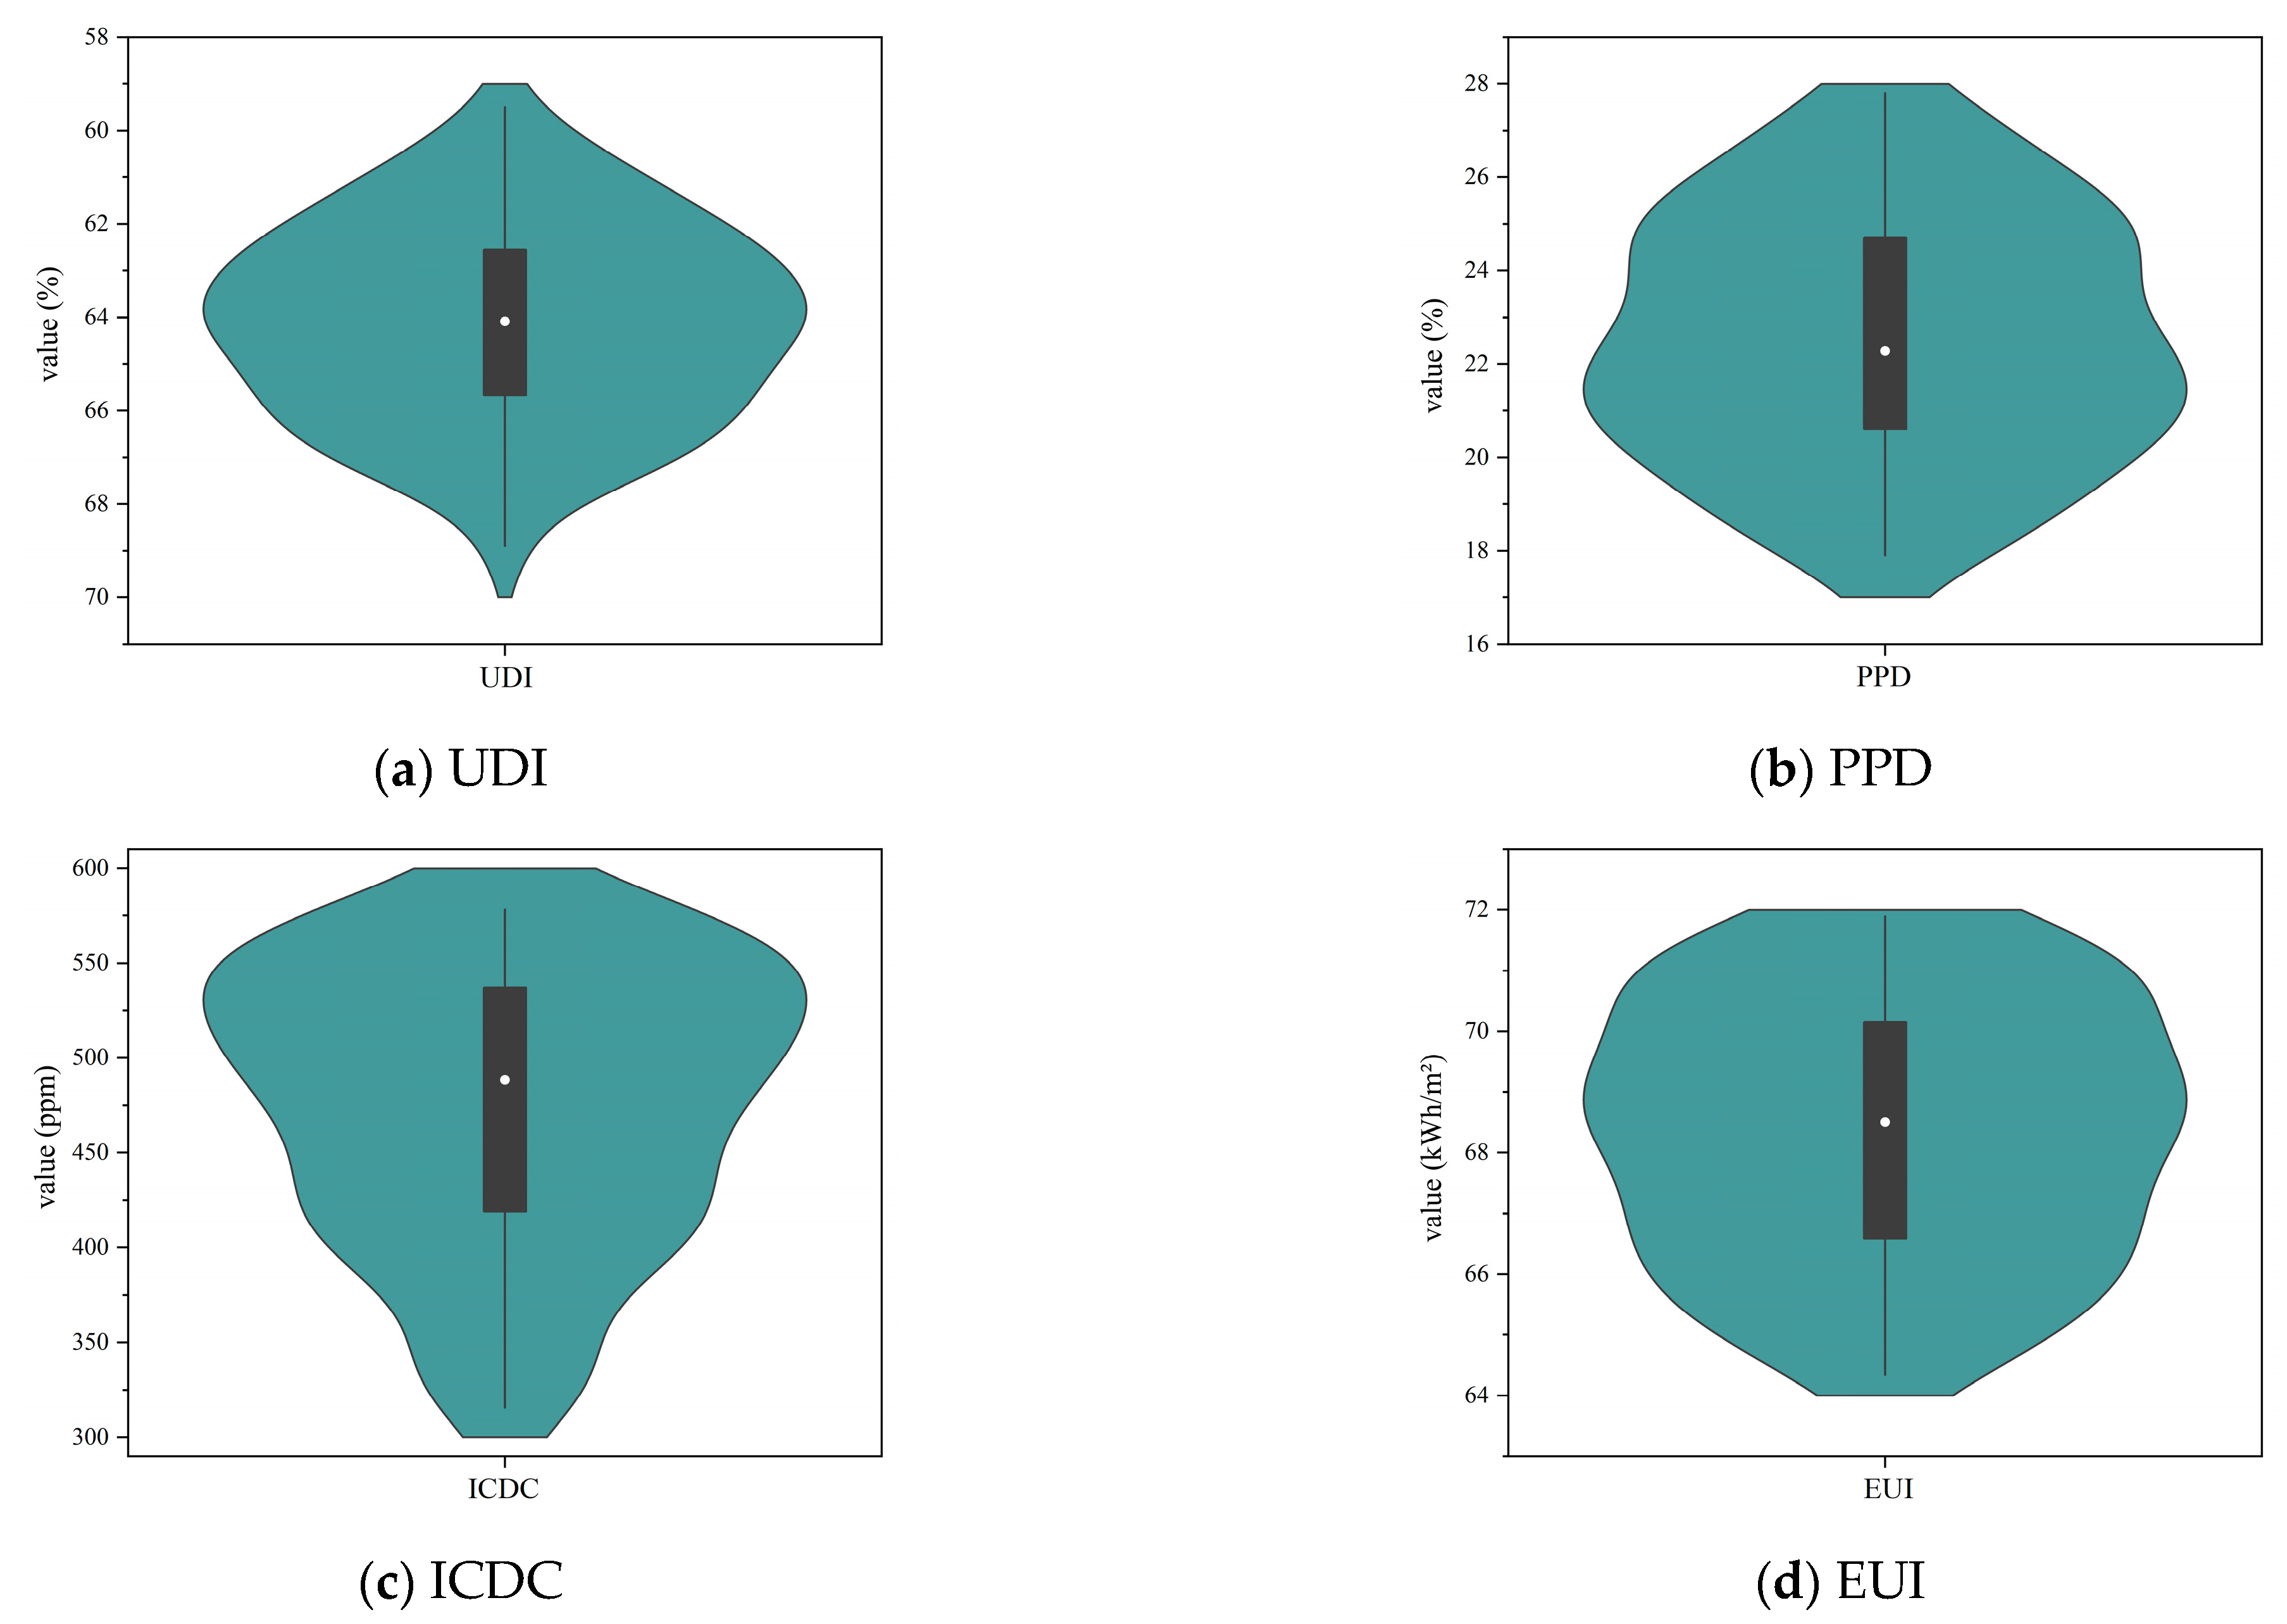
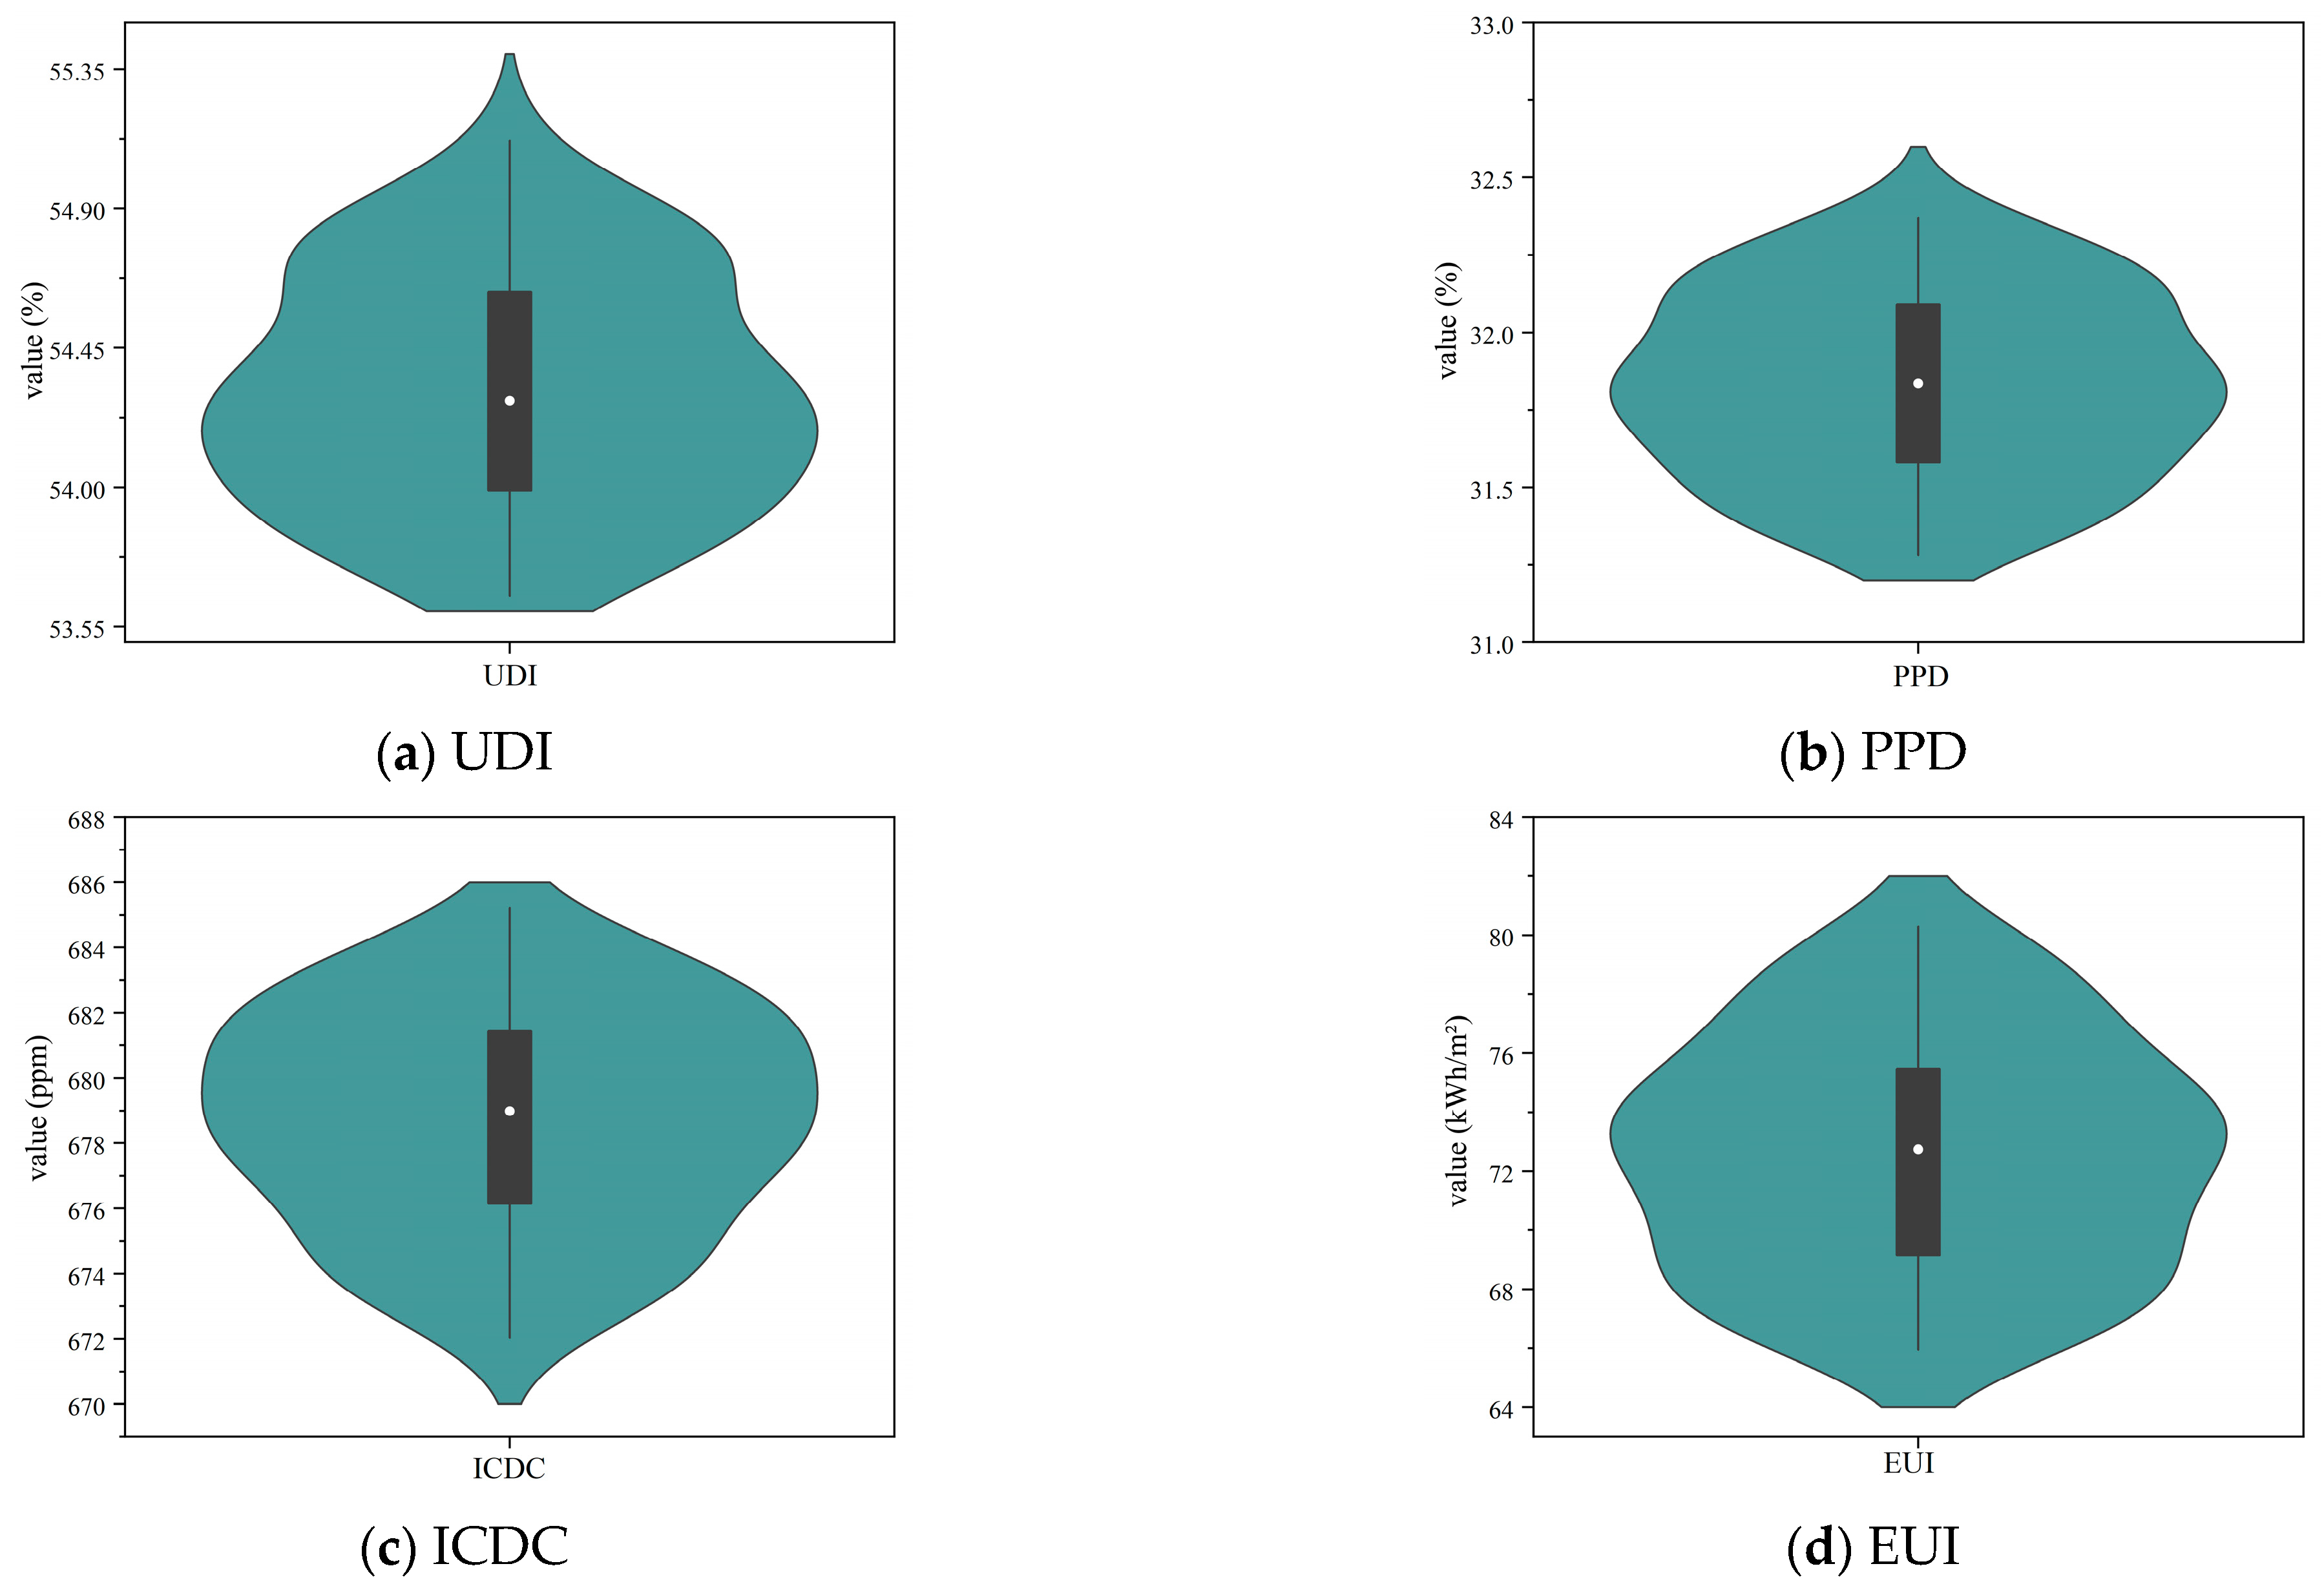
For the optimization objectives in the non-dominated solution set of Building A, as shown in Figure 20, the ranges of UDI, PPD, and ICDC across all Pareto solutions were notably narrow, varying within 1.47%, 1.09%, and approximately 13 ppm, respectively. This indicated that these objectives exhibited limited variation among the non-dominated solutions. In contrast, EUI showed a much wider range of 14.35 kWh/m2, with the maximum reaching 80.29 kWh/m2, suggesting that energy consumption was the primary distinguishing factor among the Pareto solutions.
For the optimization objectives in the non-dominated solution set of Building B, as shown in Figure 21, a different pattern was observed. EUI exhibited the narrowest range of only 7.55 kWh/m2. Conversely, ICDC showed the widest variation with a range of 162.67 ppm, followed by UDI with a range of 9.4% and PPD with a range of 9.9%. The minimum ICDC reached 415.45 ppm, indicating substantial improvement potential in indoor air quality.
Comparing the two buildings, Building A exhibited substantially narrower ranges for UDI, PPD, and ICDC than Building B, while Building B showed a much narrower EUI range than Building A. These contrasting patterns reflected the distinct performance priorities imposed by the two renovation strategies: the co-living mode in Building A made energy consumption the dominant variable, whereas the unit integration mode in Building B increased room depth, making daylighting and ventilation the primary performance differentiators. This inference was further corroborated by the entropy weight analysis.
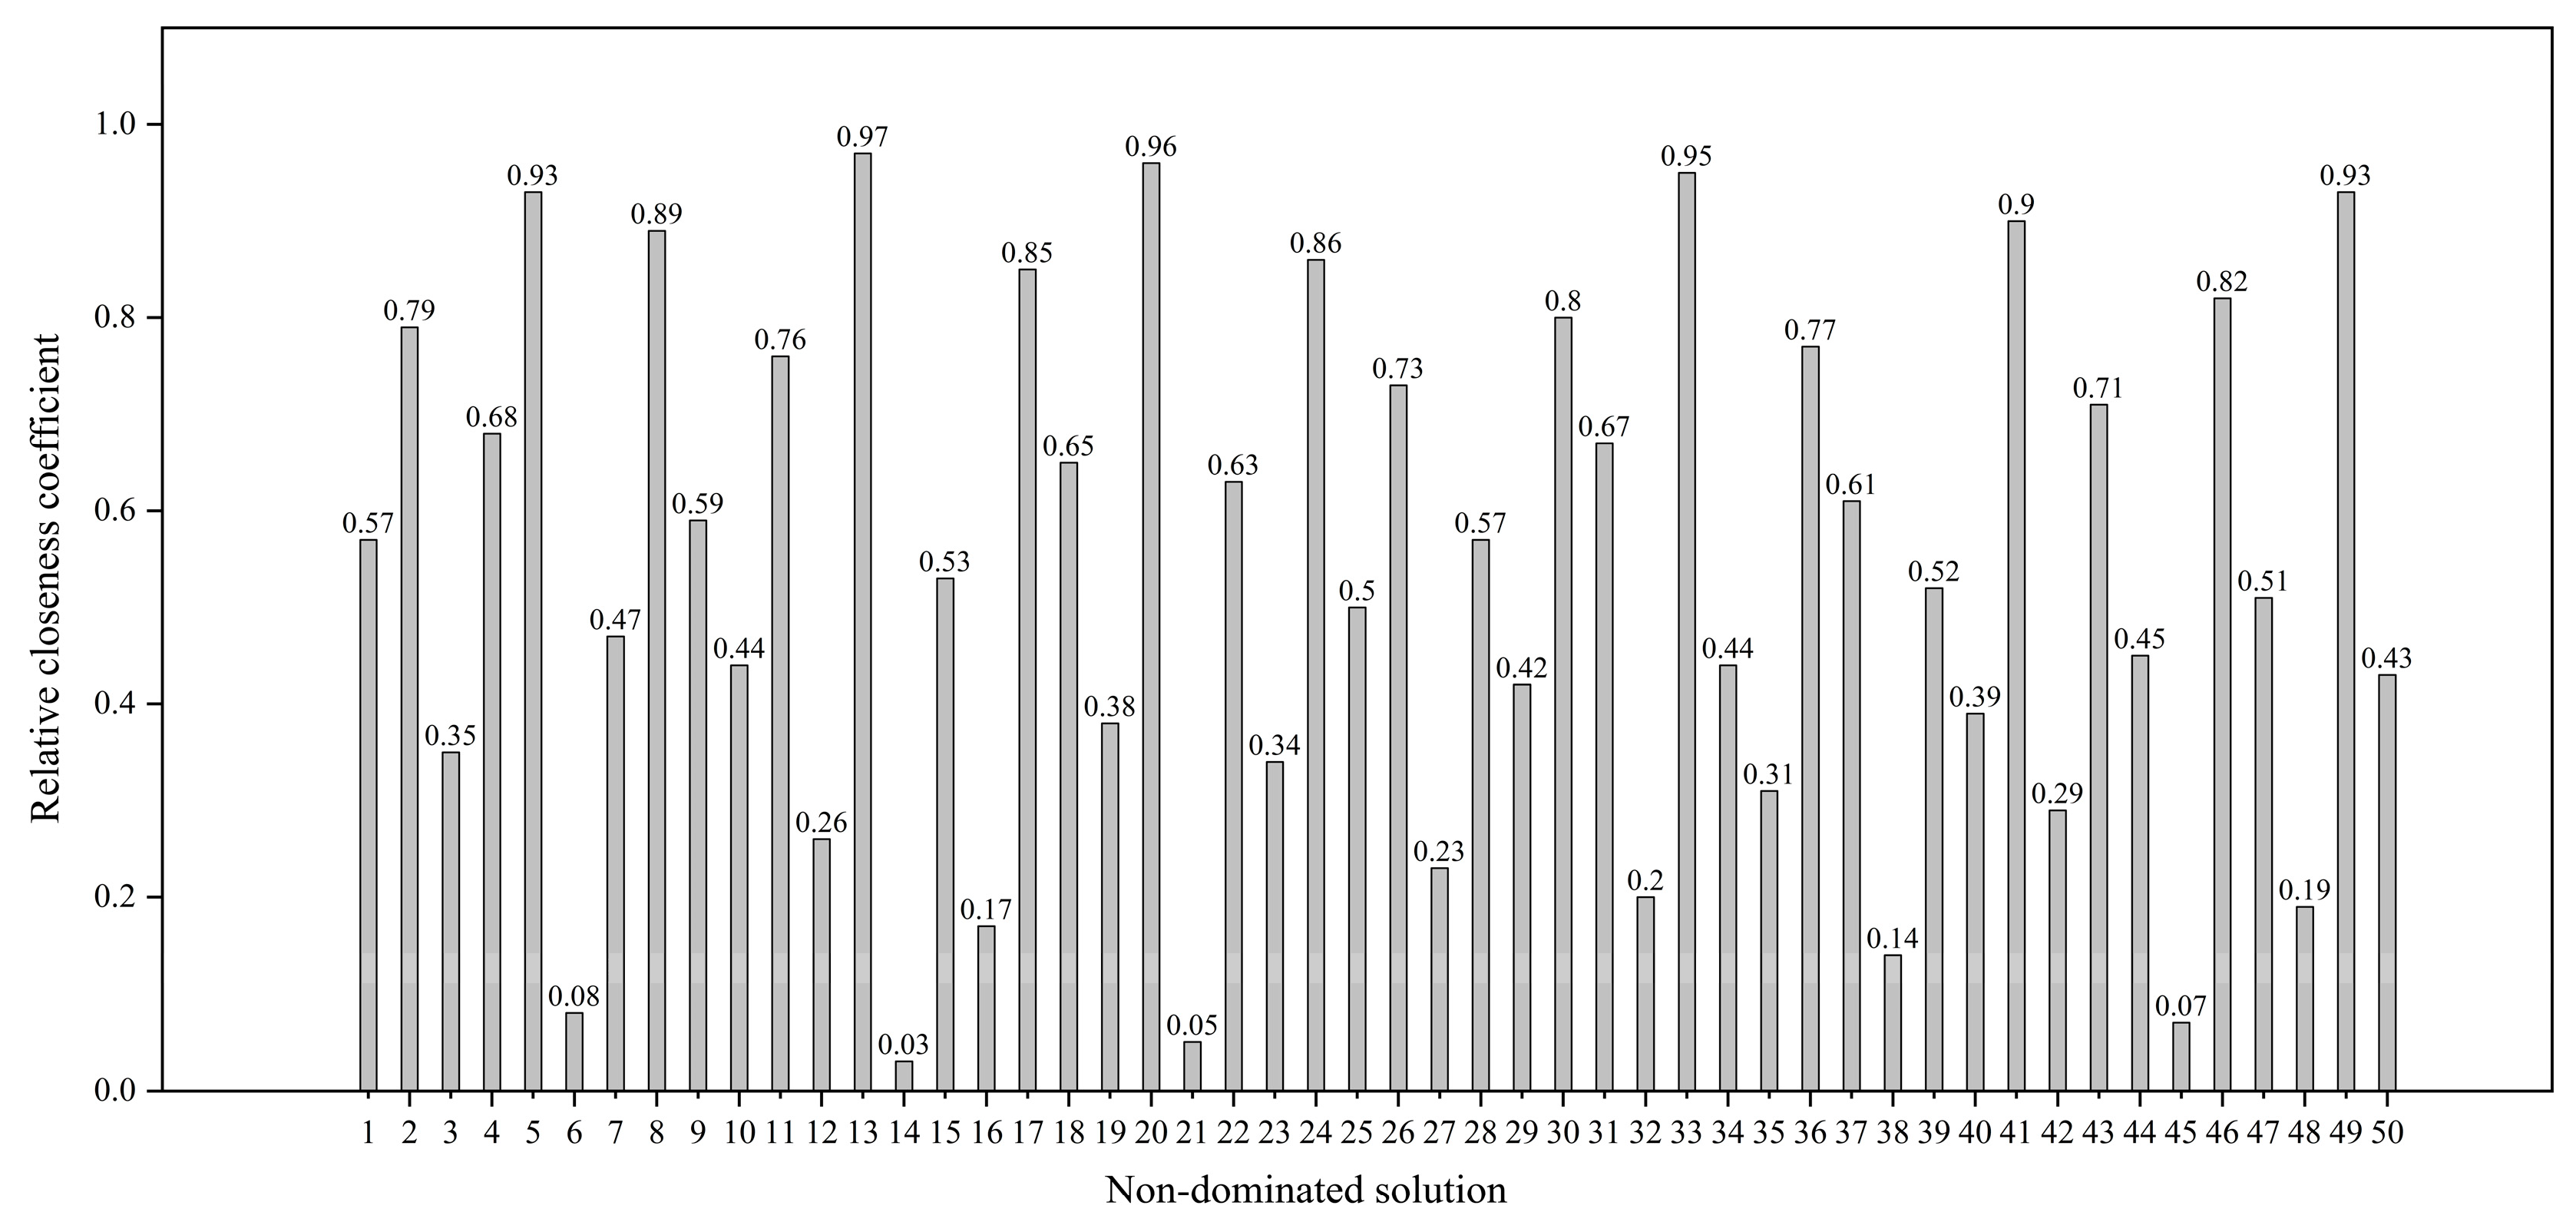
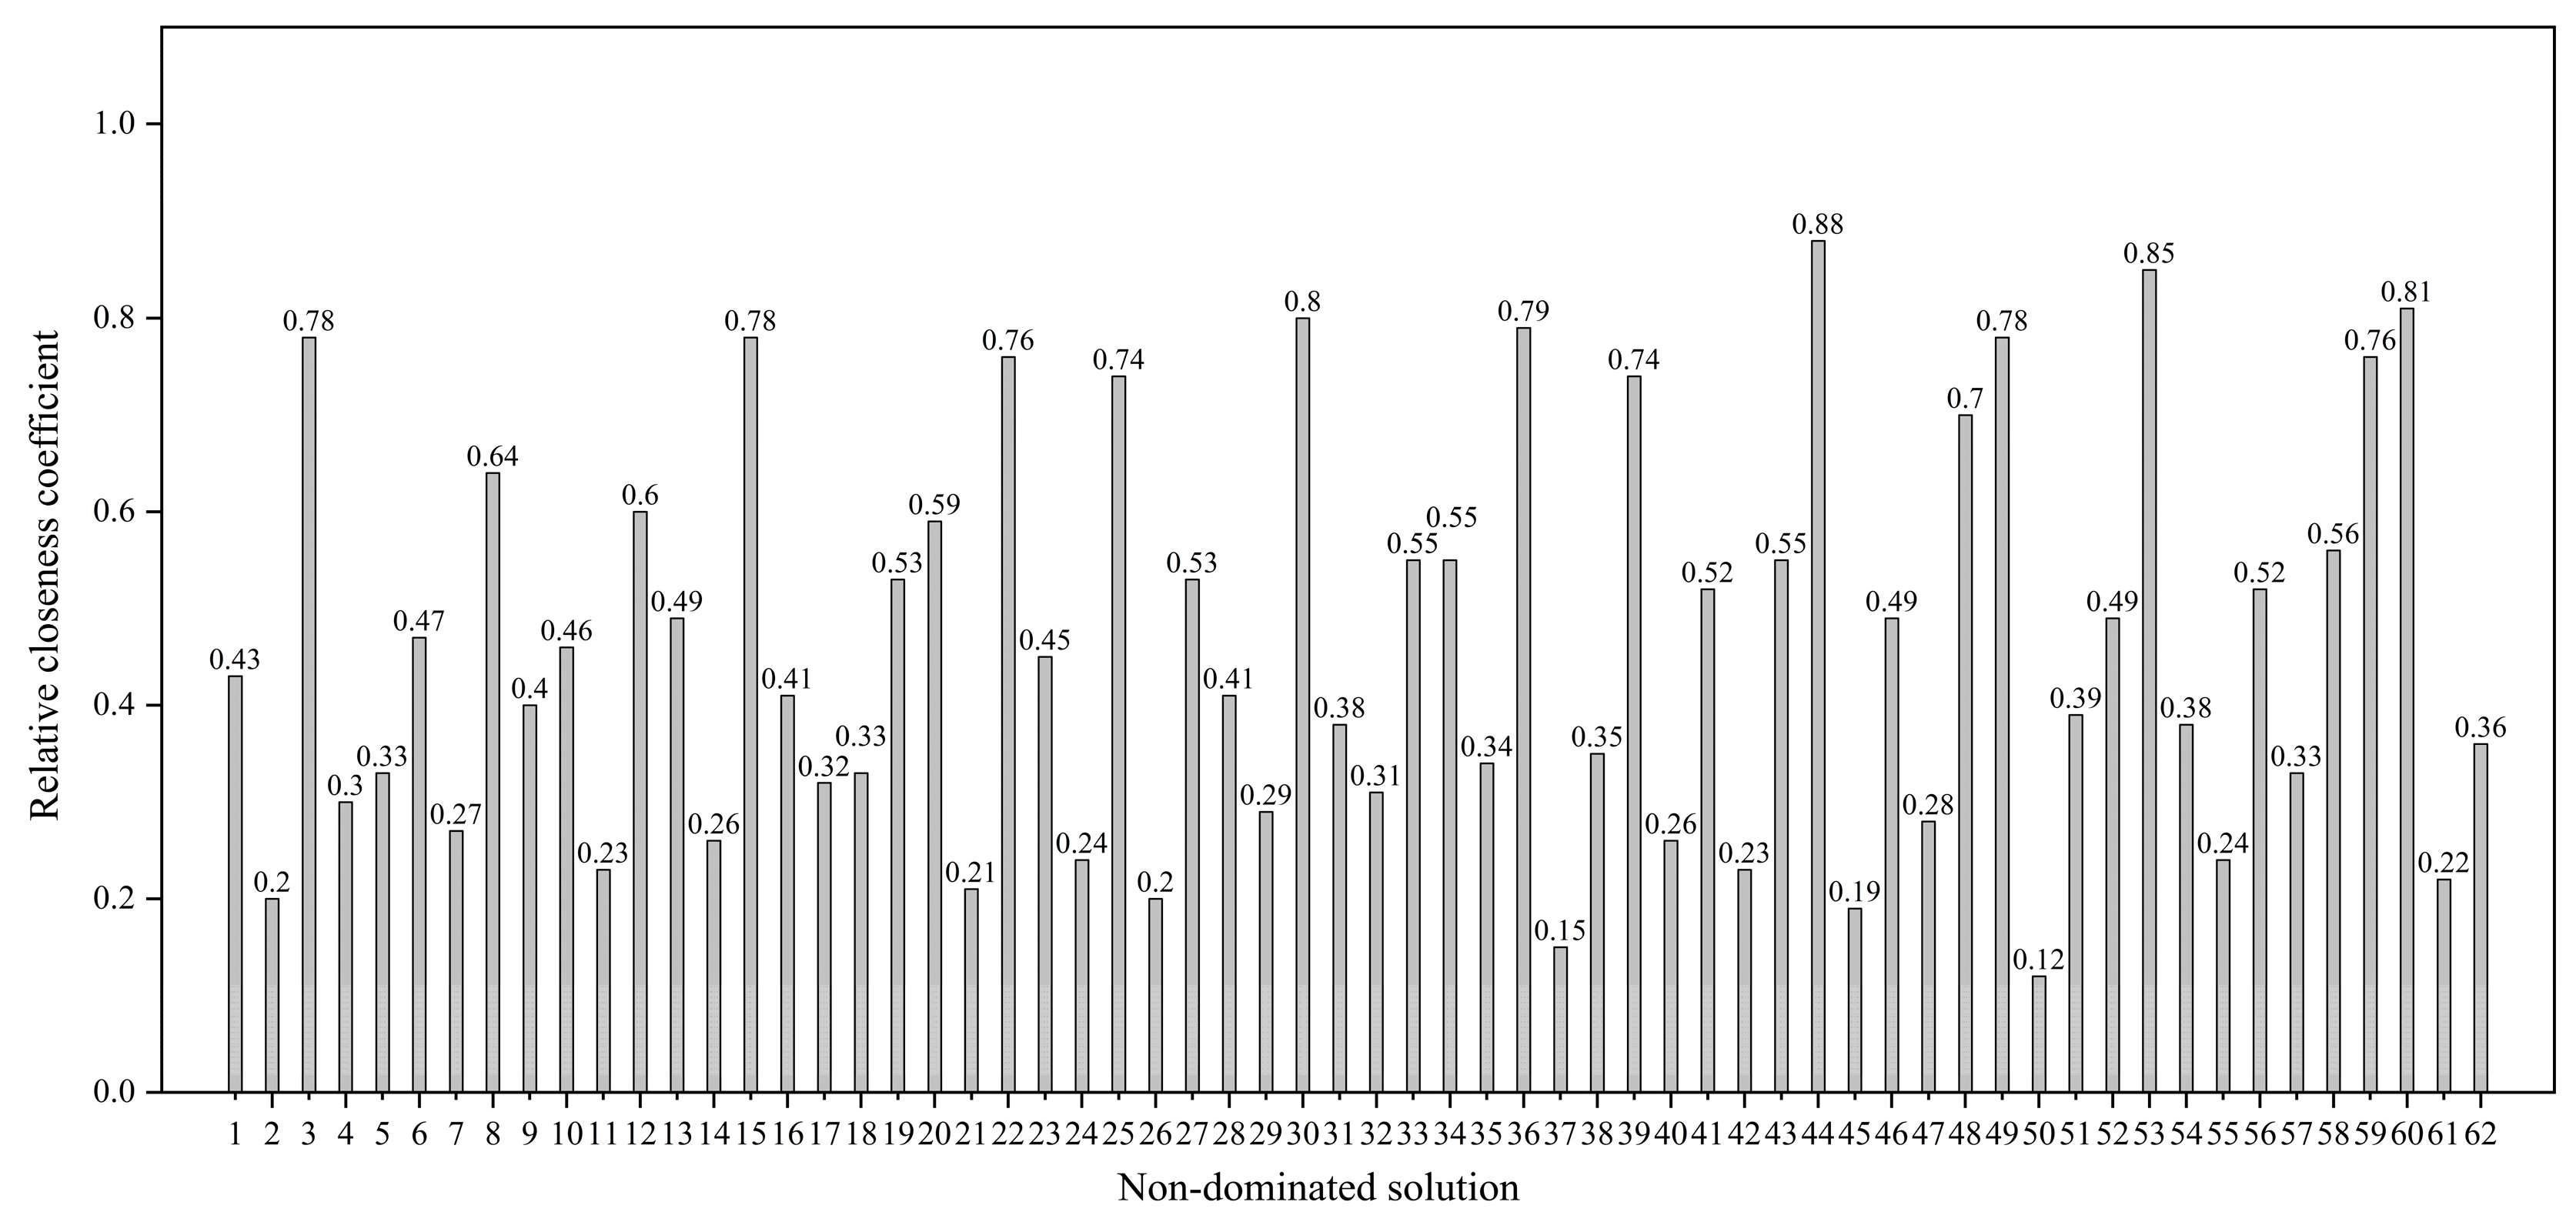
The weights for each optimization objective were obtained using the entropy method. As shown in Table 8 and Table 9, the weight distributions for the two buildings exhibited opposite patterns: for Building A, EUI dominated with a weight of 94.9%, while for Building B, UDI was the most critical objective with a weight of 84.65%. In Building A, PPD (2.78%) and UDI (1.54%) served as secondary indicators, with ICDC (0.78%) contributing minimally; in Building B, ICDC (9.63%) and PPD (5.34%) followed UDI, while EUI (0.38%) had the least influence. The entropy values approaching unity and utility values approaching zero indicate minimal variation in the corresponding indicators across the Pareto solutions, which is an inherent feature of the entropy weight method. As shown in Figure 22, the non-dominated solution No. 13, which had the largest relative closeness coefficient, was selected as the optimal solution for Building A. For Building B, as shown in Figure 23, the non-dominated solution No. 44 was selected as the optimal solution.
The optimal values of the key design parameters for Building A with the regenerated layout are listed in Table 10. After decision-making, UDI increased by 12.52% compared to that for the prototypical model with the regenerated layout. The PPD exhibited the most significant improvement, decreasing by 24.08%. In contrast, the reduction in indoor carbon dioxide concentration was relatively less pronounced, with a decrease of 6.67%, while EUI was reduced by 12.5%. The optimal values of the key design parameters for Building B are listed in Table 11. The most substantial improvement was observed in indoor carbon dioxide concentration, which decreased by 27.83% compared to that of the prototypical model with the regenerated layout. UDI improved by 4.15%, PPD was reduced by 11.17%, and EUI was reduced by 8.1%.

4.3. Structural Strengthening Design Schemes and Seismic Performance Analysis

4.3.1. Structural Strengthening Design Schemes

In response to renovation actions such as creating openings in load-bearing walls and partial wall removal during layout regeneration design, structural safety verification was conducted using PKPM software, with emphasis placed on the internal force redistribution characteristics and vulnerable locations under both vertical and seismic loads. The results revealed that load-bearing walls with opening ratios exceeding 15% exhibited significant stress concentration, and units with partially removed transverse walls suffered from aggravated torsional effects, with the inter-story drift ratio reaching 1/780, which exceeded the specified limit of 1/1200 [38]. The compressive stress ratio of the wall segments after opening reached 0.87, approaching the design value of masonry compressive strength of 0.9 [38], indicating that priority should be given to restoring the structural load transfer system through strengthening.
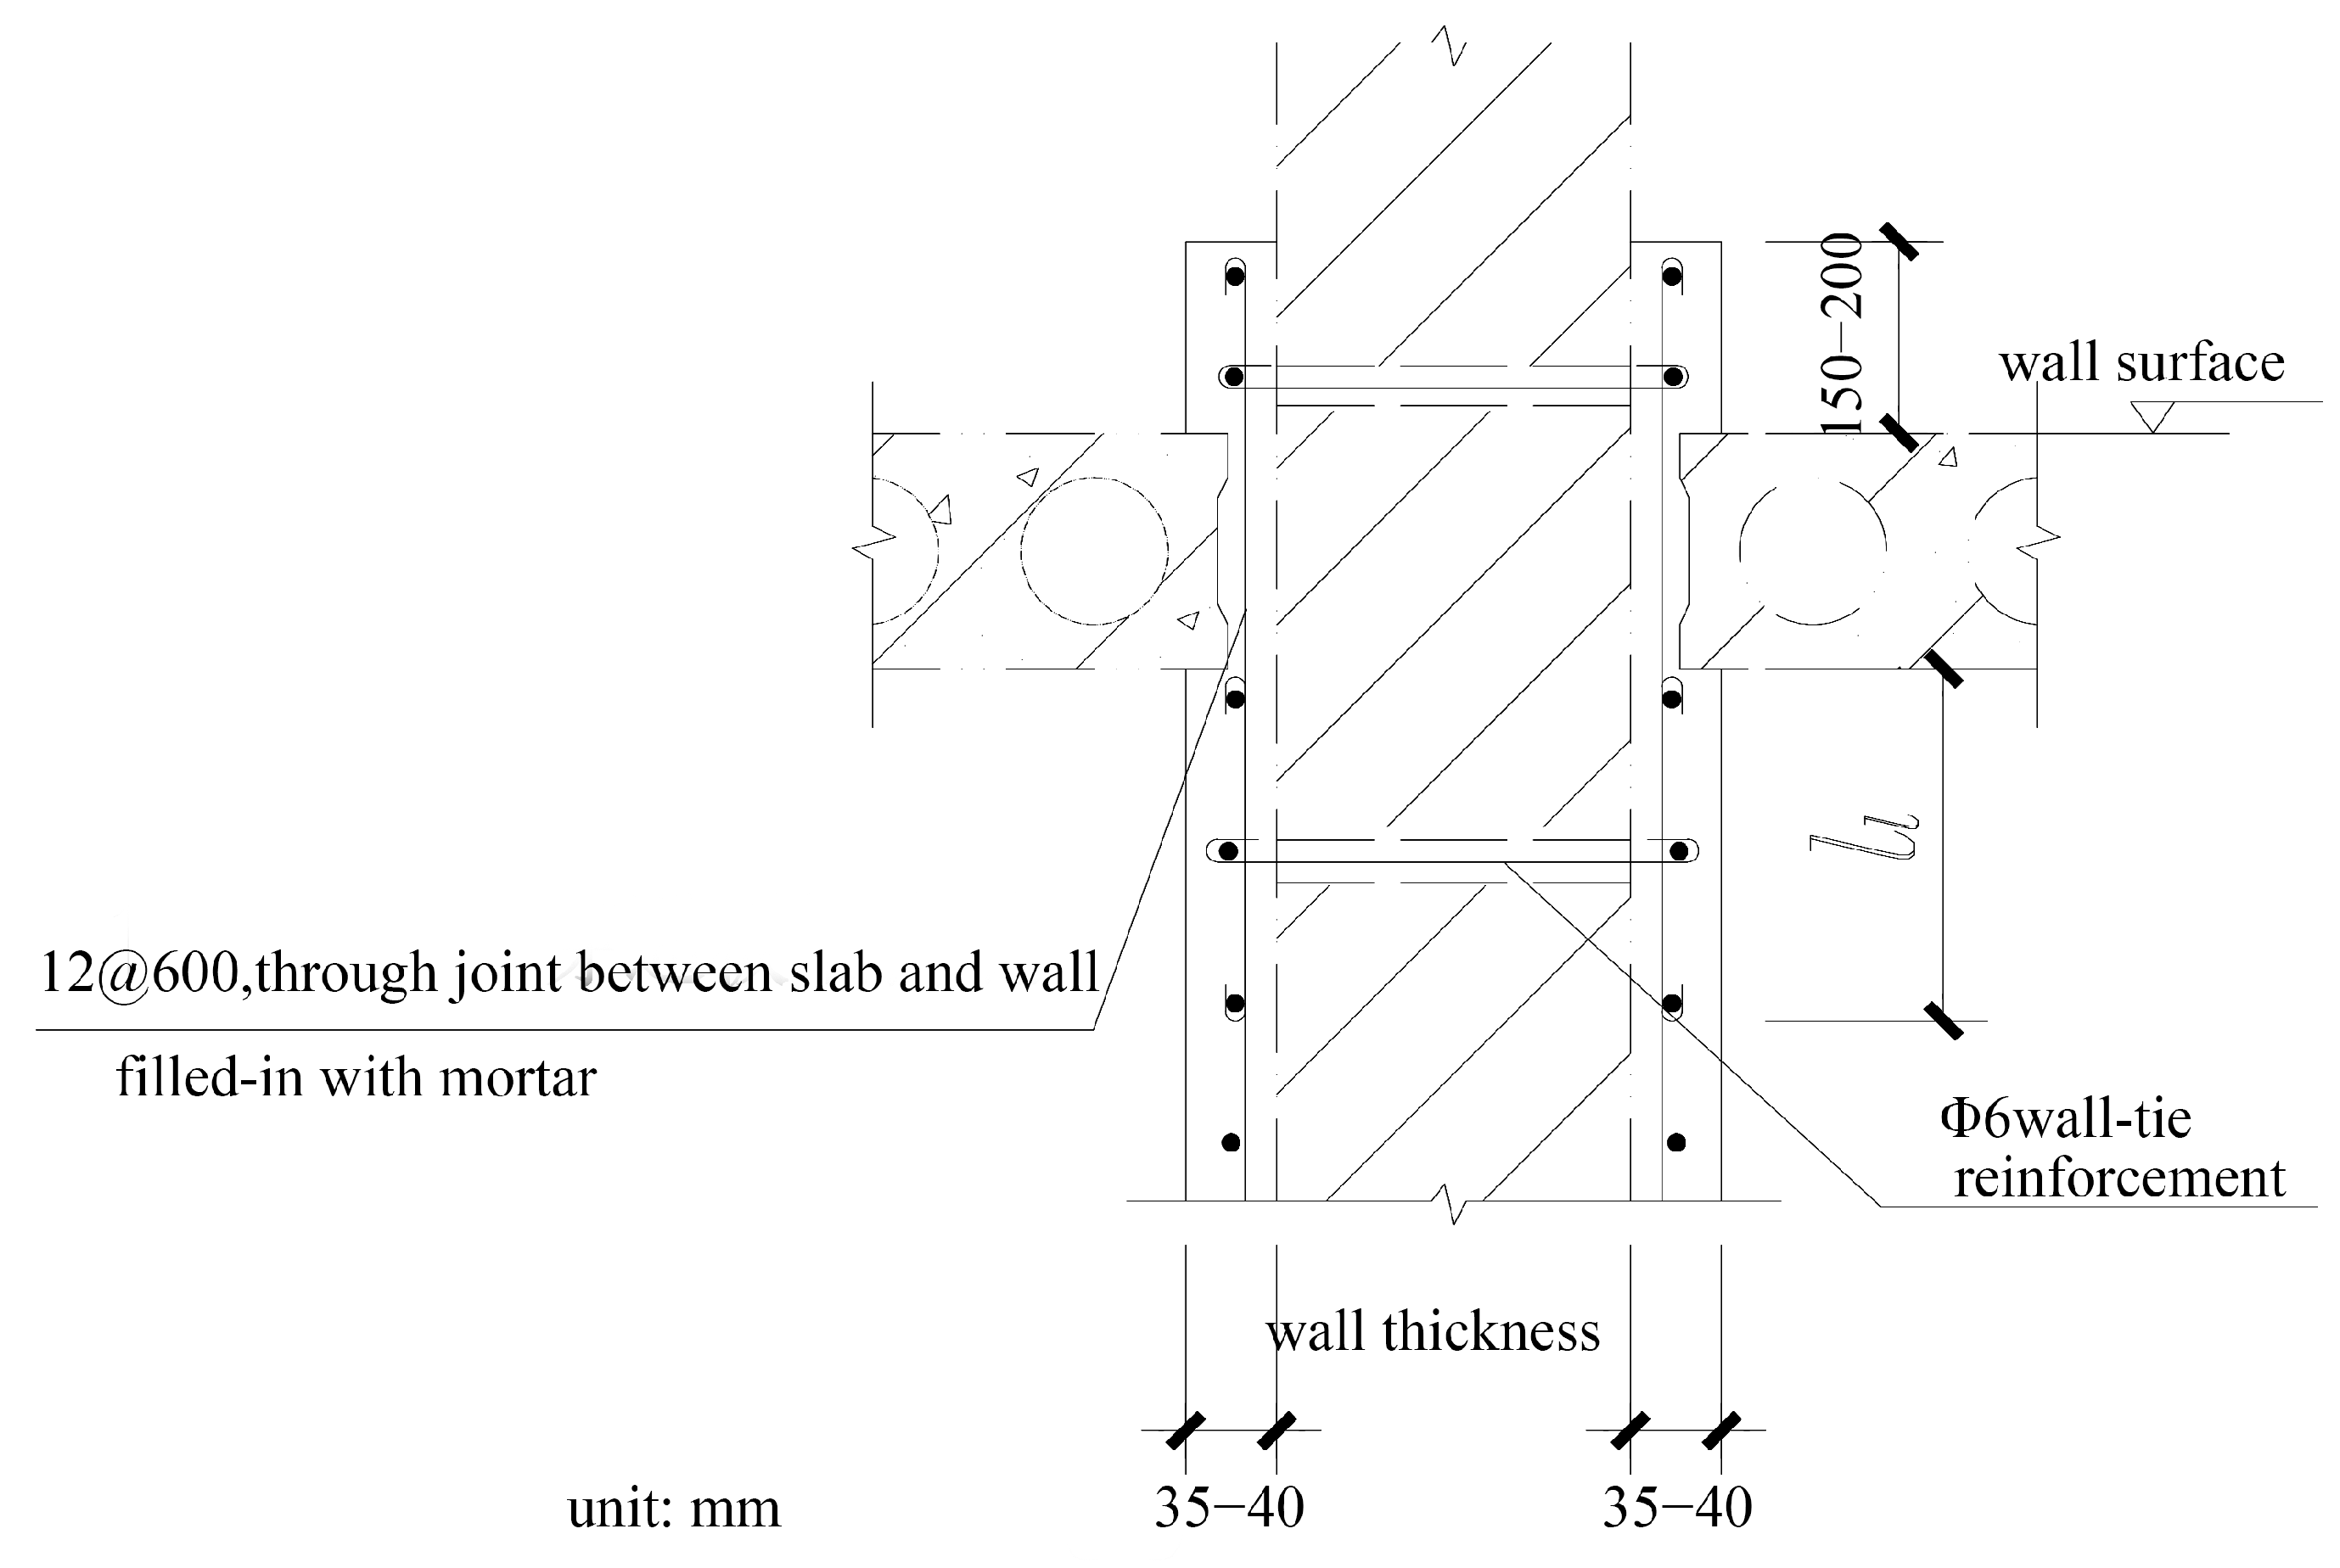
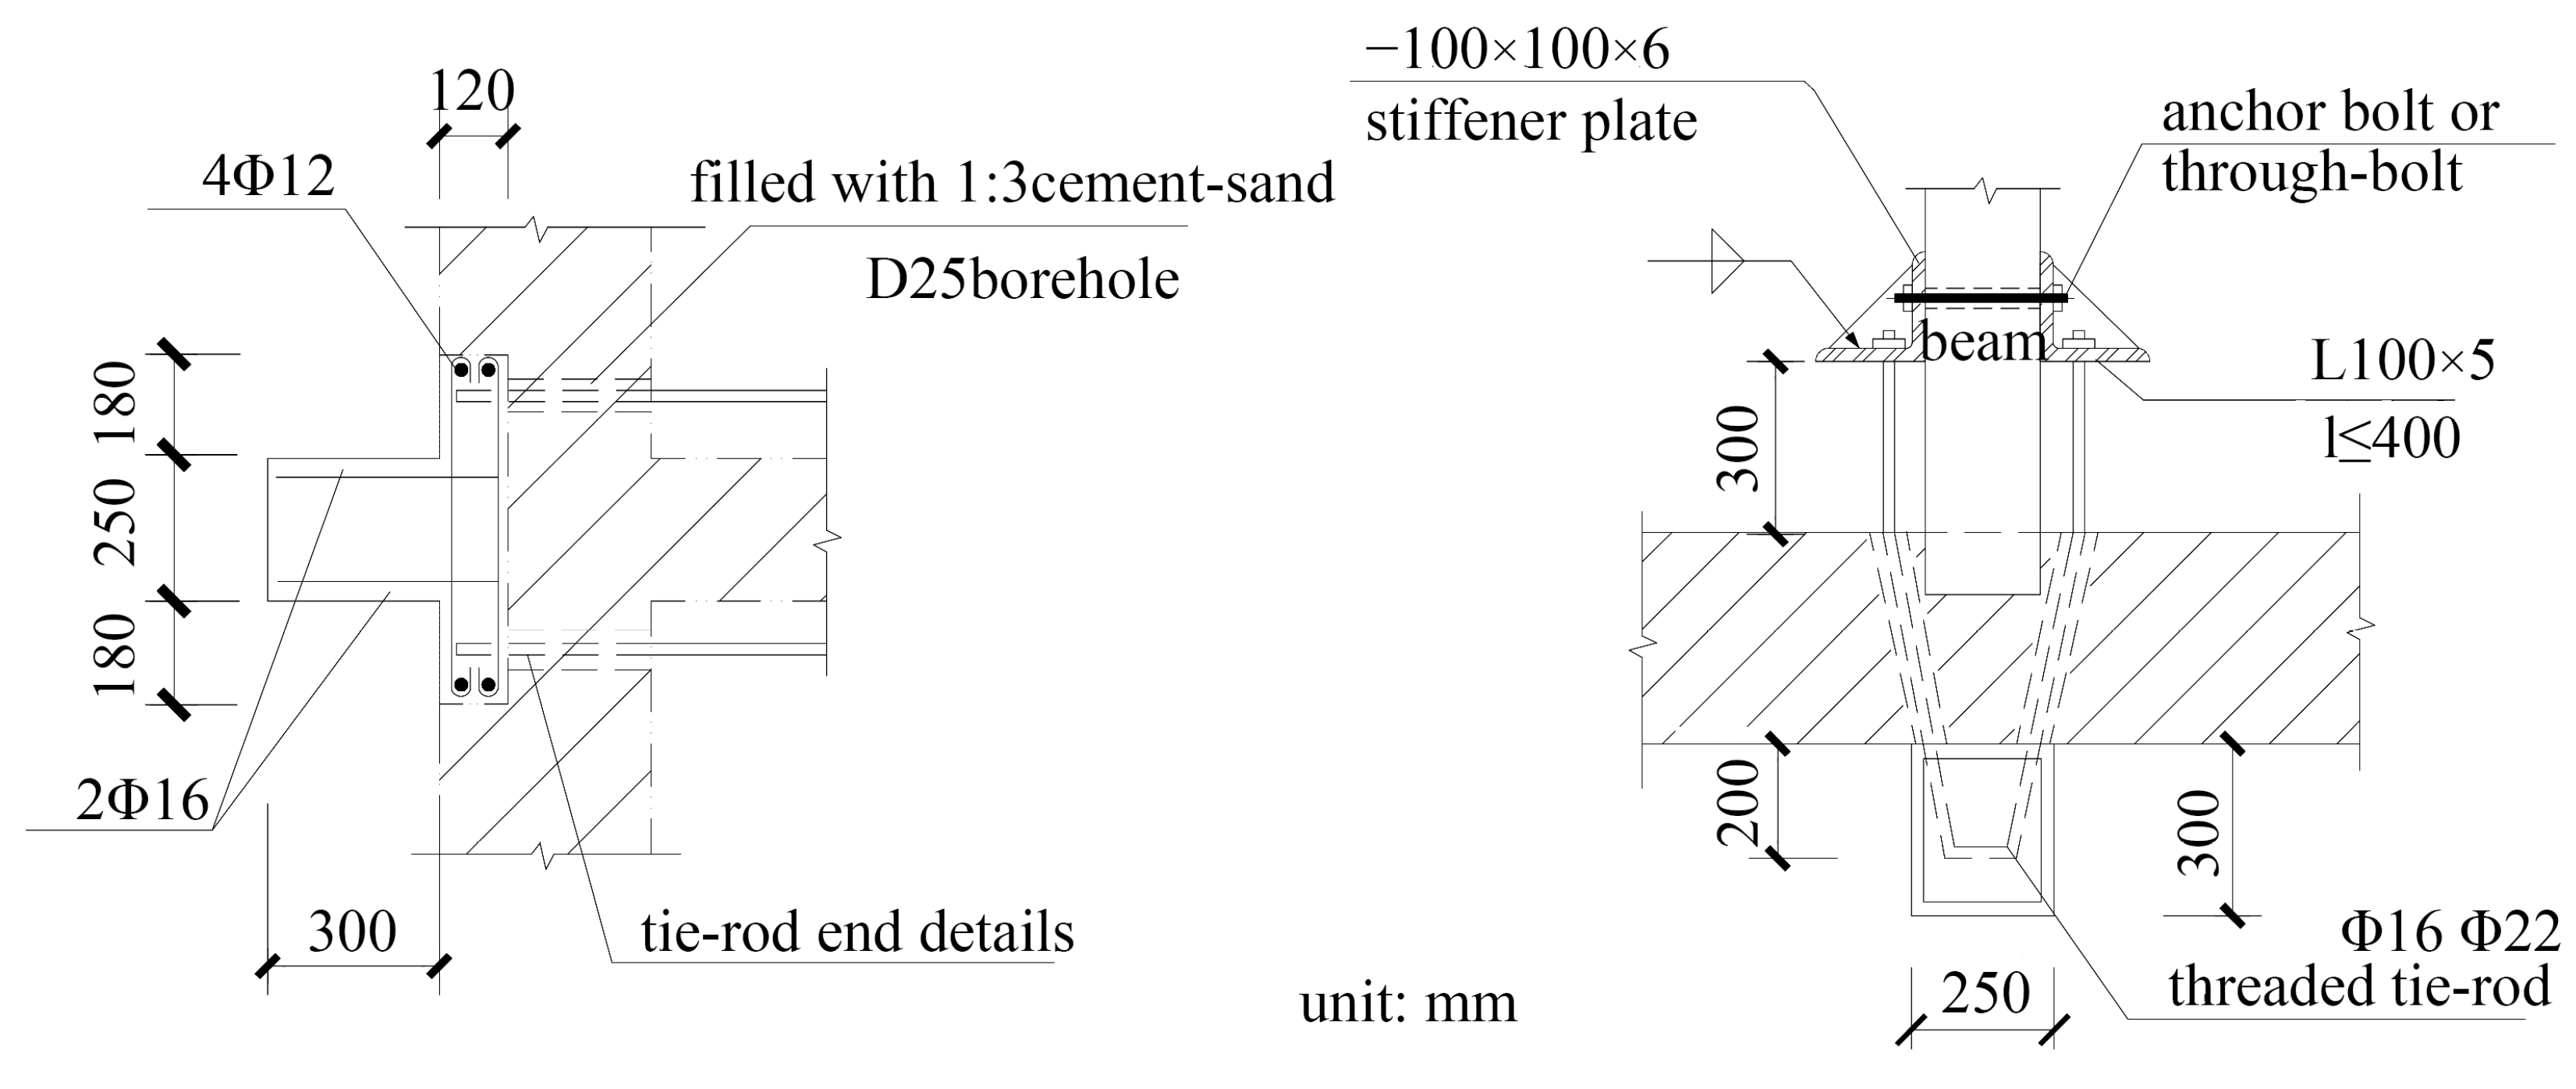
To address the loss of shear capacity caused by wall openings, the double-layer steel-mesh mortar surface layer reinforcement method was adopted, with a steel bar diameter of φ6@150 and surface layer thickness of 40 mm, by which the shear capacity of the walls increased by 30–40%, with minor construction disturbance and good adaptability to existing building retrofitting conditions. For the torsional effects induced by wall removal, reinforced concrete structural columns were added, constructed with C25 concrete and a cross-section of 240 mm × 360 mm, forming a local restraint system together with ring beams, and the structural torsional stiffness was improved. Meanwhile, H-shaped steel beams (HM300×200×8×12) were embedded at the locations where walls were removed, spanning the removed wall areas. PKPM-based verification of the load transfer path was conducted to ensure that vertical loads were effectively transmitted through the steel beams to the adjacent unremoved walls. Reinforcement details and structural joint configurations are provided in Figure 24 and Figure 25.

4.3.2. Seismic Performance Analysis

According to the formula for calculating the shear capacity of masonry structures, the shear capacity ratios of all stories in both buildings were confirmed to be greater than 1.0, as shown in Table 12, thereby satisfying seismic requirements. The shear capacity was observed to gradually increase from the sixth story to the first story, which is consistent with the pattern of higher forces being resisted by lower stories. The capacity ratios in the X and Y directions were found to be close to each other, indicating uniform stiffness distribution in the structure.
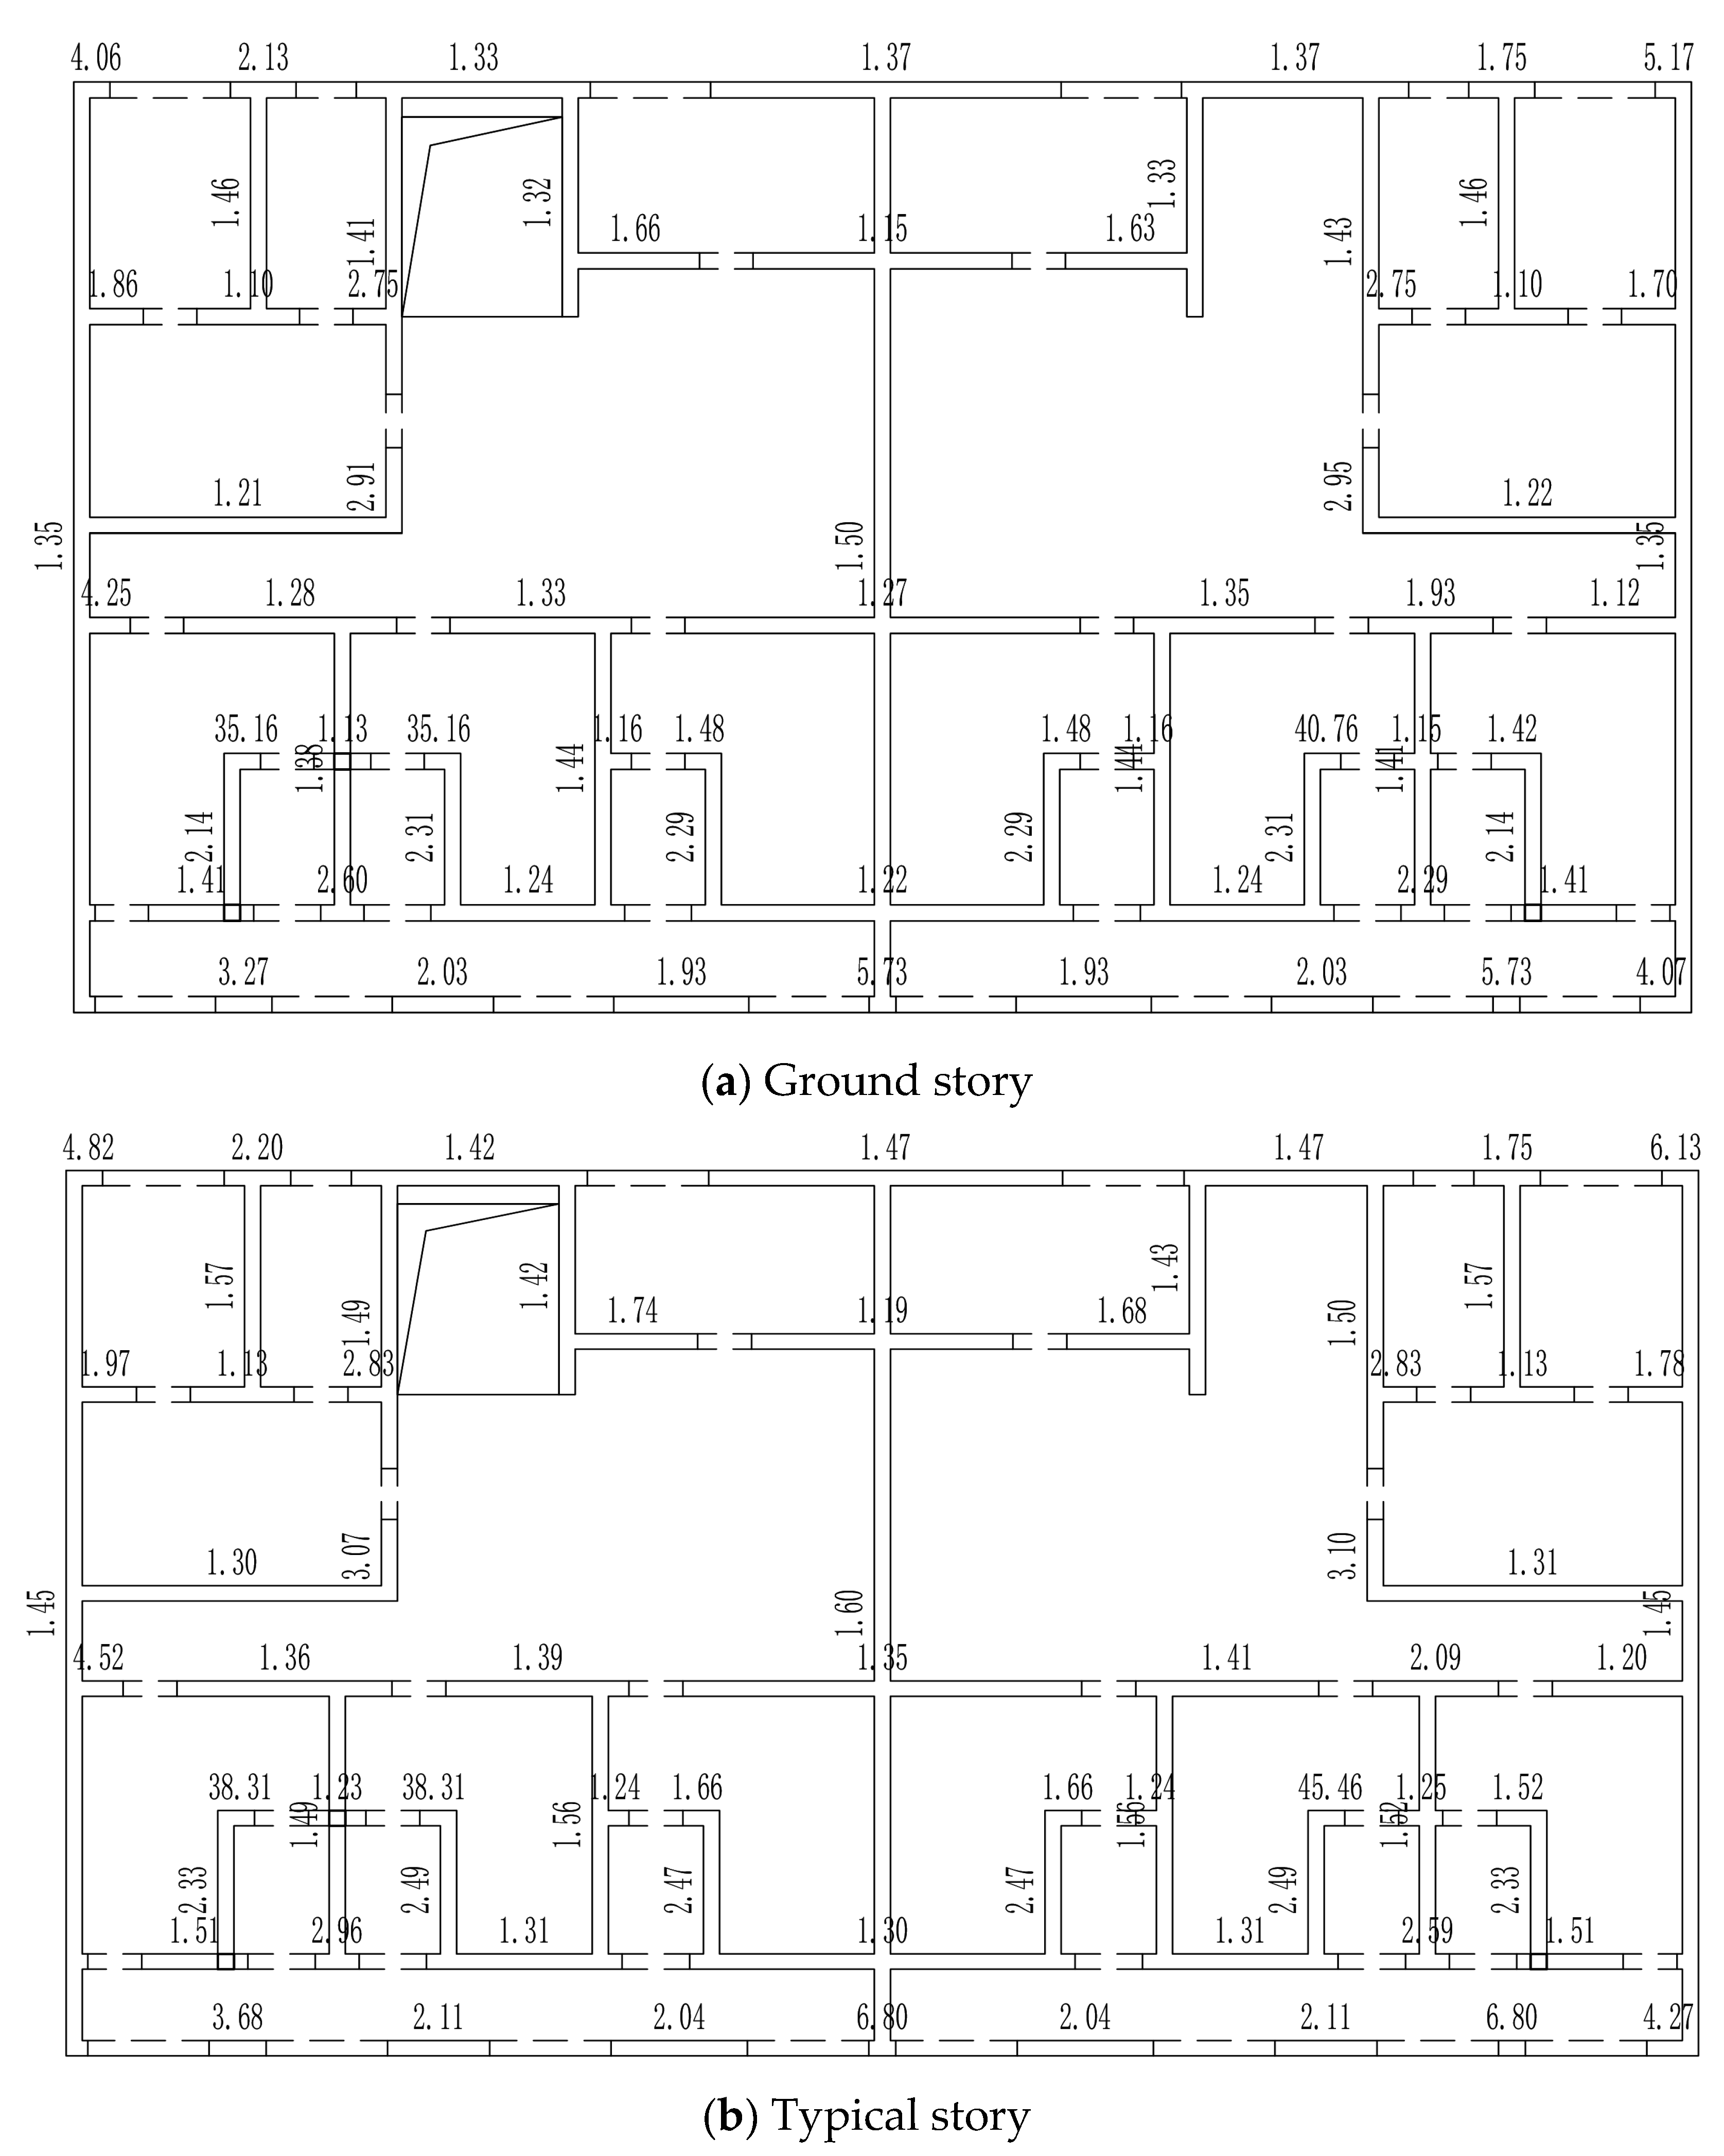
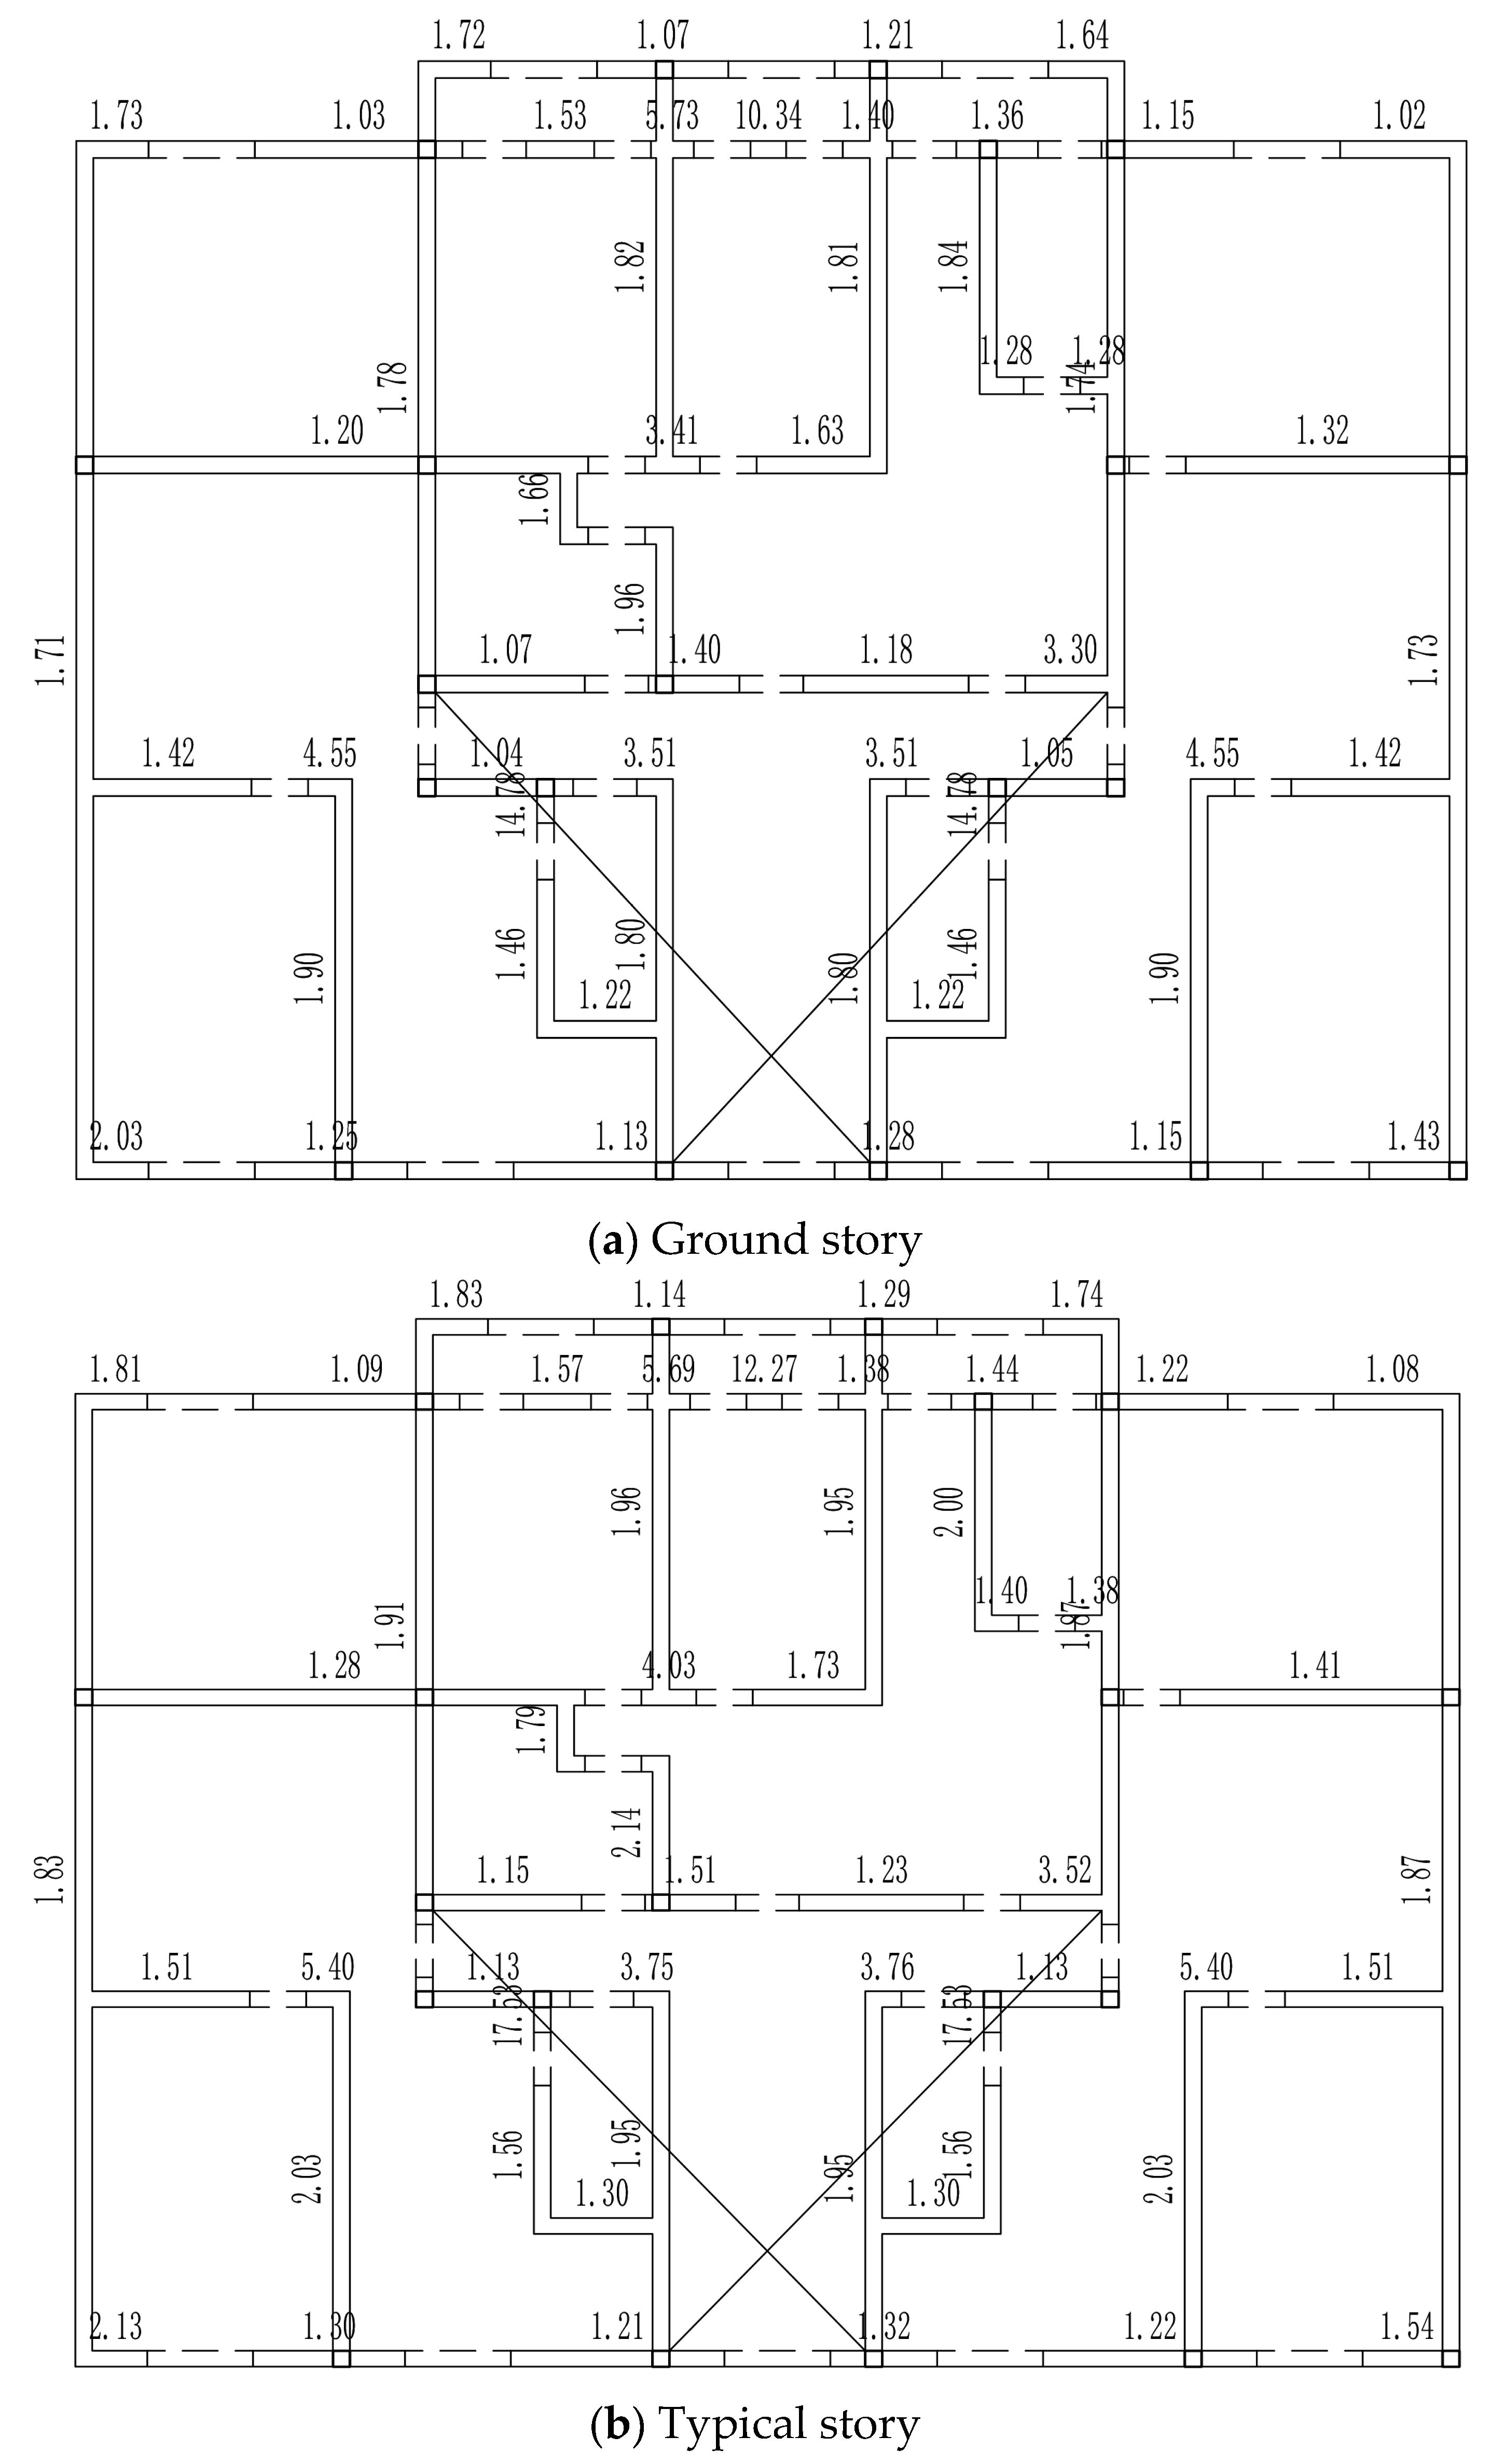
Furthermore, through secondary verification using PKPM, the comprehensive seismic capacity indices for stories and wall segments were calculated according to a fortification intensity of 8 degrees. Figure 26 shows the secondary seismic verification diagrams for the ground story (i.e., the first story) and the typical story (i.e., the third story) of Building A, and Figure 27 shows those for Building B. Table 13 lists the parameters of various coefficients from the secondary seismic verification for the ground floor of both buildings. As shown in the seismic verification results, although the ground floor carried the largest shear force, all stories exhibited shear capacity ratios well above 1.0, indicating an adequate seismic reserve and a uniform distribution of lateral resistance without evident weak stories.

5. Conclusions

In this study, an integrated renovation approach for layout regeneration design, multi-performance optimization, and structural verification of aging residential buildings transformed into public rental housing was proposed. The main conclusions are drawn as follows:
(1)
A modular layout regeneration strategy was developed based on the prototypical models of aging residential buildings. Through co-living and unit integration modes, spatial layouts were flexibly tailored to different household structures. The strategy is characterized by the decomposition and reorganization of residential functions into standardized modules, thereby overcoming the monotony of the original layouts and achieving higher spatial efficiency and improved shared space utilization. The co-living mode is better suited for single or young tenants, while the unit integration mode is more appropriate for family households.
(2)
Furthermore, as revealed by the entropy weight analysis, under the co-living mode, energy consumption was the dominant concern, while under the unit integration mode, daylighting became the primary performance bottleneck.
(3)
The optimal parameters for both aging residential buildings with the regenerated layouts were determined, and significant performance improvements were achieved compared to the prototypical models after the regeneration of the layouts. For Building A, the predicted percentage of dissatisfied exhibited the greatest improvement, decreasing by 24.08%, followed by energy use intensity, which was reduced by 12.5%. For Building B, indoor carbon dioxide concentration showed the most substantial reduction, with a decrease of 27.83%, while useful daylight illuminance had the smallest improvement, increasing by 4.15%.
(4)
Structural strengthening and seismic verification were carried out for the masonry structures after layout regeneration. The post-strengthening verification confirmed that all stories satisfied both the shear capacity ratio and secondary seismic assessment requirements under a fortification intensity of 8 degrees, demonstrating that the proposed layout regeneration strategies are structurally feasible.
While a systematic optimization framework was provided by this study, certain limitations should be noted. The current work is primarily focused on passive design strategies. Therefore, the integration of active and passive technologies, such as renewable energy systems, and the incorporation of life cycle carbon emission assessment are recommended for future research. In addition, the passive strategies obtained by multi-performance optimization achieved measurable performance improvements in aging residential buildings. However, the extent of improvement was constrained by the inherent limitations of the case buildings. Further validation across a wider range of building layouts is also needed to develop more universal design guidelines.

Author Contributions

Conceptualization, S.Y.; Methodology, X.L.; Investigation, X.L.; Validation, Y.Z. and R.S.; Formal Analysis, Y.L.; Writing—Original Draft Preparation, Y.L.; Writing—Review and Editing, M.L. and S.Y.; Supervision, M.L.; Project Administration, S.Y.; Funding Acquisition, S.Y. All authors have read and agreed to the published version of the manuscript.

Funding

This research was supported by the Hebei Social Science Foundation (No. HB25SH014).

Data Availability Statement

The original contributions presented in this study are included in the article. Further inquiries can be directed to the corresponding author.

Conflicts of Interest

The authors declare no conflicts of interest.

Appendix A

Table A1. Functional rooms for one-bedroom units (m2).
Type NumberGross AreaEntrance HallIntegrated Dining-Living-Sleeping AreaKitchenBathroomBalcony
135.51.116.23.93.11.0
234.22.114.13.72.61.4
336.51.116.33.83.11.0
434.72.114.13.72.61.3
537.21.116.23.93.11.0
632.14.110.42.92.12.7
Average area35.031.9314.563.642.771.4
Proportion 5.5%41.54%10.4%7.9%4%
Table A2. Functional rooms for two-bedroom units (m2).
Type NumberGross AreaEntrance HallDining AreaLiving RoomMaster BedroomSecondary BedroomKitchenBathroomBalcony
148.31.010.19.05.34.52.61.4
243.21.310.99.17.25.43.62.4
352.51.112.09.05.34.12.91.2
450.11.811.29.55.34.22.61.4
551.61.112.09.05.34.12.91.2
655.13.23.98.49.48.74.53.83.0
753.02.43.08.09.48.74.44.23.8
856.11.45.27.99.76.95.53.92.4
949.60.93.44.99.15.34.12.83.7
1058.01.54.010.59.56.03.54.30.0
1158.51.12.98.69.77.64.03.60.0
1259.92.44.110.19.96.24.24.00.0
1359.71.94.96.79.76.94.13.23.0
Average area53.051.6211.379.386.514.363.422.35
Proportion 3.06%21.43%17.69%12.28%8.21%6.40%4.53%
Table A3. Functional rooms for three-bedroom units (m2).
Type NumberGross AreaEntrance HallDining AreaLiving RoomMaster BedroomSecondary BedroomMulti-Functional RoomKitchenBathroomBalcony
159.82.32.77.29.16.66.53.33.42.9
259.32.34.27.09.57.37.14.13.53.5
357.22.33.77.09.95.77.14.13.82.7
454.52.34.26.09.55.66.44.13.53.5
559.71.12.56.99.75.55.04.13.02.5
Average area 2.063.466.829.546.146.423.943.443.02
Proportion 3.54%5.96%11.74%16.42%10.57%11.05%6.78%5.92%5.20%
Table A4. Basic information of the selected prototypical communities.
CharacteristicCommunity ACommunity B
DistrictNankai DistrictHeping District
Year of construction19951993
Total building floor area70,000 m270,000 m2
Site area38,000 m235,000 m2
Number of buildings227
Number of households1218790
Green space ratio~20%20%
Building density/FAR2.12 (Floor area ratio)1.50 (Building density)
Building formsix-story, north–south oriented slab-type, flat roofseven-story, north–south oriented slab-type, flat roof
LayoutsOne- to three-bedroomOne-, two-, and three-bedroom
Table A5. Original parameters of the prototypical buildings.
ItemBuilding ABuilding B
Number of storiesSix storiesSix stories
Exterior wall constructionStructural layer: 240 mm clay solid brick wall (some buildings may use hollow bricks)Structural layer: 240 mm thick clay solid brick wall (may be partially reinforced later)
Roof constructionPlastering layer: mixed mortar plaster (approx. 15–20 mm)Plastering layer: cement mortar leveling (approx. 20 mm)
Additional insulation boardFinishing layer: paint (original appearance)
Building form parametersWaterproof layer: three-felt four-oil asphalt waterproofing (now aged)Surface layer: asphalt felt waterproof layer (prone to aging); Insulation layer: slag concrete (approx. 100 mm, poor thermal insulation); Structural layer: precast hollow floor slabs
Exterior window typeInsulation layer: slag concrete (approx. 80 mm, poor thermal insulation)No insulation system
Roof formStructural layer: precast concrete hollow slab0.4
Table A6. Personnel occupancy rate (%).
Time 01234567891011
BedroomWeekday10010010010010010010000000
Weekend100100100100100100100050505050
Living roomWeekday000000000000
Weekend0000000050505050
Kitchen 00000001000000
BathroomWeekday00000050500000
Weekend000000505010101010
BalconyWeekday00000010100000
Weekend000000101010101010
Time 121314151617181920212223
BedroomWeekday00000000050100100
Weekend001001000000050100100
Living roomWeekday00000001001005000
Weekend05050505050 1001005000
Kitchen 1000000010000000
BathroomWeekday0000001010505000
Weekend1010101010101010505000
BalconyWeekday000000010101000
Weekend1010101010101010505000
Table A7. Equipment utilization rate (%).
Time 01234567891011
Bedroom 0000000100100000
Living room Weekday000000000000
Weekend0000000501001005050
Kitchen 00000001000000
Bathroom 000000000000
Balcony 000000000000
Time 121314151617181920212223
Bedroom 00000000501001000
Living room Weekday000000010010010000
Weekend100100505050501001001005000
Kitchen 1000000010000000
Bathroom 00000000050500
Balcony 000000000000
Table A8. Lighting-on rate (%).
Time 01234567891011
Bedroom 0000000500000
Living room 000000000000
Kitchen 00000001000000
BathroomWeekday00000050500000
Weekend00000010100000
Balcony 000000101010101010
Time 121314151617181920212223
Bedroom 000000010010010000
Living room 00000001001005000
Kitchen 00000010000000
BathroomWeekday0000001010505000
Weekend1010101010101010505000
Balcony 00000000101000

References

  1. Cao, Y.; Yi, D.; Huang, Y.; Zhu, Y. Mismatches between the Supply and Demand of Public Rental Housing in Chinese Cities. Sustainability 2024, 16, 8358. [Google Scholar] [CrossRef] [Scilit]
  2. General Office of the State Council of the People’s Republic of China. Opinions on Accelerating the Development of Government-Subsidized Rental Housing: Guobanfa [2021] No. 22. 2021. Available online: https://www.gov.cn/zhengce/content/2021-07/02/content_5622027.htm (accessed on 20 July 2026).
  3. Li, Y. Preliminary Study on Livable Design of Public Rental Housing: A Public Rental Housing Design in Jiading District, Shanghai. Urban Constr. Theor. Res. Urban Constr. 2025, 13, 64–66. [Google Scholar]
  4. Zhu, X.; Wang, B.; Yu, W. Correlation between Family Structure and Multi-generational Living Space: A Case Study of Affordable Housing Unit Types in Guangzhou. South Archit. 2020, 6, 8–14. [Google Scholar]
  5. Federal Ministry of Housing. Sozial Wohnungsbau-Richtlinien (German Social Housing Construction Standards); Federal Ministry of Housing: Berlin, Germany, 2020. [Google Scholar]
  6. Lee, J.E.; Park, Y.J. A framework for applying off-site construction methods integrated with site conditions and equipment to renovate Seoul’s aging public rental housing. J. Archit. Inst. Korea 2025, 41, 159–168. [Google Scholar]
  7. Gong, Q.; Ding, W.; Liu, X.; Zeng, Y.; Adu, E.; Shao, H. Multi-objective optimization framework for the building envelope of public rental housing in China’s cold regions. J. Build. Eng. 2025, 104, 112261. [Google Scholar] [CrossRef] [Scilit]
  8. Ge, J.; Zhao, Y.; Luo, X.; Lin, M. Study on the suitability of green building technology for affordable housing: A case study on Zhejiang Province, China. J. Clean. Prod. 2020, 275, 122685. [Google Scholar] [CrossRef] [Scilit]
  9. Wu, C.; Pan, H.; Luo, Z.; Liu, C.; Huang, H. Multi-objective optimization of residential building energy consumption, daylighting, and thermal comfort based on BO-XGBoost-NSGA-II. Build. Environ. 2024, 254, 111386. [Google Scholar] [CrossRef] [Scilit]
  10. Yao, S.; Li, M.; Yuan, J.; Huo, Q.; Zhao, S.; Wu, Y. Optimization design of layout dimension for residential buildings weighing up daylighting, thermal comfort, and indoor air quality with a low-carbon decision-making. J. Build. Eng. 2024, 98, 111328. [Google Scholar] [CrossRef] [Scilit]
  11. Ouda, E.; Ghunaim, A.; Belkacem, A.N. Multi-Objective Optimization of Residential Layout and Envelope Design for Daylight, Thermal Comfort, and Cooling Energy in Hot-Arid Climates. IEEE Access 2026, 14, 104105–104121. [Google Scholar] [CrossRef] [Scilit]
  12. Caprili, S.; Chellini, G.; Mattei, F.; Salvatore, W.; Simonetti, G.; Badalassi, M. Lightly reinforced concrete walls in formwork blocks for the combined seismic and energy retrofit of masonry structures. Eng. Struct. 2024, 303, 117573. [Google Scholar] [CrossRef] [Scilit]
  13. Furtado, A.; Rodrigues, H.; Arêde, A.; Varum, H. A experimental characterization of seismic plus thermal energy retrofitting techniques for masonry infill walls. J. Build. Eng. 2023, 75, 106854. [Google Scholar] [CrossRef] [Scilit]
  14. Wan, Z.; Chen, J.; Ge, W.; Zhang, R.; Hu, Y.; Wang, Y.; Yuang, S.; Sun, C. Cyclic loading test for brick masonry walls strengthened by steel mesh-ECC layers. Mater. Sci.-Pol. 2026, 43, 243–266. [Google Scholar] [CrossRef] [Scilit]
  15. Gao, P.; Nor, M.F.I.M.; Sulaiman, M.K.A.M. Closing the selection gap in passive retrofit optimization: A pathway-based framework for resident-informed selection in old residential buildings in cold-region China. Energy Build. 2026, 368, 117807. [Google Scholar] [CrossRef] [Scilit]
  16. Pohoryles, D.A.; Bournas, D.A.; Da Porto, F.; Caprino, A.; Santarsiero, G.; Triantafillou, T. Integrated seismic and energy retrofitting of existing buildings: A state-of-the-art review. J. Build. Eng. 2022, 61, 105274. [Google Scholar] [CrossRef] [Scilit]
  17. Nabil, A.; Mardaljevic, J. Useful daylight illuminance: A new paradigm for assessing daylight in buildings. Light. Res. Technol. 2005, 37, 41–59. [Google Scholar] [CrossRef] [Scilit]
  18. Mardaljevic, J.; Nabil, A. Useful daylight illuminances: A replacement for daylight factors. Energy Build. 2006, 38, 905–913. [Google Scholar] [CrossRef] [Scilit]
  19. Fanger, P.O. Thermal Comfort: Analysis and Applications in Environmental Engineering; McGraw-Hill: New York, NY, USA, 1970. [Google Scholar]
  20. ISO 7730:2005; Ergonomics of the Thermal Environment—Analytical Determination and Interpretation of Thermal Comfort Using Calculation of the PMV and PPD Indices and Local Thermal Comfort Criteria. ISO: Geneva, Switzerland, 2005.
  21. Wang, X.; Yang, L.; Dai, Q. Optimization of Architectural Interior Design Parameters Based on Environmental Dynamic Heat Dissipation Principle and Thermal Comfort Standard. Int. Energy J. 2025, 25, 593–604. [Google Scholar] [CrossRef] [Scilit]
  22. Kendall, M.G. A new measure of rank correlation. Biometrika 1938, 30, 81–93. [Google Scholar] [CrossRef] [Scilit]
  23. Saboor, S.; Chelliah, A.; Gorantla, K.K.; Kim, K.-H.; Lee, S.-H.; Shon, Z.H.; Brown, R.J.C. Strategic design of wall envelopes for the enhancement of building thermal performance at reduced air-conditioning costs. Environ. Res. 2021, 193, 110577. [Google Scholar] [CrossRef] [Scilit] [PubMed]
  24. Gustavsen, A.; Grynning, S.; Arasteh, D.; Jelle, B.P.; Goudey, H. Key elements of and material performance targets for highly insulating window frames. Energy Build. 2011, 43, 2583–2594. [Google Scholar] [CrossRef] [Scilit]
  25. Amer, L.A.H.; Saad, L.E.E. The effect of openings ratio and wall thickness on energy performance in educational buildings. Int. J. Low-Carbon Technol. 2020, 15, 155–163. [Google Scholar] [CrossRef] [Scilit]
  26. Madabhushi, A.; Tenpierik, M.; Luna-Navarro, A. The Impact of Occupant Window Operation on Indoor Temperature and Air Quality during the Cooling Season. In Multiphysics and Multiscale Building Physics; Springer Nature: Singapore, 2025. [Google Scholar]
  27. Saltelli, A.; Ratto, M.; Andres, T.; Campolongo, F.; Cariboni, J.; Gatelli, D.; Saisana, M.; Tarantola, S. Global Sensitivity Analysis: The Primer; Wiley: New York, NY, USA, 2008. [Google Scholar]
  28. Iman, R.L.; Conover, W.J. A distribution-free approach to inducing rank correlation among input variables. Commun. Stat.-Simul. Comput. 1982, 11, 311–334. [Google Scholar] [CrossRef] [Scilit]
  29. Zhang, X.; Arhonditsis, G.B. Sensitivity analysis of a water quality model using Latin hypercube sampling and partial rank correlation coefficients. J. Hydrol. 2009, 367, 232–242. [Google Scholar]
  30. Helton, J.C.; Davis, F.J. Latin hypercube sampling and the propagation of uncertainty in analyses of complex systems. Reliab. Eng. Syst. Saf. 2003, 81, 23–69. [Google Scholar] [CrossRef] [Scilit]
  31. Collette, Y.; Siarry, P. Multi-Objective Optimization: Principles and Case Studies; Springer: Berlin/Heidelberg, Germany, 2004; pp. 12–25. [Google Scholar]
  32. Deb, K.; Pratap, A.; Agarwal, S.; Meyarivan, T. A fast and elitist multiobjective genetic algorithm: NSGA-II. IEEE Trans. Evol. Comput. 2002, 6, 182–197. [Google Scholar] [CrossRef] [Scilit]
  33. Hwang, C.L.; Yoon, K. Multiple Attribute Decision Making: Methods and Applications; Springer: New York, NY, USA, 1981. [Google Scholar]
  34. Diao, R.; Cao, Y.; Sun, L.; Xu, C.; Yang, F. Optimization of the Energy-Saving Building Envelopes in Regional Climate. Buildings 2024, 14, 320. [Google Scholar] [CrossRef] [Scilit]
  35. Deng, K.; Cui, Y.; Deng, Q.; Liu, R.; Chen, Z.; Wang, S. Multi-Objective Optimization of Urban Residential Envelope Structures in Cold Regions of China Based on Performance and Economic Efficiency. Buildings 2025, 15, 2365. [Google Scholar] [CrossRef] [Scilit]
  36. GB 50009-2012; Load Code for the Design of Building Structures. China Architecture & Building Press: Beijing, China, 2012.
  37. GB 50003-2011; Code for Design of Masonry Structures. China Architecture & Building Press: Beijing, China, 2011.
  38. GB 50011-2010; Code for Seismic Design of Buildings. China Architecture & Building Press: Beijing, China, 2010.
  39. GB 50023-2009; Standard for Seismic Appraisal of Buildings. China Architecture & Building Press: Beijing, China, 2009.
  40. Selenium. Selenium WebDriver [Computer Software]. Available online: https://www.selenium.dev/ (accessed on 1 March 2025).
  41. Rhinoceros 3D, Version 7; [Computer software]; Robert McNeel & Associates: Seattle, WA, USA, 2020. Available online: https://www.rhino3d.com/ (accessed on 1 September 2025).
  42. Rutten, D. Grasshopper [Computer Software]; Robert McNeel & Associates: Seattle, WA, USA, 2020; Available online: https://www.grasshopper3d.com/ (accessed on 1 September 2025).
  43. GB/T 50034-2024; Standard for Lighting Design of Buildings. China Architecture & Building Press: Beijing, China, 2024.
  44. JGJ 26-2018; Design Standard for Energy Efficiency of Residential Buildings in Severe Cold and Cold Zones. China Architecture & Building Press: Beijing, China, 2018.
  45. State Council of the People’s Republic of China. Seventh National Population Census Bulletin. 2021. Available online: https://www.gov.cn/guoqing/2021-05/13/content_5606147.htm (accessed on 20 July 2026).
  46. GB/T 51366-2019; Standard for Building Carbon Emission Calculation. China Architecture & Building Press: Beijing, China, 2019.
  47. GB/T 5699-2017; Method of Daylighting Measurements. China Architecture & Building Press: Beijing, China, 2017.
  48. GB 50096-2011; Design Code for Residential Buildings. China Architecture & Building Press: Beijing, China, 2011.
  49. China Academy of Building Research. PKPM Structure Series Software, Version 2025; [Computer software]; China Academy of Building Research: Beijing, China, 2025.
  50. GB 50176-2016; Code for Thermal Design of Civil Building. China Architecture & Building Press: Beijing, China, 2016.
Figure 1. Flowchart of research methodology.
Buildings 16 03729 g001
Figure 2. Household structures and demand of occupants.
Buildings 16 03729 g002
Figure 3. Importance of functional rooms in public rental housing by different household types.
Buildings 16 03729 g003
Figure 4. Modular coordination system diagram.
Buildings 16 03729 g004
Figure 5. Schematic diagram of the dimensions for functional rooms.
Buildings 16 03729 g005
Figure 6. Schematic diagram of complex space and space-intensive design.
Buildings 16 03729 g006
Figure 7. Type of layout unit.
Buildings 16 03729 g007
Figure 8. SSE line chart.
Buildings 16 03729 g008
Figure 9. Three-dimensional geometry model and floor plan of Building A.
Buildings 16 03729 g009
Figure 10. Three-dimensional geometry model and floor plan of Building B.
Buildings 16 03729 g010
Figure 11. Layout regeneration design scheme for Building A under Co-living mode.
Buildings 16 03729 g011
Figure 12. Layout regeneration design scheme for Building B under Unit integration mode.
Buildings 16 03729 g012
Figure 13. Correlation analysis of each optimization objective.
Buildings 16 03729 g013
Figure 14. Results of sensitivity analysis for (a) UDI, (b) PPD, (c) ICDC, and (d) EUI.
Buildings 16 03729 g014aBuildings 16 03729 g014b
Figure 15. Hypervolume indicator of non-dominated solutions in each generation.
Buildings 16 03729 g015
Figure 16. Distribution of non-dominated solutions for Building A.
Buildings 16 03729 g016
Figure 17. Distribution of non-dominated solutions for Building B.
Buildings 16 03729 g017
Figure 18. Violin plots of design parameters in non-dominated solution set for Building A.
Buildings 16 03729 g018aBuildings 16 03729 g018b
Figure 19. Violin plots of design parameters in non-dominated solution set for Building B.
Buildings 16 03729 g019
Figure 20. Violin plots of optimization objectives in non-dominated solution set for Building A.
Buildings 16 03729 g020
Figure 21. Violin plots of objective objectives in non-dominated solution set for Building B.
Buildings 16 03729 g021
Figure 22. TOPSIS evaluation results for Building A.
Buildings 16 03729 g022
Figure 23. TOPSIS evaluation results for Building B.
Buildings 16 03729 g023
Figure 24. Detail of strengthening with steel mesh and cement mortar surface layer.
Buildings 16 03729 g024
Figure 25. Detail of additional structural column strengthening.
Buildings 16 03729 g025
Figure 26. Secondary seismic verification diagram of Building A.
Buildings 16 03729 g026
Figure 27. Secondary seismic verification diagram of Building B.
Buildings 16 03729 g027
Table 1. Suitable unit types for different household structures.
Household StructureFunctional RoomSuitable Unit TypeAreaDesign Approach
Single individualKitchen, bathroom, integrated dining, living, and sleeping area (1 bed), balconyUnit type 130–36 m2Co-living
CoupleKitchen, bathroom, bedroom (1), balconyUnit type 230–45 m2Co-living
Three-member familyKitchen, bathroom, bedrooms (2), balconyUnit type 345–55 m2Layout integration
Multi-generational familyKitchen, bathroom, bedrooms (3), balconyUnit type 455–60 m2Layout integration
Table 2. Statistics of K-means clustering results.
ClusteringSample SizePercentageCluster Centers (Normalization)Prototypical Model
RoomHallToiletBuilding OrientationBuilding AreaBuilding Time
Cluster I 589.7%0.530.530.440.490.510.61Building A
Cluster II39065.2%0.140.320.330.460.210.54Building B
Table 3. Settings of key parameters.
TypeParameterValue or Setting Basis
Material parametersWall materialMU10 clay brick, mortar strength grade M5 or M7.5
Concrete strengthC20 or C25 concrete for floor slabs and ring beams
Load parametersDead load (floor slab)2.0 kN/m2
Dead load (wall)Calculated based on brick wall thickness
Live load (residential area)2.0 kN/m2
Live load (corridor and stair area)3.5 kN/m2
Seismic parametersFortification intensity8 degree (0.20 g)
Maximum horizontal seismic influence coefficient0.16
Characteristic period0.45 s
Structural damping ratio5%
Structural Model parametersWall layoutAccording to the actual wall layout
Floor slab typeRigid diaphragm assumption is adopted
Table 4. Preliminary design parameter ranges for Building A.
CategoryVariableDescription for VariableTypeUnitRangeStep Size
Door opening dimensionsX1Multi-functional hall door heightContinuousm2–2.80.1
X2Multi-functional hall door widthContinuousm0.9–50.1
X3Bedroom A door heightContinuousm2–2.40.1
X4Bedroom A door widthContinuousm0.9–1.20.1
X5Bedroom B door heightContinuousm2–2.40.1
X6Bedroom B door widthContinuousm0.9–1.20.1
X7Bedroom C door heightContinuousm2–2.40.1
X8Bedroom C door widthContinuousm0.9–1.20.1
X9Bedroom D door heightContinuousm2–2.40.1
X10Bedroom D door widthContinuousm0.9–1.20.1
X11Bedroom E door heightContinuousm2–2.40.1
X12Bedroom E door widthContinuousm0.9–1.20.1
X13Bedroom F door heightContinuousm2–2.40.1
X14Bedroom F door widthContinuousm0.9–1.20.1
Window-to-wall ratioX15Bathroom A WWRContinuous-0.01–0.40.01
X16Bathroom B WWRContinuous-0.01–0.40.01
X17Bathroom C WWRContinuous-0.01–0.40.01
X18Bathroom D WWRContinuous-0.01–0.40.01
X19Bathroom E WWRContinuous-0.01–0.40.01
X20Bathroom F WWRContinuous-0.01–0.40.01
Envelope constructionX21Exterior wall insulation thicknessContinuousm0.02–0.150.01
X22Roof insulation thicknessContinuousm0.02–0.150.01
X23Exterior wall insulation materialDiscrete-0–41
X24Roof insulation materialDiscrete-0.41
X25Glazing constructionDiscrete-0–121
Occupant behavior informationX26Window opening area ratioContinuous-0.01–0.50.01
Table 5. Design parameter ranges for Building B.
CategoryVariableDescription for VariableTypeUnitRangeStep Size
Window-to-wall ratioX1Bathroom A WWRContinuous-0.1–0.30.1
X2Bathroom B WWRContinuous-0.1–0.30.1
X3Bathroom C WWRContinuous-0.1–0.30.1
X4Living room C interior window WWRContinuous-0.1–0.40.1
Envelope constructionX5Exterior wall insulation thicknessContinuousm0.02–0.150.01
X6Roof insulation thicknessContinuousm0.02–0.150.01
X7Exterior wall insulation materialDiscrete-0–31
X8Roof insulation materialDiscrete-0–31
X9Glazing constructionDiscrete-0–121
occupant behavior informationX10Window opening area ratioContinuous-0.1–0.50.1
Table 6. Recommended ranges for key decision parameters of Building A.
No.Key VariableRecommended RangeStep SizeCategory
1Multi-functional hall door width (m)1, 21Door opening
2Bedroom A door width (m)1, 1.10.1Door opening
3Bedroom B door width (m)10.1Door opening
4Bedroom C door width (m)0.9–1.10.1Door opening
5Bedroom D door width (m)0.9–1.10.1Door opening
6Bedroom E door width (m)0.9–1.10.1Door opening
7Bedroom F door width (m)0.9–1.10.1Door opening
8Bathroom A WWR0.20.1Window opening
9Bathroom B WWR0.40.1Window opening
10Bathroom C WWR0.1, 0.20.1Window opening
11Bathroom D WWR0.10.1Window opening
12Bathroom E WWR0.40.1Window opening
13Bathroom F WWR0.2, 0.30.1Window opening
14Exterior wall insulation thickness (m)0.070.01Insulation
15Roof insulation thickness (m)0.120.01Insulation
16Exterior wall insulation materialEPS1Insulation
17Roof insulation materialRock wool panel, XPS1Insulation
18Glazing constructionHigh LT heat-reflective glass, medium LT heat-reflective + A + clear1Insulation
19Window opening area ratio0.1, 0.20.1Occupant behavior
Table 7. Recommended range for key design parameters of Building B.
No.Key VariableRecommended RangeStep SizeCategory
1Bathroom A WWR0.25, 0.40.1Window opening
2Bathroom B WWR0.1, 0.3, 0.40.1Window opening
3Bathroom C WWR0.3, 0.40.1Window opening
4Living Room C interior window WWR0.1, 0.20.1Window opening
5Exterior wall insulation thickness (m)0.07, 0.141insulation
6Roof insulation thickness (m)1–0.150.01insulation
7Exterior wall insulation materialXPS, SEPS1insulation
8Roof insulation materialRock wool panel, XPS, rigid polyurethane foam0.01insulation
9Glazing constructionLow LT heat-reflective + A + clear, high transmittance low-E + A + clear1Window performance
10Window opening area ratio0.3–0.50.1Occupant behavior
Table 8. The weights of the four objectives of Building A.
ItemInformation Entropy ValueInformation Utility ValueWeight Coefficient
UDI1.00000.00001.5418%
PPD1.00000.00002.7756%
ICDC1.00000.00000.7791%
EUI0.99960.000494.9036%
Table 9. The weights of the four objectives of Building B.
ItemInformation Entropy ValueInformation Utility ValueWeight Coefficient
UDI0.97380.026284.6548%
ICDC0.99700.00309.6258%
EUI0.99990.00010.3825%
PPD0.99830.00175.3370%
Table 10. Optimal values of key design parameters for Building A.
No.Key Design ParameterOptimal Value
1Multi-functional hall door width1
2Bedroom A door width1.1 m
3Bedroom B door width1 m
4Bedroom C door width1.1 m
5Bedroom D door width1.2 m
6Bedroom E door width1.1 m
7Bedroom F door width1 m
8Bathroom A WWR0.3
9Bathroom B WWR0.3
10Bathroom C WWR0.1
11Bathroom D WWR0.2
12Bathroom E WWR0.4
13Bathroom F WWR0.4
14Exterior wall insulation thickness0.07 m
15Roof insulation thickness0.12 m
16Exterior wall insulation material1
17Roof insulation material1
18Glazing construction6
19Window opening area ratio0.4
Table 11. Optimal values of key design parameters for Building B.
No.Key Design ParameterOptimal Value
1Bathroom A WWR0.4
2Bathroom B WWR0.4
3Bathroom C WWR0.4
4Living room C interior window WWR0.2
5Exterior wall insulation thickness0.07 m
6Roof insulation thickness0.15 m
7Exterior wall insulation material1
8Roof insulation material1
9Glazing construction5
10Window opening area ratio0.3
Table 12. Story shear capacity and capacity ratios for Building A and Building B.
Realistic Typical ModelStoryVx (kN) Vy (kN)Vx/VxpVy/Vyp
Building A621,728.9323,808.031.001.00
521,985.7924,035.471.011.01
422,174.9924,262.631.011.01
322,424.7224,489.571.011.01
222,632.2024,714.991.011.01
122,785.8824,950.971.011.01
Building B615,894.7122,600.581.001.00
516,084.7822,858.671.011.01
416,306.4323,070.201.011.01
316,575.2923,298.431.021.01
216,946.6422,761.141.021.01
117,786.4323,007.621.051.01
Table 13. Secondary seismic verification parameters for Building A and Building B.
Parameter CodeParameter Description and UnitBuilding ABuilding B
G1Gravity load (kN)5064.64385.2
F1Horizontal seismic action (kN)205.2117.4
V1Story seismic shear force (kN)3907.83389.7
MMortar strength grade5.05.0
MUMasonry unit strength grade10.010.0
fyhTensile strength of steel reinforcement (N/mm2)210210
XkCenter of stiffness X coordinate11,951.69779.7
YkCenter of stiffness Y coordinate6616.87887.9
XmCenter of mass X coordinate12,006.89687.1
YmCenter of mass Y coordinate6560.07742.9
Disclaimer/Publisher’s Note: The statements, opinions and data contained in all publications are solely those of the individual author(s) and contributor(s) and not of MDPI and/or the editor(s). MDPI and/or the editor(s) disclaim responsibility for any injury to people or property resulting from any ideas, methods, instructions or products referred to in the content.