Article

A Novel Live Load Survey Approach for Classroom Buildings by Group Intelligence: Methodology and Application


1
College of Civil Engineering, Tongji University, Shanghai 200092, China
2
The State Key Laboratory on Disaster Reduction in Civil Engineering, Tongji University, Shanghai 200092, China
*
Author to whom correspondence should be addressed.
Buildings 2026, 16(18), 3689; https://doi.org/10.3390/buildings16183689
Submission received: 17 August 2026 / Revised: 10 September 2026 / Accepted: 15 September 2026 / Published: 16 September 2026
(This article belongs to the Section Building Structures)

Abstract

Floor live load is a governing parameter for engineering structures, and its reliable quantification is critical during both the design phase and the structural service life. Although classrooms represent a common building category, research regarding their live load characteristics remains relatively limited. Existing studies generally rely on physical sampling and on-site weighing. These methods are labor-intensive and inefficient, which limits their applicability to large-scale surveys. To address these challenges, this paper proposes a novel survey approach for classroom live loads based on group intelligence technology. This method aggregates load amplitude samples by recruiting volunteers through questionnaires. Meanwhile, the weights of indoor items are determined via an electronic inventory method. Field measurements verified the feasibility of this approach. The methodology was subsequently applied across four provinces in China. This implementation yielded an extensive dataset comprising 299 classrooms and covering a total floor area of 22,921 m2. Finally, the study presents a statistical analysis and probabilistic modeling of the results.

1. Introduction

In structural engineering, load determination is a key component of structural design. The reliable quantification of loads is essential for the safe design of new buildings and provides a basis for assessing the performance of existing structures [1]. Among the basic load types, floor live loads act on buildings for most of their service life and are therefore a primary consideration in building design [2]. These loads are closely related to building function, which determines the furniture, equipment, and occupants present in a building. The random distribution and variation in these components lead to uncertainty and result in the spatiotemporal variability of live loads [3]. Investigating this variability and determining representative load values provide a basis for structural safety assessment, economical design, and uncertainty characterization.
Floor live loads are generally classified into sustained loads and extraordinary loads [4]. Sustained loads mainly originate from furniture and regular occupancy, and their effects persist throughout the service life of a structure [5]. In contrast, extraordinary loads have low occurrence frequencies and short durations. They typically arise from occasional events, such as crowd gatherings, temporary furniture stacking, or meetings. This study focuses on sustained loads.
To characterize the uncertainty of sustained loads, a large number of measured samples is required. These samples are usually obtained from field surveys. The sample size and the accuracy of the collected data directly affect the quality and reliability of the resulting load model. Accordingly, many countries have conducted field surveys to establish appropriate live load design values. Table 1 summarizes the major load surveys reported in the literature.
Classroom buildings differ functionally from residential and office buildings. Therefore, their live loads are classified separately and assigned specific values in international design codes. However, empirical surveys of classroom live loads are much less common than those for offices and residences. Only limited studies have been reported worldwide. To date, only three relevant studies on classroom buildings have been identified. Among them, only one was conducted in the current century, and that study was performed by the authors of the present paper.
In 1990, Andam [18] surveyed institutional buildings in Ghana, including more than 2000 m2 of classroom space. The study provided rare data on extreme load events in the region and proposed a stochastic model for determining the lifetime equivalent uniformly distributed load (EUDL). In 1997, Ruiz [23] investigated classrooms in several public schools in Mexico City. The results were used in a probabilistic Monte Carlo analysis to derive the distribution function of maximum classroom live loads. These findings were compared with relevant codes, leading to the proposal of a new design live load value. In 2023, the authors’ research team [24] conducted a load survey at a university in China using multi-source data. By collecting live load data through multiple approaches, including direct weighing by researchers, the study analyzed probability distributions and statistical parameters using statistical methods. It established distribution models for classroom live loads, determined design values, and verified the feasibility of multi-source data collection for live load surveys in the big data era.
Traditional surveys of classroom live load amplitudes usually require investigators to enter classrooms to measure floor areas and weigh indoor items. However, this approach may disrupt normal teaching activities. Moreover, direct weighing of large or fixed objects is often infeasible, and their weights can only be estimated. Therefore, the time-consuming, costly, and inefficient nature of traditional survey methods is a major reason for the scarcity of classroom live load data.
The development of big data has provided new approaches for data acquisition. Based on internet accessibility and the widespread use of social media, this study proposes a group-intelligence-based data collection method. Questionnaires containing essential information for classroom live load surveys, such as room dimensions and furniture types, are distributed online to recruit volunteers. The questionnaire is designed to be simple and accessible to support participation by non-professional respondents.
The remainder of this paper is organized as follows. Section 2 introduces the theoretical basis of probabilistic modeling for sustained loads. Section 3 describes the implementation of the group intelligence method and the determination of the weights of surveyed items. Section 4 validates the feasibility of the proposed method by comparison with measured data. Section 5 presents the survey information, summarizes the collected data, and provides the statistical analysis. Section 6 summarizes the main findings.

2. Theoretical Model for Sustained Loads

Field surveys provide the empirical basis for theoretical load models, which generalize the patterns observed in measured data. This section reviews existing theoretical frameworks for live load modeling. Characterizing the temporal variation in loads is essential for deriving the probability distribution of maximum loads over a design reference period and for establishing representative values for structural design.
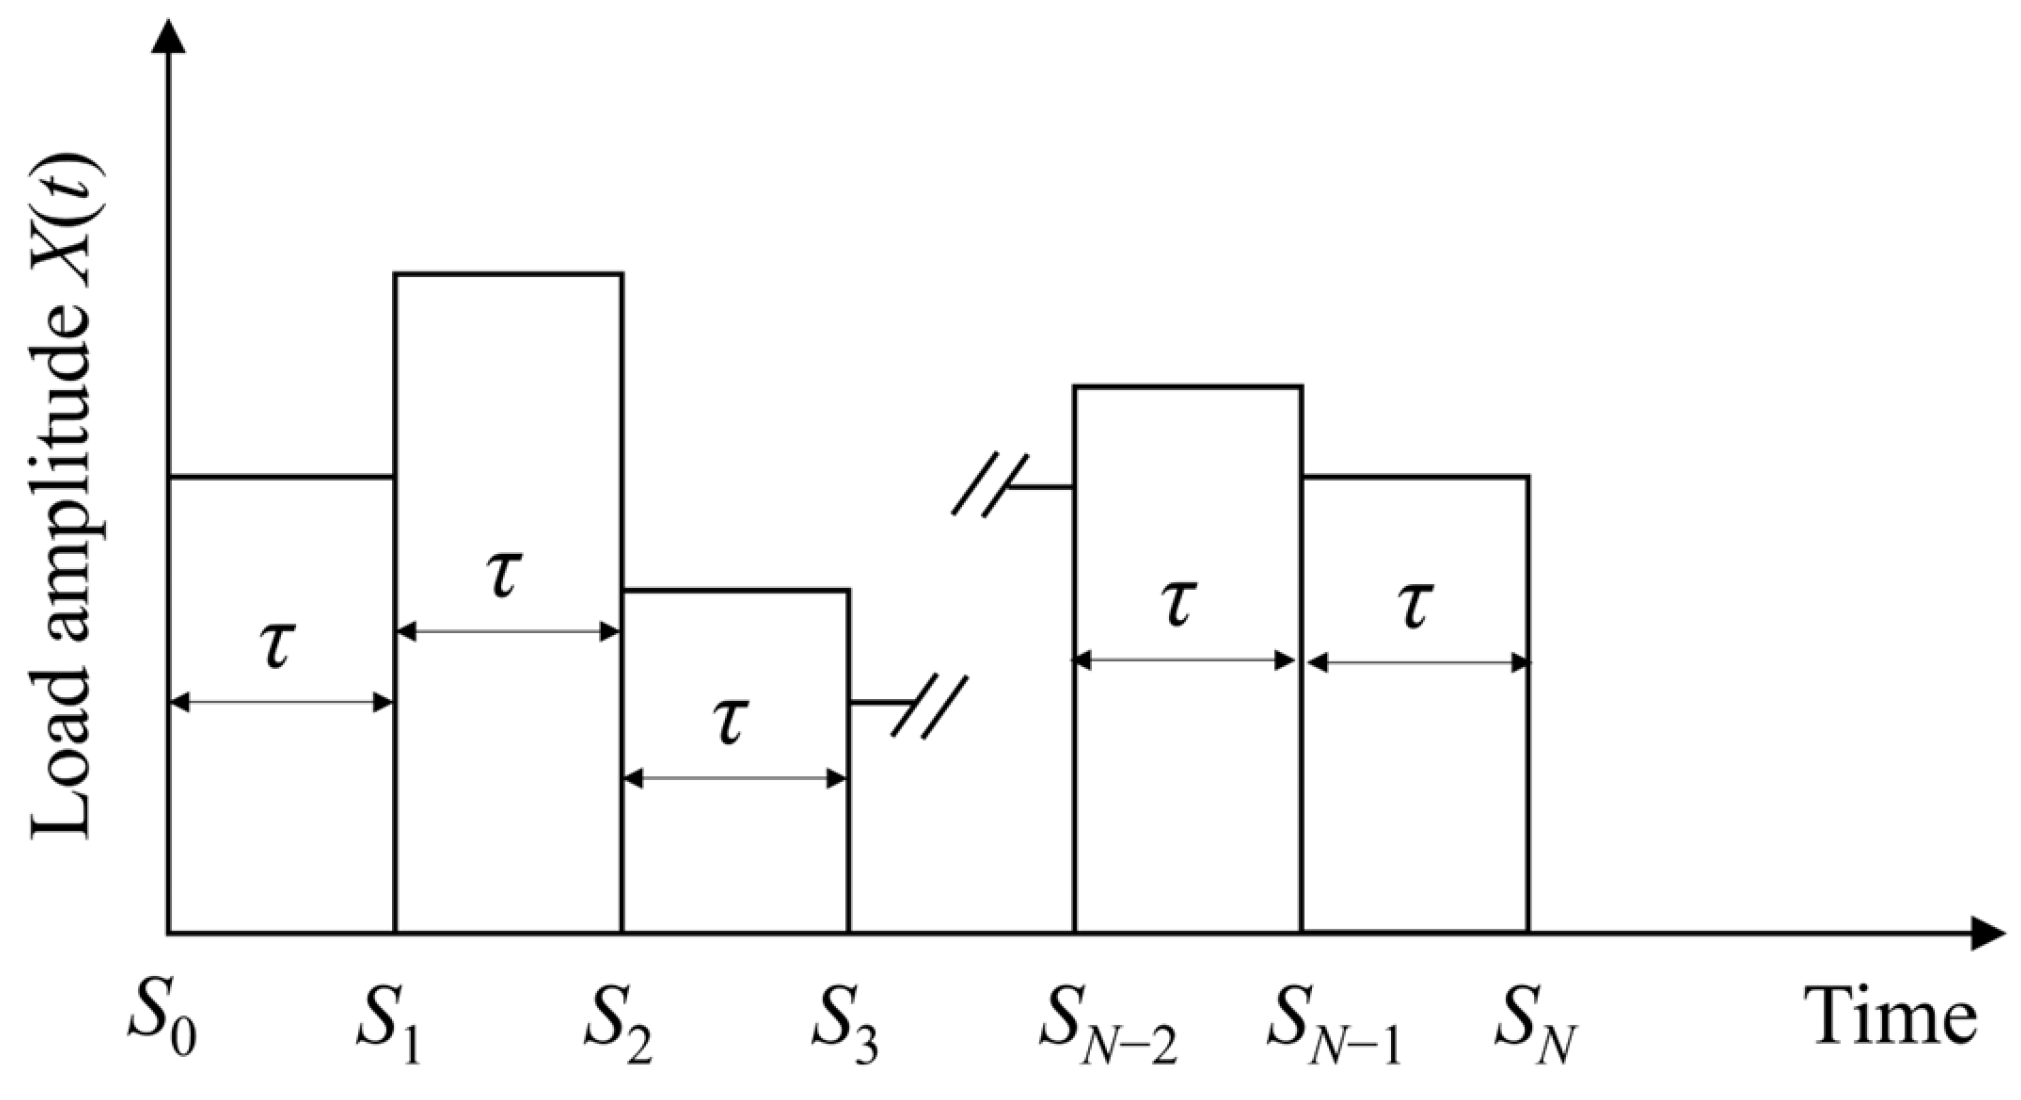
Stochastic models for sustained loads are generally classified according to their treatment of load duration. The two main approaches are the Poisson square wave process model [4,5] and the stationary binomial process model [25]. Consistent with the methodology adopted in Chinese load codes [26,27], this study uses the stationary binomial process model. Originally proposed by Ferry and Castanheta [25], this model simplifies the temporal dimension by neglecting the randomness in the timing of load changes. As shown in Figure 1, the model is based on the following assumptions:
(a)
The design reference period T, standardized as 50 years, is represented by an equivalent number n of statistically independent sustained-load states. When the load duration τ is introduced, n can be expressed as n = T/τ. In this context, n is an equivalent average model parameter rather than necessarily an integer number of physical time intervals.
(b)
The load amplitude L within any given interval is treated as a random variable that follows the cumulative distribution function (CDF) FL(l). Amplitudes across different intervals are considered independent and identically distributed.
(c)
The sustained load is assumed to be continuously present throughout each time interval, which means the probability of occurrence is p = 1.
Based on the aforementioned characteristics, the expression corresponding to the CDF of the maximum sustained load FM(T) over the structural reference period T is presented as follows:
F M T = [ F L ( l ) ] n

3. Methodology

3.1. Scheme of the Group Intelligence-Based Survey Approach

Compared with the authors’ previous multi-source survey, the present study shifts the data acquisition mode from researcher-centered online information collection to volunteer-centered distributed data collection.
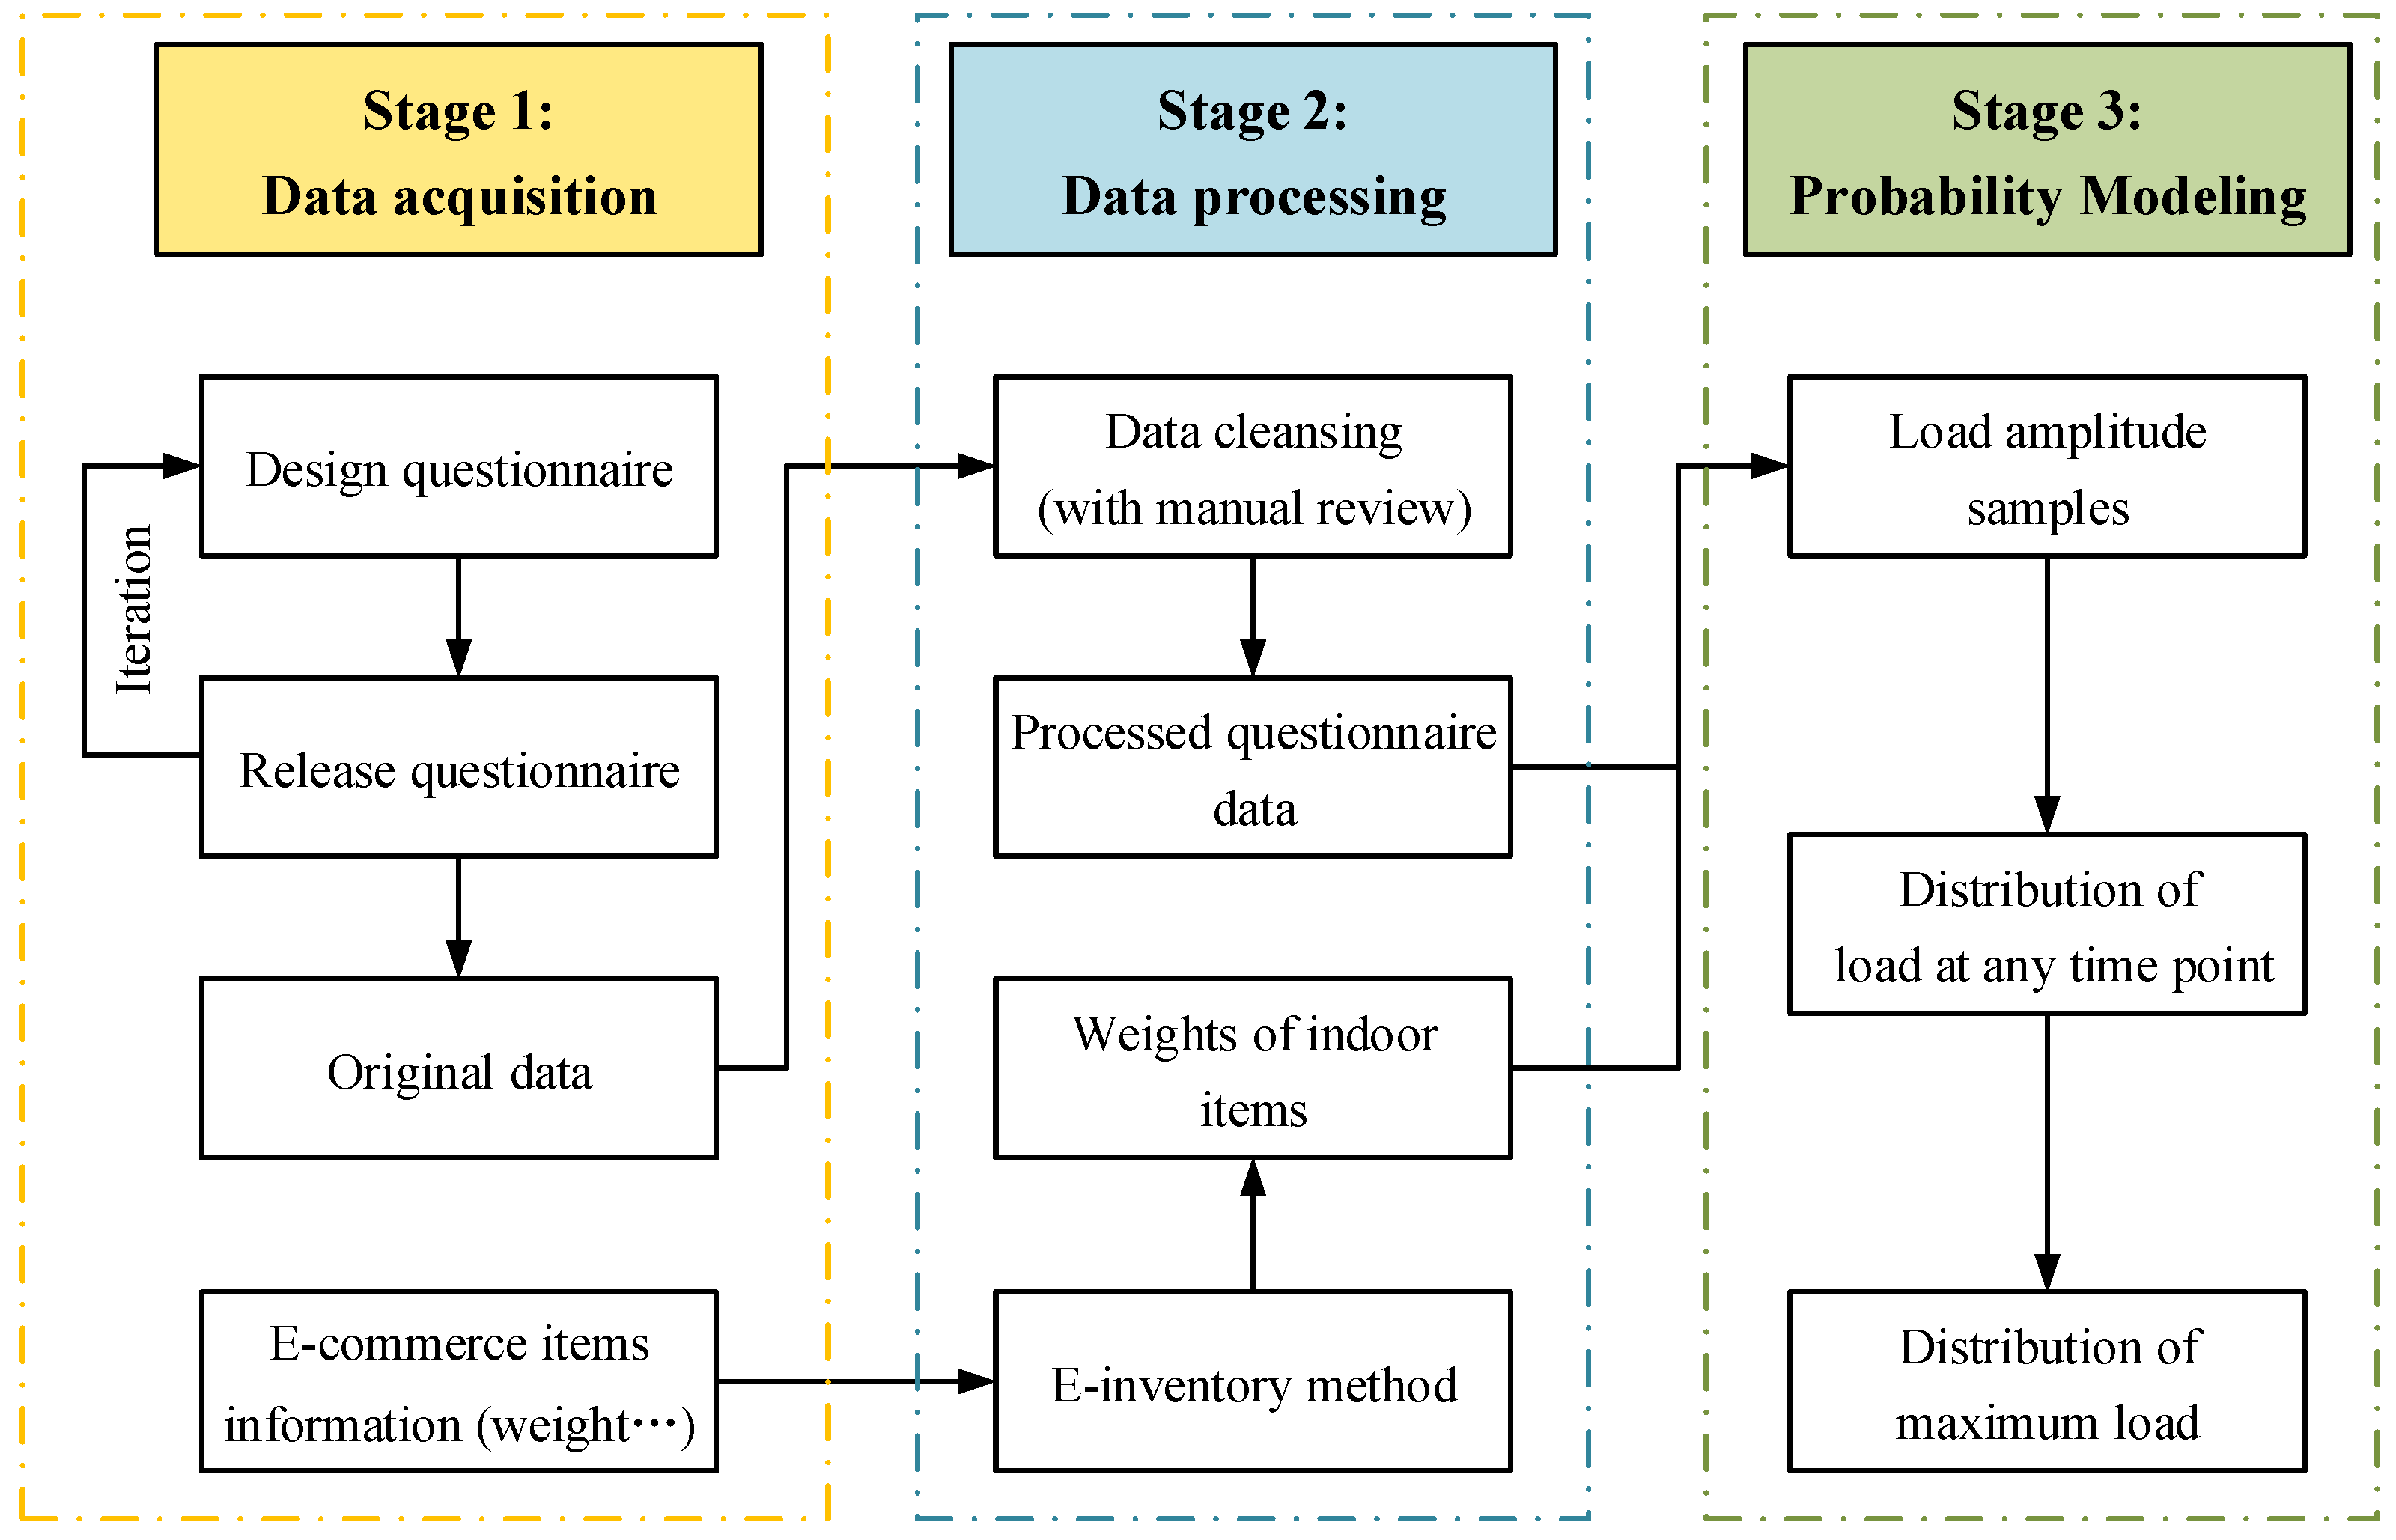
Based on the stochastic process model for sustained loads introduced in Section 2, the primary objective is to conduct a load amplitude survey for deriving the CDF of the arbitrary-point-in-time load, denoted as FL(l). To this end, this paper proposes a group-intelligence-based load survey method. As shown in Figure 2, the method addresses the limitations of conventional survey techniques and consists of three stages. First, the quantity and characteristics of classroom samples are obtained through questionnaires distributed to volunteers. Second, the load amplitudes are determined using the e-inventory method. Third, the load model parameters are calculated from the survey results.

3.2. Determination of Types and Quantities of Indoor Objects by Group Intelligence Technology

The rapid development of the internet and big data technologies has improved connectivity and data transmission among smart devices. In this context, group intelligence has emerged as a sensing paradigm [28]. Unlike conventional dedicated sensor networks, which rely on costly fixed hardware, group intelligence uses the sensing, computing, and communication capabilities of devices carried by the public. It collects, transmits, and processes environmental, social, or physical information in a distributed manner. This approach helps overcome the limitations of conventional sensing methods in terms of cost, coverage, and flexibility. It is characterized by multi-source heterogeneity, dynamic scalability, cost efficiency, and real-time performance [29,30]. Group intelligence has been applied in various fields of scientific research and engineering practice. For example, in disaster response, it enables the rapid collection of post-disaster site information [31,32].
Based on group intelligence and its advantages in data acquisition, this study developed a method for collecting live load survey samples. The research team designed questionnaires to collect the data required to determine live load amplitudes, including photographs of classrooms, classroom dimensions, dimensions of indoor items, and quantities of indoor items. These questionnaires were distributed through smartphone-based social media platforms, such as WeChat Moments and official WeChat accounts. During data collection, an iterative approach was used, and the questionnaire content was revised to improve completeness and accuracy. Volunteers, mainly young students, were asked to follow simple procedures: take photographs, measure items, complete the questionnaire, and submit the form. This process provided the raw data required for the live load analysis of classroom buildings.
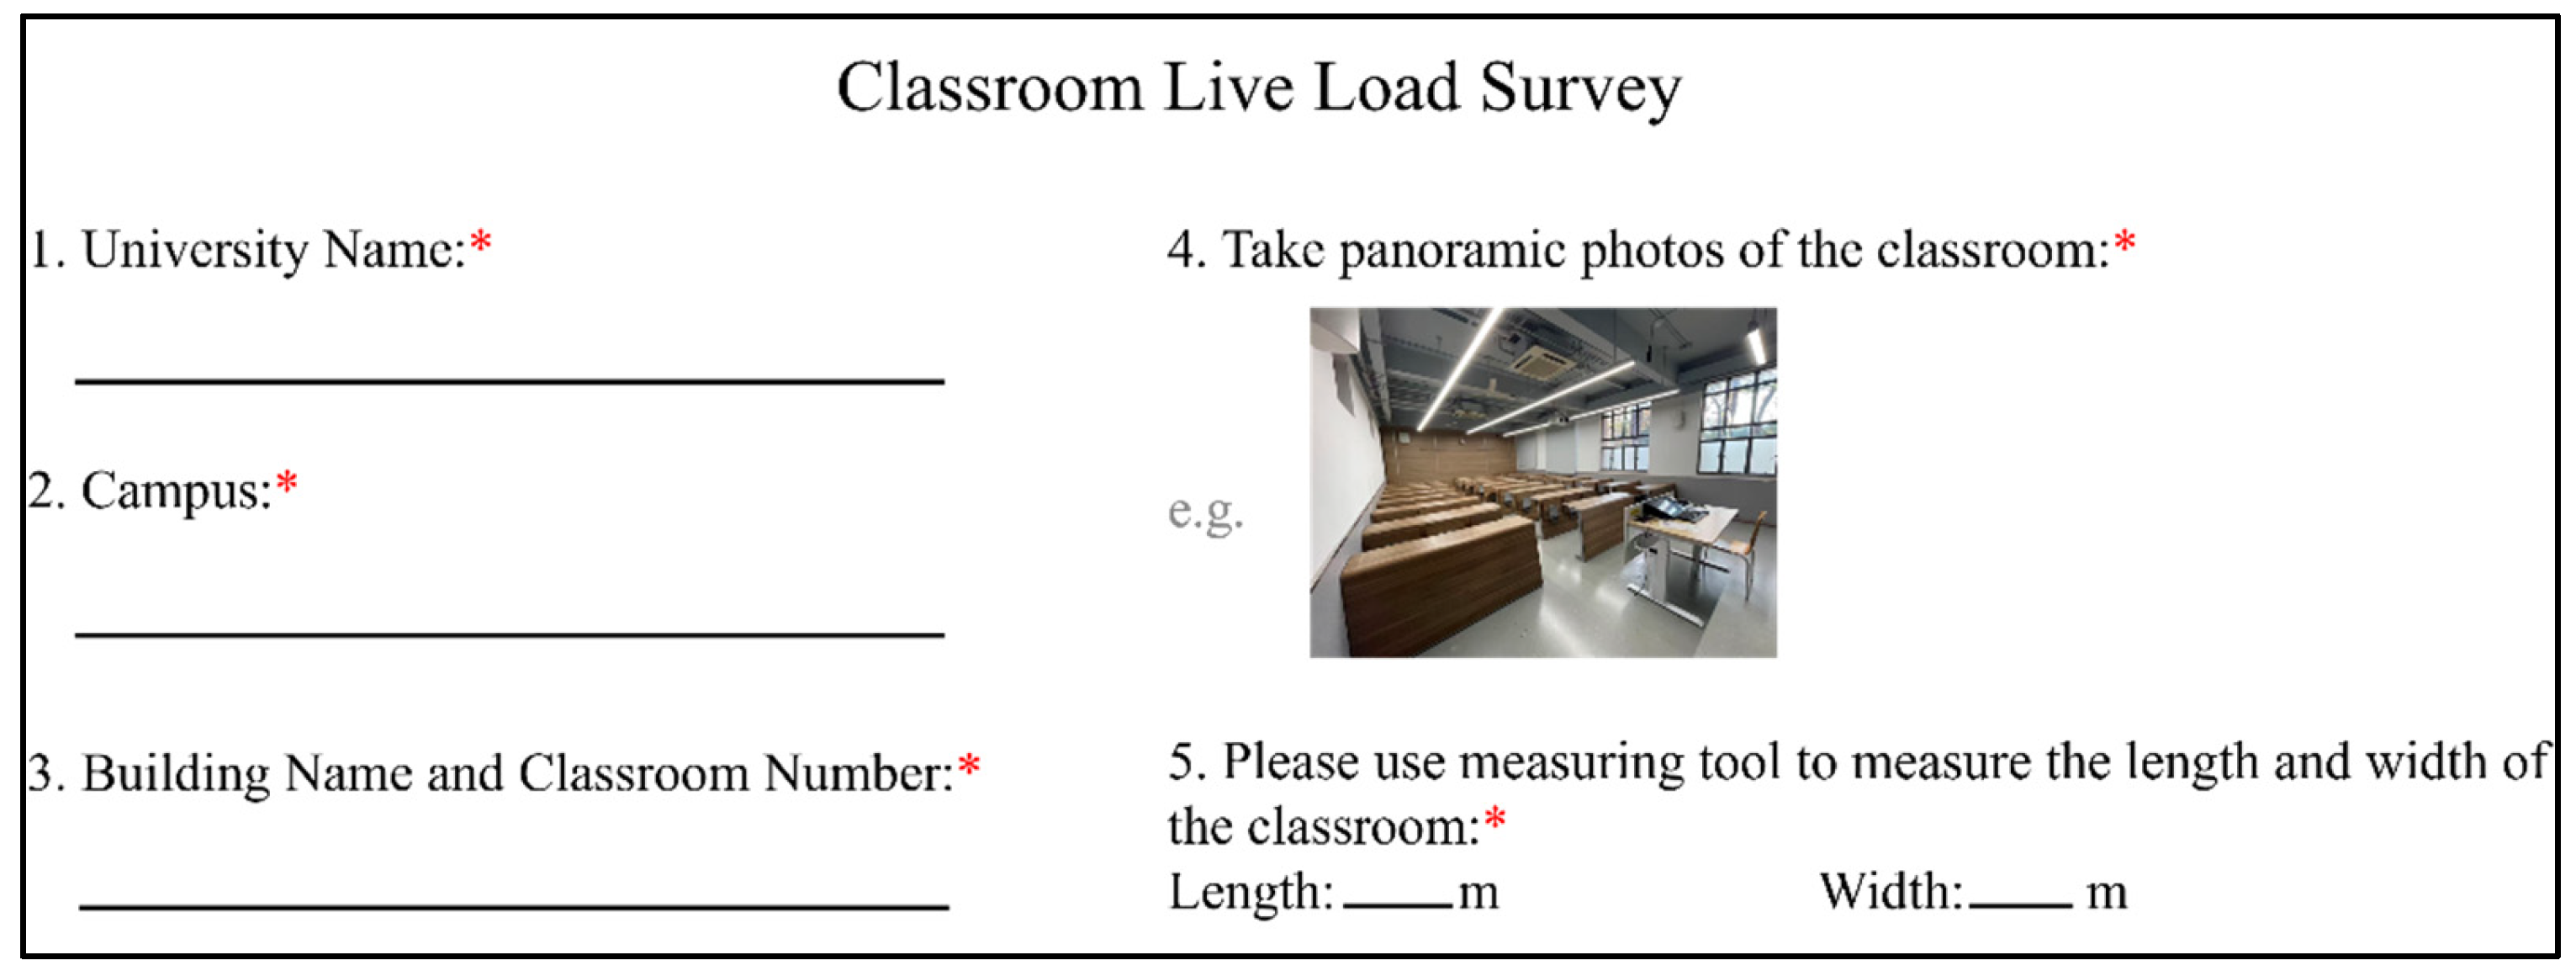
To improve the questionnaire design and adapt it to different classroom configurations, multiple rounds of pre-testing were conducted. An initial small-scale deployment was first implemented, followed by refinements based on the collected feedback. This pre-testing and refinement process complemented the iterative updates during formal data collection and helped ensure the applicability of the questionnaire to various scenarios. A partial screenshot of the questionnaire is shown in Figure 3, Questions marked with an asterisk (*) in the figure are compulsory, and the full version is provided in Appendix A.
Although recruitment was open to the general public, most respondents were young students. This group is highly active on social media platforms and generally willing to participate in new activities. In addition, they may be more interested in research related to the classroom environments in which they study. These characteristics facilitated the use of the group-intelligence-based survey method and supported continuous questionnaire iteration during data collection.
To identify the types and quantities of items in classrooms through questionnaire-based surveys, the questionnaire was designed to include common items as selectable options, such as desks, chairs, projectors, and bookshelves. A fill-in-the-blank section was also included for less common items, with a corresponding field for recording the quantity of each item. The questionnaire was distributed to volunteers familiar with classroom layouts, such as teachers and students. Participants were instructed to identify existing items, classify each item type, and record the corresponding quantities. After the completed questionnaires were collected, the reported item types and quantities were systematically collated. To improve data accuracy and reliability, a subset of samples was verified on site to cross-check the submitted information.
This study uses group intelligence technology to conduct load amplitude surveys for classroom buildings. Compared with traditional on-site surveys, this approach has the following advantages:
(a)
Researchers only need to distribute a recruitment notice to invite volunteers to participate in the survey. Survey data can therefore be obtained without physical on-site visits by researchers. In addition, volunteers from different regions can participate concurrently, which improves the efficiency of data collection.
(b)
The questionnaire covers multiple types of information, including the school name, building location, classroom number, room dimensions, and interior photographs. It also records the dimensions and model numbers of desks, chairs, furniture, and multimedia equipment. On average, the questionnaire takes approximately 5–10 min to complete, which is shorter than traditional offline surveys.
(c)
All classroom sample information collected through the questionnaire is voluntarily provided by participants. This helps avoid the difficulty of accessing campuses in traditional surveys, where entry may be restricted by administrative requirements.
(d)
Classroom-related information can be accumulated continuously through the questionnaire. This enables the survey to obtain a sufficiently large sample size, which is important for improving the reliability and representativeness of the results.

3.3. Determination of Weights of Indoor Objects Using e-Inventory Method

After the item types and quantities are identified, their weights are determined using specific strategies. Two main approaches are used for weight determination: the traditional inventory method [8] and the e-inventory method [33,34].
The traditional inventory method mainly relies on on-site surveys to directly measure the weights of indoor items. For furniture and equipment that cannot be easily weighed, weights are obtained from product manuals or calculated using dimensional parameters and material properties. For example, the weights of electrical appliances with specified models, such as air conditioners and projectors, are usually reported in the corresponding manuals. This procedure is consistent with the standard inventory method.
The e-inventory method, also termed the big-data-driven inventory method, is a relatively new approach for estimating item weights. In this study, it is used to address weight determination when only image data and dimensional information are available. The e-inventory method is based on a deep-learning predictive model for furniture weight estimation. The procedure starts with the classification of furniture items, such as tables, chairs, and sofas. Correlation models are then established between item characteristics, including dimensions and structural forms, and actual weights. Web crawler techniques are used to periodically collect furniture attribute data and corresponding weight records from home furnishing e-commerce platforms. The collected datasets are analyzed and used to train machine learning models, which predict the weights of unknown furniture items from known characteristic parameters. In practical applications, users of the e-inventory method select the furniture category and input its dimensional and shape-related features, after which the model provides an estimated weight.
Finally, the load amplitude is calculated. Existing studies generally use two models: the linear random model [4,35] and the random variable model [26]. Consistent with the approach adopted in studies supporting Chinese load codes, this study uses the random variable model. This model assumes that uniformly distributed load amplitudes in spaces with the same function follow the same probability distribution. Based on the authors’ experience, the uniformly distributed load, also referred to as the unit load (UL), is expressed as the average load per unit area. The formulation is given as follows:
U L = i = 1 n N i W i A
where A denotes the area of the surveyed space; Ni denotes the quantity of the i-th item, and Wi denotes its net weight.

4. Verification of Method’s Feasibility Based on Field Measurements

The proposed approach integrates group intelligence technology and the e-inventory method to determine load amplitudes. However, its feasibility should be verified before application to large-scale load surveys. To evaluate the accuracy of the approach, a field measurement verification campaign was conducted. For each surveyed room, the load amplitude was calculated independently using both the proposed approach and direct field measurements.

4.1. Field Survey Process

The research team conducted an on-site investigation of classrooms at a university to determine the weights of indoor loads. Small movable items, such as individual desks and chairs, were weighed separately using a high-precision portable scale. For large or fixed items, such as fixed lecture benches and wall-mounted storage units, direct weighing was infeasible. Therefore, a volume-density method was used. The external dimensions of each fixed item were first measured using a tape measure. The volumes of hollow sections were then subtracted to obtain the net material volume. The main material composition of each item was determined through visual inspection and material identification, and the corresponding material density was used to estimate its weight. For classroom multimedia devices, the model number of each device, typically labeled on the product casing or rear panel, was recorded. The corresponding weight was then obtained from official technical datasheets provided by the manufacturers. Finally, the room dimensions were measured.

4.2. Verification Examples

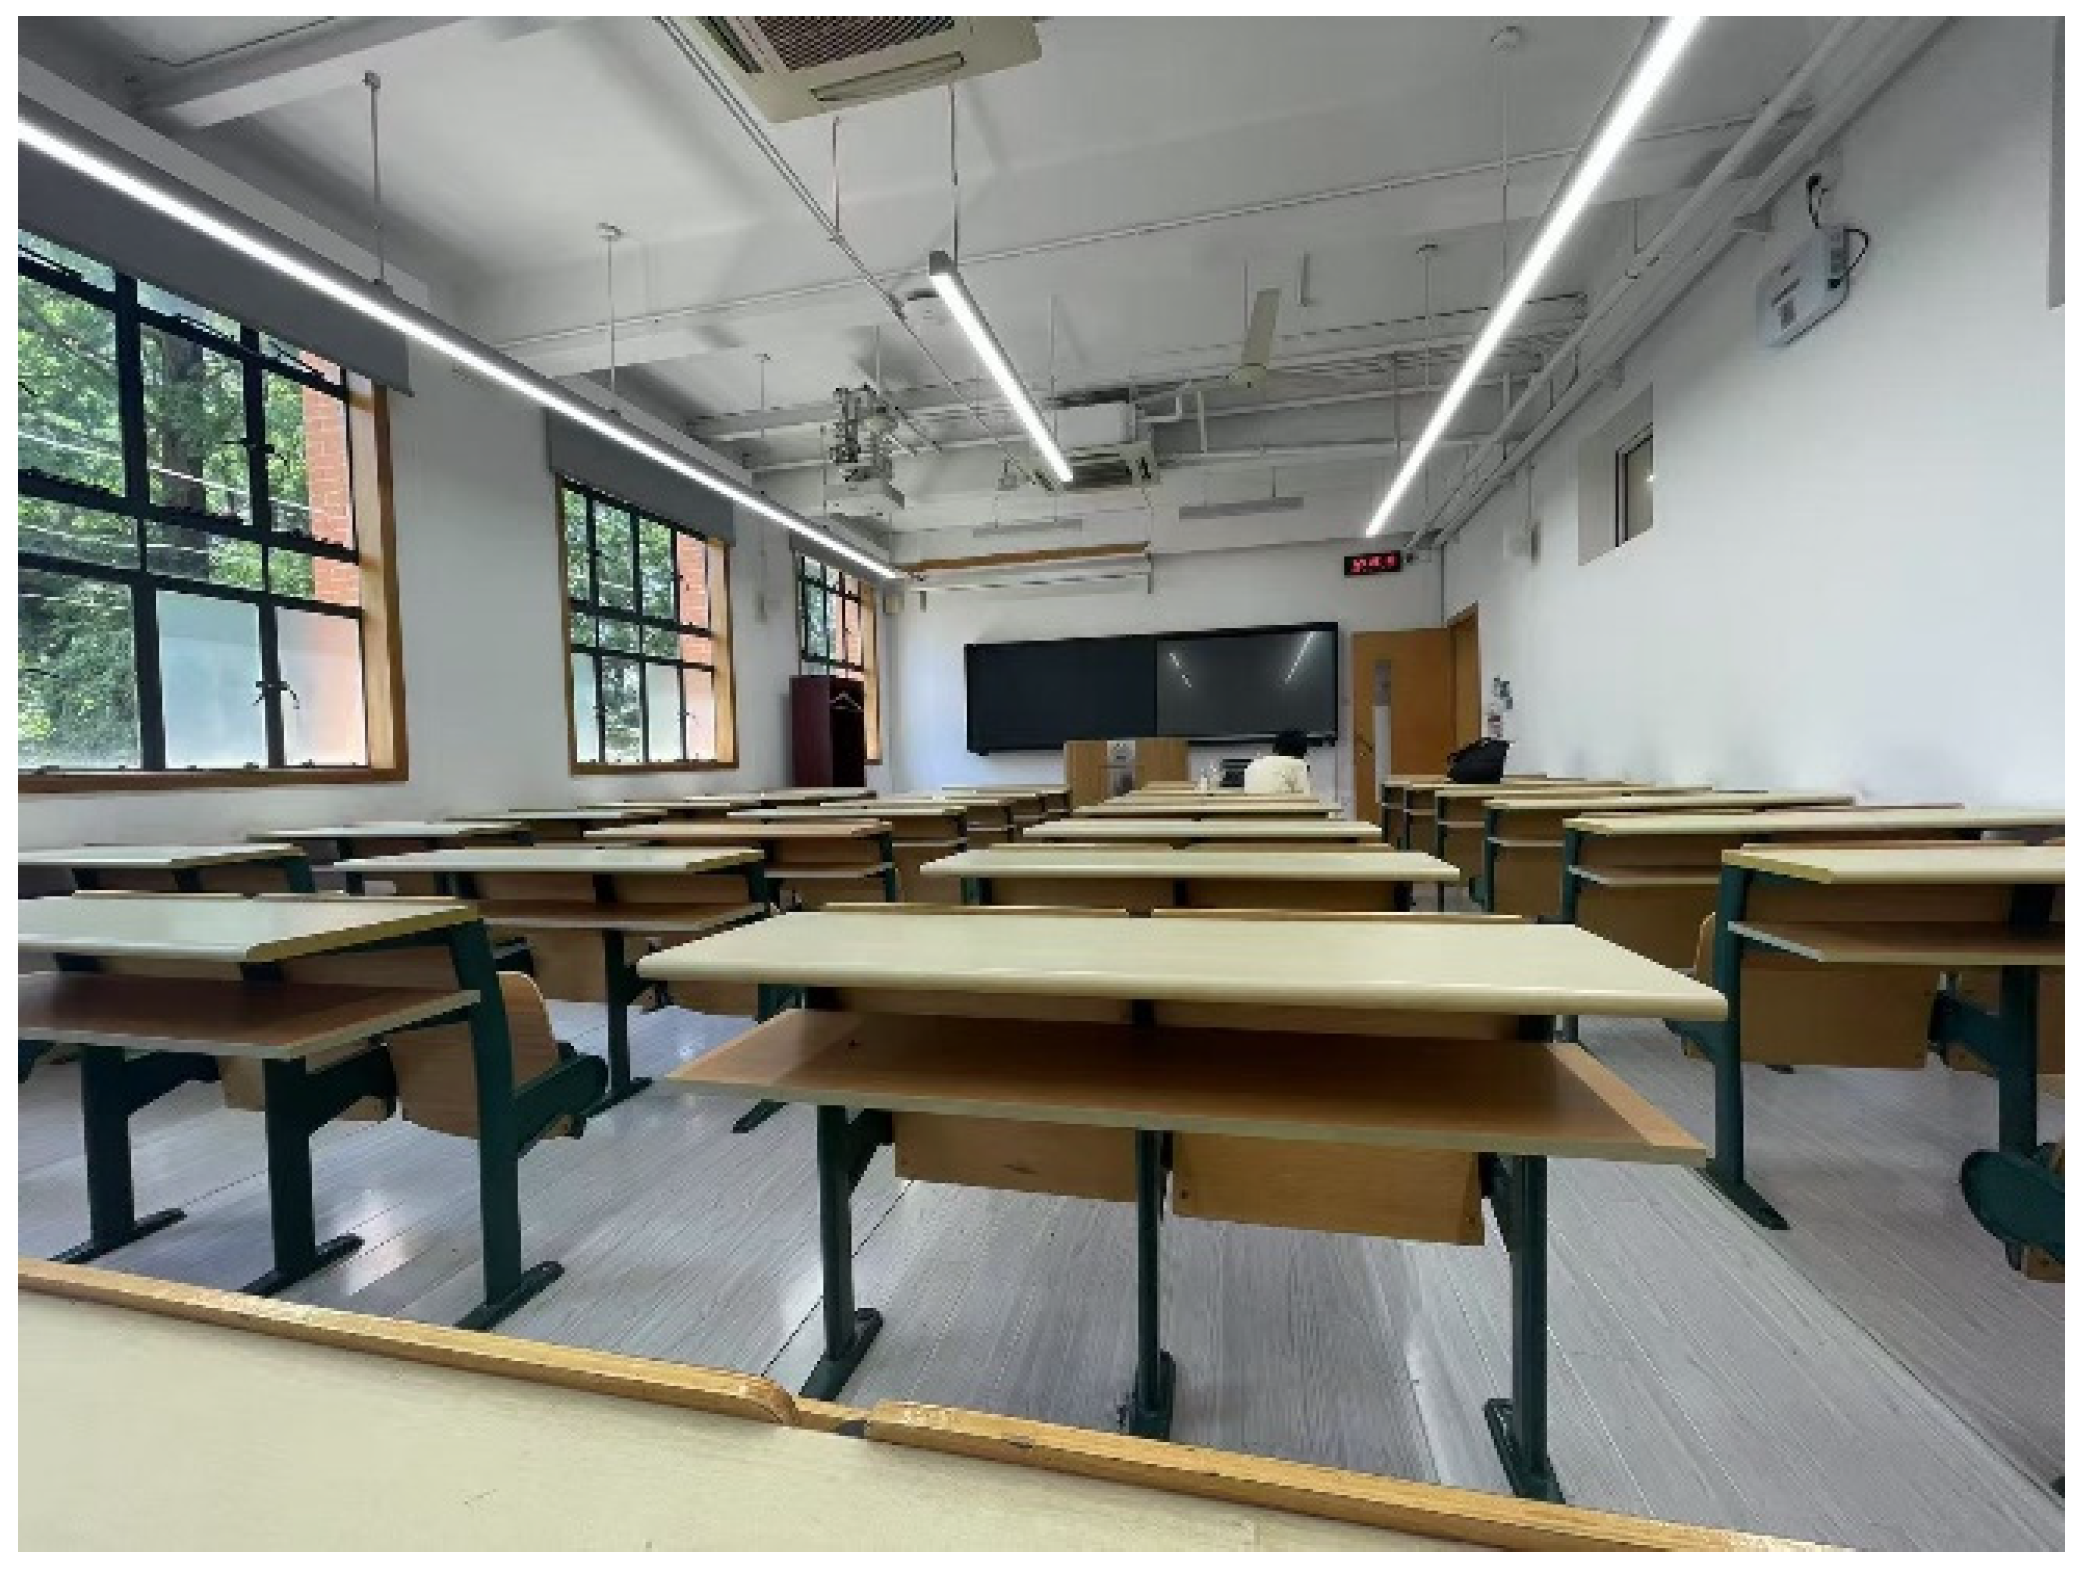
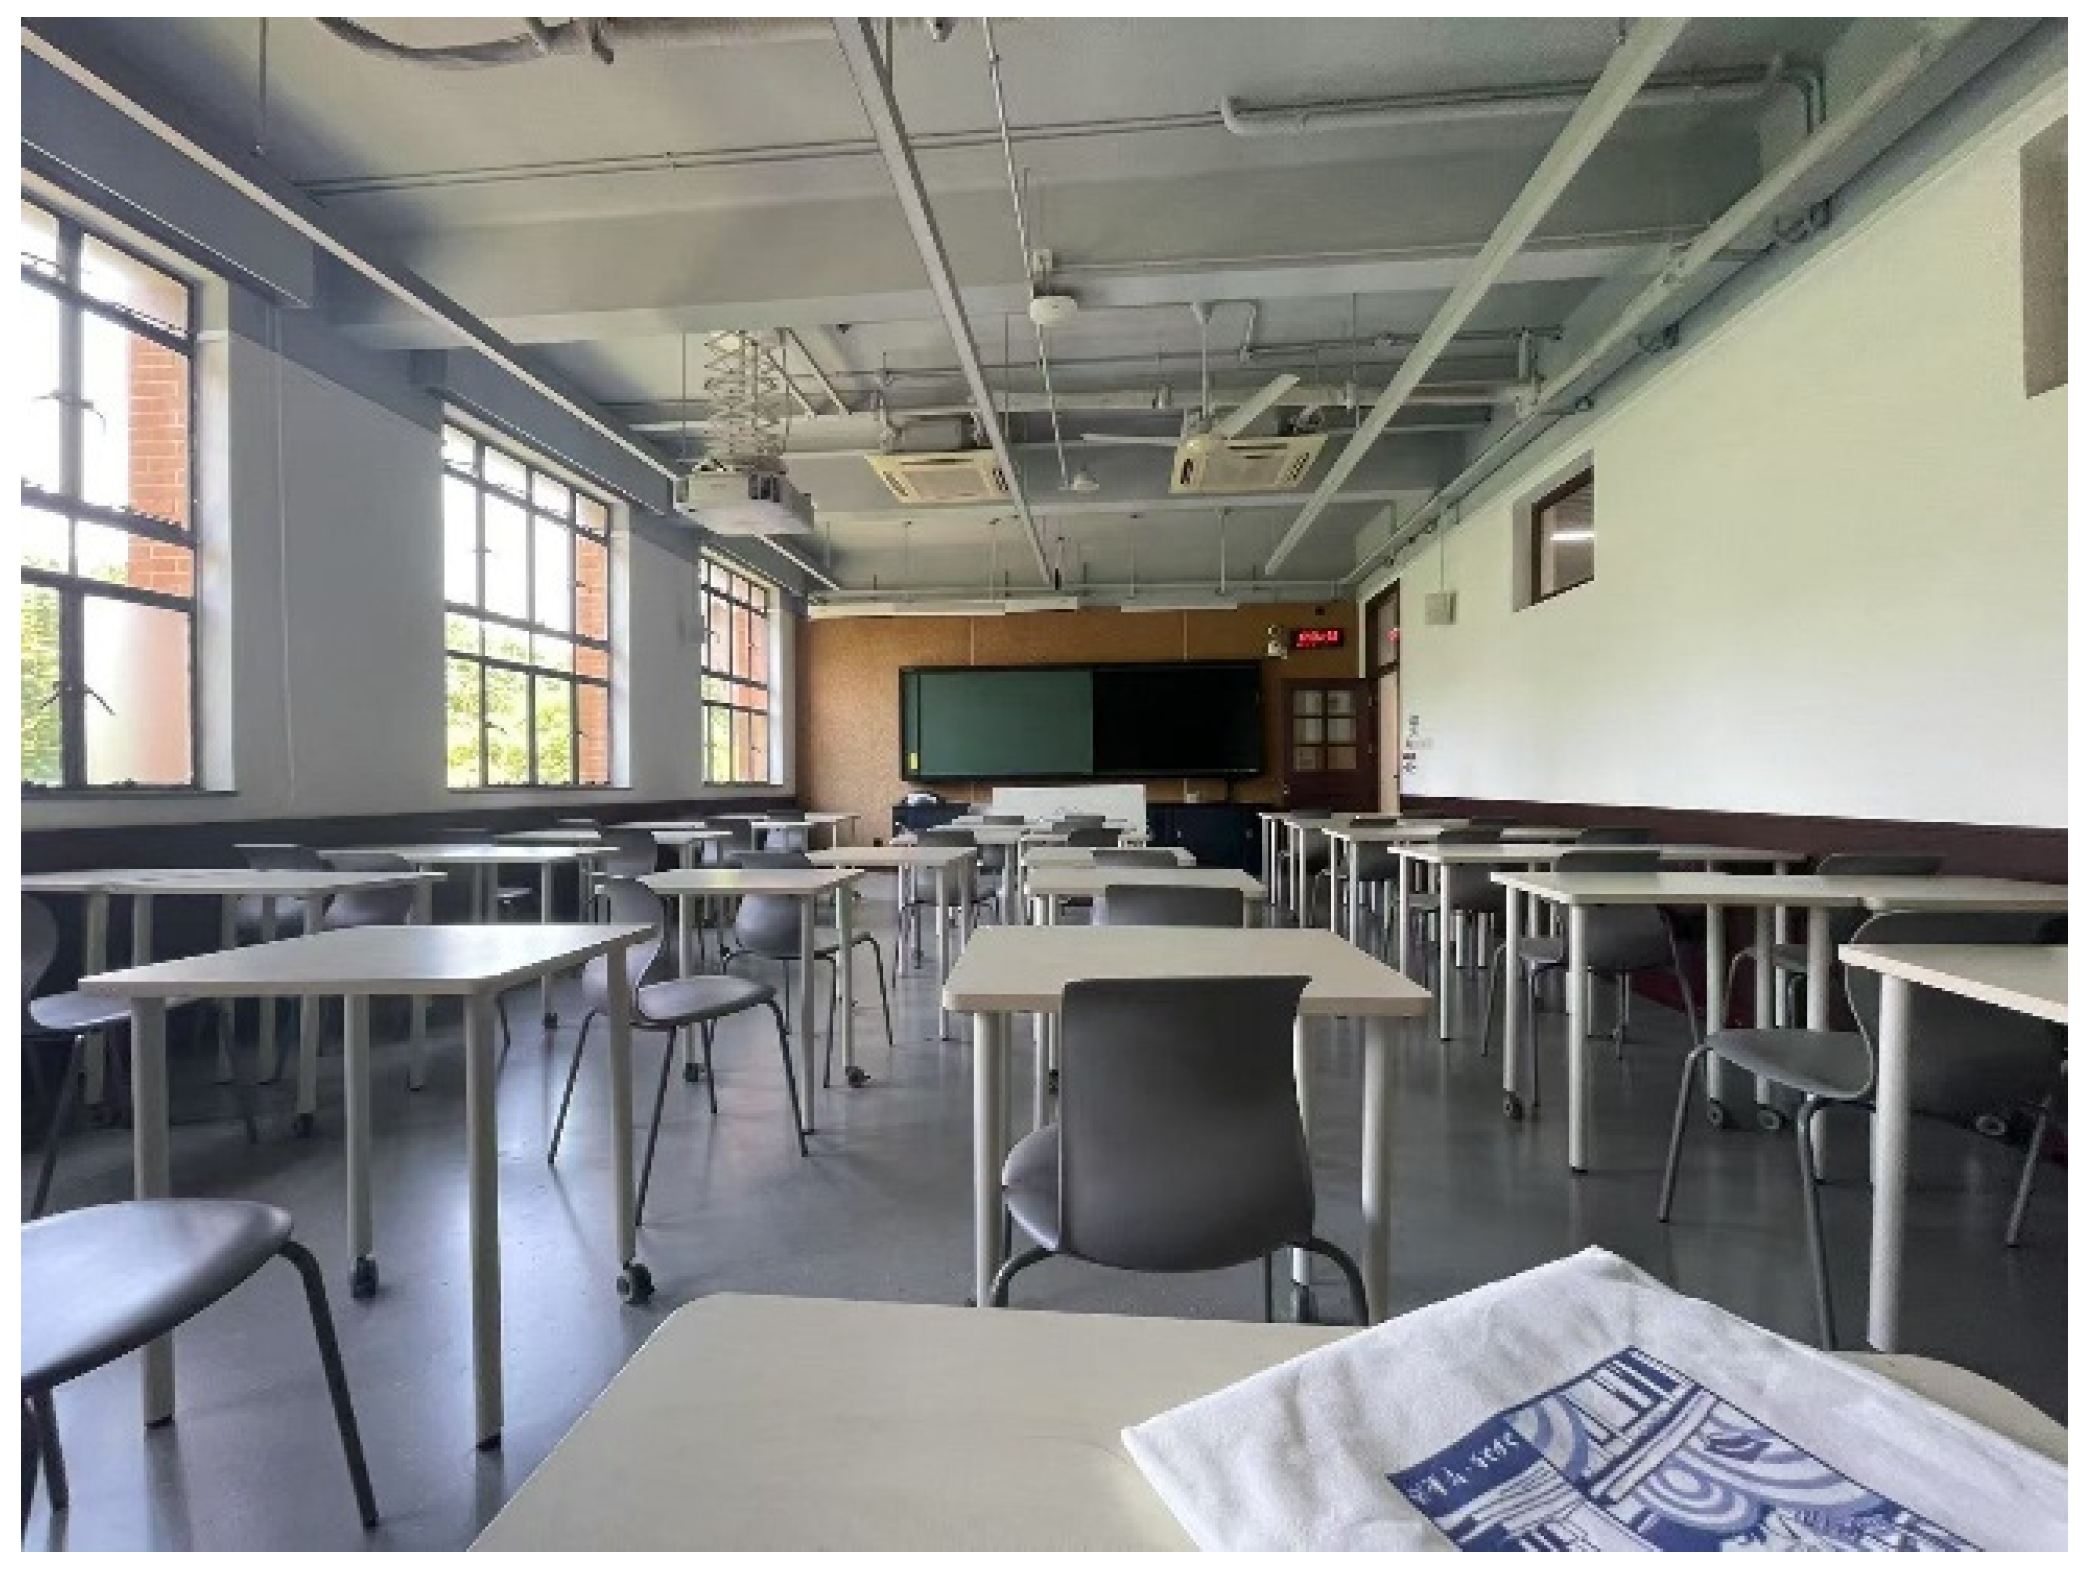
The survey scheme described above was applied to two classrooms with different layouts, as shown in Figure 4 and Figure 5. Table 2 and Table 3 present the weight comparison between the results obtained via the proposed approach and the actual results obtained through field measurements.
Classroom 1 has a floor area of 70.26 m2. The total field measured weight was 12,153.47 N, corresponding to a floor live load of 172.97 N/m2. Using the proposed survey method, the estimated total item weight was 11,687.97 N. This yields a live load of 166.35 N/m2. This value is 3.8% lower than the measured live load. Similarly, Classroom 2 covers an area of 72.72 m2. The total field measured weight was 7090.30 N, corresponding to a floor live load of 97.50 N/m2. Using the proposed survey method, the total item weight was calculated as 7383.32 N. This results in a live load of 101.53 N/m2, which is 4.1% higher than the measure live load.
To further validate the method, seven classrooms were surveyed to compare the results obtained from the proposed method with those from direct measurements. Although the validation was based on only seven classrooms, the samples covered the two common layouts of ordinary university classrooms: movable desks and chairs and fixed desks and chairs. Table 4 summarizes the results and the corresponding discrepancies. The relative error ranged from 3.8% to 9.8%, which is close to the error level reported in previous live load survey studies [8]. In addition, the total deviation, calculated from the sums of the estimated and measured load amplitudes for the seven classrooms, was 0.65%. These results indicate that the proposed method can provide acceptable accuracy for preliminary large-scale classroom load surveys.
In terms of efficiency, a classroom survey can be completed in approximately 10 min using the group intelligence method. In contrast, direct weighing requires 30–60 min per classroom. Considering both accuracy and efficiency, the group-intelligence-based approach is feasible for practical engineering applications.

5. Load Amplitude Surveys Based on the Proposed Method

5.1. Survey Overview

The proposed group-intelligence-based method was used to quantify sustained load amplitudes in classrooms across multiple cities in China. The survey was conducted in several successive phases. Volunteers were recruited through WeChat Moments and notices posted on official WeChat accounts. The recruitment announcement specified key information, including eligible participants, research objectives, survey tasks, and questionnaire completion requirements.
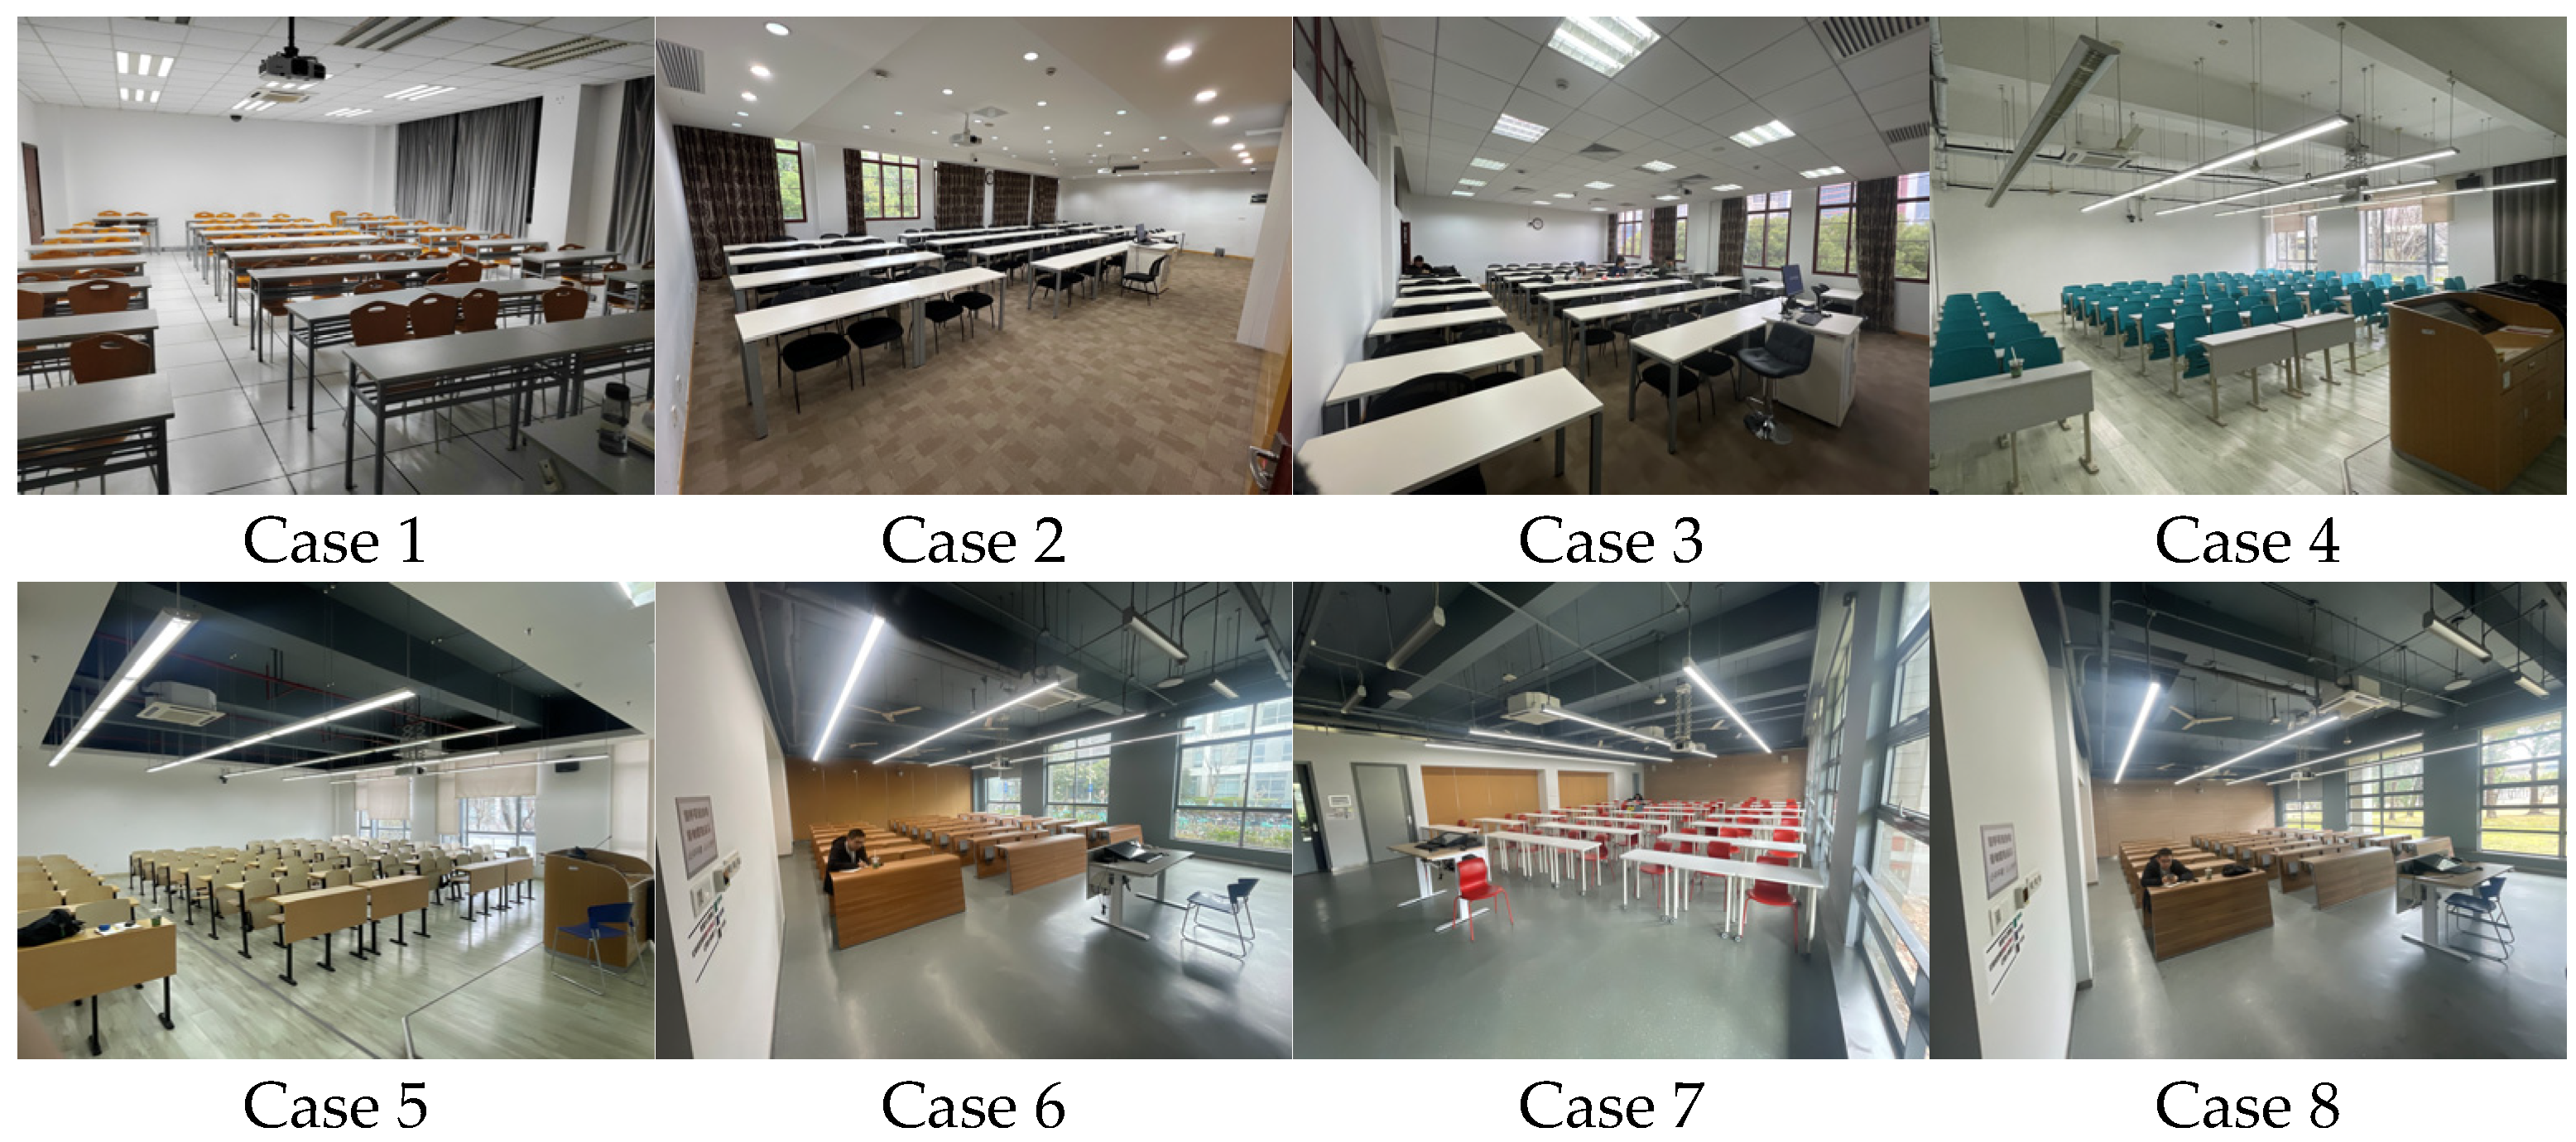
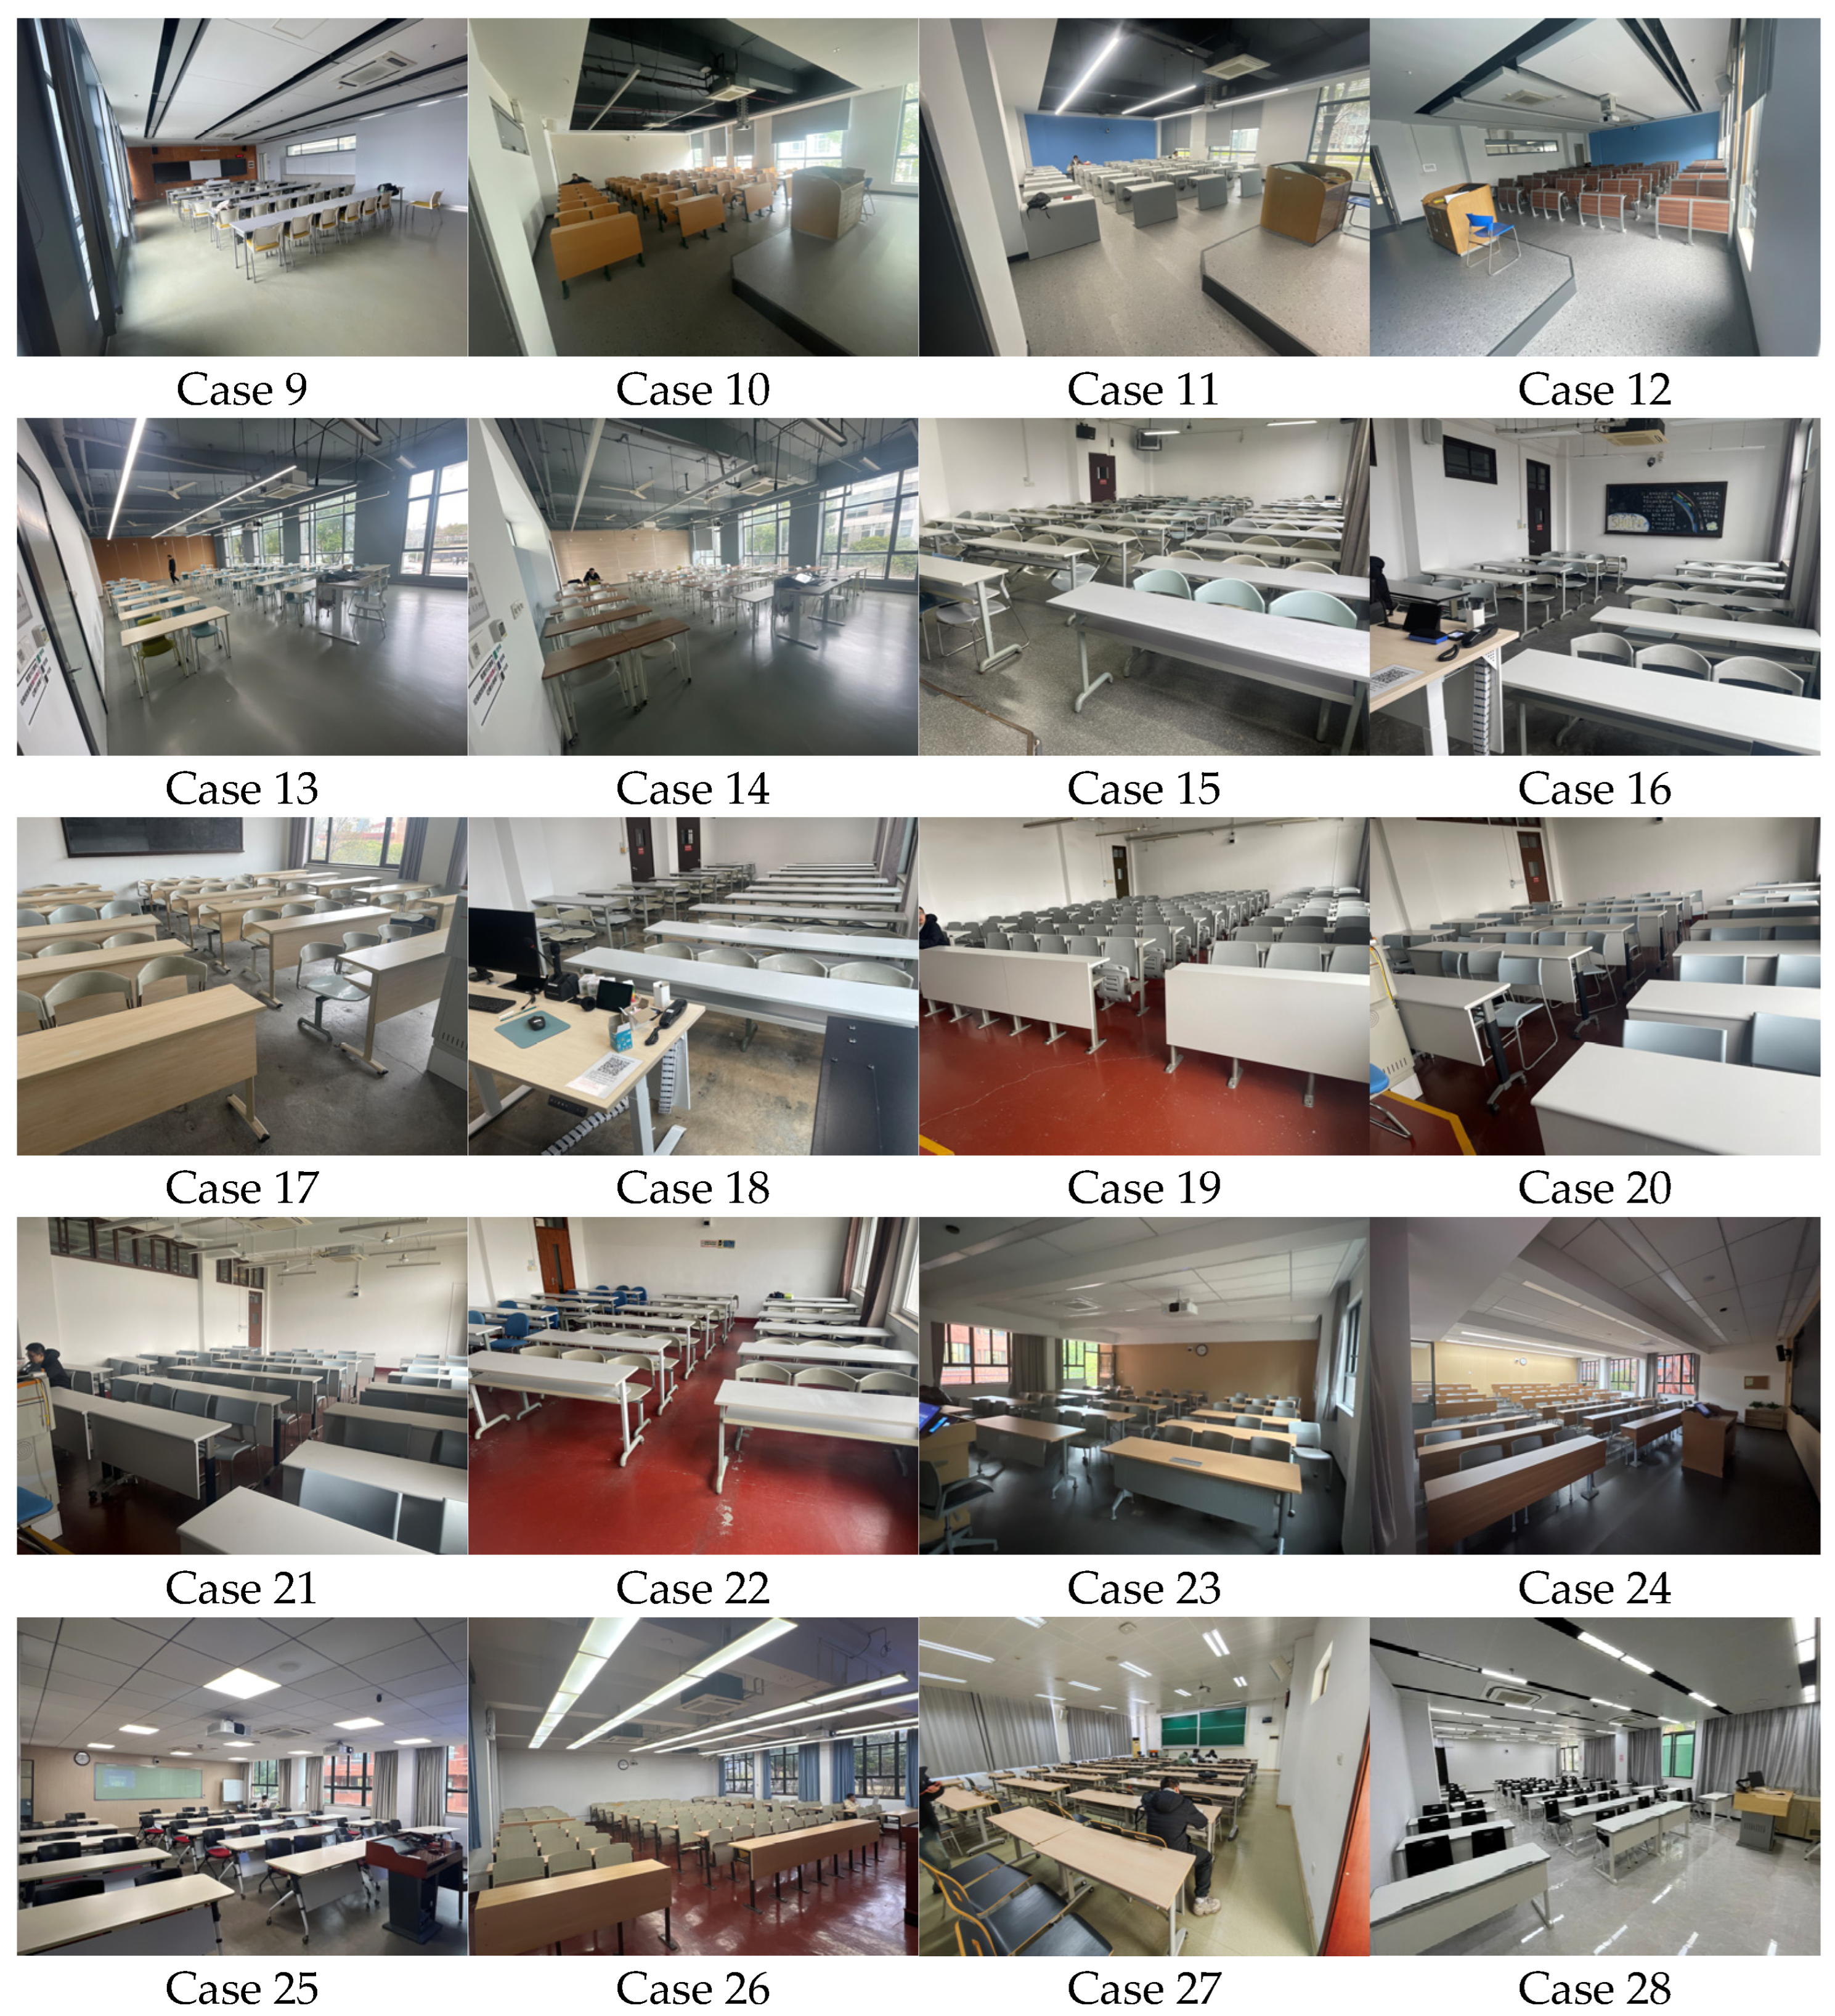
After its release, the notice received broad responses. Most recruited volunteers were university students or educators, who were familiar with classroom environments and able to complete the assigned tasks. In addition, the questionnaire was iteratively revised during data collection. Ultimately, 299 valid samples were obtained from 21 universities, covering a total floor area of 22,921 m2. A visual overview of the collected cases is shown in Figure 6, and the aggregated survey results are summarized in Table 5.

5.2. Statistical Analysis of Surveyed Classrooms

As the survey progressed, several common characteristics were observed despite differences among the classrooms. For example, the furniture types in these classrooms were generally similar. Although the overall dimensions varied across classrooms, the layout density of desks and chairs remained relatively consistent. Building load codes generally adopt load reduction factors for larger rooms. To examine the relationship between classroom area and load amplitude, a subsequent statistical analysis was conducted.

5.2.1. Number of Types of Furniture

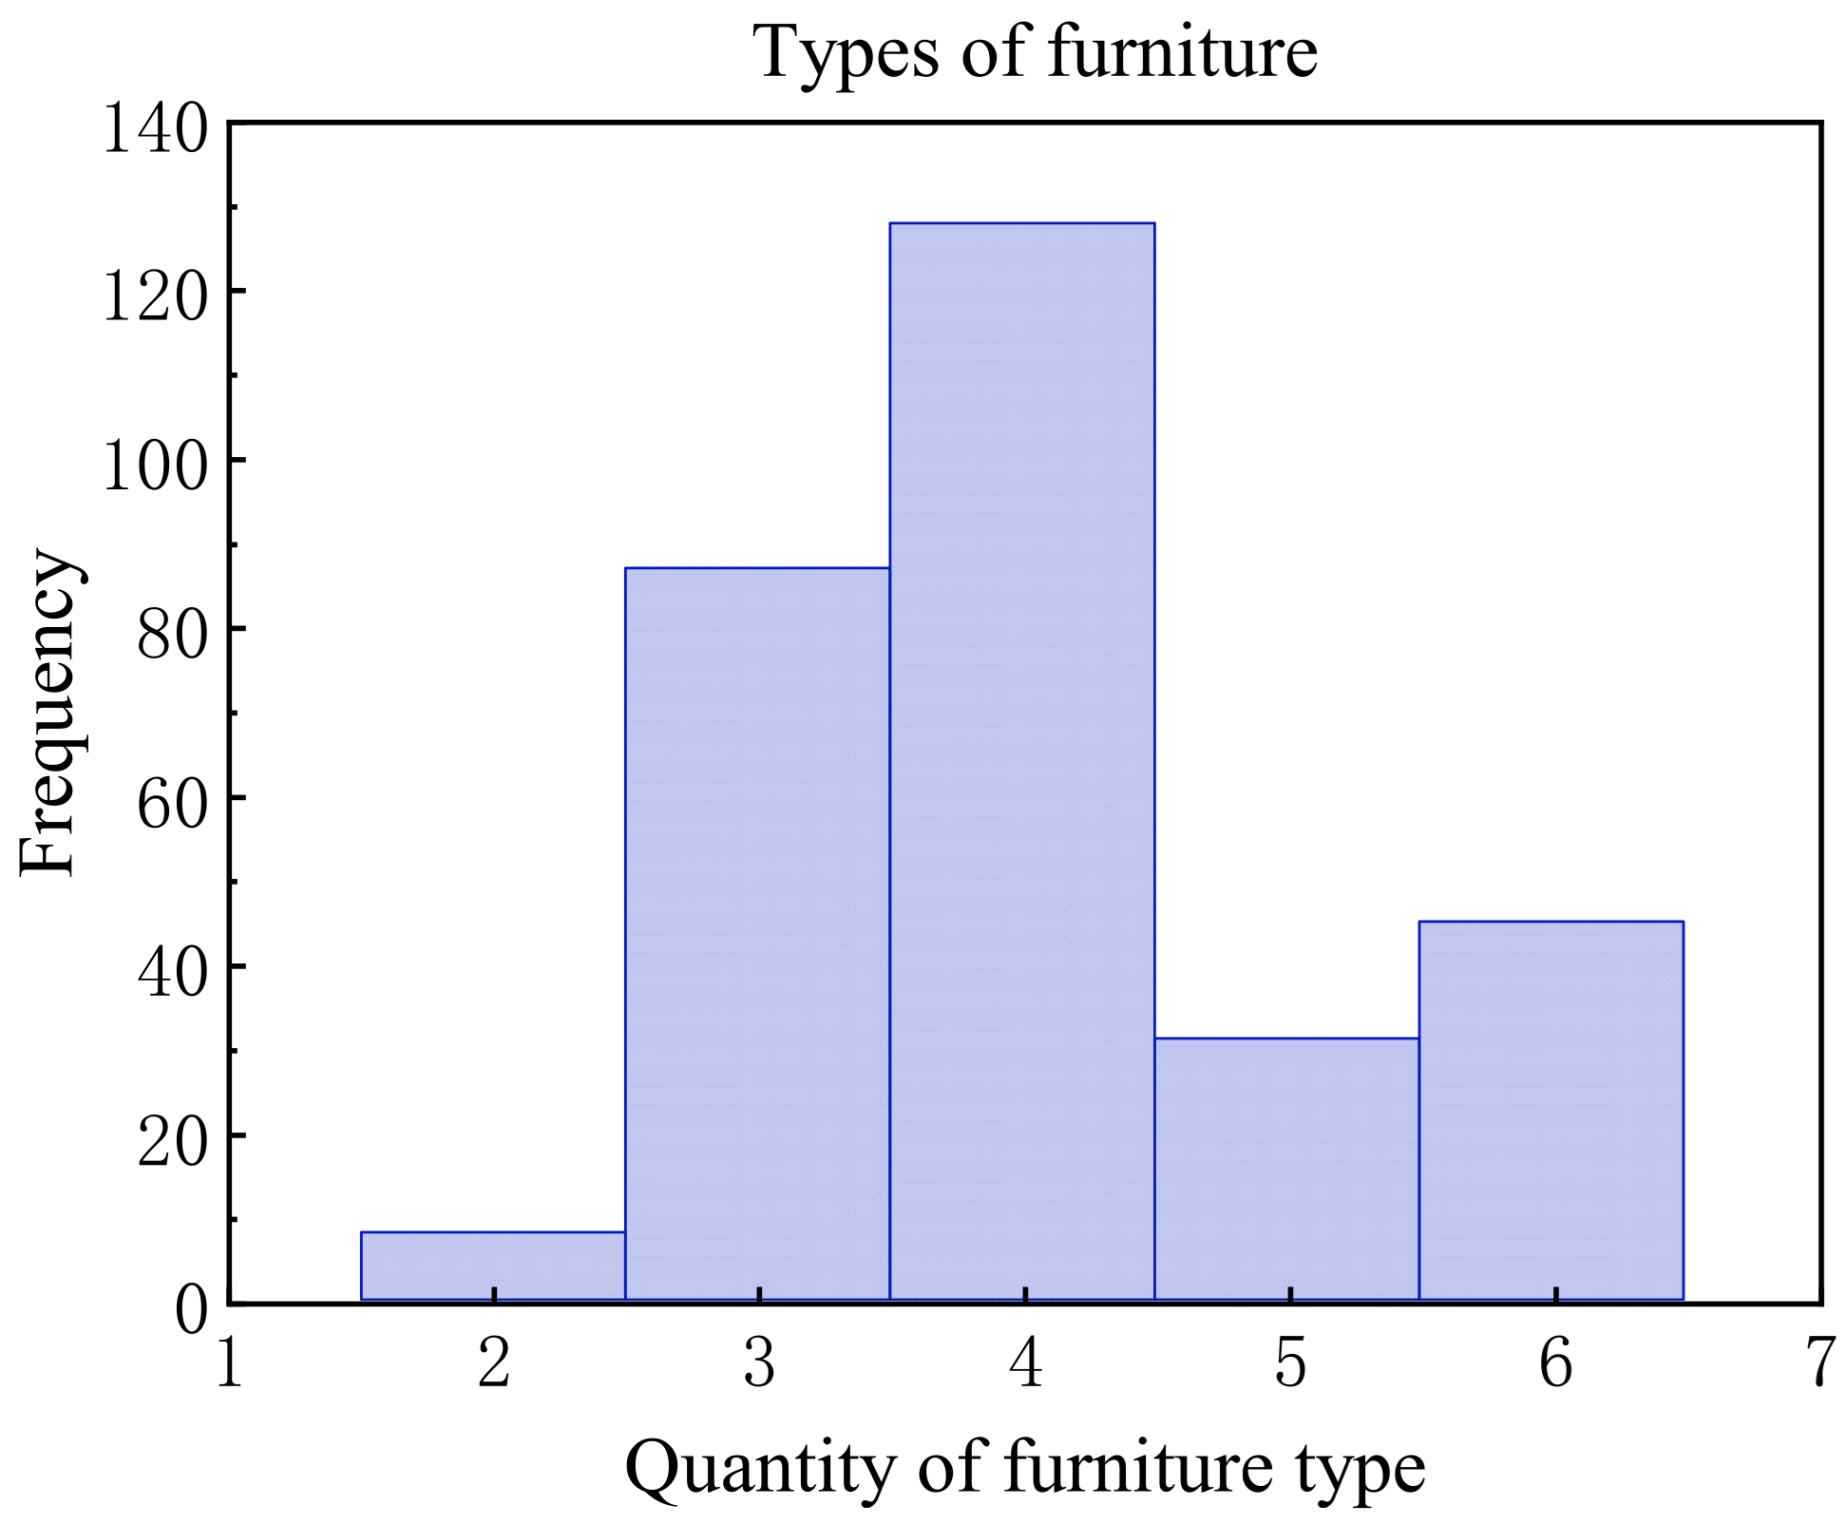
The survey showed that, in addition to standard furniture such as tables, chairs, and desks, classrooms contained other items, including equipment cabinets, coat racks, and televisions. In total, 16 furniture types were identified, as detailed in Appendix B. However, these 16 types did not occur in every classroom. As shown in Figure 7, the maximum number of furniture types observed in a single classroom was six.

5.2.2. Classroom Area

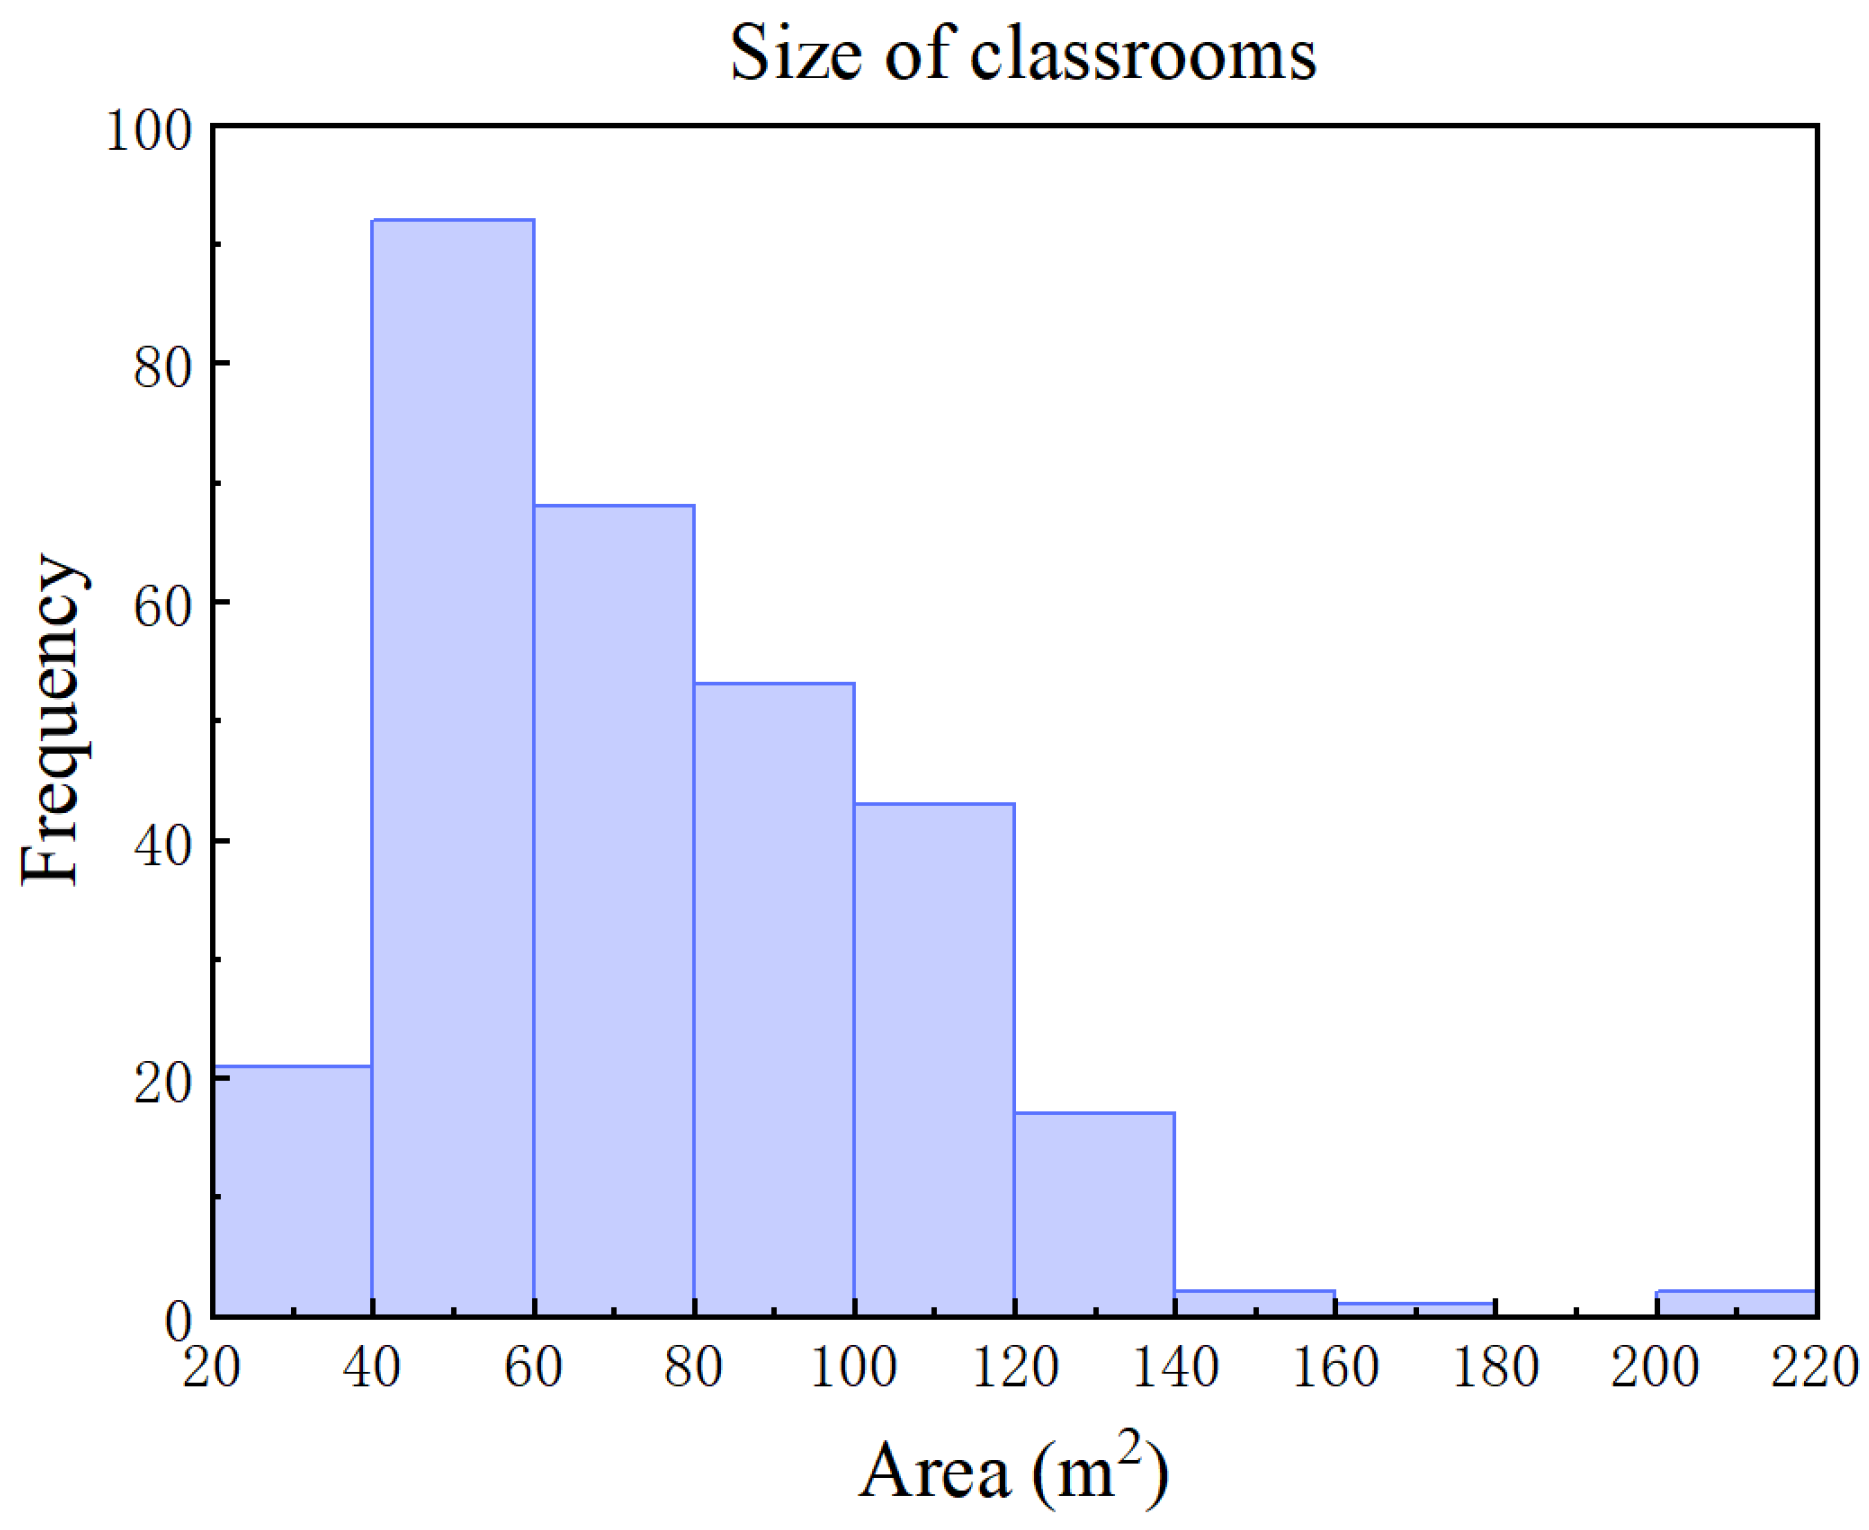
Among the 299 samples, the classroom area ranged from 31.68 m2 to 207.36 m2. Figure 8 shows the frequency distribution of classroom area. As shown in the figure, classrooms with areas of 50–60 m2 had the highest occurrence frequency.

5.2.3. Unit Load

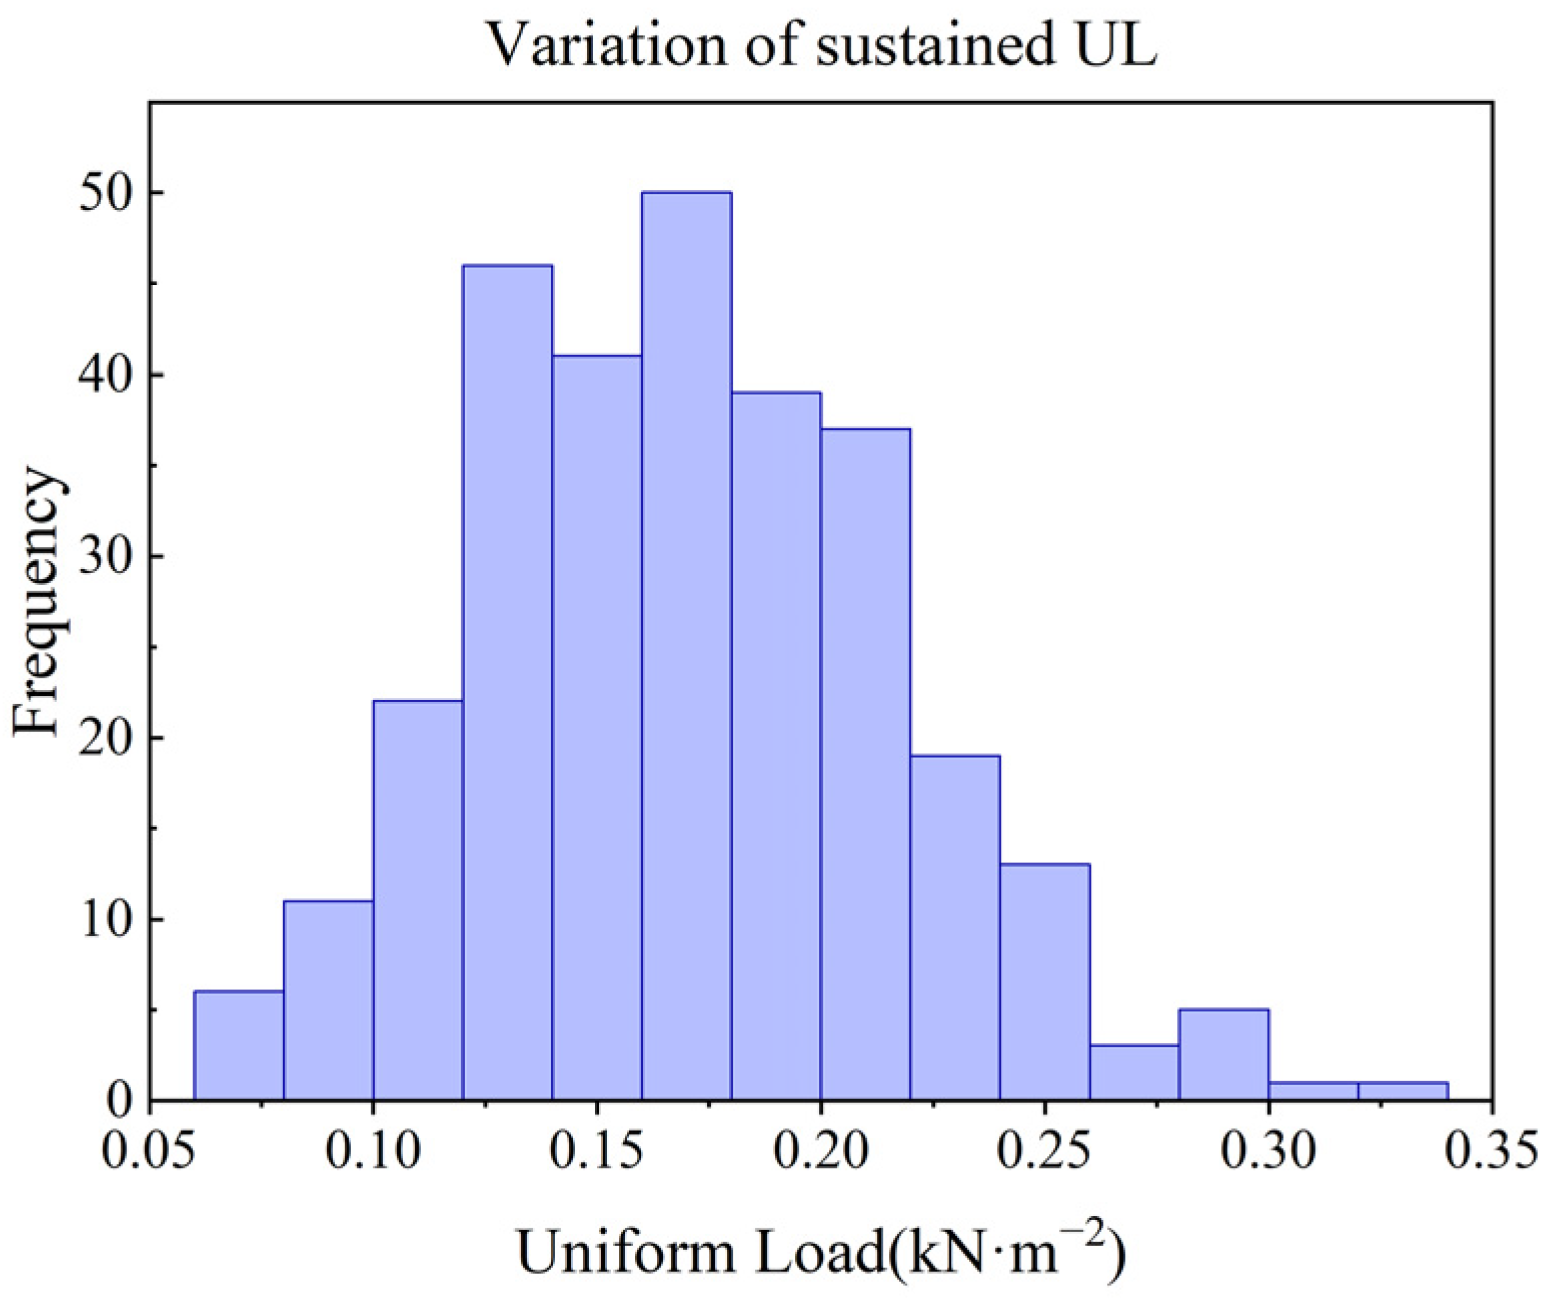
The frequency distribution of the unit load (UL) was also analyzed to identify typical and extreme load conditions in classrooms. As shown in Figure 9, the UL values of most classrooms ranged from 0.10 to 0.26 kN/m2, with a maximum value of 0.30 kN/m2.
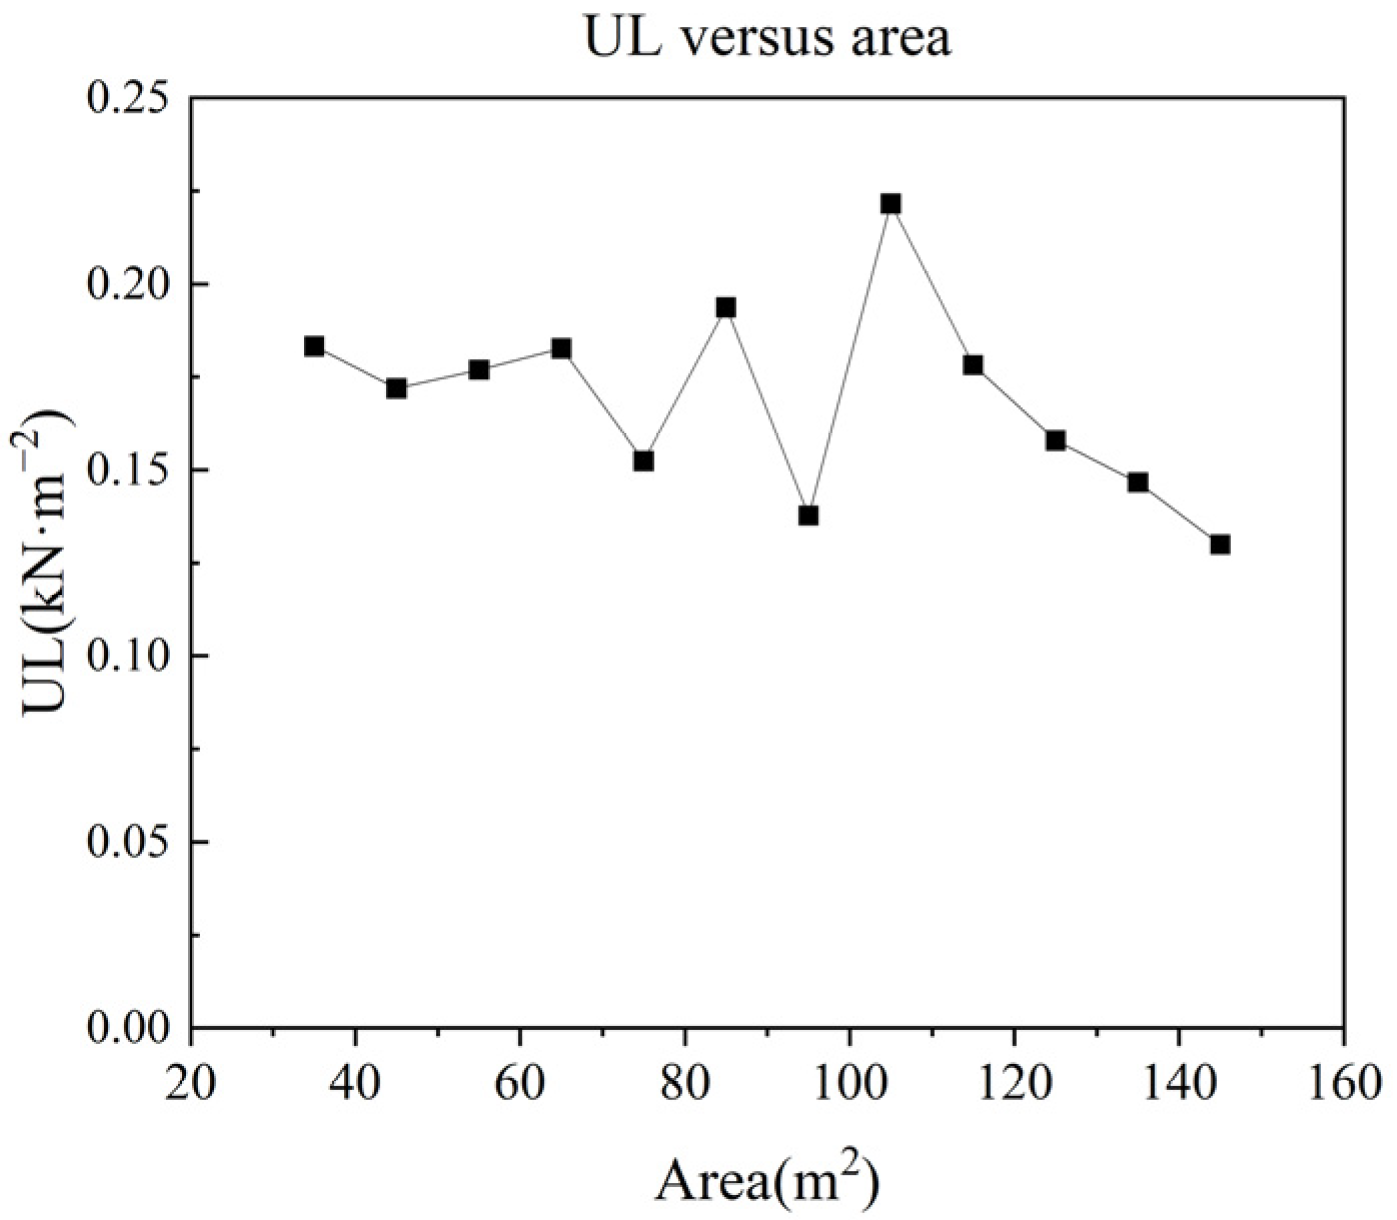
Consistent with common practice in load research [6,7,8], the relationship between UL and classroom area was examined. As shown in Figure 10, the UL of classrooms did not vary markedly with increasing area. This trend differs from that observed in office and residential buildings. A possible explanation is that most sustained loads in classrooms are contributed by desks and chairs, which are arranged at similar densities regardless of classroom size.

5.3. Load Modeling

5.3.1. Probability Model of Sustained Load at an Arbitrary Time Point

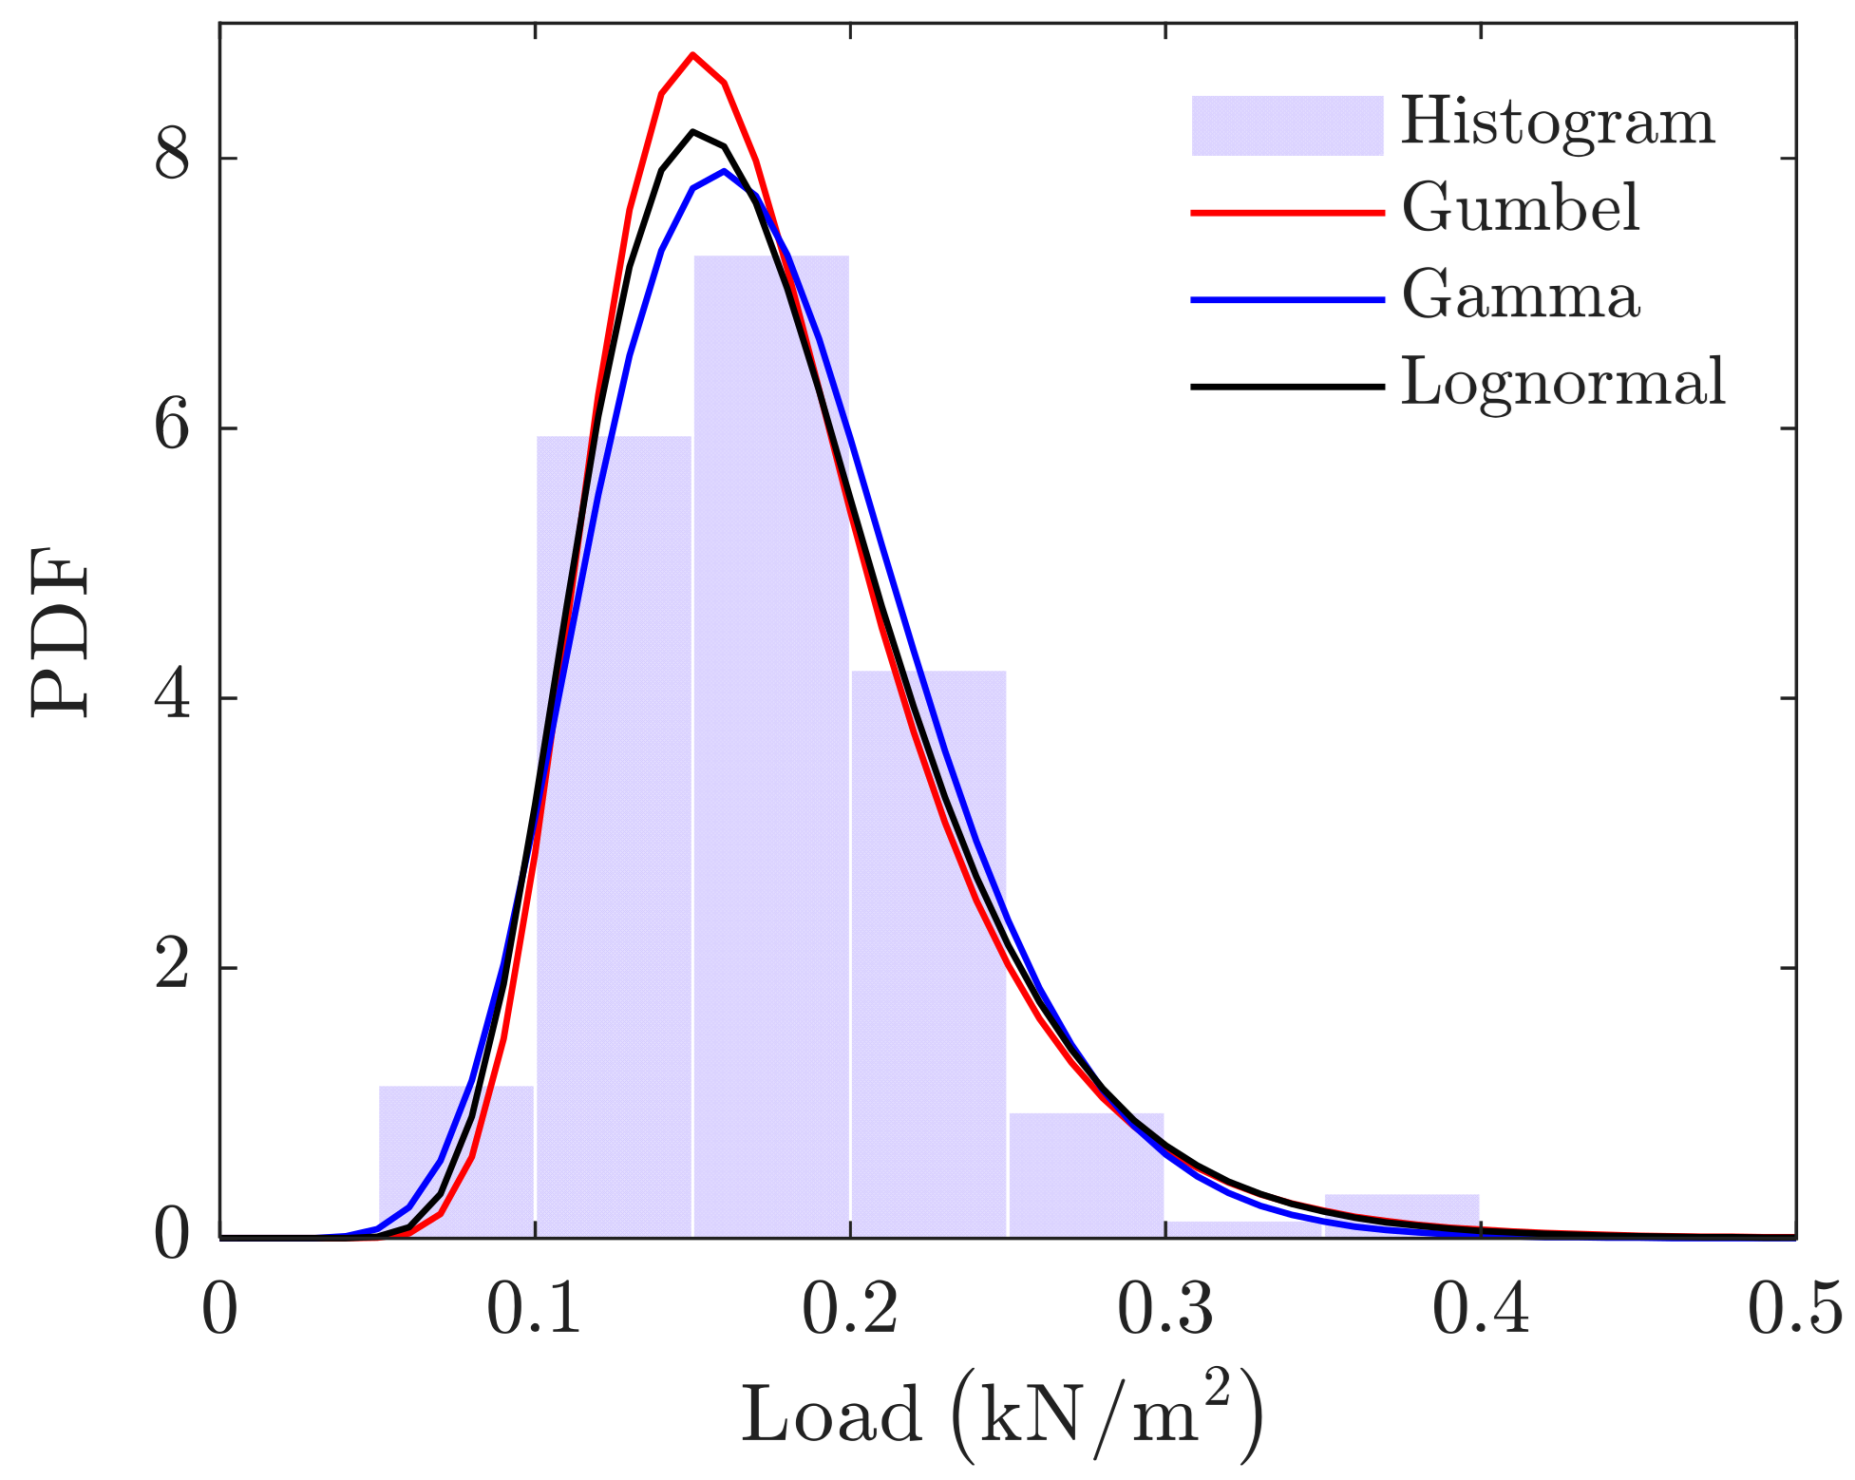
To analyze the collected data, three distribution models were selected. The first was the Gumbel distribution, which is commonly used in Chinese load codes to characterize extreme values [26,27]. The other two were the Gamma distribution and the lognormal distribution, both of which are widely used in international codes [35,36]. The three distribution types are shown in Figure 11.
To evaluate the goodness of fit of the candidate distributions, the Kolmogorov–Smirnov (K–S) test was first performed. For each candidate distribution, the null hypothesis (H0) was that the observed sustained load amplitudes follow the specified distribution, whereas the alternative hypothesis (H1) was that they do not follow the specified distribution. A p-value greater than 0.05 indicates that H0 cannot be rejected at the 5% significance level. However, this result does not prove that the tested distribution is the true or best-fitting model.
Therefore, the Akaike information criterion (AIC) and the Anderson–Darling (A–D) statistic were further used. The AIC was used to compare the overall fitting performance of the candidate distributions, whereas the A–D statistic was used as a tail-sensitive goodness-of-fit measure. A smaller AIC value indicates better overall model performance, and a smaller A–D statistic indicates better agreement between the empirical and theoretical distributions, particularly in the tails.
As shown in Table 6, the Gumbel, lognormal, and Gamma distributions all passed the K–S test at the 5% significance level. Therefore, none of the three candidate distributions can be rejected based on the K–S test alone. The lognormal distribution yielded a slightly smaller AIC value than the Gamma distribution, with values of −928.6804 and −928.6519, respectively. However, the difference between these two AIC values was only 0.0375, indicating that their overall fitting performances were practically indistinguishable. In contrast, the Gamma distribution produced a smaller A–D statistic than the lognormal distribution, with values of 0.6141 and 0.8100, respectively, suggesting better tail-sensitive fitting performance. Because upper-tail behavior is important for estimating the maximum sustained load and its high quantiles over the design reference period, the Gamma distribution was selected as the preferred probability model among the candidate distributions.
Using the collected dataset, the two parameters of the Gamma distribution, k (shape parameter) and θ (scale parameter), were calculated, as shown in Table 7. These parameters were then used to derive the expression for the arbitrary-point-in-time distribution of sustained load amplitudes in classrooms:
F L x = 0 x 1 Γ k θ k t k 1 e t θ d t

5.3.2. Probability Model of Maximum Sustained Load

Under the stationary binomial process assumption, the distribution of the maximum sustained load over a reference period T is given by the n-th power of the CDF of the arbitrary-point-in-time load amplitude. The corresponding CDF is expressed as follows:
F M x = 0 x 1 Γ k θ k t k 1 e t θ d t n
With the parameters k and θ in Equation (4) already determined (see Table 7), deriving the distribution of the maximum sustained load over the 50-year reference period (T = 50 years) requires only the calculation of n. This parameter denotes the average number of sustained load occurrences within the reference period. The average load duration, τ, was taken as 9.0 years based on the authors’ previous study on university classrooms [24]. This value was adopted because the building type and load characteristics in that study are consistent with those considered in the present research. Accordingly, the number of load changes during the reference period was r = T/τ = 5.56. Because the sustained load is continuously present, its occurrence probability p is 1, giving n = p·r = 5.56. On this basis, the probability distribution of the maximum classroom sustained load is determined as follows:
F M x = 0 x 1 Γ 11.08 × 0.01 6 11.08 t 11.08 e t 0.0158 d t 5.56

5.3.3. Discussion of the Results

Based on the derived CDF of the maximum sustained load, the values corresponding to selected quantiles were determined. Because the quantile level corresponding to the characteristic value of classroom live loads is not specified in previous Chinese load codes, this study selected reference quantiles based on those associated with residential and office live loads in code calibration studies [37,38]. Accordingly, the 92.1%, 97.4%, and 99% quantiles were adopted as comparative guarantee levels for discussing the maximum sustained live loads in university classrooms. The results are presented in Table 8.
Table 9 compares the characteristics and advantages of the proposed method with those of traditional methods. The comparison shows that the proposed method does not require on-site measurements or direct weighing and enables automated data processing.
The traditional direct measurement method requires investigators to enter the surveyed rooms to measure floor areas and weigh each item individually. Although the inventory method eliminates direct weighing, it still requires on-site work, including recording the specifications and characteristics of indoor items. In contrast, the proposed method allows researchers to complete the entire workflow online without visiting the site. Considering both time and labor requirements, the proposed method can obtain sustained load amplitude data with improved efficiency.

6. Concluding Remarks

6.1. Summary

This paper proposes a sustained load amplitude survey method based on group intelligence technology. The method addresses the long survey duration and poor timeliness of conventional approaches while providing low-cost and efficient data collection. Its accuracy was preliminarily validated through field measurements.
The method was applied to collect sustained load samples from classrooms, yielding 299 valid samples from 299 classrooms across 21 universities, with a total surveyed area exceeding 22,000 m2. This sample size is comparable to those of previous live load surveys [39]. The dataset provides an empirical basis for analyzing sustained live loads in the surveyed university classrooms. The results may also serve as a reference for ordinary university classrooms with similar functions and layouts.
In addition, this paper presents the probability distributions of both the arbitrary-point-in-time value and the maximum value of classroom sustained loads, which were modeled using the Gamma distribution.

6.2. Limitations

Although the proposed method shows potential for improving the efficiency of classroom sustained live load surveys, several limitations should be acknowledged.
(1)
The dataset has limitations in sampling representativeness and application scope. The samples were collected through voluntary participation, and recruitment was mainly conducted through WeChat Moments and official WeChat accounts. Therefore, the dataset may be affected by self-selection bias and social-network-related sampling bias. In addition, this study focused on ordinary university classrooms, whereas other educational spaces, such as high school classrooms, lecture halls, laboratories, and special teaching spaces, were not included. Future studies should expand the geographic coverage and include more universities and classroom types with different regional, functional, and construction characteristics.
(2)
Uncertainties remain in data collection, load evaluation, and validation. Because the proposed method relies partly on questionnaire data submitted by volunteers, measurement errors, reporting errors, omitted items, and inconsistencies in photographs or dimensional information may occur. In addition, furniture weights estimated using the e-inventory method may deviate from actual values because of differences in materials, internal structures, and manufacturing specifications. The field validation was based on seven classrooms and was mainly intended to demonstrate the preliminary feasibility of the proposed method, rather than to provide a complete statistical validation. More field-measured classrooms should be included in future studies to further quantify the accuracy, robustness, and uncertainty of the proposed method. The integration of multimodal large language models and computer vision techniques may also improve the automation and consistency of object identification and counting.
(3)
The probabilistic modeling and maximum load estimation depend on several assumptions. The estimated maximum sustained live load over the design reference period depends on the stationary binomial process model, the assumption of statistically independent sustained-load states, and the adopted average sustained-load duration used to determine the equivalent number of load states. These assumptions affect the estimated probability distribution and upper quantiles of the maximum sustained load. Future research should incorporate larger datasets, longer-term observations, and sensitivity analyses of key model parameters to improve the reliability of maximum sustained load estimation.

Author Contributions

Conceptualization, J.C.; methodology, J.C. and Z.L.; investigation, Z.L. and Z.C.; data curation, Z.C.; validation, W.W. and Z.C.; visualization, W.W.; writing—original draft, Z.L.; writing—review and editing, J.C. and W.W.; supervision, J.C.; funding acquisition, J.C. All authors have read and agreed to the published version of the manuscript.

Funding

This research was funded by National Natural Science Foundation of China: 52678255.

Data Availability Statement

The anonymized dataset used in this study has been deposited in a public data repository and is available at [Zenodo], DOI: [https://doi.org/10.5281/zenodo.22683457]. The dataset includes classroom area, and the calculated sustained live load values. Personal information, identifiable photographs, and institution-sensitive details have been removed before publication.

Conflicts of Interest

The authors declare no conflicts of interest.

Appendix A

Table A1. The detailed content of the questionnaire.
Questionnaire
1. Please provide your contact information.
2. University Name:
3. Campus:
4. Building Name and Classroom Number:
5. Take panoramic photos of the classroom.
6. Please use a measuring tool to measure the length and width of the classroom.
Length:      Width:
7. Take a photo of the desk.
8. Measure the dimensions of the desk.
Length:      Width:
9. Take photo of the chair.
10. Measure the dimension of the chair.
Length:      Width:      Height:
11. Number of Desks and Chairs:
12. Take photos of the podium.
13. Measure the dimension of the podium.
Length:      Width:      Height:
14. Take photos of other furniture in the classroom.
15. Measure the dimension of the furniture.
Length:      Width:      Height:
16. Take photos of electric appliances in the classroom.

Appendix B

Table A2. Interior contents and corresponding weights.
NumberItemWeight (kg)
1Tables and chairs8–27
2Podium45–105
3Platform100
4Projectors8
5Central air conditioner36.5
6Floor-standing air conditioner40
7Piano200
8Equipment cabinet42
9TV20
10File cabinet20.55–66.92
11Bookcase17.3–67.53
12Clothes-hanger6
13Floor-standing blackboard10
14Teaching integrated machine70
15Desktop computer15
16Vintage television30

References

  1. Cao, Z.X.; Cao, P. Load of Civil Engineering Structure; China Water & Power Press: Beijing, China, 2006. (In Chinese) [Google Scholar]
  2. Costa, L.G.L.; Beck, A.T. A critical review of probabilistic live load models for buildings: Models, surveys, Eurocode statistics and reliability-based calibration. Struct. Saf. 2024, 106, 102411. [Google Scholar] [CrossRef] [Scilit]
  3. Li, J. On the third generation of structural design theory. J. Tongji Univ. (Nat. Sci.) 2017, 45, 617–632. (In Chinese) [Google Scholar]
  4. Peir, J.C.; Cornell, C.A. Spatial and temporal variability of live loads. J. Struct. Div. 1973, 99, 903–922. [Google Scholar] [CrossRef] [Scilit]
  5. Peir, J.C. A Stochastic Live Load Model for Buildings; Massachusetts Institute of Technology: Cambridge, MA, USA, 1972. [Google Scholar]
  6. Mitchell, G.R.; Woodgate, R.W. Floor Loadings in Office Buildings: The Results of a Survey; Building Research Station: Watford, UK, 1971. [Google Scholar]
  7. Choi, E.C.C. Live load model for office buildings. J. Struct. Eng. 1989, 67, 421–425. [Google Scholar] [CrossRef] [Scilit]
  8. Culver, C.; Kushner, J. A Program for Survey of Fire Loads and Live Loads in Office Buildings; National Bureau of Standards: Washington, DC, USA, 1975. [Google Scholar]
  9. Li, J.; Lin, Z.; Li, M. Probabilistic Limit States Design of Building Structure; China Architecture & Building Press: Beijing, China, 1990; pp. 278–292. (In Chinese) [Google Scholar]
  10. Andam, K.A. Floor live loads for office buildings. Build. Environ. 1986, 21, 211–219. [Google Scholar] [CrossRef] [Scilit]
  11. Kumar, S. Live loads in office buildings: Lifetime maximum load. Build. Environ. 2002, 37, 91–99. [Google Scholar] [CrossRef] [Scilit]
  12. Ruiz, S.E.; Soriano, A. Design live loads for office buildings in Mexico and the United States. J. Struct. Eng. 1997, 123, 816–822. [Google Scholar] [CrossRef] [Scilit]
  13. Wu, W.; Dou, K.; Chen, J. Big data-driven online survey methodology for building sustained load amplitude: Verification and applications. Eng. Struct. 2025, 343, 121053. [Google Scholar] [CrossRef] [Scilit]
  14. Karman, T. Statistical Investigations on Live Loads on Floors; Int Council for Building Research, Studies and Documentation: Madrid, Spain, 1969. [Google Scholar]
  15. Sjolin, V. Fire in a Flat-Ignited Through Heat Radiation from Nuclear Arms; Swedish Defence Research Authority: Stockholm, Sweden, 1969. [Google Scholar]
  16. Sentler, L. A Live Load Survey in Domestic Houses, R47; Division of Building Technology, Lund Institute of Technology: Lund, Sweden, 1974. [Google Scholar]
  17. Issen, L.A. Single-Family Residential Fire and Live Loads Survey; US Department of Commerce, National Bureau of Standards: Washington, DC, USA, 1980. [Google Scholar]
  18. Andam, K.A. Live load studies for buildings in Ghana. Proc. Inst. Civ. Eng. 1990, 89, 295–299. [Google Scholar] [CrossRef] [Scilit]
  19. Ge, S. The Survey and Statistical Analysis of Live Loads of Residential Buildings in the Central Plains Region. Master’s Thesis, Zhengzhou University, Zhengzhou, China, 2004. (In Chinese) [Google Scholar]
  20. Niu, J. Investigation and Statistical Analysis on Floor Loads of Typical Residential Buildings. Master’s Thesis, Xi’an University of Architecture and Technology, Xi’an, China, 2004. (In Chinese) [Google Scholar]
  21. Niu, J.; Niu, D. Investigation and statistical analysis on the floor loads of residential building. J. Xi’an Univ. Archit. Technol. 2006, 38, 214–220. (In Chinese) [Google Scholar]
  22. Andam, K.A. Variability in stochastic sustained and extraordinary load processes. Build. Environ. 1990, 25, 389–396. [Google Scholar] [CrossRef] [Scilit]
  23. Ruiz, S.E.; Sampayo-Trujillo, A. Design live loads for classrooms in United States and Mexico. J. Struct. Eng. 1997, 123, 1652–1657. [Google Scholar] [CrossRef] [Scilit]
  24. Chen, Z.; Chen, J. Survey and statistical analysis of live loads of classroom based on multi-source data. Struct. Eng. 2023, 39, 46–53. (In Chinese) [Google Scholar]
  25. Ferry, B.J.; Castanheta, M. Structural Safety; Laboratorio Nacional de Engenharia Civil: Lisbon, Portugal, 1971. [Google Scholar]
  26. GB50009-2012; Load Code for the Design of Building Structures. China Architecture & Building Press: Beijing, China, 2012.
  27. GB 55001-2021; General Code for Engineering Structures. China Architecture & Building Press: Beijing, China, 2021. (In Chinese)
  28. Guo, B.; Wang, Z.; Yu, Z.; Wang, Y.; Yen, N.Y.; Huang, R.; Zhou, X. Mobile crowd sensing and computing: The review of an emerging human-powered sensing paradigm. ACM Comput. Surv. 2015, 48, 1–31. [Google Scholar]
  29. Rehman, M.H.; Liew, C.S.; Wah, T.Y.; Khan, M.K. Towards next-generation heterogeneous mobile data stream mining applications: Opportunities, challenges, and future research directions. J. Netw. Comput. Appl. 2017, 79, 1–24. [Google Scholar] [CrossRef] [Scilit]
  30. Herrero, R. Mobile shared resources in the context of IoT low power lossy networks. Internet Things 2020, 12, 100274. [Google Scholar] [CrossRef] [Scilit]
  31. Wu, K.; Wu, J.; Ye, M. A review on the application of social media data in natural disaster emergency management. Prog. Geogr. 2020, 39, 1412–1422. (In Chinese) [Google Scholar] [CrossRef] [Scilit]
  32. Kejriwal, M.; Gu, Y. A pipeline for post-crisis Twitter data acquisition. arXiv 2018, arXiv:1801.05881. [Google Scholar]
  33. Li, Y.; Chen, J. Structural live load surveys by deep learning. Smart Struct. Syst. 2022, 30, 145–157. [Google Scholar]
  34. Chen, J.; Wu, W.; Dou, K.; Xu, C.; Li, J. Study on survey method for office floor live load based on network big data. China Civ. Eng. J. 2025, 58, 1–9. (In Chinese) [Google Scholar]
  35. ASCE/SEI 7-22; Minimum Design Loads and Associated Criteria for Buildings and Other Structures. American Society of Civil Engineers (ASCE): Reston, VA, USA, 2022.
  36. Joint Committee on Structural Safety (JCSS). Probabilistic Model Code: Part 2: Load Models; JCSS: Shanghai, China, 2001. [Google Scholar]
  37. GBJ 9-87; Load Code for the Design of Building Structures. State Planning Commission of PRC: Beijing, China; China Architecture & Building Press: Beijing, China, 1988. (In Chinese)
  38. GB 50009-2001; Load Code for the Design of Building Structures. Ministry of Construction of PRC, General Administration of Quality Supervision, Inspection and Quarantine of PRC: Beijing, China; China Architecture & Building Press: Beijing, China, 2001. (In Chinese)
  39. TJ 9-74; Load Code for the Design of Industrial and Civil Buildings (Trial). State Capital Construction Commission of PRC: Beijing, China; China Architecture & Building Press: Beijing, China, 1974. (In Chinese)
Figure 1. Schematic diagram of the stationary binomial process.
Buildings 16 03689 g001
Figure 2. Schematic diagram of the proposed survey approach.
Buildings 16 03689 g002
Figure 3. A partial screenshot of the survey questionnaire.
Buildings 16 03689 g003
Figure 4. Scene of classroom 1.
Buildings 16 03689 g004
Figure 5. Scene of classroom 2.
Buildings 16 03689 g005
Figure 6. Samples of surveyed classrooms.
Buildings 16 03689 g006aBuildings 16 03689 g006b
Figure 7. Histogram of the frequency distribution of furniture types.
Buildings 16 03689 g007
Figure 8. Histogram of the frequency distribution of classroom area.
Buildings 16 03689 g008
Figure 9. Frequency histogram of UL.
Buildings 16 03689 g009
Figure 10. Relationship between UL and area.
Buildings 16 03689 g010
Figure 11. Histogram and probability density function (PDF) curves fitted by different distributions.
Buildings 16 03689 g011
Table 1. Overview of live load surveys.
TypeAreaSize (m2)Time
Office
buildings
UK163,0001965–1967 [6]
Australia144,0001972–1979 [7]
USA53,9331974–1975 [8]
China63,7001977–1979 [9]
Ghana27,8181985 [10]
India11,7201992–1993 [11]
Mexico14,8901997 [12]
China90,0002024 [13]
Residential
buildings
Hungary183 residencesAround 1960 [14]
Sweden341 rooms1969 [15,16]
USA359 residences1976 [17]
China70141977–1979 [9]
Ghana59691985–1987 [18]
China52812002–2003 [19]
China78792004 [20,21]
China43,9412022
China75,0002024 [13]
Classroom
buildings
Ghana70701987 [22]
Mexico13,7001997 [23]
China76802021 [24]
Table 2. Comparison of live load survey items for Classroom 1.
Item NameQuantityE-Inventory Result (kg)Actual Measured Result (kg)
Unit WeightTotal WeightUnit WeightTotal Weight
Desks and chairs7014.3100114.831038.1
Projectors1886.96.9
Podium1767685.5585.55
Air conditioner236.57336.573
Clothes cabinet134.6534.6546.1546.15
Table 3. Comparison of live load survey items for Classroom 2.
Item NameQuantityE-Inventory Result (kg)Field Measured Result (kg)
Unit WeightTotal WeightUnit WeightTotal Weight
Desks and chairs4213.2554.412.2512.4
Projectors18820.120.1
Podium1767685.5585.55
Air conditioner436.514636.5146
Table 4. Comparison of two methods and deviation analysis.
Classroom1234567Total
New method/ N · m 2 148.94134.08101.53115.05160.05166.35118.56944.56
Field measurement/ N · m 2 135.67124.6197.50123.50172.24172.97111.94938.43
Deviation9.78%7.60%4.13%6.84%7.07%3.83%5.91%0.65%
Table 5. Summary of survey data obtained using the group intelligence based method.
Province of universityShanghai, Zhejiang, Jiangsu, Sichuan
Number of Samples299
Total area/m222,921
Mean amplitude/ kN · m 2 0.1746
Standard deviation/ kN · m 2 0.0538
Table 6. Goodness of fit results for different candidate distributions.
K–S p ValueK–S Test ResultAICA–D Statistic
Gumbel distribution0.6738Pass−927.16361.0387
Lognormal distribution0.7076Pass−928.68040.8100
Gamma distribution0.7227Pass−928.65190.6141
Table 7. Parameters of the sustained load distribution function.
Mean value/kN·m−20.1746
Standard deviation/kN·m−20.0538
Distribution parameterShape parameter k11.0842
Scale parameter θ0.0158
Table 8. Values of maximum sustained load at different quantiles.
Quantile92.1%97.4%99.0%
Quantile value/kN·m−20.31010.34270.3687
Table 9. Combination among different survey methods.
On-Site SurveyInventory MethodProposed Method
MeasuringOn-siteOn-siteOnline
Weight acquisitionOn-siteOffice workOnline
ProcessingManualSemi-automaticAutomated
Disclaimer/Publisher’s Note: The statements, opinions and data contained in all publications are solely those of the individual author(s) and contributor(s) and not of MDPI and/or the editor(s). MDPI and/or the editor(s) disclaim responsibility for any injury to people or property resulting from any ideas, methods, instructions or products referred to in the content.