1. Introduction
Underground utility tunnels are a crucial component of urban lifeline engineering, and their safe service directly impacts the stable operation of municipal systems, including water supply and drainage, power supply, and communication networks. With urban development, new buildings are increasingly constructed adjacent to or across existing underground utility tunnels. The additional loads generated during construction and service may change the stress state of the foundation soil and cause uneven settlement around the tunnel [
1,
2,
3]. When these effects are combined with cyclic loadings, cracking, increased deformation, or even local damage may occur in the tunnel structure [
4,
5,
6,
7]. Therefore, establishing a reliable mechanism to coordinate load transfer and settlement deformation between new buildings and existing tunnels is critical for the safe operation of underground utility tunnels.
To address this issue, engineering measures, such as foamed-concrete replacement and structural truss underpinning, are commonly employed [
8,
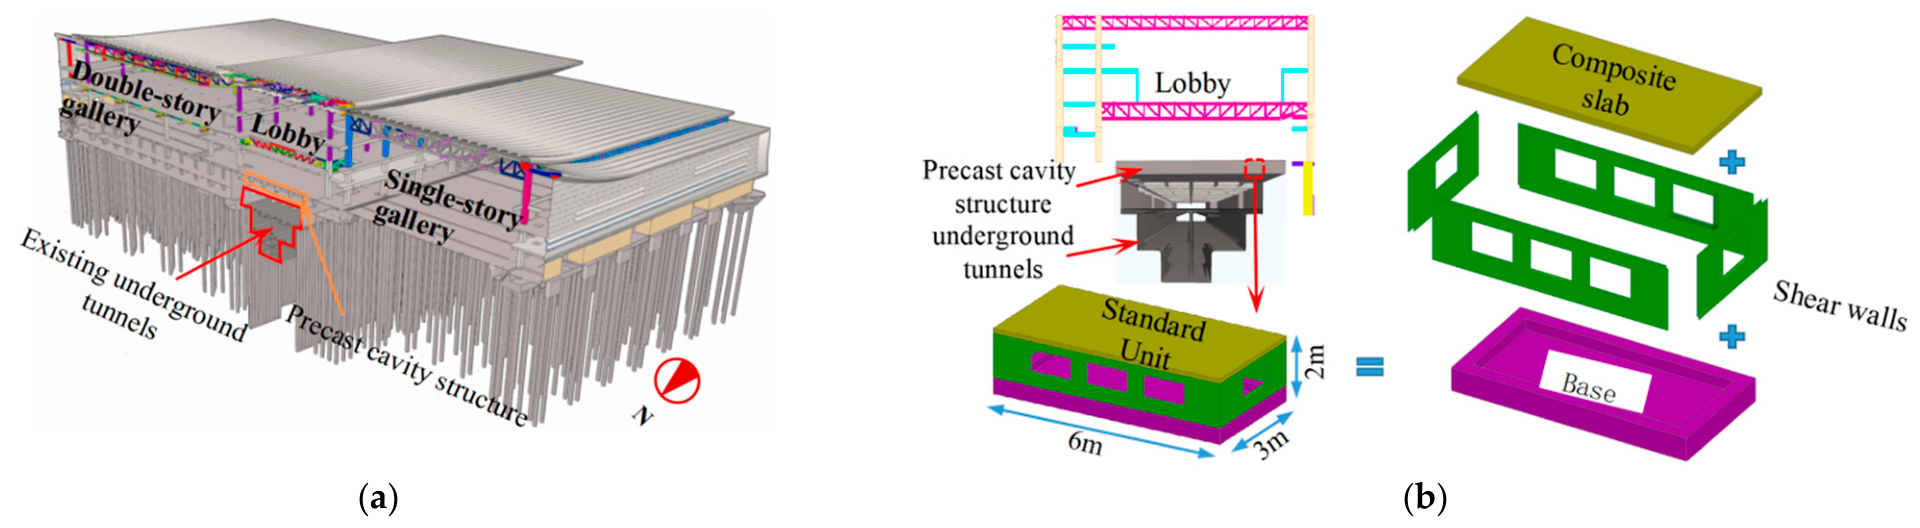
9]. Foamed-concrete replacement is economically viable to a certain degree but demands complex waterproofing details; thus, its long-term performance is significantly influenced by the groundwater environment. Truss underpinning can offer a clear load-transfer path, but it is costly, difficult to build, and requires high existing site conditions and construction accuracy. Considering structural safety, construction convenience, and economy, the authors proposed a technical approach for the Zhengzhou Central Cultural District (CCD) Cultural Exchange Center project. In this approach, precast cavity structures are used to replace the soil above underground utility tunnels [
10], as depicted in
Figure 1a. The cavity units form a controllable vertical and lateral resistance system between the foundation of the new building and the existing tunnel, so that the vertical load on the roof slab of the existing tunnel remains essentially unchanged, thereby reducing direct additional load transfer and controlling foundation settlement.
In addition to the settlement control function, the precast cavity structure should maintain adequate seismic safety under multidirectional ground motions. Previous studies on underground structural components have indicated that vertical ground motion can modify force paths and damage susceptibility. Vertical excitation can amplify the axial force in central columns and affect their deformation capacity and seismic vulnerability [
11,
12]. In utility-tunnel branch systems, tridirectional ground-motion input can exacerbate damage at branch joints and lead to local stress concentrations in pipeline connections [
13]. Component-based fragility analyses further indicate that the individual damage contributions of different components should be considered when horizontal and vertical excitations are combined [
14]. However, the in-plane cyclic load-transfer mechanism and failure process of precast wall components with large openings remain insufficiently understood.
These findings underscore the need to examine the component-level seismic response of the proposed precast cavity structure. As shown in
Figure 2b, precast RC shear walls with openings serve as the core load-carrying and seismic-resisting components, and their mechanical performance directly affects the overall static and seismic performance of the cavity structure. Existing studies on shear walls with openings primarily concentrate on above-ground building structures that suffer horizontal cyclic loading. Hosseini et al. [
15] investigated the seismic performance of regular reinforced concrete (RC) shear walls containing cut-out openings. The test results indicate that the openings changed the failure mode from diagonal compression failure to sliding shear failure and diagonal tension failure. Also, the increase in the opening eccentricity decreased the energy dissipation. Xu et al. [
16] discovered that openings transform the failure mode of squat shear walls from shear failure to flexural failure, and that both the load-carrying capacity and secant stiffness decline as the opening area ratio and shear-span ratio increase. Xu et al. [
17] reported that the vertical position of an opening in a squat shear wall has a substantial impact on the failure mode and load-carrying capacity; the ductility and energy-dissipation capacity decrease as the opening is situated lower. Wang et al. [
18] examined the seismic performance of semi-dry connected precast shear walls with openings through numerical simulation. They found that increasing the opening ratio diminishes the overall wall performance. Li et al. [
19] reported that the failure modes of shear walls without openings and the wall with two vertical post-openings in the middle are flexural-shear failure, while those of the shear wall with one post-opening in the middle or two horizontal post-openings in the middle are shear failure of the wall limbs.
Recently, high-performance concrete materials have been employed to enhance the seismic performance of structural components [
20,
21]. Li [
22] employed modified reactive powder concrete (RPC) to strengthen shear walls with openings. After strengthening, the load-carrying capacity was even greater than that of walls without openings, and the ultimate drift ratio and ductility were also notably enhanced. Yu [
23] utilized ultra-high-performance concrete (UHPC) to repair earthquake-damaged shear walls with openings. The test results indicated that UHPC can restore the initial stiffness and enhance the load-carrying capacity and ductility. However, the influence of the pre-damage level on seismic performance was minimal. Zhang et al. [
24,
25] compared regular shear walls with openings and steel fiber-reinforced concrete shear walls with openings. They discovered that steel fiber-reinforced concrete can postpone crack propagation and improve the load-carrying capacity and energy-dissipation capacity. Bhanu et al. [
26] studied the effects of the opening orientation and steel fibers on slender high-performance concrete (HPC) shear walls. They concluded that the addition of steel fibers (volume fraction 0.5%) was more effective in the specimens with openings than the solid specimens. In addition to new materials, new methods, e.g., data-driven methods, have also been used to assess the seismic performance of RC shear walls and to clarify influential geometric, reinforcement, and loading features [
27]. Such methods complement physical tests when a large and diverse dataset is available. For shear walls with openings, the parameters of the openings will alter the load-transfer mechanism, internal force distribution, and failure characteristics of the shear walls, thereby making the interactions between parameters more complex. Nevertheless, the above studies mainly focus on the in-plane horizontal cyclic response of walls with openings; the effects of vertical cyclic response or out-of-plane deformation associated with multidirectional seismic excitation remain insufficiently addressed. Also, mature data-driven methods have been rarely reported.
On the other hand, the response of RC shear walls under vertical or multi-axial seismic loading conditions has also received growing attention. Multi-axial cyclic tests have shown that varying axial force and out-of-plane deformation can affect the shear strength, deformation capacity, and failure mechanism of RC walls [
28,
29,
30]. Nevertheless, these studies mainly concern monolithic walls or nuclear power plant structures and do not address the in-plane load-transfer mechanism of precast walls with openings used as cavity components in underground engineering.
Overall, existing research has established the influence of opening details and material enhancement on the in-plane horizontal cyclic performance of RC shear walls. Studies of multi-axial wall response have further confirmed the sensitivity of shear behavior to axial-force variation and out-of-plane deformation. However, the cyclic behavior of precast RC shear walls with large openings used in underground cavity structures remains insufficiently understood, particularly with respect to the directional load-transfer path and failure process under orthogonal loading configurations. This gap needs to be addressed because vertical ground motion may alter the force state of underground components [
31].
Based on the Zhengzhou Cultural Exchange Center project, this study presents an experimental investigation of RC shear walls with openings in an underground precast cavity structure crossing a utility tunnel. Two specimens were designed and tested under cyclic loading. The seismic performance of the shear wall with openings under horizontal and vertical cyclic loadings was investigated. The failure modes, hysteretic curves, and seismic performance indices were comprehensively analyzed, and the influence of the seismic-action direction on seismic performance was revealed. In addition, the load-carrying capacities were predicted using existing models, and their performances were evaluated using existing test results. Finally, design recommendations are provided.
2. Experimental Program
2.1. Specimen Details
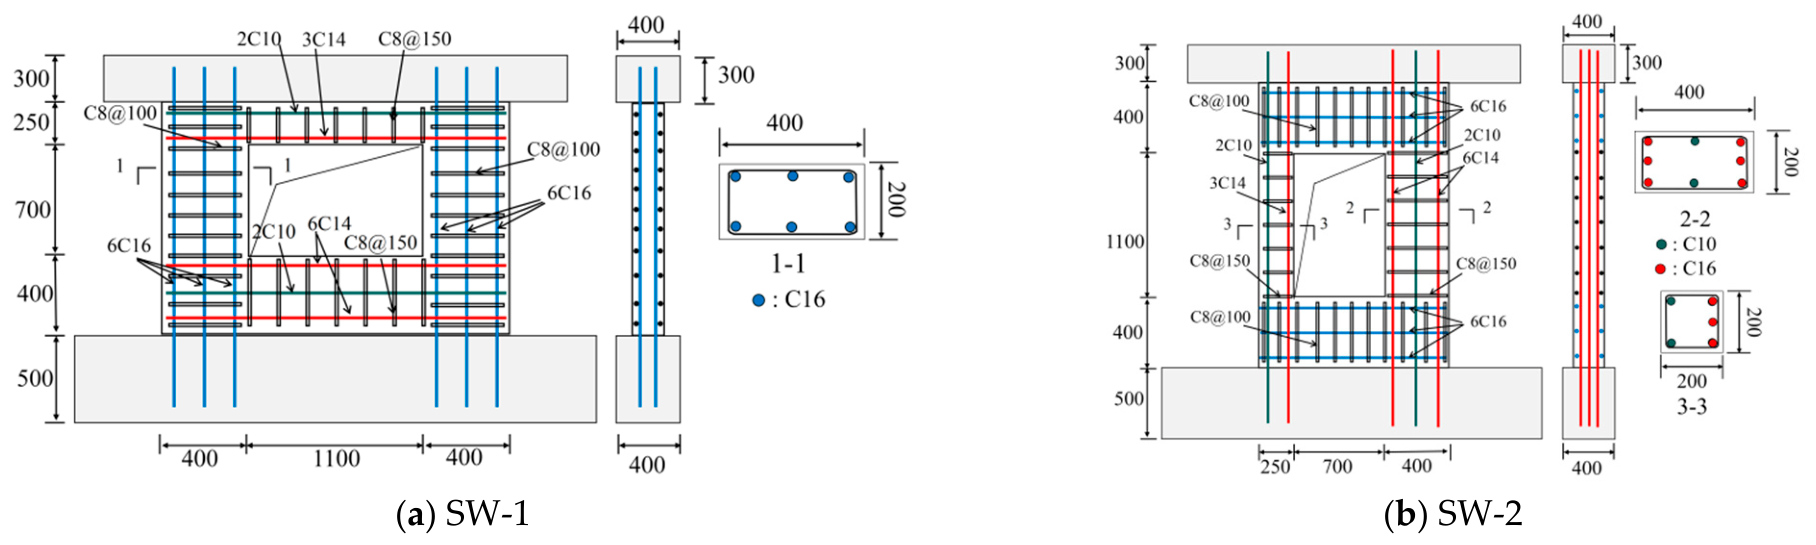
In this study, two shear wall specimens with openings were designed. Their geometric and reinforcement details are presented in
Figure 2, and the main parameters are summarized in
Table 1.
Specimen SW-1 represents a code-designed squat shear wall with openings. The length (h), width (b), and height (H) were 1900 mm, 200 mm, and 1350 mm, respectively. The opening size was 1100 × 700 mm, and the opening ratio was 30%. In addition, a loading beam (size: 2500 mm × 400 mm × 300 mm) and a foundation (size: 3100 mm × 400 mm × 500 mm) were fabricated to apply the lateral load and fix the specimen, respectively. The longitudinal reinforcement of the boundary columns comprised six HRB400 bars with a diameter of 16 mm (C16), and the stirrups were HRB400 bars with a diameter of 8 mm, spaced at 100 mm (C8@100).
Figure 2.
Geometry and reinforcement details of the specimens (unit: mm).
Figure 2.
Geometry and reinforcement details of the specimens (unit: mm).
The longitudinal reinforcement of the upper coupling beam consisted of two 10 mm and three 14 mm HRB400 bars, while that of the lower coupling beam consisted of two 10 mm and six 14 mm HRB400 bars. The stirrups of the coupling beam were HRB400 bars with a diameter of 8 mm, spaced at 150 mm (C8@150). In the present test setup, a vertical MTS actuator capable of applying reversed cyclic loading was unavailable in the laboratory. To investigate the behavior of the shear wall under vertical cyclic loading, SW-2 was designed by rotating the wall body of SW-1 by 90 degrees in the test plane, while maintaining the same geometric dimensions and reinforcements. Thus, the MTS actuator load was aligned with the direction corresponding to the vertical axis of SW-1, providing a directional quasi-static comparison of in-plane load-transfer mechanisms. Note that rotating the wall changed not only the nominal loading direction but also the calculated specimen height, shear-span ratio, effective wall-limb cross-sections, compression area, and reinforcement participating in the load paths. The calculated height H for specimens SW-1 and SW-2, i.e., the height from the center of the loading beam to the bottom of the wall, was 1500 mm and 2050 mm, respectively. The calculated shear-span ratios (=H/L) were 0.79 for SW-1 and 1.52 for SW-2. Thus, the specimens in this study are classified as squat shear walls.
It should be noted that only one specimen was tested for each loading configuration. Therefore, the present program constitutes a comparison of two prototype-derived configurations rather than a statistically replicated test matrix.
2.2. Material Properties
The design strength grade of the concrete for the specimens was C30. According to GB/T 50081-2019 [
32], the compressive strength of concrete was determined using cube specimens with a side length of 150 mm. At an age of 30 days, the measured average compressive strength of concrete was 26.5 MPa. According to GB/T 228.1-2021 [
33], the measured mechanical properties of the steel reinforcements are listed in
Table 2.
2.3. Test Setup and Loading Protocol
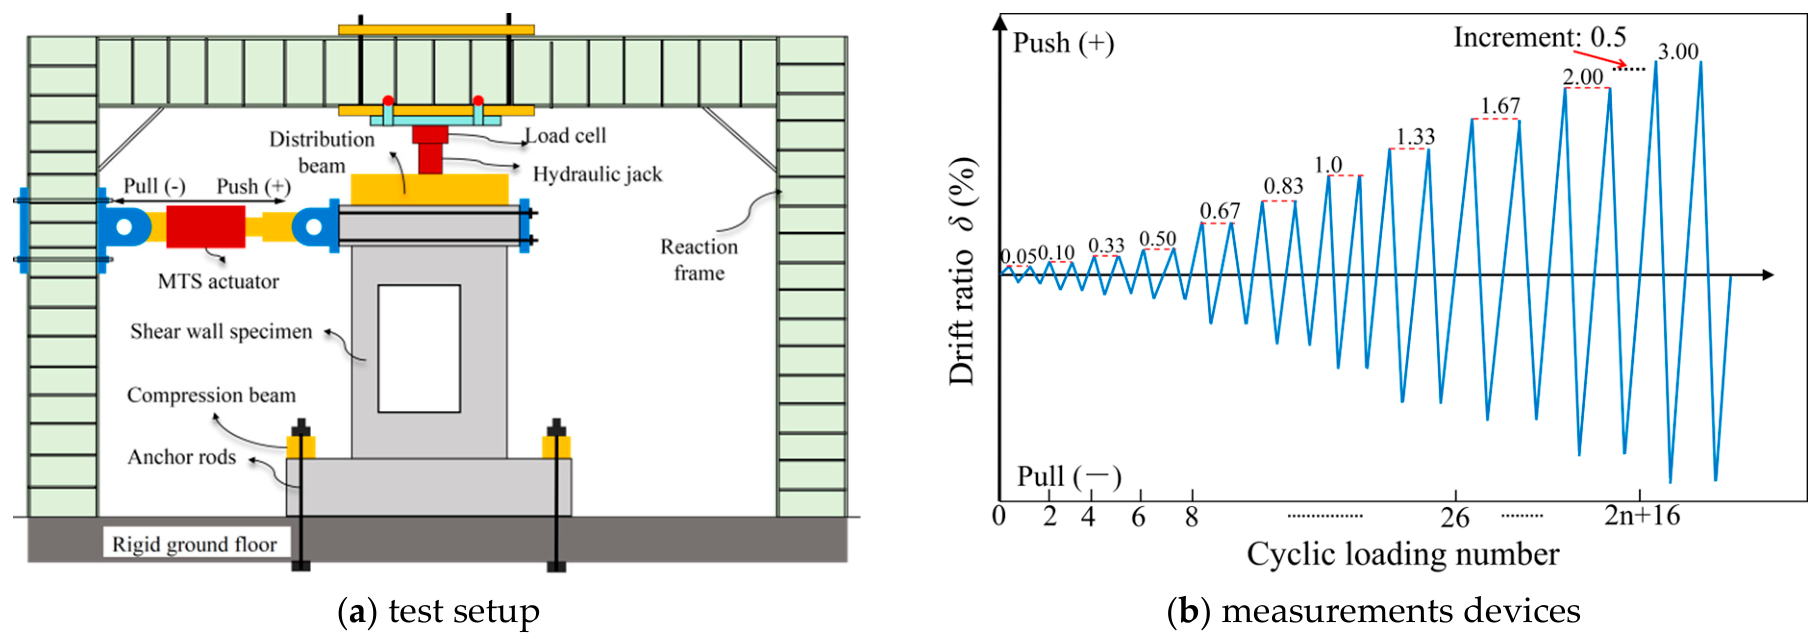
The test setup is shown in
Figure 3a. Each specimen was fixed to the strong floor using two compression beams. The lateral force was applied by an MTS hydraulic actuator with a maximum lateral capacity of 1000 kN and a stroke of ±250 mm. The axial force was applied by a vertical jack and transferred to the specimen through a distribution beam. During loading, the direction of the axial force remained vertical. The axial compression ratio of both specimens was 0.1 [
16,
17], and the axial forces applied to SW-1 and SW-2 were 410 kN and 320 kN, respectively. The loading protocol is shown in
Figure 3b [
17]. The lateral loading was controlled by drift ratio, which is defined as the ratio of the lateral displacement to the calculated specimen height. The push direction was defined as positive and the pull direction as negative. Each loading level was applied twice. The test was terminated when the lateral load decreased below 85% of the peak load [
34]. Except for the 90-degree change in wall orientation and the resulting effective wall-limb geometry and calculated height, the concrete grade, reinforcement detailing, support restraint, axial compression ratio, and cyclic loading procedure were kept consistent between the two specimens.
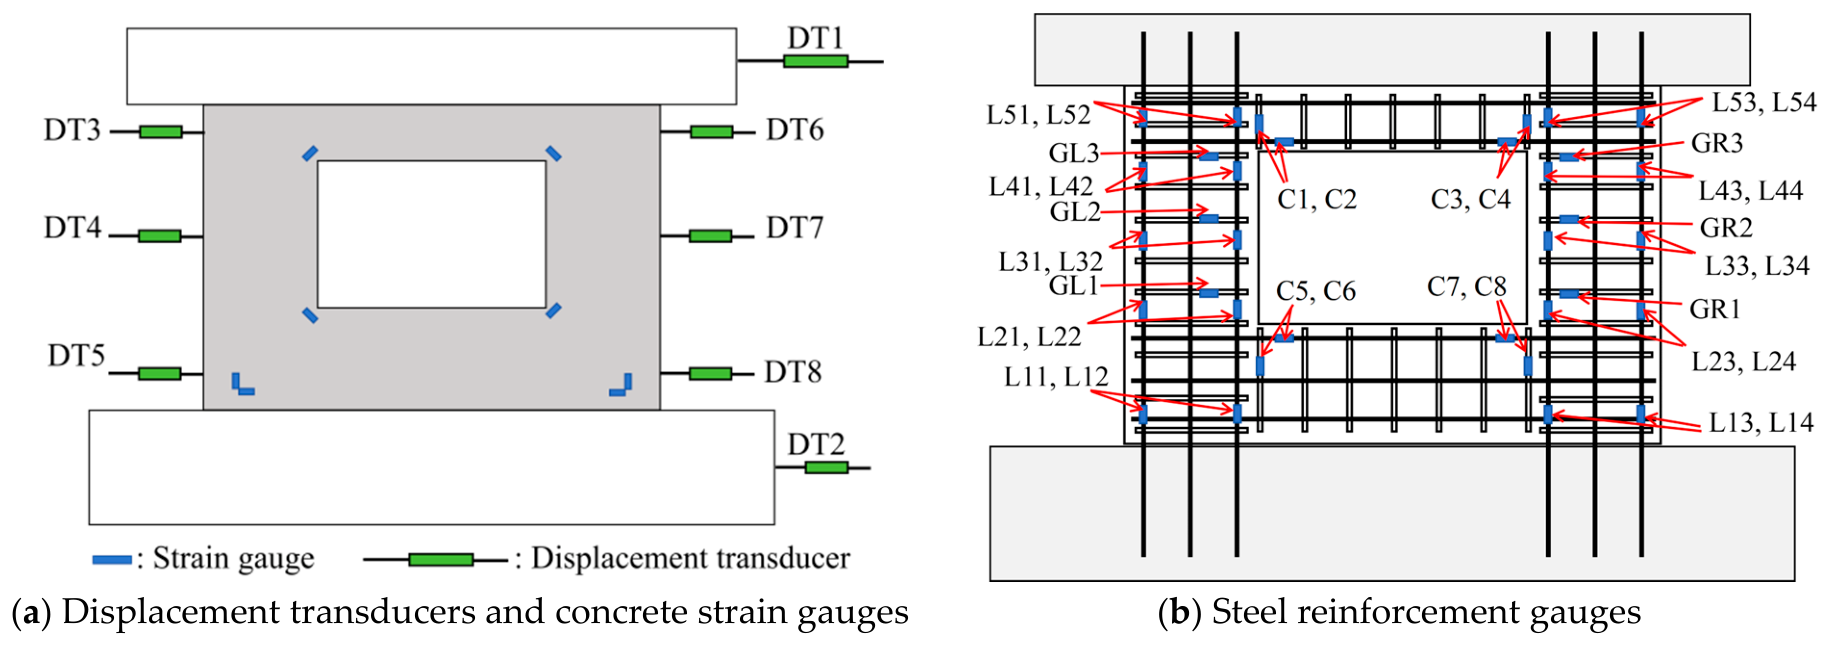
Figure 4 shows the arrangements of displacement transducers (DTs) and strain gauges (SGs) for specimen SW-1. The actual lateral displacement was determined using DT1 and DT2. The lateral displacement along the wall panel was measured using DT3~8, which were arranged at 0.1
H, 0.5
H, and 0.9
H from the bottom. The SGs for concrete were arranged at the wall toes and the corners of the openings. Further, the strains of longitudinal rebars and stirrups in the boundary columns and coupling beams were monitored, and the nomenclature of SGs is shown in
Figure 4b.
3. Test Results and Discussion
3.1. Damage Process and Failure Mode
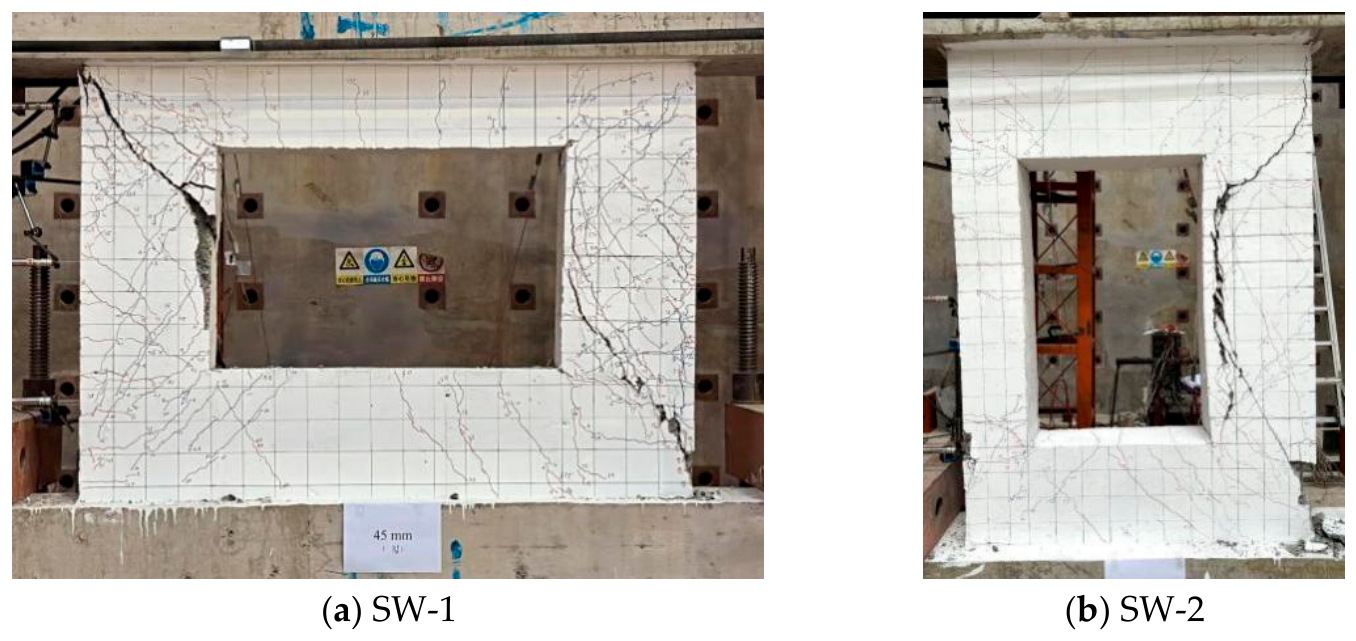
The failure modes of specimens SW-1 and SW-2 are shown in
Figure 5. Note that the non-English terms in the figure were the laboratory warning signs. In SW-1, diagonal cracks first appeared near the opening at a drift ratio of 0.1%, indicating an initiation of stress concentration. At a drift ratio of 0.5%, several horizontal cracks appeared in both the boundary columns and extended to the wall sides, identifying the simultaneous development of flexural tension in the boundary regions. As loading continued, horizontal and diagonal cracks spread through both wall limbs, while vertical flexural cracks developed in the upper and lower coupling beams. At a drift ratio of 2.0%, cross cracks formed in the wall limbs and four major cracks developed at the four corners of the opening; meanwhile, the vertical flexural cracks in the upper and lower coupling beams gradually developed into diagonal cracks. When the drift ratio reached 3.0%, the upper-left and lower-right major cracks at the corners propagated rapidly, resulting in local concrete crushing and spalling, and SW-1 experienced flexural-shear failure.
Regarding SW-2, diagonal cracks also initiated near the opening at a drift ratio of 0.1%, followed by horizontal cracks in both boundary columns at 0.5%. As loading proceeded, the subsequent development was strongly asymmetric: crossed diagonal cracks formed in the right wall limb, whereas the left wall limb remained dominated by horizontal cracks. At a drift ratio of 1.0%, diagonal cracks appeared in the upper and lower coupling beams, and a major diagonal crack developed in the right wall limb. Further, a vertical crack appeared on the opening side of the right wall limb at a drift ratio of 1.35%. When loading continued to a drift ratio of 1.75%, the major crack in the right wall limb propagated rapidly, and adjacent corner concrete was crushed and spalled. In contrast, only limited corner concrete crushing occurred in the left boundary column, showing a less severe damage state.
The failure modes of specimens SW-1 and SW-2 are classified as flexure-shear failure. Flexural participation is demonstrated by the horizontal cracks in the boundary columns and wall limbs, and the initially vertical flexural cracks in the coupling beams. Shear participation is demonstrated by the diagonal cracks emanating from the opening corners, the crossed cracks in the wall limbs, and the rapid widening of a governing diagonal crack immediately before strength loss. This preliminary failure-mode assessment based on the observed cracking patterns is further verified by the longitudinal- and transverse-reinforcement strain responses in
Section 3.6.
On the other hand, the different localization patterns between SW-1 and SW-2 reveal the effect of loading direction on the force-transfer mechanism. In SW-1, the two wall limbs jointly resisted shear and overturning moment, so damage was distributed on both sides of the opening. In SW-2, the rotated geometry and reinforcement arrangement produced a narrower critical wall limb and less balanced coupling action; diagonal damage therefore concentrated in the right wall limb, while the left limb did not fully mobilize its resistance. SW-2 can thus be described as more shear-dominated within the flexure-shear failure category, but not as a pure wall-limb shear failure.
3.2. Hysteretic Curves
The hysteretic curves of the specimens are shown in
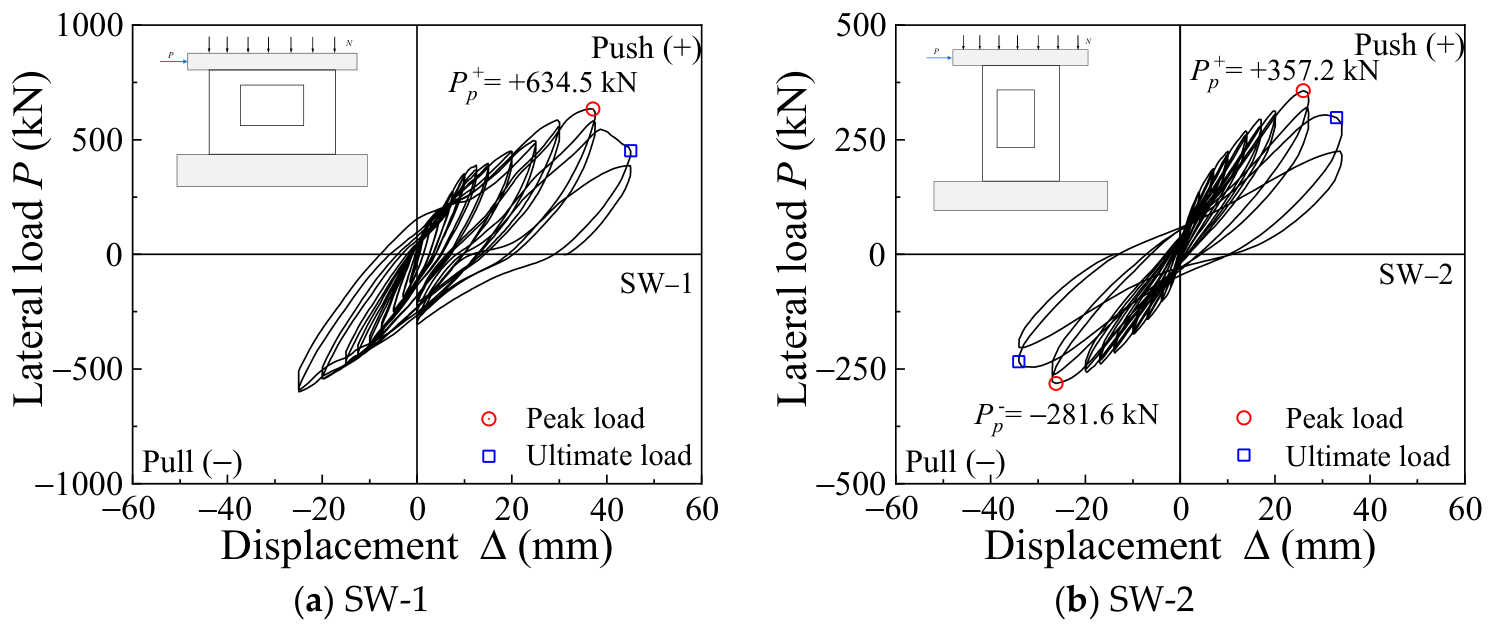
Figure 6. At small drift ratios, the loops of SW-1 and SW-2 were narrow and approximately linear. After diagonal cracks formed at the opening corners and horizontal cracks developed in the boundary columns, the secant stiffness decreased, and the loop areas increased, indicating good energy-dissipation capacity. The final descending branches were governed by rapid diagonal-crack propagation and local concrete crushing. Note that in SW-1, the stiffness of the actuator end plate became insufficient after the displacement reached 25 mm; consequently, only positive loading was continued.
Figure 6a shows that SW-1 reached a peak load of 634.5 kN at 37 mm (2.5% drift ratio), and the ultimate drift ratio was reached at 3.0% drift ratio after the upper-left and lower-right major cracks widened rapidly. The positive response clearly shows that both wall limbs remained engaged until the major diagonal load paths deteriorated.
Regarding SW-2, the positive and negative peak loads were 357.2 and −281.6 kN, respectively, at approximately ±26 mm (±1.42% drift), and the terminal drift was approximately ±1.70%. The positive-to-negative peak-strength ratio was 1.27, demonstrating a marked directional asymmetry. This asymmetry resulted from the unequal effective wall-limb sections and reinforcement participating in the push and pull directions. The narrower critical load path promoted damage concentration in the right wall limb, reduced loop area, and caused earlier post-peak deterioration compared with SW-1. Thus, the comparison of the hysteretic curves shows that the seismic performance of the squat shear wall with openings under vertical cyclic loading (SW-2) was significantly lower than that under horizontal cyclic loading (SW-1).
3.3. Stiffness, Strength, and Ductility
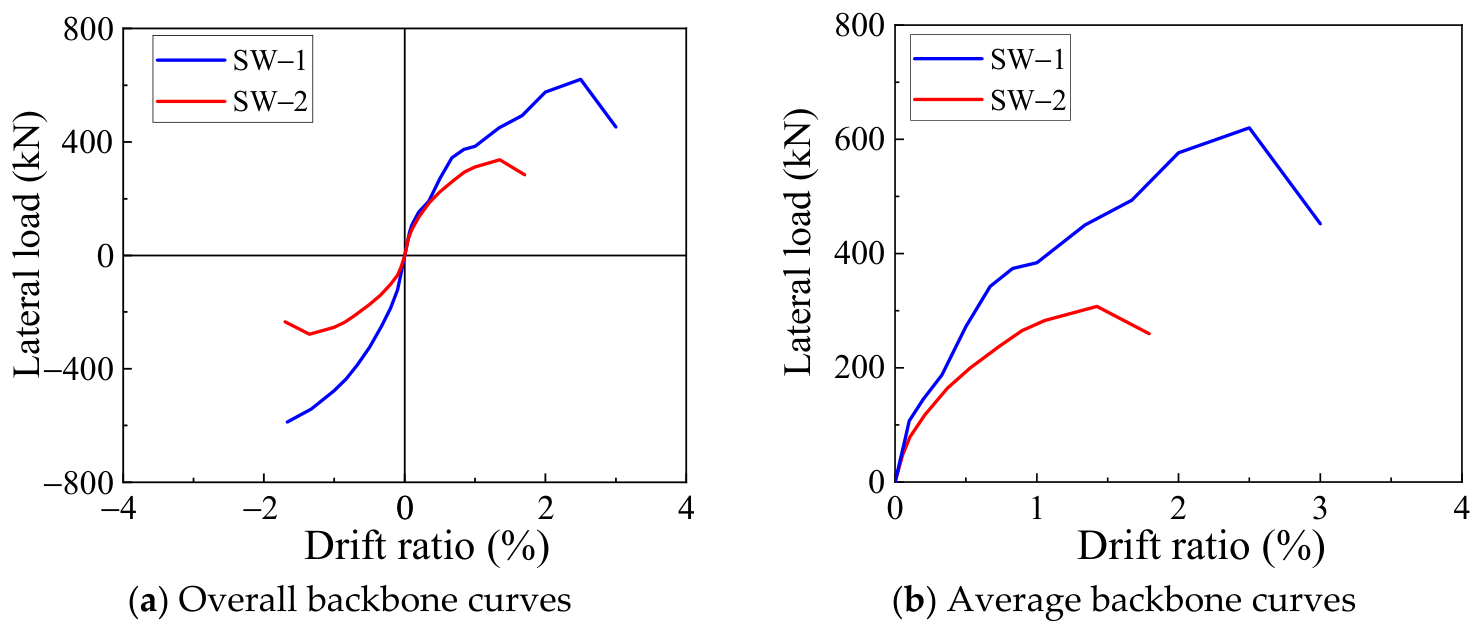
The overall and average backbone curves of the specimens were determined from the hysteretic curves, as shown in
Figure 7. The main characteristic points and seismic performance indices of specimens are summarized in
Table 3.
Py and
δy denote the yield load and yield drift ratio at the yielding of longitudinal rebars in the boundary column, respectively.
Pp and
δp are the peak load and corresponding drift ratio, respectively;
δu is the ultimate drift ratio;
K0 is the initial stiffness, defined as the secant stiffness at a load equal to 0.1 times the peak load [
34,
35];
μ is the ductility index that is defined as the ratio of ultimate drift ratio to the yield drift ratio (=
δu/
δy). Note that only the positive backbone curve was adopted as the representative response because the negative hysteretic curve of SW-1 was incomplete and the wall limbs are symmetrical. In contrast, SW-2 had asymmetric wall limbs; therefore, the average curves were adopted to evaluate the overall response. Further, positive and negative responses of SW-2 were evaluated separately.
As shown in
Table 3, the initial stiffness, peak load, peak drift ratio, and ultimate drift ratio of SW-1 were 1.87, 2.06, 1.76, and 1.64 times those of SW-2, respectively. This result indicates that the strength and deformation capacity of the shear wall under horizontal cyclic loading (SW-1) were superior to those under vertical cyclic loading (SW-2). When the cyclic load was applied along the vertical direction of the original shear walls (SW-2), the coupling beams became the wall limbs. Thus, the shear-span ratio increased, while the effective cross-sectional geometry and the reinforcement ratios decreased. Consequently, the load-transfer roles of the wall limbs and the reinforcement participating in the compression-strut and tension-tie mechanisms changed. Also, the ductility factor of SW-1 was slightly higher than that of SW-2. Considering the higher ultimate drift ratio of SW-1, the comparable ductility between SW-1 and SW-2 was because the stronger wall limbs in SW-1 delayed the yielding of longitudinal rebars. Further, the post-yield drift ratio increment for SW-1 (1.44%) was 1.80 times that of SW-2 (0.80%), indicating that SW-1 developed more effective force redistribution and a larger post-yield strength reserve. Further, SW-2 exhibited asymmetric responses in the two loading directions. Its positive peak load (357.2 kN) was 26.8% higher than that of the negative one (-281.6 kN). This is because upon load reversal, the compression-strut and tension-tie load paths were transferred to different wall limbs.
3.4. Stiffness Degradation
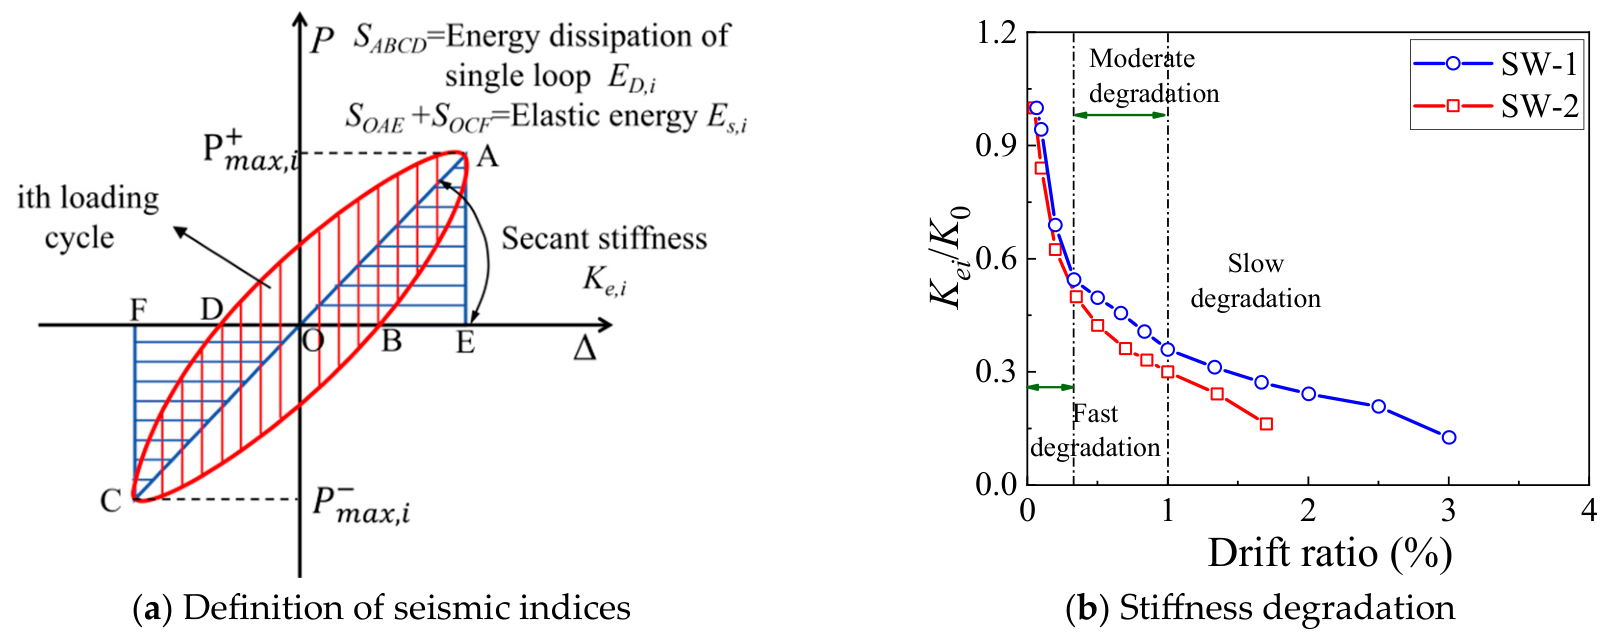
Stiffness degradation is an important index reflecting the damage development of specimens. In this study, the stiffness degradation process was evaluated using the ratio of the secant stiffness at each loading level to the initial stiffness. The definition of secant stiffness K
ei is shown in
Figure 8a, and the stiffness degradation curves are shown in
Figure 8b.
As shown in
Figure 8b, the stiffness degradation curves of SW-1 and SW-2 can be divided into three stages. Before a drift ratio of 0.33%, the normalized stiffness decreased rapidly because diagonal cracking at the opening corners and horizontal cracking in the boundary columns reduced the effective section. Between drift ratios of 0.33% and 1.0%, the degradation rate slowed as the existing cracks propagated and the reinforcement increasingly participated in the force-transfer process. Beyond a drift ratio of 1.0%, the normalized stiffness curves tended to stabilize, indicating that the response was governed by a stabilized cracked mechanism rather than by the uncracked gross cross section.
Further, SW-1 and SW-2 exhibited similar degradation rates in the first stage, which is consistent with their same opening ratio and similar onset of cracking. In the second stage, the stiffness of SW-2 degraded more rapidly than SW-1. This is because: (1) damage was primarily concentrated in the right wall limb of SW-2, and (2) the two wall limbs of SW-1 shared the lateral force, and cracking remained more evenly distributed. At failure, the secant stiffness of both specimens was approximately 0.15 times their initial values. This similar normalized residual stiffness does not indicate equivalent seismic performance. Specifically, SW-1 reached the stable residual stiffness at a much larger drift ratio than SW-2, which is a more precise indication of SW-2’s greater vulnerability under the vertical cyclic loading. The observed three-stage trend is consistent with the expected transition of RC shear walls from an initially uncracked response to crack-controlled stiffness and finally to a stabilized reinforced cracked mechanism [
16].
3.5. Energy-Dissipation Capacity
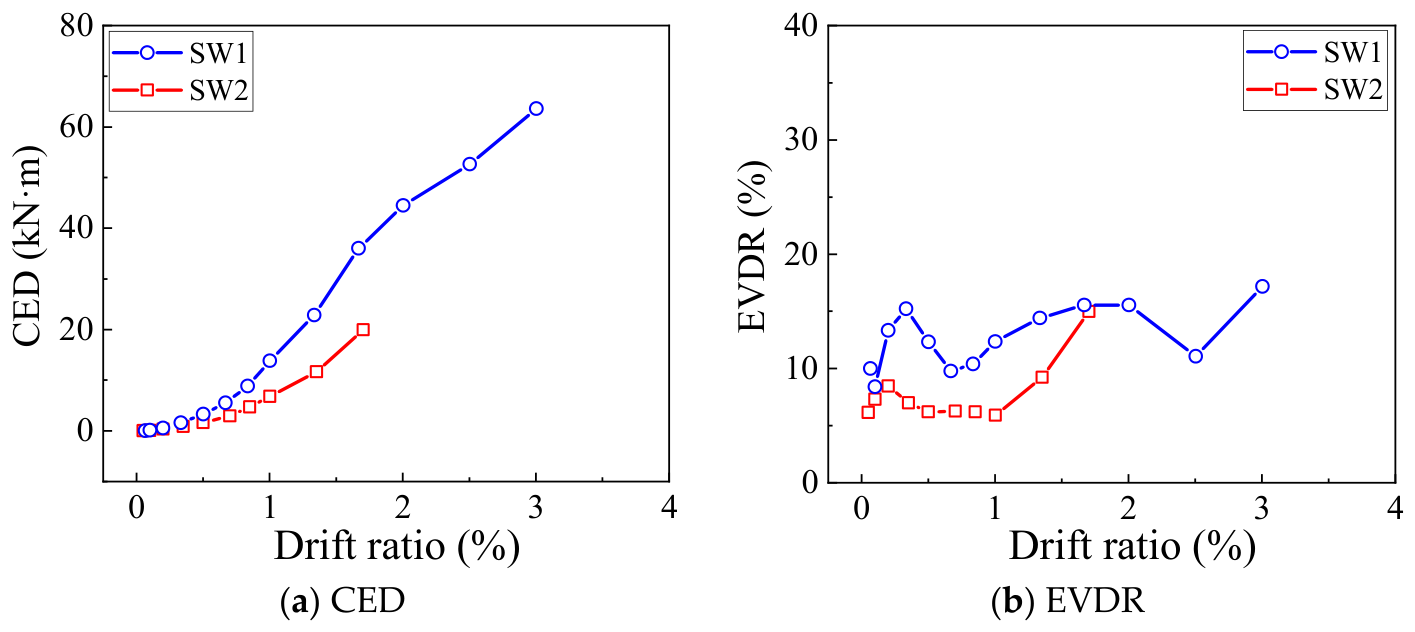
In this section, cumulative energy dissipation (CED) and equivalent viscous damping ratio (EVDR) are used to evaluate the energy-dissipation capacity of the proposed shear walls. The hysteretic energy dissipation was defined as the area enclosed by the hysteretic curve in the first cycle at each loading level, and the cumulative hysteretic energy dissipation was obtained by summing the hysteretic energy dissipation at all loading levels. The equivalent viscous damping ratio was calculated as follows:
where
ED,i and
Es,i are the hysteretic energy dissipation and elastic energy, respectively, in the first cycle at ith cyclic loading level, as shown in
Figure 8a.
The development of CED and EVDR is shown in
Figure 9. Before a drift ratio of 0.5%, both specimens dissipated little energy because cracking was limited and the response remained almost elastic. As the drift ratio increased, crack development, reinforcement yielding, and concrete damage enlarged the hysteretic loops, and the CED of SW-1 progressively exceeded that of SW-2. To enable a comparison at the same deformation demand, the CED was first evaluated at the ultimate drift ratio of SW-2 (1.80%). At 1.80% drift ratio, the CED of SW-1 (30.1) was 1.81 times that of SW-2 (19.9). This comparison indicates that SW-1 exhibited higher energy-dissipation capacity because it maintained higher lateral resistance and exhibited more stable cyclic behavior. Further, the final CED of SW-1 at 3.00% drift ratio (63.6) was 3.2 times that of SW-2 (19.9) at 1.80% drift ratio. This is because SW-1 underwent more loading cycles.
As shown in
Figure 9b, SW-1 exhibited a higher EVDR than SW-2 at drift ratios below 0.5%. This is because the reinforcement ratio of the wall limbs in SW-1 was activated earlier than that in SW-2. When SW-2 reached its ultimate drift ratio of 1.80%, the EVDR values of SW-1 and SW-2 were close, whereas the CED of SW-1 was substantially higher. This is because SW-1 still maintained a higher load-carrying capacity at this stage, resulting in substantially higher elastic energy than that of SW-2.
The above energy-dissipation performances are consistent with the observed failure mechanisms. Distributed cracking and bilateral wall-limb participation allowed SW-1 to dissipate energy over a larger region. In contrast, localization of diagonal damage in the right wall limb of SW-2 shortened the stable inelastic stage and limited the energy that could be dissipated before failure. Therefore, the shear wall with openings under horizontal cyclic loading outperformed that under vertical cyclic loading in terms of energy-dissipation capacity.
3.6. Strain Responses
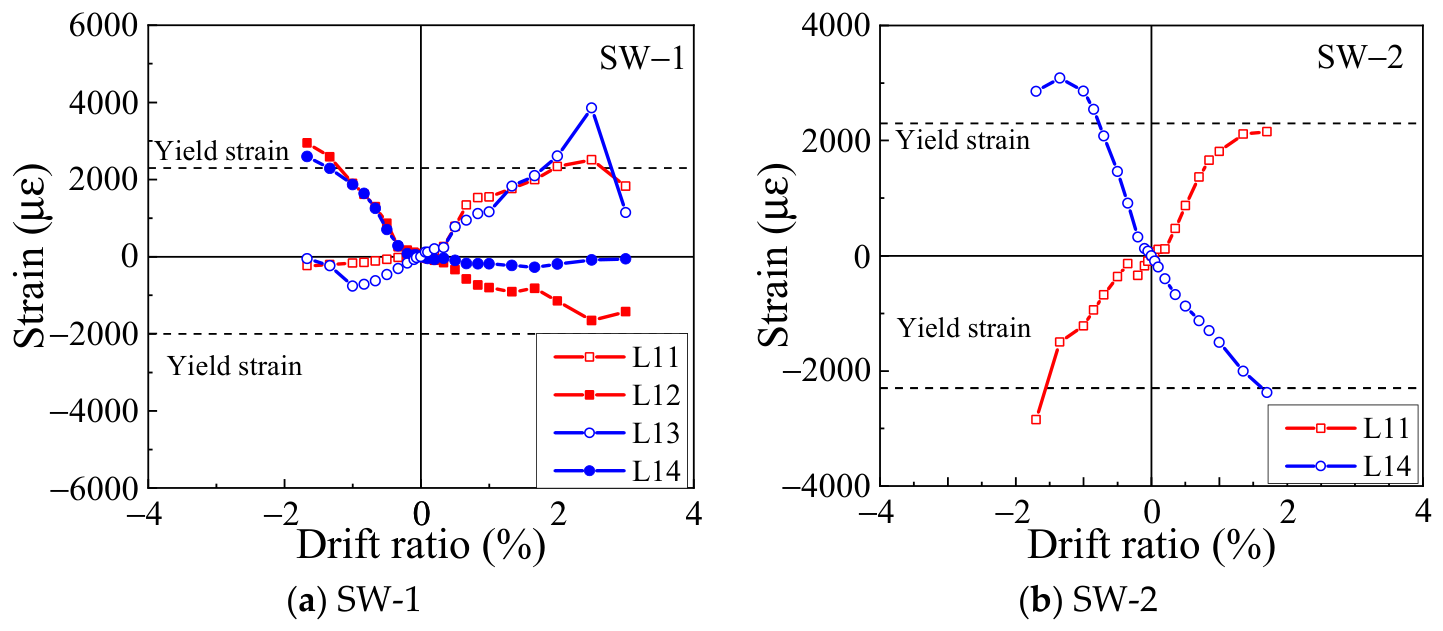
The strain developments of the longitudinal bars at the bottom of the boundary columns (L11~L14) are shown in
Figure 10. In SW-1, the tensile strain developments of longitudinal rebars in the left (L11 and L12) and right (L13 and L14) wall limbs exhibited a similar trend, confirming that both limbs undertook the lateral load together. At the peak load, the tensile strain of L13 was greater than that of L11 because concrete spalling occurred at the bottom of the right wall limb. Compared with SW-1, the longitudinal rebars in the boundary columns of SW-2 yielded earlier due to the smaller section area and reinforcement ratio. At the ultimate drift ratio, the strain of L14 decreased while that of 12 did not. This localized strain redistribution agrees with the rapid propagation of the right-limb diagonal crack and the abrupt post-peak strength loss, as shown in
Figure 5b.
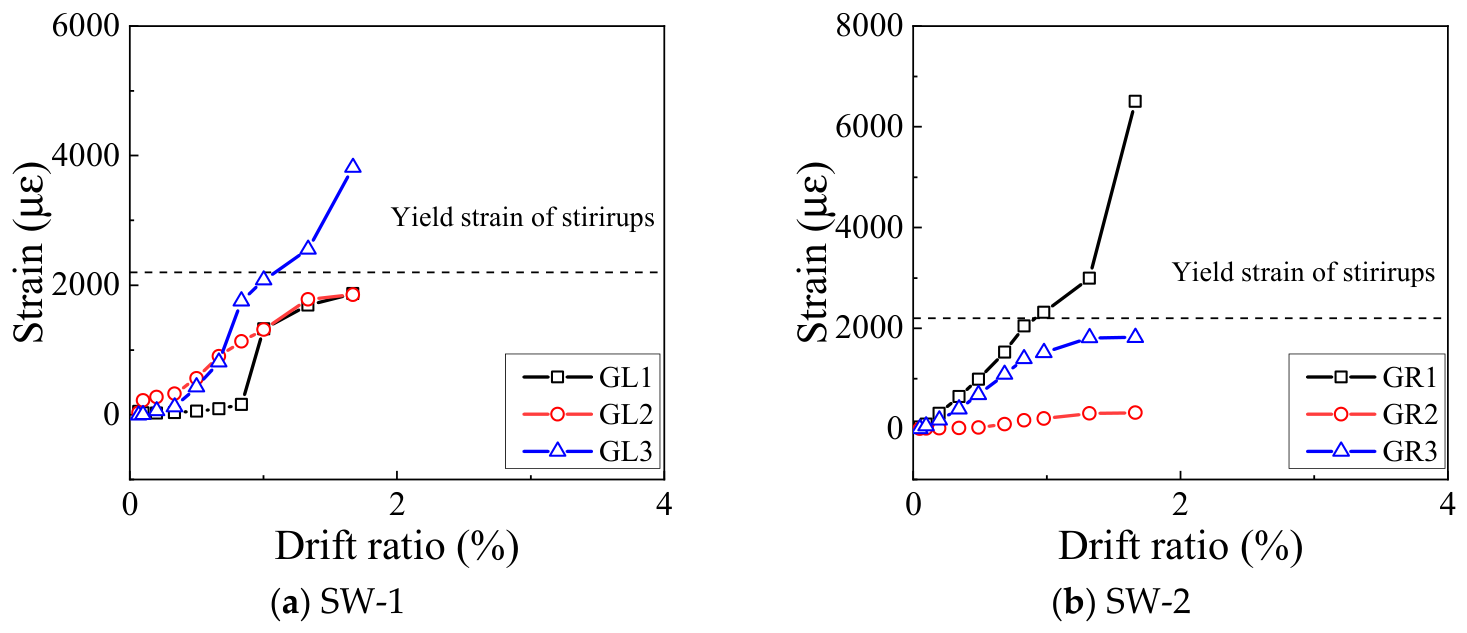
Figure 11 shows the strain developments of the stirrups in the boundary columns. In SW-1, the tensile strain of GL3 at the top increased faster than that of GL2 at the middle. This response is consistent with the upper-left major diagonal crack intersecting the upper part of the left boundary column. In contrast, GL2 increased progressively to approximately 1800 microstrain, while GL1 remained nearly inactive until about 0.8% drift ratio and then increased to a similar terminal level. Neither GL1 nor GL2 yielded before a drift ratio of 2.0%. The more pronounced strain gradient from GL3 to GL1 demonstrates that the transverse demand was governed by the local crack path rather than by a uniform shear field over the column height.
For SW-2, the strain of the bottom stirrup (GR1) developed the largest and most sustained response. It approached yielding at approximately 0.9–1.0% drift ratio, and increased sharply to approximately 0.0065 at the ultimate drift ratio. Also, the strain of stirrup at the top (GR3) increased steadily, but remained below the yielding strain. Further, GR2, representing the stirrups at the middle, remained at a low strain level (below approximately 0.00035). This is because the crack passed adjacent to the gauge or that shear was transferred through another local reinforcement path.
The two specimens consequently developed different transverse-reinforcement mechanisms. In SW-1, yielding was concentrated at the upper gauge of the left boundary column, consistent with the test observation. In SW-2, the dominant stirrup strain was concentrated at the bottom of the right boundary column, where the wall-limb damage ultimately localized. Together with the earlier yielding of the boundary longitudinal bars, this sequence confirms an asymmetric flexure-shear mechanism occurred in SW-2: flexural reinforcement yielded first or nearly simultaneously with the stirrups, after which the principal diagonal crack governed strength deterioration.
Taking the yield strain shown in
Figure 10 and
Figure 11 as the reference, the tensile longitudinal bars in both specimens reached or exceeded the yield strain at or close to the peak-response stage, indicating that flexural yielding had developed before substantial strength loss. In SW-1, the subsequent development of diagonal cracks and local concrete crushing occurred after longitudinal-bar yielding, resulting in a flexure-shear response with relatively distributed damage in both wall limbs. In SW-2, the critical stirrup GR1 in the right boundary column approached yielding at a drift ratio of approximately 0.9~1.0% and increased to approximately 0.0065 at the ultimate drift ratio, while the principal diagonal crack in the right wall limb widened rapidly during the post-peak response. These observations confirm flexure-shear failure in both specimens.
5. Practical Design Recommendations
The experimental results of this study demonstrate that the cyclic behavior of cavity-structure shear walls with openings varies remarkably with the loading direction, and present shear walls are more prone to failure under vertical cyclic loading than horizontal cyclic loading. However, changes in opening geometry, wall-limb dimensions, reinforcement arrangement, relative strength and stiffness of coupling beams and wall limbs, axial load, boundary restraints, and connection details may change the load-transfer mechanism and control failure mode. Accordingly, horizontal and vertical cyclic loadings should be checked separately to determine the governing condition.
Regarding the prediction of the load-carrying capacity, the STM and GB 50010-2010 models gave the best and acceptable overall prediction, respectively. Thus, the STM model is recommended for refined assessment. When a design model is developed, the GB 50010-2010 is suggested because it is concise and compliant with existing codes.
The above recommendations are for the component-level assessment and detailing of RC shear walls with large openings in cavity structures, within conditions comparable to the tested geometry, reinforcement detailing, and quasi-static loading configurations. For an integrated cavity structure crossing a utility tunnel, the effects of three-dimensional soil–structure interaction, tunnel-induced constraints, simultaneous multidirectional ground motions, time-varying axial force, construction imperfections, and interactions among adjacent cavity components should be assessed through appropriate system-level analysis.




 ,
,