1. Introduction
The planning and early phases of the design process are critical, as architectural, structural, and material choices made at these stages largely determine the later socio-economic and environmental impacts of a building [
1,
2]. Although many studies have examined the performance of ‘green’ buildings, few researchers have compared alternative options for sustainable buildings at the early design stage [
3].
Construction practices are widely recognized as a major contributor to environmental degradation, global warming, ozone depletion, and related impacts. As populations grow, with the consequent increase in demand for buildings, environmentally friendly materials and systems are required to achieve sustainability. Researchers have highlighted the need for innovative approaches towards reducing the carbon footprint of construction materials, for example by using recycled waste in concrete [
4]. The need for rational criteria for prioritizing materials has also been emphasized, as these would enable decision makers to select sustainable design solutions [
5].
Sustainability is commonly viewed as a multifaceted concept encompassing environmental, social, and economic dimensions. Since trade-offs must be made between these dimensions, multi-criteria decision-making (MCDM) models are often used [
6]. Numerous MCDM methods have been developed to address diverse problems in the Architecture, Engineering and Construction (AEC) industry [
7]. Multi-criteria analysis is generally accepted as a suitable approach for selection problems, such as evaluating the sustainability of buildings [
8].
MCDM methods are particularly valuable when combined with BIM, and the use of this approach in the AEC industry has delivered benefits across the project lifecycle [
9]. Despite challenges related to interoperability, lack of BIM protocols, and design-phase cost overruns [
10], numerous BIM-based frameworks have been proposed for decision-making scenarios. Oti et al. [
11] developed a BIM extension for assessing structural sustainability using multi-criteria analysis, cost, and environmental indicators, but this was limited to Revit and would need to be redesigned for other BIM platforms. Abuhussain et al. [
12] showed that BIM could support complex building management across the entire life-cycle, for example in retrofit evaluation, sustainable demolition planning, sustainability assessment, material recycling, and solution optimization. Tan et al. [
13] identified three main functions of BIM: as a model database for geometric and non-geometric information, as a processing tool for data collection and analysis, and as an information intermediary for format conversion and data exchange. However, the complexity of current datasets and the time required to prepare them limit the application of existing solutions [
14,
15]. The design workflow in the preliminary stages is often complicated due to uncertainties, the complexity of the processes, and the high level of computational effort required [
16]. Aspects considered by researchers include sustainability indicators [
17], the suitability and availability of data for sustainability assessment [
18], the level of integration between different software tools [
19], the level of detail required for a BIM model [
16], the need for interoperability solutions [
20], and the necessity of more user-friendly visualizations with design-oriented interfaces [
21].
Recent BIM-based life cycle assessment (BIM-LCA) studies have indicated the significant potential of this approach for integrating environmental assessment into the building design process by linking BIM models with LCA databases and environmental product declarations (EPDs). This can improve the automation of environmental impact calculations and support sustainability assessment during the design process [
21,
22]. However, recent research has also highlighted persistent challenges related to data interoperability, the uncertainty of information in the early stages of design, and the machine interpretation and exchange of environmental data between BIM and LCA environments [
21,
23]. Furthermore, existing BIM-LCA approaches mainly focus on environmental impact calculation, optimization of specific design parameters, or visualization of LCA results, and integrated decision-support frameworks in which data from heterogeneous sources are combined with multiple sustainability indicators and MCDM methods remain limited [
22,
24]. Further research is therefore needed to support early-stage sustainable design decisions under conditions of incomplete information and heterogeneous forms of data.
A review of related work shows that some efforts have been made to improve the early stage of the design process. Al-Qazzaz et al. [
25] suggested a BIM-based approach using the TOPSIS method for circularity assessment in the early stages of design, in which circularity and economic indicators were applied, with the environmental group represented only by carbon emissions. Mowafy et al. [
22] combined parametric BIM-based LCA with multi-objective optimization using NSGA-II and data envelopment analysis for automated sustainability assessment. Namaki et al. [
26] combined the BIM, LCA, and analytic hierarchy process (AHP) methods for sustainable material selection, taking into consideration environmental, social, cost, and circularity aspects. Cascone et al. [
27] used BIM and the Weighted Sum Method to optimize options for a building envelope based on cost, embodied energy, global warming potential, and acoustics. Nasir et al. [
15] presented an automated, BIM-supported sustainability assessment framework in which BIM was linked with ratings and LCA indicators. However, this approach was country-specific, and did not support design optimization or comparison of alternatives through MCDM. Parisi et al. [
28] created an automated tool to assess the circularity of construction products that included 68 indicators; this tool supported IFC export and used a national standard classification, but was Revit-dependent and product-focused, without an MCDM procedure.
An analysis of existing studies shows that a large proportion of BIM-MCDM research [
22,
25,
26,
27,
28,
29] has relied on proprietary formats, meaning that the functionality of these systems depends on the ontologies and semantics of those software programs (e.g., Archicad, Tekla). Only a small proportion of this work [
21,
30] has included openBIM interoperability principles using IFC formats, and existing solutions typically use different national information classification systems. There is therefore a need for a stable data structure when developing automated decision-making solutions for the lifecycle of an entire building. These systems are tailored to the needs of processes at different stages of a building’s life cycle (design, construction, manufacturing, logistics, etc.) and are not interconnected: when the process moves from one stage to the next, data transformations are required, resulting in reduced reliability of information and the need for additional resources. In most existing classification systems (such as OmniClass [
31], UniFormat [
32], MasterFormat [
33], Uniclass [
34], and NL/SfB [
35]) and in the structures created within the BIM-MCDM systems reviewed here, separation of classification and identification of building element is not ensured, and the element identification process is not linked to parametric information. This means that when such classifiers are applied in BIM models, it is not possible to link decision-making automation tasks to parametric information about elements, and when design solutions are changed, recalculated results cannot be obtained automatically.
In summary, although existing approaches provide valuable support for sustainability assessment, some research gaps still exist. In the assessment of design alternatives, decision makers are still faced with difficulties in terms of balancing economic, environmental, technical and other objectives because of fragmented methodologies and the absence of formal MCDM [
15,
21,
29,
30,
36]. Moreover, the information required for decision-making is often distributed across heterogeneous data sources and represented in incompatible formats and structures, creating a data fusion challenge [
37]. Consequently, these heterogeneous data must be harmonized, semantically aligned, and fused into a consistent dataset before they can be reliably used as input to the MCDM process. Analyzed approaches such as [
22,
25,
26,
27,
28,
29] generally remain dependent on proprietary BIM environments and application-specific data structures. Ontology-driven classification, automated data mapping, and integrated multi-criteria decision-support workflows are rarely implemented simultaneously.
Consequently, the main aim of this research was to develop a novel hybrid approach that combined data fusion with BIM, ontology-driven classification, semantic mapping, and MCDM to enable the most sustainable alternative to be selected at the early stage of design, thereby bridging these gaps and enabling a more consistent and traceable decision-making process.
The main contributions of this study can be distinguished as methodological, technical, and practical:
Methodologically, the study proposes a hybrid BIM-based decision-support approach that combines multi-level data fusion, ontology-driven classification, semantic mapping, and MCDM to transform heterogeneous BIM and external data into structured information for sustainability assessment at the early design stage. The ontology-based classification provides machine-readable, consistent, and traceable links between building elements, their parameters, and the decision-making process. Furthermore, it improves maintainability through systematic rule management and strengthens traceability by explicitly linking classification outcomes to their underlying semantic representations across the building information life cycle.
Technically, the proposed methods are implemented within the web-based BIM4NZEB-DS environment, enabling data acquisition, classification, semantic mapping, and multi-criteria assessment within a unified digital workflow.
Practically, the approach supports designers in systematically comparing alternative building solutions using a comprehensive set of sustainability indicators in five categories, including embodied environmental impacts derived from LCA-based data, cumulative energy demand, cost, amounts of construction and demolition waste, and technical parameters, while incorporating decision maker preferences and reducing reliance on fragmented and manually prepared information.
This paper explores the possibility to combine BIM, web, and MCDM approaches into BIM4NZEB-DS to deliver sustainable building solutions at an early stage of design. The results may have implications for advancing information management and automated decision making in the AEC industry.
In
Section 2, a literature review is conducted to compare previous BIM-based sustainability decision-support systems, and research gaps are defined.
Section 3 introduces the BIM4NZEB-DS model, data sources, software tools, and data analysis techniques. In
Section 4, the results are presented and a case study is conducted to validate the developed system. The next section contains a discussion, including an interpretation and comparative analysis of the results and the limitations of this work. Conclusions and directions for future research are given in the last section.
2. Related Work
The integration of BIM with sustainability assessment and decision-support methods has received increasing attention as a means of improving the evaluation of building design alternatives, particularly during the early stages of design when the potential to influence the environmental and economic performance is greatest. Existing studies show a gradual shift from BIM-supported LCA to more integrated approaches that include life cycle costing (LCC), life cycle sustainability assessment (LCSA), circularity indicators, optimization algorithms, and MCDM. However, the proposed approaches still vary in scope, automation level, interoperability, and decision-support features.
Table 1 summarizes the contributions and limitations of the most relevant studies conducted from 2020 to date in which BIM is combined with LCA/LCSA, openBIM, and MCDM approaches.
For example, Santos et al. [
29] developed BIMEELCA, a BIM-based tool that integrated environmental LCA and economic LCC indicators. Their approach demonstrated the feasibility of linking BIM data with LCA procedures, and enabled data integration and graphical interaction. However, the system was dependent on the Revit environment, relied only partially on an external classification structure based on Uniformat, and did not incorporate an MCDM procedure to evaluate competing alternatives. Thus, although the automation of environmental and economic assessments was improved in BIMEELCA, its contribution was predominantly assessment-oriented rather than constituting a comprehensive decision-support environment. With a particular emphasis on open data exchange, Llatas et al. [
30] developed an IFC-based BIM–LCSA approach for early design. Their framework expanded the scope of assessment by integrating environmental, economic, and social indicators, including global warming potential, cost, and working hours. One important aspect was that the use of IFC reduced dependence on a single proprietary BIM environment. Nevertheless, their approach did not incorporate MCDM, and although it supported sustainability assessment, limited functionality was provided for systematic preference-based comparison of multiple design solutions. Forth et al. [
21] advanced the field of openBIM-based sustainability assessment through the development of BIM4EarlyLCA, an interactive visualization approach that was intended to support early-stage decision making. This framework provided IFC-based interoperability, data integration, and graphical visualization, but was primarily focused on analyzing embodied greenhouse gas emissions. Its main contribution lay in facilitating the interpretation of uncertain environmental results rather than in providing integrated, multi-dimensional sustainability decision support.
Other studies have focused more explicitly on automation and optimization. Serrano-Baena et al. [
36] proposed the MLCAQ methodology for automated multi-criteria material selection based on cost, embodied energy, CO
2 emissions, and waste generation. Although the range of sustainability indicators was broadened in this approach and material assessment was automated, its scope was restricted to material selection, and it did not provide a general interoperability mechanism or a formal MCDM framework for evaluating complex building design alternatives. In contrast, Mowafy et al. [
22] integrated parametric BIM-based LCA with multi-objective optimization using NSGA-II and data envelopment analysis. Their framework demonstrated the potential of automated generation and optimization of sustainability alternatives, but was dependent on Revit, lacked an ontology-based semantic classification mechanism, and was predominantly LCA-oriented.
MCDM is increasingly being introduced into BIM-supported sustainability research to structure decisions involving multiple and potentially conflicting criteria. Namaki et al. [
26] integrated BIM with LCA and the AHP for sustainable material selection, with criteria based on environmental, social, cost, and circularity aspects. However, the applicability of this approach was constrained by its reliance on subjective AHP weighting and any proprietary BIM software. Similarly, Cascone et al. [
27] combined BIM with the Weighted Sum Method to optimize alternative designs for a building envelope based on cost, embodied energy, global warming potential, and acoustics. Although this approach represented a step towards integrated design optimization, it was Revit-dependent, and only a relatively restricted range of sustainability dimensions was considered.
Researchers in this area are also increasingly addressing the challenges of BIM-supported sustainability assessment. Al-Qazzaz et al. [
25] designed an important method in which sustainability assessment was combined with an explicit multi-criteria ranking using the TOPSIS method and a semantic structure based on a circularity data dictionary. Nevertheless, their approach depended on Revit, used national semantic standardization, and lacked a comprehensive process for user validation. Parisi et al. [
28] developed an automated tool to evaluate construction-product circularity using 68 indicators. Although their tool enabled IFC export and incorporated a national standard-based classification structure, its core functionality was both Revit-dependent and product-oriented, and no MCDM procedure was incorporated. Nasir et al. [
15] provided another example of an automated, BIM-supported sustainability assessment using the BIM-GRIHA15-LCA framework, in which BIM was connected with sustainability rating and LCA indicators. However, this framework was linked to a country-specific rating system and did not support design optimization or MCDM-based comparison of alternatives.
Interoperability remains one of the major challenges in terms of combining BIM, sustainability assessment, and MCDM. These processes rely on heterogeneous forms of information originating from BIM environments, external sustainability databases, classification systems, and analytical tools. BIM tools can be used to classify and structure building elements according to proprietary object hierarchies, naming conventions, and parameter schemas, whereas in LCA and LCC databases different classifications, identifiers, units, and levels of aggregation are typically employed. MCDM introduces an additional layer of information, as building data must be transformed into consistently defined criteria associated with clearly identifiable design alternatives. As a consequence, effective interoperability requires not only the exchange of technical data but also semantic consistency across the entire information chain.
The studies reviewed here demonstrate that this problem has only been partially resolved. A substantial proportion of BIM-based sustainability assessment and decision-support approaches remain dependent on proprietary software environments. BIMEELCA [
29], the parametric BIM–LCA framework proposed by Mowafy et al. [
22], the BIM–LCA–AHP approach developed by Namaki et al. [
26], the building-envelope optimization framework of Cascone et al. [
27], and recent circularity-assessment approaches (Al-Qazzaz et al. [
25]; Parisi et al., 2026 [
28]) vary in their dependence on native Revit data structures. Although such solutions enable a high degree of automation to be achieved within a particular software ecosystem, their transferability is constrained when information must be reused in subsequent BIM use cases.
The adoption of Industry Foundation Classes (IFC) and openBIM principles represents an important step toward reducing software dependency. Llatas et al. [
30] demonstrated the use of IFC for BIM-based life cycle sustainability assessment, while Forth et al. [
21] employed an openBIM workflow for early-stage LCA. These approaches confirmed the potential of IFC to support cross-platform data exchange, but the technical ability to exchange IFC models does not, in itself, guarantee semantic interoperability, since building elements exported from different authoring tools may still contain inconsistent naming conventions, incomplete parameter sets, or application-specific classification structures. Syntactic interoperability must therefore be complemented by mechanisms that ensure that the exchanged information can be interpreted consistently and reused by subsequent analytical processes.
A further limitation concerns the role of conventional construction classification systems. In many existing systems, element classification and element identification are combined within a single classification code structure. This can substantially complicate the development of automated workflows because several conceptually different characteristics of a building element may be embedded in the classification code rather than represented as independently machine-readable parameters: for example, Uniclass [
34] provides six classification codes for walls, four of which are associated with a possible IFC parameter indicating whether the element is interior or exterior (“IsExternal”), with EF_25_10_25 representing external walls, EF_25_10_27 external walls below DPC, EF_25_10_28 external walls below ground, EF_25_10_40 internal walls. One code within the same structure may be associated with an IFC parameter indicating whether the element is load-bearing or non-load-bearing (“LoadBearing”); for example, EF_25_10_30 represents free-standing walls. The last code of the same structure can be associated with a specific part of the building’s structure; for example, EF_25_10_60 indicates parapet walls. This example shows that it is not possible to develop automation tasks using this structure for forming classification codes. In this ontology, and with the semantics governing classification codes, automation rules can only be written by linking them to classification codes. When this type of classification is applied in BIM models, it is not possible to link automation tasks to BIM parameters. This reduces flexibility and makes automated information processing more dependent on a particular classification system.
When considering BIM–LCSA–MCDM integration, this distinction is critical. In sustainability assessment and decision support procedures, access is generally required not merely to a building element class, but to a set of explicitly structured properties describing its function, location, material composition, technical characteristics, environmental performance, and other attributes. If these characteristics are implicitly embedded in classification codes, additional interpretation and mapping procedures will be required before the data can be used for sustainability assessment or multi-criteria evaluation. In contrast, parameter-based data structures enable individual attributes to be queried, validated, mapped, and reused independently across multiple BIM use cases.
This problem is particularly relevant to current design practice. In general design teams exploit the native functionality of their BIM authoring software and structure information primarily to meet the immediate needs of the design process. This may provide high efficiency within the authoring environment but does not necessarily ensure that the data required for subsequent BIM uses, such as 4D, 5D, LCA, or MCDM-based sustainability assessment, are appropriately prepared and transferred through IFC parameters. The information required for subsequent processes may therefore remain incomplete even when the model itself is sufficiently detailed for the designers’ tasks. This creates a structural interoperability gap between BIM authoring and analytical or decision-support applications.
Taken together, existing studies show that considerable progress has been made in the individual dimensions of BIM-based sustainability assessment. Approaches have been successfully developed to integrate BIM with LCA/LCC, introduce optimization or MCDM procedures, facilitate visualization, or improve automated data exchange. However, these functions are usually used separately or only in limited combinations. In particular, few systems support multidimensional sustainability assessment, structured generation of design alternatives, semantic data classification, open interoperability, automated data mapping, and preference-based MCDM simultaneously. From a review of previous research the major gaps can be identified as follows: (i) sustainability assessment is frequently restricted to selected dimensions, and particularly environmental impacts, such as embodied energy, CO2 emissions, or circularity; (ii) MCDM is absent from many BIM-based assessment systems; (iii) automated generation of design alternatives remains limited; (iv) approaches are generally dependent on proprietary BIM environments and application-specific data structures; and (v) ontology-driven classification, automated data mapping, and integrated multi-criteria decision-support workflows are rarely implemented simultaneously.
In BIM4NZEB-DS, these gaps are addressed by combining openBIM/IFC exchange with ISO 81346-based [
39] ontology-driven classification and parameter-level data mapping. In the proposed classification structure, element identification is separated from technical and sustainability-related properties, thus allowing automated procedures to operate based on explicit parameters rather than compound classification codes. In this way, the system establishes semantic links among BIM objects, the building envelope system (BES) database, sustainability indicators, and the MCDM module. The main contribution of BIM4NZEB-DS therefore extends beyond IFC-based data exchange; its novelty lies in integrating open-format interoperability, semantic classification, and explicit data mapping within a single decision-support workflow. This approach reduces dependence on proprietary BIM ontologies and supports more consistent reuse of data across sustainability assessment and decision-making processes.
3. Materials and Methods
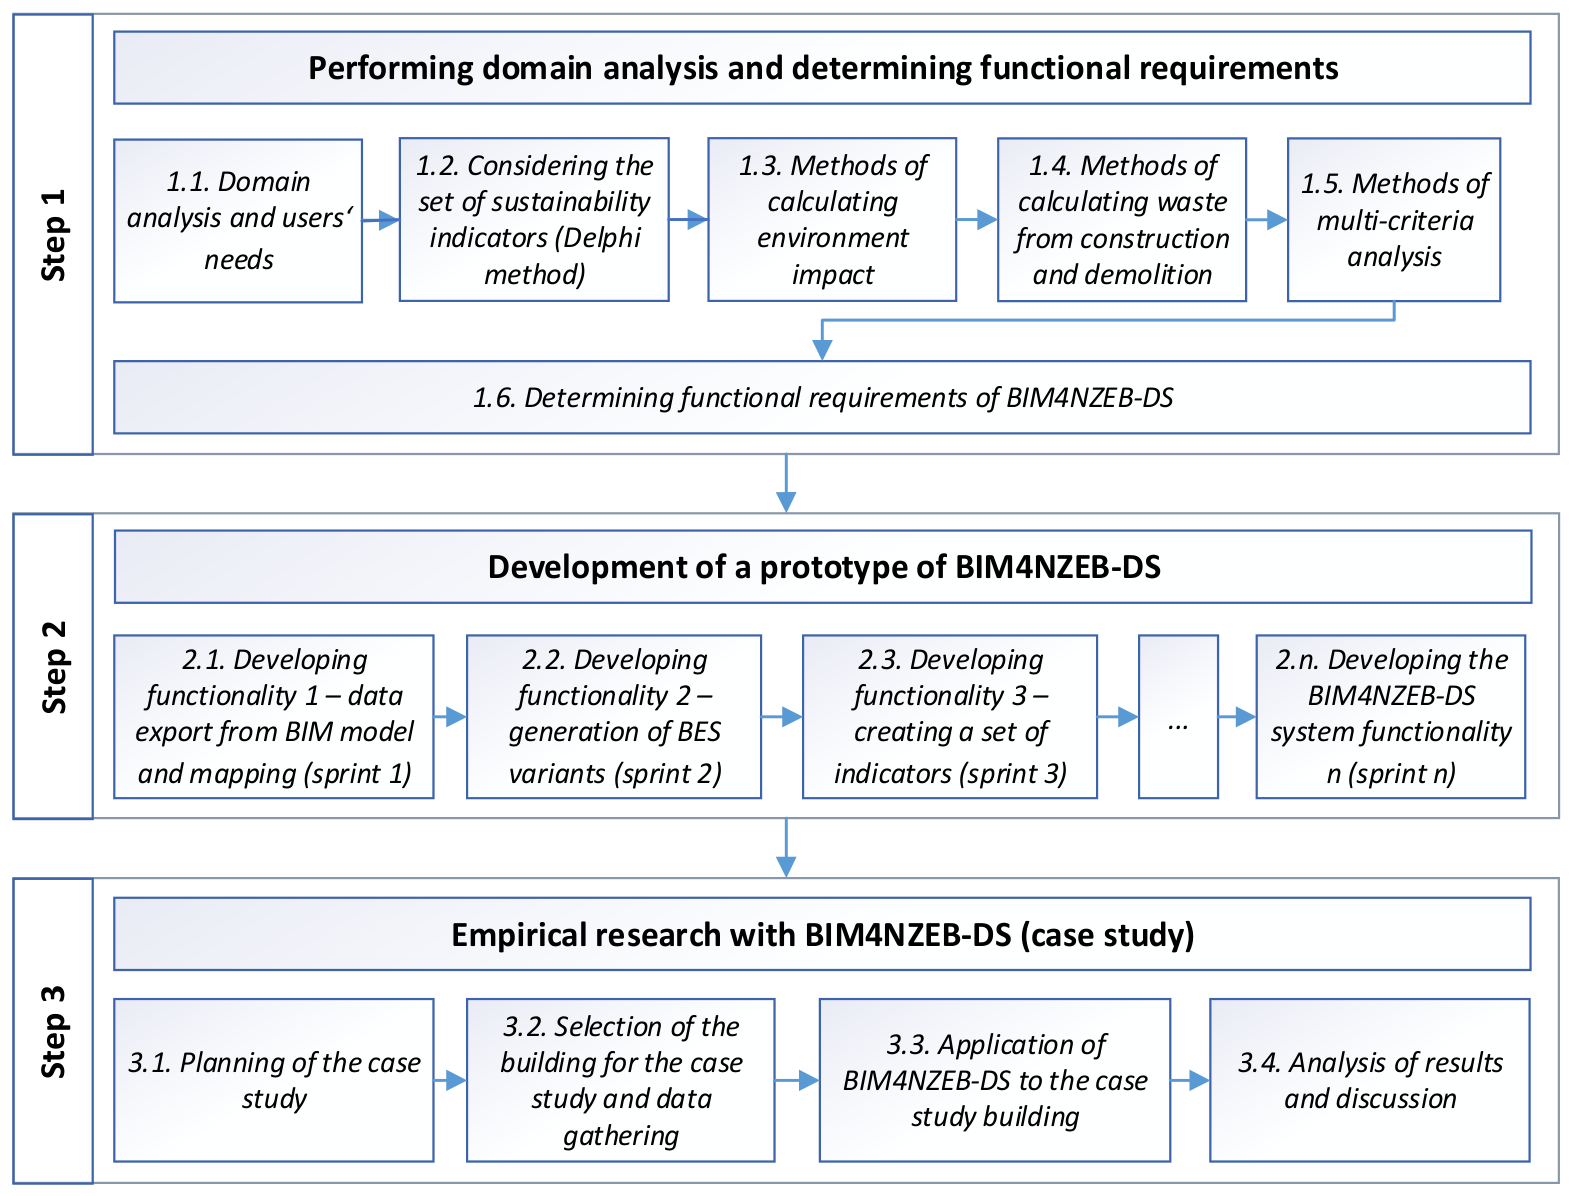
This research was conducted according to the workflow depicted in
Figure 1. In Step 1, several main research findings were generated by analyzing the application domain, identifying sustainability indicators, exploring the fusion of BIM-MCDM and stakeholder needs, and outlining the scope and core requirements of the BIM4NZEB-DS system. The Delphi technique was used to select and weight the indicators. The life cycle stages for environmental assessment were defined, BIM-based data extraction and classification workflows were established, methods of assessing construction and demolition waste and multi-criteria analysis were considered, and, based on these, the system’s functional requirements were specified.
In Step 2, the BIM4NZEB-DS system architecture and development methodology were defined, and evolutionary prototyping was applied to address the issue of uncertainties in development through an iterative, incremental delivery process. The system components and the user interface were then developed and refined in sprints, each of which involved implementing a specific set of features.
In Step 3, the system was empirically tested on a case study building. The methods and results are presented in
Section 4.
3.1. Domain Analysis and Selection of Sustainability Indicators
Sustainable development indicators were first defined by UNESCO in the 1990s, and were divided into three categories: environmental, social, and economic [
40]. Although, these indicators have changed little since then, the individual indicators used in different studies vary. The most commonly used environmental indicators are energy consumption [
41], greenhouse gas emissions [
42], and global warming potential (GWP) [
43]. Researchers have assessed the technical–structural parameters of building, such as the mechanical properties of materials (compressive strength, flexural strength, and other parameters) [
41]; technical reliability [
44]; the compactness of the building [
45]; the heat transfer coefficient and dynamic thermal characteristics of the partitions [
46]; and the airtightness of the building [
47]. Economic indicators include life cycle costs [
48]; design costs [
49]; construction costs [
41]; maintenance costs [
18]; material costs [
45]; and payback period [
50]. Nielsen et al. [
51] have shown that environmental sustainability indicators are most widely represented in sustainability assessments.
The indicators for the economic and environmental dimensions were selected based on the literature review and the research objectives. The cost of alternatives is one of the most frequently used economic indicators in sustainability assessments, alongside the payback period, net present value, and design cost. In this study, only the cost of envelope systems was considered. Cumulative Energy Demand (CED), describing the total amount of primary energy required to produce, use, and dispose of a product, was also used as a key indicator for sustainability assessment. To determine the environmental indicators, the materials and energy used in each industrial process were first calculated based on the inventory data (Ecoinvent v2.0) and CED v1.08 method.
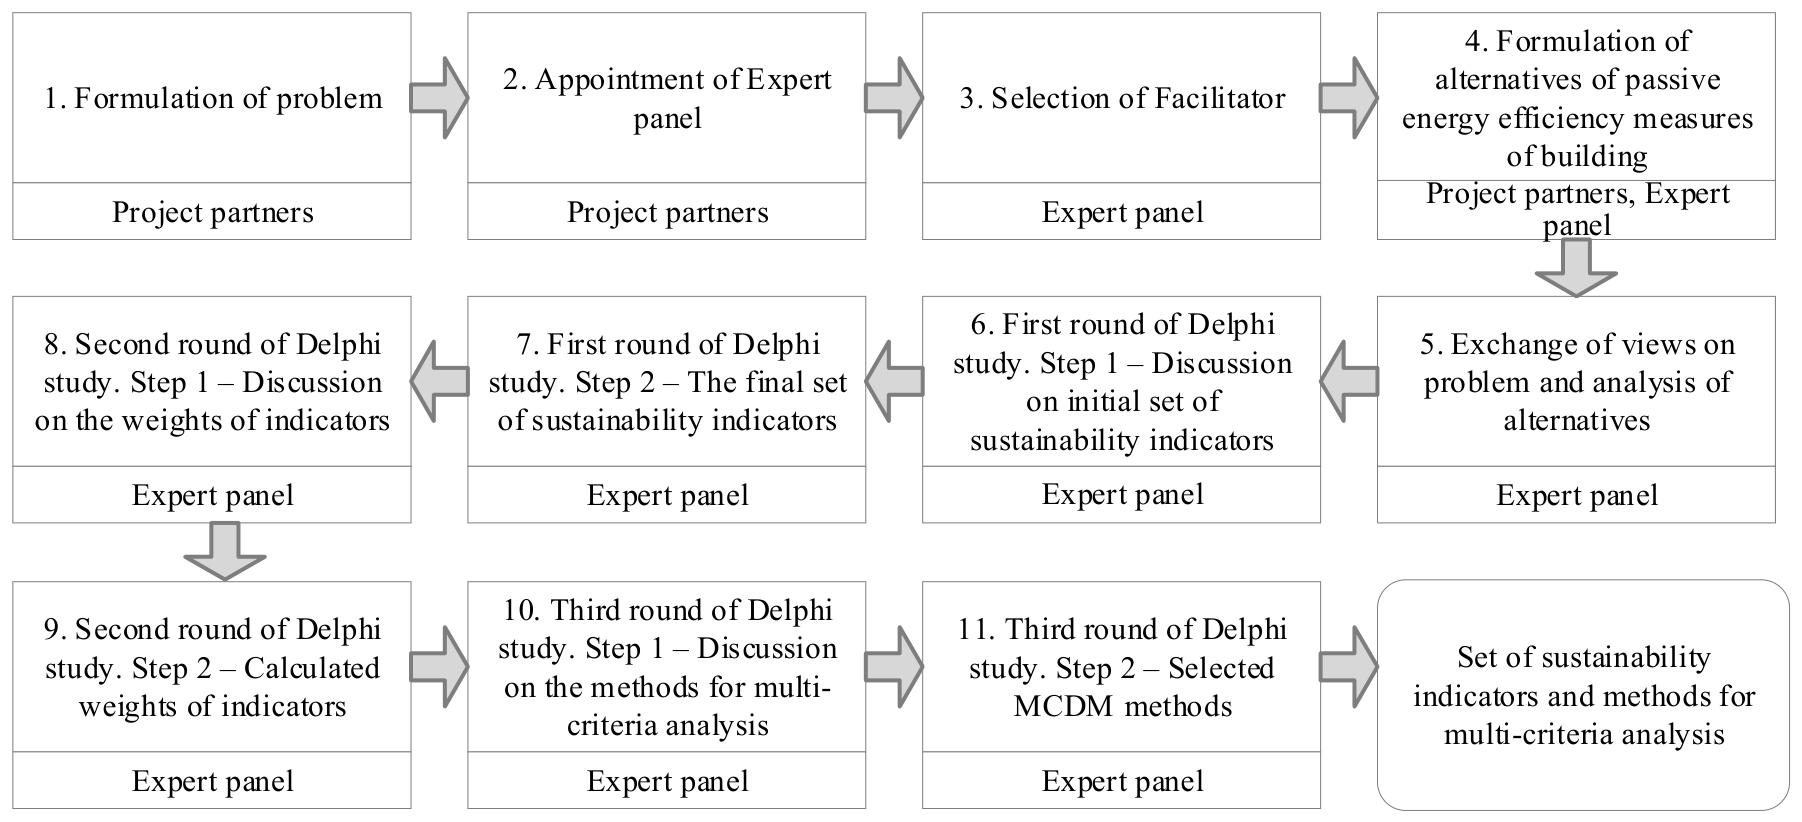
Based on the literature review, material properties and their environmental impacts, such as GWP, ozone-depleting emissions, and waste generation, could be assessed at the early stage of the design process. The Delphi technique was applied to identify the most important indicators, eliminate less important ones, and assign their weights. This technique is based on the idea that a structured group of experts can make more accurate decisions than individual or unorganized opinions, via an iterative process of group evaluations. The main methodological features of the Delphi study are a multi-stage process, guaranteed anonymity, feedback, and independent expert opinions. In this case, the expert group consisted of 10 members, five of whom were industry designers and five were researchers. The industry experts had at least 10 years of experience in the construction industry and a degree in AEC, whereas the research experts had at least five years of experience in the construction industry and a PhD in civil engineering or a related field. The authors participated as facilitators and members of the expert panel, and the Delphi study was conducted in three rounds (
Figure 2). The expert group first selected a moderator, who was a university expert with experience in applying the Delphi technique. The experts then shared their views and provided the moderator with independent assessments. The group was asked to decide on a set of indicators that would be relevant and applicable to other cases.
In the first round, the experts reviewed the initial set of object-related sustainability indicators and rejected the less relevant ones. They then identified a final set of sustainability indicators (
Table 2). The weights of these indicators, which were necessary to enable the multi-criteria evaluation of alternatives, were determined by the experts in the second round. The importance of the indicators was rated by assigning percentage weights, from which average weights were calculated (presented in
Section 4). In the third round, the experts selected methods for MCDM and for ranking the design alternatives. Note that in accordance with MCDM terminology, the selected indicators are hereafter referred to as criteria once they are incorporated into the initial decision-making matrix (DMM), described in
Section 3.3, and used to evaluate the alternatives.
The consensus among experts was assessed using Kendall’s coefficient of concordance (W) [
52], a non-parametric measure of agreement among multiple raters based on ranked assessments. The calculated Kendall’s coefficient of concordance (W = 0.72) indicated substantial agreement among the experts. This agreement was statistically significant (χ
2 = 57.93, df = 8,
p < 0.01), as the calculated χ
2 exceeded the critical value (χ
2crit = 20.09), thereby confirming sufficient consistency of the expert assessments for their subsequent use in the analysis.
Table 2.
Final set of indicators.
Table 2.
Final set of indicators.
| Indicators | Measuring Units | Description and Necessary Data |
|---|
| R1. Construction cost | euro/(m2, m3, unit) | The indicator includes: work extent (person hours); remuneration rates (euro/(m2,m3, units); cost of materials (euro/(m2, m3, units); quantity of materials (m2, m3, units); costs of machinery and equipment (lease or purchase) (euro/units); other data (such as construction site costs). BIMGates.lt software (https://bimgates.lt/) is used to calculate these values. |
| R2. CED | MJ/(m2, m3, kg) | CED represents the direct and indirect energy used throughout the life cycle, including the energy used to extract, manufacture, and dispose of raw materials and other consumables. |
| R3. Global warming potential (GWP-fossil) | kg CO2 eq | The GWP fossil indicator represents the GWP of greenhouse gas emissions from the oxidation or reduction in fossil fuels or fossil carbon-containing substances. |
| R4. Ozone layer depletion potential (ODP) | kg CFC-11 eq | The ODP for a chemical compound is the relative amount of damage to the ozone layer it can cause, with the value of trichlorofluoromethane (R-11 or CFC-11) being set at 1.0. |
| R5. Formation potential of tropospheric ozone (POCP) | kg NMVOC eq. | Photochemical POCP, expressed as non-methane volatile organic compounds, contributes to the formation of ground-level (tropospheric) ozone (also known as photochemical smog) and thus to the degradation of air quality with adverse effects on the environment. |
| R6. Amount of construction waste (CW) | % | This indicator was calculated following [53]. |
| R7. Amount of demolition waste (DW) | % | This indicator was calculated following [53]. |
| R8. Thickness (t) | mm | This is an important technological indicator for assessing the weight of the envelope system, and its value can be retrieved from the BIM model. |
| R9. Thermal resistance (R) | m2K/W | This is a thermal property that measures the temperature difference imposed by a material or system on heat flow; its value was calculated using the parameters from the BIM model. |
3.2. Methods for Environmental Impact Calculation
For the environmental impact assessment, this study uses two data sources: environmental assessment software (SimaPro 9.3.0.3) and Environmental Product Declarations (EPD) compliant with EN 15804:2012+A2:2019 [
54]. The reliability and completeness of available EPD data were evaluated prior to use. The environmental assessment is intentionally limited to cradle-to-gate (A1–A3) impacts, for three main reasons: (i) not all manufacturers provide information for every life-cycle stage; (ii) as described in [
55], the manufacturing phase usually has the highest environmental impact, and often represents the most significant proportion of the impact; and (iii) the objective of this study was to support early-stage design decisions regarding building envelope alternatives. These modules, according to [
56], represent raw material extraction and processing (A1), transport to manufacturing (A2), and product manufacturing (A3), and are generally regarded as the dominant source of embodied environmental impacts of construction products. The assessment therefore focused on the embodied environmental impacts of envelope components rather than the complete life-cycle performance of the building [
56].
Since some of the products needed for the study were not available in the EPD database, SimaPro (v9.3.0.3) software was used to determine the individual impact indicators. CED (non-renewable) was calculated using the CED v1.08 method, while the GWP and ODP indicators were obtained with IMPACT 2002+ v2.1, and POCP from ReCiPe Midpoint (E) v1.05 (see
Table 1). The total amounts of the equivalent emissions or primary energy for a specific impact category were obtained by multiplying the equivalent impact indicators by the amount of product (e.g., mass of material) or process (e.g., mass and transportation distance of the product) corresponding to a cradle-to-gate analysis. An inventory analysis was performed by itemizing the elements of the building envelope. Major components were expressed as a volume and mass of constituent material, and minor items were not included.
This environmental evaluation did not include the operational stage (particularly module B6, operational energy use), building service systems, maintenance, replacement, and end-of-life processes beyond a waste assessment. At the conceptual stage of the design process, reliable information on HVAC systems, control strategies, occupancy patterns, and future energy supply is typically unavailable, making operational impact assessments highly uncertain. By restricting the analysis to embodied impacts, an objective comparison of alternative envelope solutions could be conducted while maintaining consistency across design options.
When calculating the amounts of construction and demolition waste, the method described in [
53,
57] was used. Waste from new construction projects (CW in
Table 1) was calculated using the apparent volume of debris waste, whereas waste at the demolition stage (DW in
Table 1) was obtained based on the apparent volume of demolished waste. However, if waste parameters could be estimated from EPDs for all compared alternatives, then EPDs would be a more suitable data source.
3.3. Methods for Multi-Criteria Analysis
To determine which MCDM method required least coding to achieve the same results, we carried out a preliminary comparison of four MCDM methods: Simple Additive Weighting (SAW) [
58], Technique for Order of Preference by Similarity to Ideal Solution (TOPSIS) [
59], Additive Ratio Assessment (ARAS) [
60], and Complex Proportional Assessment (COPRAS) [
61]. The results of this comparison and a sensitivity analysis are presented in
Section 4.
The basic concept of the SAW method is to find a weighted sum of the performance ratings for each alternative on all attributes, as summarized in [
62] and described in [
58]. This process consists of several steps:
- 2.
The DMM is then normalized to ensure that the initial data are comparable (Equations (2) and (3)):
where
is the converted value of the
i-th criterion for the
j-th alternative (
,
is the smallest value of the
i-th criterion, and
is the largest value of the
i-th criterion.
When maximum values are preferred, Equation (2) is used to transform the maximizing criteria; when minimum values are preferred, Equation (3) is used to transform the minimizing criteria.
The relative weights of the criteria were determined by experts as described above, and are assigned in such a way that the sum of the weights of all criteria is equal to one:
- 3.
The weighted normalized DMM is then formed:
where
is the weighted normalized criterion and is calculated as follows:
- 4.
The sum Sj of the weighted normalized values of all the criteria is calculated for the j-th object:
- 5.
The alternatives are then ranked. The highest value of Sj represents a rational alternative, and the alternatives are ranked in decreasing order of the calculated values of Sj.
3.4. Ontology-Driven Data Classification and Identification of Building Envelope Element Types
The proposed BIM4NZEB-DS system is based on an ontology-driven approach, where the ontology provides the semantic layer used to represent types of building element within a unified machine-interpretable structure. The following classification sequence and information management approach were applied in this study: IFC element → classification of elements → identification of elements → design alternatives → evaluation criteria → MCDM results. This formal representation facilitates semantic interoperability and supports consistent information management and classification.
Following the classification of objects and construction works described in [
39,
63], an ontology-driven classification structure for building element types was developed. The parameterized representation of each type of element was transformed into a formal machine-readable semantic representation, enabling automated mapping and integration of the building element components. The resulting classification structure supports the assessment of BES compatibility and facilitates the generation of structured digital descriptions of the BES characteristics. These semantically enriched representations constitute the foundation for all subsequent automated workflows within the proposed decision-support process.
Table 3 presents a fragment of the classification codes defined for the building elements.
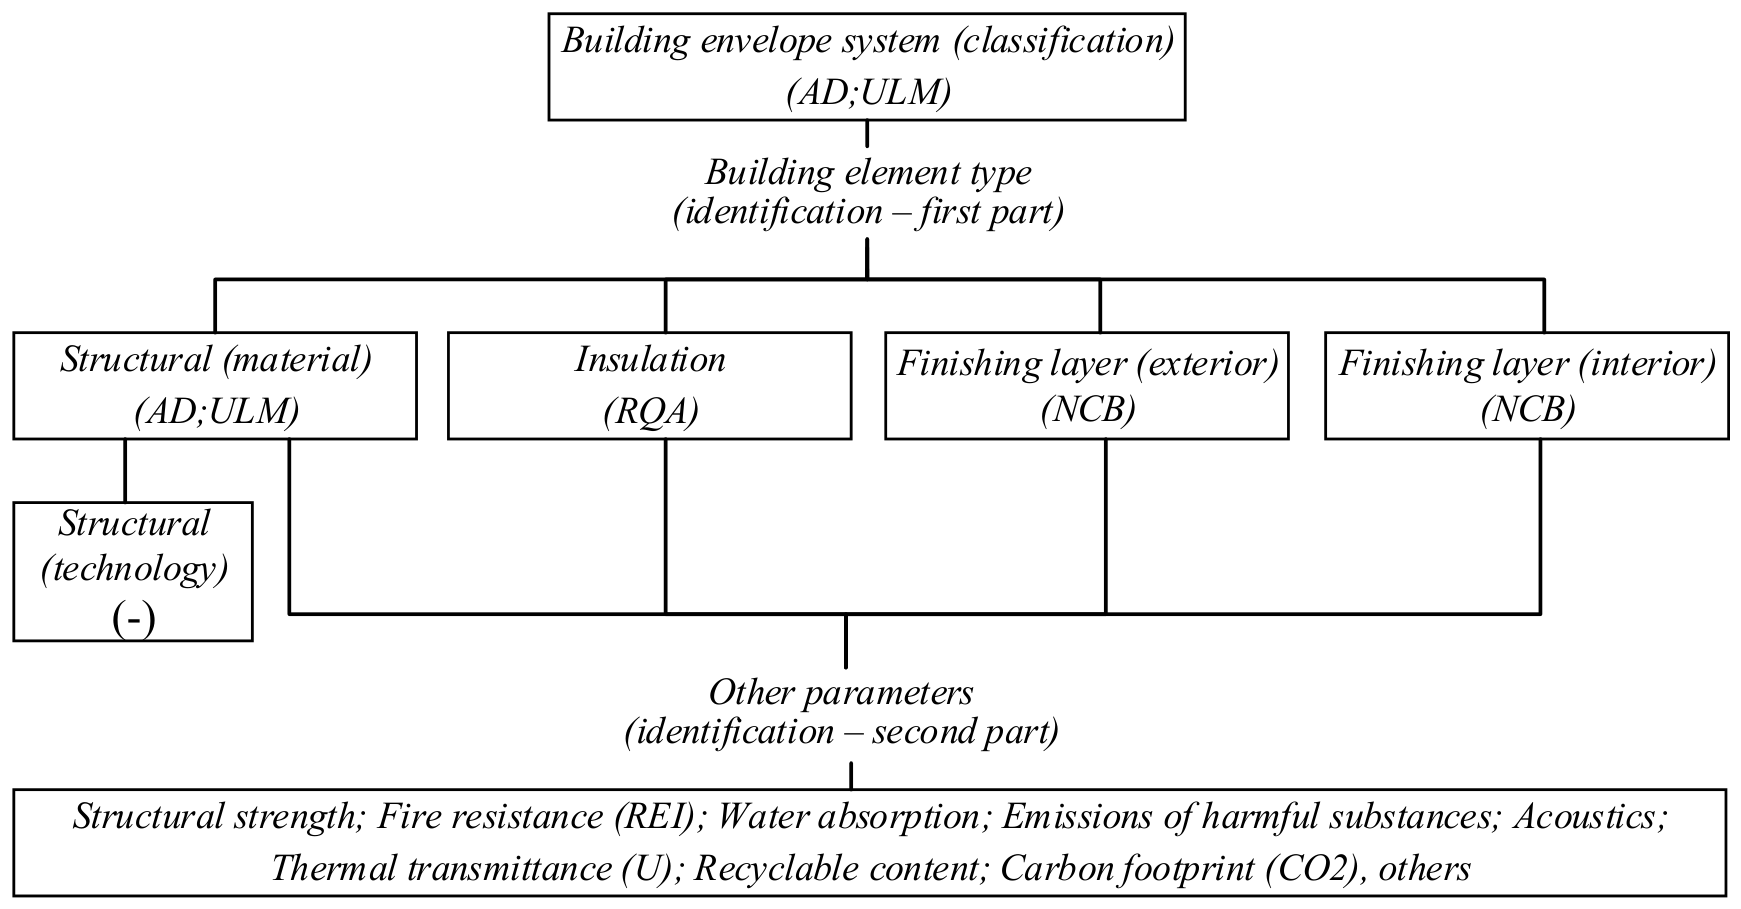
The ontology was structured around types of building envelope elements and their constituent components. At the element level, each element type was represented as a semantic entity linked to the corresponding structural material, construction technology, insulation layer, exterior finishing layer, and interior finishing layer (
Figure 3).
These relationships describe the composition of an element and enable its individual components to be interpreted and processed independently while maintaining their semantic connection to the complete type of building element. Hierarchical relations are also used to associate specific subclasses of material and technology with the corresponding functional classes, defined according to ISO 81346 [
39]. For example, a wall type can be represented as a structured combination of a specific structural material (e.g., ULM), construction technology (in this example not specified), insulation material (e.g., RQA), and exterior and interior finishing layers (e.g., NCB) (see
Table 4). These explicit semantic relationships enable the automated identification, comparison, and compatibility assessment of BES components and support the generation of alternative designs for the building envelope.
A semantically stable relationship between the BIM data and decision making within the developed system was established through the consistent integration of object classification, identification, property description, and evaluation levels. In the initial stage, an IFC element is mapped to the corresponding ISO 81346 object, thereby defining its class and semantic position within the overall building system structure. Based on this classification, a specific type of element is created; the first part of its identification is defined by parameters describing the object’s typological and construction-related characteristics, and the second part is supplemented with technical, economic, and sustainability-related properties that characterize its performance, environmental aspects, and other evaluation-relevant attributes. This two-level identification system enables the relatively stable ontological identity of an object to be distinguished from its variable properties while maintaining an unambiguous semantic relationship between the BIM element and the associated data.
This structure allows different types of elements and combinations of their parameters to be integrated into design alternatives. The corresponding technical characteristics and sustainability indicators are automatically assigned to each alternative and are subsequently transformed into criteria values for use in multi-criteria evaluation. This creates a consistent semantic basis for the information management and decision flow processes in BIM4NZEB-DS: IFC element → ISO 81346 object → element type → technical and sustainability properties (indicators) → design alternative → evaluation criteria → MCDM result. The MCDM results therefore remain directly traceable to the original BIM objects and their semantic descriptions, while data interpretation remains consistent throughout the different stages of information processing.
The ISO 81346-based ontological and semantic structure proposed in this study therefore provides a common framework that facilitates data fusion between the BIM model and heterogeneous external data sources. Semantic and structural consistency is ensured, thereby enabling the transfer of a unified dataset to automated decision-making processes, and supporting reliable data mapping, consistent data reuse, and decision traceability.
3.5. Data Fusion Model
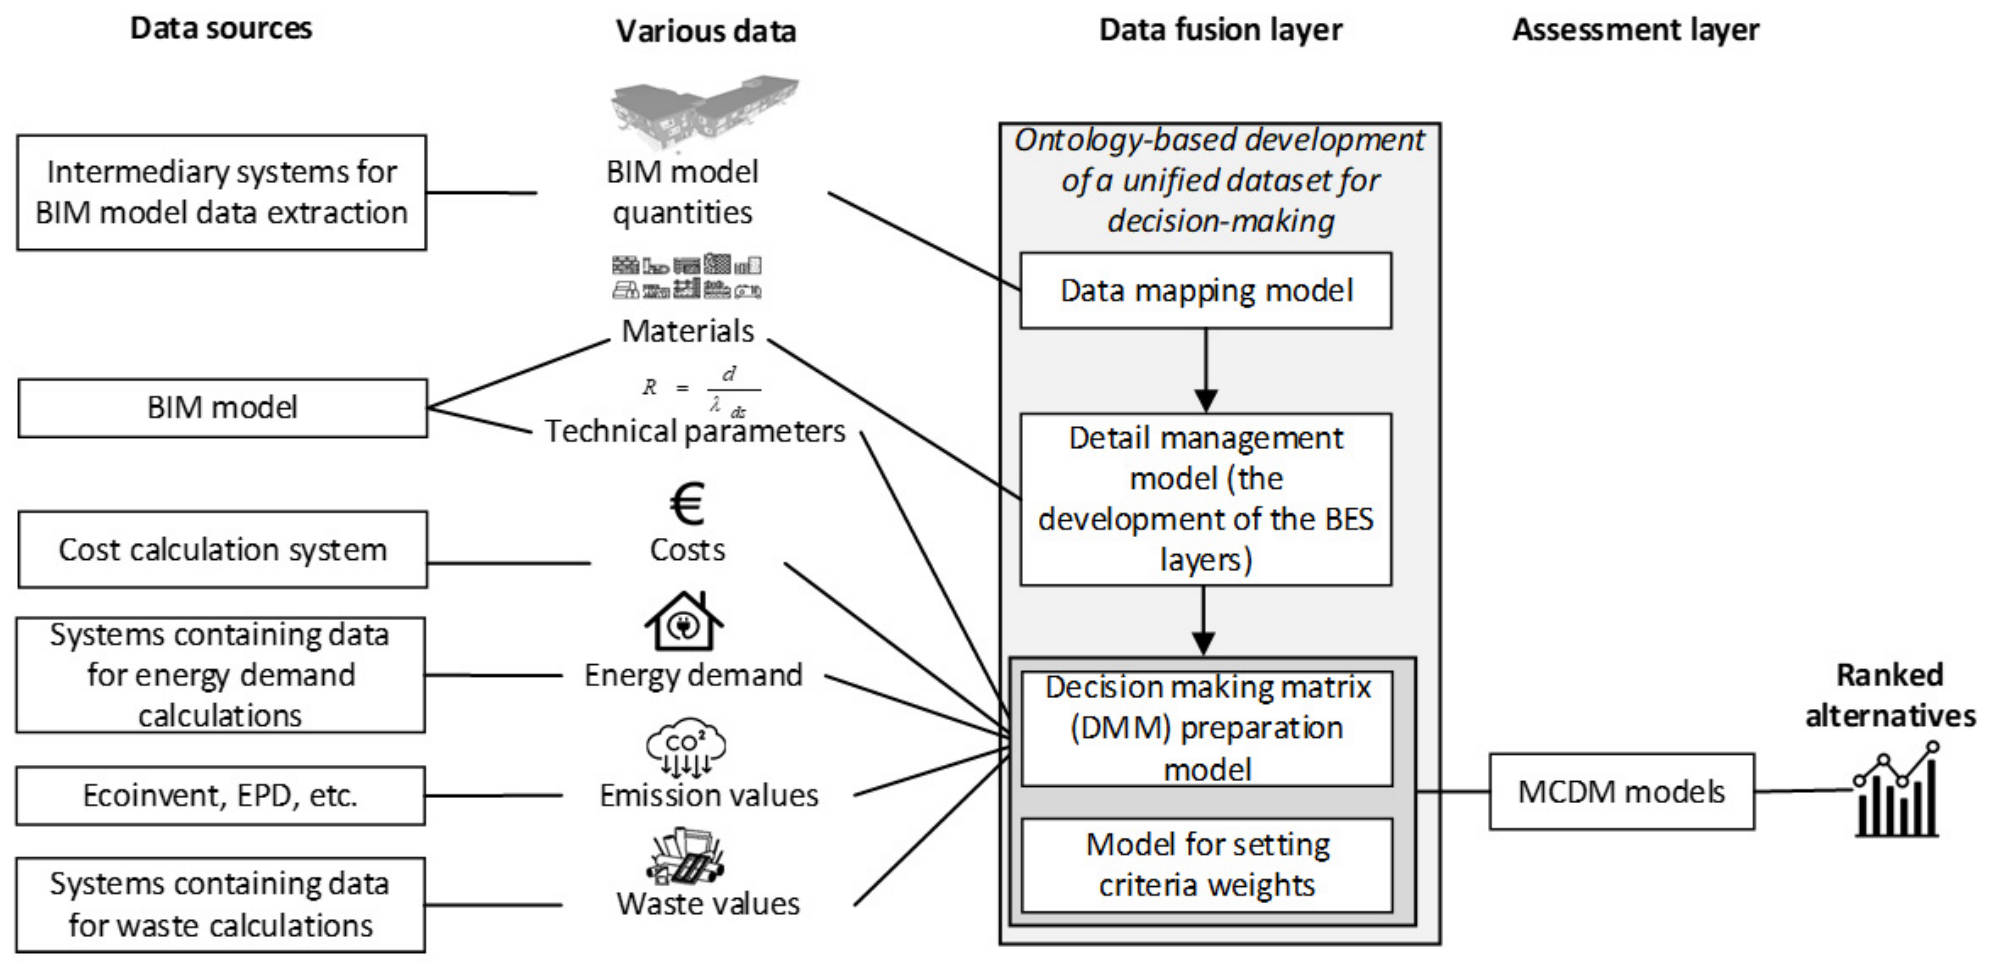
The proposed data fusion model was designed to support sustainability assessment by combining heterogeneous data sources into a unified dataset suitable for decision making. Unlike conventional approaches to data integration, the proposed data fusion model can generate a consolidated dataset that serves as a common basis for sustainability analysis (see
Figure 4). Data extracted from each data source are processed and harmonized according to the ontological and semantic structure described above, resulting in the development of a DMM.
As shown in
Figure 4, the proposed data fusion model enables the extraction and aggregation of diverse types of data, including quantities from the BIM model, cost information, energy demand, emissions values, waste values, and technical parameters. These data are obtained from multiple sources, such as a BIM model, cost calculation systems, systems containing data on energy demand and waste calculations, Ecoinvent, and EPD database (DB). After extraction, the data are semantically aligned and fused into a unified dataset, which is then used as input for the generation, evaluation, and comparison of sustainable building design alternatives. The resulting data fusion model facilitates a comprehensive assessment of sustainability performance by incorporating environmental, economic, and technical criteria within a single decision-support process.
The proposed data fusion model consists of three interconnected layers: the data source layer, the data fusion layer, and the assessment layer. The data source layer consists of the datasets required for sustainability assessment, which differ in terms of their origin, structure, semantic interpretation, and level of detail. To overcome these heterogeneities, the data fusion layer functions as the core component of the model, combining distributed information into a semantically consistent dataset. An ontology-based process of data organization is used to establish explicit relationships among building elements, materials, technical characteristics, and sustainability performance indicators, thereby ensuring semantic consistency throughout the assessment process.
The fused data are then transferred to the DMM preparation model, where the alternatives and criteria values are systematically structured. In parallel, the criteria-weighting model defines the relative importance of each selected assessment criterion according to the decision maker’s preferences. The prepared DMM and criteria weights are transferred to the MCDM models in the assessment layer, where the alternatives are evaluated against multiple sustainability criteria. The final output is a ranked set of alternatives, which is presented for final decision making.
3.6. Workflow of the System Algorithm
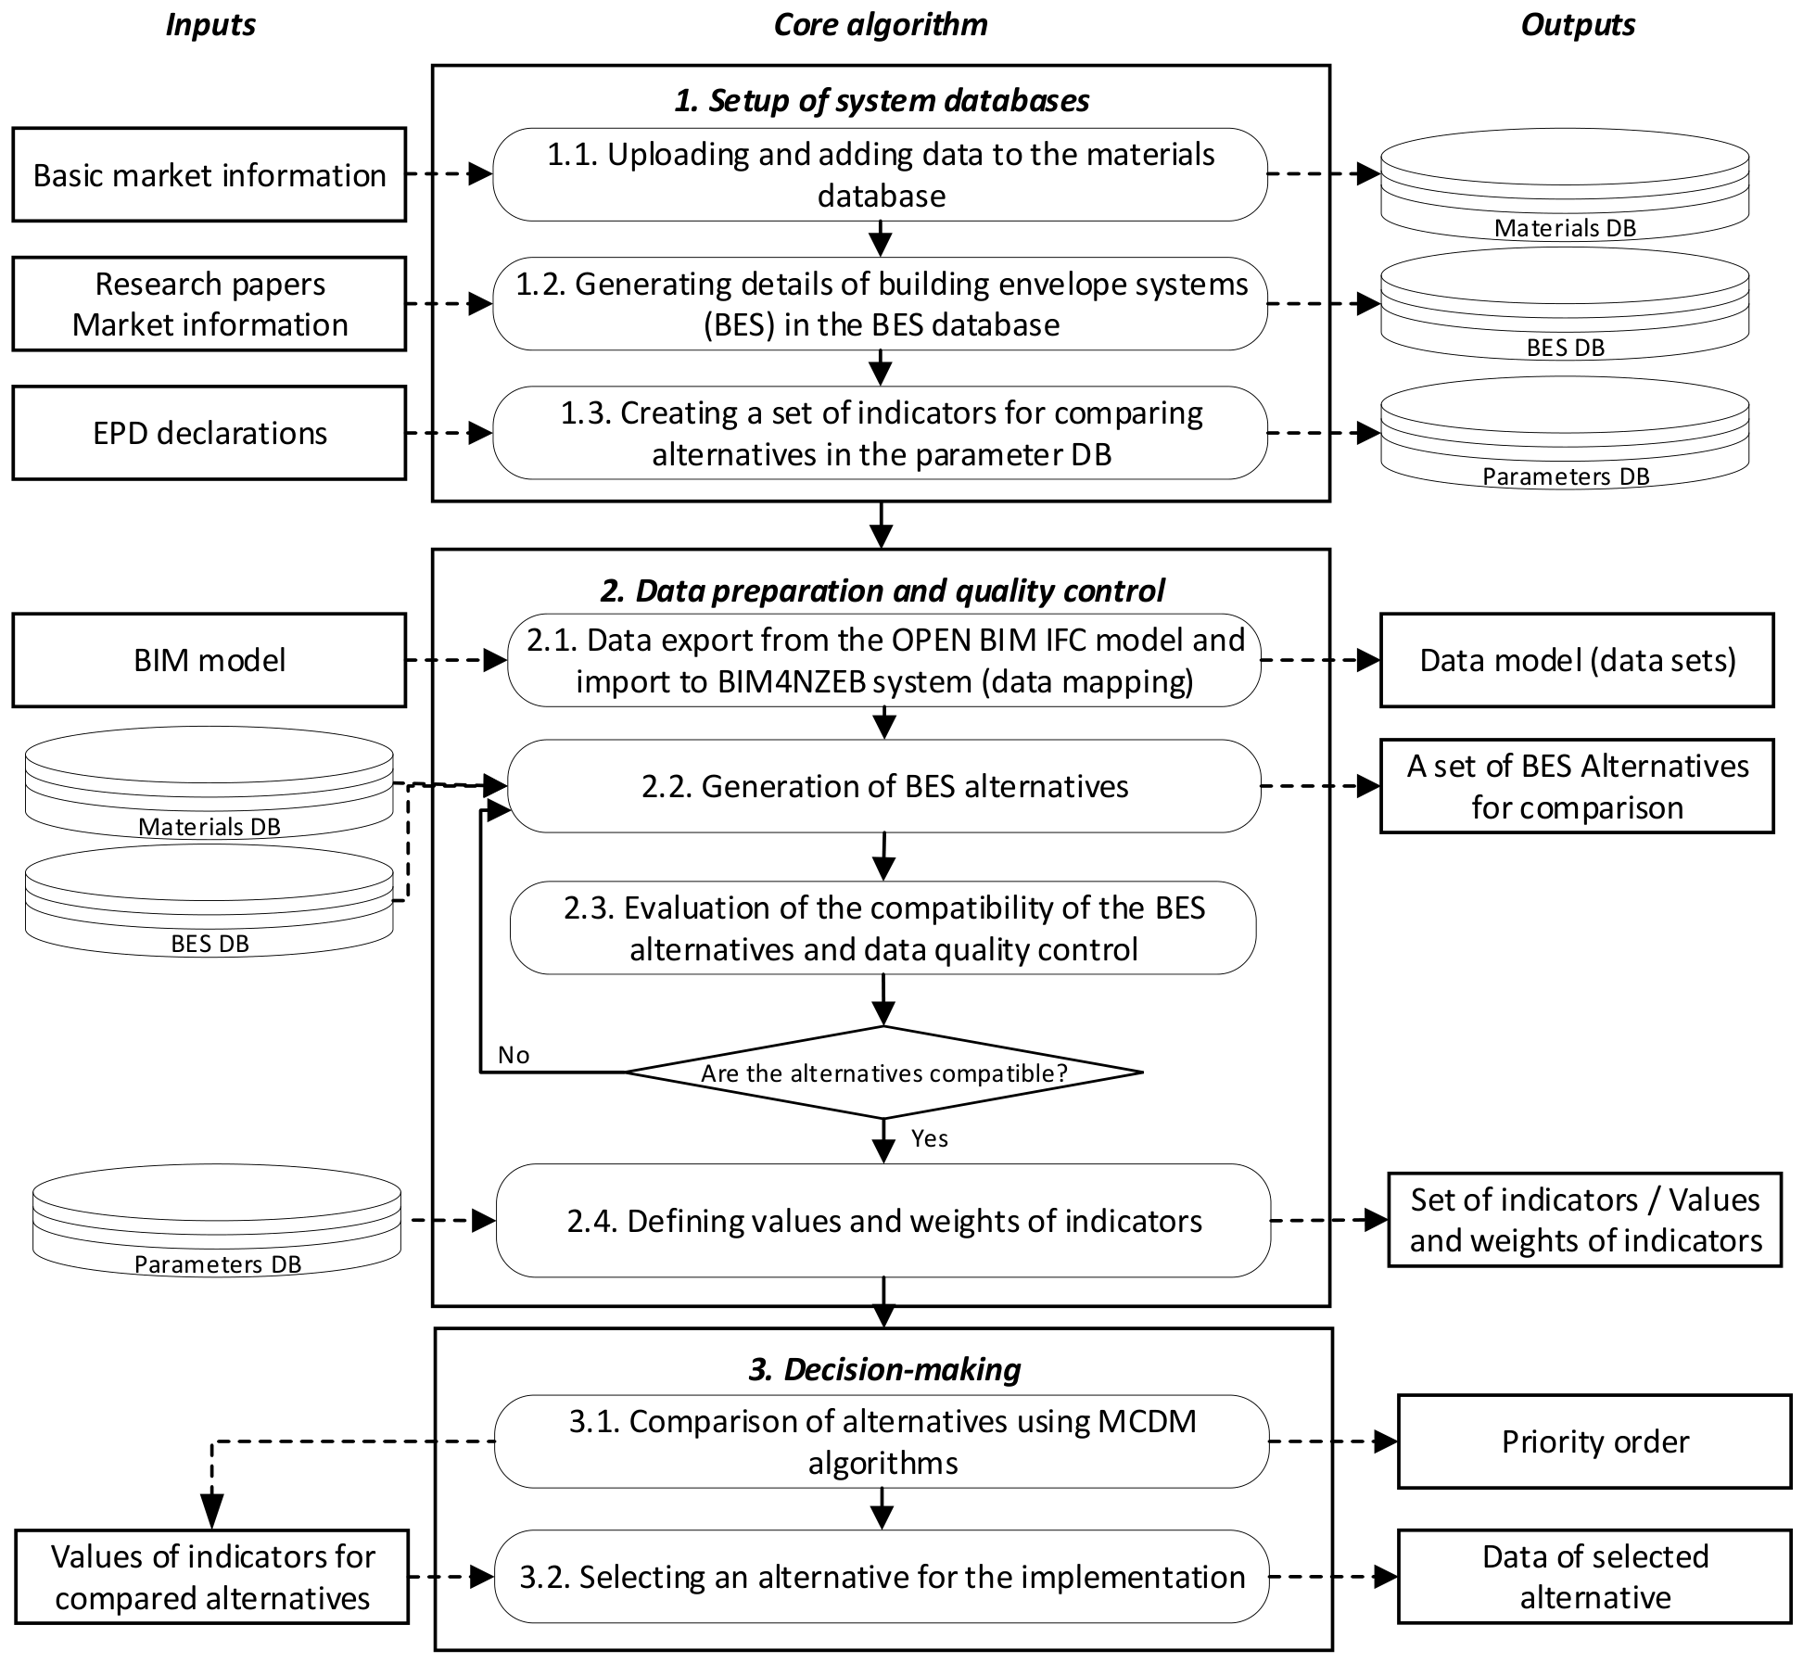
Figure 5 shows the workflow for the developed system, including the inputs, core algorithm, and output layers. The core algorithm consists of three main parts. In the first part (1. Setup of system databases), the decision maker reviews the DBs (i.e., Materials DB, BES DB, and Parameter DB) and verifies whether there is sufficient information (
Figure 5, step 1.1).
The decision maker also checks whether the Parameters DB contains the indicators needed to assess the alternatives. If necessary, the Materials DB is supplemented with missing information on the materials, and the BES DB with building technical information, such as the basic composition of the building envelope (layers, materials), and the essential characteristics of the technical system components of the building. Possible options are then generated for comparison. Finally, the decision maker verifies whether the BES sets and components in the BES DB follow the design intent.
The elements that make up the technical systems of a building (
Table 2) are coded in such a way that when the technical system has been created, the computational algorithm recognizes the basic composition of the building envelope (layers, materials) and, the essential (material) characteristics of the components, and generates possible options for further analysis and comparison (
Figure 5, step 1.2).
From the Parameters DB, the decision maker selects a set of parameters to build indicators for comparing the building envelope systems (BESs) (
Figure 5, step 1.3).
In the next step (2. Data preparation and quality control), the data are transferred from the openBIM IFC model to BIM4NZEB-DS, including the data mapping (
Figure 5, step 2.1). During the data mapping process, the algorithm recognizes the types of classes formed by the technical systems and elements of the building, which are classified according to the classification structure (
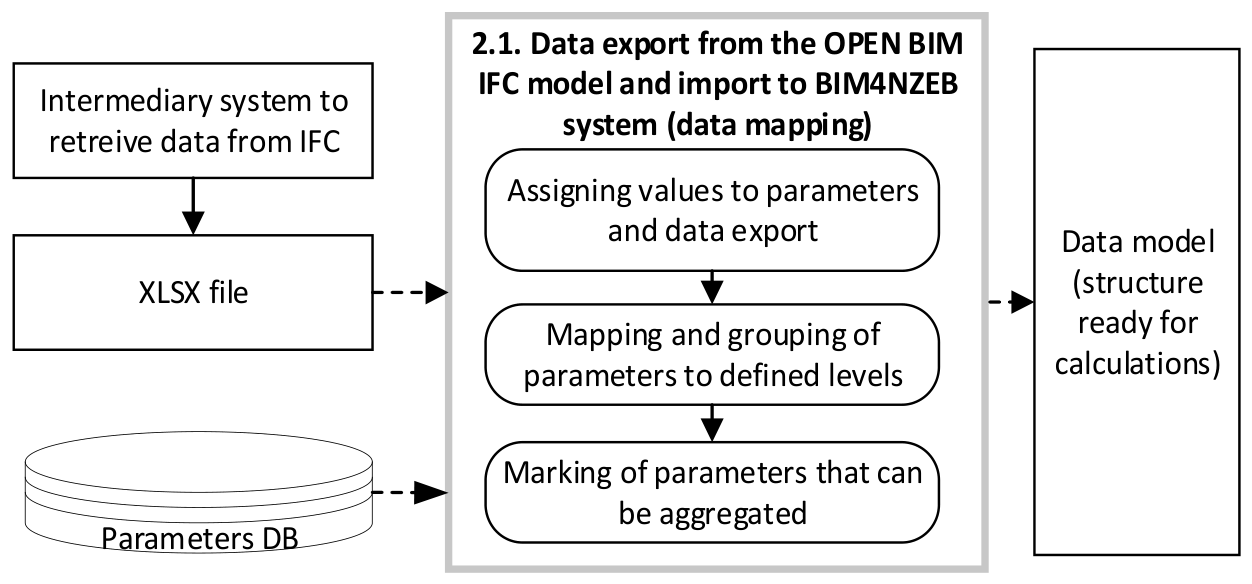
Table 2). It relates these technical systems and elements to the envelope layers (such as load-bearing layer, insulation, and vapor barrier) and materials, thereby providing a parameterized transition from the geometry of the BIM model to the subsequent calculations. The results of data mapping are saved as JSON objects.
The data mapping scheme is presented in
Figure 6.
Examples of mappings from BIM data to BIM4NZEB-DS data are presented in
Table 5.
In step 2.3 (
Figure 5), a set of possible BES alternatives is generated from the BES DB for each type of building envelope. The decision maker then assesses the compatibility of these alternatives with one another and with other structures of the same building, especially the load-bearing ones. Since an Individual envelope system does not consist of individual materials but of combinations of materials and elements, it is important to develop BESs properly to ensure compatibility between the materials; for example, triple-layered reinforced concrete panels for a façade should not be mounted on a timber supporting frame. Data quality control is also necessary, i.e., by ensuring that the same units of measurement are chosen.
In step 2.4 (
Figure 5), a set of indicators for comparing alternative BESs is identified using the data from the Parameters DB. Some indicator values are assigned directly from the BIM model. The weights are assigned by a decision maker, but the system checks that the weights sum to one and readjusts them if necessary.
Finally (3. Decision making), the system runs an MCDM algorithm and presents the alternatives in order of priority. The decision maker takes the final decision based on these results.
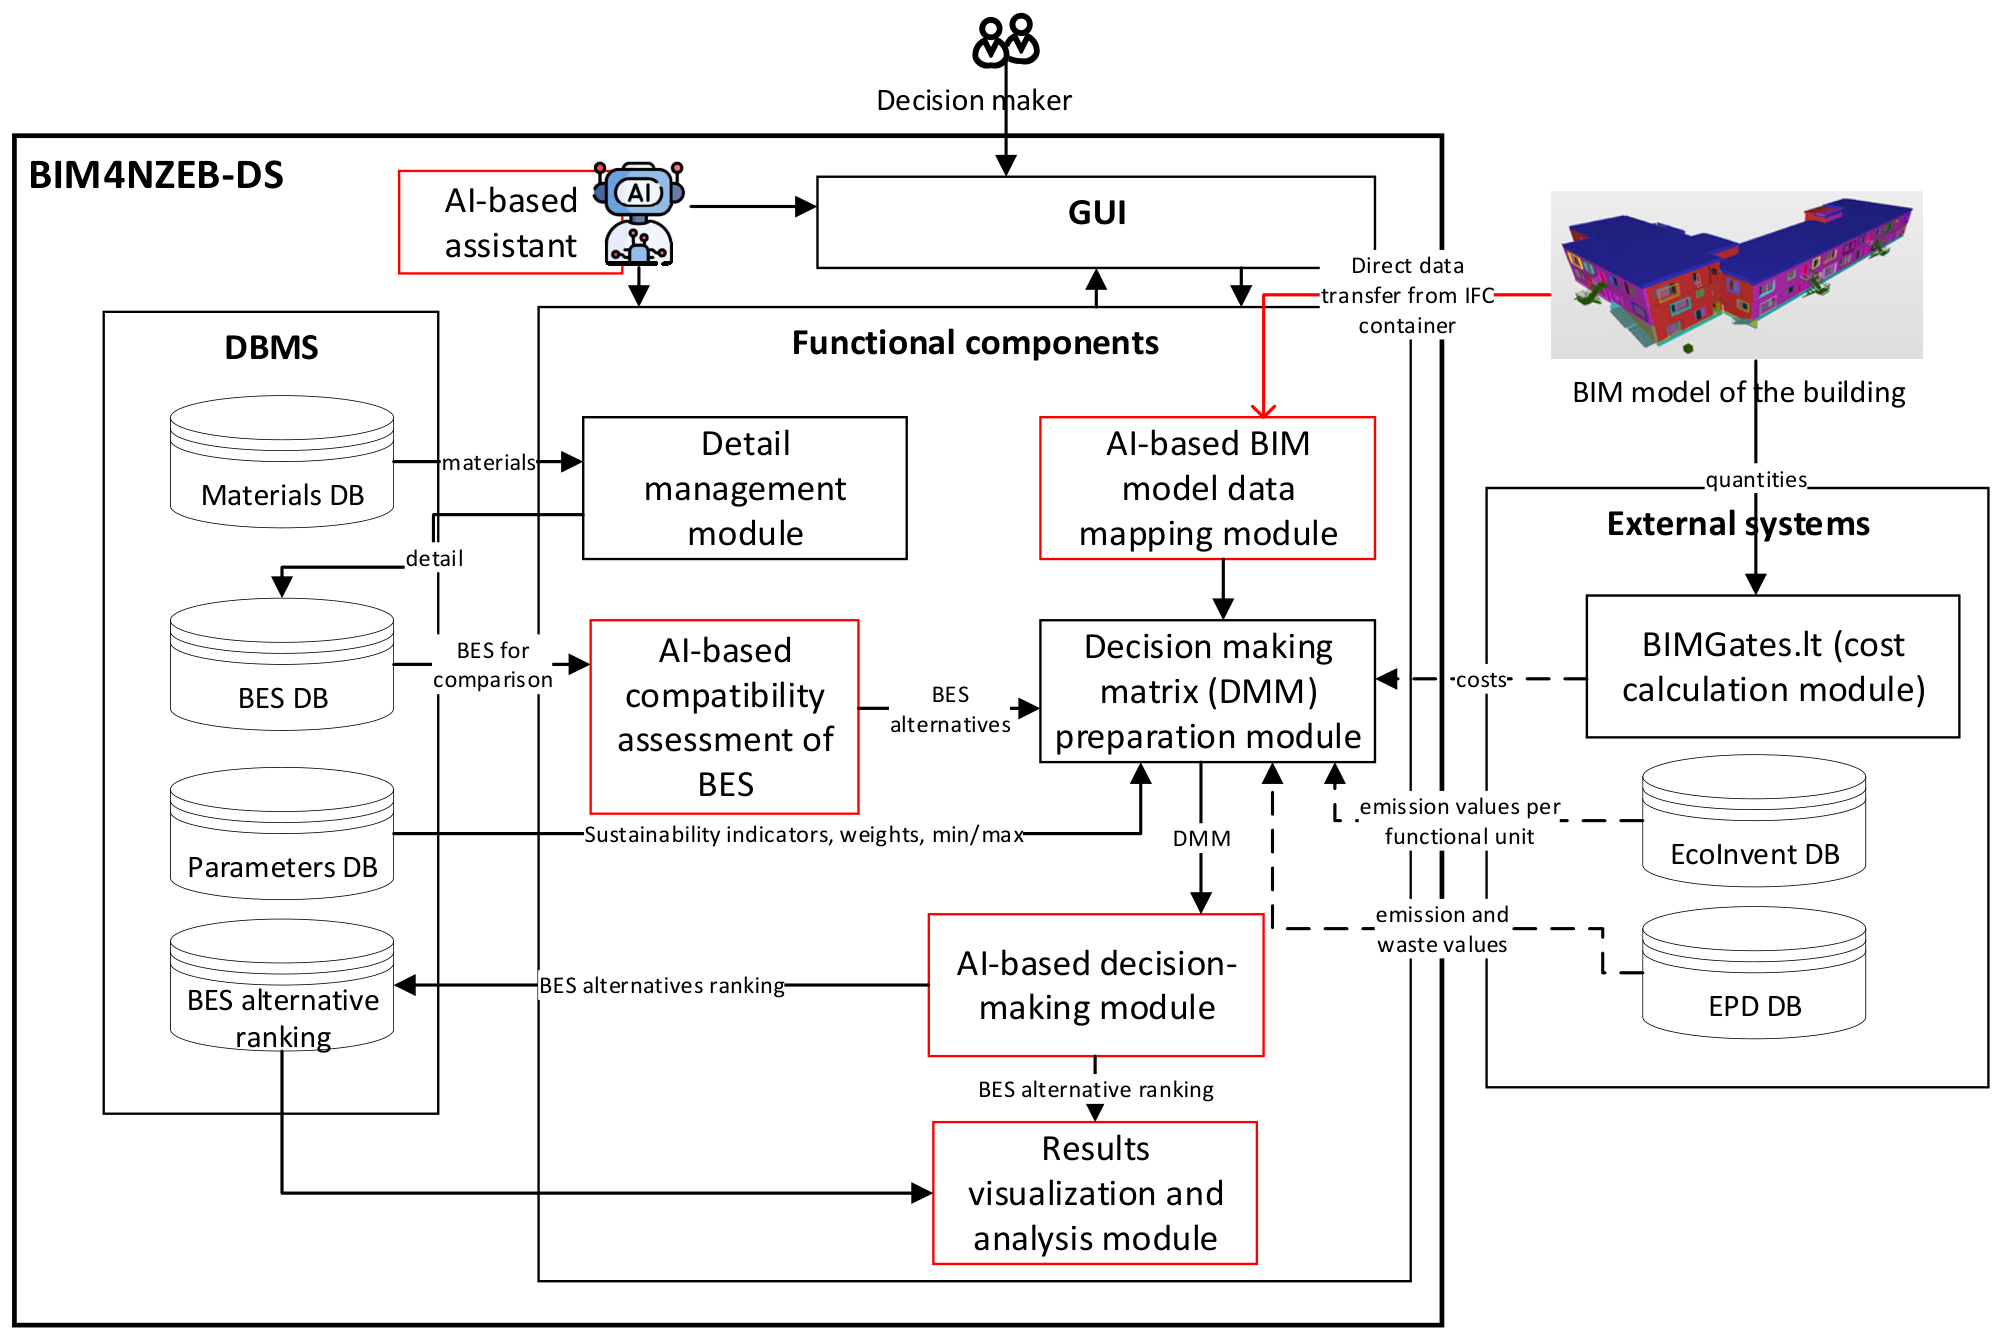
3.7. System Architecture
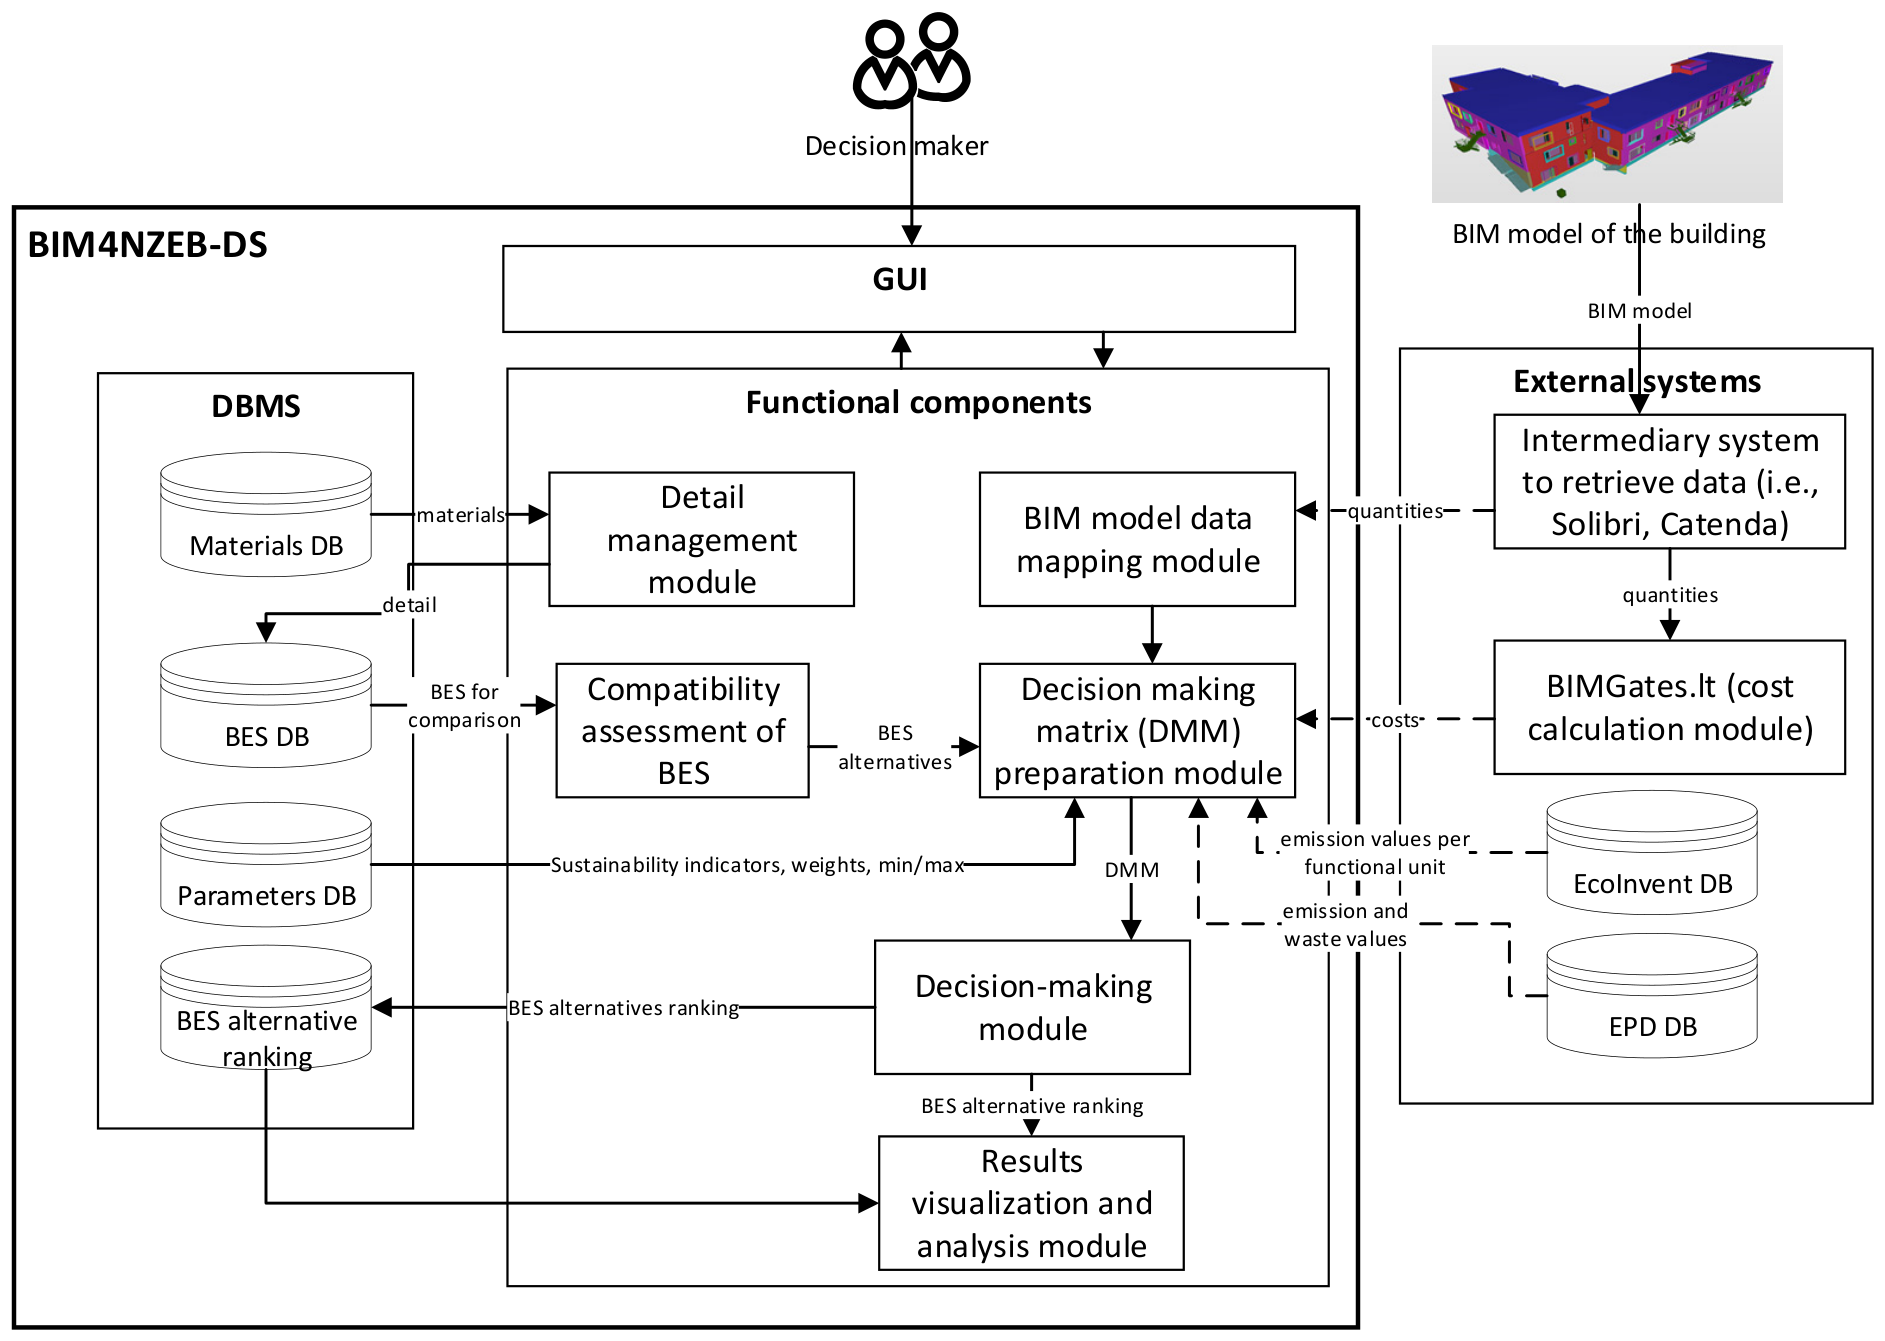
A three-layer architecture was chosen for BIM4NZEB-DS, comprising a graphical user interface (GUI), functional components, and several databases (
Figure 7) as follows:
The GUI enables interaction between the decision maker and the system, and provides information for decision making, as described above. Decision-makers use the GUI to access the Materials DB, BES DB, and Parameters DB via a Web-based platform.
The functional components of BIM4NZEB-DS implement the core steps of the algorithm.
The database management system (DBMS) includes the Materials DB, BES DB, and Parameters DB.
BIM4NZEB-DS takes the necessary data from external systems. BIM quantities are transferred from the BIM model via intermediary systems (i.e., Solibri Office) and are used to develop the DMM. Any platform that supports openBIM (buildingSMART) formats and allows users to extract data from a BIM model in IFC format, regardless of the IFC standard (IFC 2x3 or IFC 4), based on the “one row, one element” principle is suitable for the methodology and system described here. The data mapping mechanism (based on parameters) ensures that data submitted in IFC 4 format are supported.
BIMGates.lt was used to calculate costs based on BIM quantities, whereas Ecoinvent and EPD DBs were used to determine emission values per functional unit to calculate the environmental impact indicators.
The following technologies were chosen for the implementation of the proposed architecture:
Backend (server): JavaScript programming language, NodeJS JavaScript runtime.
Frontend (GUI): JavaScript, HTML, CSS programming languages, ReactJS JavaScript framework.
Databases: MongoDB NoSQL type database.
4. Results
4.1. Description of the Case Study Building and Setup of Databases
The object selected to test BIM4NZEB-DS was a public building in Vilnius with a total area of 3506 m
2. The geometry of the BIM model was developed at LOD 100–350 level. The building was designed according to universal design principles, to make it accessible to all individuals regardless of any disability. The expected energy class of the building was A, according to [
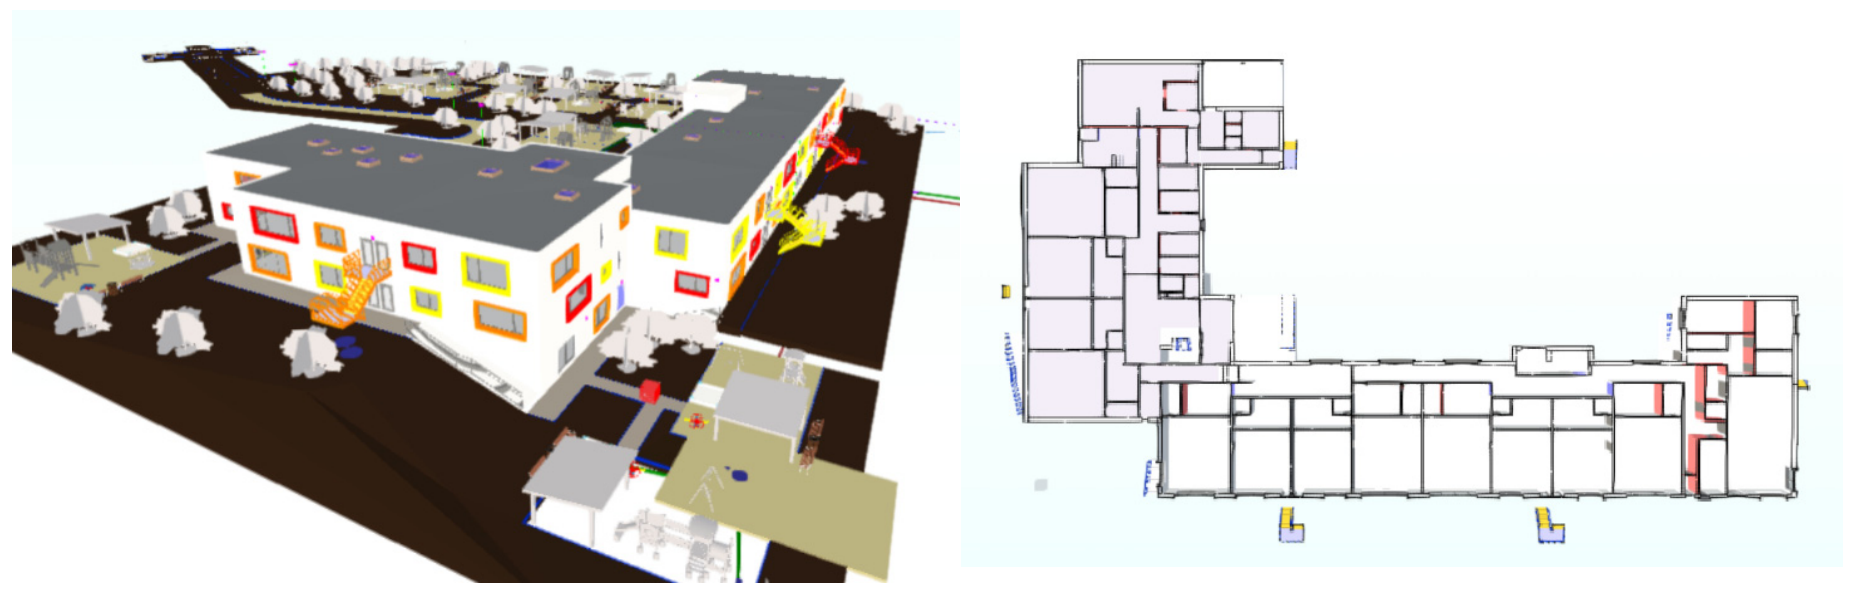
64]. Geothermal heating was installed to meet the building’s heating needs, and a load-bearing structure for the roof was created using prefabricated reinforced-concrete slabs. A model of the building, with on-site solutions and layout, is shown in
Figure 8.
The decision maker added missing data to the Materials DB, generated details of the BESs for the case study building in the BES DB, and created a set of indicators in the Parameter DB.
Table 6 presents the set of sustainability indicators.
The following section outlines the workflow used to apply BIM4NZEB-DS in this case study.
4.2. Workflow for the Case Study
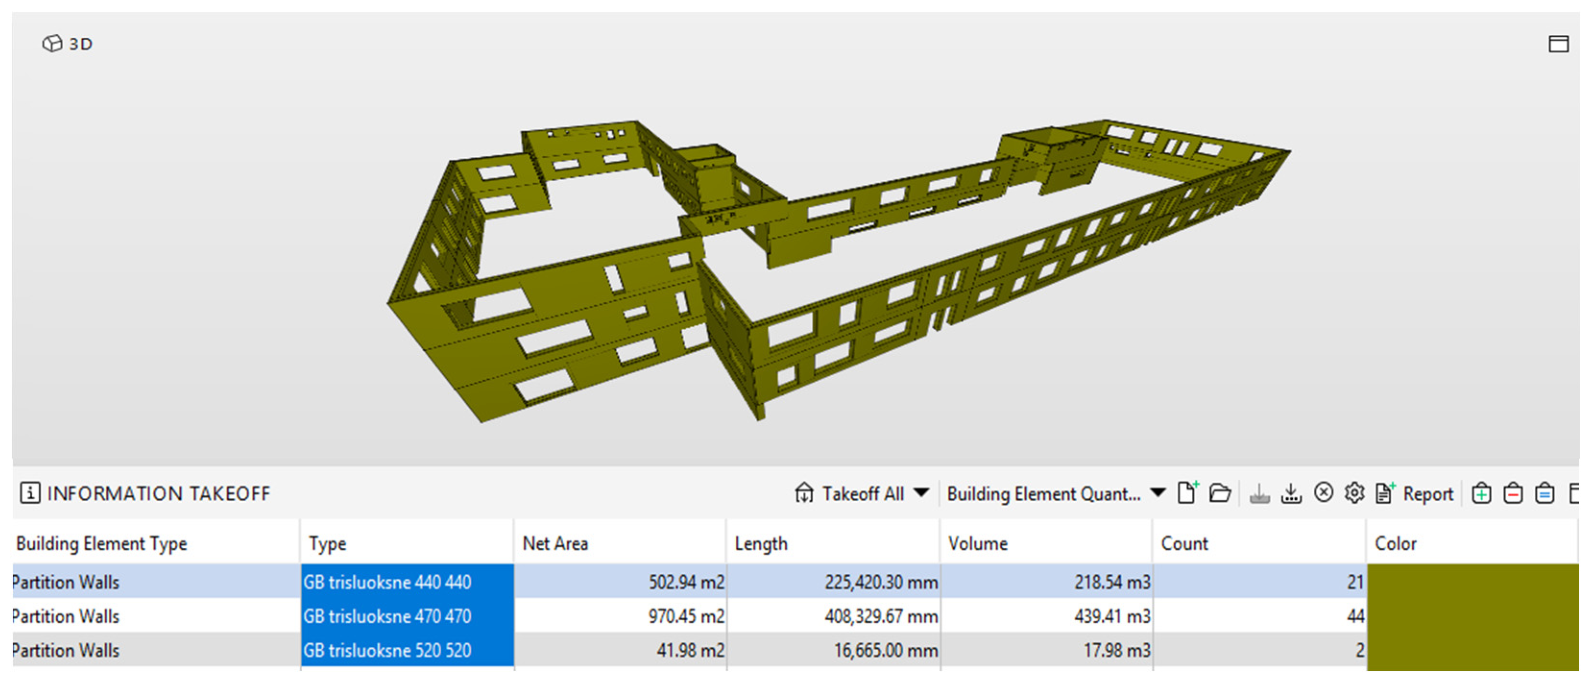
The initial data for assessing the case study building were extracted from the BIM model (
Figure 9) using Solibri software (
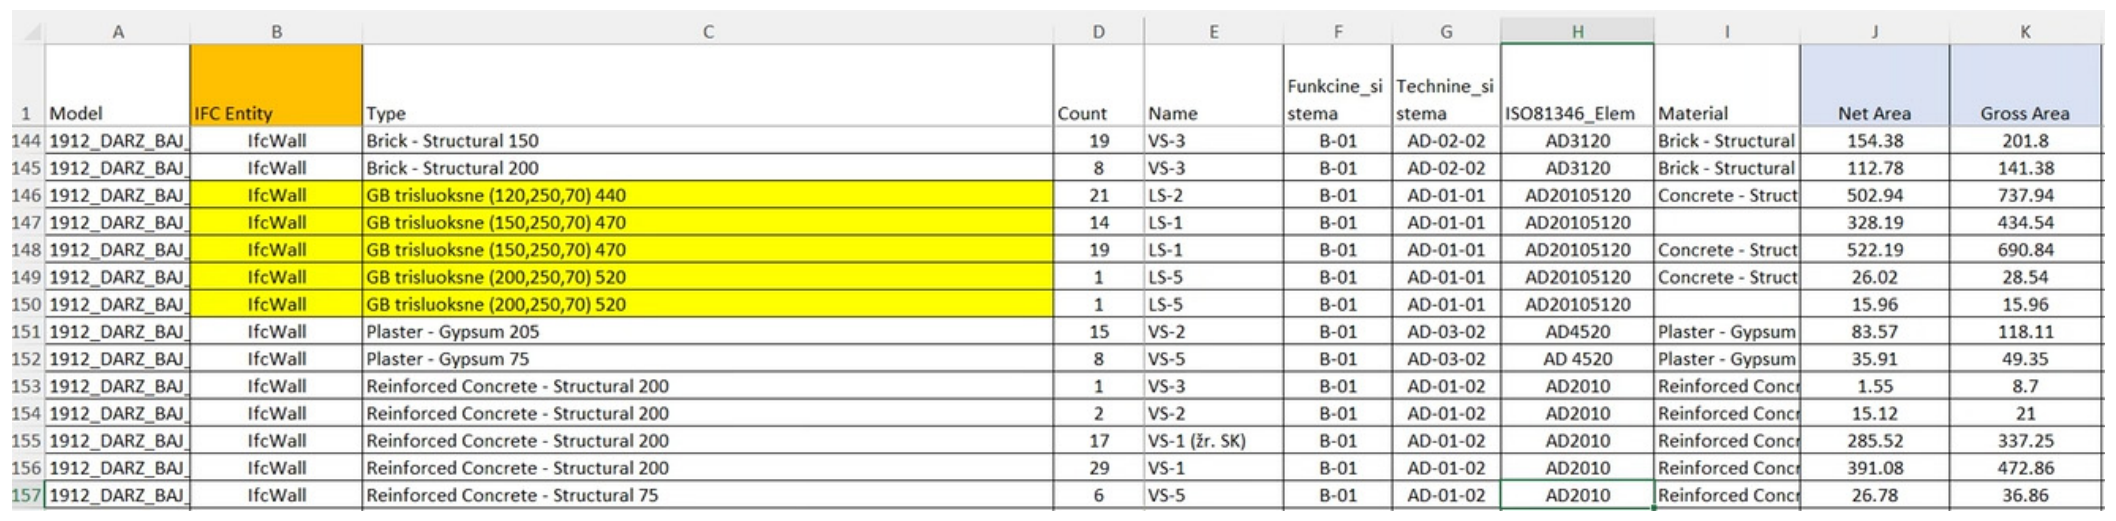
https://www.solibri.com), including data on external wall systems, roof systems, and window elements, and were saved in .xls format (
Figure 10). Other systems customized for quantity takeoff could also be used.
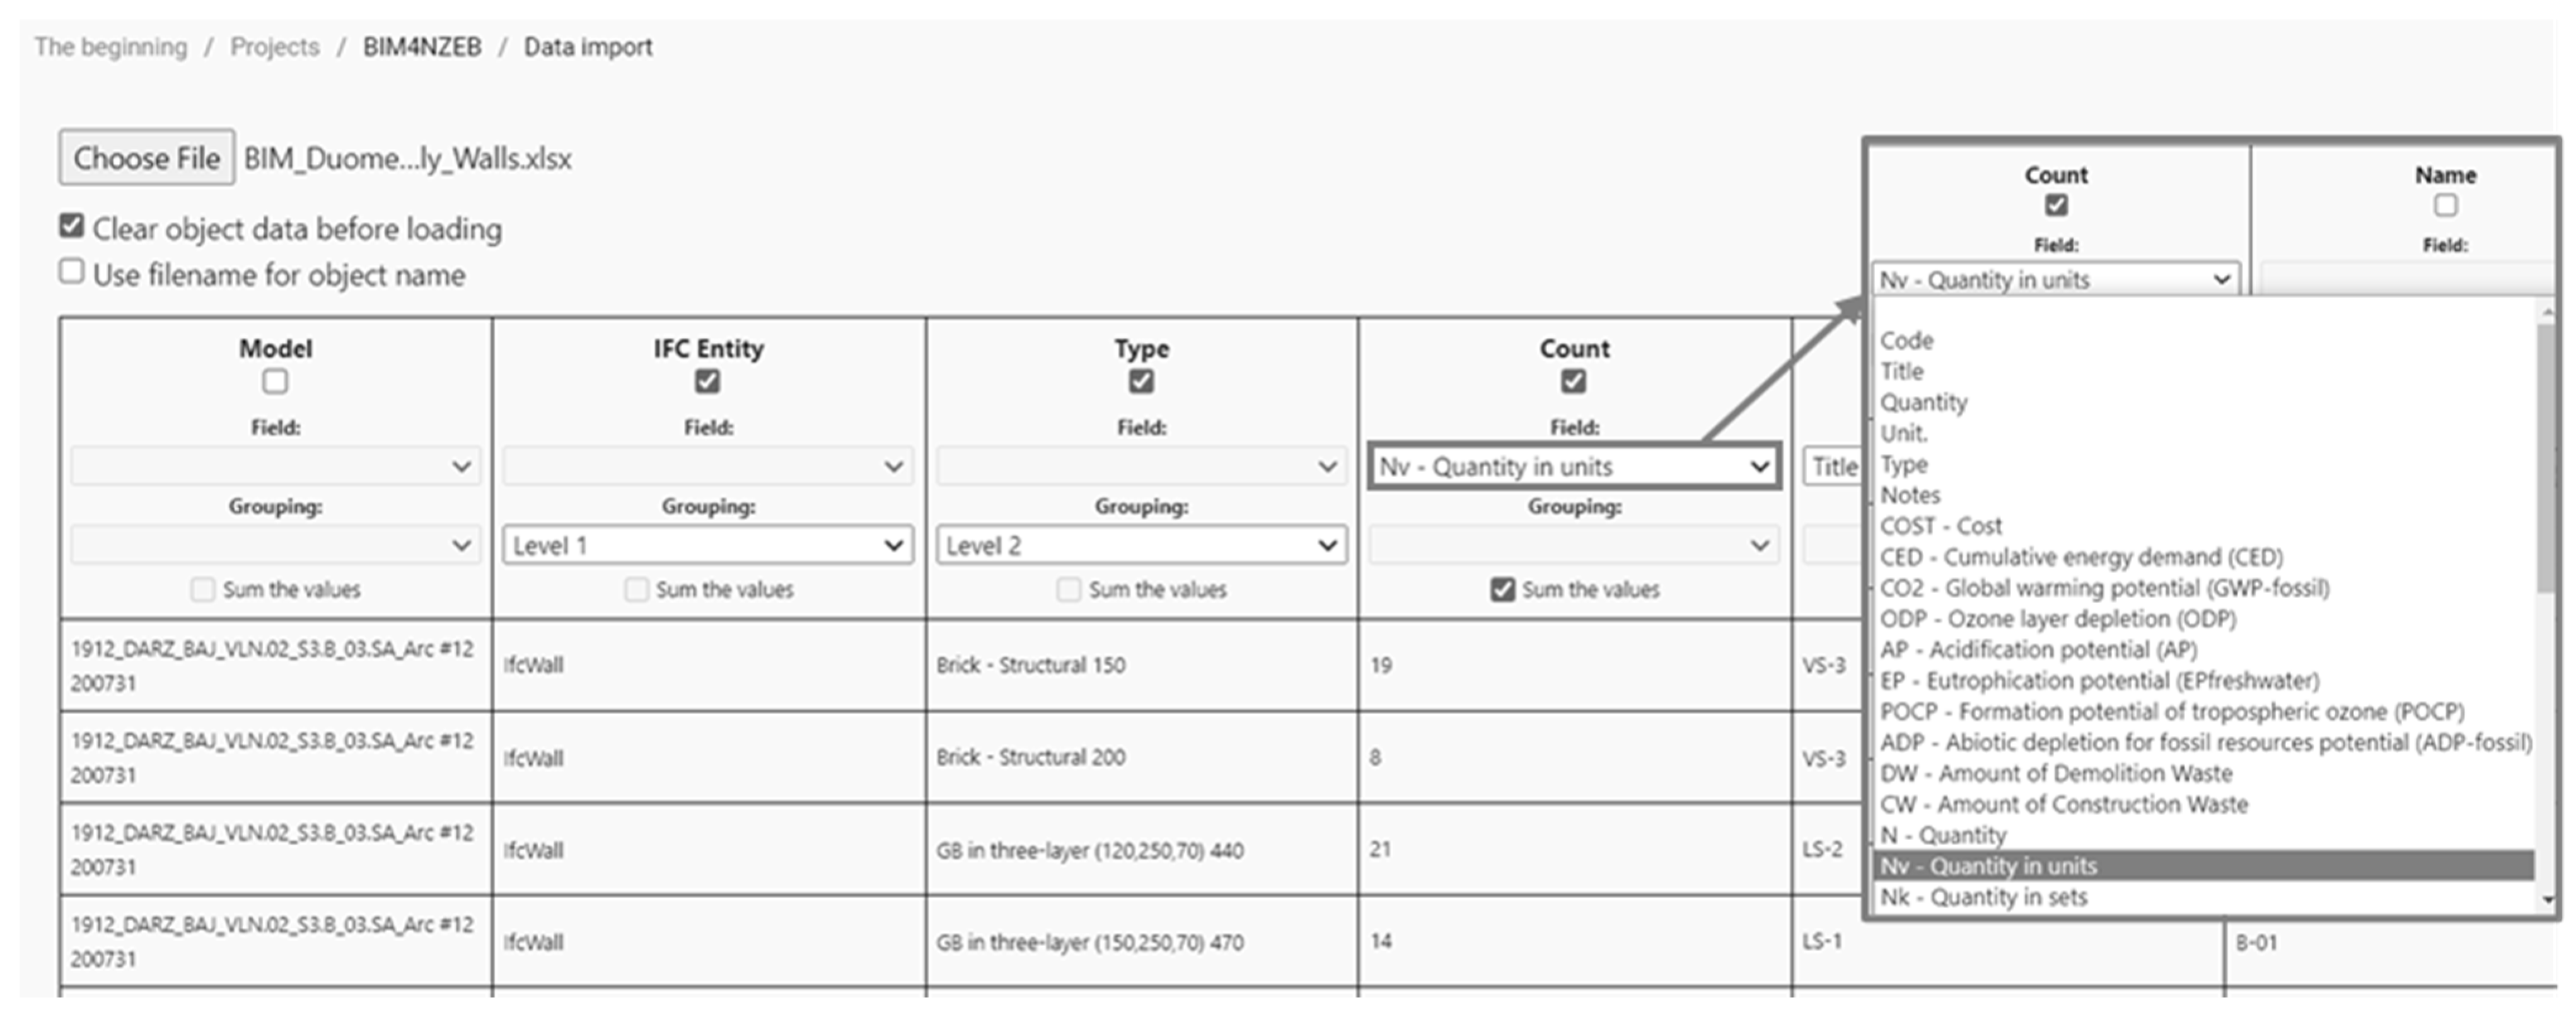
The process of data transfer from the BIM model into BIM4NZEB-DS involved mapping data from the generated information container, grouping to ensure correct data transfer, and aggregating values (
Figure 11). The data grouping function categorized these BIM data into levels based on project parts, element classes, and types. In this case study, the object data were grouped into two levels, based on IFCs and element types (e.g., level 1—ifcwall, level 2—bricks, three-layer wall) (
Figure 11).
The values of some element parameters can be transferred to the system in the form of units or aggregated values by summing the values for a group of elements of the same type (e.g., quantity of elements, areas, volumes, weights, lengths).
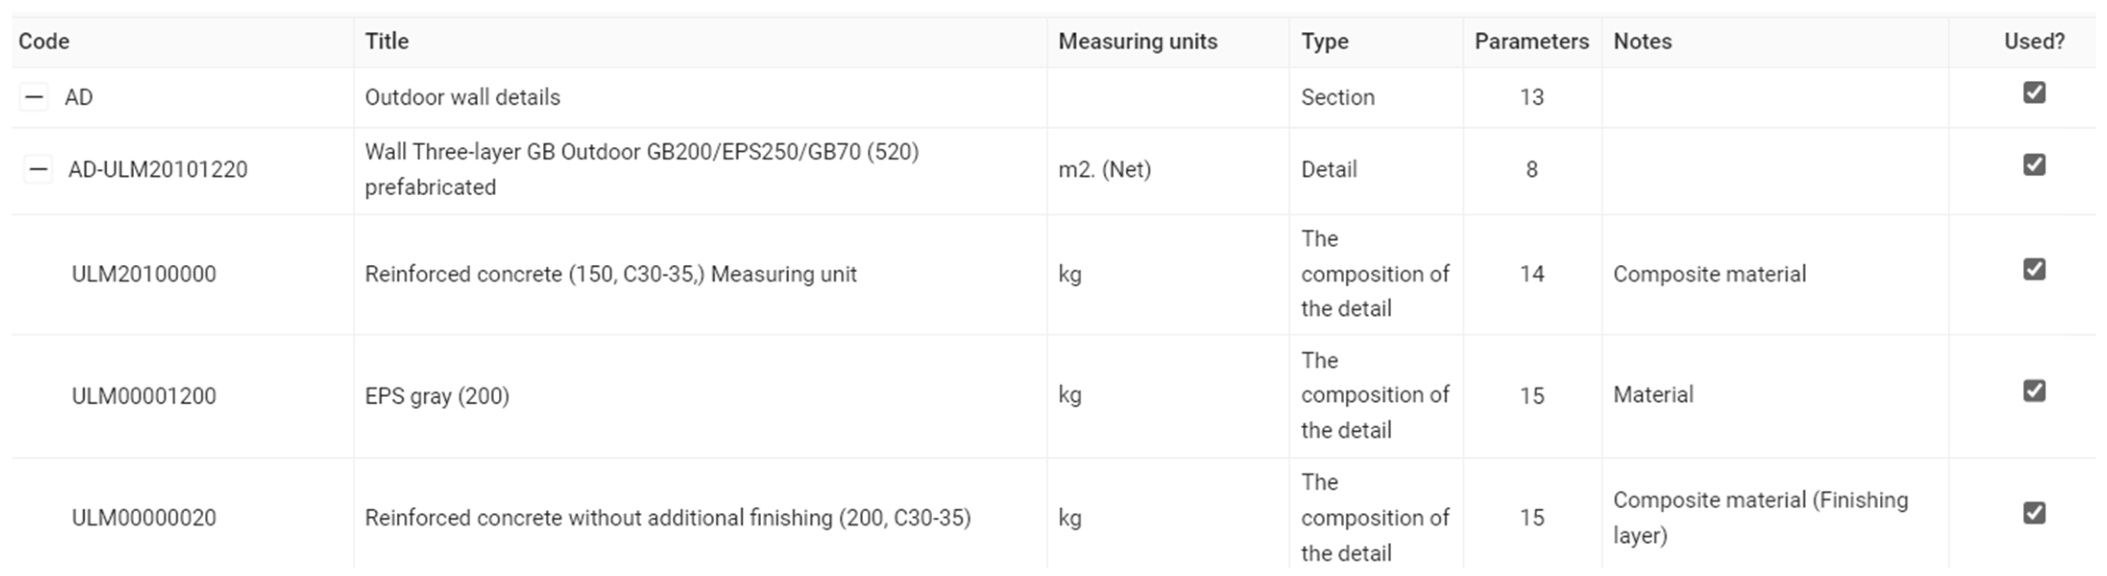
Next, BES alternatives were generated using the data from the BES and Materials DBs. Component linking was performed separately for each BES type using the Detail management module. An example showing of the formation of BES layers for the wall system in the BIM4NZEB-DS detail management module is shown in
Figure 12.
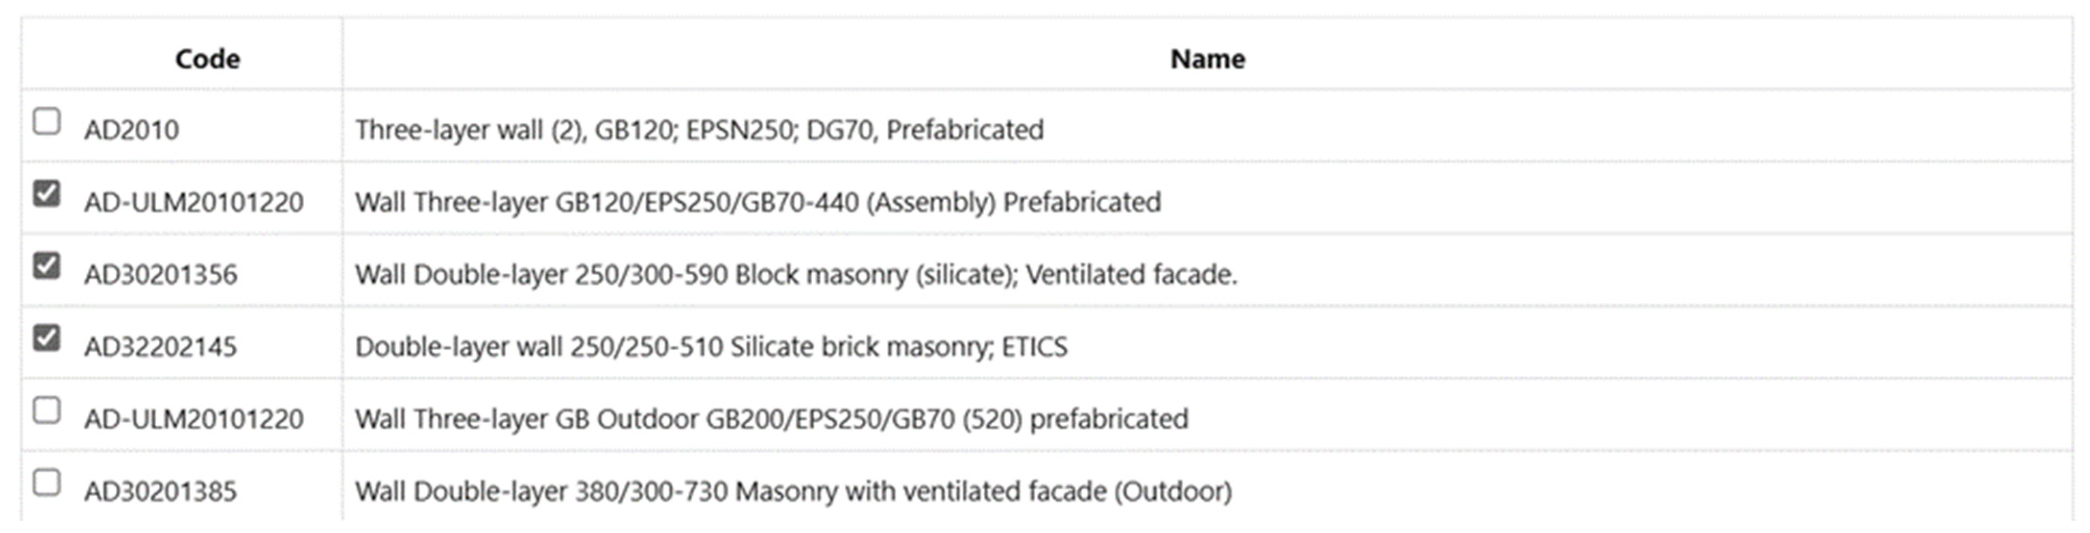
To generate a set of comparable BES alternatives, the decision maker searched the BES DB for technical system options for the external envelope, selected the most relevant ones, and assigned them to the analyzed part of the building envelope (e.g., wall, roof, etc.) (
Figure 13).
For a comparative analysis of the wall systems, one type (multi-layer) of exterior wall system was used as the basis for the quantity take-off. Three different technical wall systems were analyzed with the same quantities in m2 (for these calculations, Neto quantities were used, excluding openings):
A three-layer prefabricated wall system (120/250/70-440) with a load-bearing structure in reinforced concrete, insulated with gray EPS, and an exterior finishing layer of reinforced concrete (thermal resistance of the wall system R = 7.65 m2·K/W);
A two-layer wall system with masonry bricks (250/300(40)-590) and a ventilated facade insulated with soft mineral wool and finished with stone mass tiles (thermal resistance of the wall system R = 7.21 m2·K/W);
A two-layer wall system with silicate bricks (250/250(10)-510) with ETIC system insulated with gray EPS (thermal resistance R = 7.83 m2·K/W).
Three different roof systems were analyzed with the same quantities in m2 (Neto):
A reinforced concrete slab (220 mm), insulated with mineral wool (400 mm) and bituminous roof covering (10 mm), total thickness 630 mm (thermal resistance of the roof system R = 10.67 m2·K/W);
A reinforced concrete slab (220 mm), insulated with EPS100 (370 mm), mineral wool (20 mm) and PVC (polyvinyl chloride) membrane (4 mm), total thickness 594 mm (thermal resistance R = 11.92 m2·K/W);
A green roof system made of reinforced concrete slab (220 mm), insulated with EPS100 (370 mm), mineral wool (20 mm), bituminous roof covering (10 mm), drainage layer (10 mm) and layer of soils (100 mm) partially covering the roof, total thickness 730 mm (thermal resistance R = 11.94 m2·K/W).
Two types of windows were considered:
The compatibility of the materials and technologies was evaluated across various element types, and it was concluded that all wall and roof options were compatible both with one another and with the load-bearing structures of the building. The window options were also compatible with the structural solutions for the exterior walls.
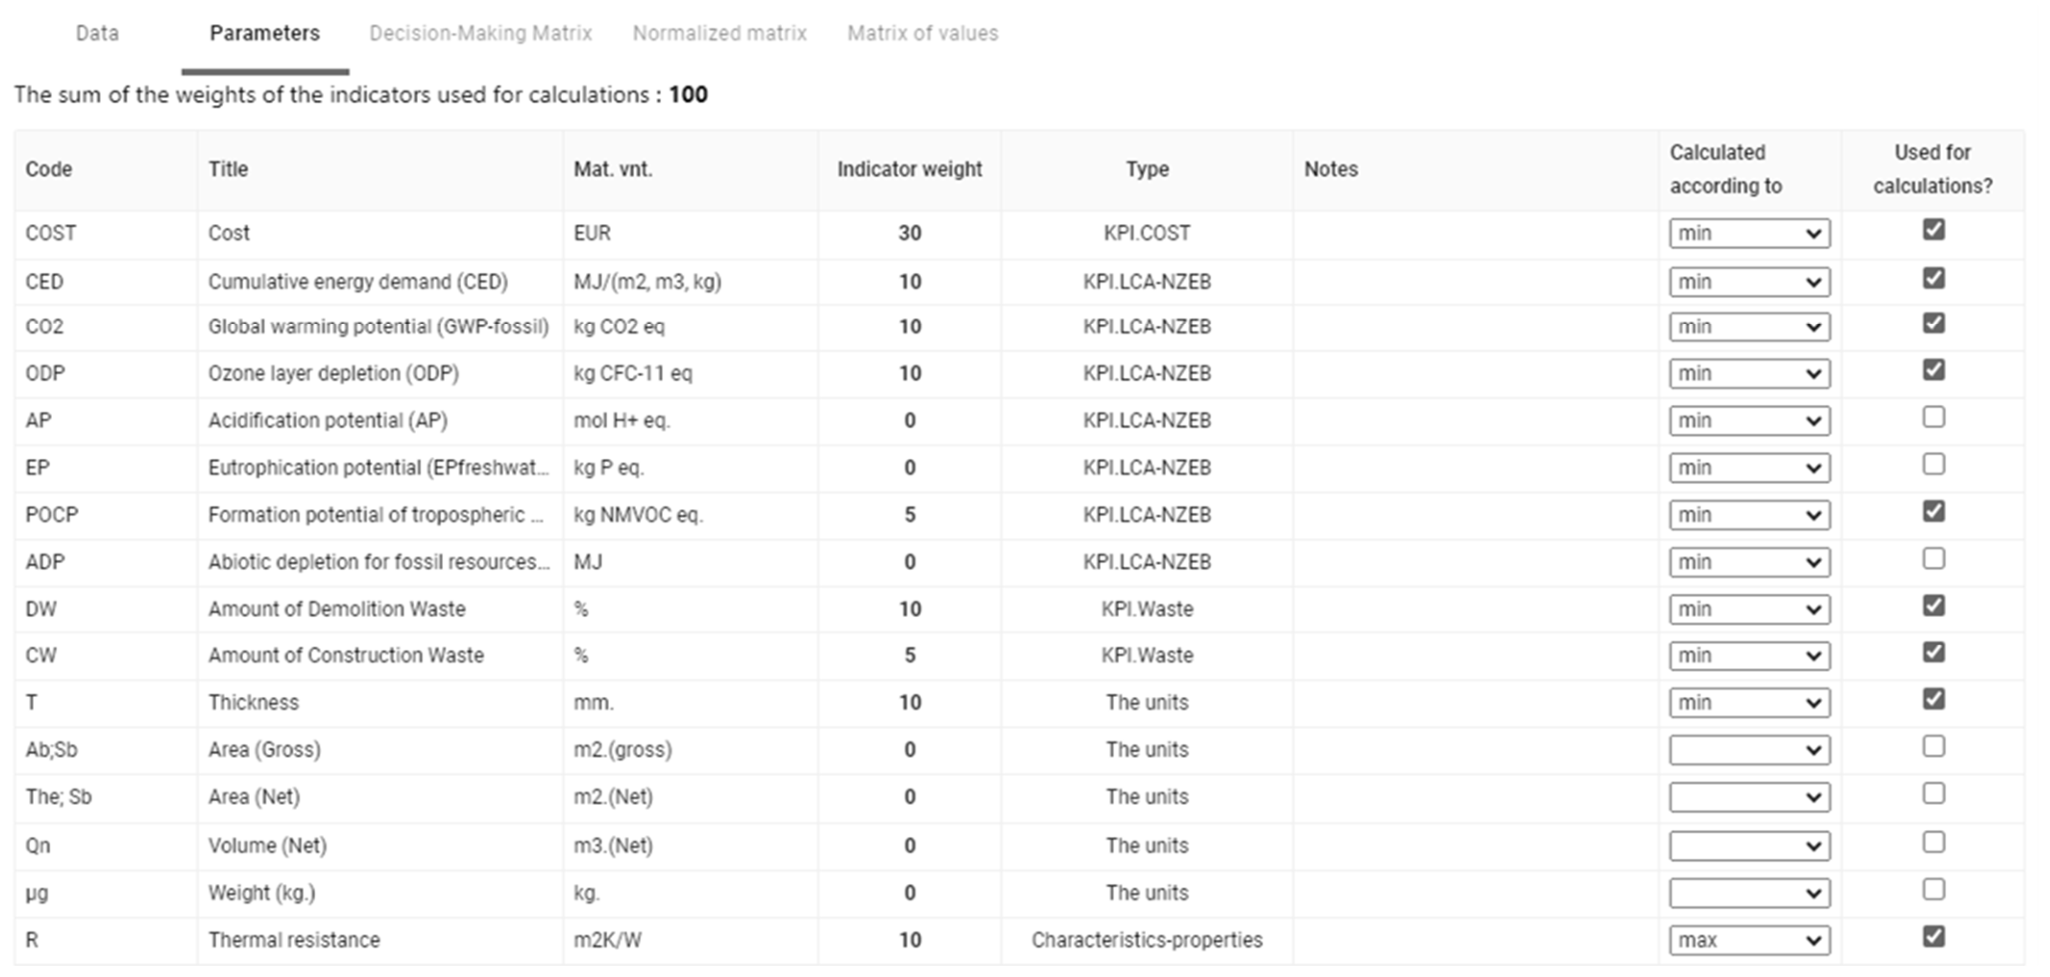
The indicators for the calculations were selected from the Parameters DB, the optimization direction (min/max) was specified, and the weights were adjusted (
Figure 14). The system provided predefined weights, but the decision maker adjusted them based on the objectives of the case study (
Figure 14). The costs of the BES alternatives for the case study building were calculated using the BIMGates.lt price calculation module.
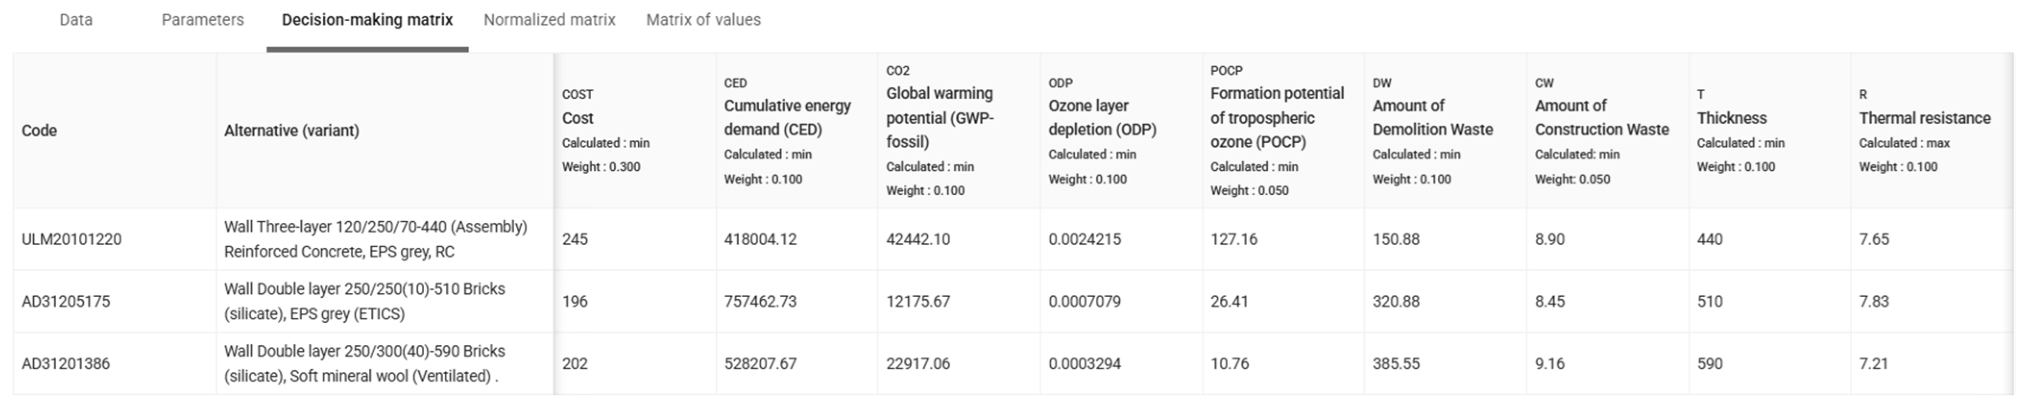
The system then automatically generated DMMs for comparison and decision making (
Figure 15).
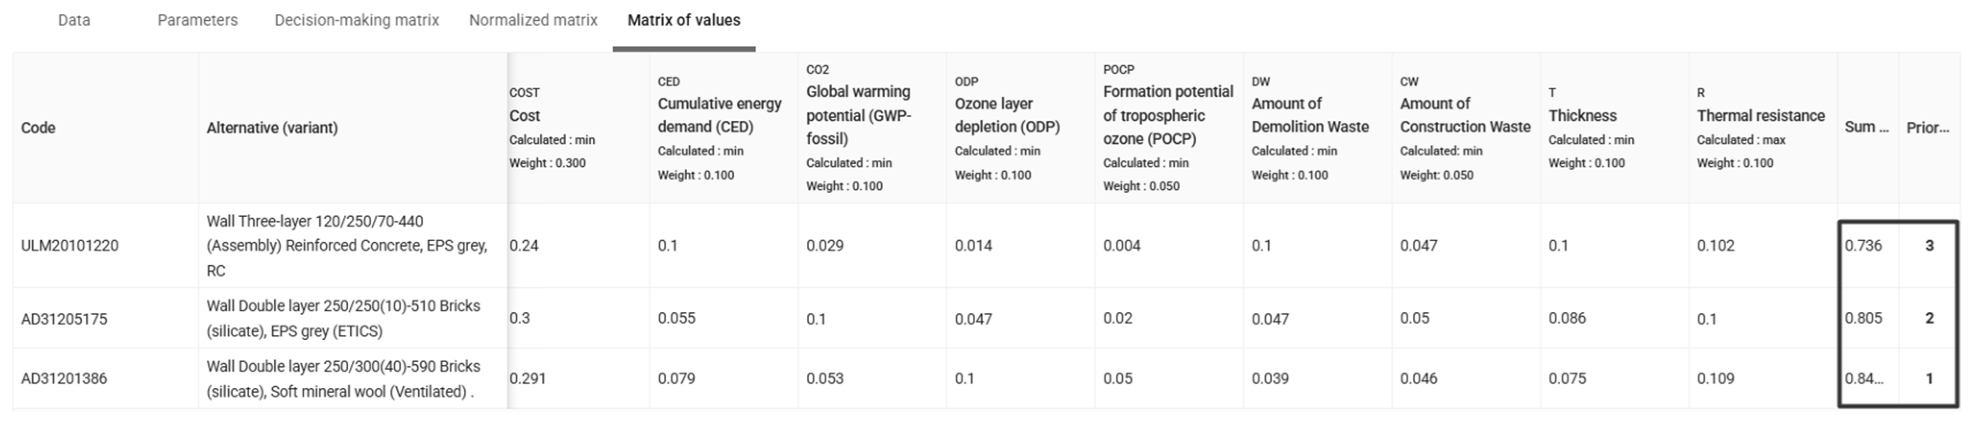
Next, BIM4NZEB-DS automatically transformed the initial indicator values into normalized criteria and presented them as a normalized DMM (
Figure 14). The MCDM results took the form of the sum
Sj of the weighted, normalized values and the order of priority for the alternatives in the last column in
Figure 14.
The rational alternatives were as follows: (i) a double-layer wall system (250/300(40)-590) made of silicate bricks, insulated with a soft mineral wool layer (
Figure 16); (ii) the first option for the roof system; and (iii) the second type of triple-glazed window with a timber frame. These results do not mean that the best alternative identified based on these calculations must necessarily be selected for the project, since when special conditions arise, such as construction in winter (when time and assembly issues become important), or where there is greater emphasis on waste recycling, reuse, and other issues, the decision may change.
4.3. Sensitivity Analysis of Assessment Results
A sensitivity analysis was conducted to assess whether the ranking of the evaluated alternatives was robust to changes in the importance of criteria and to the choice of MCDM method.
Five criteria-weighting scenarios were tested using four MCDM methods: SAW, ARAS, COPRAS, and TOPSIS. The robustness was assessed at two complementary levels: the ordinal rank stability was first examined to identify whether the priority order changed across scenarios, and the actual MCDM preference scores were then analyzed to determine whether changes in rank represented substantial changes in performance or only small numerical differences between closely competing alternatives.
Five weighting scenarios were constructed to represent alternative structures for the decision maker’s preferences (
Table 7). Scenario S1 was based on the initial expert-based weights, and served as the reference case. In scenario S2, equal importance was assigned to all nine criteria, meaning that the influence of the expert-defined preference structure was removed. In scenario S3, the weight of the cost criterion (R1) was increased to 0.40, while in scenario S4, the importance values for the waste-related criteria R6 and R7were increased to 0.15 each. In scenario S5, the weights of the environmental criteria R2–R5 were increased to 0.15 each, while the importance of R8 and R9 was reduced. In all scenarios, the weights were normalized to a total of 1.00.
A comparative table of calculation results using four MCDM methods: SAW, ARAS, COPRAS, and TOPSIS is presented in
Table 8.
To complement the rank comparison, a relative top-two preference margin was calculated for each method and scenario as ∆
rel = (P1 − P2)/P1 × 100%, where P1 and P2 are the preference scores of the first- and second-ranked alternatives, respectively (
Table 9). This measure captured the strength of the preference, and was not used to compare the absolute scale of the scores across different MCDM methods. A change in rankings accompanied by a very low ∆
rel indicator suggested that the results were nearly identical, rather than a substantive change in decision performance.
This sensitivity analysis revealed a highly consistent overall decision structure. Alternative A1 remained in third position in every method and every weighting scenario, and the only changes in rankings were related to variants A2 and A3. Across the 20 combinations of methods and weighting scenarios, A3 was ranked first in 15 cases (75%), whereas A2 was ranked first in five cases (25%). An analysis of the preference scores showed that several apparent rank changes occurred when A2 and A3 had nearly identical scores.
In the initial expert-based scenario S1, the alternatives were ranked in SAW, ARAS, and TOPSIS as A3 > A2 > A1, whereas COPRAS produced a ranking of A2 > A3 > A1. In SAW, A3 had an advantage of 2.34% over A2, whereas in ARAS, the advantage was 4.72%, and in TOPSIS, 2.90%. When COPRAS was used, the first two positions were reversed, but the relative difference was only 0.45% (0.3666 for A2 versus 0.3650 for A3). Thus, the results of the COPRAS study show that the calculated results were nearly identical, rather than indicating that there was strong evidence supporting Option A2.
Under conditions of equal weighting (S2), all four methods produced the same priority sequence, A3 > A2 > A1, although the strength of the agreement differed markedly. In SAW and ARAS, A3 was separated from A2 by 7.09% and 10.52%, respectively, while COPRAS and TOPSIS produced margins of only 0.65% and 0.42%. The overall numerical consistency of the results for S2 therefore hides the fundamental differences in the computational accuracy of these methods.
The cost-oriented scenario S3 produced the greatest ambiguity in the choice between A2 and A3. SAW and ARAS yielded a ranking of A3 > A2 > A1, with top-two margins of 1.30% and 3.52%, whereas in COPRAS and TOPSIS, the ranking was A2 > A3 > A1, with margins of 1.44% and 0.75%, respectively. These results indicate a certain degree of uncertainty in the solutions rather than a clear methodological contradiction.
In the waste-oriented scenario S4, A3 was again preferred in SAW and ARAS, with relatively clear margins of 5.52% and 8.76%. In COPRAS and TOPSIS, A2 was preferred, but the corresponding margins were 1.22% and 3.48%. Compared with S3, the divergence was therefore more pronounced: the compensatory aggregation used by SAW and ARAS provided stronger support for A3, whereas the distance-to-ideal structure of TOPSIS provided meaningful support for A2.
The environmental scenario S5 produced the strongest and most consistent evidence in favor of A3. All four methods yielded a ranking of A3 > A2 > A1, with substantial top-two margins: 13.12% for SAW, 16.52% for ARAS, 5.66% for COPRAS, and 5.04% for TOPSIS. S5 therefore represents the most robust scenario both in terms of inter-method agreement and numerical separation of the preferred alternative.
The highest stability was found for SAW and ARAS (
Table 10), as both methods generated a ranking of A3 > A2 > A1 in all five weighting scenarios. The average relative margins between the top two options were 5.87% and 8.81%, respectively, a significant numerical difference that confirmed the stability of these ranking positions. The largest average difference between the top two options was obtained with ARAS.
The greatest sensitivity was found for COPRAS, in which A2 was ranked first in S1, S3, and S4, but A3 first in S2 and S5. However, the average relative top-two margin was only 1.88%, and in four of the five scenarios, the difference between the two leading alternatives remained below 1.5%. The rank changes in COPRAS should therefore be interpreted primarily as changes in the ordering of nearly equivalent alternatives rather than as substantial instability in the underlying preference values.
Using the TOPSIS method, A3 was given priority in S1, S2, and S5, whereas A2 was given priority in S3 and S4. The average top-two margin was 2.52%. The smallest differences occurred in S2 (0.42%) and S3 (0.75%), indicating that the observed change between these scenarios was numerically weak. For S4, however, TOPSIS produced a clearer 3.48% advantage for A2, suggesting that the waste-oriented weighting structure changed the distance-to-ideal relationship between A2 and A3 more substantially.
Summing up, based on the presented sensitivity analysis, SAW was chosen for implementation in BIM4NZEB-DS as the most stable method. Additionally, among the evaluated MCDM methods, SAW has the simplest computational structure, requiring fewer steps for normalization, weighting, and determination of preference scores. This simplicity reduces implementation complexity in the developed system and may also contribute to lower computational resource usage.
4.4. Industry-Based Validation and User Feedback on the BIM4NZEB-DS Prototype
The BIM4NZEB-DS prototype was validated by representatives of Lithuanian companies involved in design, construction, cost estimation, BIM, and the manufacture and supply of BESs. The prototype was validated in a real web environment, where its functionalities were demonstrated using the building chosen for the case study in this research. During the demonstration sessions, semi-structured interviews were conducted with these representatives to collect their professional opinions, comments, and recommendations regarding the applicability, functionality, and further development of the proposed system.
Representatives from a total of 11 SME companies participated, from several segments of the AEC sector. Of these companies, 63.6% were involved in design activities, 54.5% in the manufacturing or supply of building materials and systems, 36.4% in construction or installation works, 18.2% in cost estimation, and 18.2% in BIM or other digital services (
Table 11). Since several companies operated across multiple areas, these categories were not mutually exclusive and the percentages do not sum to 100%.
Throughout the validation process, appropriate research ethics and data protection principles were followed. The anonymity of the respondents was preserved during participation and reporting, and no confidential, commercially sensitive, or otherwise identifiable company information was disclosed. The data collected through interviews were used only for research and validation of the system, and the results included only anonymized and aggregated professional feedback. Particular attention was paid to protecting potentially sensitive information and ensuring that the collection, processing, and reporting of participant feedback complied with applicable ethical and data-protection requirements.
Overall, the participants considered the system particularly relevant to the early stage of design, where alternative building elements and systems can be compared using multiple sustainability indicators rather than cost alone. The feedback also highlighted the importance of a consistent classification structure, interoperability with company-specific information structures, direct extraction of information from IFC models, and the involvement of different project stakeholders in the evaluation process. The respondents identified potential applications during procurement and later processes of design change management, where alternative technical solutions need to be assessed in terms of both economic and sustainability performance.
The prototype was refined based on this feedback, with the main improvements including extensions to the element classification parameters, additional information sources for assessment indicators, and harmonization of the parameter set used for comparing alternatives. In the initial implementation, environmental indicators of A1–A3 stages, commonly reported in EPDs were selected to ensure a consistent minimum data scope across alternatives.
5. Discussion
In this research, BIM4NZEB-DS was developed based on a data fusion model, data mapping algorithms, a data classification model, algorithms for calculating criteria weights, and MCDM algorithms. This approach enabled the digitalization of the complex decision-making process, which is difficult to automate in the early stage of design, by transforming human work into digital algorithms. This is the first step in the digital transformation of the multifaceted decision-making process at the early design stage and requires future developments, as discussed below.
The findings demonstrate the feasibility of using a BIM-based data fusion and decision-support approach to transform heterogeneous information of the early stage of design into structured inputs for multi-criteria assessment. Rather than merely connecting BIM data to an MCDM procedure, the proposed BIM4NZEB-DS approach addresses an important intermediate problem: ensuring that information from heterogeneous sources is semantically classified, mapped, and prepared for automated decision making. The case study therefore provides proof of concept that ontology-based classification, parameter-based identification, and data mapping can establish a structured information flow between BIM data and sustainability-oriented decision-support processes.
This finding is particularly relevant in the context of persistent interoperability problems reported for BIM-based sustainability assessment. Previous research has identified inconsistent LCA data sources, manual data collection and mapping, incompatibility between BIM applications and environmental databases, data loss, and inconsistent functional units as important barriers [
18]. Design teams typically use the native features of software applications [
15,
22,
25,
26,
27,
28,
29] presenting them as the highest possible level of efficiency. However, they fail to assess requirements and do not prepare or transfer the necessary data volume and structure, in the form of geometry and parameters provided via IFC formats, to other processes (BIM use cases, such as 4D, 5D, and LCA). As a result, designers address their own needs but fail to fully ensure interoperability and automation needs in accordance with openBIM principles.
The results of the present study suggest that interoperability should not be understood only as successful file exchange. Effective decision support also requires semantic interoperability, whereby data transferred between systems retain sufficiently consistent meaning and structure to be automatically interpreted and reused. From this perspective, the ontology-, semantics-, and mapping-based approach developed in BIM4NZEB-DS contributes to bridging the gap between geometric BIM representations and the information requirements of sustainability assessment and MCDM. The proposed parameterized mapping approach introduces an intermediate semantic layer between BIM objects and decision criteria. The case study indicates that such an approach can reduce manual intervention in preparing BIM-derived information for decision analysis and can improve the traceability of data from building elements to evaluated design alternatives.
The applicability of the system to the early stage of design was validated through the demonstration of its functionalities in the case study. It was shown that the proposed approach is feasible and can be used for decision making at this stage. The case study also provided a comprehensive illustration of the use of the proposed approach in a real-world situation, including how data are prepared for a decision and how decisions are made in the early stage of design. This allowed us to effectively evaluate the approach in real-world conditions and gain insights for developing future research at a larger scale.
The application of the system to a real case study revealed that importing IFC-formatted data and mapping it took five minutes. MCDM calculation for a single selected building envelope element (e.g., walls) took ten minutes (including criteria selection and weight assignment). The processing times observed in the case study provide an initial indication that automated mapping and MCDM assessment can be performed within a practical workflow. However, these results should not yet be interpreted as evidence of superior efficiency, since no controlled comparison with alternative BIM-LCA-MCDM workflows was conducted. Future benchmarking should therefore compare BIM4NZEB-DS with conventional manual procedures and existing digital tools using measurable indicators such as data-preparation time, number of manual operations, mapping errors, computational time, and decision consistency.
Another implication concerns the scope of the proposed system’s applicability. The ontology-, parameter-, and mapping-based principles were designed so that the decision-support workflow is not inherently dependent on a specific building typology. Nevertheless, the present study validated the system using only one case study. Further validation should therefore include multiple residential and non-residential buildings across different scales and levels of BIM complexity.
The proposed BIM4NZEB-DS framework is intended to support decision making during the conceptual design stage, where the selection of envelope solutions precedes the detailed design of building service systems and operational strategies. Environmental assessment focuses on the embodied environmental impacts of building envelope components (life cycle stages A1–A3), enabling a consistent comparison of alternative design solutions based on the information available at this stage. The assessment of operational energy use (module B6) and active building systems would require assumptions regarding HVAC systems, energy supply, occupancy patterns, and building operation, as information is generally unavailable or highly uncertain during the early stages of design. Therefore, the resulting rankings should not be interpreted as representing the complete building life-cycle performance. The practical application of BIM4NZEB-DS relies on an organization’s BIM maturity, staff skills, existing workflows, and willingness to adopt digital decision-support practices. Its effectiveness is also influenced by the availability, completeness, consistency, and reliability of data from BIM models and heterogeneous external sources. Automated classification and mapping require sufficiently structured and semantically consistent BIM information, whereas incomplete parameters and inconsistent modeling practices may increase manual effort. Wider adoption, therefore, requires clear responsibilities for data preparation and validation, appropriate user training, and further testing across organizations with varying BIM maturity levels, software environments, and data availability.
This study, like all others, has certain limitations. The proposed BIM4NZEB-DS system is intended as an early-stage decision-support tool rather than a complete methodology for the life cycle assessment of a whole building. Assessment was therefore intentionally limited to passive energy-efficiency measures related to building envelopes, including wall, roof, and window systems, while active engineering systems and their interaction with passive measures fell outside the scope of this research. Likewise, the environmental assessment was restricted to the cradle-to-gate life-cycle stages (A1–A3), representing the embodied environmental impacts of envelope components (as considered in [
55]). Although operational energy use and building service systems may substantially influence the environmental performance over the life cycle, these aspects cannot be robustly assessed during the conceptual design stage, as key design parameters remain undefined. In future research, the system should be extended by integrating building energy simulation, active systems, and full life cycle assessment once sufficient design information becomes available. In this study, the compatibility of materials and technologies was evaluated by experts, as rule-based automation was insufficient for this complex task, whereas in future, AI-based compatibility assessment models should be developed. BIM4NZEB-DS also currently uses a single MCDM method, although other methods may be incorporated based on the preferences of the decision maker.
Compared with existing BIM-LCA tools, the proposed system emphasizes decision support during conceptual design rather than detailed LCA. By combining BIM, LCA data, ontology-based mapping and MCDM, the system enables consistent comparisons of design alternatives using the information typically available in the early stages of the design process.
To promote digital transformation in design management and architectural engineering, there is a need for free-access digital datasets that are designed to track and manage the life cycles of building elements, such as Digital Product Passports [
65] or Material Passports [
66]. These datasets would provide reliable, readily available information on products for sustainability assessment and the possibility of integration with similar systems, as described in this study.




 ,
,