Article

Natural Gas Price Elasticity and Urban Residential Natural Gas Consumption: Evidence from Provincial Data in China

1
School of Civil and Hydraulic Engineering, Chongqing University of Science and Technology, Chongqing 401331, China
2
School of Management, Chongqing University of Science and Technology, Chongqing 401331, China
3
Chongqing Gangli Environmental Protection Co., Ltd., Chongqing 401331, China
*
Author to whom correspondence should be addressed.
Buildings 2026, 16(18), 3568; https://doi.org/10.3390/buildings16183568
Submission received: 8 July 2026 / Revised: 31 August 2026 / Accepted: 1 September 2026 / Published: 8 September 2026

Abstract

Natural gas consumption in urban residential buildings is important for household energy affordability and the low-carbon transition of the residential sector. Using panel data from 30 Chinese provinces from 2005 to 2020, this study employs a panel regression model to examine the impact of residential natural gas prices (NPs) on per capita natural gas consumption (NGC) in urban residential buildings. We apply the model to estimate price elasticity and analyze the transmission mechanism of energy consumption intensity (EI), while examining the differentiated characteristics of price effects from both regional and urbanization-stage perspectives. The main findings are as follows: (1) NP shows a significantly negative association with residential NGC, with a price elasticity of −1.182; (2) EI serves as a potential transmission channel between NP and NGC, with its indirect effect offsetting 12.5%; (3) heterogeneity analysis shows that price elasticity is statistically significant only in the western region. Across urbanization quartiles, the absolute magnitude of price elasticity is greatest in Q2. This study provides empirical evidence to optimize tiered natural gas pricing, refine targeted subsidy policies, and inform energy utilization policies in urban residential areas.

1. Introduction

Natural gas is important for the energy transition in the residential sector [1,2]. As a transition fuel that produces fewer emissions than many other fossil fuels, it has been widely recognized as an important means of reducing carbon emissions [3,4]. It is also a major energy source for urban residents, particularly for cooking, hot water, and heating [5,6]. In China, the government has introduced a series of measures to promote the development and wider use of natural gas. In 2020, China’s natural gas consumption reached 328 billion cubic meters, of which urban consumption accounted for 38% [7]. It is therefore necessary to examine how residential natural gas use can be managed more effectively to control the growth of household energy demand, reduce carbon emissions, and promote the sustainability of residential energy systems.
Changes in NPs alter the cost to residents of accessing essential services such as cooking, hot water, and heating [8,9]. These changes may subsequently affect the frequency and intensity of natural gas use, as well as household energy choices. Existing studies have provided extensive empirical evidence on the price elasticity of natural gas demand at the household level. Favero and Grossi [10], based on monthly billing data from 51,177 end users in Italy, found that residential users respond more strongly to changes in natural gas prices than non-residential users. Still, overall natural gas demand remains relatively inelastic. In China, Yu et al. [11] were among the first to examine variations in natural gas demand at the city level. Based on data from the China Household Energy Consumption Survey, Zeng et al. [12] found that household natural gas demand responds significantly to price changes, with an overall price elasticity of −0.898. Li et al. [13] further analyzed changes in urban natural gas demand in China from the perspectives of NP and income elasticity, demonstrating that real NP and income levels are important factors in explaining differences in urban natural gas demand. These studies indicate that NP affects not only NGC but also household energy choices and the effectiveness of residential energy policies.
NGC is not merely the result of changes in price and income. Yan [14], using data from the China Household Panel Survey, found that fuel prices, household characteristics, population mobility, and the expansion of infrastructure such as natural gas pipeline networks collectively influence households’ choice of clean fuels. The study concluded that urbanization and infrastructure improvements can increase the likelihood of households adopting clean fuels. A study by Wang et al. [15] on China’s low-carbon city pilot policies indicates that low-carbon city development can promote a low-carbon transition in urban household energy consumption by increasing the availability of clean energy and improving clean energy infrastructure, thereby further reducing household coal consumption and increasing NGC. Residential energy consumption is also closely linked to demographic structure and living conditions. Xu et al. [16] found that a number of factors have a significant impact on carbon emissions from residential buildings, including household size, population size, urbanization, population aging, and educational attainment. Li et al. used bimonthly gas consumption data from residents in Hefei and found that climate has a suppressing effect on gas consumption; when the annual temperature rises by 1 °C, gas consumption decreases by 2.08% [17].
In short, understanding the factors that influence residential gas consumption is important for implementing specific policies and reducing energy intensity [18,19,20]. Previous studies have extensively examined the price elasticity of natural gas demand and regional differences in China; however, several research gaps remain: First, most studies use total NGC and nominal prices; these measures are affected by population growth and changes in the general price level, making it difficult to accurately identify how natural gas demand in urban residential buildings responds to changes in real NP. Further evidence based on CPI-adjusted residential natural gas prices and per capita consumption is needed. Second, existing research has primarily provided preliminary evidence that NP affects NGC but has not identified the underlying mechanisms of this effect [13]. Third, while regional heterogeneity has been widely discussed, further investigation is needed to determine whether the effectiveness of residential natural gas pricing policies varies across different stages of urbanization.
To address these shortcomings, this paper uses panel data from 30 Chinese provinces covering the period 2005–2020 to examine the impact of NP on NGC among urban residents. Further, it investigates the transmission mechanism of EI as well as the heterogeneity across regions and urbanization stages. The contributions of this paper are summarized below: (1) Focusing on per capita residential natural gas consumption in urban areas, we use real natural gas prices adjusted for the CPI to provide a more accurate assessment of household price responses. (2) Second, beyond estimating the direct price effect, EI is incorporated into the mediation analysis to explore the potential transmission mechanism through which NP affects NGC, providing new insights into the interaction between price signals and energy intensity changes in residential energy use. (3) This study extends existing heterogeneity analysis by examining differences not only across geographic regions but also across urbanization stages, providing theoretical and empirical support for the formulation of differentiated energy consumption policies for households.
The paper is structured as follows: Section 2 presents the theoretical framework and hypotheses; Section 3 describes the methodology and data; Section 4 reports the empirical results; Section 5 discusses the findings; and Section 6 concludes the study with policy recommendations.

2. Theoretical Framework and Research Hypothesis

2.1. The Direct Impact of NP on NGC by Urban Residents

According to the household production theory [21,22], households do not derive utility directly from natural gas itself but, rather, by combining natural gas, time, and other household inputs to obtain household services such as cooking, hot water, and heating. Changes in NP will affect the cost to residents of accessing these essential services and, in turn, influence their gas consumption patterns. Previous studies have shown that an increase in NP in China tends to be negatively associated with NGC [12,13]. China’s tiered natural gas pricing system affects residential natural gas consumption and may also be related to household affordability and the use of other energy sources [23]. An increase in NP will raise the energy costs residents must pay to access the same level of living services. Residents may respond to these cost changes by reducing non-essential gas use, decreasing the frequency of gas use, adjusting heating levels, or improving gas efficiency, thereby reducing NGC. Based on this, this paper proposes the following hypothesis:
H1. 
NP will contribute to the reduction in urban residential NGC.

2.2. The Indirect Impact of NP on NGC by Urban Residents

EI measures energy consumed per unit of economic output. As a macro-level aggregate indicator, it reflects regional energy-use intensity and is a key determinant of natural gas consumption [24]. Energy intensity, technological advances, and other potential trends in energy demand may also influence changes in NGC [25]. Technological advances help reduce the energy input required for energy services, thereby reducing natural gas consumption. Changes in industrial structure and the energy mix will alter how natural gas is used. Actual natural gas price fluctuations not only directly affect residential natural gas consumption but may also influence residential natural gas demand by altering regional energy intensity. Energy price signals are associated with changes in regional energy intensity, although the magnitude and direction of this relationship may vary across energy types and periods [26]. Rising energy prices help reduce energy intensity, while industrialization may increase it [27]. Urbanization drives the expansion of infrastructure and population growth, and may reshape energy-use patterns, indicating that urbanization has a significant impact on energy intensity [28].
The response of EI to price signals may also vary across different regions and at different stages of urbanization. Furthermore, regional EI may be associated with broader technological and energy-system changes at the macro level that influence the amount and structure of natural gas used by urban households. This association should be interpreted with caution, as EI is an aggregate indicator and does not directly reflect micro-level improvements in household energy efficiency. Additionally, adjustments in EI are often accompanied by changes in housing conditions, pipeline infrastructure, and the regional energy mix, which, in turn, affect the convenience of natural gas use for residents. NP may affect urban residential NGC through two distinct channels. Higher NP directly increases the monetary cost of residential natural gas use and therefore tends to suppress demand. At the same time, NP may be associated with changes in regional EI; in turn, it may affect the cost of access to energy services for households and the structure of energy use. This paper proposes the following hypothesis:
H2. 
EI is the mediating variable between NP and NGC.
Based on the above analysis, this paper constructs a theoretical analytical framework based on NP, EI, and NGC among urban residents. An increase in NP raises the cost of residential energy consumption, thereby directly affecting urban residential NGC. Concurrently, changes in NP may indirectly affect NGC through regional EI. This framework provides a basis for examining how price signals and changes in energy intensity jointly shape residential energy sustainability.

3. Methodology and Data

3.1. Natural Gas Price

The natural gas price variable (NP) is obtained from the National Development and Reform Commission (NDRC) [29]. To eliminate the influence of inflation and ensure price comparability across different years, the nominal natural gas price is deflated using the consumer price index (CPI), with 2005 as the base year. The real natural gas price is calculated as follows:
N P i , t = P i , t n o m × C P I 2005 C P I i , t
where N P i , t represents the real natural gas price, P i , t n o m denotes the nominal natural gas price obtained from NDRC, and C P I i , t represents the consumer price index of province i in year t .

3.2. Model Construction

To investigate how NP affects NGC among urban residents, the following benchmark regression model is specified:
l n N G C i , t = α + β l n N P i , t + γ X i , t + μ i + λ t + ε i , t
where i denotes the province, and t denotes the year; X i , t is the vector of control variables; μ i   represents province fixed effects, controlling for time-invariant provincial characteristics; λ t represents the year-specific fixed effects, used to control for common time shocks at the national level, macroeconomic fluctuations, and changes in energy policy; ε i , t is the random error term. β is the estimated coefficient of primary interest in this paper, used to measure the direction and magnitude of elasticity of the impact of changes in NP on NGC among urban residents. Standard errors are clustered at the provincial level in all estimations to account for within-province dependence. The reported p-values are based on a t-distribution with degrees of freedom equal to the number of provincial clusters minus one.
To further analyze the channels through which NPs affect residential NGC, we construct the following mediation model:
l n N G C i , t = a 1 + c l n N P i , t + γ 1 X i , t + μ i + λ t + ε 1 , i , t
l n E I i , t = a 2 + a l n N P i , t + γ 2 X i , t + μ i + λ t + ε 2 , i , t
l n N G C i , t = a 3 + c l n N P i , t + b l n E I i , t + γ 3 X i , t + μ i + λ t + ε 3 , i , t
where c represents the total effect of NP on NGC; a represents the effect of NP on EI; b represents the effect of EI on NGC among urban residents; and c′ represents the direct effect after controlling for the mediating variable. This paper employs the Sobel test to verify the significance of the indirect effect a × b.

3.3. Data Sources

The data sources and variable descriptions are shown in Table 1. This paper selects 30 provincial-level administrative regions in China from 2005 to 2020 as the research sample (excluding Tibet, Hong Kong, Macao, and Taiwan) to construct a panel data set. It uses per capita natural gas consumption in urban residential buildings as the NGC and the CPI-adjusted first-tier price for residential natural gas as the NP. The NP for Chinese households has long been regulated by the National Development and Reform Commission and the Provincial Development and Reform Commissions; policy controls strongly influence price formation and are not entirely determined by short-term market supply and demand. Therefore, the likelihood that changes in NGC among urban residents will have a reverse effect on residential NP is relatively limited, which to some extent alleviates the endogeneity issues caused by reverse causality [5,13]. Control variables include factors such as income levels, demographic structure, housing conditions, climate-related demand, and industrial structure; energy consumption intensity (EI) is introduced as the mediating variable, reflecting the amount of energy consumption required per unit of economic output at the regional level. It is important to note that EI is a macro-level aggregate indicator and is not a direct measure of energy efficiency at the household or appliance level.
HDD is used as a control variable to account for climate-related demand. The daily average temperature data used to calculate HDD are obtained from the China Meteorological Administration (CMA) [30]. It is calculated as follows:
H D D = i = 1 m T b T i T b > T i
where m denotes the number of days in a year, T i   represents the average daily temperature on day i , and T b denotes the base temperature. In this study, 18   C is adopted as the base temperature.
Table 1. Explanation of variables.
VariablesVariable NameSource of Data
NGCUrban residential per capita natural gas consumptionChina Statistical Yearbook (CSY) [31]
NPNatural gas price adjusted by CPICalculated by Equation (1)
PCDIPer capita disposable income of urban residentsCSY
AGEPercentage of seniorsChina Population and Employment Statistics
Yearbook
PFAPer capita residential floor areaCSY
HDDHeating degree daysCMA
TISShare of tertiary industry in GDPCSY
EIEnergy consumption intensityChina Energy Statistical Yearbook [32]
UGCUrban gas consumption scaleCSY
UUrbanization level in ChinaCSY

4. Results

4.1. Distribution of NGC and NP

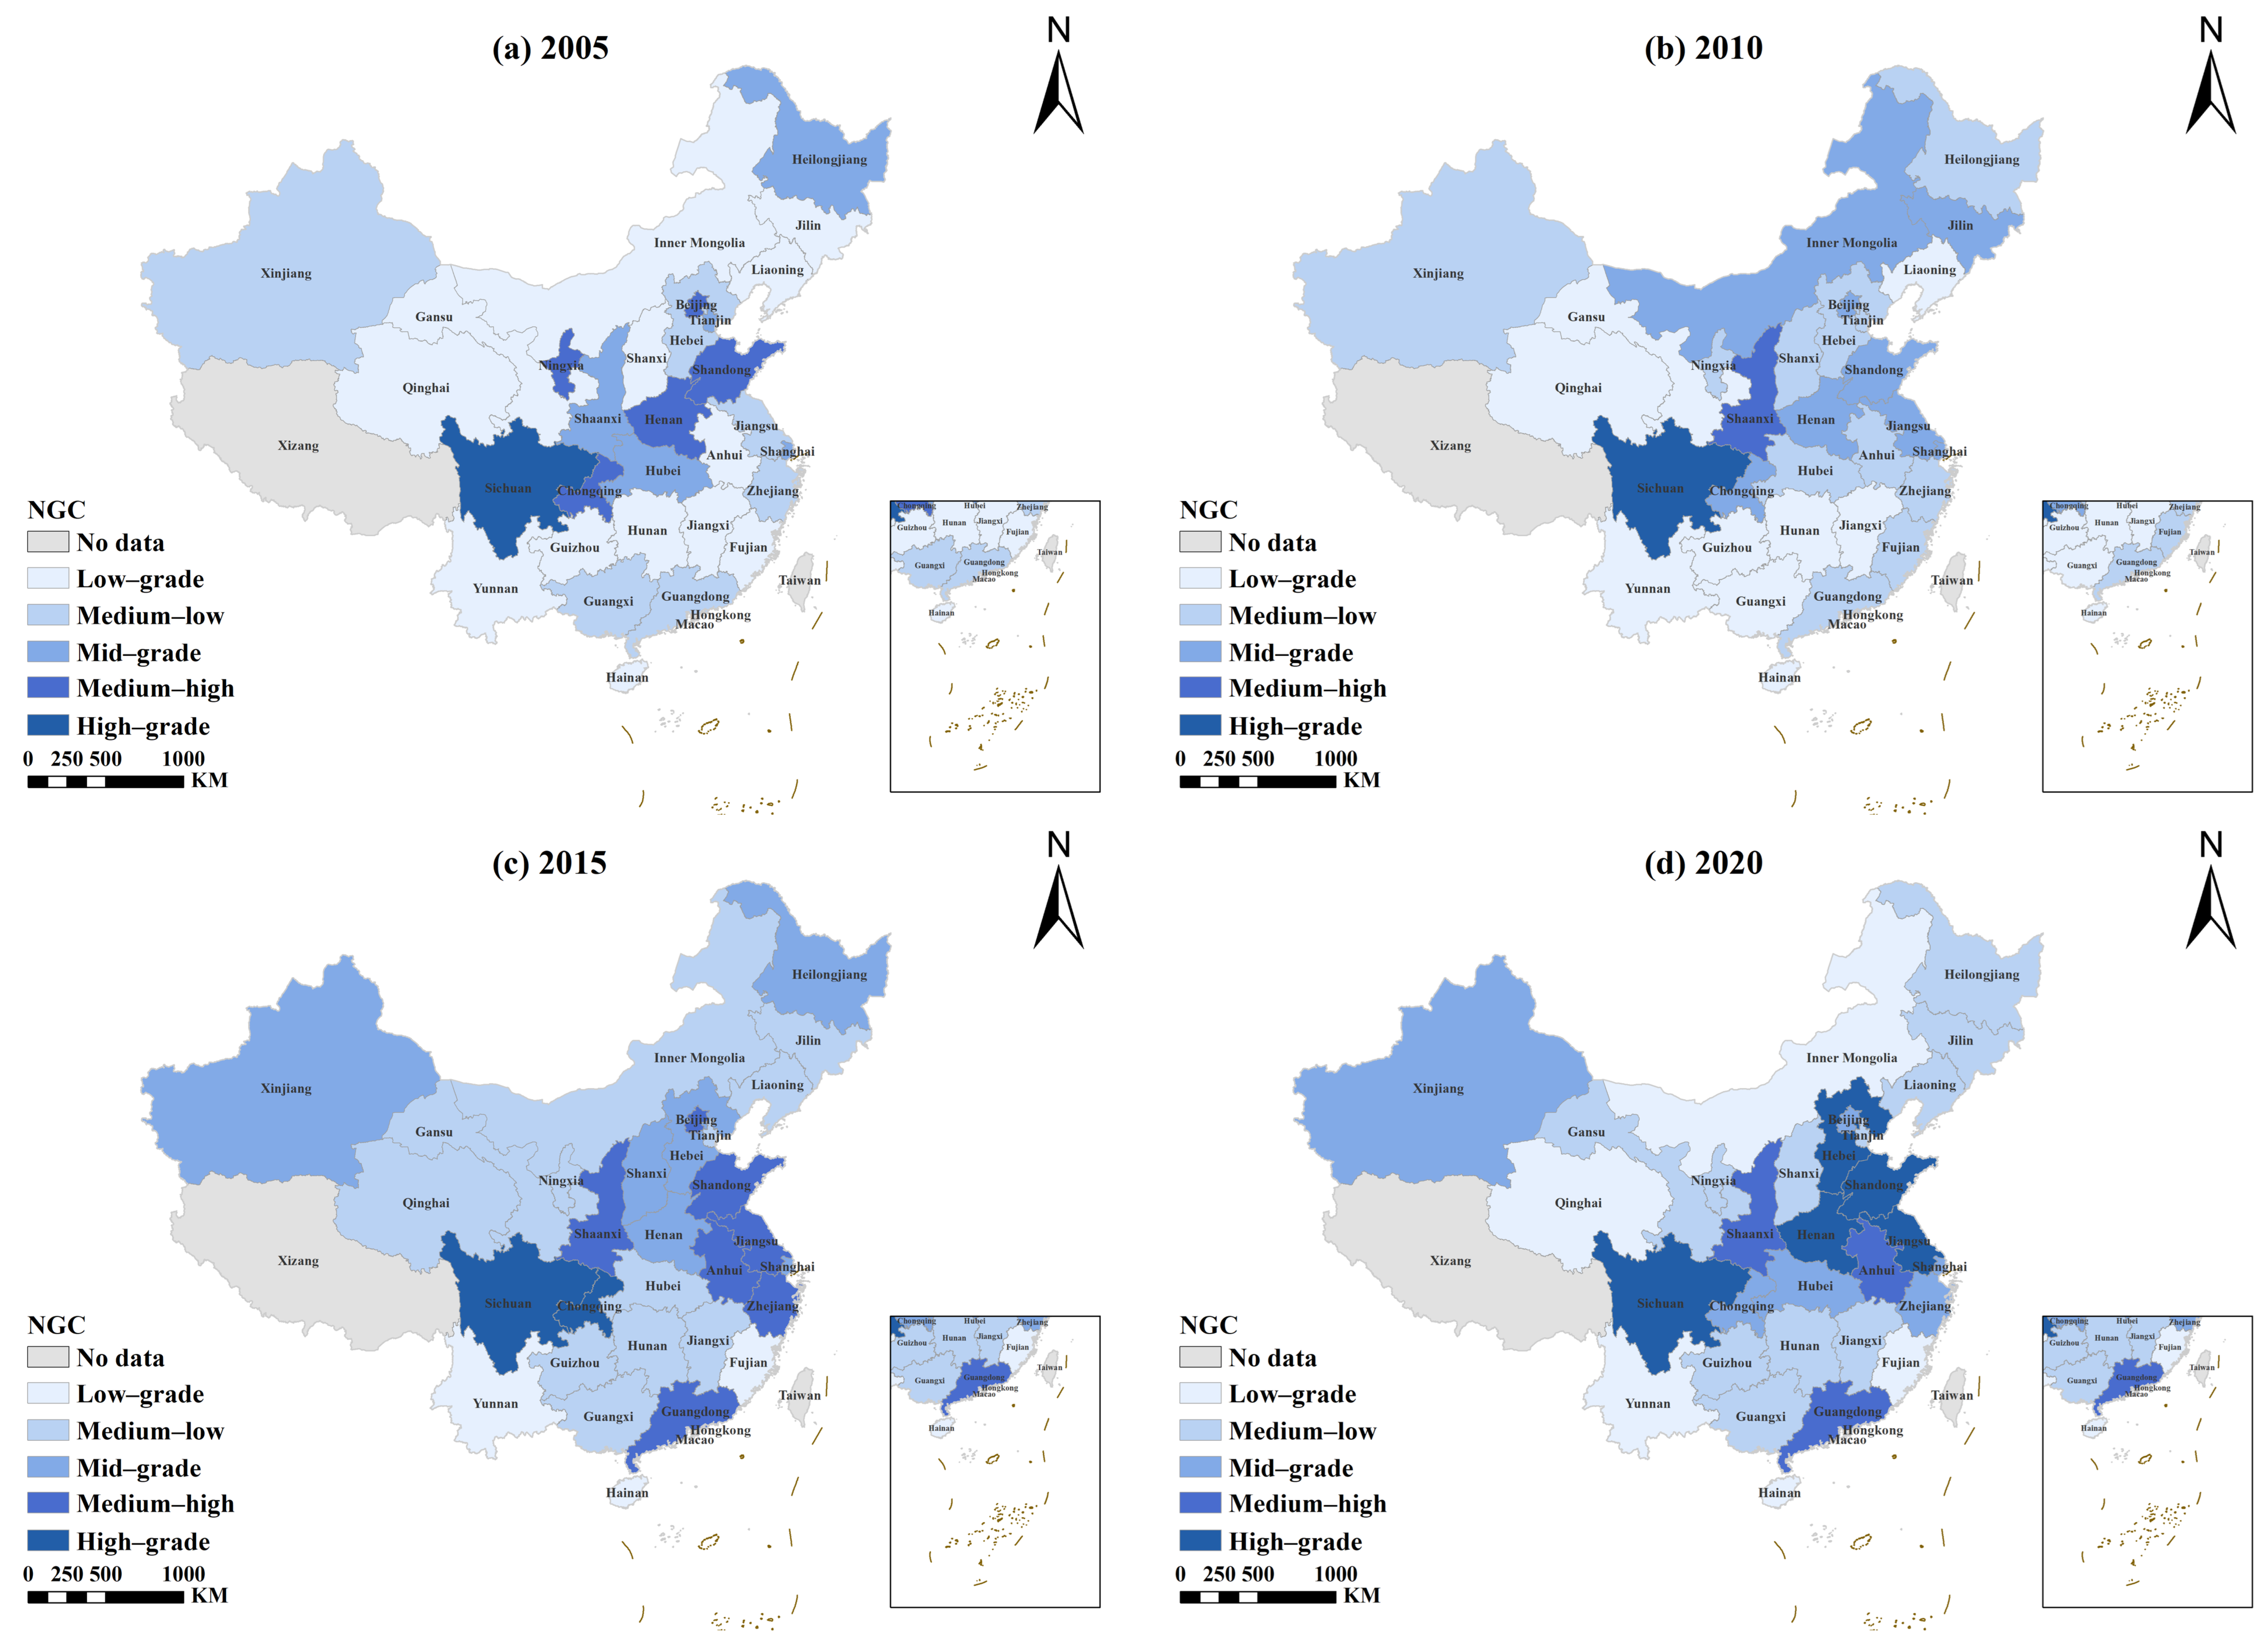
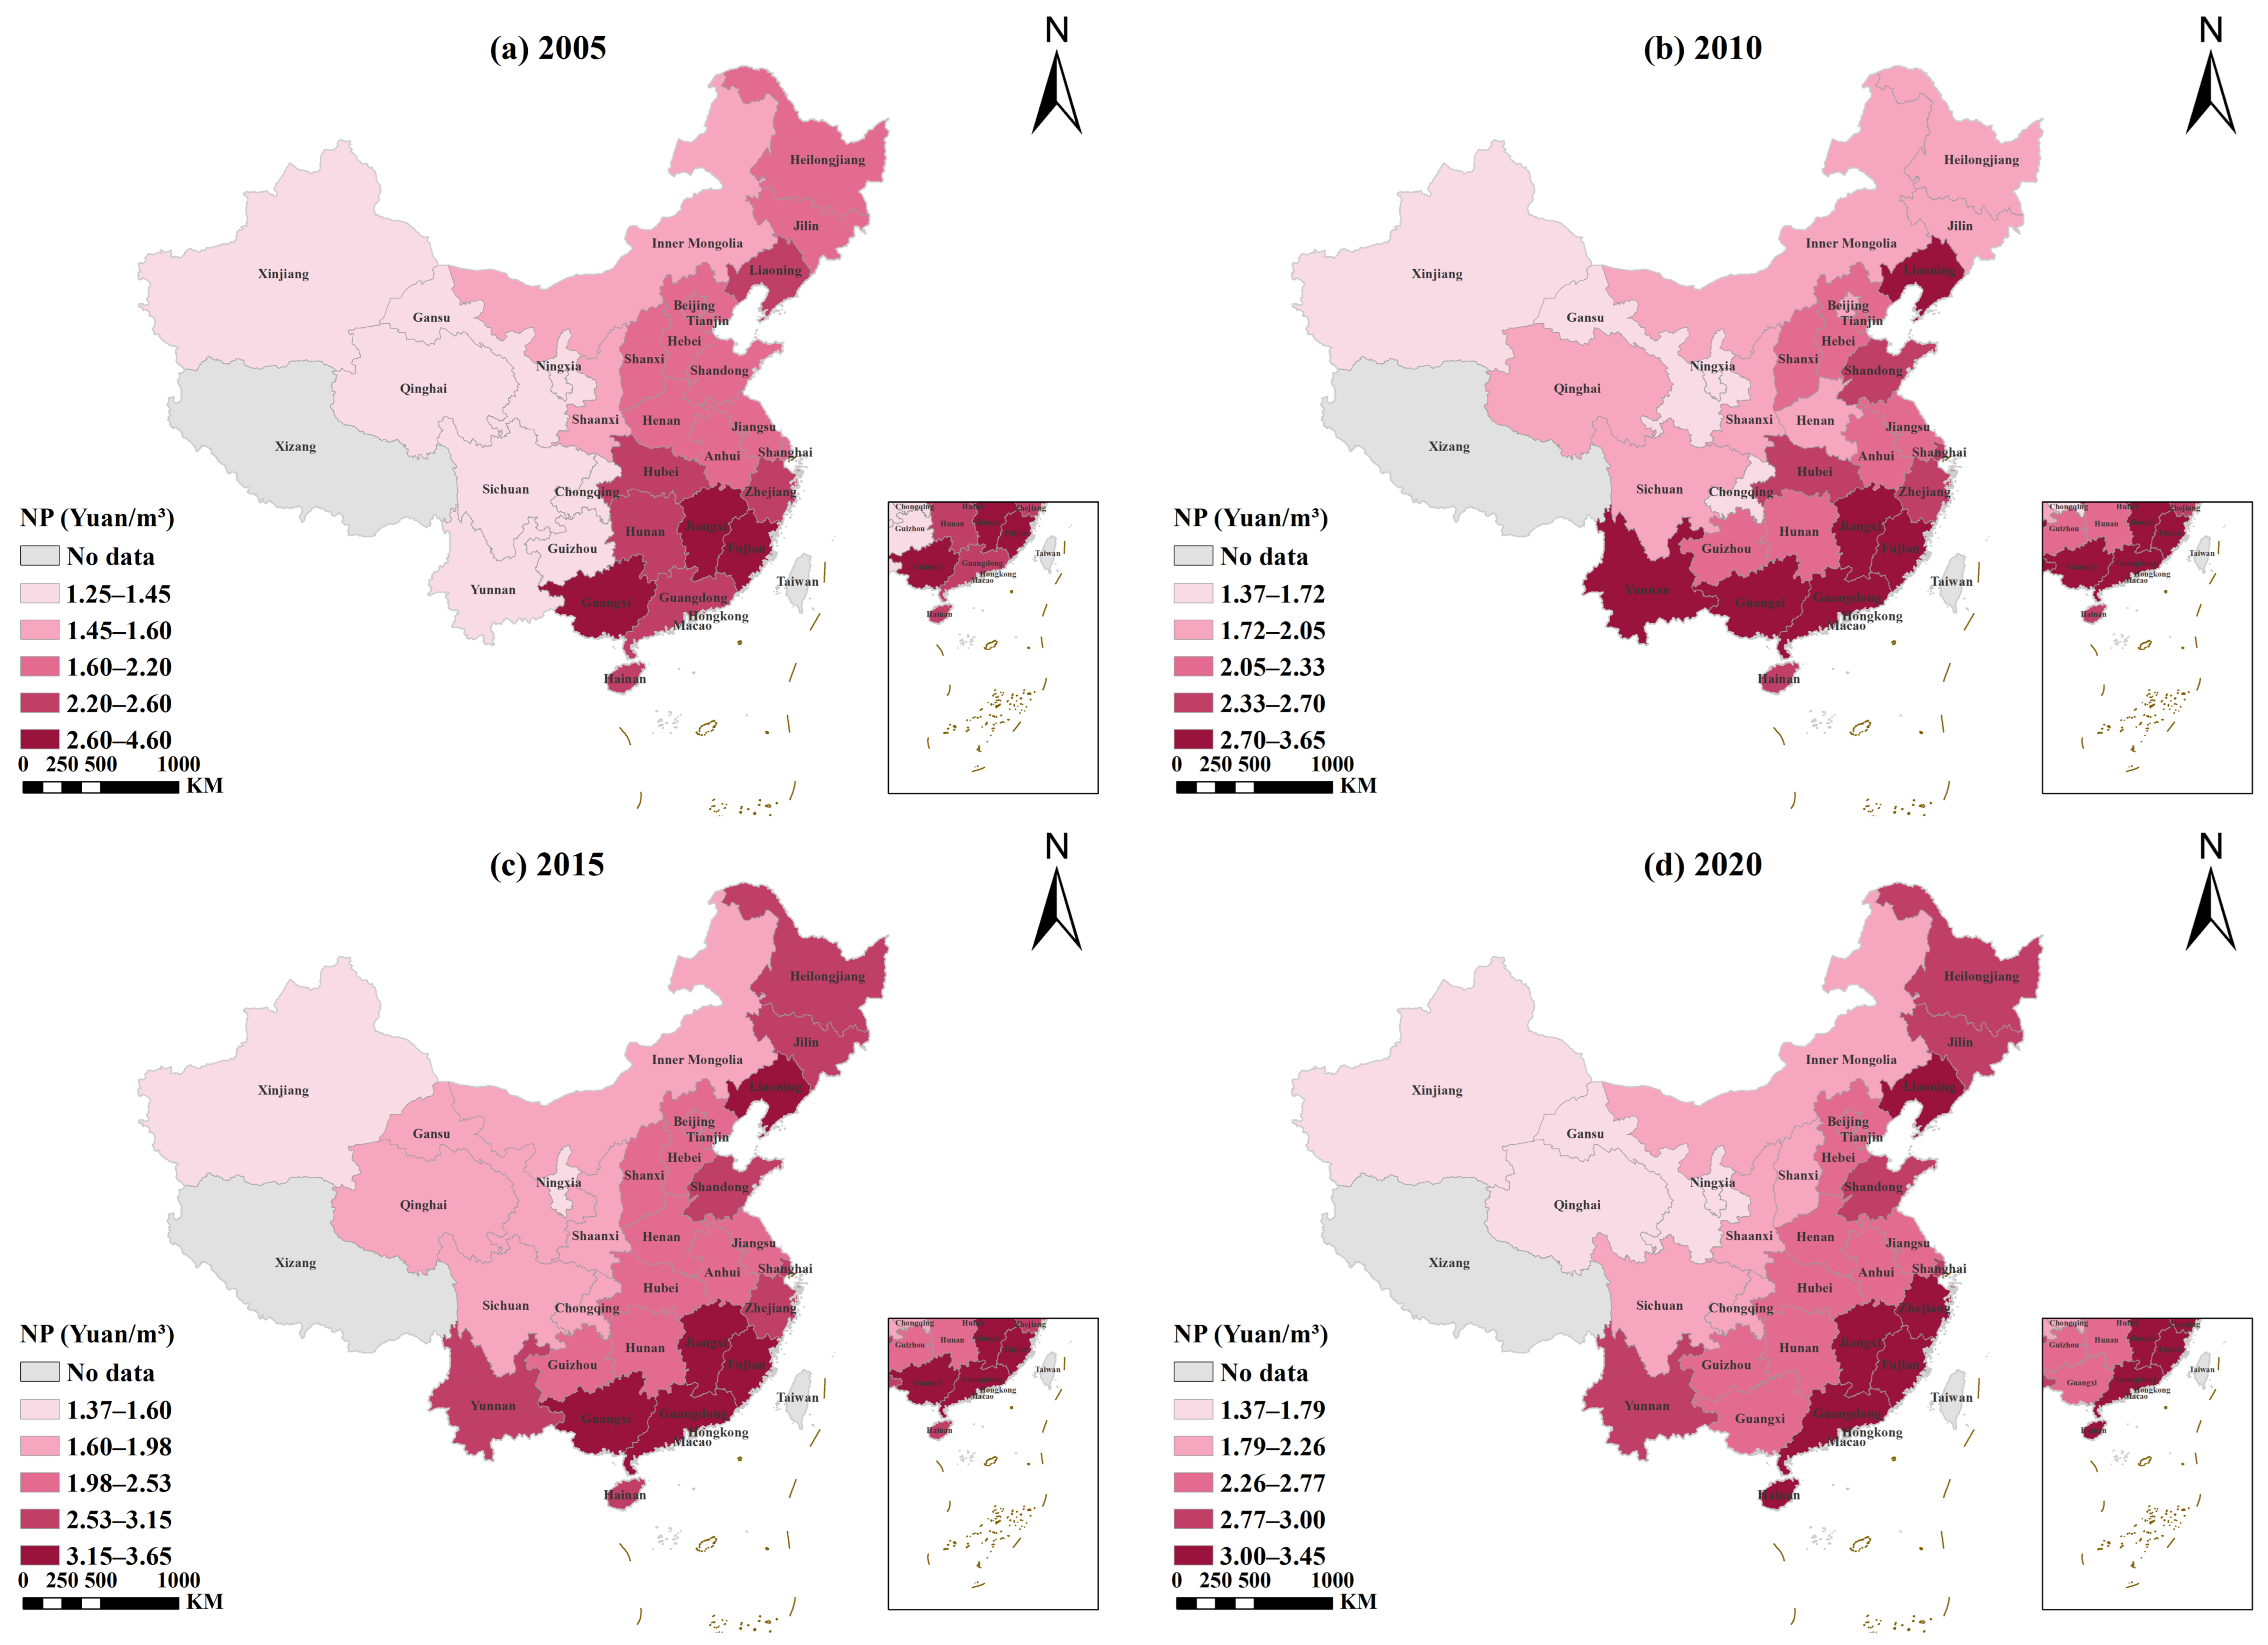
To illustrate the interprovincial differences in urban residents’ NGC and NP, this paper examines data from four years (2005, 2010, 2015, and 2020). The results are shown in Figure 1 and Figure 2.
Figure 1 shows the spatial distribution of NGC. From 2005 to 2020, China’s NGC exhibited significant regional variations. NGC levels in the Eastern region are generally high and show a sustained upward trend; in the Central region, the levels are gradually increasing, with some provinces transitioning from low-to-medium to medium-to-high levels; the Western region exhibits significant internal variations, with provinces such as Sichuan and Chongqing having relatively high levels, while some provinces in the northwest have relatively low levels. By 2020, regions with medium-to-high and high consumption levels had expanded further, and urban NGC exhibited a pattern of regional diffusion.
Figure 2 illustrates the spatial distribution of residential NP. Compared to NGC, regional differences in NP are more pronounced. Prices are relatively high in the Eastern region and some southern provinces, moderate in the Central region, and vary significantly within the Western region, with prices relatively low in some northwestern provinces and relatively high in some southwestern provinces. Overall, residential NP shows a certain upward trend.

4.2. Results of Empirical Regression Analysis

Before performing benchmark regression, this paper first conducts a correlation analysis of the main variables. The correlation results in Table 2 show that the correlation coefficient between NP and NGC is −0.527, which is significant at the 1% level, indicating a significant negative correlation between them. The correlation coefficients among most explanatory variables fall within a reasonable range and do not show any obvious high correlations.
This paper then conducts a variance inflation factor (VIF) test. As shown in Table 3, the maximum VIF value for the explanatory variables is 3.41, and the average VIF is 2.07, indicating that the model does not suffer from severe multicollinearity and exhibits good statistical stability.
Table 4 reports the results of the benchmark regression analysis. Column (1) presents a mixed OLS regression including only the core explanatory variables; Column (2) adds control variables; and Column (3) presents a random effects model. The Hausman test is significant at the 1% level, suggesting that the fixed effects model is preferred over the random effects specification. Considering potential unobserved provincial heterogeneity and common time shocks, the benchmark model adopts a two-way fixed effects specification including both province and year fixed effects. The estimation results are presented in Column (4).
The results show that NP is negatively correlated with urban household natural gas consumption across all models. In the main regression model, the coefficient for NP is significant at the 5% level, indicating that price signals can significantly influence household natural gas demand; a 1% increase in NP is associated with a 1.182% decrease in NGC. Regarding the control variables, the coefficients for PCDI, AGE, and HDD show positive effects, indicating that rising income levels, changes in the population’s age structure, and increased heating demand drive an increase in NGC. PFA and TIS did not pass the significance test, suggesting that their direct effects are relatively unstable.

4.3. Robustness Test

To test the reliability of the benchmark findings, this paper conducts robustness tests from three perspectives: in Column (1), NGC is replaced with total urban natural gas consumption, while urban gas consumption scale (UGC) is introduced as an additional control variable to capture differences in regional natural gas development and utilization conditions; in Column (2), continuous variables are subject to 1% and 99% two-sided truncation; and in Column (3), NP is replaced with nominal natural gas prices (unadjusted for CPI). Table 5 shows that the negative effect of rising NP on urban NGC remains consistent across the three robustness scenarios, indicating that the baseline regression results are robust.

4.4. Mediating Effect Test

This paper further examines the mediating role of EI in the relationship between NP and urban residents’ NGC; the results are presented in Table 6. Column (1) shows that the coefficient of NP is −1.182 and is significant at the 5% level, indicating that NP has a significant negative effect on NGC. In Column (2), the coefficient of NP relative to EI is −0.352 and is significant at the 1% level, indicating that rising NP is significantly correlated with a decline in EI. In Column (3): after further including EI, NP has a direct negative effect on NGC; at the same time, the coefficient for EI is −0.422 and is significant at the 1% level, suggesting that EI is also an important channel influencing NGC.
The Sobel test is significant at the 5% level, with an indirect effect of 0.148, indicating that the EI channel is statistically significant. Consistent with H2, EI mediates the relationship between NP and NGC. The direction of the indirect effect is opposite to that of the direct effect of NP, indicating that the EI channel partially offsets the effect of NP on residential NGC.
To further address potential endogeneity concerns in the mediating pathway, this study employs the one-period lagged value of EI and conducts a two-stage least squares estimation. As reported in Table 7, the first-stage F-statistic is 37.291, indicating a strong association between lagged EI and EI. The second-stage results show that EI remains significantly negatively associated with NGC, providing further support for the robustness of the mechanism.

4.5. Heterogeneity Analysis

4.5.1. Regional Heterogeneity Analysis

Regions were classified according to the “Eastern, Central, and Western” divisions defined by Chinese standards, and regression analyses were conducted separately for each region. The results in Table 8 show that the estimated coefficients vary across regions. However, only the coefficient for the Western region is statistically significant at the 5% level. The fully interacted model and Wald test further confirm overall regional heterogeneity in NP effects.

4.5.2. Heterogeneity Across Urbanization Stages

To examine differences in the NP across various stages of urbanization, this paper groups the data into the quartiles of the urbanization rate (p25 = 45.16%, p50 = 53.43%, p75 = 62.10%). Accordingly, the sample is divided into four groups (Q1, Q2, Q3, and Q4 representing urbanization levels from low to high, respectively). The fully interacted model and Wald test are further employed to examine whether NP coefficients differ significantly across urbanization groups.
As shown in Table 9, the coefficients of NP were negative across all quartiles, although the statistical significance varied across groups. The absolute magnitude of price elasticity exhibited a distinct non-monotonic pattern: in Q1 (lowest, urbanization rate < 45.16%), the elasticity was −1.289; in Q2 (45.16–53.43%), it increased to −2.667, corresponding to the largest absolute elasticity; in Q3 (53.43–62.10%), the elasticity declined to −1.986, and it further decreased to −1.076 in Q4 (highest, ≥62.10%).

5. Discussion

Based on panel data from 30 Chinese provinces covering the period 2005–2020, this paper examines the impact of NP on NGC among urban residents. The results show that an increase in NP contributes to lower NGC. The transmission mechanisms suggest that EI is a pathway through which NP influences NGC. Heterogeneity analysis reveals that price elasticity varies across geographic regions and stages of urbanization. These findings indicate that residential NGC is not determined solely by NP but is shaped by the combined effects of income, demographic structure, energy intensity, and climate.
The results of the baseline regression indicate that NGC is highly responsive to changes in the NP of urban residents. This finding is generally consistent with the conclusions reached by Li et al. [13]. Our estimated price elasticity of −1.182 is comparable to, although slightly larger in absolute magnitude than, the −0.898 reported by Zeng et al. [12]. This difference may mainly arise from differences in data structure and time horizon. Zeng et al. used household-level cross-sectional survey data, whereas this study employs a 16-year provincial panel dataset and controls for both province and year fixed effects to identify within-province responses to price changes. The robustness test using nominal natural gas prices yields consistent results, suggesting that the difference is unlikely to be driven solely by price measurement. In addition, this paper focuses on per capita residential natural gas consumption in urban areas. It uses the first-tier residential natural gas price adjusted by the CPI to more directly reflect the actual price signals faced by households for their basic natural gas needs.
In terms of control variables, PCDI, AGE, and HDD have a positive impact on NGC. Multiple studies have found that these factors do indeed influence household energy consumption [33,34,35]. However, the effects of per capita living space and industrial structure are inconsistent. Wang’s study indicates that living space affects residential energy consumption [36], which does not contradict our findings, as different studies selected different variables. NGC may also be influenced by factors such as housing type and employment [37].
The most noteworthy finding in the mediation analysis is not whether the EI channel is significant but, rather, the direction of its effect. On the one hand, rising NP contributes to the reduction in residential NGC through a direct channel; on the other hand, they weaken the overall dampening effect of price increases on end-use EI through an indirect channel, resulting in an offsetting effect of approximately 0.148 on NGC. As these two channels act in opposite directions and offset each other, the net effect ultimately remains a significant reduction in NGC. This finding suggests that, in the context of NGC, the impact of NP is partially mitigated by the offsetting effects resulting from reductions in regional energy intensity, with the offsetting effect of the indirect channel accounting for approximately 12.5%.
NP affects NGC, and it is not a one-way “price increase–consumption decrease” relationship. Theoretically, energy efficiency improvements may reduce the energy input per unit of service while lowering perceived costs and potentially encouraging additional demand, which could offset part of the expected energy savings [38]. In this study, however, the EI-mediated effect should be interpreted as an indirect and suggestive macro-level association, not as direct evidence of a classical rebound effect at the household level. The offsetting pathway identified through EI may reflect broader regional adjustments that occur alongside price changes. These adjustments may involve changes in the regional energy mix and the upgrading of urban energy infrastructure. This also illustrates that when evaluating the effectiveness of residential pricing policies, one should not focus solely on the price coefficient itself but should also consider whether regional energy intensity may be associated with indirect pathways that partially offset reductions in gas demand.
The heterogeneity analysis revealed differences in price elasticity across regions and at different stages of urbanization. On the one hand, regional heterogeneity analysis indicates that residential natural gas price responses differ across regions. Only the Western region exhibited a statistically significant negative response. This pattern may be partly explained by relatively lower income levels and fewer substitution options in some western regions, which may make households more sensitive to natural gas price changes. On the other hand, existing studies typically categorize urbanization levels into two groups—high and low [39]. We grouped regions based on urbanization quartiles, which allows for a more detailed depiction of the “initial rise followed by a decline” pattern of price elasticity across different stages of urbanization. This may be because, at low urbanization stages, the base level of NGC is insufficient, resulting in relatively low price elasticity; at medium urbanization stages, as the base of NGC gradually expands, residents’ sensitivity to price changes increases, leading to a rise in the absolute value of price elasticity; in contrast, at high urbanization stages, NGC tends to become inelastic, as residents’ energy demand and consumption habits mitigate the impact of price adjustments on NGC, causing the absolute value of price elasticity to decline accordingly. Urbanization may play an important role in shaping long-term energy intensity and consumption patterns [40].
This study uses provincial panel data to identify long-term and regional price elasticity characteristics. It still has certain limitations. First, due to data availability constraints, this study only covers the period up to 2020. Although important factors are controlled for, some factors, including local policy changes and energy substitution patterns, cannot be fully captured. Second, this study uses the first-tier price for residential natural gas, deflated by the CPI, as the NP. While this indicator offers good regional comparability, it does not fully represent the effective average and marginal gas prices faced by high-consumption households. Third, this paper uses panel regression to examine the impact of NP on urban NGC; however, price adjustments in neighboring regions may influence one another, and the study did not further account for potential spatial correlations between regions.
Future research could be expanded into three areas. First, incorporating more recent data and exploring additional factors may provide deeper insights and further improve the analysis. Second, if data on tiered prices and corresponding consumption volumes were available, it would be possible to construct indicators of the effective average or marginal price of natural gas for households, thereby improving the accuracy of price elasticity estimates. Third, spatial econometric methods could be employed to examine the spatial spillover effects of natural gas prices between adjacent regions.

6. Conclusions and Policy Recommendations

6.1. Conclusions

This study builds a panel regression model based on annual panel data for the 30 provinces in China from 2005–2020 to estimate the impact of residential NP on urban NGC. It further explores the potential transmission mechanism through which NP influences residential NGC and tests for heterogeneity in natural gas price elasticity. This paper mainly draws the following conclusions:
NP significantly contributes to reducing NGC among urban residents; a 1% increase in NP is associated with an estimated 1.182% decrease in NGC. This finding is consistent with the predictions of the household production theory and reflects the negative price elasticity of natural gas as a conventional commodity.
The mediation analysis suggests a dual transmission channel through which NP influences residential NGC: rising NP significantly affects residential NGC through a direct effect; the indirect pathway has an offsetting effect of 0.148, which partially weakens the negative association between NP and residential NGC.
Heterogeneity analysis further revealed differences in price elasticity across regions and urbanization stages. Geographically, the estimated price elasticity is statistically significant only in the Western region, while the coefficients for the other two regions are insignificant. In the analysis grouped by urbanization rate quartiles, gas price elasticity exhibited a non-monotonic pattern of “first rising and then falling” along the urbanization spectrum. It was greatest in the second urbanization quartile, suggesting that residential NGC exhibits greater sensitivity to NP in these urbanization stages.
The findings of this paper support the implementation of differentiated and tiered pricing strategies in NP reform. At the same time, policymakers should pay attention to the offsetting effects of regional energy intensity while recognizing that these are macro-level associations rather than direct household-level efficiency gains. Complementary measures should be considered when designing energy conservation and emissions reduction policies.

6.2. Policy Recommendations

The price adjustment mechanism should be further optimized by region and urbanization stage. Policymakers should ensure that first-tier residential natural gas prices continue to cover essential household gas demand and remain relatively stable. In western regions and areas with medium or low urbanization levels, policymakers should make price adjustments gradually to avoid rapid increases that may affect basic energy needs. In highly urbanized areas, they should also moderately strengthen price constraints in higher tiers to guide high-consumption households to reduce unnecessary gas use. Improving tiered pricing, price transparency, and billing feedback will allow the pricing mechanism to more effectively support energy conservation and the low-carbon transition [41].
Policies targeting reductions in regional energy intensity should be coordinated with natural gas pricing reforms to enhance residential energy management. Local governments may consider incorporating energy-efficient building retrofits, replacing outdated gas equipment, and wider use of smart gas meters into residential energy management systems. Gas companies could improve residential billing feedback by providing tiered consumption information, energy-saving suggestions, and peak demand reminders to enhance residents’ awareness of gas costs and conservation benefits. In regions where heating accounts for a large share of urban natural gas consumption, improving building insulation and replacing inefficient heating equipment may serve as complementary measures for improving residential energy efficiency.
Targeted subsidy policies should be refined to complement the tiered natural gas pricing system for residential users. These policies may be considered as complementary measures to support basic household gas access and alleviate potential energy affordability pressures among vulnerable groups. In regions where natural gas infrastructure is still under development, support measures such as subsidies for basic gas consumption or heating season assistance could be explored. Such measures may help balance energy affordability and residential energy sustainability goals.


Author Contributions

Conceptualization, formal analysis, writing—original draft, methodology, writing—review and editing, C.S.; data curation, investigation and visualization, J.L.; data curation, methodology, S.S.; conceptualization, supervision, funding acquisition, Y.W. All authors have read and agreed to the published version of the manuscript.

Funding

This study was supported by the Graduate Innovation Program of Chongqing University of Science and Technology (Grant No. YKJCX2520710), the Chongqing Graduate Student Research Innovation Project (Grant No. CYS260938), the Chongqing Graduate Student Research Innovation Project, the Chongqing Postdoctoral Science Foundation Project (Grant No. 2023NSCQ-BHX0390), the Chongqing Municipal Education Commission (Grant No. 23SKG-H354), and the project “Analysis and Target Decomposition of Total Urban Building Energy Control in Liaoning Province from the Perspective of Carbon Neutrality” (Grant No. L21BJY007).

Data Availability Statement

Data will be made available on request.

Acknowledgments

We thank the anonymous reviewers for their valuable comments on this manuscript. The authors would like to thank Linna Geng for her initial guidance and valuable input during the early stages of this research.

Conflicts of Interest

Author Yuanping Wang was employed by the company Chongqing Gangli Environmental Protection Co., Ltd. The remaining authors declare that the research was conducted in the absence of any commercial or financial relationships that could be construed as a potential conflict of interest.

References

  1. Abar, S.N.; Schulwitz, M.; Faulstich, M. Urban form as a lever: Reducing residential natural gas dependency. Sustain. Cities Soc. 2025, 133, 106891. [Google Scholar] [CrossRef] [Scilit]
  2. Salimi, M.; Faramarzi, D.; Hosseinian, S.H.; Gharehpetian, G.B. Replacement of natural gas with electricity to improve seismic service resilience: An application to domestic energy utilities in Iran. Energy 2020, 200, 117509. [Google Scholar] [CrossRef] [Scilit]
  3. Jiang, H.D.; Dong, X.C.; Jiang, Q.Z.; Dong, K.Y. What drives China’s natural gas consumption? Analysis of national and regional estimates. Energy Econ. 2020, 87, 104744. [Google Scholar] [CrossRef] [Scilit]
  4. Hou, L.C.; Zhu, C.C.; Cai, W.G.; Wu, F.Y.; Zuo, J. Mineral demand for the global energy transition by 2050 from a production-side and demand-side perspective: A focus on wind and solar power systems. Resour. Conserv. Recycl. 2026, 234, 109082. [Google Scholar] [CrossRef] [Scilit]
  5. Liu, G.X.; Dong, X.C.; Jiang, Q.Z.; Dong, C.; Li, J.M. Natural gas consumption of urban households in China and corresponding influencing factors. Energy Policy 2018, 122, 17–26. [Google Scholar] [CrossRef] [Scilit]
  6. Liu, G.X.; Dong, X.C.; Kong, Z.Y.; Jiang, Q.Z.; Li, J.M. The role of China in the East Asian natural gas premium. Energy Strategy Rev. 2021, 33, 100610. [Google Scholar] [CrossRef] [Scilit]
  7. CNGDR. China Natural Gas Development Report (2021); Petroleum Industry Press: Beijing, China, 2021. [Google Scholar]
  8. Kavgic, M.; Mavrogianni, A.; Mumovic, D.; Summerfield, A.; Stevanovic, Z.; Djurovic-Petrovic, M. A review of bottom-up building stock models for energy consumption in the residential sector. Build. Environ. 2010, 45, 1683–1697. [Google Scholar] [CrossRef] [Scilit]
  9. Gassar, A.A.A.; Cha, S.H. Energy prediction techniques for large-scale buildings towards a sustainable built environment: A review. Energy Build. 2020, 224, 110238. [Google Scholar] [CrossRef] [Scilit]
  10. Favero, F.; Grossi, L. Analysis of individual natural gas consumption and price elasticity: Evidence from billing data in Italy. Energy Econ. 2023, 118, 106484. [Google Scholar] [CrossRef] [Scilit]
  11. Yu, Y.H.; Zheng, X.Y.; Han, Y. On the demand for natural gas in urban China. Energy Policy 2014, 70, 57–63. [Google Scholar] [CrossRef] [Scilit]
  12. Zeng, S.P.; Chen, Z.M.; Alsaedi, A.; Hayat, T. Price elasticity, block tariffs, and equity of natural gas demand in China: Investigation based on household-level survey data. J. Clean. Prod. 2018, 179, 441–449. [Google Scholar] [CrossRef] [Scilit]
  13. Li, J.M.; Dong, X.C.; Jiang, Q.Z.; Dong, K.Y. Urban natural gas demand and factors analysis in China: Perspectives of price and income elasticities. Pet. Sci. 2022, 19, 429–440. [Google Scholar] [CrossRef] [Scilit]
  14. Yan, H. A pathway towards energy transition: Urbanization and clean fuel adoption in Chinese homes. Energy Econ. 2026, 154, 109153. [Google Scholar] [CrossRef] [Scilit]
  15. Wang, Y.C.; Ren, Y.J.; Yang, J.Y.; Zhou, M.; Zhao, Q.R. Greener cities, cleaner homes: Evaluating the effect of China’s low-carbon city pilot policy on urban household energy consumption structure. Energy Policy 2026, 215, 115336. [Google Scholar] [CrossRef] [Scilit]
  16. Xu, P.P.; Zhang, Y.P.; Yao, H.N.; Wen, Y.Y. Research on the impact of demographic factors on carbon emissions from residential buildings in Chongqing (China). Energy Build. 2025, 346, 116167. [Google Scholar] [CrossRef] [Scilit]
  17. Li, L.L.; Li, J.J.; Li, K.; Luo, X.; Jiao, J.L. Climatic impacts on residential natural gas consumption: Evidence from Hefei, China. Energy Build. 2022, 275, 112488. [Google Scholar] [CrossRef] [Scilit]
  18. Namazkhan, M.; Albers, C.; Steg, L. A decision tree method for explaining household gas consumption: The role of building characteristics, socio-demographic variables, psychological factors and household behaviour. Renew. Sustain. Energy Rev. 2020, 119, 109542. [Google Scholar] [CrossRef] [Scilit]
  19. Li, L.L.; Ming, H.Y.; Fu, W.Z.; Shi, Q.; Yu, S.W. Exploring household natural gas consumption patterns and their influencing factors: An integrated clustering and econometric method. Energy 2021, 224, 120194. [Google Scholar] [CrossRef] [Scilit]
  20. Wang, Y.P.; Sun, C.H.; Fan, Y.Y.; Su, S.T.; Wang, C.; Wang, R.L.; Rahnamayiezekavat, P. Household Carbon Emissions Research from 2005 to 2024: An Analytical Review of Assessment, Influencing Factors, and Mitigation Pathways. Buildings 2025, 15, 3172. [Google Scholar] [CrossRef] [Scilit]
  21. Becker, G.S. A Theory of the Allocation of Time. Econ. J. 1965, 75, 493–517. [Google Scholar] [CrossRef] [Scilit]
  22. Muth, R.F. Household Production and Consumer Demand Functions. Econometrica 1966, 34, 699–708. [Google Scholar] [CrossRef] [Scilit]
  23. Li, L.L.; Luo, X.; Zhou, K.L.; Xu, T.T. Evaluation of increasing block pricing for households’ natural gas: A case study of Beijing, China. Energy 2018, 157, 162–172. [Google Scholar] [CrossRef] [Scilit]
  24. Bu, Y.; Wang, E.D.; Bai, J.H.; Shi, Q.B. Spatial pattern and driving factors for interprovincial natural gas consumption in China: Based on SNA and LMDI. J. Clean. Prod. 2020, 263, 121392. [Google Scholar] [CrossRef] [Scilit]
  25. Javid, M.; Khan, F.N.; Arif, U. Income and price elasticities of natural gas demand in Pakistan: A disaggregated analysis. Energy Econ. 2022, 113, 106203. [Google Scholar] [CrossRef] [Scilit]
  26. Hang, L.; Tu, M. The impacts of energy prices on energy intensity: Evidence from China. Energy Policy 2007, 35, 2978–2988. [Google Scholar] [CrossRef] [Scilit]
  27. Huang, J.B.; Du, D.; Hao, Y. The driving forces of the change in China’s energy intensity: An empirical research using DEA-Malmquist and spatial panel estimations. Econ. Model. 2017, 65, 41–50. [Google Scholar] [CrossRef] [Scilit]
  28. Yan, H.J. Provincial energy intensity in China: The role of urbanization. Energy Policy 2015, 86, 635–650. [Google Scholar] [CrossRef] [Scilit]
  29. NDRC. National Development and Reform Commission. 2020. Available online: https://www.ndrc.gov.cn (accessed on 14 May 2026).
  30. CMA. China Meteorological Administration. 2019. Available online: https://data.cma.cn (accessed on 14 May 2026).
  31. CSY. China Statistical Yearbook. 2021. Available online: https://data.stats.gov.cn (accessed on 15 May 2026).
  32. CESY. China Energy Statistical Yearbook. 2021. Available online: https://www.nea.gov.cn (accessed on 15 May 2026).
  33. Ren, X.H.; Lu, Q.; Gozgor, G.; Fu, H.Q. Natural gas and the battle of carbon emissions: Interpreting the spatial effects of provincial carbon emissions in China. Int. Rev. Econ. Financ. 2025, 97, 103835. [Google Scholar] [CrossRef] [Scilit]
  34. Yuan, B.; Zhong, Y.; Li, S.; Zhao, Y. The degree of population aging and living carbon emissions: Evidence from China. J. Environ. Manag. 2024, 353, 120185. [Google Scholar] [CrossRef] [Scilit] [PubMed]
  35. Wang, Y.P.; He, Y.; Hu, L.; Su, X.Y.; Hou, L.C.; Cai, W.G.; Sun, C.H.; Fan, Y.Y.; Su, S.T.; Ma, W.W. Impact of climate change on electricity consumption of urban residents in China: An empirical analysis based on annual urban panel data. J. Renew. Sustain. Energy 2025, 17, 015104. [Google Scholar] [CrossRef] [Scilit]
  36. Wang, Y.; Hou, L.; Cai, W.; Zhou, Z.; Bian, J. Exploring the drivers and influencing mechanisms of urban household electricity consumption in China-Based on longitudinal data at the provincial level. Energy 2023, 273, 127191. [Google Scholar] [CrossRef] [Scilit]
  37. Mittakola, R.T.; Ciais, P.; Schubert, J.E.; Makowski, D.; Zhou, C.L.; Bazzi, H.; Sun, T.C.; Liu, Z.; Davis, S.J. Drivers of natural gas use in US residential buildings. Sci. Adv. 2024, 10, eadh5543. [Google Scholar] [CrossRef] [Scilit] [PubMed]
  38. Sorrell, S.; Dimitropoulos, J. The rebound effect: Microeconomic definitions, limitations and extensions. Ecol. Econ. 2008, 65, 636–649. [Google Scholar] [CrossRef] [Scilit]
  39. Fan, J.J.; Wang, J.L.; Qiu, J.X.; Li, N. Stage effects of energy consumption and carbon emissions in the process of urbanization: Evidence from 30 provinces in China. Energy 2023, 276, 127655. [Google Scholar] [CrossRef] [Scilit]
  40. Bilgili, F.; Koçak, E.; Bulut, Ü.; Kuloglu, A. The impact of urbanization on energy intensity: Panel data evidence considering cross-sectional dependence and heterogeneity. Energy 2017, 133, 242–256. [Google Scholar] [CrossRef] [Scilit]
  41. Li, K.M.; Fang, L.T.; He, L.R. The impact of energy price on CO2 emissions in China: A spatial econometric analysis. Sci. Total Environ. 2020, 706, 135942. [Google Scholar] [CrossRef] [Scilit] [PubMed]
Figure 1. Distribution of urban residential natural gas consumption. Note: Figure 1 and Figure 2 were prepared using the Ministry of Natural Resources of China’s standard map (GS (2024) 0650), with no base map boundary modifications.
Buildings 16 03568 g001
Figure 2. Distribution of residential natural gas prices.
Buildings 16 03568 g002
Table 2. Correlation test results.
VariablesLn(NGC)Ln(NP)Ln(PCDI)Ln(AGE)Ln(PFA)Ln(HDD)Ln(TIS)Ln(EI)
Ln(NGC)1.0000
Ln(NP)−0.527 ***1.0000
Ln(PCDI)0.431 ***0.0211.0000
Ln(AGE)0.266 ***−0.200 ***0.178 ***1.0000
Ln(PFA)0.130 ***0.125 ***0.582 ***−0.0351.0000
Ln(HDD)0.313 ***−0.466 ***−0.094 **0.433 ***−0.304 ***1.0000
Ln(TIS)0.373 ***−0.097 **0.686 ***0.260 ***0.173 ***−0.0701.0000
Ln(EI)−0.145 ***−0.416 ***−0.739 ***−0.097 **−0.540 ***0.417 ***−0.481 ***1.0000
Note: *, ** and *** indicate a significance level of 10%, 5% and 1%, respectively.
Table 3. Results of VIF test for variables.
VariablesVIF1/VIF
Ln(PCDI)3.410.293
Ln(TIS)2.480.403
Ln(PFA)2.020.495
Ln(HDD)1.810.553
Ln(AGE)1.380.723
Ln(NP)1.330.750
Mean2.07
Table 4. Baseline regression results.
Variables(1) Model 1(2) Model 2(3) Model 3(4) Model 4
Ln(NP)−2.380 ***−2.131 ***−0.634−1.182 **
(0.362)(0.412)(0.463)(0.431)
Ln(PCDI) 1.209 ***1.016 ***1.170 **
(0.437)(0.366)(0.497)
Ln(AGE) 0.2050.0241.160 ***
(0.352)(0.243)(0.317)
Ln(PFA) −0.3320.4950.566
(0.656)(0.613)(0.607)
Ln(HDD) 0.1630.383 **0.172 *
(0.129)(0.149)(0.101)
Ln(TIS) 0.1150.6042.063
(0.922)(0.953)(1.272)
Cons4.445 ***−7.499 *−9.193 **−30.410 *
(0.297)(4.067)(4.340)(17.485)
Province FeNONONOYES
Year FeNONONOYES
Hausman test 24.82 ***
N480480480480
R20.2780.4910.4020.737
Note: *, ** and *** indicate a significance level of 10%, 5% and 1%, respectively. Standard errors are clustered at the provincial level and reported in parentheses. p-values are based on a t-distribution of 29 degrees of freedom.
Table 5. The results of robustness test.
Variables(1) Model 5(2) Model 6(3) Model 7
Ln(NP)−1.336 **−1.127 **−1.312 ***
(0.502)(0.455)(0.443)
Ln(UGC)0.279 **
(0.121)
Control variablesYESYESYES
Province FeYESYESYES
Year FeYESYESYES
Cons−34.340 **−35.309 *−31.656
(16.811)(18.492)(19.479)
N480480480
R20.7910.7510.739
Note: *, ** and *** indicate a significance level of 10%, 5% and 1%, respectively. Standard errors are clustered at the provincial level and reported in parentheses. p-values are based on a t-distribution of 29 degrees of freedom.
Table 6. The results of mediating effect test.
Variables(1) Model 8(2) Model 9(3) Model 10
Ln(NP)−1.182 **−0.352 ***−1.329 **
(0.431)(0.105)(0.550)
Ln(EI) −0.422 ***
(0.138)
Control variablesYESYESYES
Province FeYESYESYES
Year FeYESYESYES
Cons−30.410 *1.649−36.203 **
(17.485)(3.866)(14.880)
Sobel test 2.26 **
Indirect 0.148
N480480480
R20.7370.8580.819
Note: *, ** and *** indicate a significance level of 10%, 5% and 1%, respectively. Standard errors are clustered at the provincial level and reported in parentheses. p-values are based on a t-distribution of 29 degrees of freedom.
Table 7. Endogeneity test of the mediating mechanism.
Variables(1) Model 11(2) Model 12
Lagged Ln(EI)0.684 ***
(0.112)
Ln(NP)−0.338 **−1.574 **
(0.151)(0.664)
Ln(EI) −0.671 ***
(0.221)
Control variablesYESYES
Province FeYESYES
Year FeYESYES
First-stage F stat37.291
K-P rk LM stat 10.842 ***
K-P Wald F stat 31.674
Note: *, ** and *** indicate a significance level of 10%, 5% and 1%, respectively. Standard errors are clustered at the provincial level and reported in parentheses. p-values are based on a t-distribution of 29 degrees of freedom.
Table 8. Geographic heterogeneity.
Variables(1) Eastern(2) Central(3) Western
Ln(NP)−0.452−1.661−1.137 **
(1.180)(1.397)(0.490)
Control variablesYESYESYES
Province FeYESYESYES
Year FeYESYESYES
Cons−31.62320.200−83.083 ***
(34.453)(42.264)(26.833)
N176128176
R20.71250.69030.7882
Note: *, ** and *** indicate a significance level of 10%, 5% and 1%, respectively. Standard errors are clustered at the provincial level and reported in parentheses. p-values are based on a t-distribution of 29 degrees of freedom. The equality of NP coefficients across regions is formally tested using a fully interacted model. The Wald test rejects the null hypothesis of coefficient equality (F = 3.31, p-value = 0.033).
Table 9. Heterogeneity in urbanization.
Variables(1) Q1(2) Q2(3) Q3(4) Q4
Ln(NP)−1.289 **−2.667 ***−1.986 ***−1.076 *
(0.518)(0.953)(0.597)(0.578)
Control variablesYESYESYESYES
Province FeYESYESYESYES
Year FeYESYESYESYES
Cons−51.183−35.011−52.268 **18.656
(32.296)(53.929)(24.332)(14.552)
N120120120120
R20.8740.9340.9500.820
Note: *, ** and *** indicate a significance level of 10%, 5% and 1%, respectively. Standard errors are clustered at the provincial level and reported in parentheses. p-values are based on a t-distribution of 29 degrees of freedom. The Wald test based on the fully interacted model rejects the equality of NP coefficients across the four urbanization groups (F = 18.20, p < 0.001).
Disclaimer/Publisher’s Note: The statements, opinions and data contained in all publications are solely those of the individual author(s) and contributor(s) and not of MDPI and/or the editor(s). MDPI and/or the editor(s) disclaim responsibility for any injury to people or property resulting from any ideas, methods, instructions or products referred to in the content.