Article

Experimental Study on Vertical Bearing Characteristics of Prestressed High-Strength Concrete Pipe Pile-Group Foundations

1
Huzhou Xunsu Expressway Co., Ltd., Huzhou 313000, China
2
Zhejiang Highway and Water Transport Engineering Consulting Group Co., Ltd., Hangzhou 310005, China
3
Zhejiang Provincial Communications Group Testing Technology Co., Ltd., Hangzhou 310030, China
4
School of Civil Engineering, Southeast University, Nanjing 211189, China
5
China Energy Engineering Group Jiangsu Power Design Institute Co., Ltd., Nanjing 211102, China
6
Nanjing Dongda Self-Balanced Pile Foundation Testing Co., Ltd., Nanjing 211164, China
*
Author to whom correspondence should be addressed.
Buildings 2026, 16(17), 3398; https://doi.org/10.3390/buildings16173398
Submission received: 10 July 2026 / Revised: 9 August 2026 / Accepted: 11 August 2026 / Published: 25 August 2026

Abstract

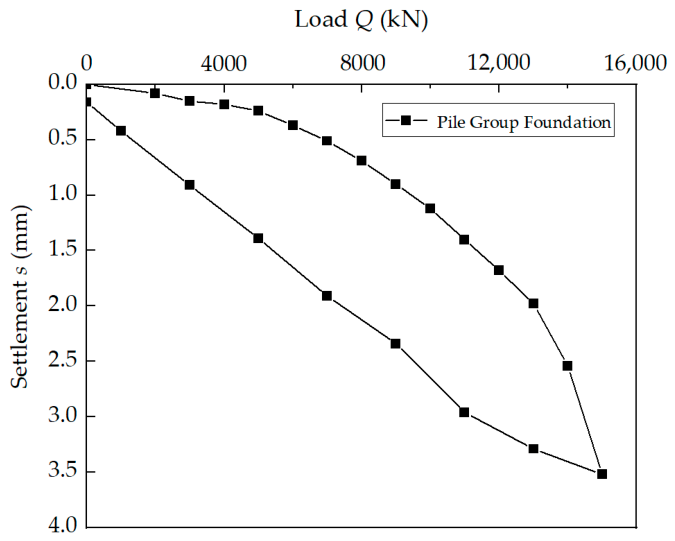
To address the difficulty in accurately evaluating the vertical bearing behavior of prestressed high-strength concrete (PHC) pipe pile-group foundations, this study investigated three single piles and an eight-pile group with a Wang-shaped irregular pile cap through field static loading tests and theoretical analysis. The measured ultimate bearing capacities of single piles D1/D2 and D3 were 7040 and 3000 kN, respectively. For the pile-group foundation, the ultimate bearing state was not reached under the maximum applied load of 15,000 kN, at which the settlement was only 3.52 mm. The pile-head load distribution followed the order corner piles > side piles > inner piles, with corresponding load proportions of approximately 13.9%, 12.9%, and 9.4%. The calibrated API and hyperbolic models predicted the single-pile bearing capacities with errors ranging from 0.23% to 3.40%. The API model better represented the steep-drop portion of the Q-s curve, whereas the hyperbolic model more accurately predicted the initial stiffness and low-load response. For pile-group foundations, the combined equivalent-pier and load-transfer method showed good applicability. The main contribution of this study is to provide field evidence for the vertical bearing and load-transfer behavior of a large-diameter PHC pipe pile group with a Wang-shaped irregular pile cap, extending existing studies that have mainly focused on single piles or conventional symmetric pile groups. The results also provide a quantitative basis for the analysis and design of PHC pipe pile-group foundations in highway bridge engineering.

1. Introduction

Compared with conventional bored cast-in-place piles, prestressed high-strength concrete (PHC) pipe piles have been widely used in soft ground treatment and highway bridge engineering because of their high single-pile bearing capacity, cost-effectiveness, convenient and reliable construction, and environmental benefits. Existing studies have mainly focused on the bearing behavior of single PHC pipe piles [1,2,3]. Li et al. [4] conducted field static load tests on PHC pipe piles, providing experimental evidence for evaluating the bearing characteristics of PHC pipe piles in deep soft ground. Wang et al. [5,6], based on highway projects in the Dongting Lake region, conducted vertical bearing capacity tests on single PHC pipe piles and investigated standardized design schemes, revealing the load-transfer characteristics of PHC pipe piles under the local geological conditions and verifying the reliability of the standardized design. Their results showed that PHC pipe piles with gravel as the bearing stratum exhibited end-bearing friction-pile behavior while reducing construction costs by approximately 22% and carbon emissions by approximately 32% compared with bored cast-in-place piles.
In terms of the bearing mechanism and theoretical analysis of single piles, researchers have conducted extensive investigations from different perspectives. Regarding pile-tip bearing mechanisms, Ling et al. [7] conducted static loading failure tests on non-displacement rock-socketed PHC pipe piles and found that an unsealed open-ended pile shoe exhibited a punching failure mode into the rock foundation, whereas end sealing with concrete increased the ultimate bearing capacity by 340%. Based on these tests, a simplified method for calculating the pile-tip bearing capacity of rock-socketed pipe piles was proposed. Li et al. [8] subsequently developed a simplified nonlinear model for analyzing the load–settlement response of rock-socketed PHC pipe piles considering the effects of end sealing and side grouting. Regarding the soil-plugging effect of open-ended pipe piles, Kikuchi et al. [9] conducted penetration tests using a double-pipe model pile and separately measured the inner shaft resistance and annular resistance, thereby clarifying the influence of soil plugging on the development of tip resistance. Zhu et al. [10] further reported from model tests on open-ended double-wall pipe piles that the local shaft resistance along the inner and outer pile walls gradually decreased with increasing h/R. In terms of theoretical calculations of bearing capacity, Jiang et al. [11] proposed correction coefficients for the empirical formula of single-pile ultimate bearing capacity based on static load test data from a PHC pipe pile project in Changsha. Nie et al. [12] established a limit-state equation for the vertical bearing capacity of single piles considering pile–soil interaction based on code-based empirical formulas and field static load tests. Zhou et al. [13] conducted model tests on the static installation of PHC pipe piles in sandy soil with pebble interlayers. They found that a pebble layer with a thickness of 2.5 times the pile diameter increased the average and peak pile penetration forces by 1.3 and 1.8 times, respectively, and proposed a modified calculation formula for pile penetration resistance.
In recent years, combining field tests with numerical simulations has become an important approach for investigating the bearing behavior of PHC pipe piles. Zhang et al. [14] investigated the selection of pile foundations for port engineering by establishing a self-balanced static load model for PHC piles to simulate the load–displacement response, axial load transfer, and shaft resistance distribution and validated the model using field test data. The results showed that although the PHC pile diameter was 20% larger than that of the steel pipe pile, their ultimate bearing capacities were approximately comparable. Plaxis 3D simulations further indicated that, under the same conditions, the ultimate bearing capacity of the steel pipe pile was 18.43% higher than that of the PHC pile, while its axial load distribution along the pile shaft was more uniform. Feng et al. [15] combined field load tests with finite difference method numerical simulations to systematically evaluate the vertical bearing behavior of PHC pipe piles in mudstone. The results showed that the piles transitioned from end-bearing friction piles to friction end-bearing piles as the applied load increased. When the load reached 5700 kN, the proportion of tip resistance increased sharply from 53% to 94%. Although shear failure occurred at the pile–soil interface, the structural integrity of the pile was maintained through complete redistribution of the load to the pile tip. These studies demonstrate the value of combining field tests and numerical simulations for understanding the bearing mechanisms of PHC pipe piles.
For pile-group foundations, considerable progress has also been made in understanding their vertical bearing behavior. Gong et al. [16,17] investigated long-core stiffened deep cement mixing (SDCM) piles through full-scale field tests and three-dimensional numerical simulations involving isolated piles, two-pile groups, and six-pile groups. They systematically examined the effects of the pile spacing, cemented-soil coverage, and elastic modulus on the pile-group effect and found that the group effect was insignificant when the pile spacing exceeded four times the pile diameter. Sun et al. [18] conducted laboratory model tests on 2 × 2 and 3 × 3 pipe pile groups and obtained compression efficiency coefficients of 1.12 and 1.06, respectively. Song and Wang [19] showed through ABAQUS numerical simulations that the bearing capacity of 2 × 2 and 3 × 3 inclined pile groups increased with the increasing pile inclination angle.
However, several limitations remain in the existing literature. First, studies of PHC pipe piles in highway bridge engineering have mainly focused on single-pile bearing behavior, while field investigations of the vertical load-transfer mechanism of PHC pipe pile groups, particularly those with complex pile-cap configurations, remain limited. Second, existing vertical bearing tests on pile groups have mostly adopted regular and symmetric 2 × 2 or 3 × 3 configurations with relatively simple pile caps, whereas systematic field investigations of pipe pile groups with asymmetric or irregular pile caps, such as Wang-shaped pile caps, remain scarce. Third, applications of the load-transfer method to pipe pile groups have largely been developed within the framework of building foundation codes, and their applicability to the design and analysis of highway bridge pile-group foundations has not been sufficiently validated by field tests.
To address these issues, this study investigates the vertical bearing characteristics of prefabricated pipe single piles and pile-group foundations for highway bridges through a combination of field static load tests and theoretical analysis, based on the Jijiabang Super Major Bridge project of Phase I of the Su-Tai Expressway. The main experimental contribution of this study is the field vertical static loading test of a large-diameter PHC pipe pile group with a Wang-shaped irregular pile cap, extending beyond the conventional symmetric pile-group configurations. To the best of our knowledge, field evidence on the vertical bearing mechanism of PHC pipe pile groups with irregular pile caps in highway bridge engineering remains limited. Experimentally, this study aims to clarify the load-transfer mechanism and pile-group effect of pipe piles under a Wang-shaped irregular pile cap. Theoretically, the load-transfer method and equivalent-pier method are employed to analyze the vertical bearing characteristics of single-pile and pile-group foundations, respectively, and the calculated results are systematically compared with the field measurements to evaluate the applicability of these methods to highway bridge PHC pipe groups. The findings are expected to provide a scientific basis for the application of PHC pipe piles in expressway bridge engineering and are a useful reference for the design and construction of pipe pile foundations for highway bridges in Zhejiang Province.

2. Project Overview

The pile testing project was located between Piers 27 and 28 of the Jijiabang Super Major Bridge in Nanxun District, Huzhou City, Zhejiang Province, near K2 + 204.158. The site is situated in an alluvial–lacustrine plain. Most of the alignment is flat and open. The shallow strata mainly consist of cultivated soil, silt, and muddy silty clay, with no competent bearing layer in the shallow zone; the deeper strata are dominated by silty clay. The principal geotechnical parameters of the test site are listed in Table 1.
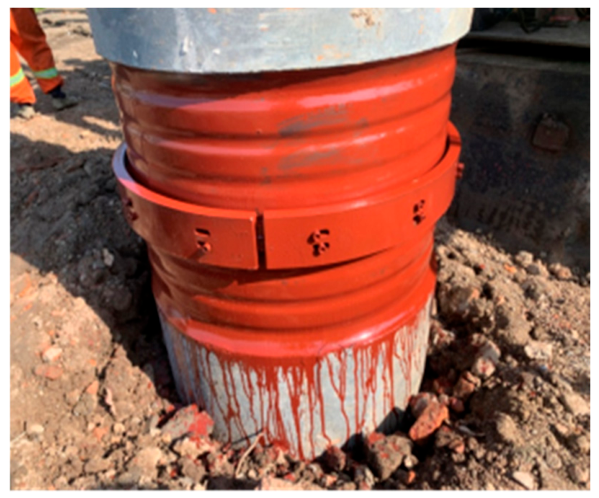
The field tests involved three single piles (D1, D2, and D3) and one eight-pile group foundation (Q1–Q8) with a Wang-shaped pile cap. All test piles were PHC800(130)-AB pipe piles manufactured using prestressing by the pre-tensioning method, centrifugal casting, and high-pressure steam curing. The centrifugal casting process produces a dense concrete matrix with relatively low permeability, thereby reducing water ingress through the pile wall. In addition, pile-end sealing measures were adopted after pile installation to reduce the possibility of water accumulation inside the piles. Figure 1 shows the cross-sectional configuration of the PHC800(130)-AB pipe pile, and its principal design parameters are listed in Table 2. The piles were installed by hammer driving, and adjacent pile segments were connected using welded joints combined with mechanical-clamp connections, as shown in Figure 2. The parameters of the single-pile and pile-group tests are listed in Table 3.

3. Field Vertical Static Loading Tests on Pipe Piles

3.1. Test System

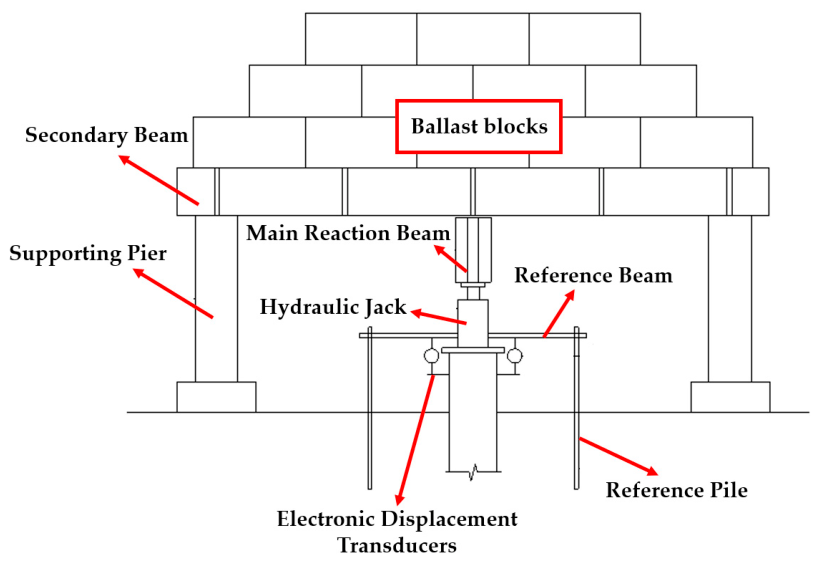
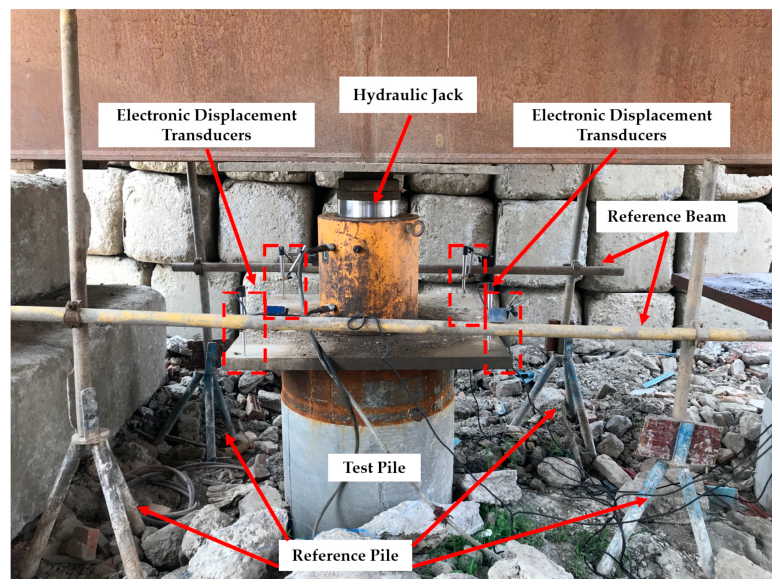
Field vertical static loading tests were conducted on three single piles. Hydraulic jacks were used as the loading devices, and a surcharge–reaction-frame system was adopted as the reaction system. According to the requirement that the capacity of the loading reaction system should be no less than 1.2 times the maximum applied test load, the surcharge weights for the 49 m and 32 m single piles were determined as 10,000 and 5000 kN, respectively. Four electronic displacement transducers were installed at the head of each pile to measure pile-head settlement under vertical loading. Load and displacement data were collected and analyzed using an RS-JYD static load testing analyzer, manufactured by Wuhan Yanhai Engineering Technology Co., Ltd. (Wuhan, China), to obtain the Q-s and s-lgt curves. The single-pile surcharge loading system and the field arrangement of the displacement transducers are shown in Figure 3 and Figure 4, respectively.
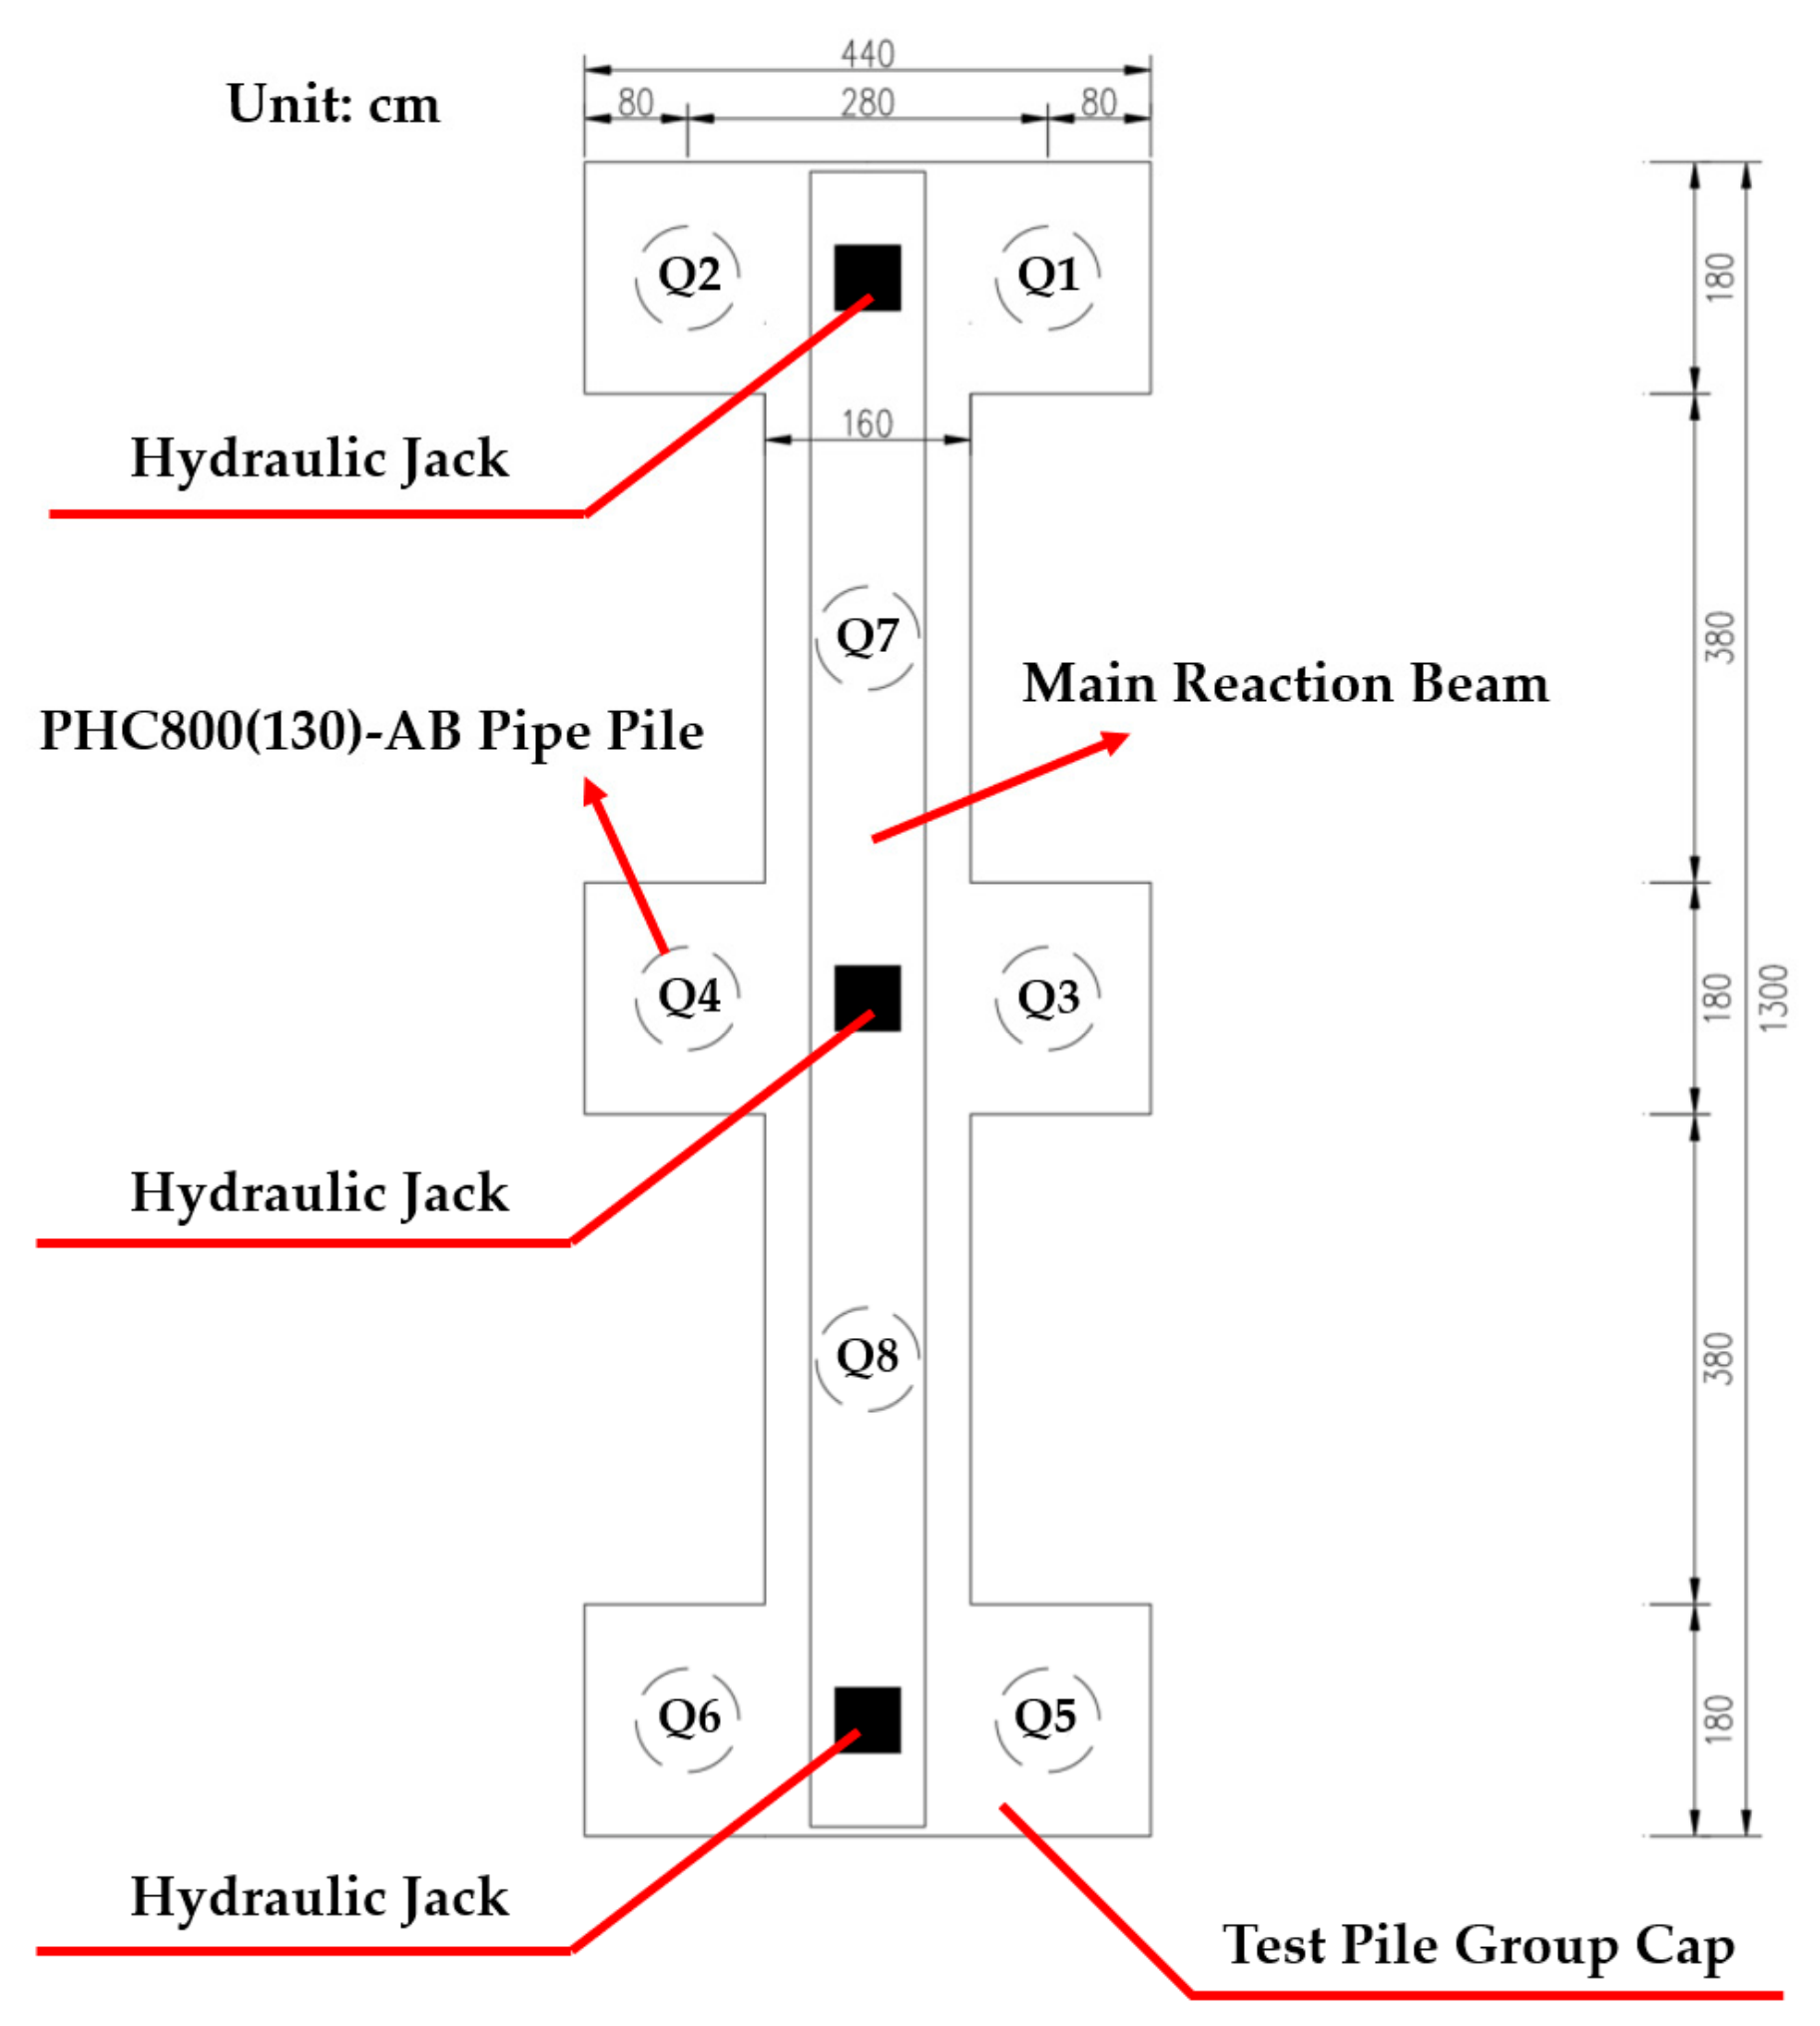
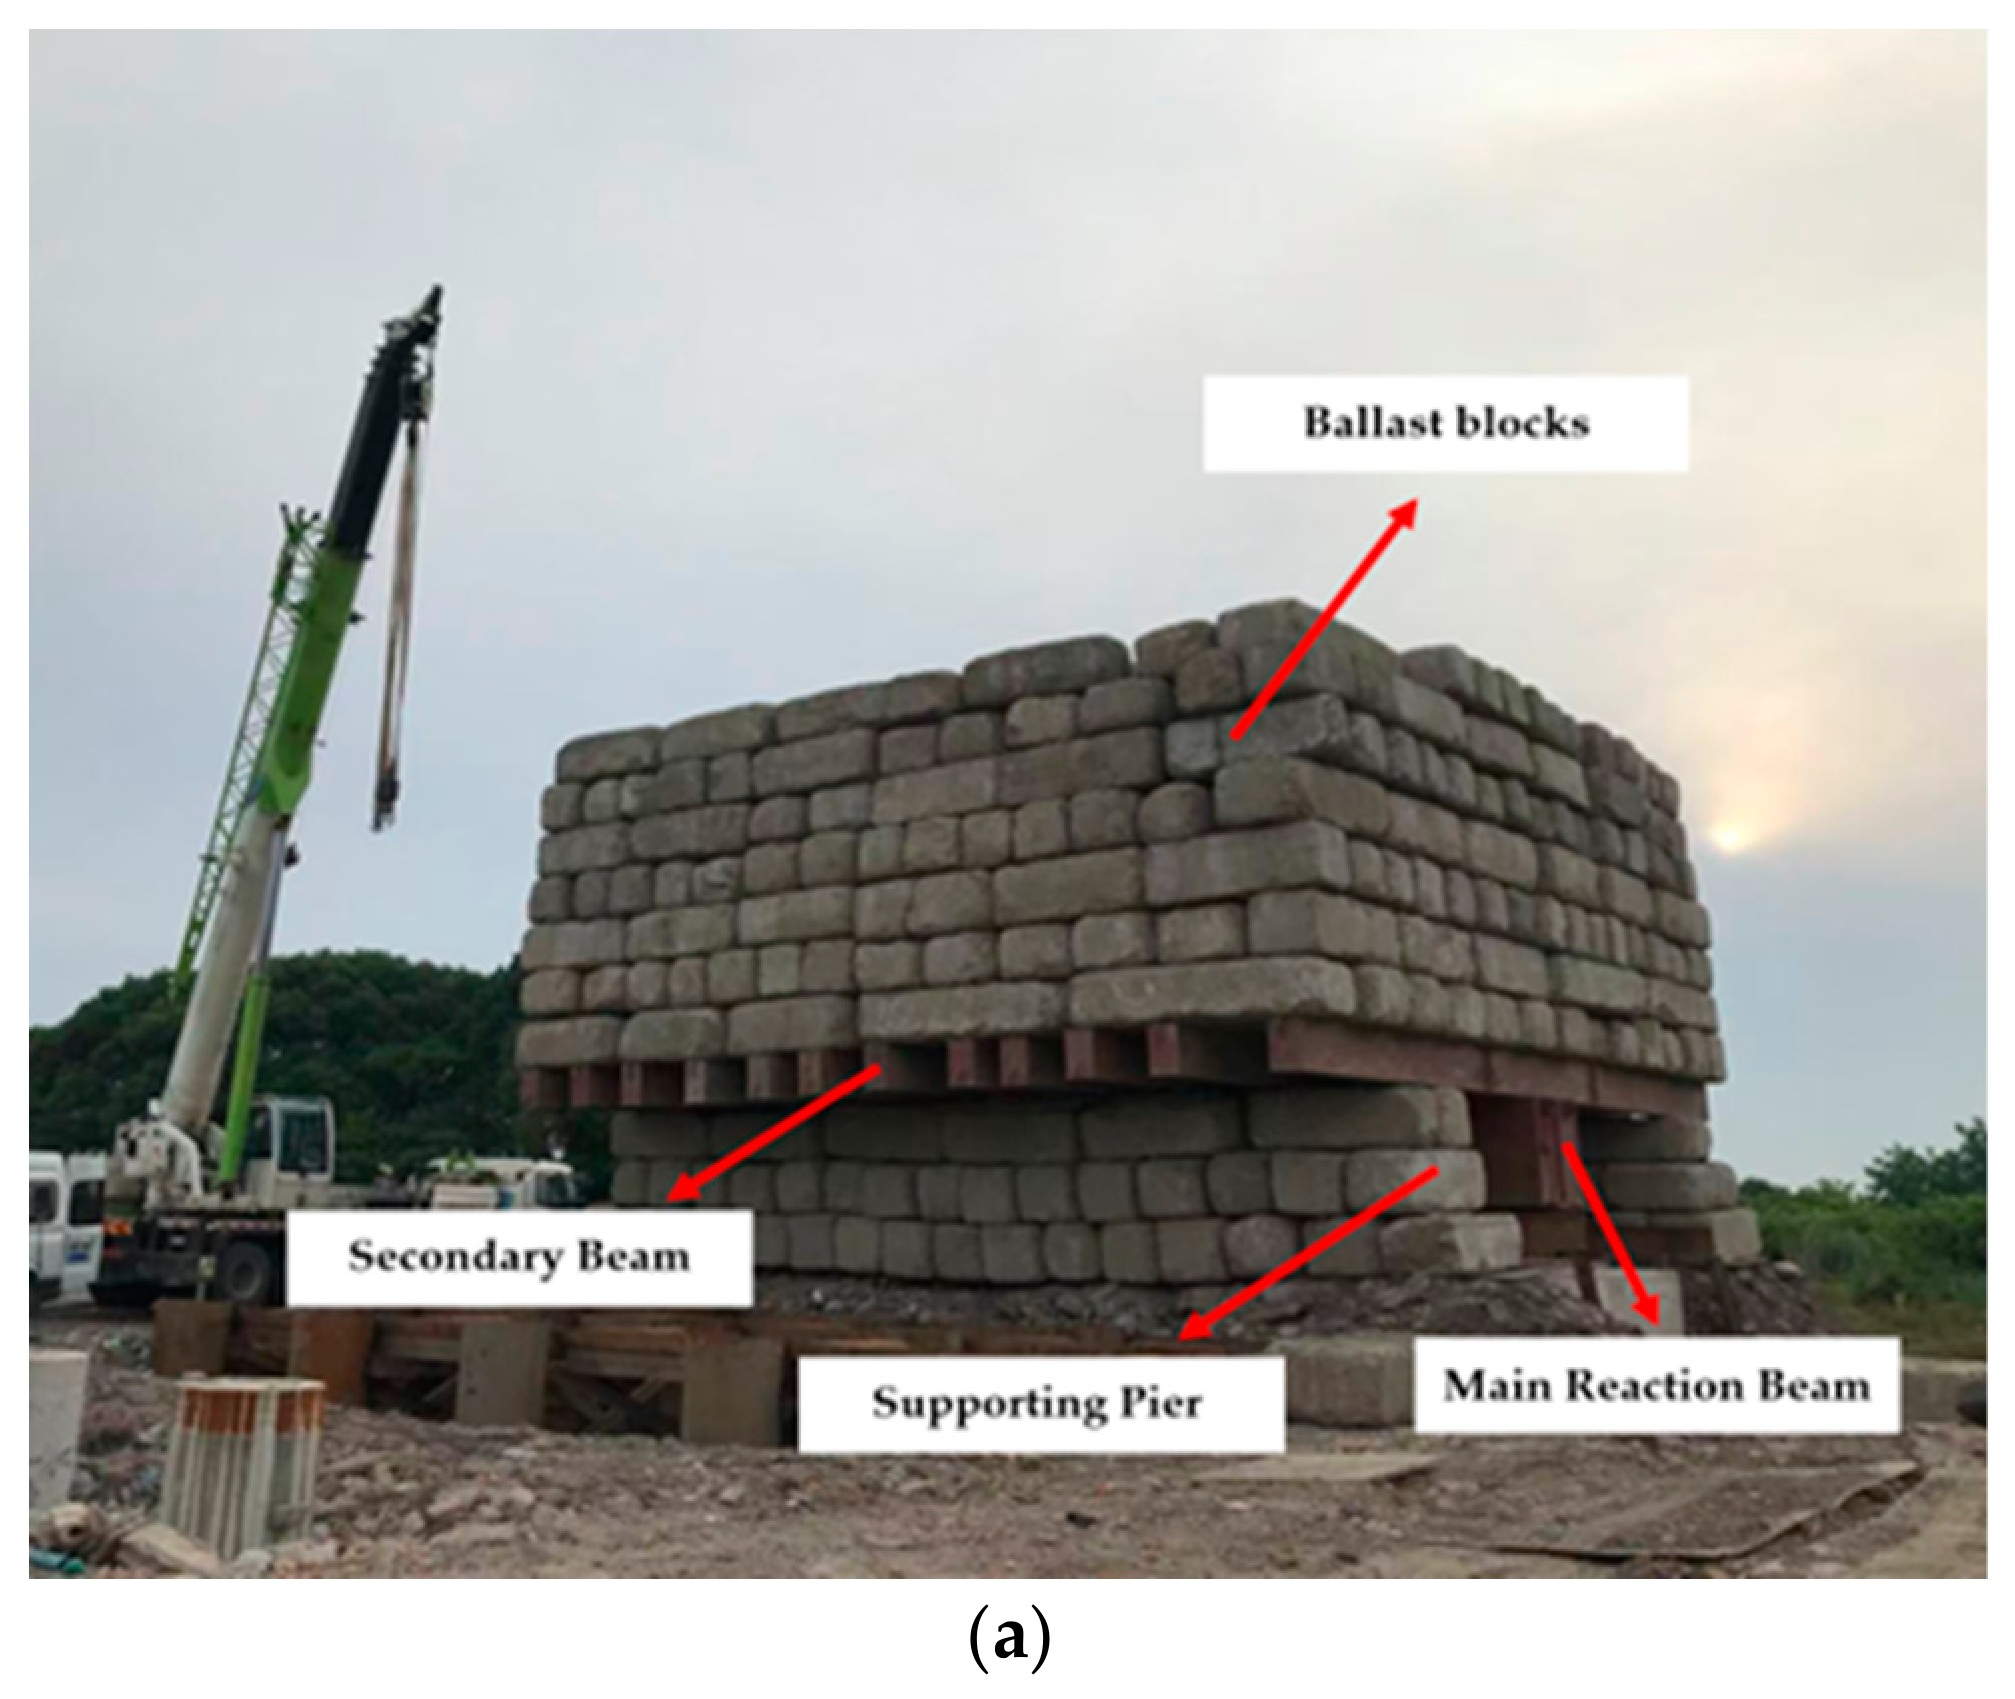
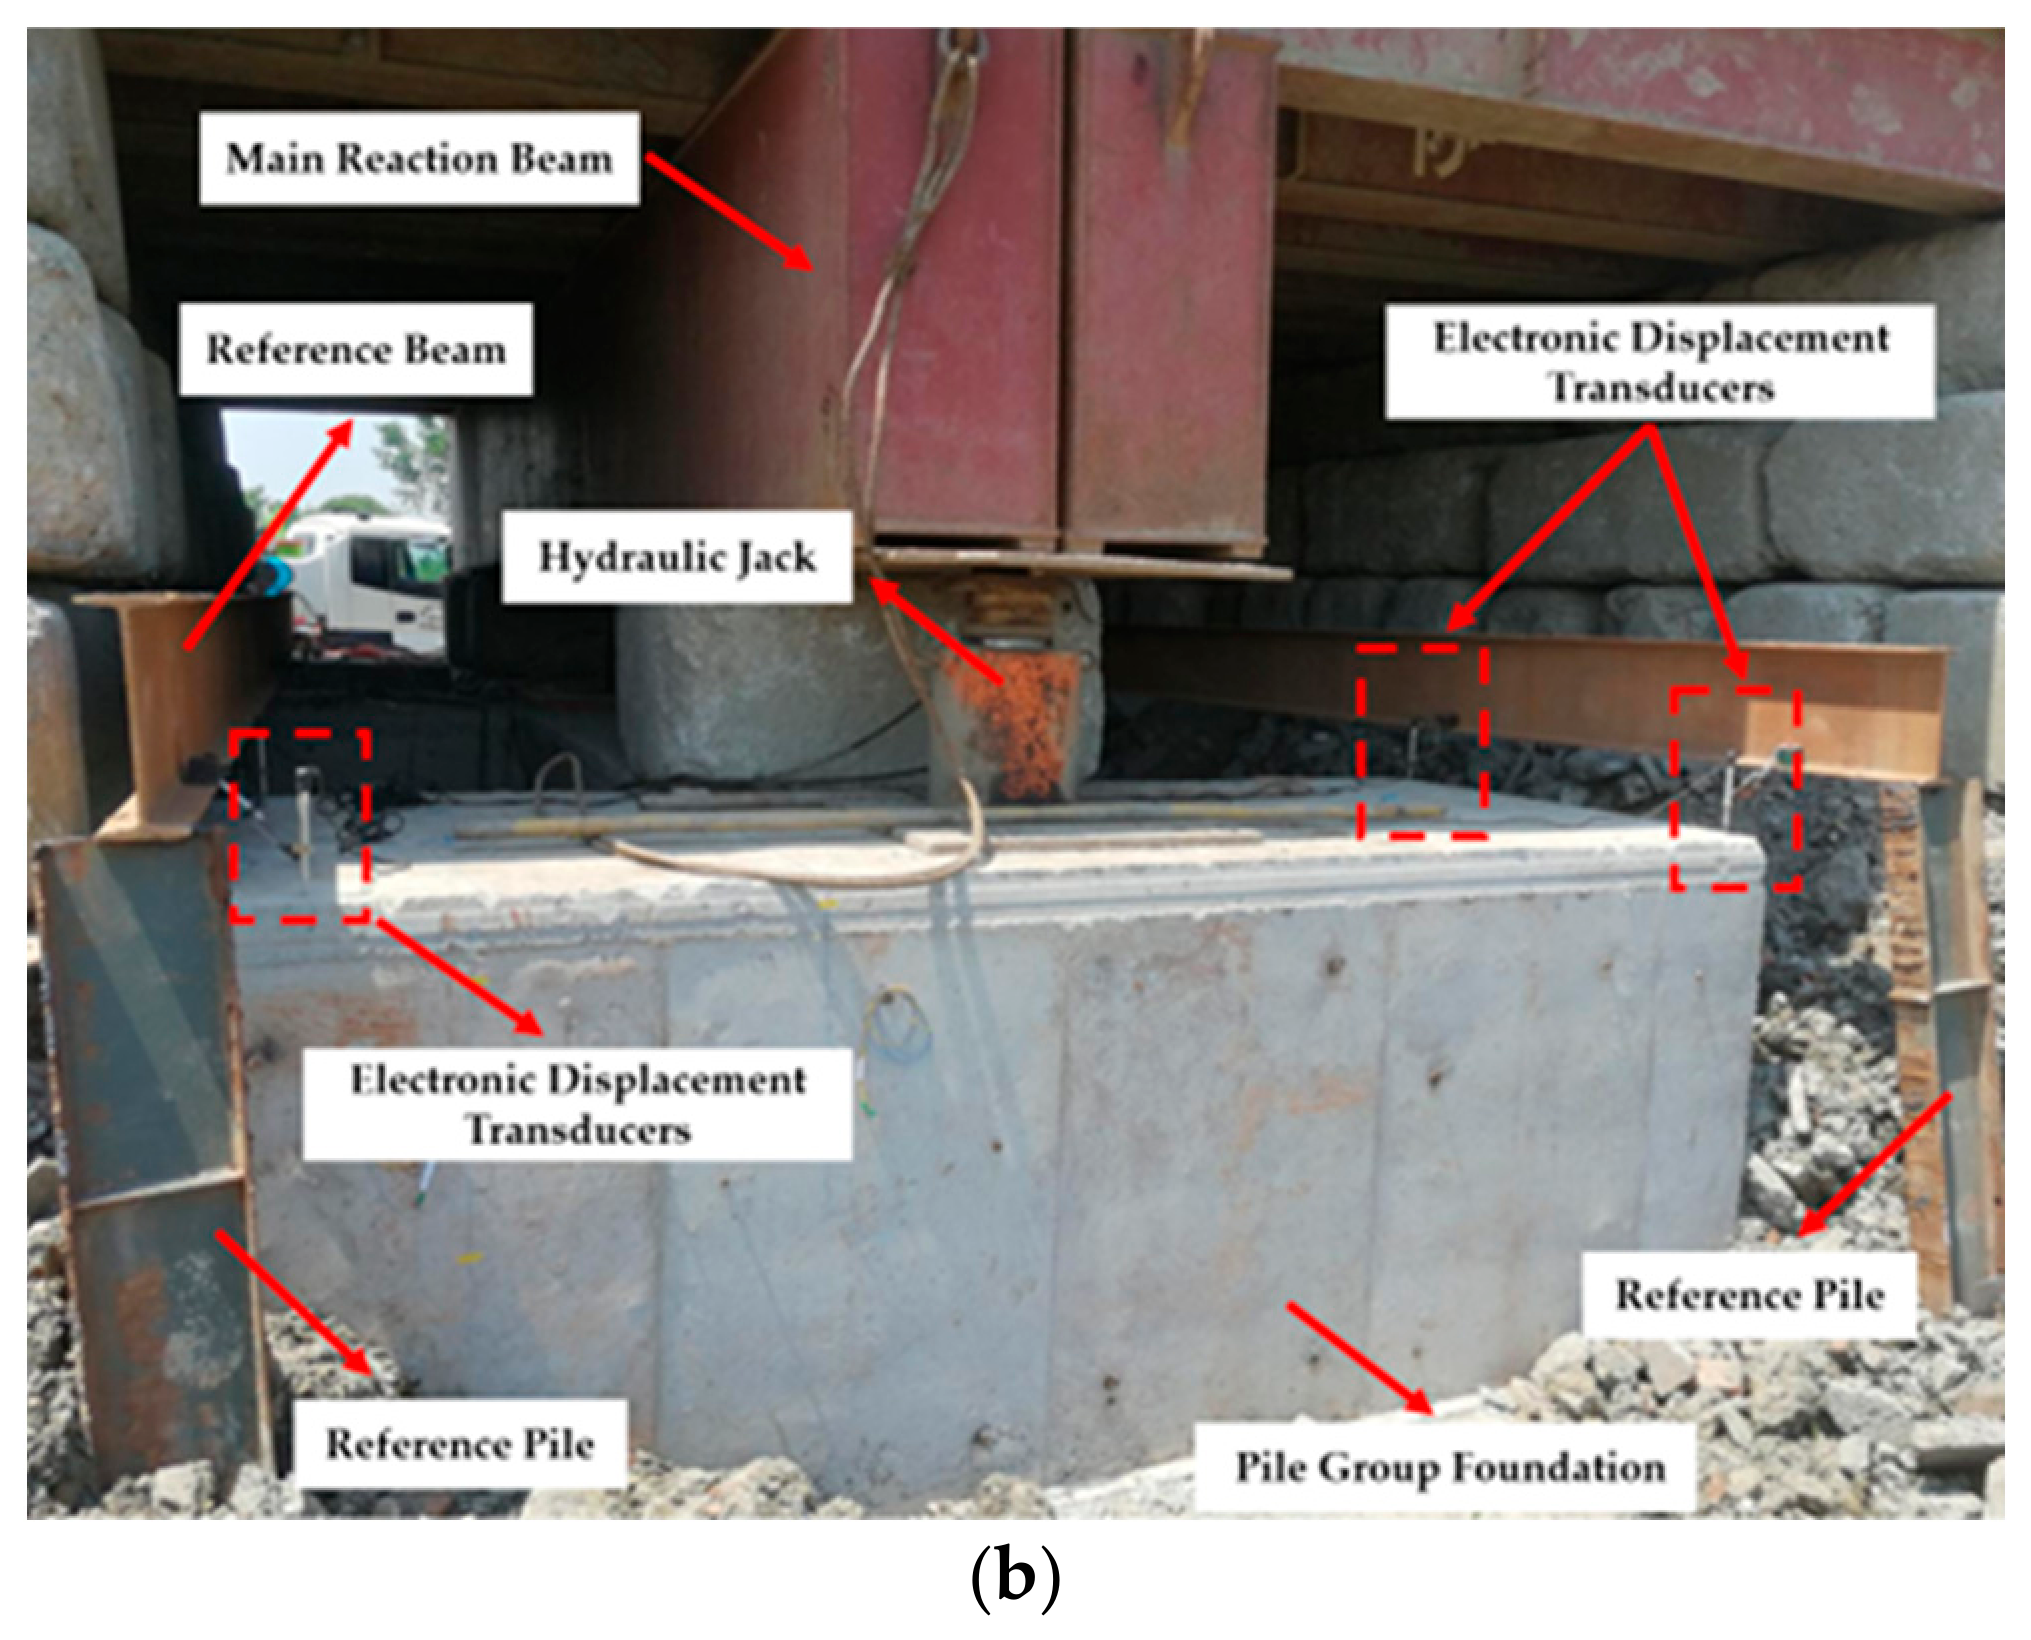
The Wang-shaped pile cap connected the eight piles into an integral foundation; the vertical surcharge loading system for the pile group is shown in Figure 5. In the pile-group vertical loading test, three hydraulic jacks of the same model and specification, manufactured by Nanjing Saibao Hydraulic Equipment Co., Ltd. (Nanjing, China), were used. The resultant line of action coincided with the central axis of the pile-group foundation. All jacks were connected in parallel to the same oil pump through hydraulic pipes, ensuring identical oil pressure and synchronous loading. Two electronic displacement transducers, manufactured by Wuhan Yanhai Engineering Technology Co., Ltd. (Wuhan, China), were installed at the head of each pile from Q1 to Q6 to measure pile-head settlement under vertical surcharge loading. Overall views of the pile-group vertical surcharge loading test and the field arrangement of the displacement transducers are shown in Figure 6a and Figure 6b, respectively. The maximum applied load for the pile-group foundation was 15,000 kN, and the surcharge weight was 18,000 kN, corresponding to 1.2 times the maximum applied load and satisfying the safety reserve requirement for the reaction system specified in the relevant testing standard.
The maximum test loads and surcharge weights for the single piles and pile-group foundation are listed in Table 3. Destructive loading tests were conducted on the single piles to determine their vertical compressive ultimate bearing capacities, whereas the pile-group test was non-destructive and was terminated when the design maximum load of 15,000 kN was reached.
All vertical static loading tests were conducted according to the Technical Specifications for Testing of Foundation Piles in Highway Engineering (JTG/T 3512-2020) [20] using the slow maintained load method. The load increments were 440 kN for piles D1 and D2, 200 kN for pile D3, and 1000 kN for the pile-group foundation. During unloading, the unloading increment at each stage was twice the corresponding loading increment. Loading and unloading were conducted uniformly and continuously without impact, and the load variation during each maintained stage was controlled within ±10% of the specified load increment.
The slow maintained load method, safety reserve of the reaction system, loading/unloading control, settlement observation, and stability criteria adopted in this study satisfy the requirements of JTG/T 3512-2020. Li et al. [4] also adopted the slow maintained load method in field static loading tests of PHC pipe piles, with a loading/unloading procedure comparable to that used in the present study. Shen et al. [21] conducted field vertical static loading tests on bridge pile-group foundations using a test scheme comparable to the pile-group surcharge test adopted herein. These comparisons demonstrate that the principal testing procedures used in the present study are consistent with the current technical standard and established field-testing practice.
Because the pile-group surcharge test involved a large loading magnitude, multiple safety measures were required to ensure the safety of the personnel, equipment, and testing operations. During surcharge placement, the loading rate and loading magnitude specified in the test plan had to be strictly followed to avoid excessive or overly rapid loading, which could cause foundation soil failure due to nonuniform stress or stress concentration. Load and displacement were monitored and adjusted in real time throughout the loading process. Maintaining the stability of the surcharge body was also essential. A level instrument, manufactured by Leica Geosystems AG (Heerbrugg, Switzerland), was used to measure height differences at different parts of the surcharge body, from which the inclination was calculated. Loading was stopped immediately when the inclination exceeded the allowable value, and corresponding reinforcement or adjustment measures were then taken.

3.2. Test Results

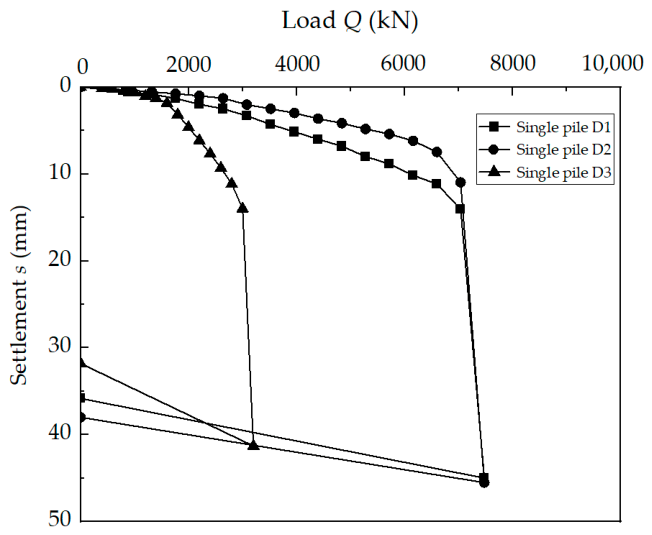
As shown in Figure 7, the Q-s curves of single piles D1, D2, and D3 are all steep-drop curves. According to the Technical Specifications for Testing of Foundation Piles in Highway Engineering (JTG/T 3512-2020) [20], the load corresponding to the beginning of the pronounced steep-drop segment was taken as the ultimate bearing capacity. The vertical compressive ultimate bearing capacities of piles D1 and D2 were both 7040 kN, with corresponding pile-head settlements of 14.07 and 10.96 mm, respectively. The ultimate bearing capacity of pile D3 was 3000 kN, with a corresponding settlement of 13.99 mm. The pronounced steep-drop behavior indicates rapid development of pile-head settlement after the ultimate load is reached.
In contrast, the Q-s curve of the pile-group foundation exhibited a gradual response, as shown in Figure 8. Under the maximum applied load of 15,000 kN, the vertical settlement was only 3.52 mm, and the ultimate bearing state was not reached. This gradual response can mainly be attributed to load sharing among the eight piles connected by the pile cap. The pile–soil–cap interaction reduced the load level carried by each individual pile compared with its single-pile ultimate capacity, and no steep-drop failure occurred within the tested load range.
The pile-head load distribution within the pile group followed the order corner piles > side piles > inner piles. Under the maximum applied load of 15,000 kN, the corner piles (Q1, Q2, Q5, and Q6) carried approximately 2080 kN each (13.9%), the side piles (Q3 and Q4) carried approximately 1930 kN each (12.9%), and the inner piles (Q7 and Q8) carried approximately 1410 kN each (9.4%). This nonuniform load distribution may be attributed to the combined influence of the pile-cap deformation/rotation tendency and pile–soil interaction. Corner piles are farther from the centroid of the pile group and are less influenced by neighboring piles, allowing their shaft resistance to be mobilized more effectively. Shen et al. [21] observed a similar pile-head load distribution in field tests of bridge pile-group foundations. Bach et al. [22] also reported that, in equal-length pile groups, corner-pile loads were approximately 10% higher than side-pile loads and approximately 31% higher than inner-pile loads. Therefore, the load distribution pattern obtained in this study is generally consistent with previously reported observations.
The difference between the single-pile and pile-group responses is primarily associated with their different load-transfer paths. For a single pile, the applied load is directly transferred through the pile shaft and pile tip, whereas in the pile-group foundation, the load is distributed among the individual piles through the pile cap, and the pile–soil–cap system works collectively, resulting in a more complex load-transfer mechanism.

3.3. Test Results of Pile-Shaft Internal Force

Pile-shaft internal-force testing was carried out simultaneously with the vertical static load tests. DY-FBG-SWMR fiber Bragg grating strain sensors (Nanjing Dongya Civil Engineering Instrument Factory, Nanjing, China) were arranged along the pile shaft, and a FBG Sensing Analyzer (Zhixing Technology Nantong Co., Ltd., Nantong, China) was used to record strain data. Before pile driving, the DY-FBG-SWMR fiber sensors were installed by cutting surface grooves to ensure that the fiber gratings remained intact during pile installation.
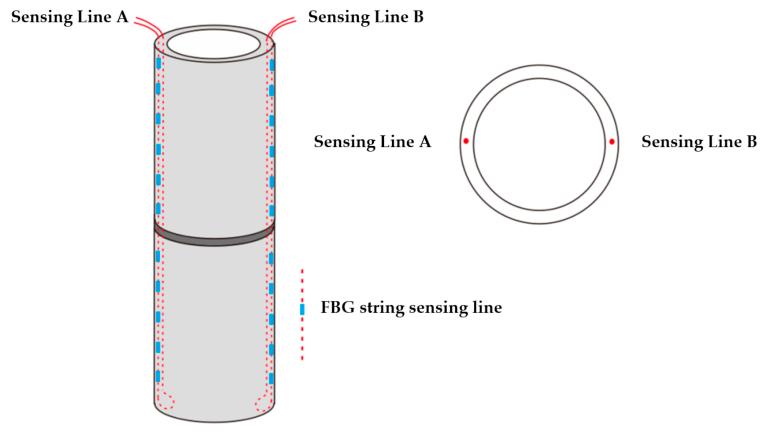
Different sensor layouts were adopted for different pile types. In the single-pile tests, sensors were installed at a dense spacing of 0.8 m within the 0–16 m depth range of the 49 m piles and at a standard spacing of 3 m within the 16–49 m depth range. For the 32 m single pile, the standard spacing of 3 m was adopted over the full pile length. In the pile-group test, the layout principle for the 32 m piles was the same as that used for the 49 m single piles. The sensor layout is shown in Figure 9.
The data acquired by the fiber-optic strain sensors were recorded as wavelength variations. When the fiber-optic strain sensor was subjected to strain, its wavelength changed accordingly. The strain was calculated as:
ε = [ λ λ 0 ( λ t λ t ' ) × 1 a × b ] K
where λ is the measured wavelength of the strain grating (nm); λ0 is its initial wavelength (nm); λt is the measured wavelength of the temperature compensation grating (nm); λt’ is its initial wavelength (nm); a is the temperature sensitivity coefficient of the temperature compensation grating, with a factory-calibrated value of 0.011051 nm/°C; b is the temperature sensitivity coefficient of the strain-measuring grating, with a factory-calibrated value of 0.016498 nm/°C; K is the first-order strain coefficient, with a factory-calibrated value of 0.000716 nm/με.
The arithmetic mean of the strain measurements from all sensing lines at the same cross section was taken as the representative strain of that section. In addition, because variations in ambient temperature may affect measurement accuracy, self-temperature compensation of the FBG sensors was adopted. According to Equation (1), the wavelength variation measured by the temperature compensation grating was converted using the sensitivity ratio b/a and subtracted from the measured wavelength variation of the strain grating, thereby minimizing the influence of temperature variation on the calculated strain. Isolated abnormal points in the raw strain data were excluded and replaced by linear interpolation between adjacent valid measurements.
Because the optical fibers were fixed to the pile surface, their axial deformation under static loading was assumed to be consistent with the axial deformation of the pile shaft (ε(Z)). Therefore, the axial stress of the pile at depth (σ(Z)) can be expressed as:
σ ( Z ) = ε ( Z ) E c
where Ec is the elastic modulus of the PHC pipe pile, taken as 38 GPa.
The axial force of the pile at depth Q(Z) is then:
Q ( Z ) = σ ( Z ) A
where A is the pile cross-sectional area, taken as 0.274 m2.
The fundamental differential equation governing load transfer along the pile shaft is:
q s ( Z ) = 1 U d Q ( Z ) d Z
where qs(Z) is the distributed shaft resistance (kPa); Q(Z) is the pile axial force (kN); U is the pile perimeter, taken as 2.5 m. For two adjacent instrumented sections within the same soil layer, Equation (4) can be expressed in finite-difference form as:
q s ( Z ) = 1 U Δ Q ( Z ) Δ Z
where ΔQ(Z) is the change in axial force between two pile sections within the soil layer, and ΔZ is the corresponding difference in depth.
Substituting Equations (2) and (3) into Equation (5) gives:
q s ( Z ) = 1 U Δ Q ( Z ) Δ Z = 1 U Δ σ A Δ Z = A U Δ ε E Δ Z = A E U Δ ε Δ Z
where Δε is the change in axial strain between the two pile sections.
The pile-head axial force obtained from Equation (3) was used to determine the load carried by each instrumented pile within the pile group. The pile-head load percentage of an individual pile was calculated as the ratio of its pile-head axial force to the total applied load on the pile-group foundation.
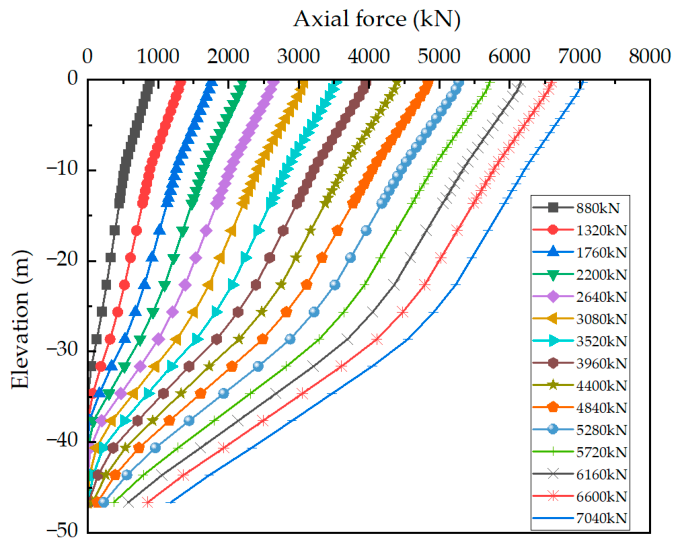
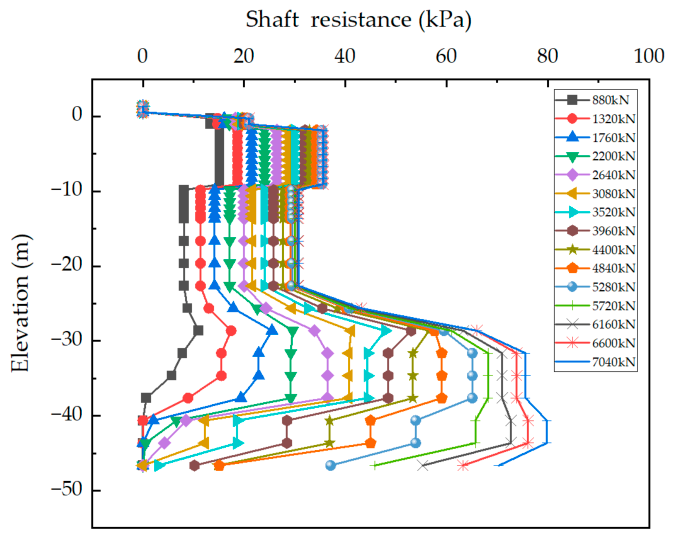
Pile-shaft internal-force measurements were conducted simultaneously with the vertical static loading tests, and FBG wavelength data were collected during the maintained period of each applied load stage. The measured wavelength data were first converted into strain using Equation (1), after which the pile axial force and shaft resistance were calculated according to Equations (2)–(6). For pile D1, the results presented in Figure 10 and Figure 11 correspond to 15 displayed load levels ranging from 880 to 7040 kN at intervals of 440 kN. Each curve in Figure 10 represents the axial-force distribution along the pile shaft at a specified load level. As shown in Figure 10, the axial force of pile D1 decreases continuously with depth. At the initial loading stage, the pile-head load is mainly transferred through axial deformation of the pile shaft. With increasing load, shaft resistance is progressively mobilized along the pile–soil interface and propagates downward along the pile shaft, eventually mobilizing pile-tip resistance. The corresponding shaft resistance distributions at the same load levels are shown in Figure 11.
The proportions of shaft resistance and pile-tip resistance for single piles D1, D2 and D3 and for the piles in the pile group are listed in Table 4 and Table 5. The internal-force test results indicate that the pile-head load of each pile is mainly resisted by shaft resistance, and all piles exhibit friction-pile behavior.

4. Theoretical Analysis

4.1. Calculation of Vertical Bearing Characteristics of Single Piles

For single-pile foundations, the load-transfer method was used for iterative calculation based on the API model and hyperbolic model to analyze vertically loaded single piles. The calculation procedure of the load-transfer method is as follows: (1) divide the pile foundation into layers according to geological conditions and further discretize each soil layer into calculation units to ensure calculation accuracy; (2) calculate the shaft resistance of each unit according to the pile–soil interaction mechanism; (3) determine the pile-tip resistance according to the bearing characteristics of the soil layer; (4) calculate the axial compression deformation of each unit using the elastic deformation theory of pile materials and sum the deformation to obtain the total pile-head settlement; and (5) use an iterative solution procedure to adjust the calculated results until the settlement change is smaller than the prescribed convergence tolerance.

4.1.1. API Model

The load-transfer method focuses on the nonlinear coupled response between pile–soil interface shaft resistance and pile-tip resistance. The mechanical evolution is described by the shear stress–displacement (tau-z) relationship and end resistance–settlement (sigma-sb) characteristic curve. In the API method [23], the ratio of tau to tau_max is taken as the ordinate of the shaft resistance mobilization function, and the abscissa is normalized by the critical displacement corresponding to full mobilization of ultimate shaft resistance, equal to 0.01 times the pile diameter. For clay, shear softening is considered. A linear strength reduction algorithm is adopted within the displacement range of 0.01–0.02 times the pile diameter, and softening coefficients of 0.7–0.9 are used to represent the transition to the residual-strength stage. Equations (7)–(9) give the shaft resistance mobilization functions for different softening coefficients:
Softening coefficient of 0.9:
τ / τ max = 609691 ( z / d ) 3 16943 ( z / d ) 2 + 208.38 ( z / d ) + 0.002 , z / d < 0.01 τ / τ max = 10 ( z / d ) + 1.1 ,   0.01 < z / d < 0.02 τ / τ max = 0.9 , z / d > 0.02
Softening coefficient of 0.8:
τ / τ max = 609691 ( z / d ) 3 16943 ( z / d ) 2 + 208.38 ( z / d ) + 0.002 , z / d < 0.01 τ / τ max = 20 ( z / d ) + 1.2 ,   0.01 < z / d < 0.02 τ / τ max = 0.8 , z / d > 0.02
Softening coefficient of 0.7:
τ / τ max = 609691 ( z / d ) 3 16943 ( z / d ) 2 + 208.38 ( z / d ) + 0.002 , z / d < 0.01 τ / τ max = 30 ( z / d ) + 1.3 ,   0.01 < z / d < 0.02 τ / τ max = 0.7 , z / d > 0.02
Similarly, Equation (10) presents the pile-tip resistance mobilization function. The ratio of σ to σmax is used as the ordinate of the function, and a displacement equal to 0.1 times the pile diameter is taken as the displacement required for full mobilization of ultimate tip resistance. For convenient calculation, the tabulated data points are fitted using a polynomial, as shown in Equation (10):
σ / σ max = 82809 ( s b / d ) 4   +   19060 ( s b / d ) 3 1501.9 ( s b / d ) 2   +     51.729 ( s b / d )   +   0.0662 , s b / d < 0.1 σ / σ max = 1 ,   s b / d > 0.1
The values of τmax for each soil layer and σmax for the pile-tip bearing layer were determined from the relevant geotechnical design parameters provided in the investigation report. Here, z is the depth of the calculation point (m), and d is the pile diameter, equal to 0.8 m in the present tests.

4.1.2. Hyperbolic Model

Based on the studies of Yu Qingquan [24] and Dai and Gong [25], the hyperbolic model was selected to investigate the vertical bearing characteristics of single piles. The backbone functions of the hyperbolic model are expressed as follows:
τ = s a + bs
σ = s b a b + b b s b
where τ is the shaft resistance of the pile; s is the displacement of the pile shaft at depth z, mm; σ is the pile-tip resistance; sb is the pile-tip displacement; and a, b, ab, and bb are the backbone-function parameters.
The relationships between the key parameters (a, b, ab, and bb) in the hyperbolic model and the geotechnical test parameters are given as follows [24]:
a = 2 Rln r m / R ( 1 + v ) β s E s 0.1 0.2
where R is the pile radius (m), taken as 0.4 m; rm is the influence radius of pile-side shear stress (m), taken as 20R, i.e., 8 m; v is Poisson’s ratio; and Es0.1–0.2 is the soil compression modulus corresponding to a stress range of 0.1–0.2 MPa. The values of v and Es0.1–0.2 for each soil layer were obtained from the geotechnical investigation report. βs is a dimensionless modulus ratio coefficient related to soil properties, pile length, and pile diameter and is determined from Equation (14):
β s = c β tg   φ   γ   L 20
where cβ is a dimensionless correlation coefficient ranging from 0.3 to 1.0, with larger values generally adopted for better soil conditions; φ′ is the effective friction angle of the soil; γ′ is the effective unit weight of the soil (kN/m3); and L is the embedded pile length (m). In this study, L = 49 m for piles D1 and D2 and L = 32 m for pile D3.
b = 1 τ su = 1 2.589 h 0.543 β σ v
where h is the soil burial depth (m); β is a coefficient with a statistical range of 0.2–0.4 and an average value of 0.32; and σv′ is the average effective vertical stress of the corresponding soil layer (kPa), evaluated using the effective vertical stress at the midpoint of that layer.
a b = 2 Rln r m / R ( 1 + v ) k b β s E s 0.1 0.2
where kb is the initial stiffness ratio between pile-tip soil and pile-side soil, ranging from 3 to 7.
b b = 1 m 0 σ 0 1 + k L d
where m0 is the working coefficient, taken as 0.3; [σ0] is the allowable bearing capacity of the pile-tip soil, taken as 200 kPa for the 49 m piles terminating in Layer ⑥1 and as 140 kPa for the 32 m pile terminating in Layer 1 1 ; k is the correction coefficient, taken as 0.06; L is the pile length, taken as 49, 49, and 32 m for D1, D2, and D3, respectively; and d is the pile diameter, taken as 0.8 m.

4.1.3. Comparison Between Calculated and Measured Results

The key parameters (a, b, ab, and bb) of the hyperbolic model for single piles D1, D2, and D3 were calculated using Equations (13)–(17), and the corresponding values are listed in Table 6 and Table 7. As shown in the tables, the key parameters adopted for pile D3 differ to some extent from those adopted for piles D1 and D2. Although the three test piles refer to the same reference borehole and have the same stratigraphic profiles, their different pile lengths result in different calculation depths for the soil layers along the pile shaft and consequently different average effective stress levels, leading to different calculated values of parameter b. In addition, piles D1 and D2 and pile D3 terminate in different bearing strata, resulting in different values of parameters ab and bb. Equations (13)–(17) directly relate the hyperbolic-model parameters to the geotechnical design parameters of the corresponding soil layers; therefore, these differences quantitatively reflect the effects of pile length and pile-tip bearing conditions.
For parameter calibration, theoretical Q-s curves were calculated using different candidate parameter values and compared with the measured response. The relative error between the calculated and measured ultimate bearing capacities was used as the primary quantitative criterion for parameter selection, while the agreement between the calculated and measured Q-s curves throughout the loading process was used as an additional check. The calculated bearing capacity was taken as the load corresponding to the loading stage immediately preceding that at which the theoretical settlement reached 40 mm. Table 8 summarizes the comparison between the API-model calculations and the measured bearing capacities. Based on these results, the optimal API softening coefficients for the 49 m piles D1/D2 and the 32 m pile D3 were determined as 0.9 and 0.8, respectively.
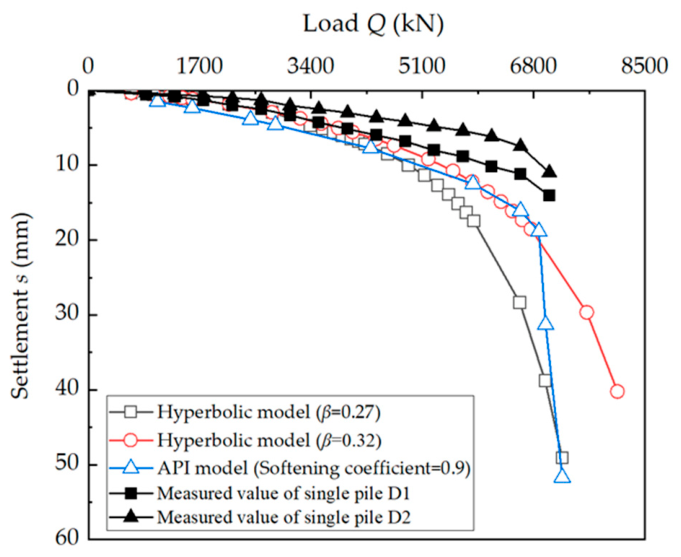
For the 49 m single piles (D1 and D2), the comparison between the calculated and measured bearing capacities is shown in Figure 12. When the API-model softening coefficient was 0.9, the calculated ultimate bearing capacity was 6984 kN, corresponding to an error of only −0.80% relative to the measured value of 7040 kN. For the hyperbolic model, reducing the shaft resistance parameter (β) from 0.32 to 0.27 changed the calculated bearing capacity from 7611 kN to 6977 kN and reduced the relative error from 8.11% to −0.89%.
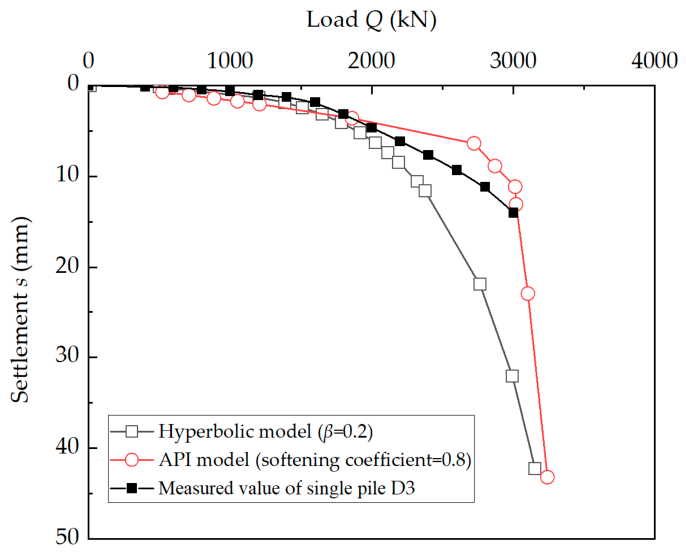
For the 32 m single pile D3, the measured ultimate bearing capacity was 3000 kN, as shown in Figure 13. When the API-model softening coefficient was 0.8, the calculated ultimate bearing capacity was 3102 kN, corresponding to an error of 3.40%, and the calculated Q-s curve showed reasonable agreement with the measured steep-drop trend. For the hyperbolic model, when the shaft resistance parameter (β) was calibrated to 0.20, the calculated ultimate bearing capacity was approximately 2993 kN, corresponding to an error of only −0.23%.
Overall, the calibrated parameters provide reasonable predictions of both the bearing capacity and load–settlement response. The API model shows an advantage in representing the backbone curve and performs well near the steep-drop segment of the Q-s curve, whereas the hyperbolic model predicts the initial stiffness more accurately and performs better under relatively low load levels. In addition, both the API softening coefficient and hyperbolic-model shaft resistance parameter (β) represent reductions in pile shaft resistance. The theoretical results indicate that, even under the same site conditions, the required shaft resistance reduction varies with pile length, with a greater reduction being required for shorter piles.

4.2. Calculation of Vertical Bearing Characteristics of Pile Groups

4.2.1. Combined Equivalent-Pier and Load-Transfer Method

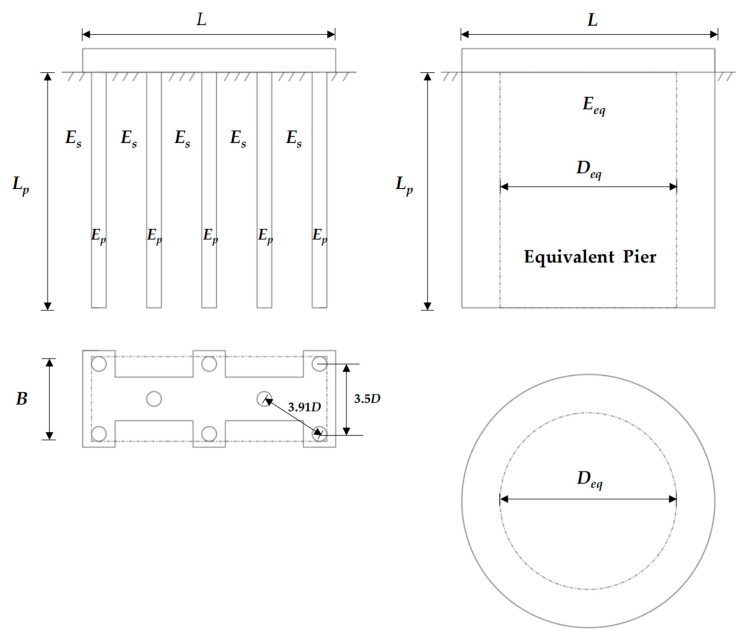
The equivalent-pier method, also known as the solid deep foundation method, treats a pile group as an equivalent large-diameter single pile or pier and predicts the vertical bearing characteristics of the pile group using the single-pile load-transfer method. During the equivalence process, however, the pile-group parameters, cap geometry, construction method, geological conditions, and load level may all influence the calculation. In practical applications, these factors are difficult to consider comprehensively and therefore must be simplified appropriately [24].
Poulos et al. [26] proposed a criterion for assessing the applicability of the equivalent-pier method. According to this method, when the equivalent-pier index (R) related to the pile-group geometry is less than 4, the pile group may be treated as an equivalent pier. When R is less than 2, this equivalence is more suitable. The criterion is expressed as follows:
R = BL L p   or   R = n S a L p
where R is the equivalent-pier index; B is the width of the pile-group layout area, which is 3.6 m in this test; L is the length of the pile-group layout area, which is 11.2 m; Lp is the pile length, which is 32 m; n is the number of piles in the group, which is 8; and Sa is the pile spacing, which is 3.5D or 3.91D in this test.
The calculated equivalent-pier index in this test is R = 0.198 < 2, indicating a highly applicable condition. Therefore, the equivalent-pier method can be adopted. Figure 14 shows the equivalent-pier method. In the figure, Deq is the equivalent-pier diameter and Eeq is the elastic modulus of the equivalent pier, which are calculated using Equations (19) and (20), respectively:
D eq = A s L p × π
E eq = E s + E p E s A tp A g
where Lp is the pile length. The pile length of the pile-group foundation is 32 m. Because the test piles exhibit clear friction-pile bearing behavior, Deq is determined by the equivalent side area and is taken as 6.4 m. Es is the compression modulus of the soil; Ep is the elastic modulus of the pile; Atp is the total pile area; and Ag is the area of the equivalent pier. Es is estimated using the formula recommended in the Standard for Geotechnical Investigation of Tall Buildings [27]:
E s = 3.3 p s + 3.2
where ps is the cone resistance measured by static cone penetration testing. The resulting equivalent elastic modulus (Eeq) is 4.757 × 10⁶ kPa.
Based on the study of Yu Qingquan [24], the mobilization parameters a, b, ab, and bb of the single-pile load-transfer function were retained. The initial stiffness at the pile–soil interface and the settlement deformation parameters were modified, and an exponential correction expression considering size effects was established as follows:
K gi = K i D D eq β
where Kgi is the initial tangent stiffness at the interface between the equivalent pier and the ith soil layer; Ki is the initial tangent stiffness at the interface between the single pile and the ith soil layer; D is the single-pile diameter; Deq is the equivalent-pier diameter; and β is the reduction coefficient for initial tangent stiffness.
s g = s D D eq g
where sg is the settlement of the equivalent pier; s is the settlement of the single pile; and g is the settlement reduction coefficient. In the above equation, β ranges from 0 to 1 and represents a reduction correction of initial stiffness, while the negative sign before exponent g indicates settlement amplification.
In a pile-group system, stress superposition in the soil between piles may reduce the bearing capacity of individual piles and increase settlement. The reduction coefficients beta and g are introduced after considering the group effect and are used to simplify and correct the calculation results, thereby more accurately representing the actual working state of the pile group.
For these two parameters, Yu Qingquan [24] proposed empirical formulas based on regression of test results:
β = 0.18 ln A tp A g + 0.57
g = 0.0188 A tp A g 1.5 λ 50
where λ denotes the slenderness ratio, and the remaining parameters are the same as those in Equation (20).

4.2.2. Comparison Between Calculated and Measured Results

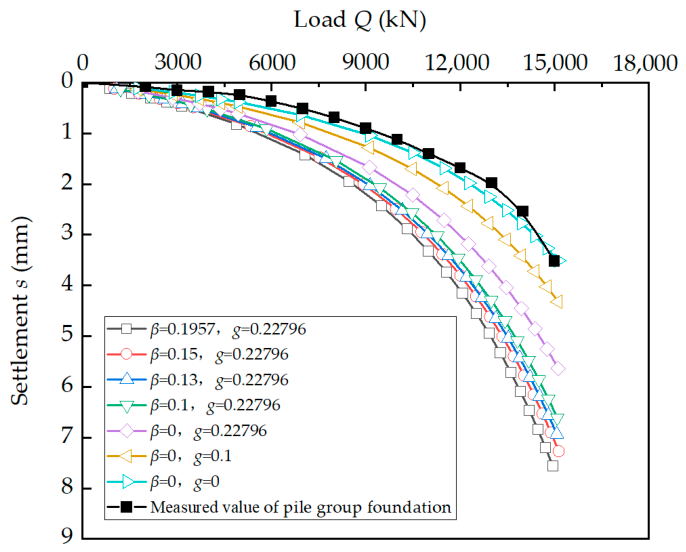
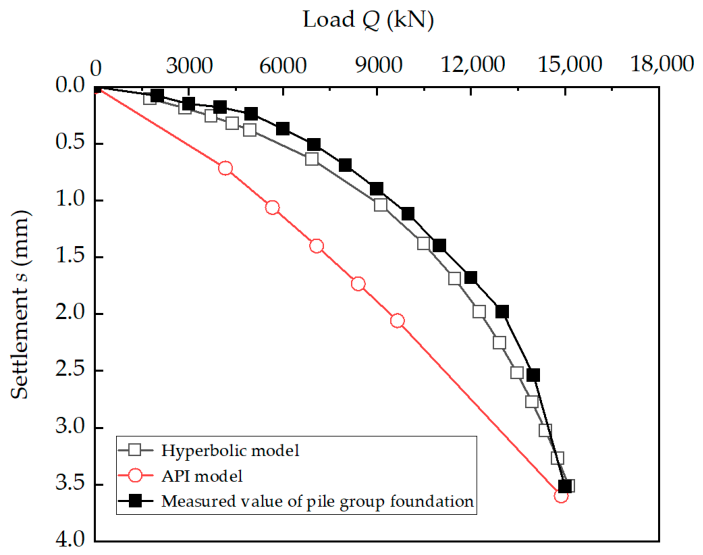
The calculated results for the pile-group foundation using the combined equivalent-pier and load-transfer method are shown in Figure 15. According to Equations (24) and (25), beta is 0.1957 and g is 0.22796. When the applied load reaches 15,000 kN, the calculated settlement is approximately 7.56 mm, which is 114.8% greater than the measured value of 3.52 mm. Further analysis shows that as the reduction coefficient beta gradually decreases, the calculated and measured results slowly converge and the error decreases accordingly. If the reduction effect of the pile group is ignored, i.e., beta and g are both set to 0, the calculated and measured results for the pile-group foundation are already very close, with an error not exceeding 7.8%.
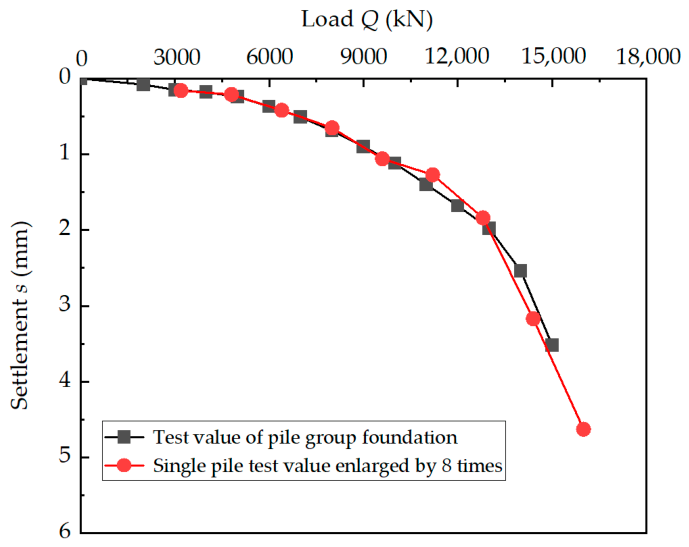
To further verify the influence of the group effect in the vertical static load test of the pile-group foundation, the measured Q-s curve of the 32 m single pile D3 was used as the basis. Its bearing capacity was multiplied by 8, corresponding to the number of piles in the group, and then compared with the measured Q-s curve of the pile group. The results are shown in Figure 16. The comparison clearly shows that the single-pile Q-s curve after eightfold amplification almost coincides with the pile-group Q-s curve. This indicates that, under vertical loading, the working mode of each pile within the group is essentially the same as that of a single pile. Therefore, the group effect of this pile group can be inferred to be very weak. Both the theoretical analysis and measured results indicate that no significant group effect occurred in this pile group within the load level of 15,000 kN. The weak group effect may be related to two factors: first, the pile spacing was relatively large and the load level was relatively low; second, the driving of PHC pipe piles induced a soil displacement effect.
During the driving of PHC pipe piles, the surrounding soil is subjected to strong lateral compression, which increases soil density, reduces void ratio, and enhances the shear strength of the pile-surrounding soil. This process increases the pile shaft resistance, improves the bearing capacity of single piles, and may also affect the load-transfer characteristics of the pile group. Meanwhile, the compaction effect generated by each pile may enhance the bearing capacity of the soil between piles, weaken negative skin friction between piles, and increase the overall stiffness of the pile group. In general, because of stress superposition in the soil between piles, the bearing capacity of a pile-group foundation is lower than the sum of the single-pile bearing capacities. In this test, however, the soil displacement effect of the PHC pipe piles may have densified the soil between piles and thereby weakened the group effect, causing the load–settlement curve of the pile group to approach the superposed single-pile result.
Without considering the group effect, the API model with a softening coefficient of 0.8 and the hyperbolic model were combined with the equivalent-pier method to obtain the calculated results for the pile group, as shown in Figure 17. The comparison indicates that the hyperbolic model predicts the settlement of the pile group under the 15,000 kN load more accurately. Under low-load conditions, the API model underestimates the initial stiffness, resulting in a relatively large discrepancy between the calculated and measured results. In contrast, the hyperbolic model performs better under this condition and more accurately reflects the actual response. This observation is consistent with the behavior of the two models in single-pile prediction; that is, the hyperbolic model has stronger applicability and accuracy than the API model under low-load conditions.

4.3. Discussion

It should be noted that the theoretical calculation methods examined in this study were evaluated using static loading test data obtained from a level site and are therefore applicable to the analysis of the vertical bearing behavior of single piles and pile groups under similar site conditions. Their applicability to pile foundations on slopes requires further validation. In addition, the present study did not consider the effects of seasonal temperature and moisture variations on pile–soil interface behavior, the interaction between horizontal loading and vertical bearing response, or differential deformation within pile groups caused by freeze–thaw cycles. The effects of these environmental and loading factors on the long-term performance of PHC pipe pile foundations, as well as the variation in pile-group effects under different load levels, pile spacings, and ground conditions, require further investigation.

5. Conclusions

The field tests and theoretical analyses conducted in this study provide field evidence of the vertical bearing performance and load-transfer behavior of PHC pipe pile groups with a Wang-shaped irregular pile cap. The results provide an engineering reference for the analysis, design, and application of PHC pipe pile foundations in highway bridge engineering. The main conclusions are as follows:
(1)
The Q-s curves of single piles D1, D2, and D3 are steep-drop curves. The vertical compressive ultimate bearing capacities of single piles D1 and D2 are both 7040 kN, and that of single pile D3 is 3000 kN. The pile-group foundation did not reach the ultimate bearing state under the maximum applied load of 15,000 kN.
(2)
In the vertically loaded pile-group foundation, the pile-head load distribution follows the pattern corner piles > side piles > inner piles.
(3)
The pile-shaft internal-force test results for the single piles and pile group show that the pile-head load of each pile is mainly carried by shaft resistance, and all piles exhibit friction-pile bearing behavior.
(4)
For single-pile foundations, the API model has a pronounced advantage in backbone curve representation and is more applicable near the steep-drop segment of the Q-s curve. The hyperbolic model predicts the initial stiffness more accurately and performs better than the API model under low-load conditions. In addition, single piles of different lengths at the same site require different side-resistance reduction coefficients, and greater side-resistance reduction should be applied to shorter piles.
(5)
For the pile-group foundation, the combined equivalent-pier and load-transfer method shows good applicability. The sensitivity analysis of the group stiffness correction coefficient and settlement correction coefficient indicates that, within the tested load range (up to 15,000 kN) and under the specific pile spacing and ground conditions considered in this study, no pronounced pile-group effect was observed. The pile-group effect under higher load levels, smaller pile spacing, or different ground conditions requires further investigation.

Author Contributions

Conceptualization, W.G.; methodology, W.G.; investigation, T.W.; resources, Y.X.; data curation, W.H. and K.S.; writing—original draft preparation, J.Y.; writing—review and editing, B.W.; supervision, L.H.; project administration, Y.S.; funding acquisition, M.H. and H.F. All authors have read and agreed to the published version of the manuscript.

Funding

This research was funded by the Department of Transport of Zhejiang Province under Project No. 2023-GCKY-01, titled “Key Technology Research on Application of Prestressed Concrete Pipe Piles in Highway Bridges”, with a total funding of 2.6 million RMB, all self-financed, of which Huzhou Xunsu Expressway Co., Ltd. contributed 2.0 million, Zhejiang Jiaogong Group Co., Ltd. contributed 0.3 million, and Jianhua Building Materials (China) Co., Ltd. contributed 0.3 million.

Data Availability Statement

Data are contained within the article.

Acknowledgments

The authors have reviewed and edited the output and take full responsibility for the content of this publication.

Conflicts of Interest

Authors Yi Sun, Yunfei Xia, Weichao He and Tao Wu were employed by the company Huzhou Xunsu Expressway Co., Ltd. Author Leilei Huang was employed by the company Zhejiang Highway and Water Transport Engineering Consulting Group Co., Ltd. Authors Meng Hua and Hang Fan were employed by the company Zhejiang Provincial Communications Group Testing Technology Co., Ltd. Author Bochen Wang was employed by the company China Energy Engineering Group Jiangsu Power Design Institute Co., Ltd. Authors Jie Yin and Kaiyue Su were employed by the company Nanjing Dongda Self-Balanced Pile Foundation Testing Co., Ltd. The remaining author declares that the research was conducted in the absence of any commercial or financial relationships that could be construed as potential conflicts of interest.

References

  1. Fu, L.; Bai, X.; Zhang, Y.; Xu, F.; Hu, J.; Ma, F.; Yan, N. Comparative study on bearing performance of PHC pipe piles and cast-in-place piles in complex coastal strata. J. Shandong Agric. Univ. (Nat. Sci. Ed.) 2025, 56, 495–504. [Google Scholar]
  2. Yu, W. Vertical bearing characteristics and stability of PHC pipe piles for pile-cap foundations. J. Water Resour. Archit. Eng. 2026, 24, 50–56. [Google Scholar]
  3. Shao, G.; Fu, T.; Jiang, T.; Chen, L.; Liu, Y. In-situ test study on compressive bearing capacity of PHC pipe pile post-grouting in alluvial strata of the lower Yellow River. J. Henan Polytech. Univ. (Nat. Sci.) 2026, 45, 1–10. [Google Scholar]
  4. Li, B.; Yu, J. Study on bearing characteristics of pile foundations based on field static load tests of PHC pipe piles. Water Resour. Hydropower Eng. 2023, 54, 96–102. [Google Scholar]
  5. Wang, Q.; Gai, Y.-B.; Li, Y.; Liu, Y.; Chen, G. Study on adaptability of PHC pipe piles for expressway bridges in Dongting Lake area. J. Highw. Transp. Res. Dev. 2023, 40, 99–105. [Google Scholar] [CrossRef]
  6. Wang, Q.; Chen, G.; Liu, Y.; Gai, Y.-B.; Qiao, Q. Standardized design and experimental study of PHC pipe piles for small- and medium-span expressway bridges in the Dongting Lake area. Highway 2024, 69, 139–146. [Google Scholar]
  7. Ling, Z.; Tang, M.-X.; Hu, H.-S.; Liu, C.-L.; Li, B.; Su, D.-L. Bearing capacity of pile toe of non-displacement rock-socketed PHC pipe piles. Rock. Soil Mech. 2024, 45, 97–107. [Google Scholar]
  8. Li, B.; Tang, M.-X.; Hu, H.-S.; Liu, C.-L.; Ling, Z.; Su, D.-L.; Hou, Z.-K.; Xiao, Y.-P. Simplified nonlinear approach for analysing the load-settlement response of rock-socketed PHC pipe pile considering end sealing and side grouting effects. Acta Geotech. 2025, 20, 2911–2925. [Google Scholar] [CrossRef] [Scilit]
  9. Yamazaki, H.; Kikuchi, Y.; Noda, S.; Saotome, M.; Nonaka, M. Unit inner friction resistance and unit resistance of actual part of open-ended piles based on the double-pipe model pile experiment. J. Jpn. Soc. Civ. Eng. Ser. B3 (Ocean Eng.) 2020, 76, 450–455. [Google Scholar] [CrossRef] [Scilit]
  10. Zhu, H.; Zhu, B.; Luo, R.; Wang, Z. Model test investigation into jacking mechanism and bearing characteristics of open-ended double-wall piles. Chin. J. Geotech. Eng. 2026, 48, 1163–1177. [Google Scholar]
  11. Jiang, H.; Geng, K.; Yang, H.; Lu, H.; Lan, P. Analysis of bearing capacity of a single prestressed concrete pipe pile. Build. Struct. 2022, 52, 2759–2762. [Google Scholar] [CrossRef]
  12. Nie, Z.; Xie, B.; Wang, H.; Wang, J. Mechanical properties of PHC pile-soil structural materials and bearing reliability. J. Hunan Inst. Eng. (Nat. Sci. Ed.) 2023, 33, 70–75. [Google Scholar] [CrossRef]
  13. Zhou, X.; Yang, C.; Ming, X.; Dai, M.; Lu, W.; Zhang, F. Mechanical characteristics and calculation method of static pressure pile installation for PHC pipe piles in sandy soil foundation with pebble interlayer. Sci. Rep. 2025, 15, 13756. [Google Scholar] [CrossRef] [Scilit]
  14. Zhang, R.; Liu, Y.; Wang, L.; Gong, W.; Wan, Z. A comparative analysis of axial bearing behaviour in steel pipe piles and PHC piles for port engineering. Buildings 2025, 15, 2738. [Google Scholar] [CrossRef] [Scilit]
  15. Feng, Q.-R.; Xing, H.-F.; Chen, H.-B.; Wei, H. Suitability and bearing behavior of PHC pipe piles in underlying mudstone. Geotech. Geol. Eng. 2025, 43, 146. [Google Scholar] [CrossRef] [Scilit]
  16. Gong, Z.; Dai, G.; Chen, X.; Ouyang, H.; Hu, T.; Chen, Z. Vertical bearing behavior and pile group effect for cemented-soil composite pile groups based on on-site experiments. Soil Dyn. Earthq. Eng. 2025, 188, 109090. [Google Scholar] [CrossRef] [Scilit]
  17. Gong, Z.; Ouyang, H.; Dai, G.; Chen, X. A theoretical analysis method for stiffened deep cement mixing (SDCM) pile groups under vertical load in layered soils. Comput. Geotech. 2025, 183, 107211. [Google Scholar] [CrossRef] [Scilit]
  18. Sun, Y.; Liu, C.; Bian, R.; Wang, J. Model test study of bearing behavior of small prefabricated piles in soft soil area. Chin. J. Undergr. Space Eng. 2018, 14, 355–361. [Google Scholar]
  19. Song, Y.; Wang, J. Analysis of horizontal and vertical bearing characteristics of inclined pile group based on numerical simulation. J. Lanzhou Univ. Technol. 2023, 49, 142–149. [Google Scholar]
  20. JTG/T 3512-2020; Technical Specifications for Testing of Foundation Piles in Highway Engineering. China Communications Press: Beijing, China, 2020.
  21. Shen, H.; Jia, C.; Ren, L. Field test and numerical simulation of bearing characteristics of large-diameter pile group foundations. J. Nat. Disasters 2023, 32, 220–228. [Google Scholar]
  22. Bach, L.V.H. Evaluation of the behavior of equal and variable-length piles in soft clay using field load tests and finite element modeling. Eng. Technol. Appl. Sci. Res. 2025, 15, 29299–29305. [Google Scholar] [CrossRef] [Scilit]
  23. API RP 2A-WSD; Recommended Practice for Planning, Designing and Constructing Fixed Offshore Platforms-Working Stress Design. American Petroleum Institute: Washington, DC, USA, 2000.
  24. Yu, Q. Test Research on Characteristic of Vertical Bearing Capacity of Super Pile Group. Doctoral Dissertation, Southeast University, Nanjing, China, 2009. [Google Scholar]
  25. Dai, G.; Gong, W. Simulation of relationship between load and displacement of group pile based on single pile loading test. J. Highw. Transp. Res. Dev. 2011, 28, 1–5+140. [Google Scholar]
  26. Poulos, H.G.; Davis, E.H. Pile Foundation Analysis and Design; John Wiley & Sons: New York, NY, USA, 1980. [Google Scholar]
  27. JGJ/T 72-2017; Standard for Geotechnical Investigation of Tall Buildings. China Architecture & Building Press: Beijing, China, 2017.
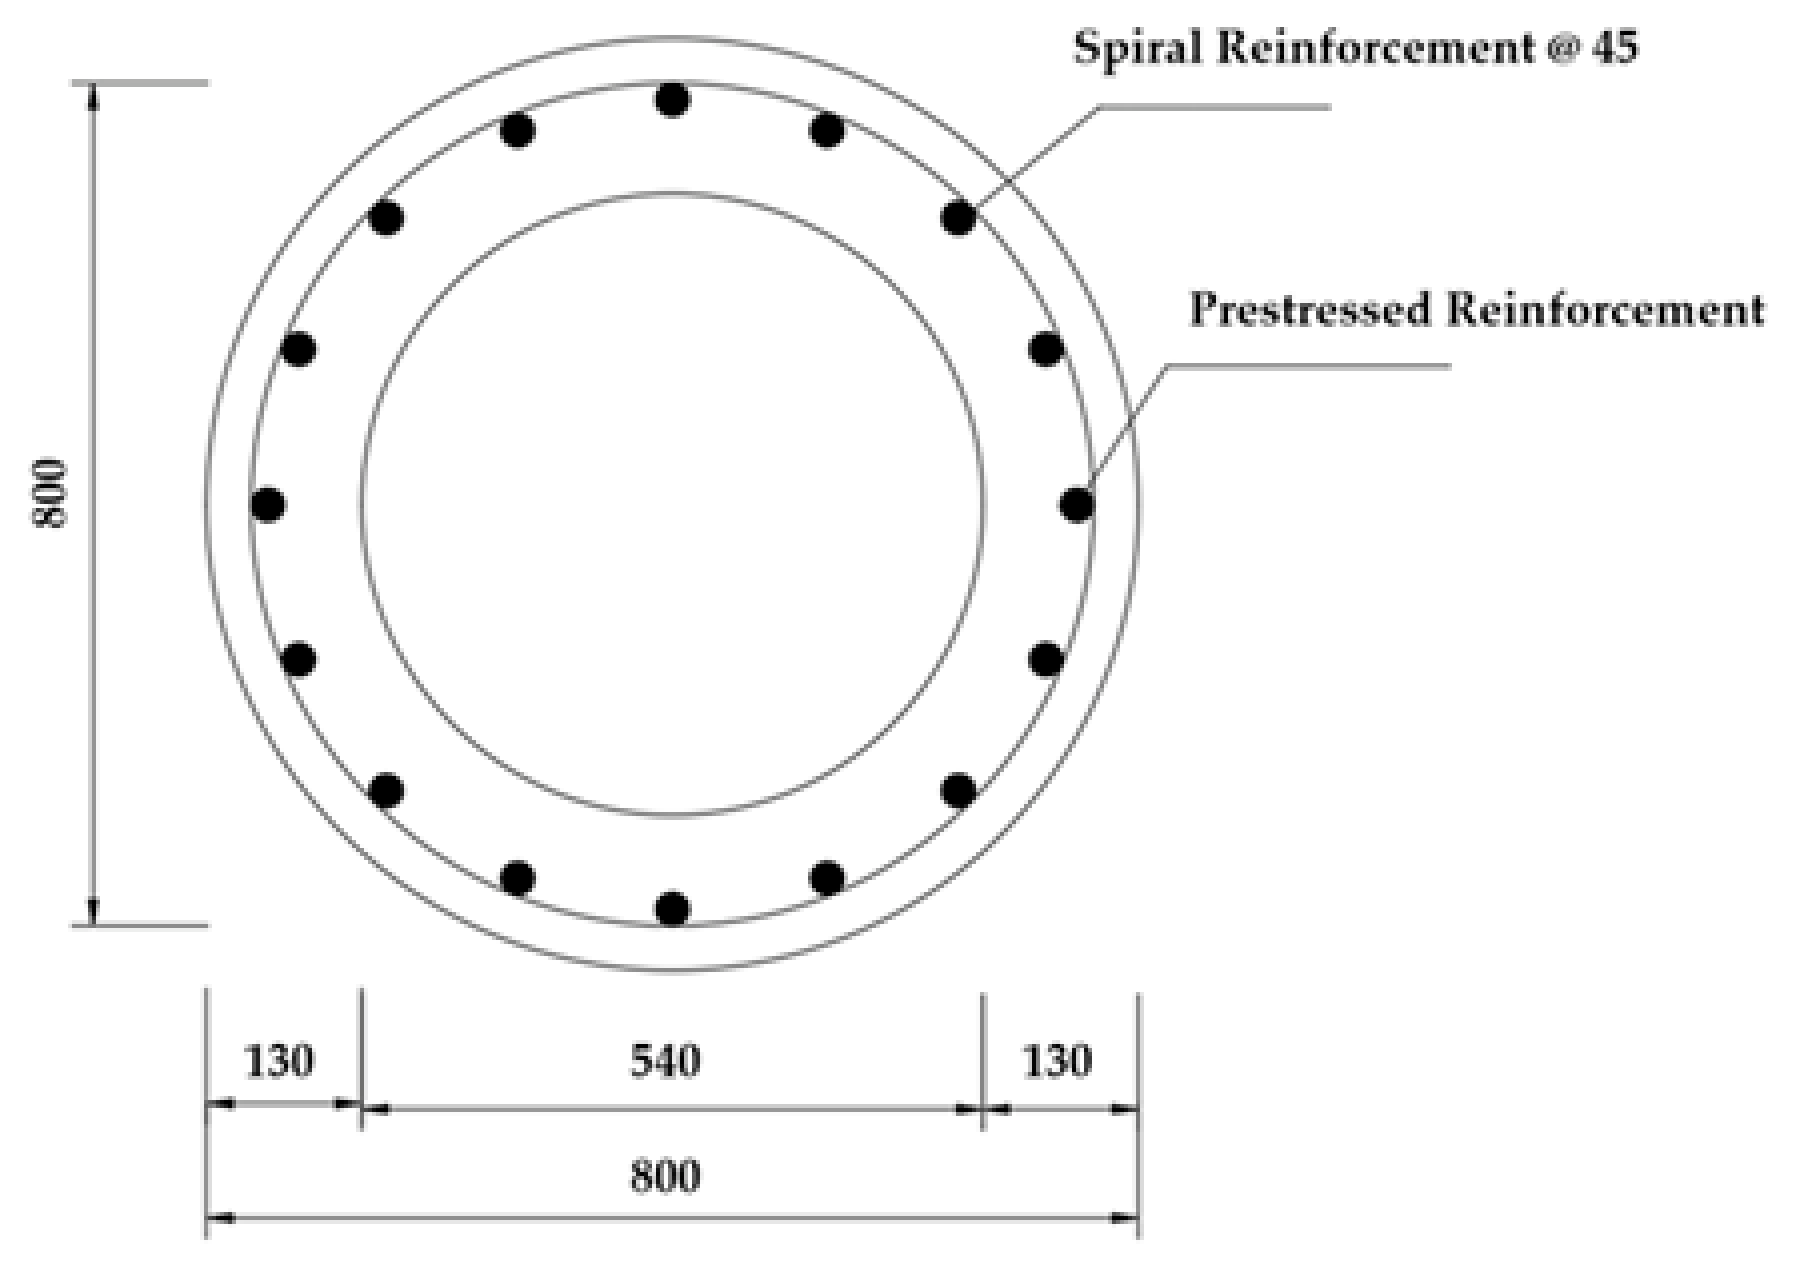
Figure 1. Cross-sectional configuration of PHC800(130)-AB pipe pile.
Buildings 16 03398 g001
Figure 2. Field view of combined welded and mechanical-clamp pile connection.
Buildings 16 03398 g002
Figure 3. Single-pile surcharge loading test system.
Buildings 16 03398 g003
Figure 4. Field arrangement of displacement transducers for single pile.
Buildings 16 03398 g004
Figure 5. Plan view of vertical surcharge loading test system for pile group.
Buildings 16 03398 g005
Figure 6. (a) Overall view of vertical surcharge loading test for pile group. (b) Field arrangement of displacement transducers for pile-group foundation.
Buildings 16 03398 g006aBuildings 16 03398 g006b
Figure 7. Q-s curves of single piles D1, D2 and D3.
Buildings 16 03398 g007
Figure 8. Q-s curve of pile-group foundation.
Buildings 16 03398 g008
Figure 9. Layout of optical fiber sensors.
Buildings 16 03398 g009
Figure 10. Axial-force distribution along single pile D1 at 15 displayed load levels from 880 to 7040 kN (load interval: 440 kN).
Buildings 16 03398 g010
Figure 11. Shaft resistance distribution along single pile D1 at 15 displayed load levels from 880 to 7040 kN (load interval: 440 kN).
Buildings 16 03398 g011
Figure 12. Comparison between calculated and measured Q-s curves of single piles D1 and D2.
Buildings 16 03398 g012
Figure 13. Comparison between calculated and measured Q-s curves of single pile D3.
Buildings 16 03398 g013
Figure 14. Schematic diagram of equivalent-pier method.
Buildings 16 03398 g014
Figure 15. Comparison between calculated and measured Q-s curves of pile group.
Buildings 16 03398 g015
Figure 16. Comparison between measured Q-s curve of pile group and that of single pile D3 after eightfold amplification.
Buildings 16 03398 g016
Figure 17. Comparison of pile-group calculation results obtained using hyperbolic model and API model.
Buildings 16 03398 g017
Table 1. Main geotechnical design parameters of test site.
Layer No.Soil TypeLithological StateUnit Weight (γ)/(kN/m3)Characteristic Pile-Tip Bearing Capacity (qpa)/kPaCharacteristic Shaft Resistance (qsa)/kPaCohesion
(cu)/kPa
0FillLoose
2MuckFluid plastic17.5 510.4
2 1 SiltSlightly dense19.1 109.5
2Muddy Silty clayFluid plastic17.5 88.5
2 1 Silty clayFluid plastic18.8 1621.4
3SiltSlightly dense to medium dense19.410002214.0
1 1 Silty claySoft plastic18.49002734.4
3SiltSoft plastic19.62500389.8
3 1 Silty claySoft plastic to soft plastic18.311002626.7
1Silty clayPlastic, locally hard plastic19.920003848.7
1 2 SiltSaturated medium dense19.6180032
2Silty claySoft plastic to plastic19.413003030.3
Notes: Layer numbers ①–⑥ denote stratigraphic age/genesis groups (① Upper Holocene, ② Middle Holocene, ③ Lower Holocene, ④ & ⑤ Upper Pleistocene upper member with different lithologies, ⑥ Upper Pleistocene lower member); subscripts (e.g., ②2) indicate sublithological subdivisions, and superscripts (e.g., 2 1 ) indicate locally distributed facies-change layers.
Table 2. Design parameters of PHC800(130)-AB pipe pile.
Design Value of Flexural Capacity of Pile Shaft [M] (kN·m)Design Value of Shear Capacity of Pile Shaft [V] (kN)Design Value of Axial Tensile Capacity of Pile Shaft [N] (kN)esign Value of Axial Compressive Capacity of Pile Shaft [V] (kN)Cracking-Resistant Bending Moment Calculated Under Characteristic Load Combination Mk (kN·m)Cracking-Resistant Tensile Force Calculated Under Characteristic Load Combination Nk (kN)Concrete Strength Grade
610485170068764961739C80
Table 3. Parameters of test piles.
Pile TypePile No.Pile Diameter
/mm
Pile Length
/m
Number of SegmentsPile-Tip Bearing StratumMaximum Test Load/kNStacked Load/kN
Single pileD1, D28004931 Silty clay748010,000
Single pileD3800322 1 1 Silty clay32005000
Pile groupQ1~Q8800322 1 1 Silty clay15,00018,000
Notes: For explanation of layer symbols ⑤ and ⑥, subscripts, and superscripts, see Notes for Table 1.
Table 4. Compositions of single-pile bearing capacities.
Pile No.Vertical Compressive Ultimate Bearing Capacity/kNUltimate shaft
Resistance/kN
Ultimate Tip
Resistance/kN
Proportion of Shaft Resistance/%Proportion of Tip Resistance/%
D170405862117883.2716.73
D270405886115483.6116.39
D33000225274875.0724.93
Table 5. Compositions of bearing capacities of individual piles in pile group.
Pile No.Vertical Compressive Ultimate Bearing Capacity/kNUltimate Shaft
Resistance/kN
Ultimate Tip
Resistance/kN
Proportion of Shaft Resistance/%Proportion of Tip Resistance/%
Q12080191017091.838.17
Q22080190717391.688.32
Q31930176916191.668.34
Q41930177515591.978.03
Q52080191516592.077.93
Q62080191216891.928.08
Q71410126914190.0010.00
Q81410127113990.149.86
Table 6. Key parameters used in hyperbolic model for single piles D1 and D2.
Layer Thickness/mSoil LayerElevation of Layer Bottom/ma (×10−3)bab (×10−3)bb
0.020−0.020.4236980.011014
1.182−1.20.4236980.011014
8.2 2 1 −9.40.0081250.011893
13.72−23.10.5649970.014057
4.8 2 1 −27.90.0652790.015387
3.33−31.20.0123890.013726
9.1 1 1 −40.30.0531270.012785
4.23−44.50.0099040.013061
1.8 3 1 −46.30.0501130.013242
0.341−47.40.0270280.0268340.0038610.00025
Notes: For explanation of layer symbols ①–⑥, subscripts, and superscripts, see Notes for Table 1.
Table 7. Key parameters used in hyperbolic model for single pile D3.
Layer Thickness/mSoil LayerElevation of Layer Bottom/ma (×10−3)bab (×10−3)bb
0.020−0.020.4236980.014869
1.182−1.20.4236980.014869
8.2 2 1 −9.40.0081250.016056
13.72−23.10.5649970.018977
4.8 2 1 −27.90.0652790.020773
3.33−31.20.0123890.020974
0.8 1 1 −40.30.0531270.0148690.007590.00105
Notes: For explanation of layer symbols ①–⑤, subscripts, and superscripts, see Notes for Table 1.
Table 8. Comparison of calculated and measured bearing capacities for different API softening coefficients.
Softening CoefficientD1/D2 (L = 49 m)D3 (L = 32 m)
Experimental Value/kNCalculated Value/kNErrorExperimental Value/kNCalculated Value/kNError
0.770406250−11.2%30002786−7.13%
0.870406661−5.4%300031023.40%
0.970406984−0.8%3000341913.97%
Disclaimer/Publisher’s Note: The statements, opinions and data contained in all publications are solely those of the individual author(s) and contributor(s) and not of MDPI and/or the editor(s). MDPI and/or the editor(s) disclaim responsibility for any injury to people or property resulting from any ideas, methods, instructions or products referred to in the content.