Article

Uniaxial Damage Mechanisms in Roller-Compacted Concrete Subjected to Freeze–Thaw Cycles
Shaanxi Key Laboratory of Safety and Durability of Concrete Structures, Xijing University, Xi’an 710123, China
*
Author to whom correspondence should be addressed.
Buildings 2026, 16(17), 3360; https://doi.org/10.3390/buildings16173360
Submission received: 24 July 2026 / Revised: 14 August 2026 / Accepted: 21 August 2026 / Published: 24 August 2026

Abstract

Water-retaining roller-compacted concrete (RCC) dams suffer severe deterioration under coupled moisture ingress and freeze–thaw (F-T) cycles. To elucidate the damage mechanisms, this study employed industrial X-ray computed tomography (CT) synchronized with uniaxial compression and acoustic emission (AE) monitoring. The cross-scale damage evolution of RCC was investigated under dry, water-saturated, 25, and 50 F-T cycle conditions. The results indicate the following: (1) Macroscopically, F-T damage causes linear peak stress attenuation, shifting the failure mode from brittle axial splitting to ductile oblique shear. (2) Mesoscopically, frost-heaving stress expands native mesopores (500–2500 μm), increasing their volume fraction from 8.45% to 14.86% and remodeling isolated voids into a 3D interconnected defect network. (3) Microscopically, GMM-based AE clustering reveals a fracture transition. Driven by moisture lubrication and defect propagation, global shear cracks surpass the 50% threshold at 25 cycles (53.5%), reaching 68.6% at 50 cycles. (4) For cross-scale mapping, calibrating the AE b-value via Aki’s method decouples pore-water signal attenuation. Its pre-peak characteristic (an initial decrease followed by a rebound) accurately maps microcracks unstably coalescing along interconnected pores to form macroscopic shear planes. This cross-scale mechanism provides a scientific paradigm for condition monitoring of massive concrete in cold regions.

1. Introduction

Roller-compacted concrete (RCC) has been extensively utilized in major hydraulic infrastructure in cold regions owing to its rapid placement and superior economic efficiency [1,2]. However, inherently constrained by its dry-mix proportions and the roller-compaction methodology, RCC naturally exhibits a high concentration of initial pores and micro-defects. In fact, analogous to the compaction dynamics of unsaturated subgrade materials [3], the initial defect distribution in concrete is highly sensitive to the vibratory energy and the internal fractal gradation of coarse aggregates [4]. For dam sections located within the water-level fluctuation zone, prolonged exposure to the coupled effects of moisture ingress and repeated freeze–thaw (F-T) cycles is inevitable. The frost-heaving pressure induced by the phase transition of pore water drives the continuous initiation and propagation of microcracks within the concrete matrix, thereby inflicting irreversible F-T damage [5,6]. Given that RCC gravity dams predominantly withstand compressive stresses—such as self-weight and hydrostatic pressure—during actual operation, these F-T-induced mesoscopic defects directly compromise the macroscopic compressive performance and ultimate load-bearing capacity of the material. Consequently, elucidating the uniaxial compressive damage mechanisms of RCC subjected to F-T cycles constitutes a pivotal issue in engineering mechanics. It is imperative for scientifically evaluating the root causes of bearing capacity degradation and ensuring the long-term service safety of water-retaining dams in cold regions.
Similar to the structural disintegration of heterogeneous geomaterials driven by cyclic wetting and drying [7], the cumulative damage of hydraulic concrete in cold regions is essentially a process of internal pore expansion under environmental fatigue. Current fundamental research concerning the freeze–thaw deterioration and load-induced damage of hydraulic concrete in cold regions predominantly focuses on isolated macro- and micro-scale characterizations. Regarding macroscopic mechanical responses, numerous uniaxial and triaxial loading tests have systematically elucidated the degradation patterns of peak strength attenuation and strain-softening behaviors induced by F-T cycles [5,8,9]. To probe the physical underpinnings of this macroscopic mechanical degradation, non-destructive testing techniques have been extensively employed for internal structural characterization. Hou et al. [10] and Chen et al. [11] utilized industrial X-ray computed tomography to quantify the spatial topological evolution of pores, corroborating that F-T action significantly drives the propagation and spatial interconnection of native micro-voids within the matrix. This provides intuitive mesoscopic geometric evidence to explain macroscopic mechanical attenuation. Given the inherent limitations of static CT in tracking the dynamic evolution of load-induced cracks, microscopic acoustic monitoring of fractures has emerged as another research frontier. Acoustic emission signals encapsulate abundant information regarding internal fracture dynamics; current studies generally dissect these signals from two dimensions: “fracture mode” and “fracture scale”. In terms of fracture mode identification, Aggelis et al. [12] pioneered a classic microscopic fracture classification criterion based on RA and AF feature parameters. Building upon this, Chen et al. [13] and Zhao et al. [14] further integrated unsupervised clustering algorithms, such as the Gaussian Mixture Model (GMM). This integration substantially enhanced the objectivity of signal classification, successfully decoupling the microscopic tensile and shear fracture modes during compression. Furthermore, regarding fracture scale characterization, the AE b-value, derived from the Gutenberg–Richter (G-R) relationship, has been widely established as a classic acoustic indicator for quantifying internal micro-damage evolution. Scholz [15] initially introduced it to analyze microscopic fracture mechanisms in rocks. In subsequent extended research, Liu et al. [16] and Liu et al. [17] employed the traditional least-squares method for the continuous calibration of the conventional b-value. This intuitively mapped the spatiotemporal evolution of fracture source scales, successfully tracking the progressive behavior wherein dispersed microcracks within the loaded medium unstably coalesce into macroscopic dominant fractures.
However, in elucidating the underlying physical mechanisms of freeze–thaw deterioration in RCC, current research still encounters two critical scientific gaps that warrant further in-depth investigation. First, regarding cross-scale damage correlations, the existing literature predominantly focuses on independent, single-scale observations. There remains a conspicuous lack of quantitative physical mapping laws between static mesoscopic pore evolution and dynamic microscopic fracture behaviors. Second, concerning quantitative acoustic evaluation methods, conventional statistical approaches exhibit inherent limitations when applied to complex deteriorated media. Given that internal pore water and micro-defects inherently induce signal attenuation and interference [18], traditional mechanism identification criteria and least-squares-based b-value statistics often fail to effectively decouple such physical distortions. This deficiency ultimately compromises the accuracy and robustness of microscopic fracture scale assessments. Consequently, the aforementioned absence of cross-scale mapping and the limitations of conventional evaluation methods introduce notable uncertainties into the quantitative evaluation of F-T damage mechanisms.
In summary, to address the deficiencies in current cross-scale damage correlation studies and the high-frequency signal attenuation issues faced by traditional acoustic emission (AE) techniques in freeze–thaw (F-T) deteriorated media, this study systematically investigates the uniaxial compressive damage mechanisms of C20 roller-compacted concrete (RCC) in cold regions under F-T cycles. Methodologically, this work innovatively synchronizes static mesoscopic computed tomography (CT) scanning with dynamic uniaxial compression-AE testing. Furthermore, the maximum curvature (MAXC) method is introduced to dynamically calibrate the completeness magnitude, which is then coupled with Aki’s maximum likelihood estimation for b-value computation, thereby effectively mitigating the statistical bias inherent in traditional b-value evaluations. Specifically, the primary objectives of this study are to undertake the following: (1) elucidate the degradation laws governing the macroscopic mechanical properties and failure modes of RCC under varying F-T cycles; (2) quantitatively characterize the topological evolution of internal mesoscopic pores using high-resolution CT; (3) identify the transitions of microscopic fracture mechanisms and the critical thresholds for scale leaps throughout the compression process by integrating unsupervised Gaussian Mixture Model (GMM) clustering with dynamic Aki-b values; and (4) reveal the cross-scale evolutionary correlation among “mesoscopic pore deterioration, microscopic fracture mechanism transition, and macroscopic mechanical attenuation.”The core scientific contribution of this work lies in elucidating the cross-scale damage mechanisms—specifically, how the coalescence of static mesoscopic pore networks drives the dynamic transition of microscopic fracture mechanisms (from tension-dominated to shear-dominated)—strictly within the specific scope of the investigated mixture and impairment levels. Ultimately, these findings provide an initial physical reference for the early-stage non-destructive microscopic warning and deterioration assessment of mass water-retaining RCC infrastructure in cold regions.

2. Experimental Program

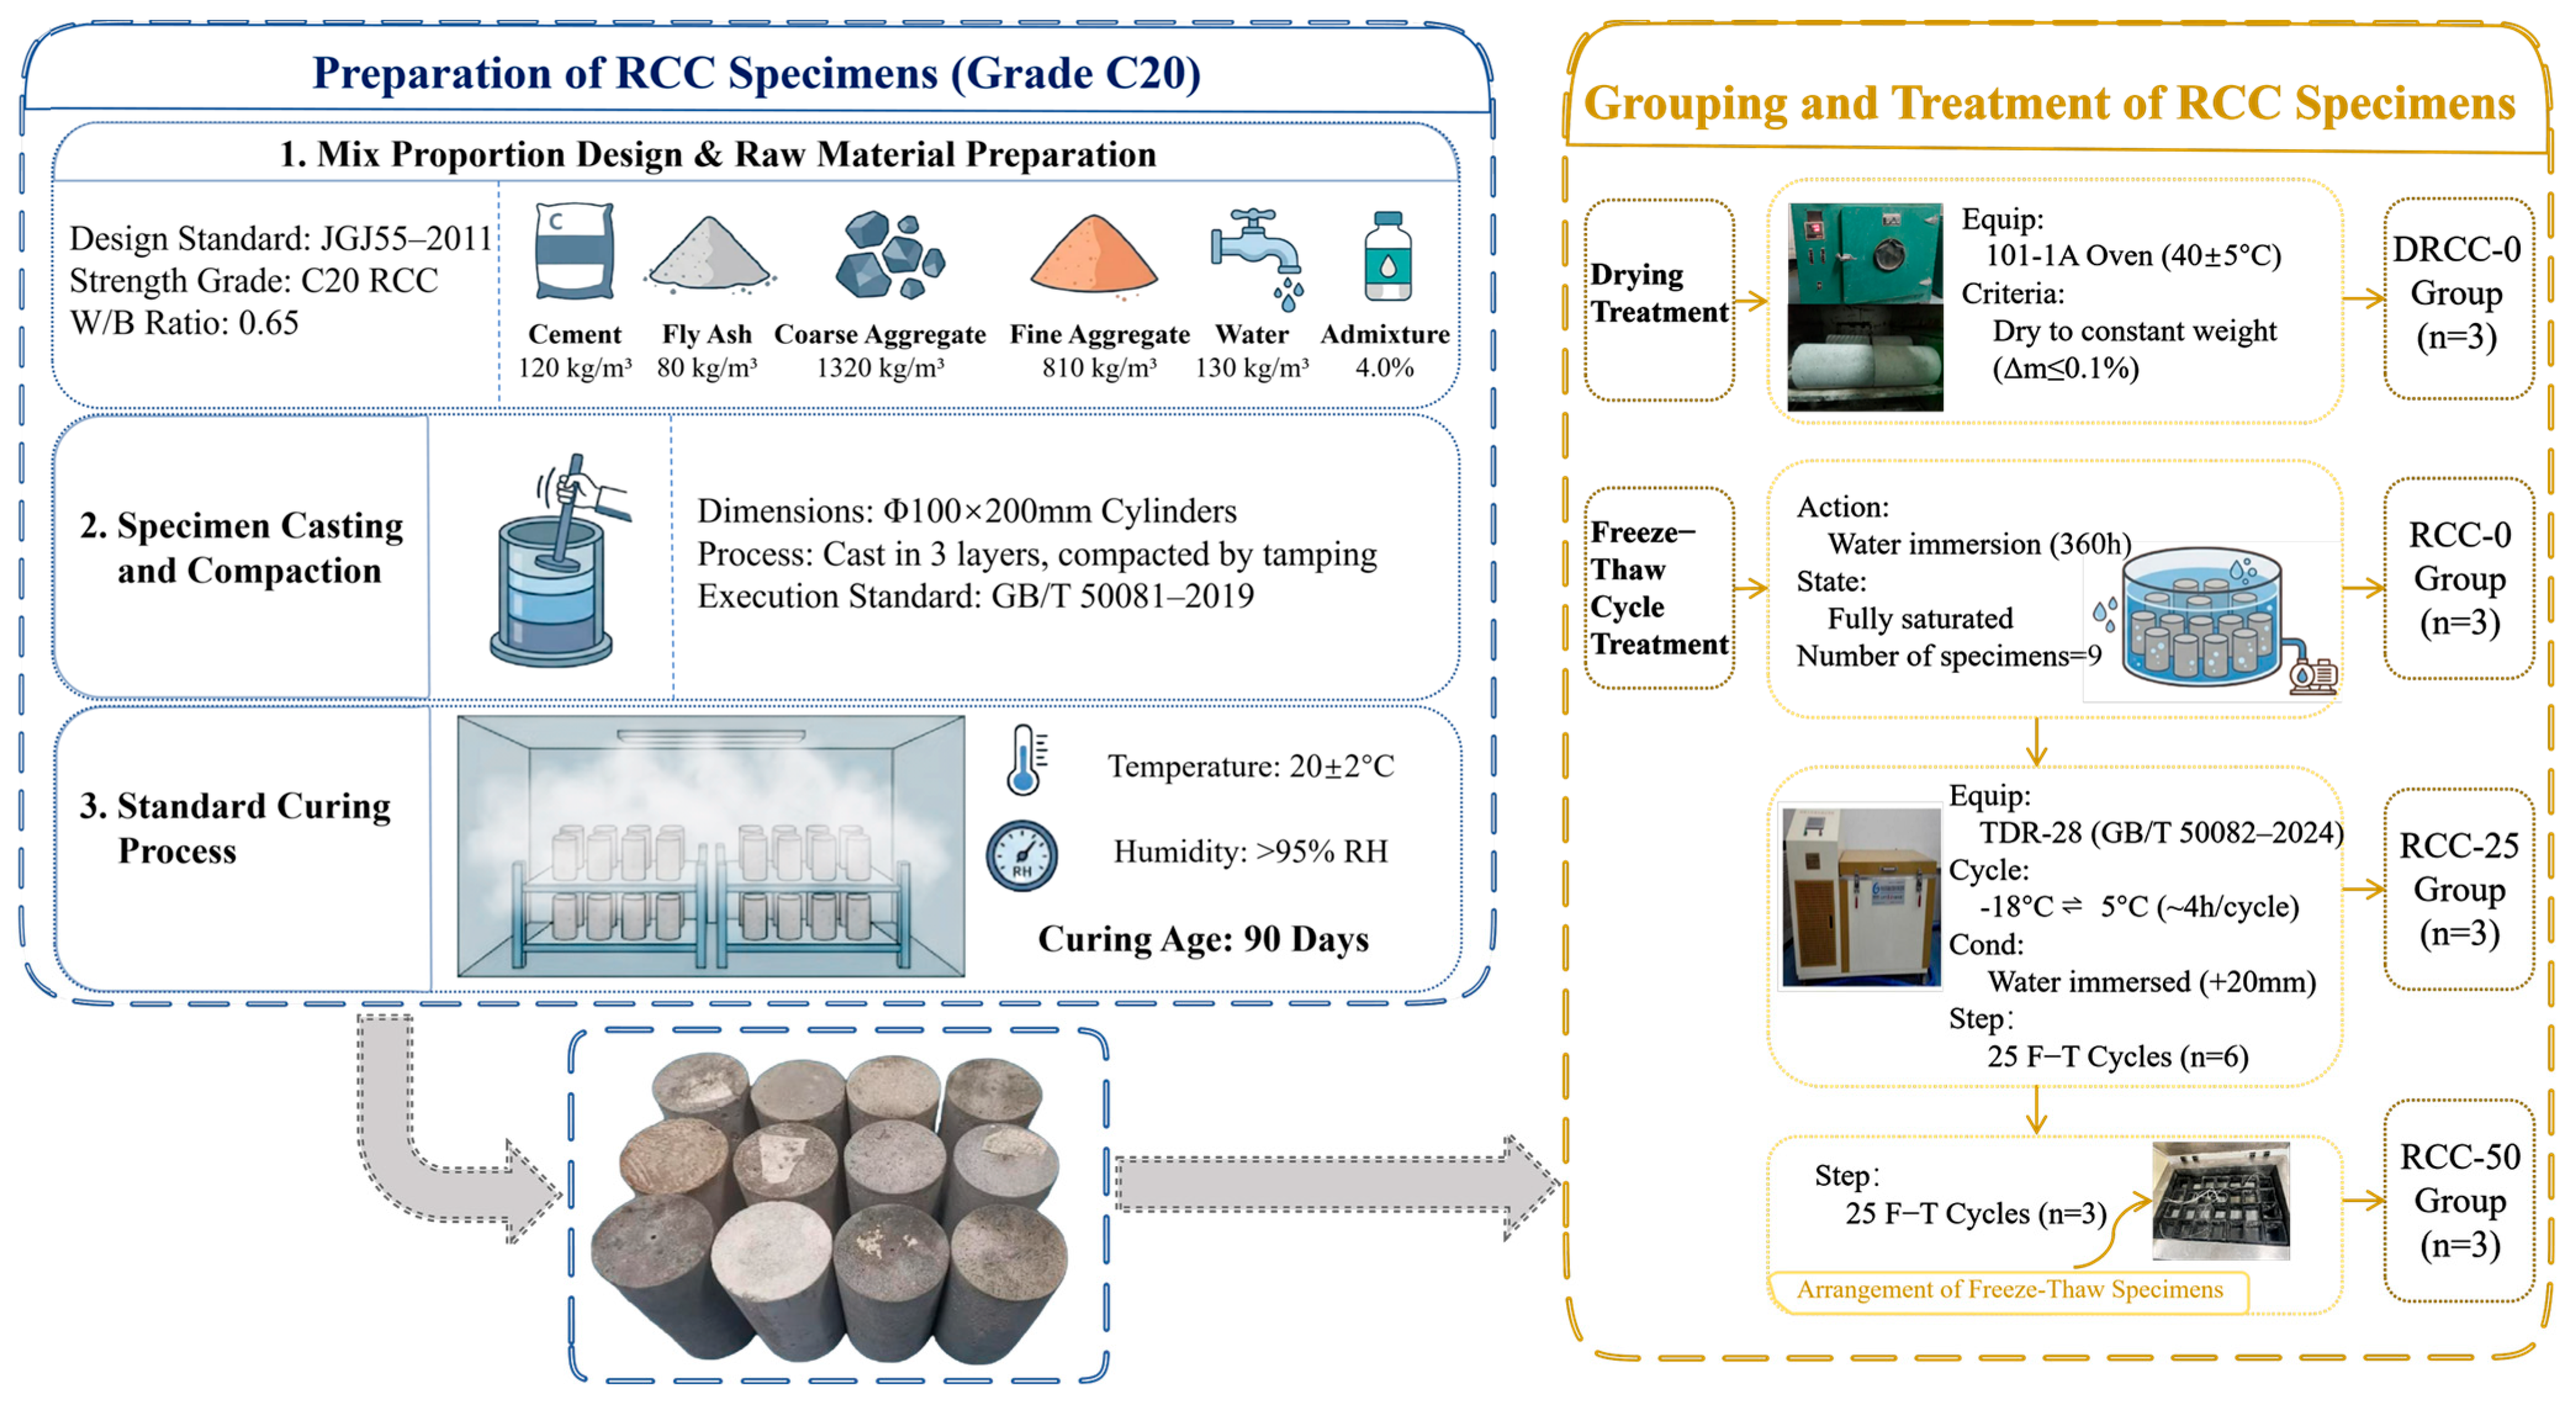
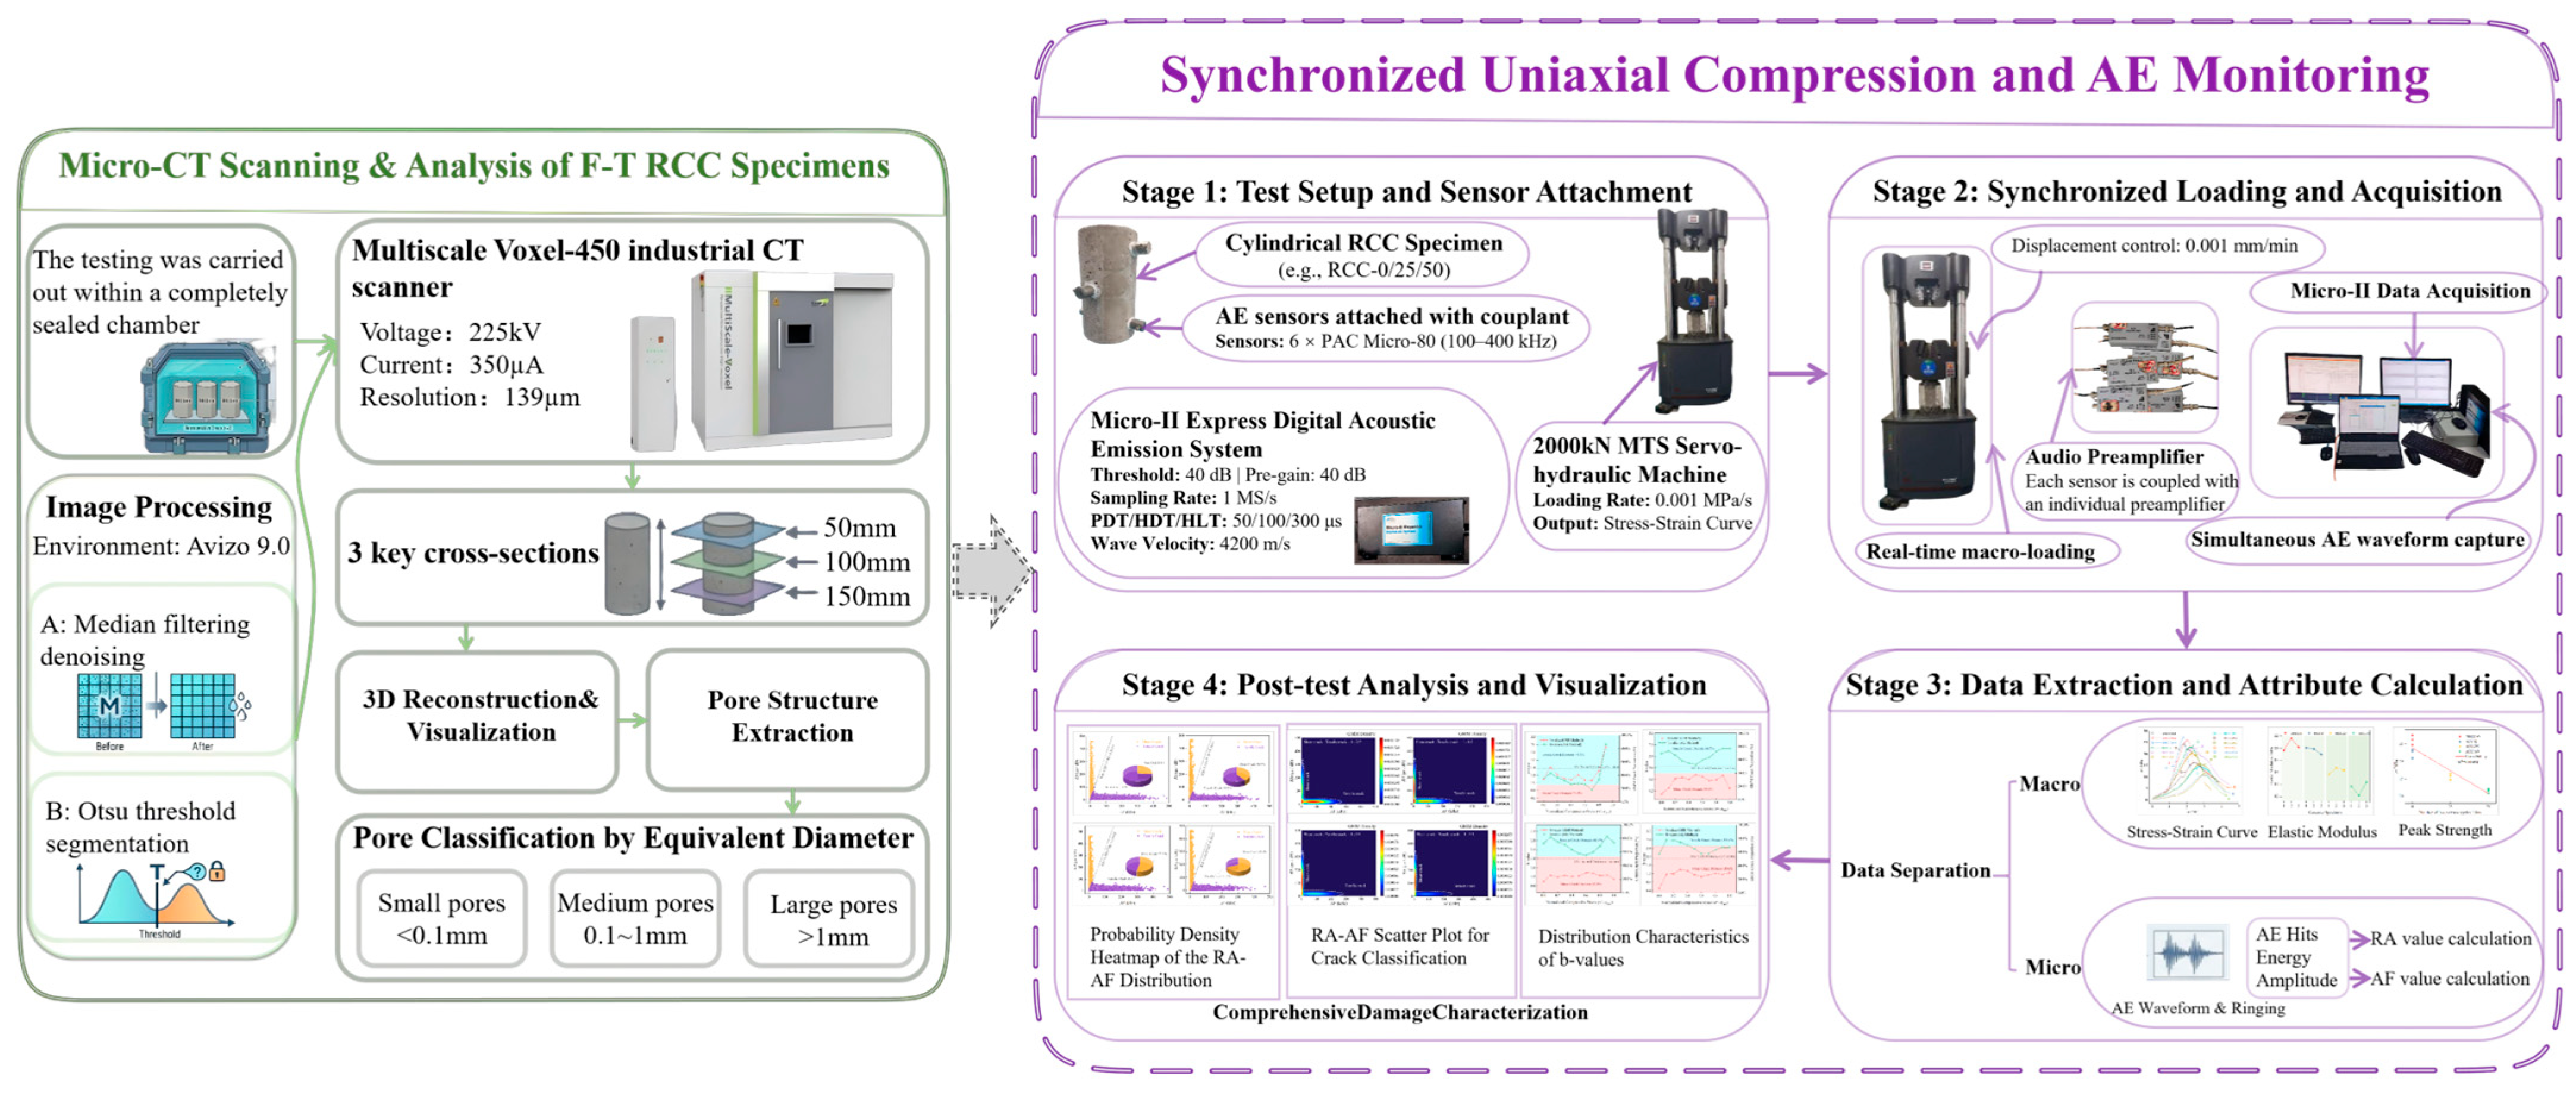
To elucidate the cross-scale damage mechanisms of RCC during F-T deterioration, a comprehensive multi-scale experimental framework, as illustrated in Figure 1 and Figure 2, was established to systematically account for both the moisture states and F-T effects of the material. Specifically, four testing conditions were configured: dry, water-saturated, and subjected to 25 and 50 F-T cycles. For the specimens conditioned to these distinct initial states, industrial CT scanning was employed to extract their internal mesoscopic pore features. Subsequently, the exact as-scanned specimens were directly subjected to synchronized uniaxial compression and AE testing. This coupled approach facilitated the simultaneous acquisition of macroscopic mechanical parameters and microscopic fracture signals throughout the entire compressive loading history.
Experimental equipment: 101-1A forced-air thermostatic oven (Tianjin Taisite Instrument Co., Ltd., Tianjin, China); TDR-28 concrete rapid freeze-thaw testing apparatus (Shanghai Rongjida Instrument Technology Co., Ltd., Shanghai, China); Voxel-450 micro-CT scanner (Sanying Precision Instruments Co., Ltd., Tianjin, China); 2000 kN MTS servo-hydraulic testing machine (MTS Systems Corporation, Eden Prairie, MN, USA); Micro-II Express digital AE system (Physical Acoustics Corporation, Princeton Junction, NJ, USA); broadband Micro-80 AE sensors (Physical Acoustics Corporation, Princeton Junction, NJ, USA); Avizo software (Version 9.0, Thermo Fisher Scientific, Waltham, MA, USA). Experimental software: Microsoft Office 2024, Origin 2024, PyCharm 2024.

2.1. Specimen Preparation and Environmental Conditioning

Cylindrical RCC specimens (100 mm × 200 mm) with a design compressive strength grade of C20 were proportioned and cast in accordance with the Specification for Mix Proportion Design of Ordinary Concrete (JGJ 55-2011) [19]. The calculated w/b ratio was 0.65, and the detailed mixture proportions are summarized in Table 1. Although actual hydraulic dams typically utilize ultra-low w/b ratios ranging from 0.40 to 0.50, this parameter was deliberately increased to 0.65 in the present study. This adjustment was implemented to accelerate the simulation of extreme F-T deterioration within a constrained experimental timeframe. A higher w/b ratio fosters the formation of a more extensive initial capillary pore network within the concrete matrix [20]. This structural attribute effectively enhances moisture transport efficiency and amplifies the accumulative effects of crystallization pressure induced by the ice phase transition [21]. Consequently, the damage progression is expedited, thereby facilitating the subsequent capture of cross-scale damage features and acoustic decoupling analysis [22]. Given this parametric disparity, when extrapolating the underlying mechanisms identified in this study to actual engineering structures with lower w/b ratios, these findings should be interpreted as the upper-bound envelope for component performance degradation.
The concrete specimens were fabricated and cured in accordance with the National Standard GB/T 50081-2019 [23]. Following a 90-day curing period at 20 ± 2 °C and a relative humidity (RH) exceeding 95%, the specimens were divided into four groups (three replicates per group) to simulate varying degrees of damage: a dry control group (DRCC-0), a saturated control group (RCC-0), and two F-T groups subjected to 25 and 50 cycles (RCC-25 and RCC-50, respectively). The drying treatment for the DRCC-0 group was performed using a 101-1A forced-air thermostatic oven (Tianjin Taisite Instrument Co., Ltd., Tianjin, China). Meanwhile, the F-T cycles were rigorously executed in a TDR-28 testing apparatus (Shanghai Rongjida Instrument Technology Co., Ltd., Shanghai, China) in strict compliance with GB/T 50082-2024 [24]. A comprehensive workflow of specimen preparation and environmental conditioning is illustrated in Figure 1.

2.2. Integrated Multi-Scale Damage Testing

To acquire the baseline mechanical parameters of F-T damaged RCC and to minimize the coupling interference exerted by complex stress boundaries on microscopic fracture signals, this study devised an integrated multi-scale testing protocol. This protocol incorporates high-resolution CT scanning coupled with synchronized uniaxial compression and AE monitoring. Such a testing matrix effectively eliminates the masking effect of lateral confinement on the genuine F-T damage evolution mechanisms, while precluding the high-frequency acoustic wave attenuation typically induced by complex testing media. Consequently, the high-fidelity acquisition of AE signals is guaranteed, thereby establishing a robust hardware foundation for the subsequent precise decoupling of dynamic b-values.
As illustrated in Figure 2, prior to mechanical loading, the internal pore structures of the conditioned specimens were non-destructively characterized using a Multiscale Voxel-450 micro-CT scanner (Sanying Precision Instruments Co., Ltd., Tianjin, China) with a spatial resolution of 139 μm. Subsequently, synchronized uniaxial compression and AE monitoring were conducted. The macroscopic load was applied via a 2000 kN MTS servo-hydraulic testing machine (MTS Systems Corporation, Eden Prairie, MN, USA) under a constant displacement control rate of 0.001 mm/min, while microscopic cracking signals were continuously acquired by a Micro-II Express digital AE system (Physical Acoustics Corporation, Princeton Junction, NJ, USA). As depicted in Figure 1, six broadband Micro-80 sensors (Physical Acoustics Corporation, Princeton Junction, NJ, USA) were coupled to the specimen surface. To eliminate ambient noise, both the trigger threshold and pre-amplifier gain were set to 40 dB, with a sampling rate of 1 MS/s.

3. Results and Analysis

3.1. Surface Deterioration and Mass Evolution

3.1.1. Macroscopic Morphological Damage

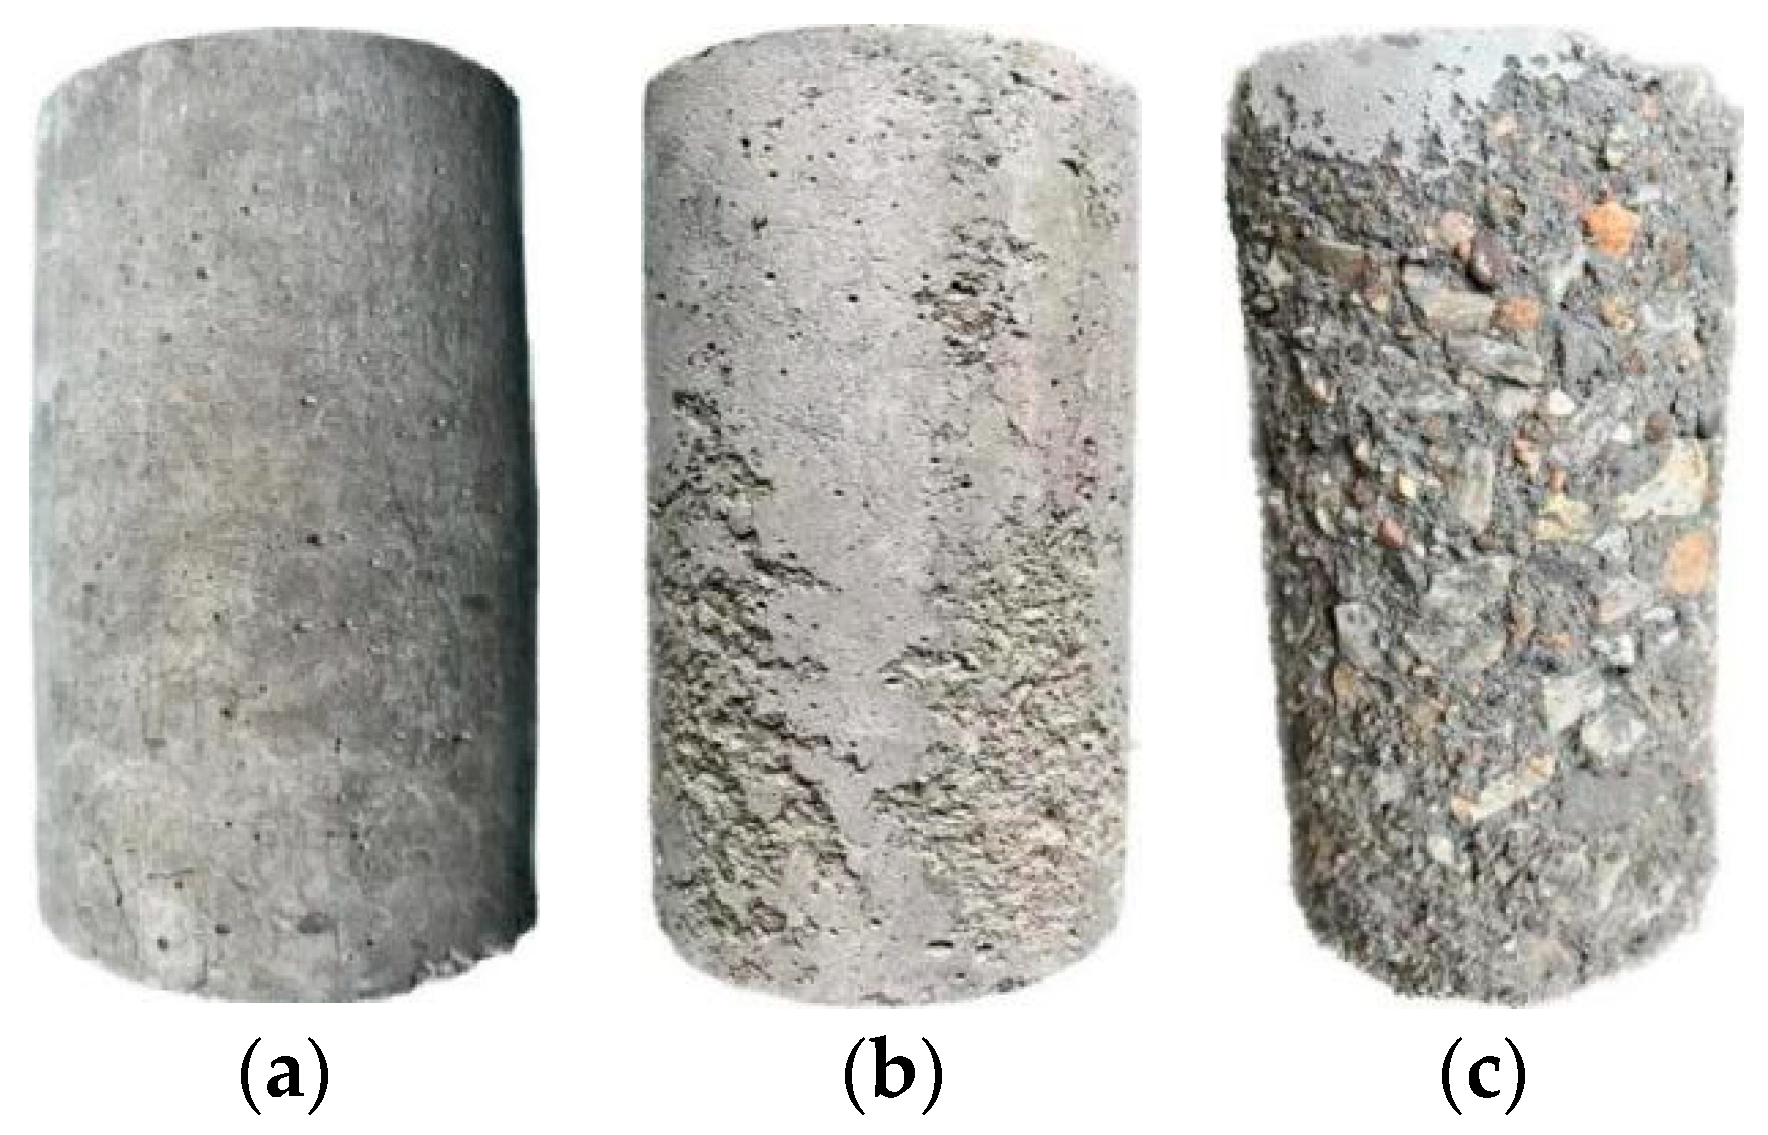
Figure 3 illustrates the surface morphologies of the RCC specimens subjected to varying F-T cycles. The unfrozen control specimens exhibit a smooth and dense surface, characterized by a sparse distribution of fine pores. In contrast, following 25 F-T cycles, the surface pores and microcracks multiply significantly, accompanied by localized surface scaling, rendering the surface rough and irregular. Upon reaching 50 F-T cycles, the surface cracks widen substantially, and the cement paste undergoes severe deterioration. This leads to the extensive detachment of fine aggregates and the consequent exposure of coarse aggregates. Evidently, the surface deterioration of the RCC specimens exacerbates progressively with an increasing number of F-T cycles, manifested by the intensified scaling of surface mortar alongside the proliferation and enlargement of pores. Mechanistically, once the specimens attain saturation, free water infiltrates and fills the internal voids. Under sub-zero conditions, the in-situ freezing of this pore water generates substantial frost-heaving pressure. Consequently, the surrounding microstructures are subjected to cyclic extrusion stresses, driving the progressive dilation of pores and culminating in severe macroscopic degradation as the F-T cycles accumulate [25].

3.1.2. Mass Loss Characteristics

The mass loss and mass loss rate of the specimens were calculated in accordance with the Standard for Test Methods of Long-Term Performance and Durability of Ordinary Concrete (GB/T 50082-2024). To ensure the consistency and reliability of the experimental results, three pre-saturated replicates were subjected to the F-T cycling protocol. Upon the completion of each designated F-T cycle, the mass of each specimen was individually recorded. Subsequently, the absolute mass and the corresponding mass loss rate were determined, as summarized in Table 2.
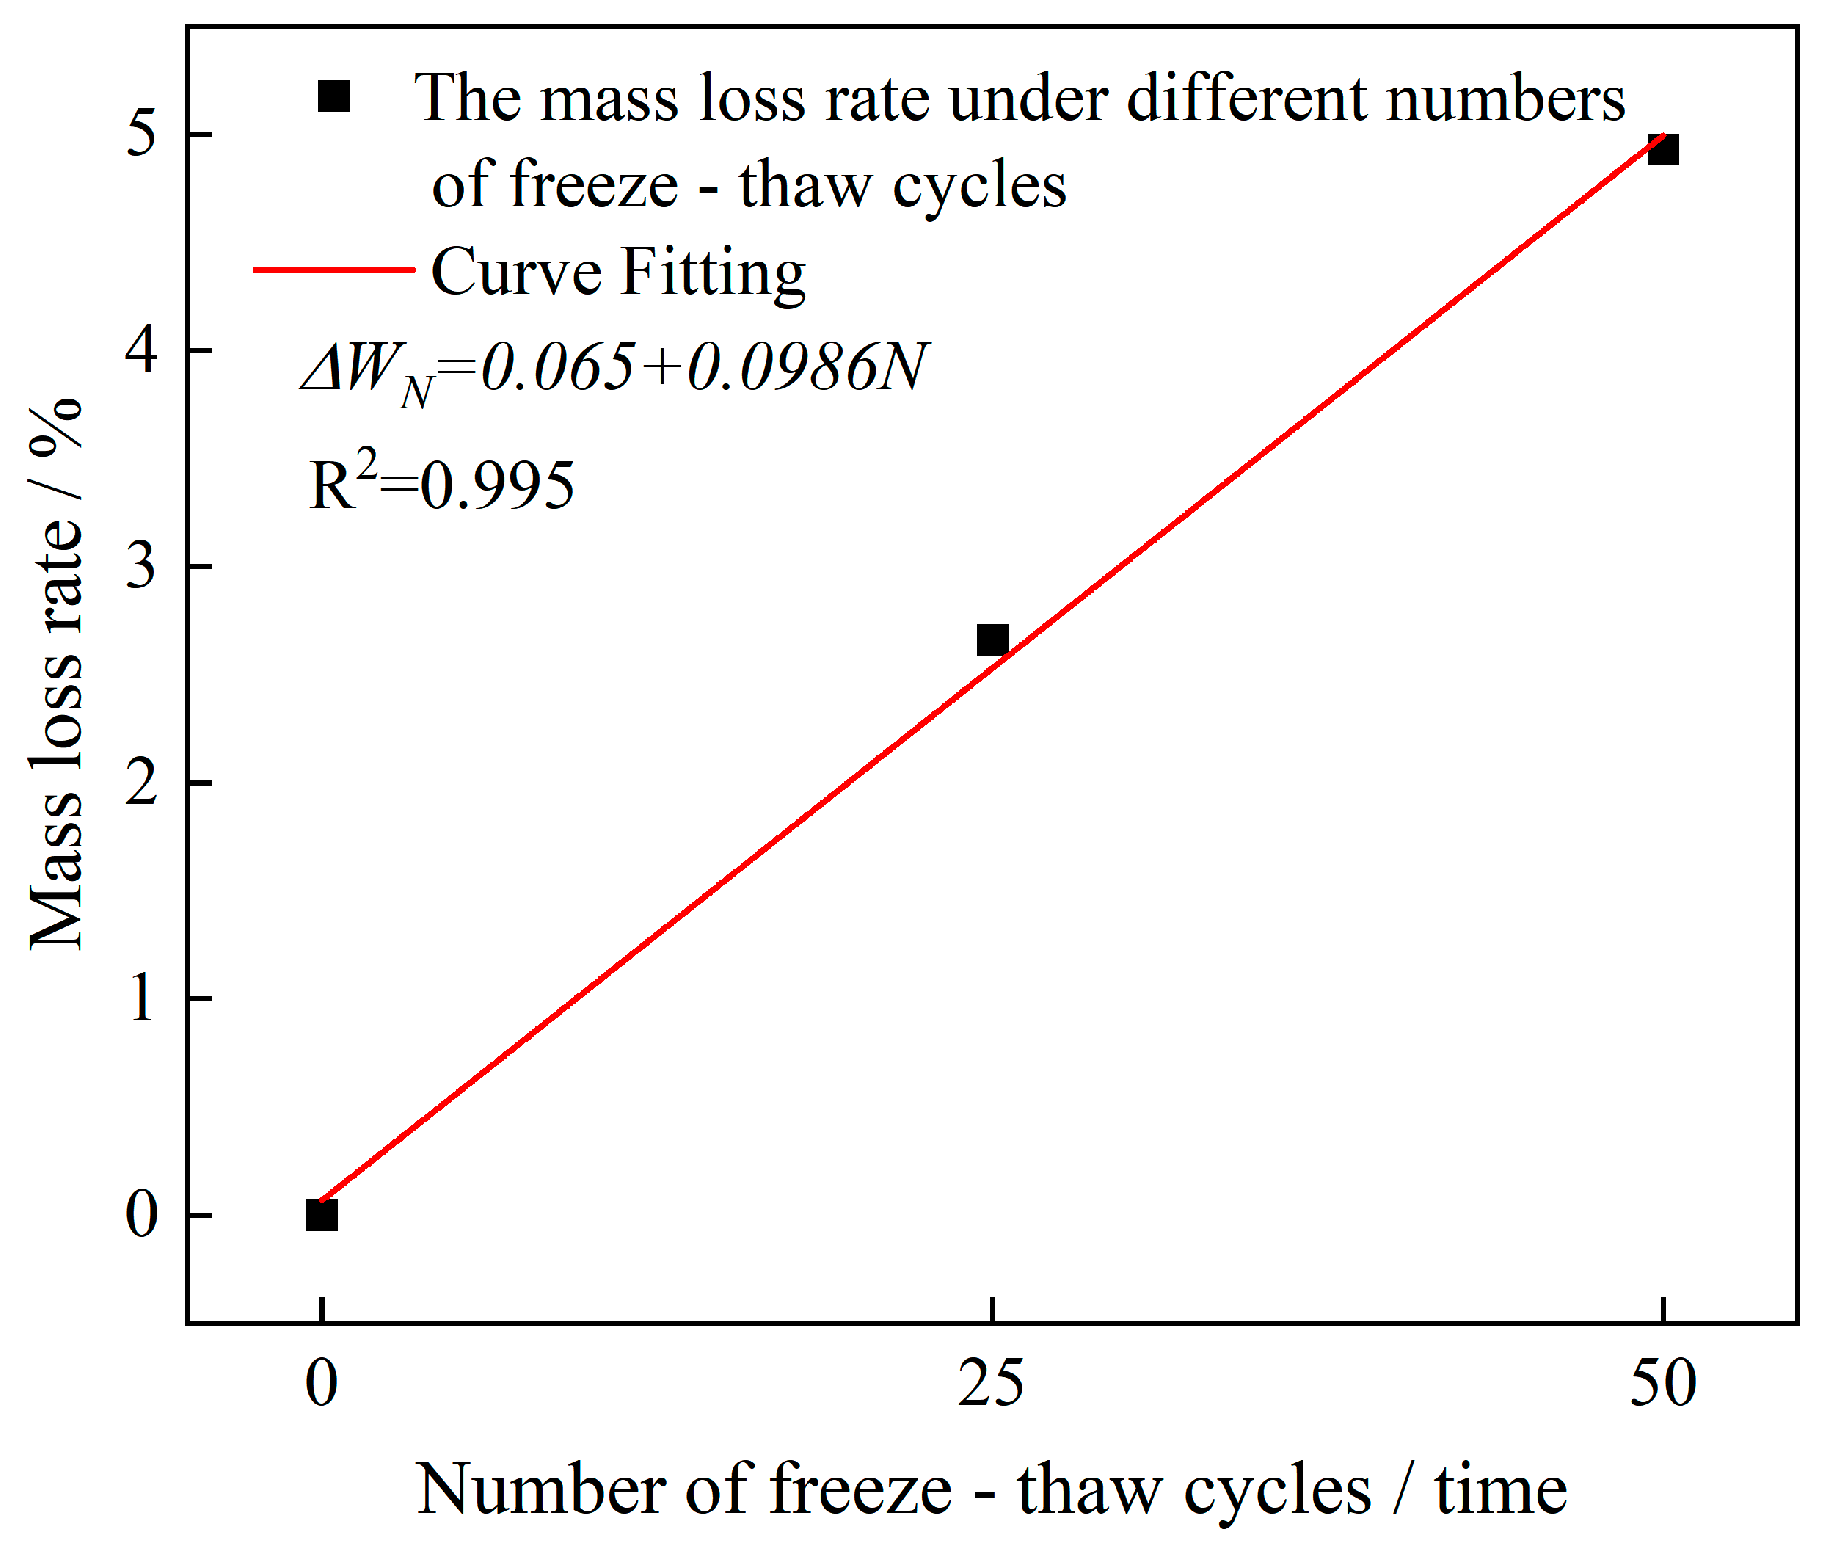
To elucidate the evolution of the average mass loss rate of RCC subjected to varying F-T cycles, the experimental data were plotted and subsequently fitted using an exponential function. As illustrated in Figure 4, the mass loss rate exhibits a progressive upward trend with the accumulation of F-T cycles. The corresponding empirical relationship is expressed as follows:
Δ W N = 0.065 + 0.0986 N
where Δ W N is the mass loss rate (%), and N denotes the number of F-T cycles.

3.2. Uniaxial Compressive Mechanical Properties

3.2.1. Deformation Characteristics

As the number of F-T cycles increases, both the average peak stress and average peak strain of the specimens exhibit a decreasing trend. Table 3 summarizes the uniaxial compression test results of the RCC specimens. In this table, H, φ , and M denote the height, diameter, and mass, respectively; σ and σ ¯ represent the peak stress and average peak stress, with Cv denoting the corresponding coefficient of variation; ε and ε ¯ indicate the peak strain and average peak strain; and E is the elastic modulus. Specifically, the secant modulus derived from the ascending branch of the complete stress–strain curve is adopted as the elastic modulus [26].
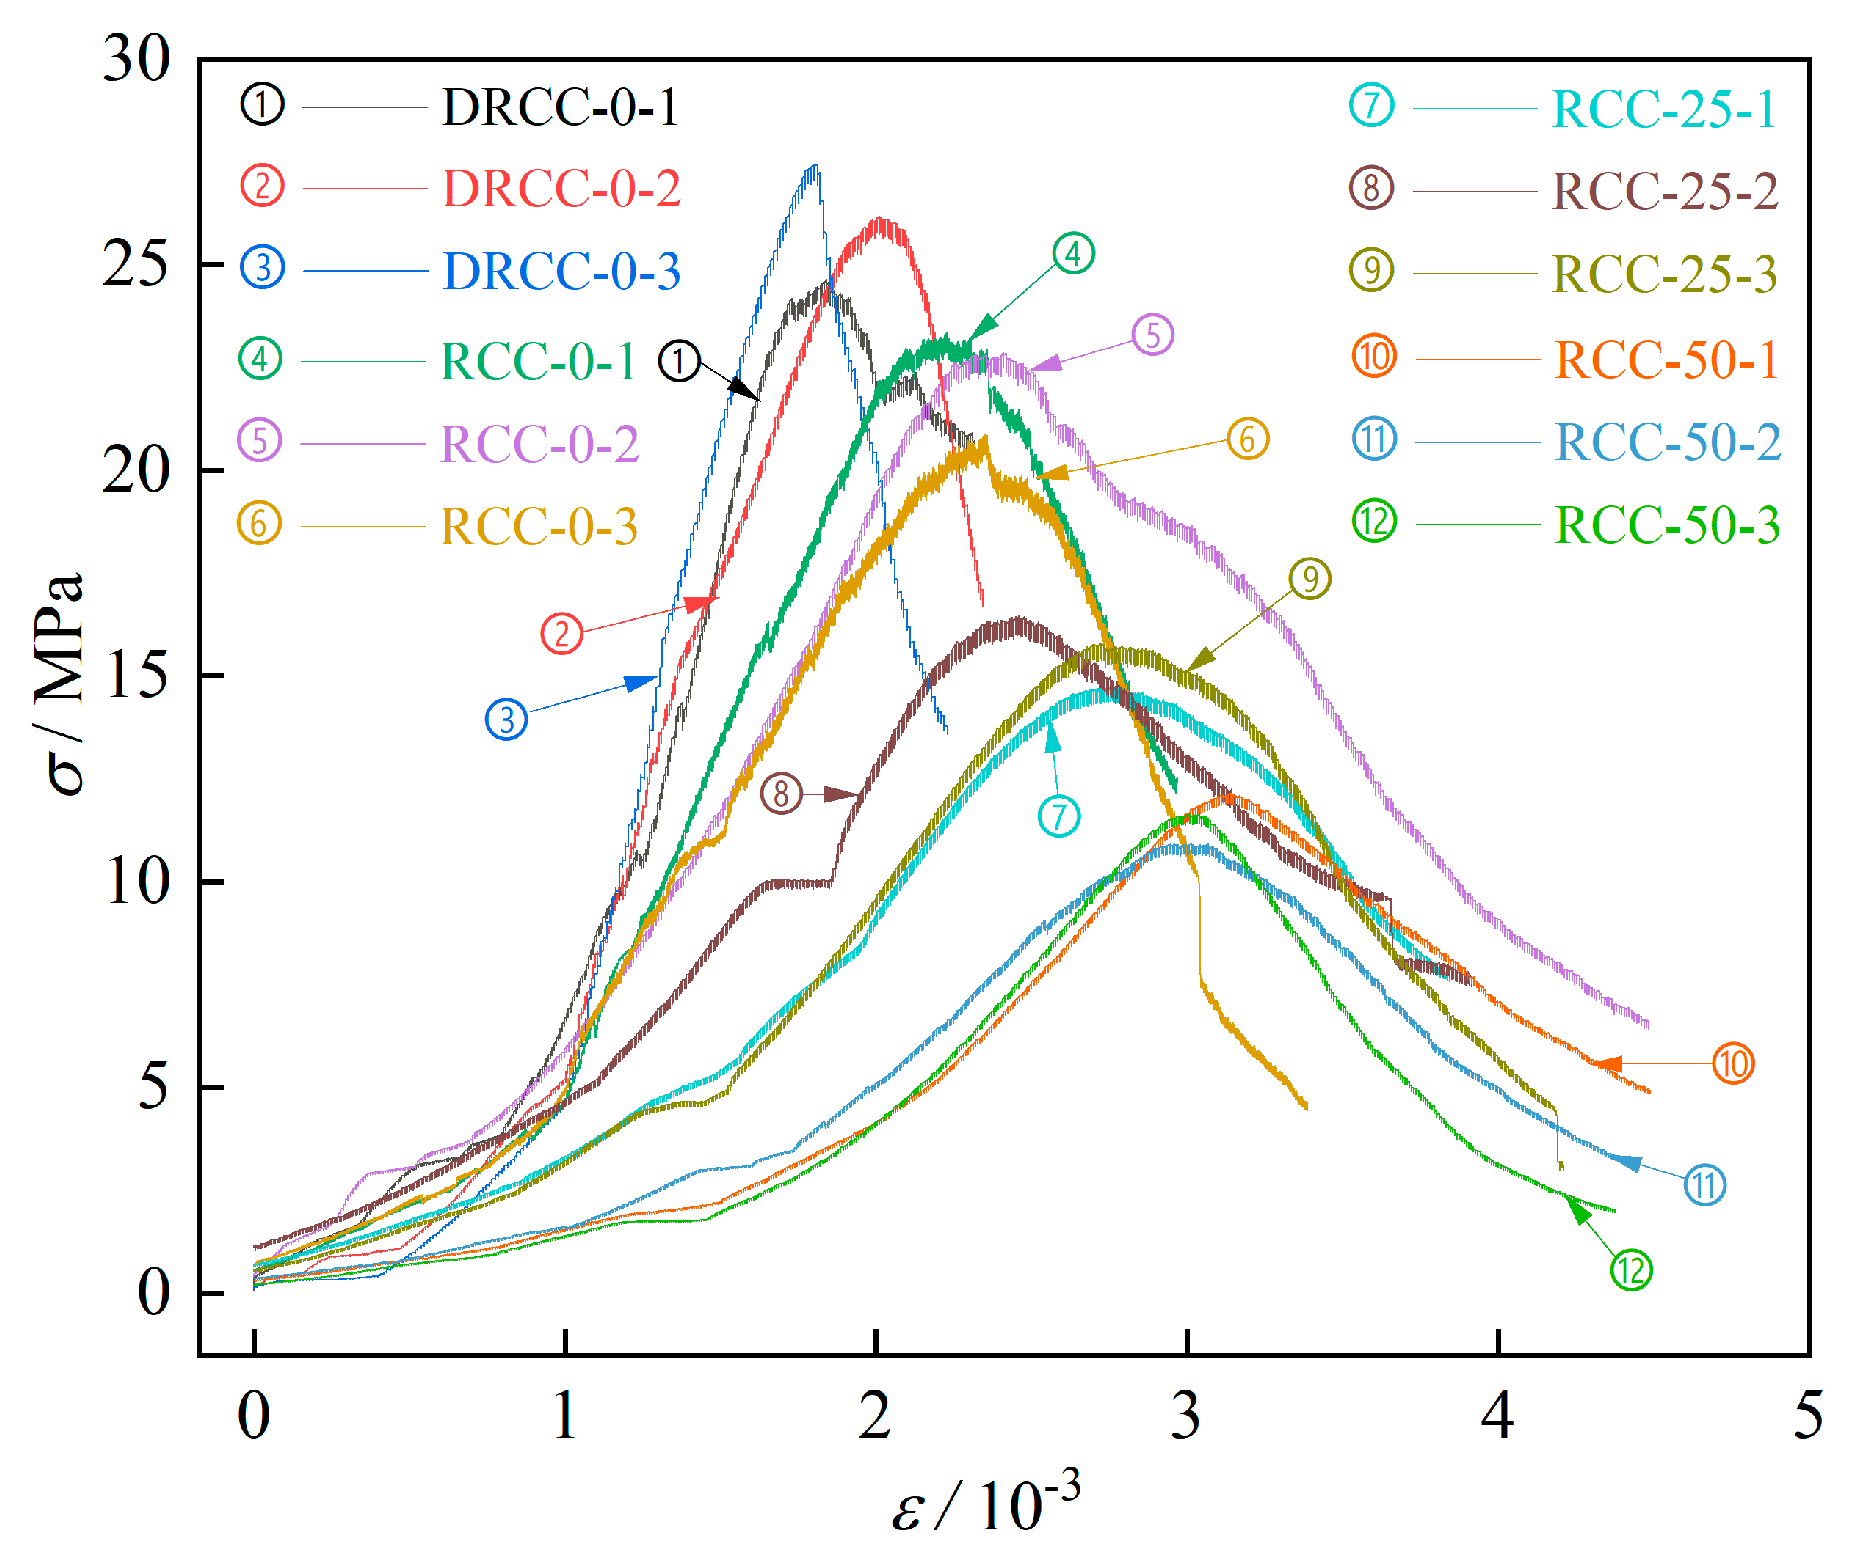
Figure 5 illustrates the typical stress–strain curves of the water-bearing RCC specimens following F-T deterioration. Evidently, the ascending branch of the unfrozen control specimens exhibits distinct linear elastic characteristics, followed by a precipitous stress drop post-peak, which is indicative of typical brittle failure. As the F-T cycles accumulate, the continuous proliferation of internal microcracks progressively broadens the initial compaction region along the strain axis. Concurrently, the secant modulus of the linear elastic stage decreases continuously, experiencing a reduction of approximately 35% after 25 cycles. Meanwhile, the peak stress undergoes a stepwise degradation, dropping by 47.1% after 50 cycles compared to the unfrozen state. Accompanying this strength degradation, the peak strain shifts significantly to the right, thereby widening the pre-peak plastic yield region, while the slope of the post-peak descending branch gradually flattens. Such morphological evolution indicates a macroscopic transition of the material from brittle to semi-brittle or ductile behavior [9].
The evolution of these macroscopic mechanical responses fundamentally reflects the detrimental effects of F-T fatigue on the material’s microstructure. On one hand, the frost-heaving pressure induced by the ice–water phase transition drives the propagation of native internal microcracks, resulting in a substantial increase in the pore volume within the matrix (detailed in Section 3.3.2). This degradation of the volumetric modulus directly contributes to the intensified compaction effect during the initial stage of compression. On the other hand, the lubricating and softening effects of internal free water further compromise the interfacial bond between the aggregates and the cementitious matrix [27]. This exacerbates interfacial frictional sliding and the stable propagation of microcracks under compressive loading, which macroscopically manifests as enhanced pre-peak ductility and a broadened yield region. Ultimately, these underlying micro-degradation mechanisms provide a robust mechanical foundation for the subsequent formulation of a damage model based on characteristic stress–strain parameters.

3.2.2. Evolution of Elastic Modulus with F-T Cycles

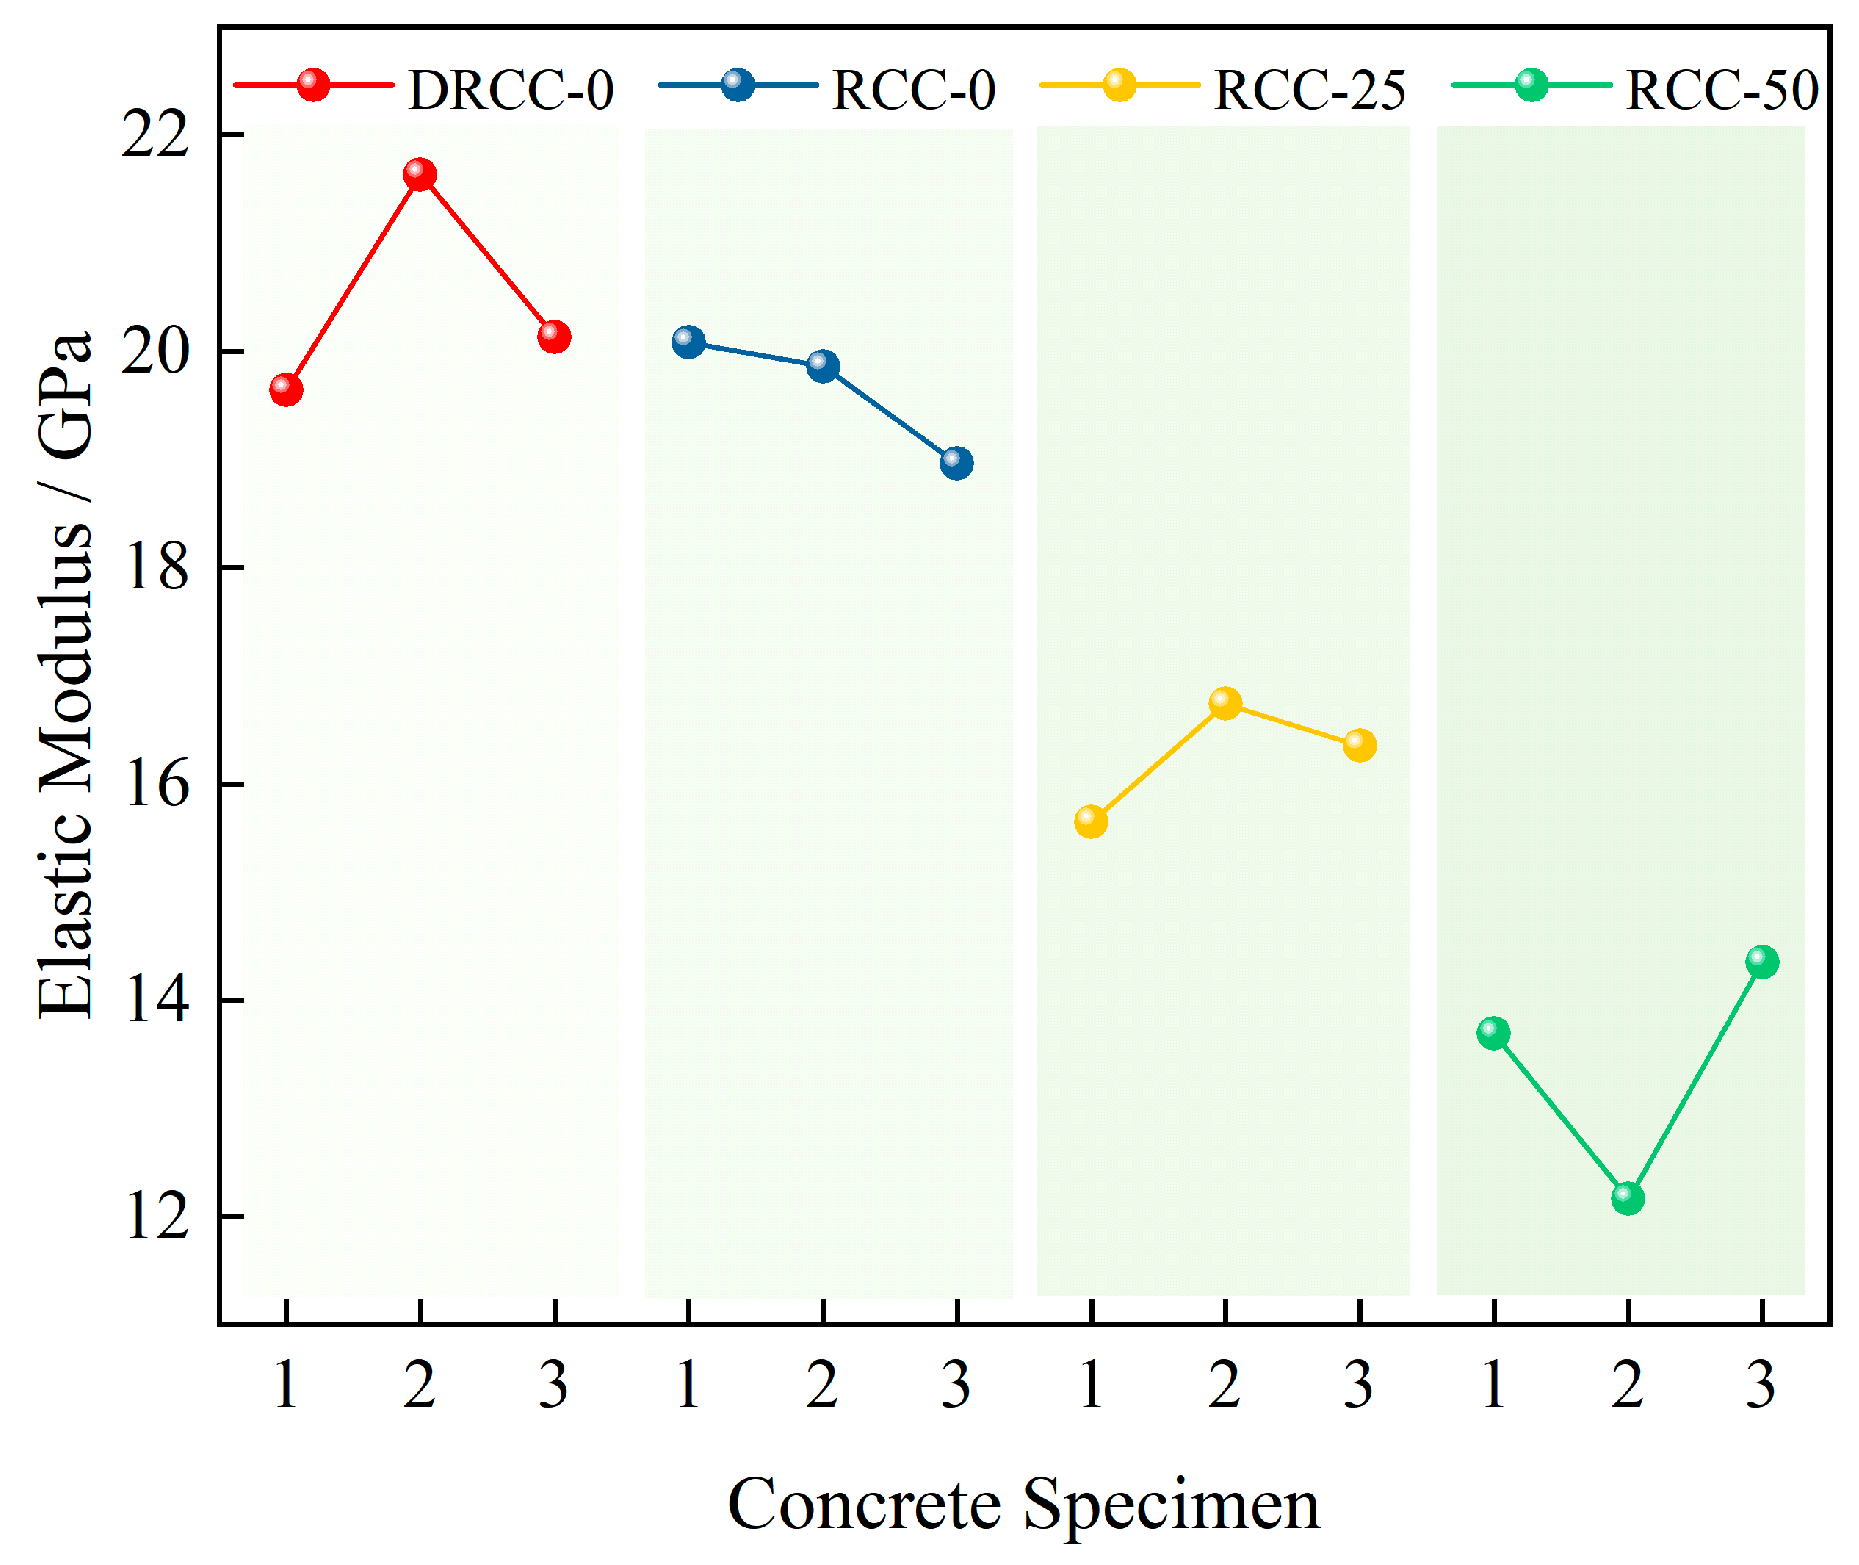
As illustrated in Figure 6, the elastic modulus of the DRCC specimens exhibits remarkably high stability, with all three parallel replicates maintaining values above 20 GPa, reaching a peak of 21.63 GPa. In contrast, the elastic modulus of the saturated RCC specimens decreases significantly with the increase in F-T cycles. Specifically, the elastic modulus of the unfrozen saturated specimens (RCC-0) ranges from 18 to 20 GPa. When the number of F-T cycles increases to 25, the elastic modulus drops to the 15–17 GPa range. Upon reaching 50 F-T cycles, the elastic modulus further degrades to a minimum of 12.16 GPa, which represents approximately only 56% of its initial value. This pronounced degradation highlights that the coupled effects of F-T cycling and moisture ingress exert a significantly detrimental impact on the mechanical properties of saturated RCC [28].
Given the non-linear nature of F-T damage, simple empirical curve fitting struggles to reveal the genuine underlying degradation mechanisms within the material. Drawing upon the mechanical framework established by Bai et al. [9] for concrete damage modeling, this study adopts a macroscopic phenomenological damage variable D defined by the degradation of the elastic modulus, rooted in continuum damage mechanics theory. Physically, this variable equates the microscopic pore interconnection induced by F-T action to the reduction in the macroscopic effective load-bearing area. The governing equation is formulated as follows:
D = 1 E N E 0
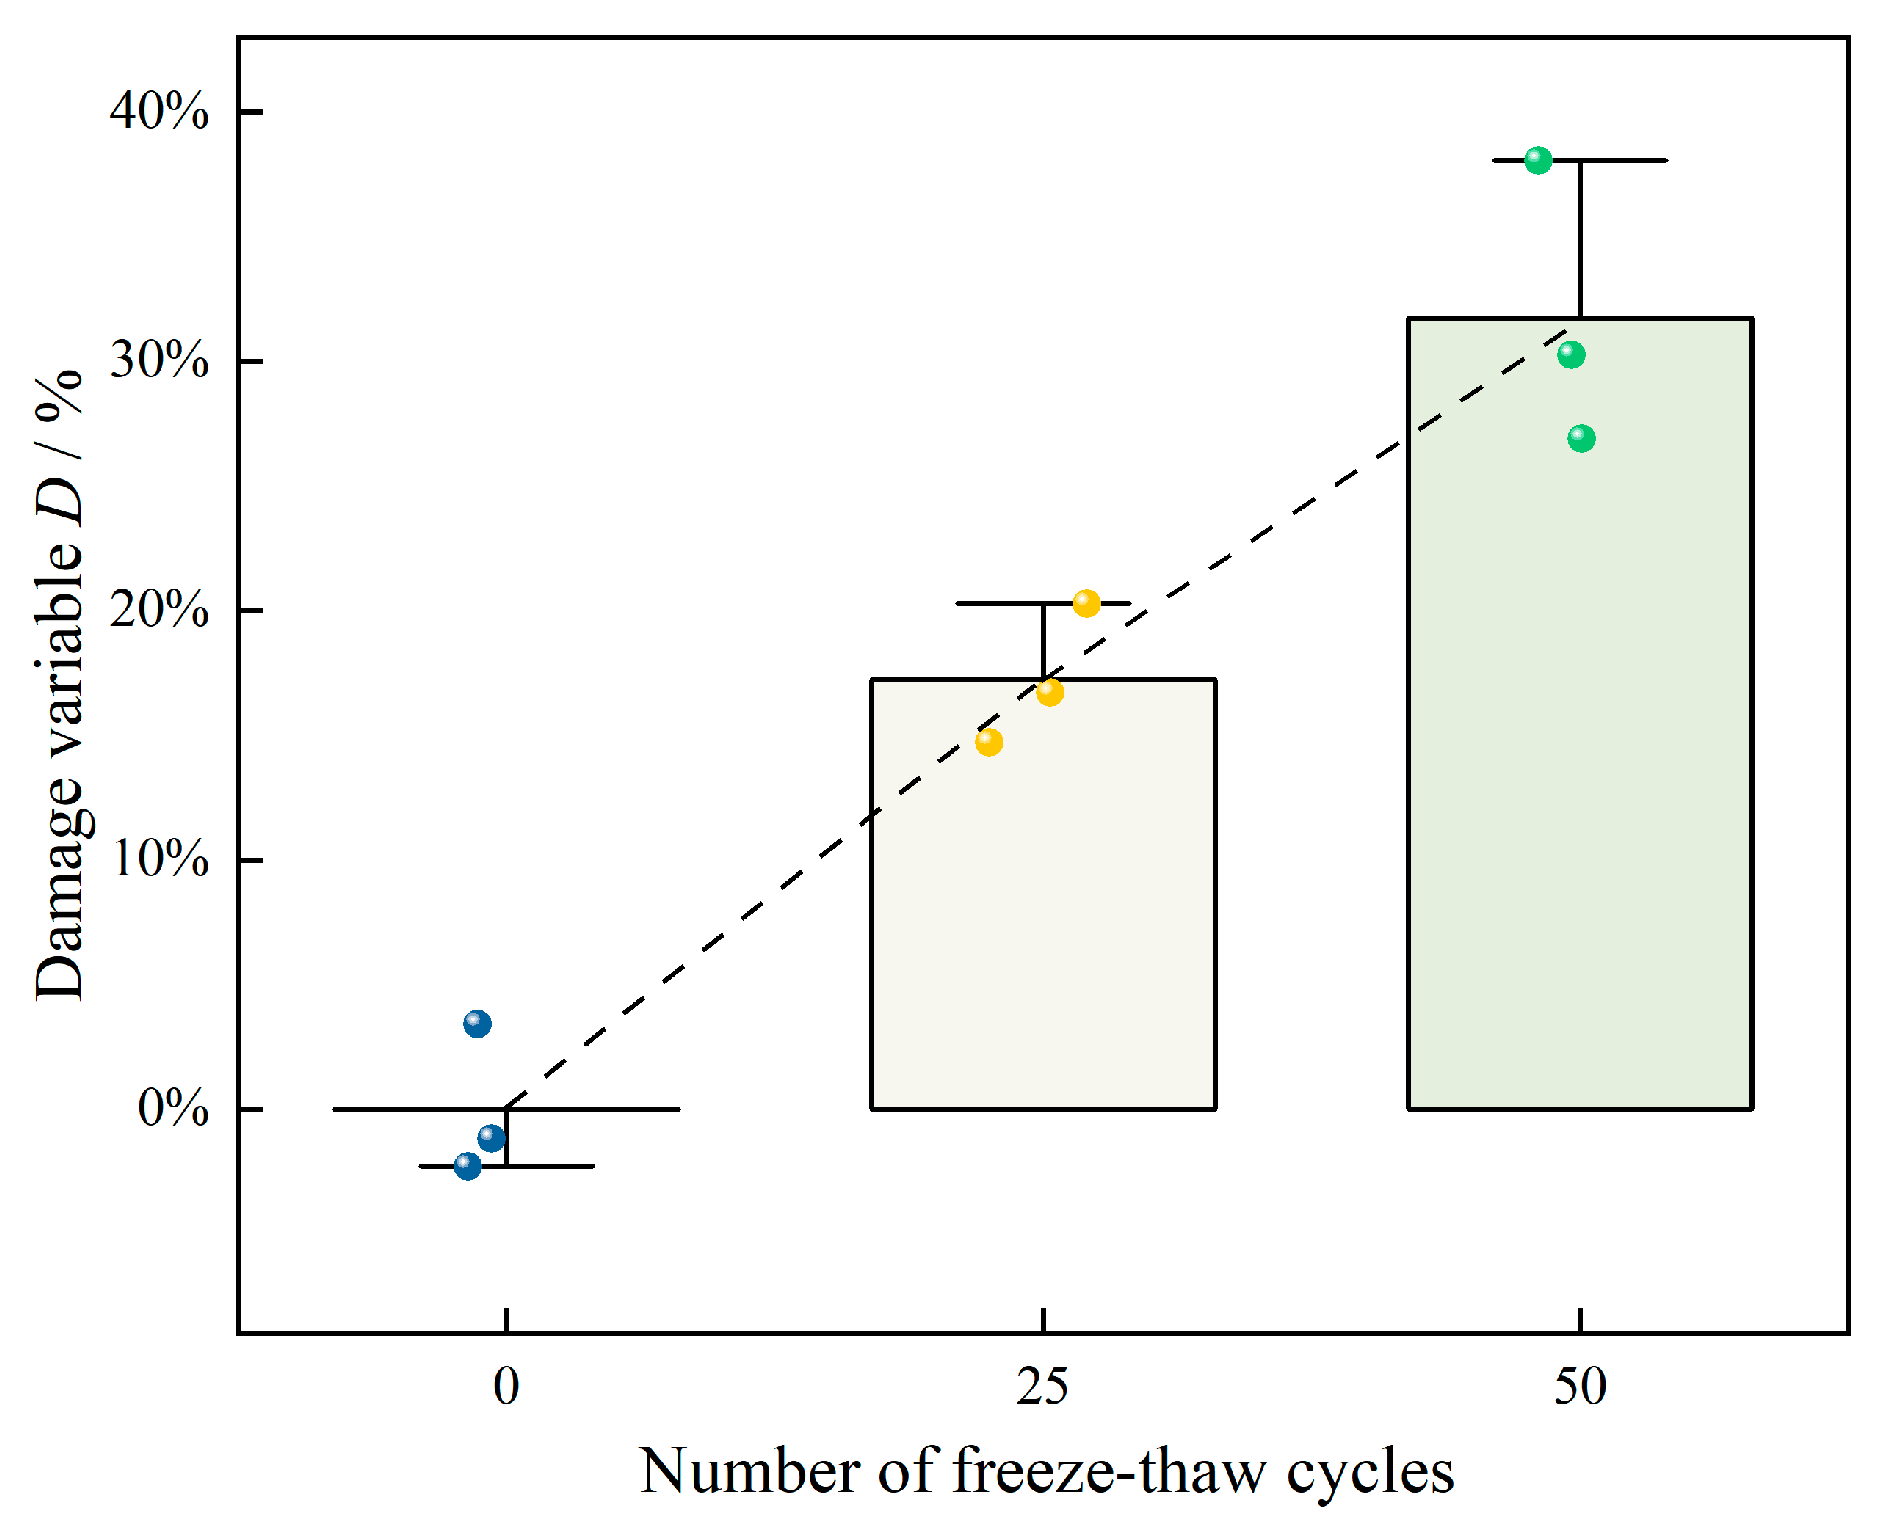
where E 0 is the initial elastic modulus of the unfrozen specimens, and E 0 represents the elastic modulus after N F-T cycles. During data processing, the mean elastic modulus of the saturated control group (RCC-0) was designated as the baseline E 0 to calculate the macroscopic damage degree for the parallel replicates in each F-T group. The corresponding statistical evolution results are presented in Figure 7. As visually evident in Figure 7, the standard deviations of the damage variable for all specimen groups are maintained at a low level, ranging from 2.82% to 5.73%. The scatter points of the three independent replicates are tightly clustered around the mean bars, demonstrating the high reproducibility and data reliability of the destructive uniaxial compression tests. This finding effectively eliminates significant individual statistical errors arising from the heterogeneity of concrete. The dashed line in the figure serves as a mean trend guide, revealing the multi-stage non-linear characteristics of damage evolution in the RCC material, which intuitively reflects the intrinsic mechanisms governing the degradation of the elastic modulus. Specifically, the damage evolution process can be divided into two stages. The period from 0 to 25 F-T cycles is characterized as the initial rapid deterioration stage, where the trend line exhibits a steep slope, and the average damage degree D rapidly reaches 17.25%. This rapid degradation is attributed to the high initial free water content and abundant interconnected pores inherent to the high w/b ratio system of 0.65. Consequently, the early-stage frost-heaving pressure acts violently on the weak zones of the matrix, driving the rapid initiation and propagation of micro-defects. The stable development and deceleration stage occurs between 25 and 50 F-T cycles. As the number of cycles exceeds 25, the slope of the trend line notably flattens. By the 50th cycle, the D value increases to 31.75%, with a damage increment of 14.50% during this stage, which is lower than the initial increment of 17.25%. This phenomenon suggests that following the coalescence of initial macropores and ITZ microcracks, a pressure-relief network is formed within the material. The newly generated cracks provide buffer space for the volume expansion associated with subsequent ice–water phase transitions. Consequently, the hydrostatic and crystallization pressures are partially released, leading to a staged deceleration in the reduction rate of the macroscopic effective load-bearing area.

3.2.3. Evolution of Peak Stress with F-T Cycles

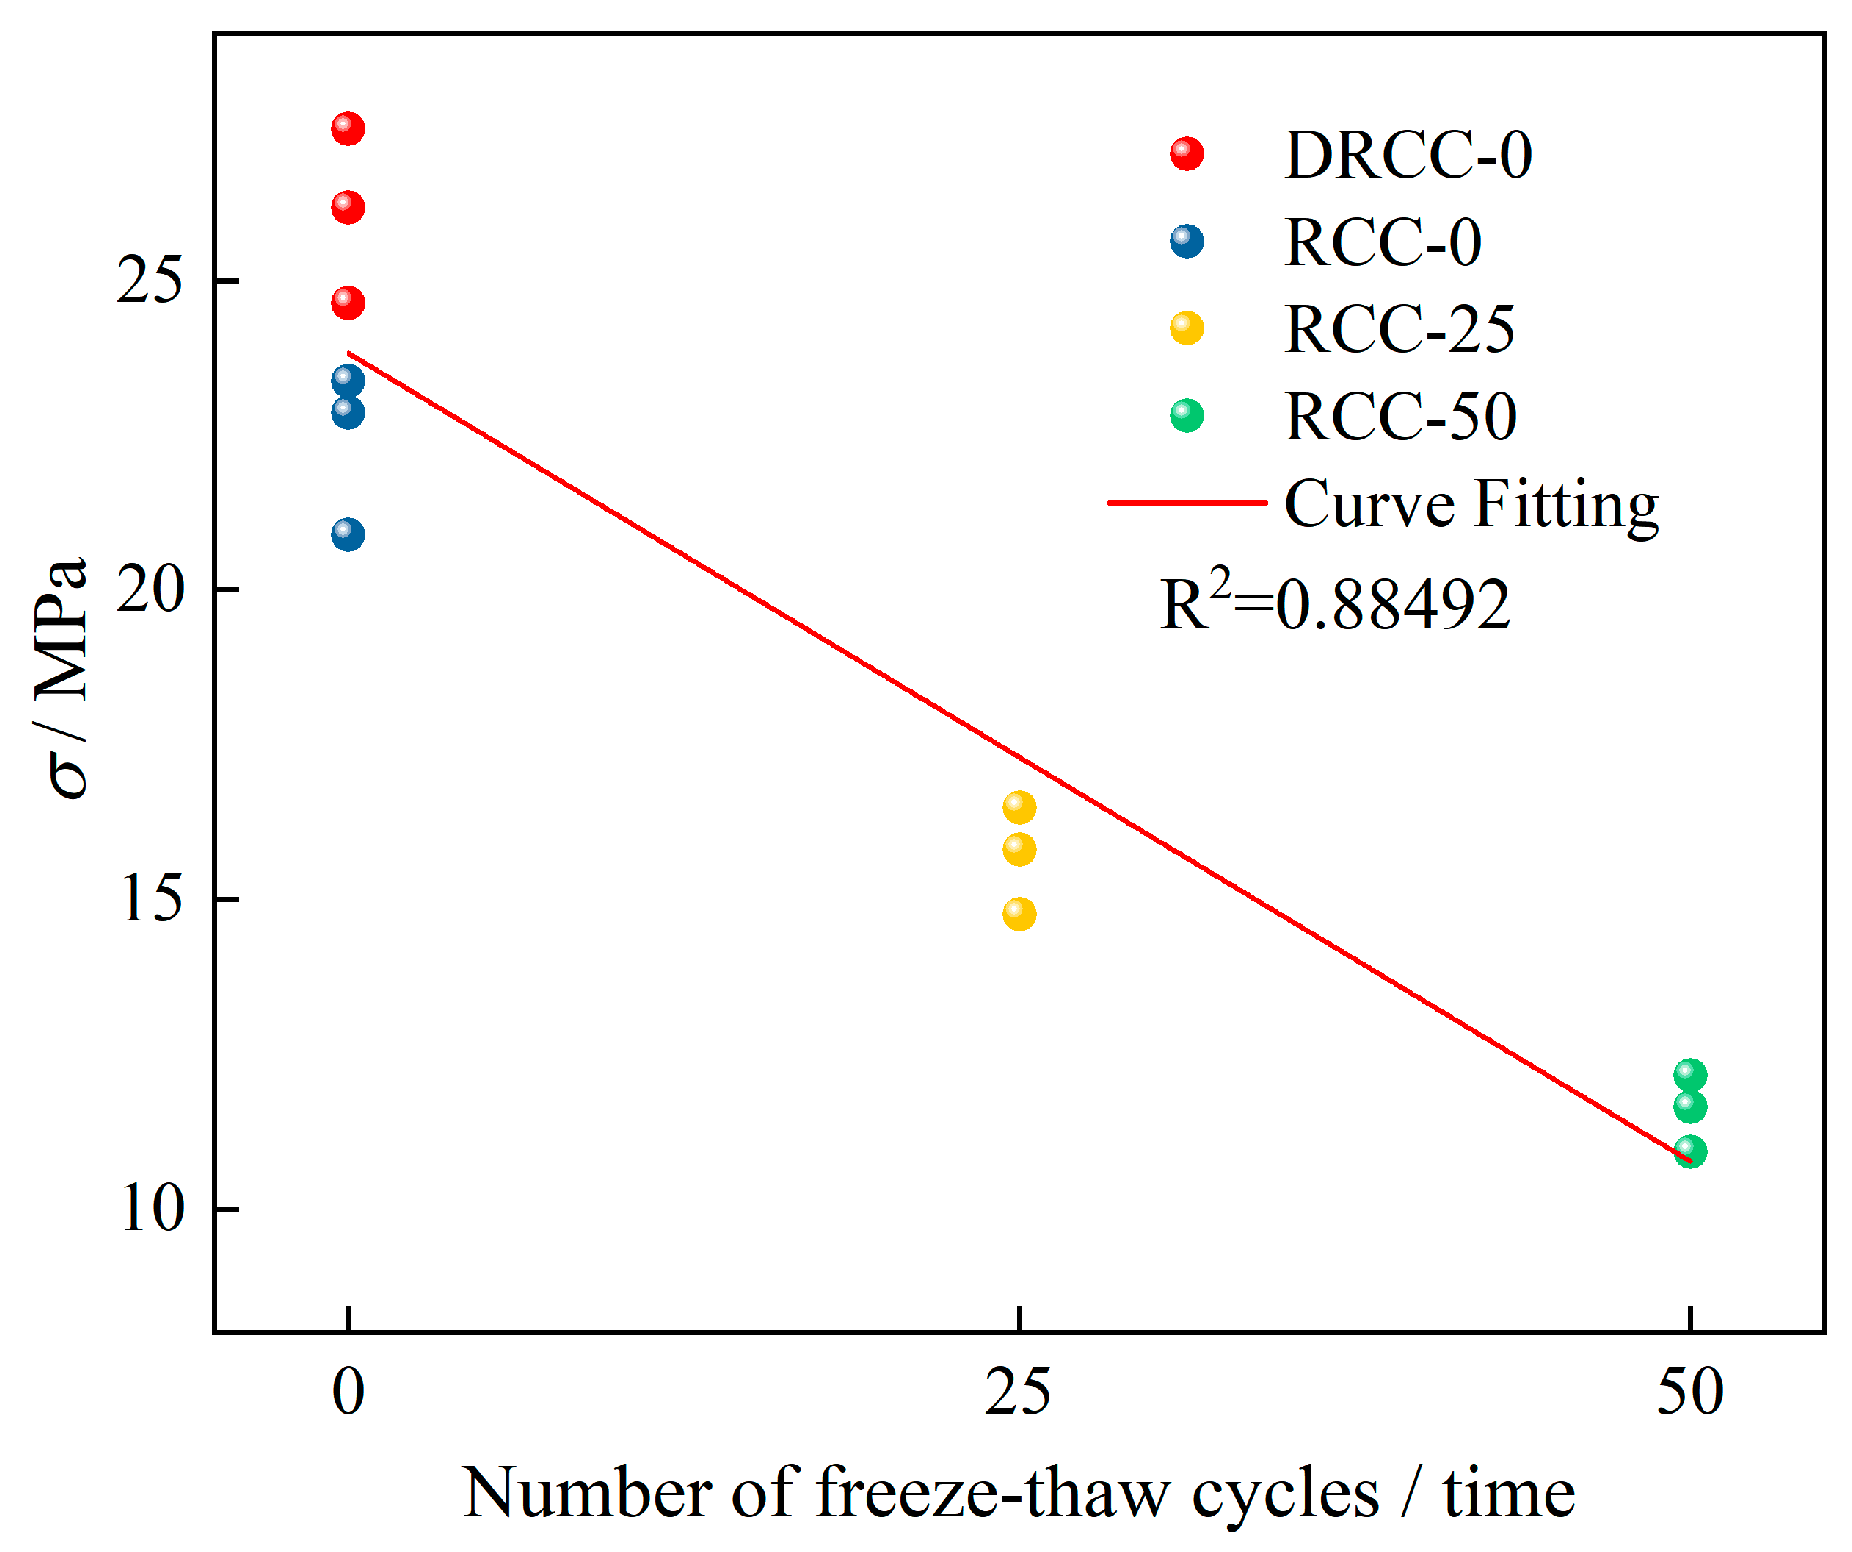
Figure 8 depicts the evolution of peak stress as a function of F-T cycles. Evidently, the peak stress of the RCC exhibits a pronounced negative correlation with the accumulation of F-T cycles. The corresponding empirical relationship is formulated as follows:
σ m = 23.82788 0.26131 N
where σ m is the peak stress, and N denotes the number of F-T cycles.
Specifically, the peak stress of the saturated RCC specimens exhibited a 20.07% reduction compared to their dry counterparts. Mechanistically, this phenomenon stems from the numerous internal pores and micro-cavities formed during the RCC preparation process, which become infiltrated by moisture. The free water entrapped within these voids exerts an incompressible cushioning effect. Consequently, upon reaching the peak strength, the post-peak brittle stress drop in the saturated specimens is somewhat mitigated compared to that in the dry specimens. Upon exposure to F-T cycles, the internal structure of the RCC undergoes irreversible deterioration, characterized by a proliferation in pore quantity and an enlargement in pore diameter. Furthermore, existing studies on conventional F-T cycling [29] have demonstrated that with an increasing number of cycles, the damage evolution is highly dependent on the concrete strength grade. This indirectly reflects the complex implications of internal structural alterations on the macroscopic mechanical properties.

3.2.4. Failure Characteristics

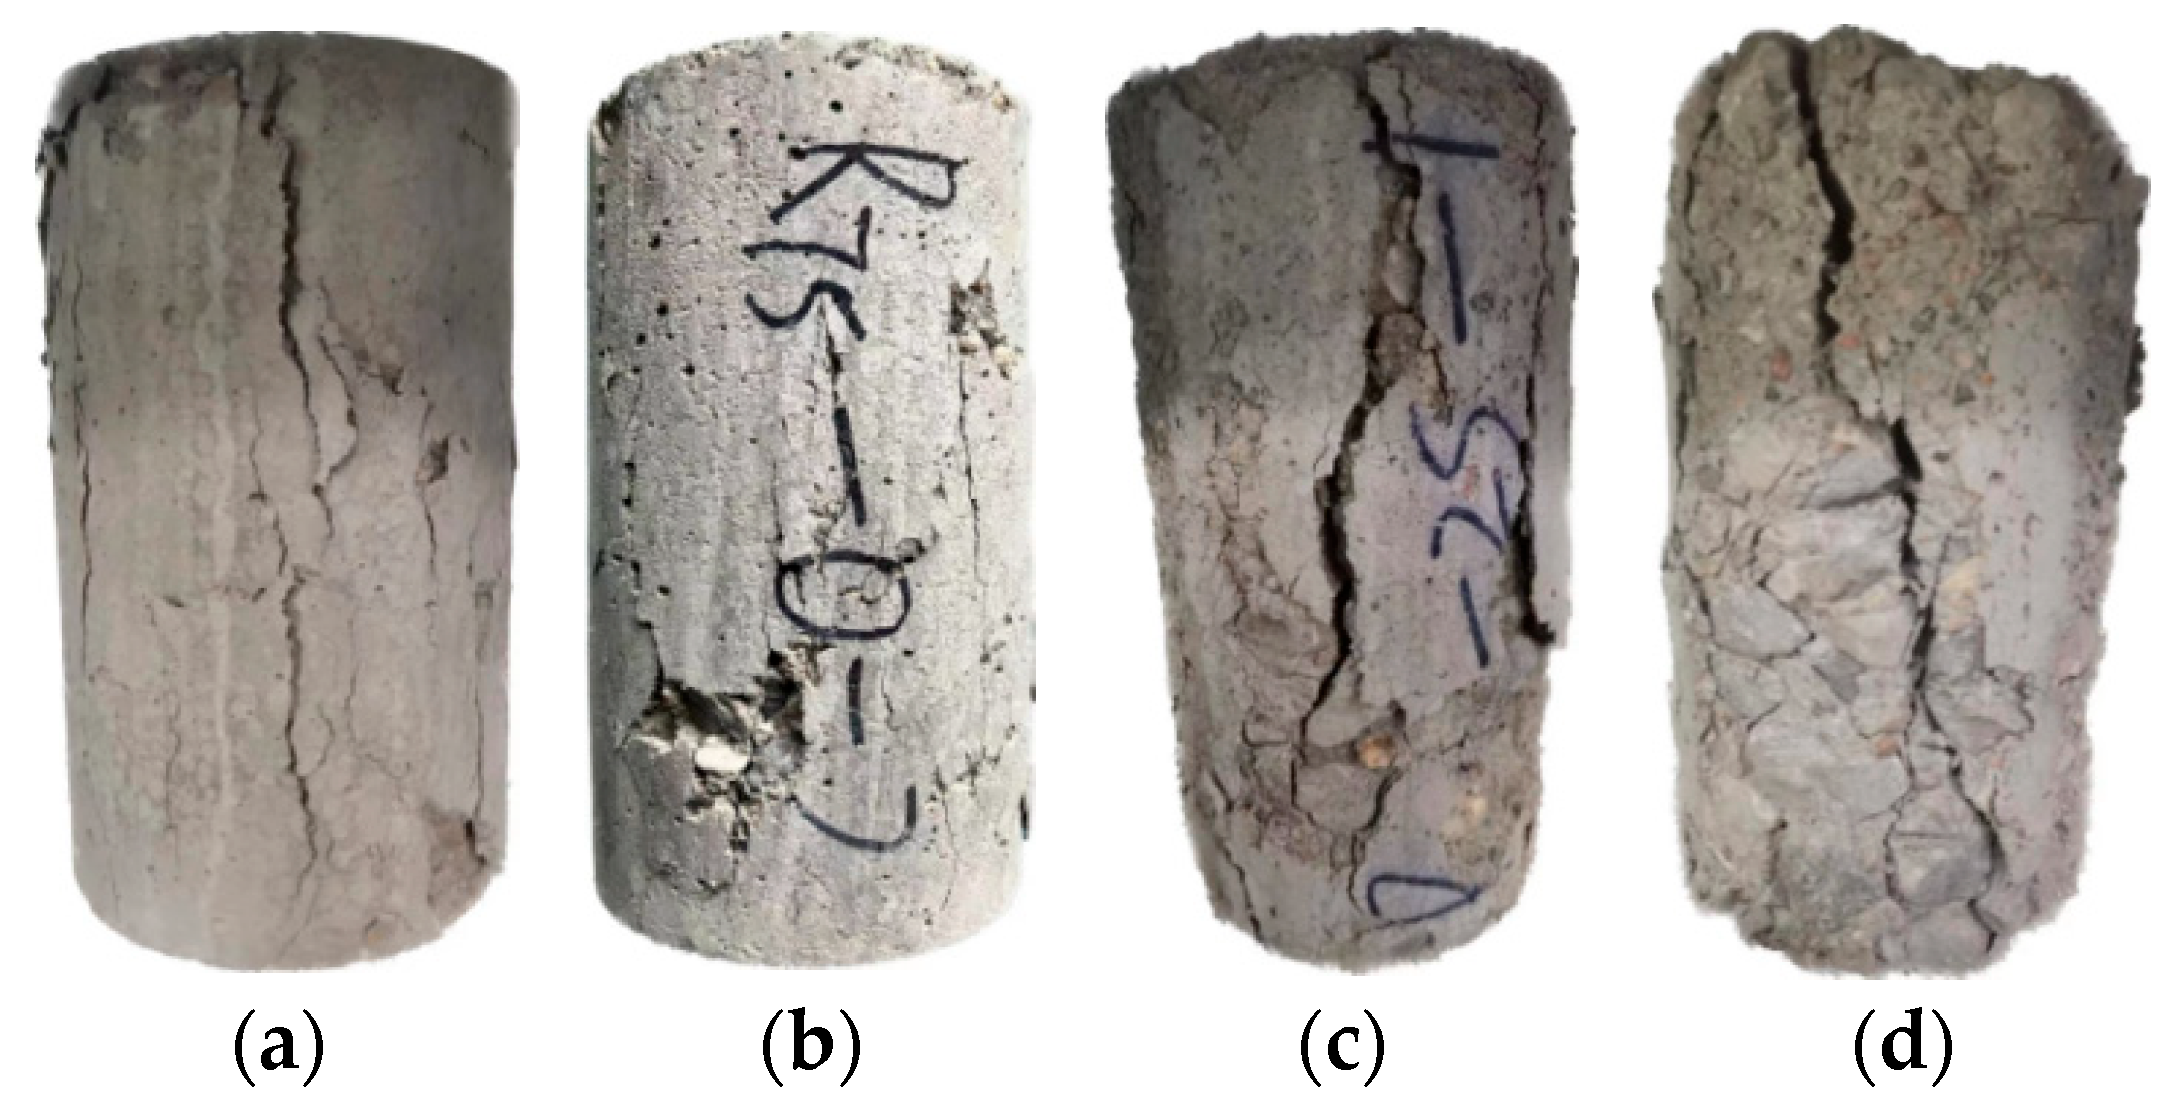
Following exposure to varying F-T cycles, the RCC specimens exhibit distinctly different macroscopic failure modes under uniaxial compression. As illustrated in Figure 9a, during the uniaxial compression process, the dry RCC specimens rapidly develop multiple axial cracks, with the maximum width reaching approximately 5 mm. As depicted in Figure 9b, compared to their dry counterparts, the saturated specimens display multiple narrower, short cracks parallel to the loading axis, which are predominantly concentrated in the central region of the specimens. As observed in Figure 9c [for the specimens subjected to 25 F-T cycles], a relatively wide diagonal primary crack emerges on the surface, accompanied by multiple short, inclined secondary cracks. The substantial width of the primary crack indicates severe localized damage in this region. As shown in Figure 9d, compared to the specimens after 25 F-T cycles, the specimens subjected to 50 F-T cycles are characterized by a single, prominent diagonal primary crack with a maximum width of approximately 8 mm. Furthermore, pronounced crack propagation is observed along the aggregate peripheries. Evidently, as the number of F-T cycles increases substantially, the internal structure of the specimens undergoes severe degradation. The interface between the aggregates and the cement mortar transforms into a highly vulnerable zone. Under the cyclic action of F-T fatigue, microcracks continuously propagate and coalesce. Ultimately, this structural deterioration culminates in a macroscopic failure mode progressively dominated by a primary diagonal crack [30].
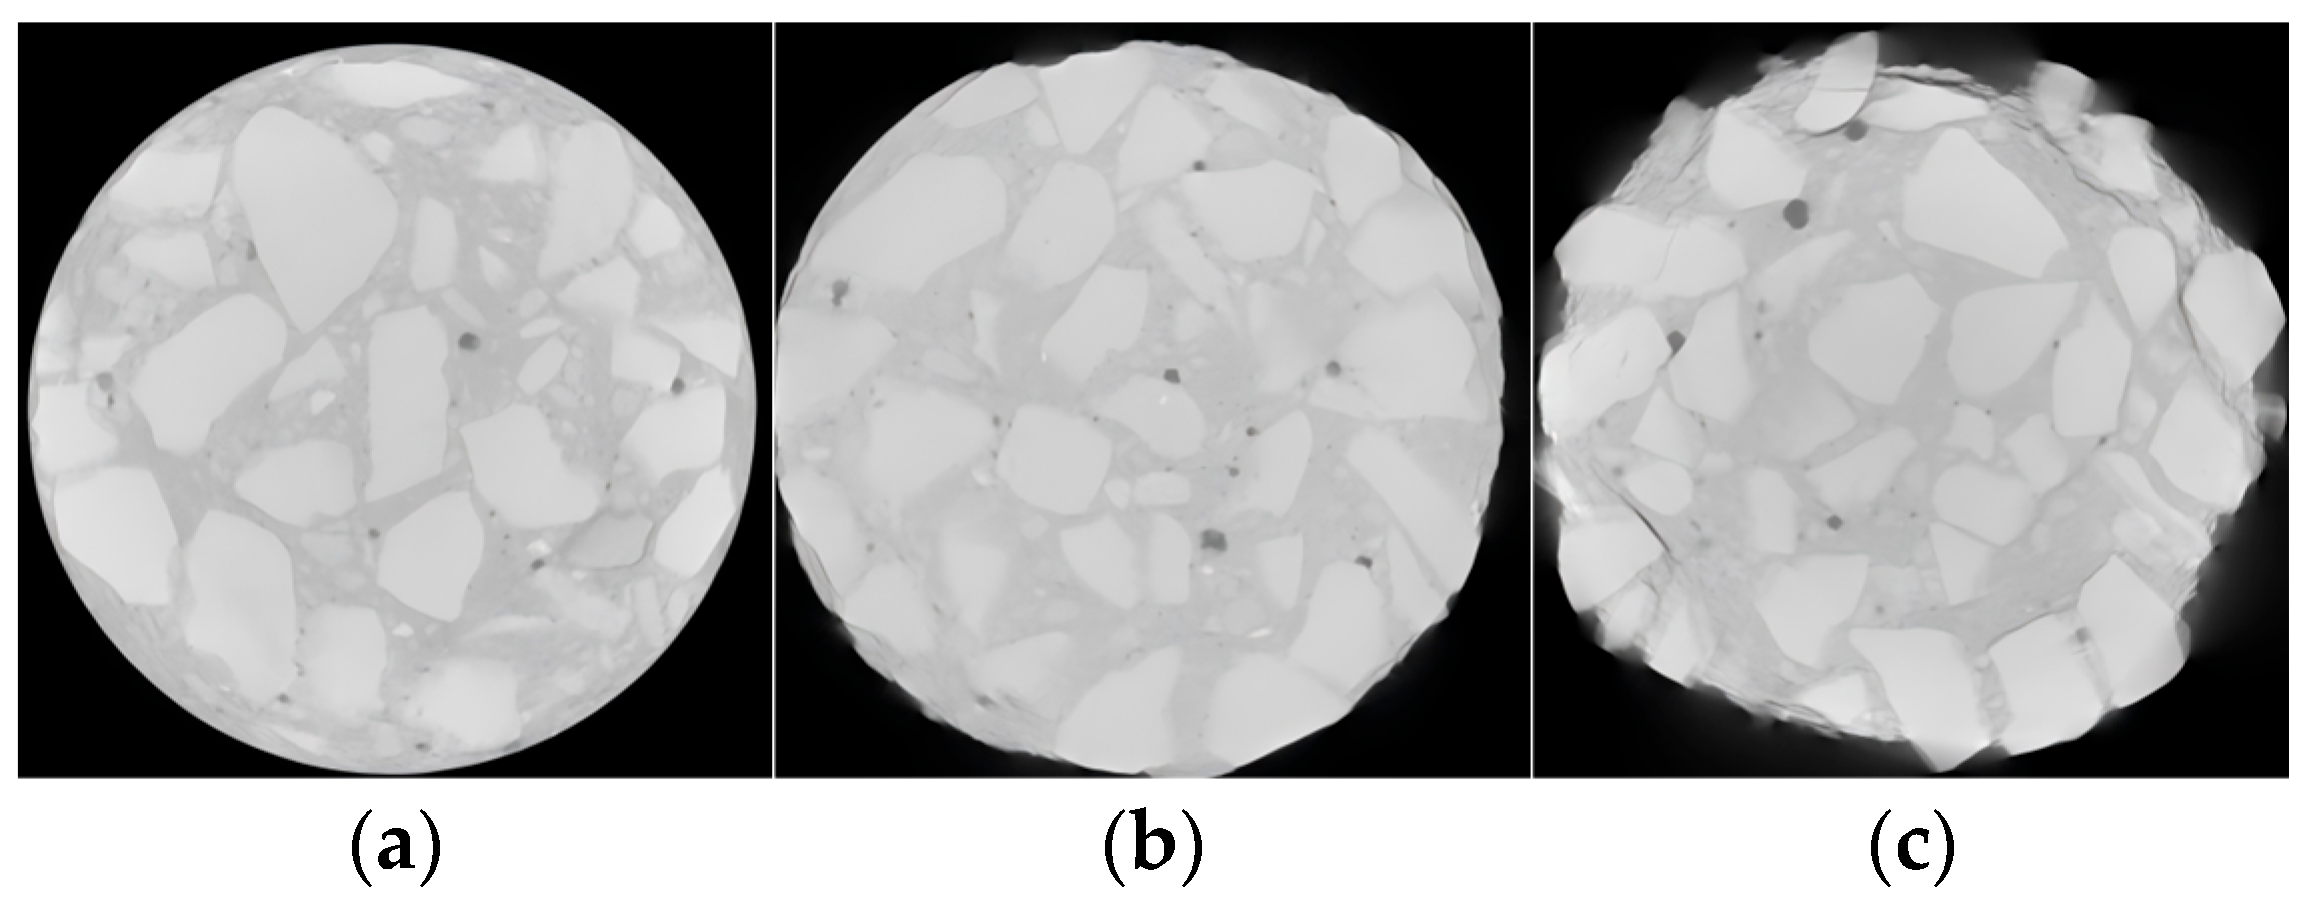
CT scanning was conducted on the specimens subjected to 0, 25, and 50 F-T cycles, respectively. Figure 10 presents the 2D cross-sectional tomographic slices of the RCC before and after F-T deterioration. A comparative analysis of these 2D scans across varying F-T cycles reveals that as the number of cycles increases, localized defects progressively enlarge. Concurrently, the cement mortar undergoes detachment, and the microcrack networks coalesce, ultimately culminating in the formation of continuous damage zones.

3.3. Microscopic Damage Under Uniaxial Compression

3.3.1. Evolution of AE Ring-Down Counts and Energy, and Damage Stage Identification

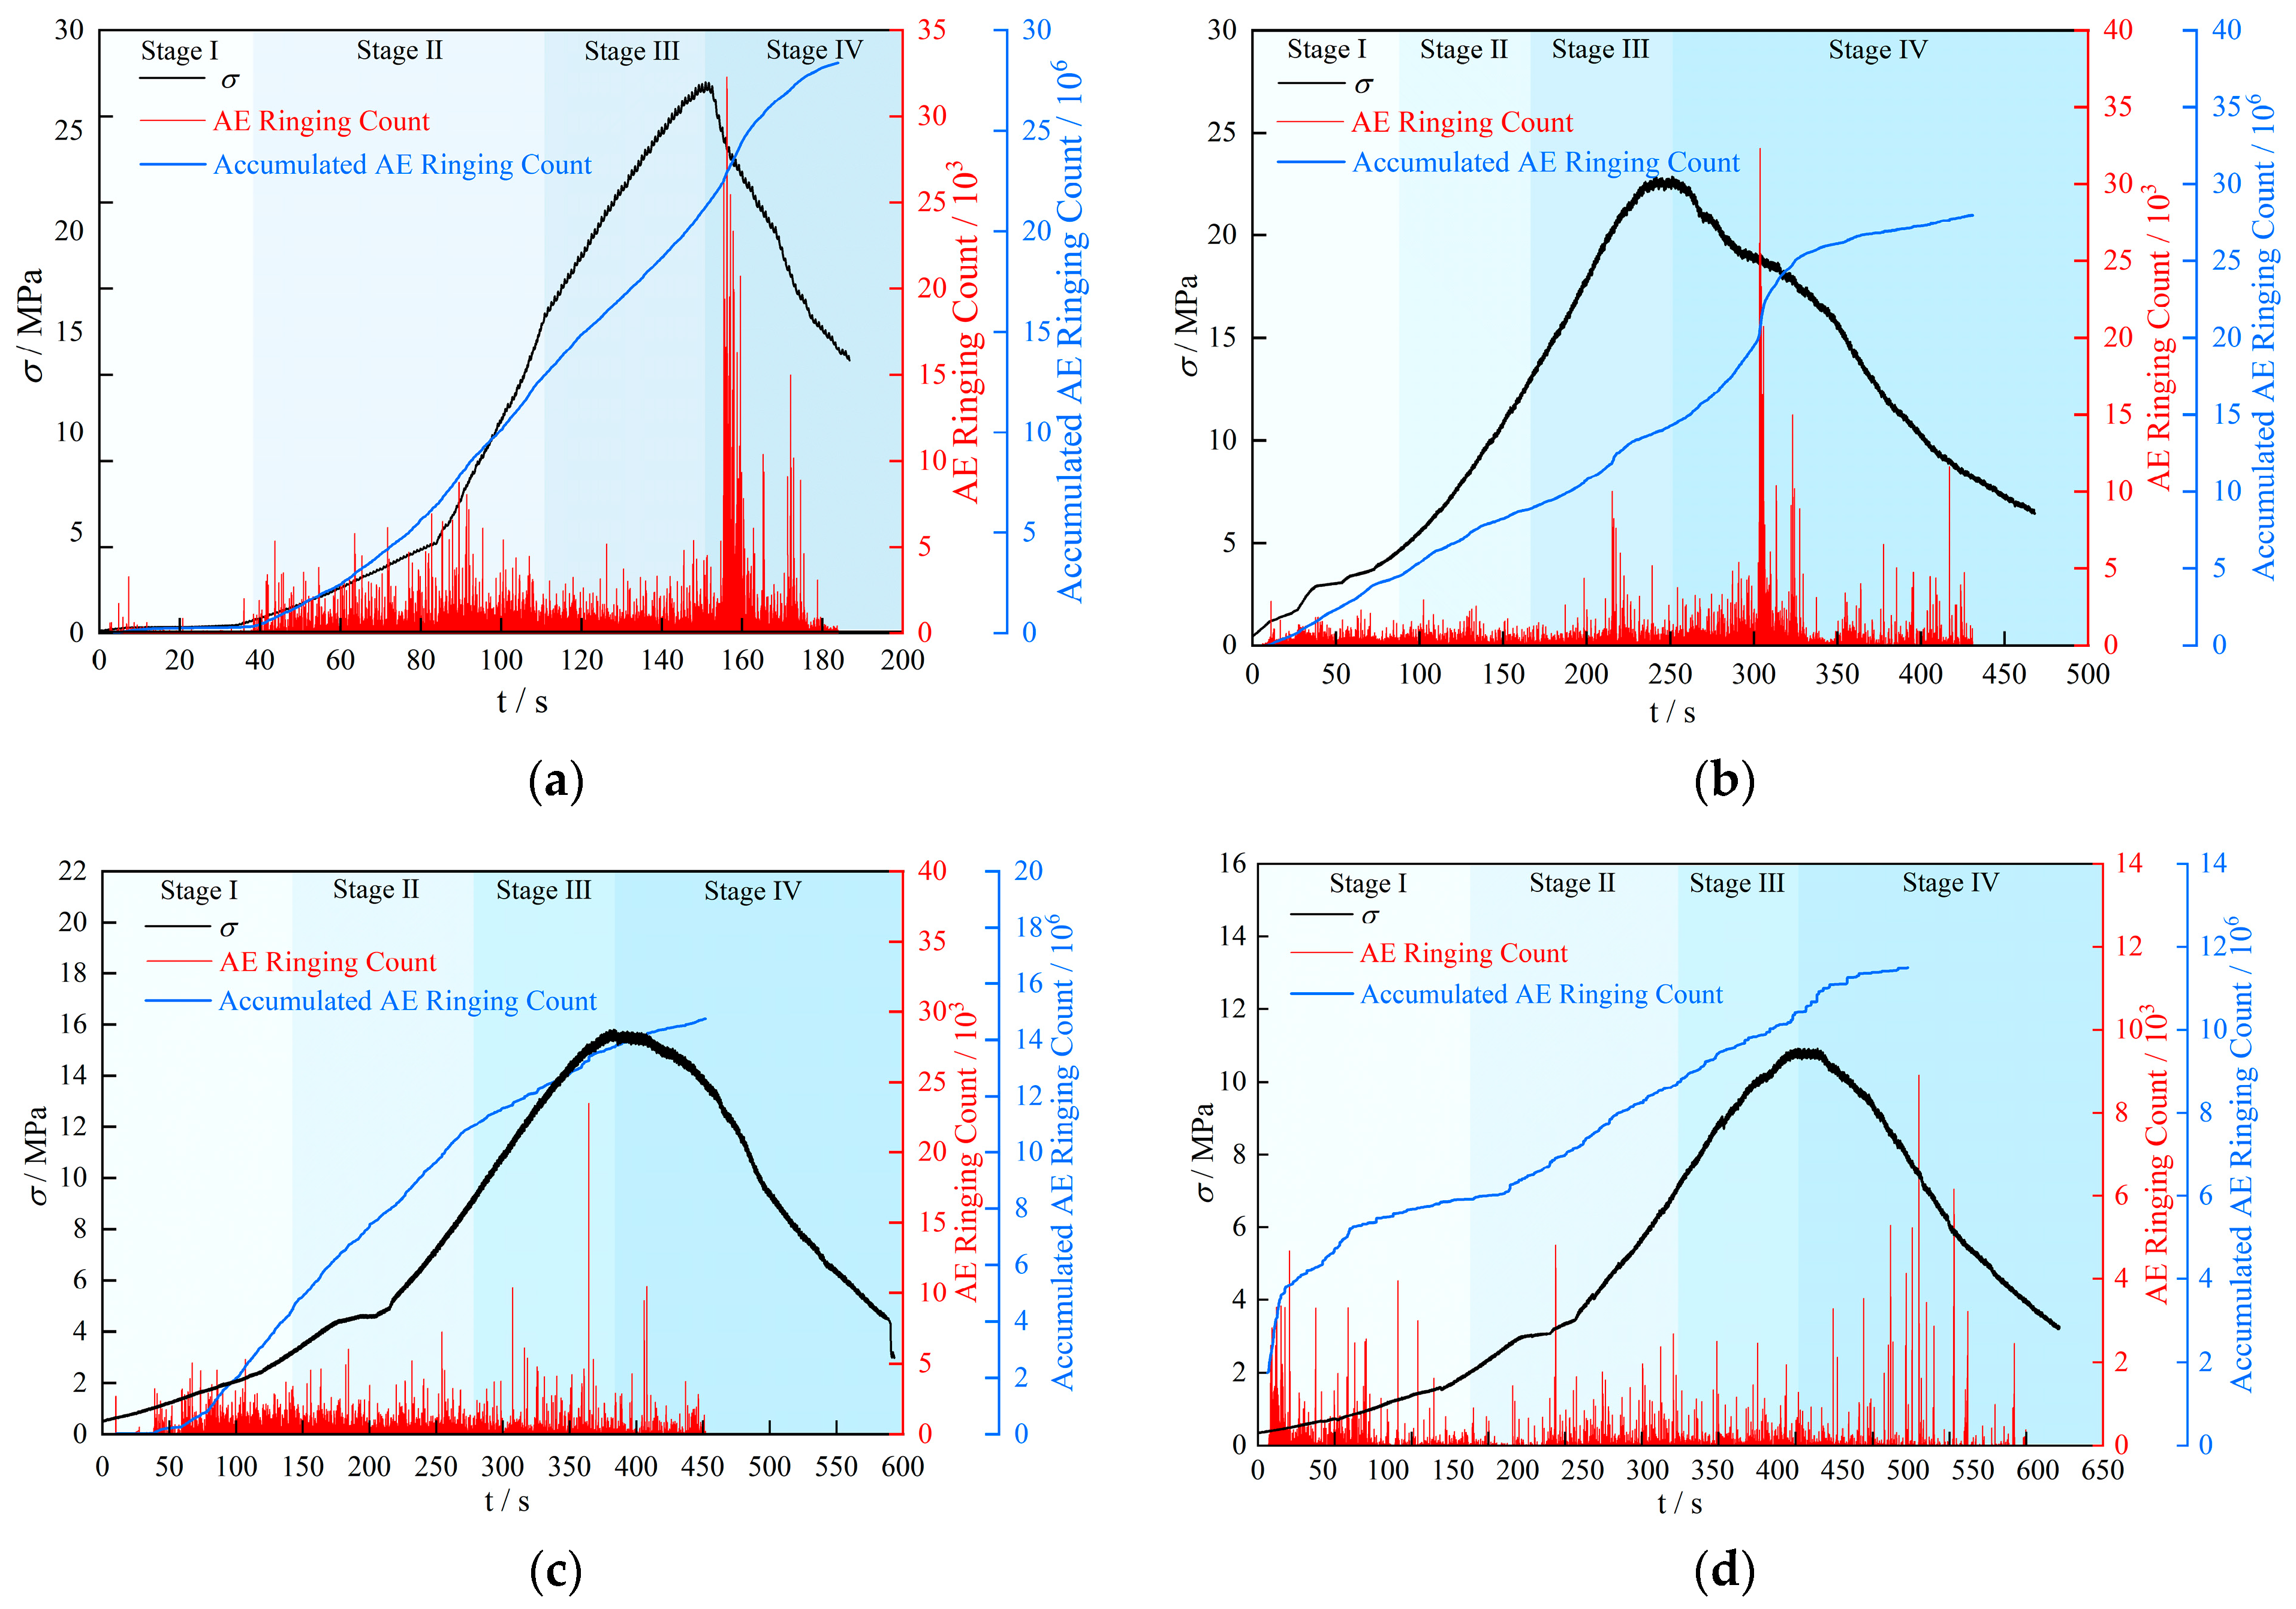
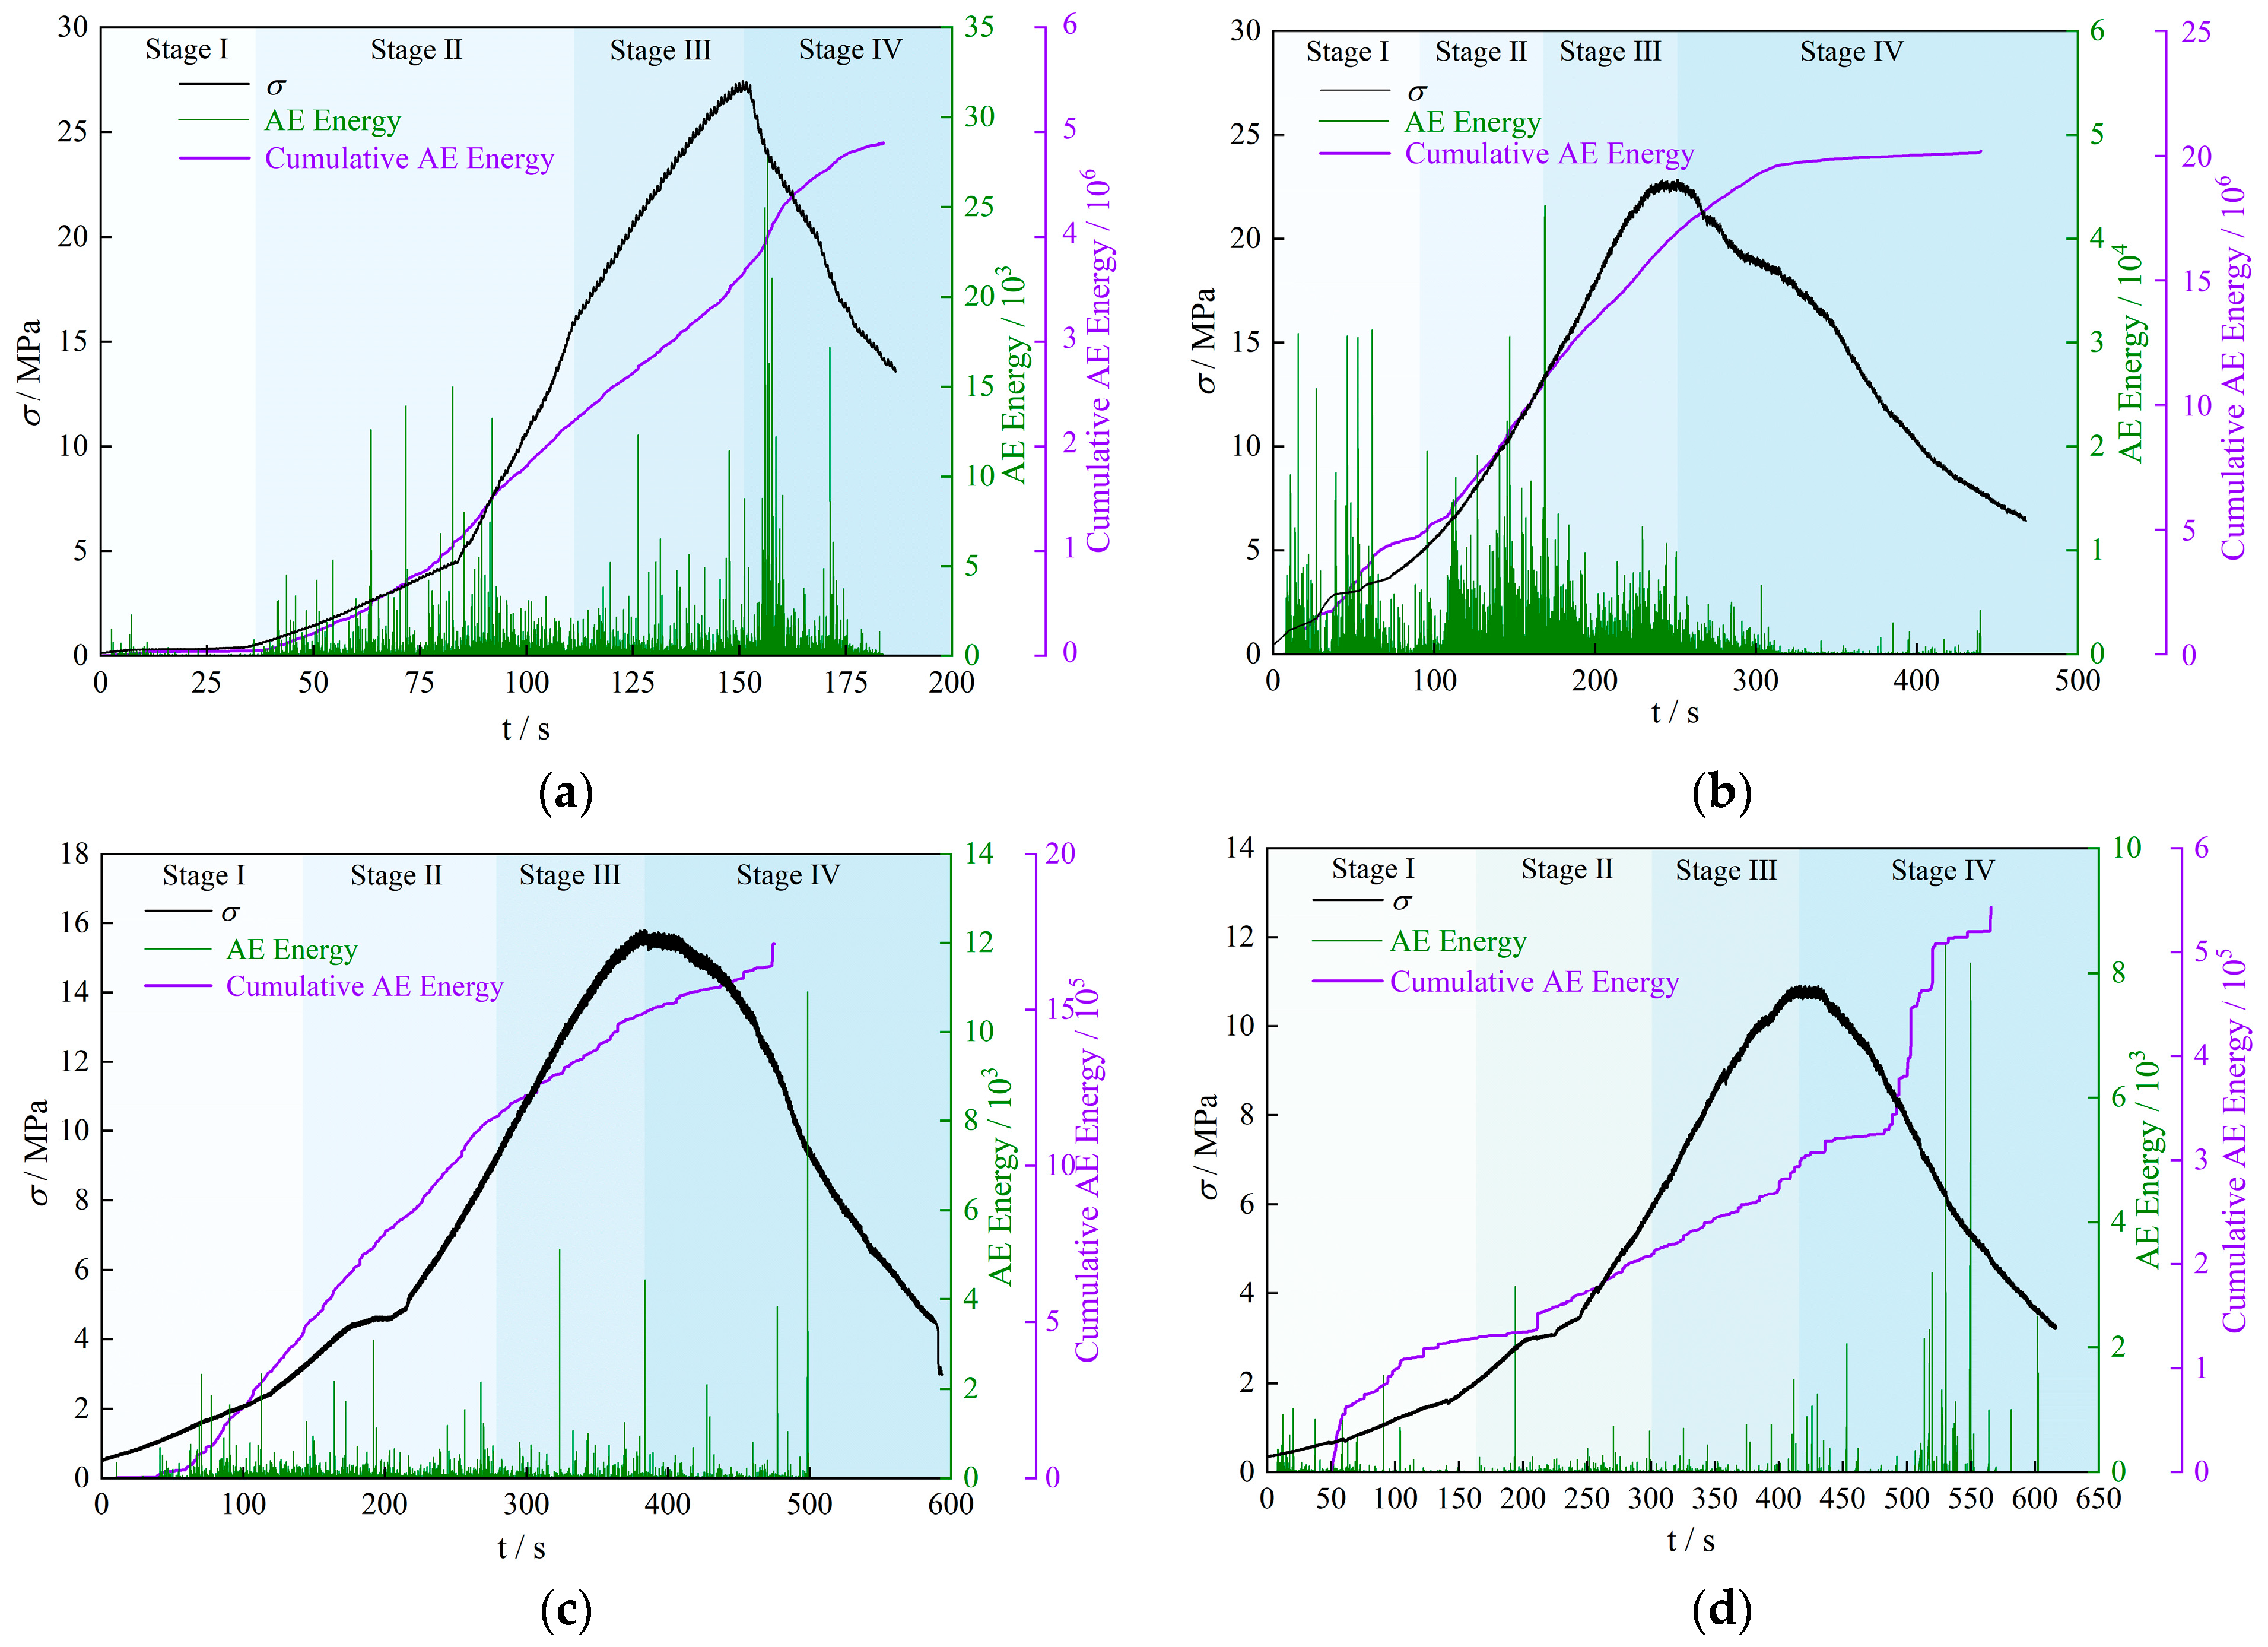
Utilizing the synchronized monitoring of AE ring-down counts and energy, one representative specimen from each of the four experimental conditions was selected for detailed analysis. The corresponding evolutionary profiles are illustrated in Figure 11 and Figure 12. To ensure an accurate representation of the universal trends across all conditions, the stress–strain curves and AE parameters of the selected specimens were strictly constrained within a ±5% deviation from their respective group means. By correlating the morphological features of the stress–strain curves with the abrupt transition points in the AE parameters, the compressive failure process of the specimens can be delineated into four distinct stages: initial compaction, elastic deformation, crack coalescence, and macroscopic failure [31].
During the first stage, designated as the initial compaction stage, the native internal microcracks within the specimens gradually close under axial compression. For the dry specimens, this compaction process is exceedingly brief, accompanied by overall faint AE signals. However, as the F-T damage escalates, the duration of the compaction stage for specimens subjected to 25 and 50 F-T cycles is significantly prolonged. This phenomenon intuitively reflects that the frost-heaving pressure induced by the ice–water phase transition has generated a proliferation of initial microcracks within the material matrix. Consequently, an increasingly pronounced deformation hysteresis effect is observed during the early stage of compressive loading.
Upon entering the second stage, i.e., the elastic deformation stage, the internal microcracks within the specimens undergo stable initiation. As elucidated by the relevant transient elastic wave fracture model [32], the dry specimens emit intermittent, high-amplitude burst signals during this period, accompanied by multiple abrupt surges in single-event strain energy. In contrast, the water-bearing state and F-T-induced pre-damage significantly suppress the release of elastic energy. For the F-T damaged specimens, the peak values of single-event energy are drastically reduced during this stage, and the AE signals exhibit low-amplitude, continuous characteristics. This indicates that the damage evolution at this juncture is predominantly governed by localized frictional sliding at the microscopic scale.
The third and fourth stages correspond to the crack coalescence and macroscopic failure periods, respectively, marking the interval where the discrepancies in AE characteristics among different conditions are most pronounced. The dry specimens exhibit typical and catastrophic brittle fracture behavior. Their ring-down counts and strain energy undergo a synchronized surge in the vicinity of the ultimate stress point, with the cumulative strain energy rapidly increasing to nearly 4.8 × 10 6 mV ms . Conversely, the peak AE activity in the saturated specimens exhibits a distinct hysteresis phenomenon, wherein a massive cluster of high-amplitude ring-down counts bursts concentratively during the post-peak failure stage.
As F-T damage accumulates, the material’s macroscopic failure mode undergoes a fundamental transition. For the specimens subjected to 50 F-T cycles, the occurrence of peak stress is substantially delayed. Furthermore, the AE signals during the failure stage transition from concentrated bursts to prolonged temporal dispersion. As illustrated by the energy evolution in Figure 12, the final cumulative strain energy of this specimen plummets to 5.5 × 10 5 mV ms , representing a reduction of nearly an order of magnitude compared to its dry counterpart. The precipitous degradation of the energy release capacity, coupled with the delayed and dispersed nature of the signals, compellingly demonstrates that severe F-T damage fundamentally dismantles the localized storage mechanism of elastic strain energy within the matrix. Consequently, the fracture mode smoothly transitions from brittle, transient energy release—triggered by the coalescence of a few primary macroscopic cracks—to ductile, progressive failure, which is predominantly governed by the frictional dissipation of massively dispersed microcracks [17,33].

3.3.2. Evolution of Pore Structure Characteristics

The three-dimensional internal structure of the RCC specimens was acquired via high-resolution industrial CT scanning. Given the equipment’s physical spatial resolution of 139 μm and the inherent partial volume effect, 3D median filtering was applied to the raw tomographic slices to mitigate digital artifacts at the grayscale edges. Subsequently, Otsu’s thresholding method was employed to accurately segment the pores from the solid matrix [10] using Avizo software (Version 9.0, Thermo Fisher Scientific, Waltham, MA, USA). In accordance with the ASTM E1441 [34] non-destructive testing standard and the Shannon–Nyquist sampling theorem [35], the identifiable dimension of effective features must strictly exceed twice the spatial resolution. Consequently, unstable signals spanning less than two to three voxels were discarded, and the lower-bound threshold for the quantitative extraction of effective pores was strictly defined as 300 μm.
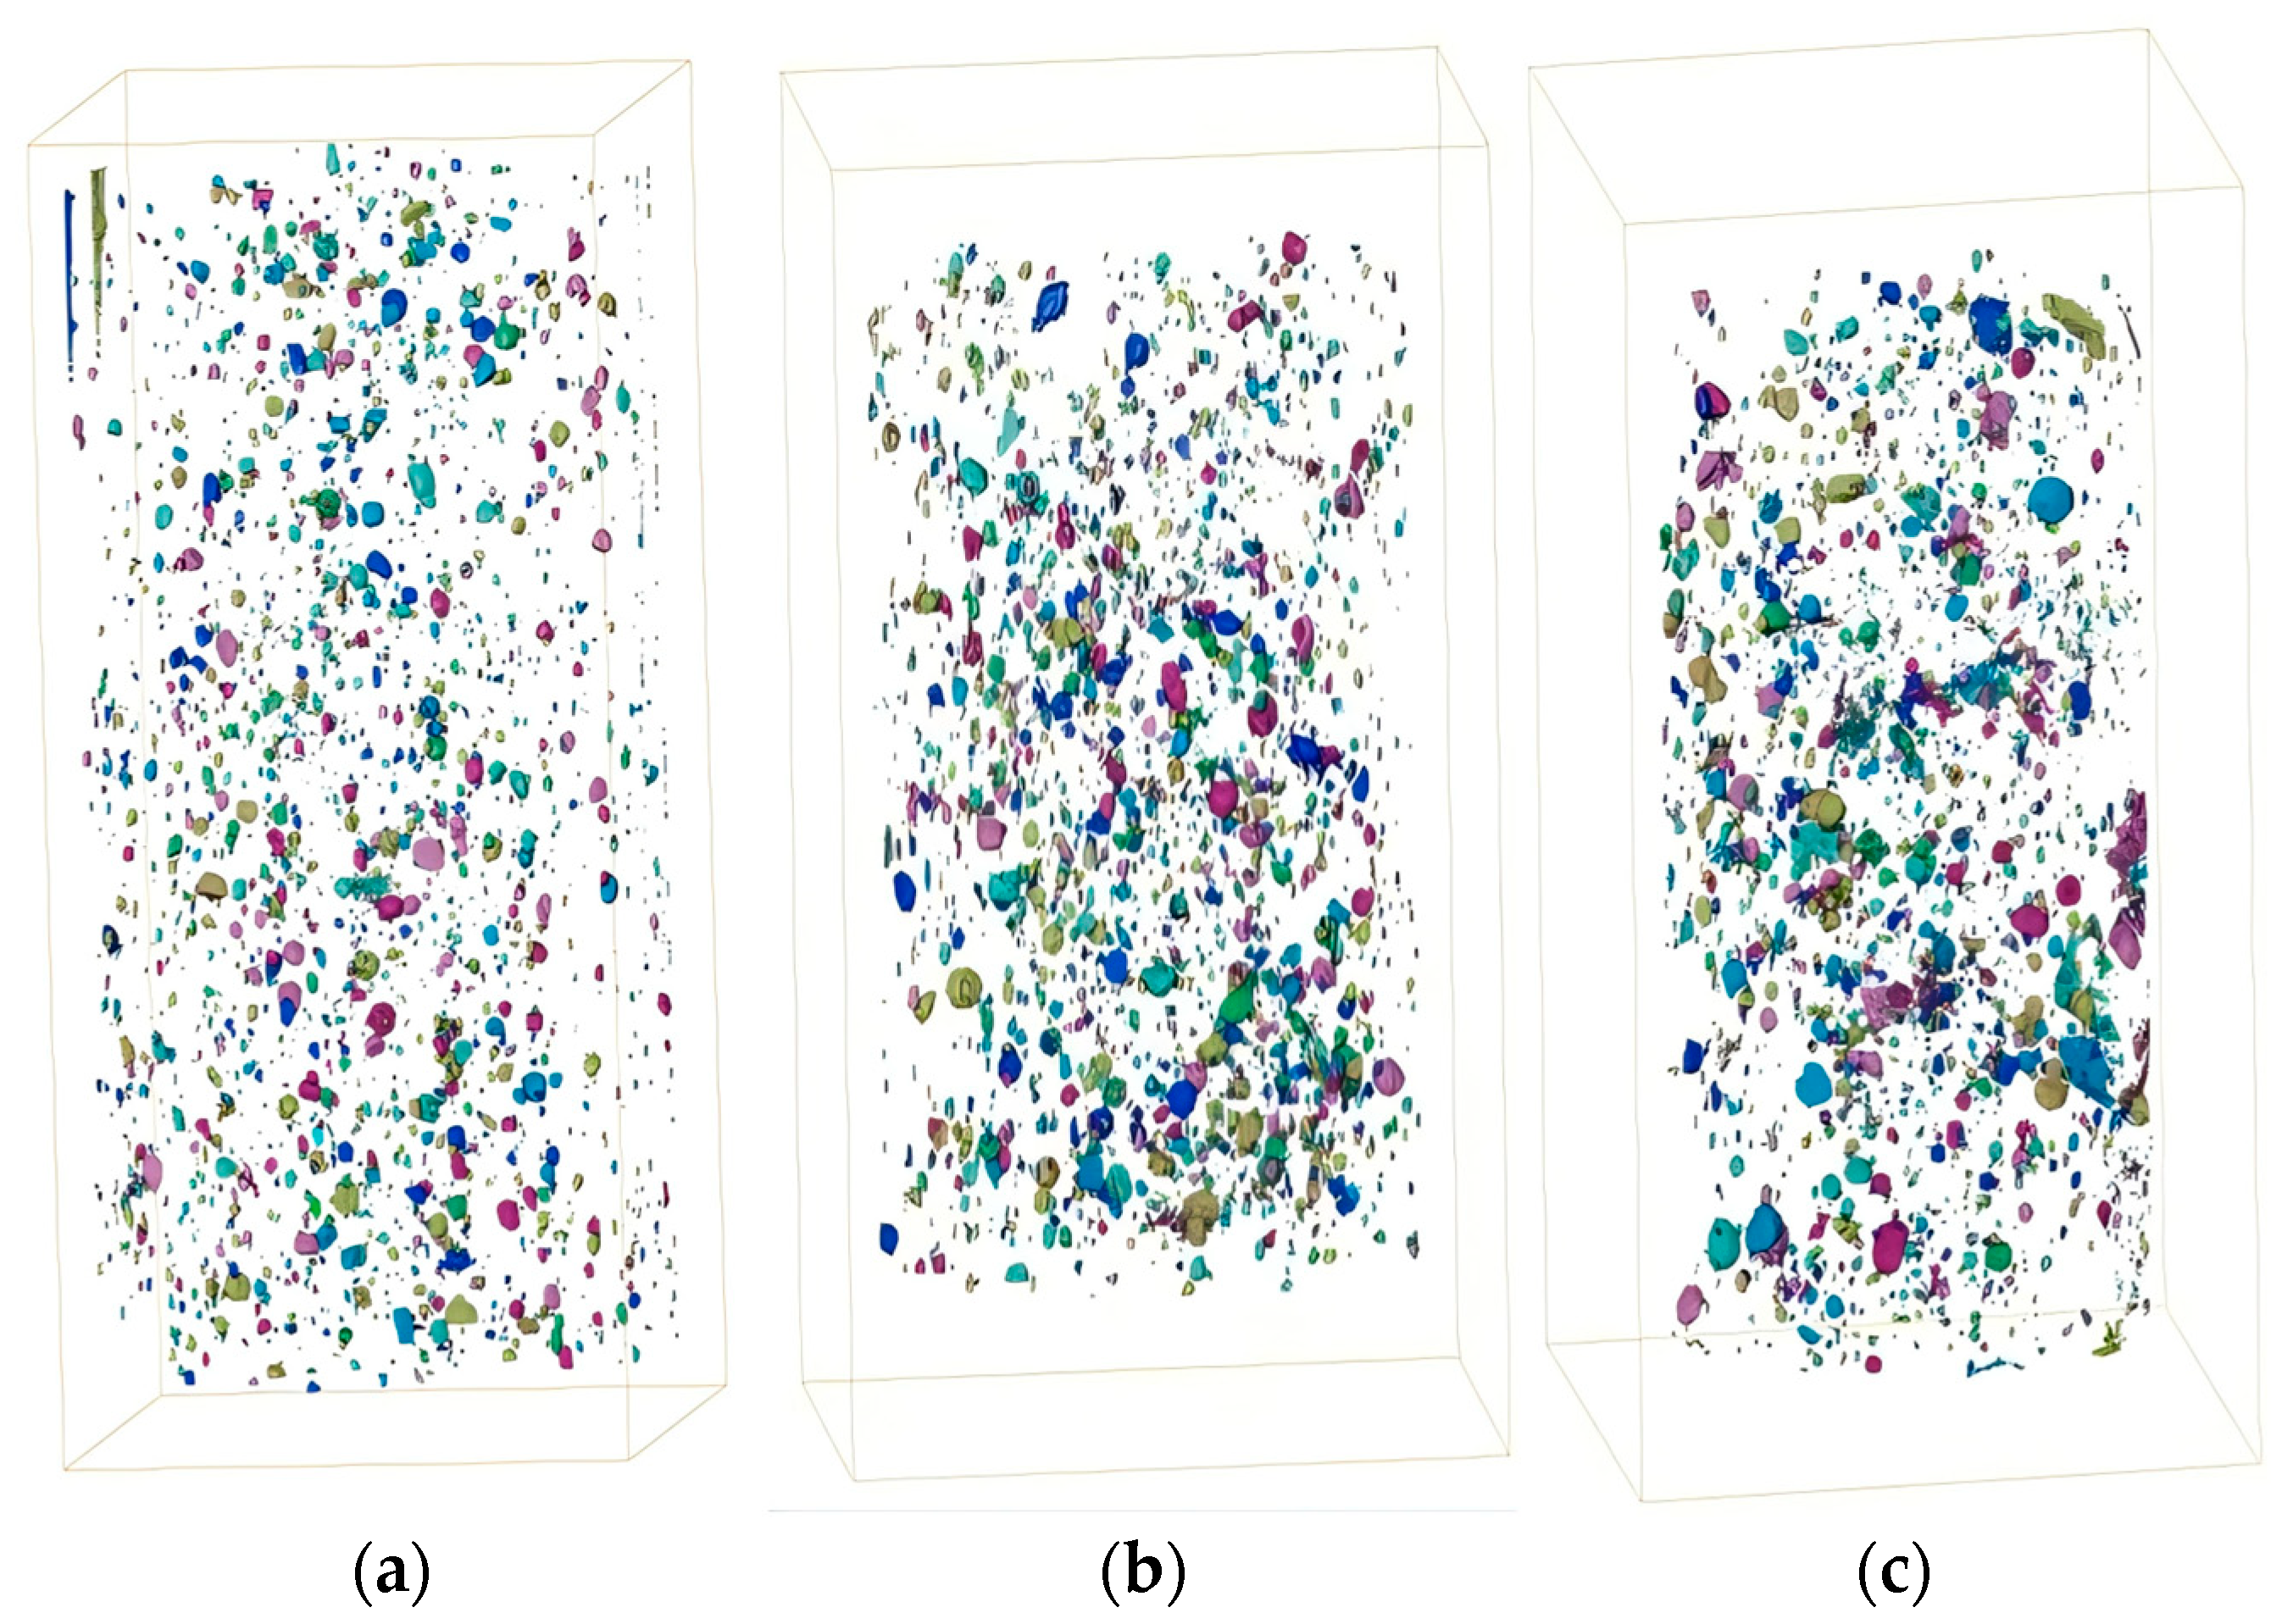
By leveraging high-resolution CT scanning and image processing techniques, the 3D spatial topological models of the effective pores within the RCC specimens across varying F-T damage stages were reconstructed (Figure 13). These 3D reconstructions intuitively visualize the spatial evolution characteristics of the pore networks. In the unfrozen state, the native pores are predominantly dispersed throughout the matrix, exhibiting minute and isolated morphologies. As the F-T cycles increase to 25, the localized frost-heaving stress induced by the ice–water phase transition drives the significant expansion of these native pores [11,21], thereby exacerbating localized pore clustering. Upon reaching 50 F-T cycles, the topological connectivity of the pore structure undergoes a fundamental transition from localized isolation to comprehensive spatial interconnection. Highly dense localized pore clusters intersect and coalesce, reshaping into a large-scale, irregular 3D interconnected damage network. Ultimately, this mesoscopic visual evidence unequivocally delineates the cross-scale structural degradation mechanism of internal damage, following a trajectory of “isolated initiation—localized propagation—comprehensive coalescence.”
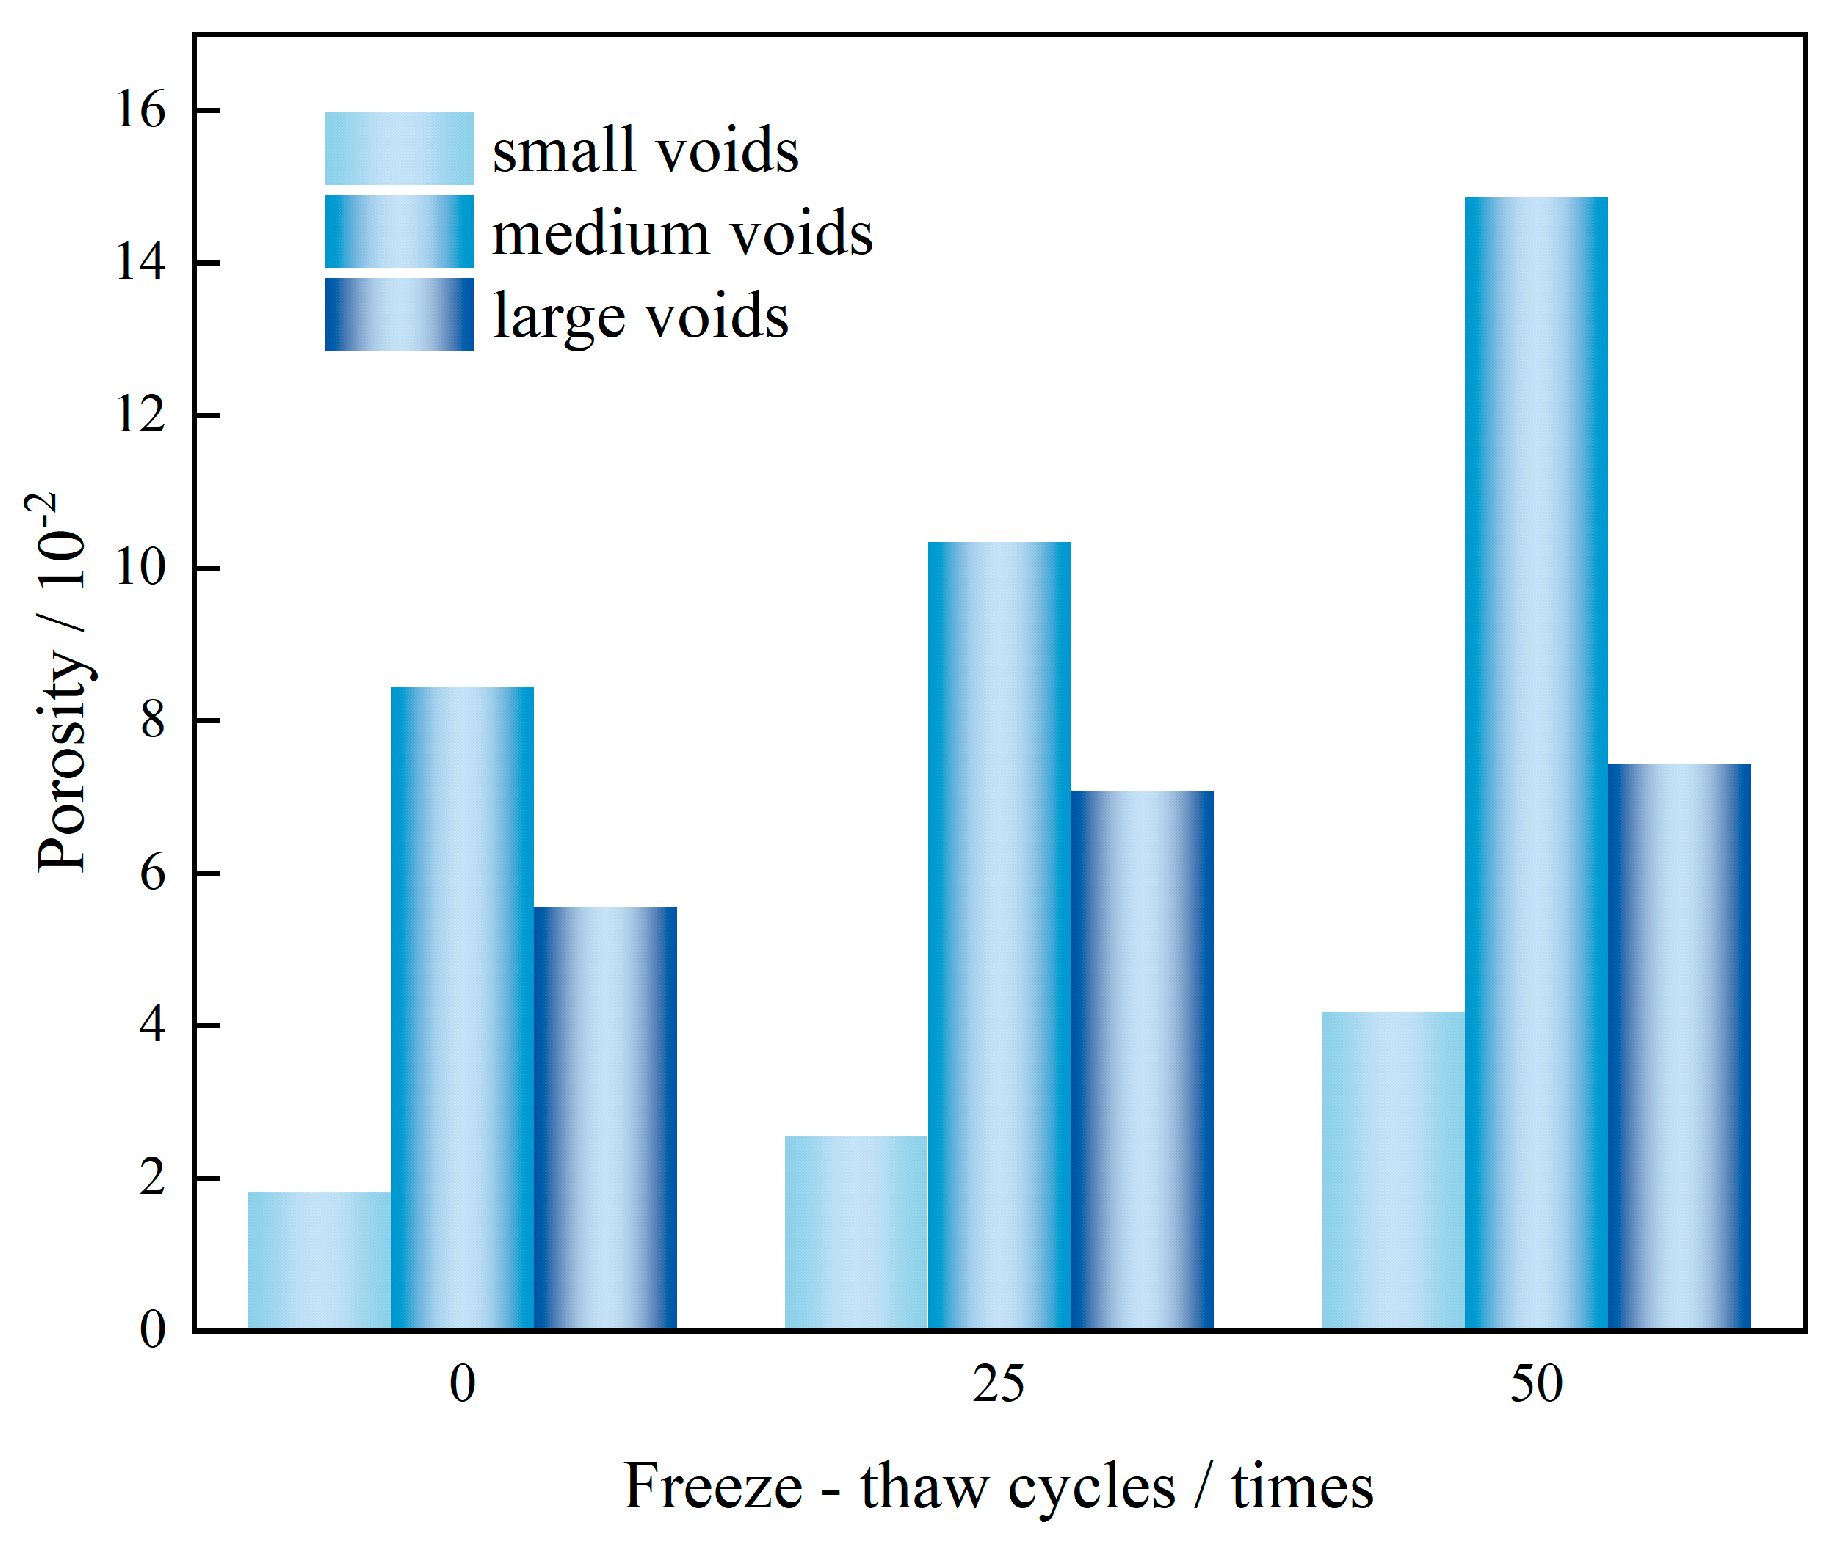
To further quantitatively characterize the evolution of this pore structure, the effective pores were categorized into three groups based on their equivalent diameters: small pores (300–500 μm), medium pores (500–2500 μm), and large pores (>2500 μm). The evolution of the volume fractions for each pore scale as a function of F-T cycles is depicted in Figure 14.
The quantitative pore size distribution results illustrated in Figure 14 further corroborate the aforementioned topological evolution trends. As the number of F-T cycles increases, the volume fractions of effective pores across all scales exhibit a consistent upward trend. Notably, the increment in the volume fraction of medium pores is the most pronounced, increasing from 8.45% in the unfrozen state to 14.86% after 50 F-T cycles. This phenomenon elucidates the mesoscopic evolutionary trajectory of the internal damage: the expansion pressure induced by the ice–water phase transition initially drives the propagation of pre-existing small pores and the initiation of new micro-pores. Subsequently, with the cyclic accumulation of frost-heaving forces, adjacent small pores progressively interconnect and coalesce, ultimately undergoing an extensive transformation into medium pores and interconnected large-pore networks [6,11].
To quantitatively characterize the morphological evolution of the pore geometry, a 3D shape factor, F , is introduced. The formulation is expressed as follows [36]:
F = 36 π V 2 S 3
where V is the pore volume, and S represents the pore surface area. According to the 3D isoperimetric inequality, the constant π is introduced to achieve spatial geometric normalization. As F approaches 1, the pore geometry approximates an ideal sphere. Conversely, a smaller F value indicates a more elongated, irregular, or microcrack-like pore morphology.
The calculation results reveal that as the F-T cycles progress, the average shape factor of the effective pores exhibits a continuous downward trend. The morphological evolution of the pores from near-spherical to elongated and crack-like geometries significantly amplifies the localized stress concentration at the defect tips [36]. During macroscopic uniaxial compression, such irregular pores readily act as initiation sites for microscopic shear sliding, thereby triggering severe internal damage. Mechanistically, this microscopic morphological evolution elucidates the previously observed macroscopic phenomena in the stress–strain curves, namely the prolongation of the initial compaction stage and the degradation of peak strength.

3.3.3. RA-AF Distribution Characteristics and Failure Modes

In the context of RCC fracture mechanics, the RA value—the ratio of rise time to peak amplitude—and the AF value—the ratio of ring-down counts to duration—serve as fundamental two-dimensional characteristic parameters for delineating microscopic cracking modes [12]. Typically, tensile cracks feature high frequencies and short rise times, thereby manifesting as low-RA and high-AF distributions. Conversely, shear cracks are characterized by low frequencies and prolonged rise times, presenting high-RA and low-AF signatures. To comprehensively elucidate the effects of moisture states and F-T cycles on the fracture mechanisms of the specimens, an in-depth analysis of the AE signals was conducted utilizing the conventional JCMS criterion [37,38] and the Gaussian mixture model [13].
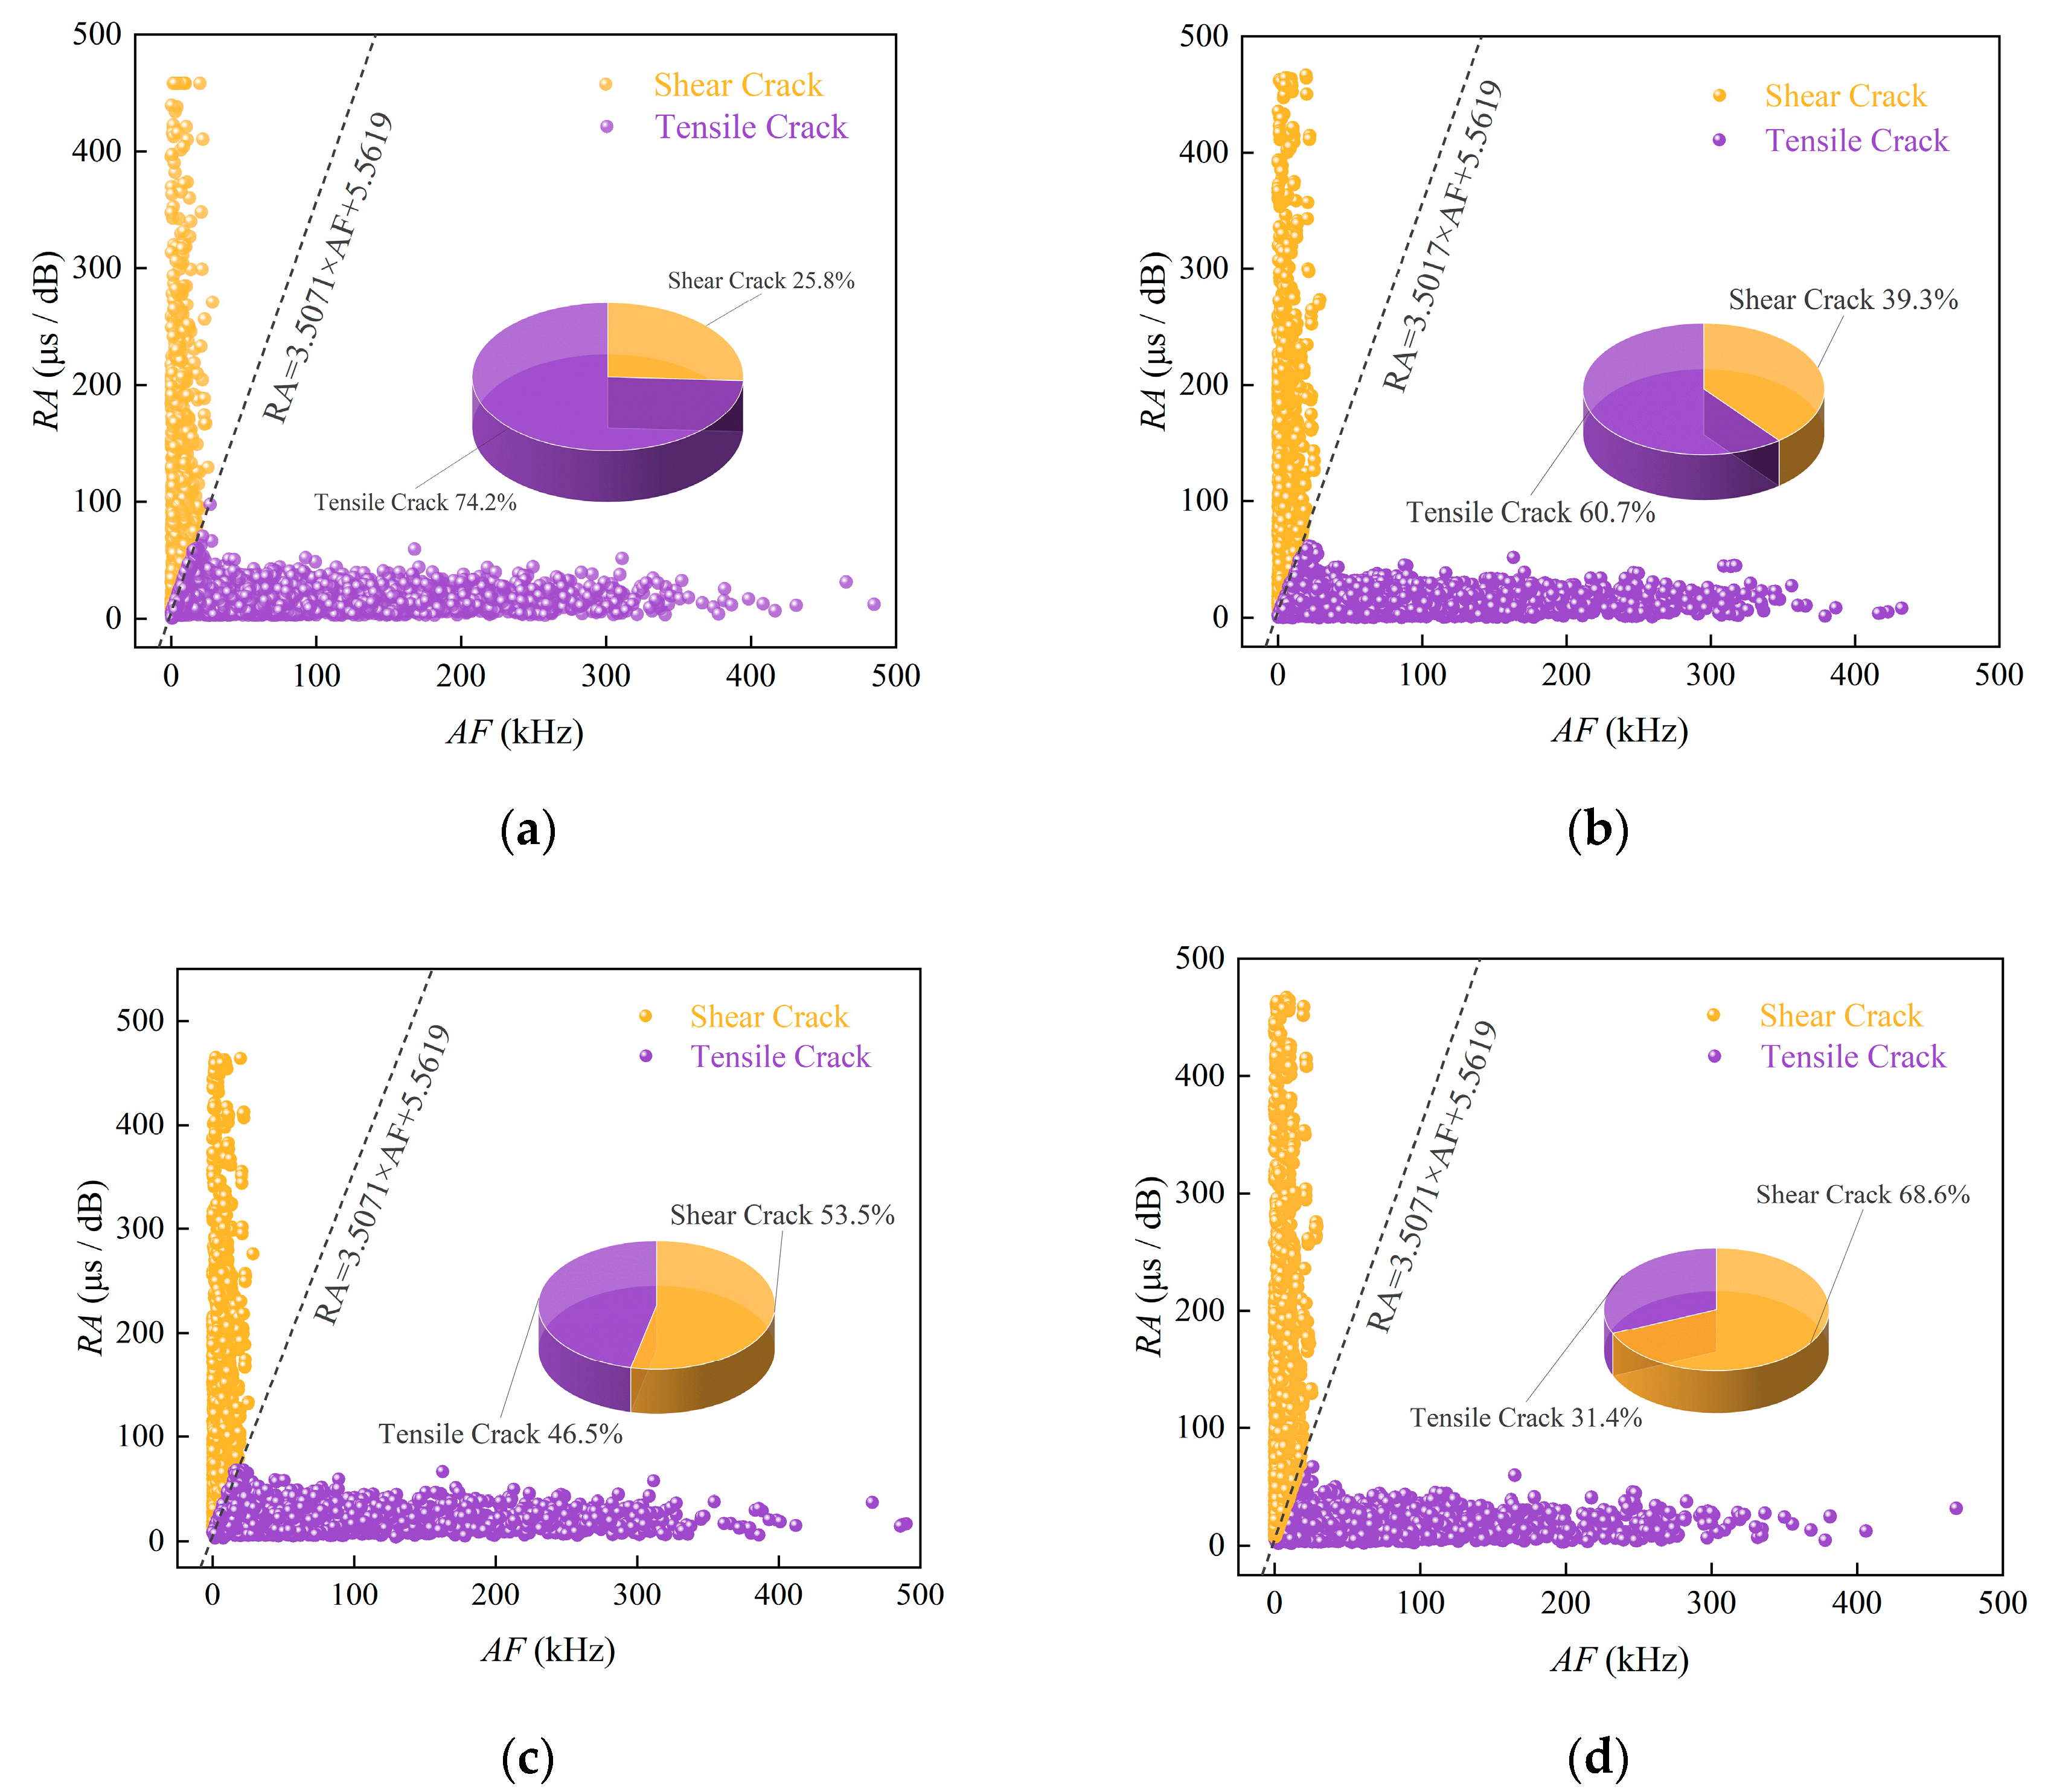
Figure 15 illustrates the RA-AF scatter distributions and crack classification results based on the JCMS criterion. To delineate the crack types, an empirical linear boundary, R A = 3.5071 × A F + 5.5619 , is introduced. The data indicate that in the dry state, tensile cracks are overwhelmingly dominant, accounting for 74.2% of the total, whereas shear cracks constitute 25.8%, exhibiting typical brittle fracture characteristics. When the specimens reach the saturated state (i.e., 0 F-T cycles), the lubricating effect of moisture reduces the frictional resistance at the aggregate–matrix interface, leading to an increase in the proportion of shear cracks to 39.3%. This phenomenon is attributed to the physical lubrication of the crack surfaces by the pore water film, which weakens the shear transfer capacity at the interface and causes a shift in the crack propagation mechanism, manifested as a significant increase in shear-mode AE events [27]. As the number of F-T cycles increases, the proportions of internal tensile cracks in the specimens subjected to 25 and 50 F-T cycles decrease to 46.5% and 31.4%, respectively, while the proportions of shear cracks increase to 53.5% and 68.6%, respectively. This progressive data evolution compellingly demonstrates that F-T damage induces a dense microcrack network within the matrix [14], forcing the failure mechanism under load to undergo a fundamental transition from being initially dominated by tensile cracking to being predominantly governed by shear sliding.
When exploring the distribution characteristics of acoustic emission (AE) RA-AF parameters, the conventional JCMS criterion relies on an empirical, fixed linear boundary. Due to the pronounced heterogeneity of RCC, alongside the complex microscopic interface responses triggered by F-T cycles and moisture lubrication, a large volume of AE data points is densely scattered and fluctuates in the vicinity of this empirical boundary. Consequently, this hard-threshold classification struggles to faithfully reflect the fracture evolution characteristics of the material under load. To overcome this limitation, this study introduces the Gaussian Mixture Model (GMM) to conduct a 2D unsupervised clustering analysis. This approach eliminates the subjective intervention of manually predefined boundary slopes. Instead, through the iterations of the Expectation-Maximization (EM) algorithm, it autonomously captures the data density centers within the RA-AF domain excited by distinct physical mechanisms. During the uniaxial compressive damage process of actual concrete specimens, in addition to pure tensile and pure shear fractures, mixed-mode fracture mechanisms and interfacial friction effects induced by the debonding and sliding between aggregates and the matrix are also widely present. Considering that tension and shear are the most fundamental intrinsic mechanisms driving macroscopic crack propagation, this study establishes these two dominant mechanisms as the benchmark and sets the number of components for the multivariate Gaussian distribution to 2, i.e., the number of clusters k = 2 . This configuration not only conforms to the physical constitutive relationships of concrete microscopic fracture but also, through the evaluation of the Bayesian Information Criterion (BIC), verifies that the two-component model achieves the optimal balance between model complexity and the goodness-of-fit of data explanation within the current RA-AF feature space.
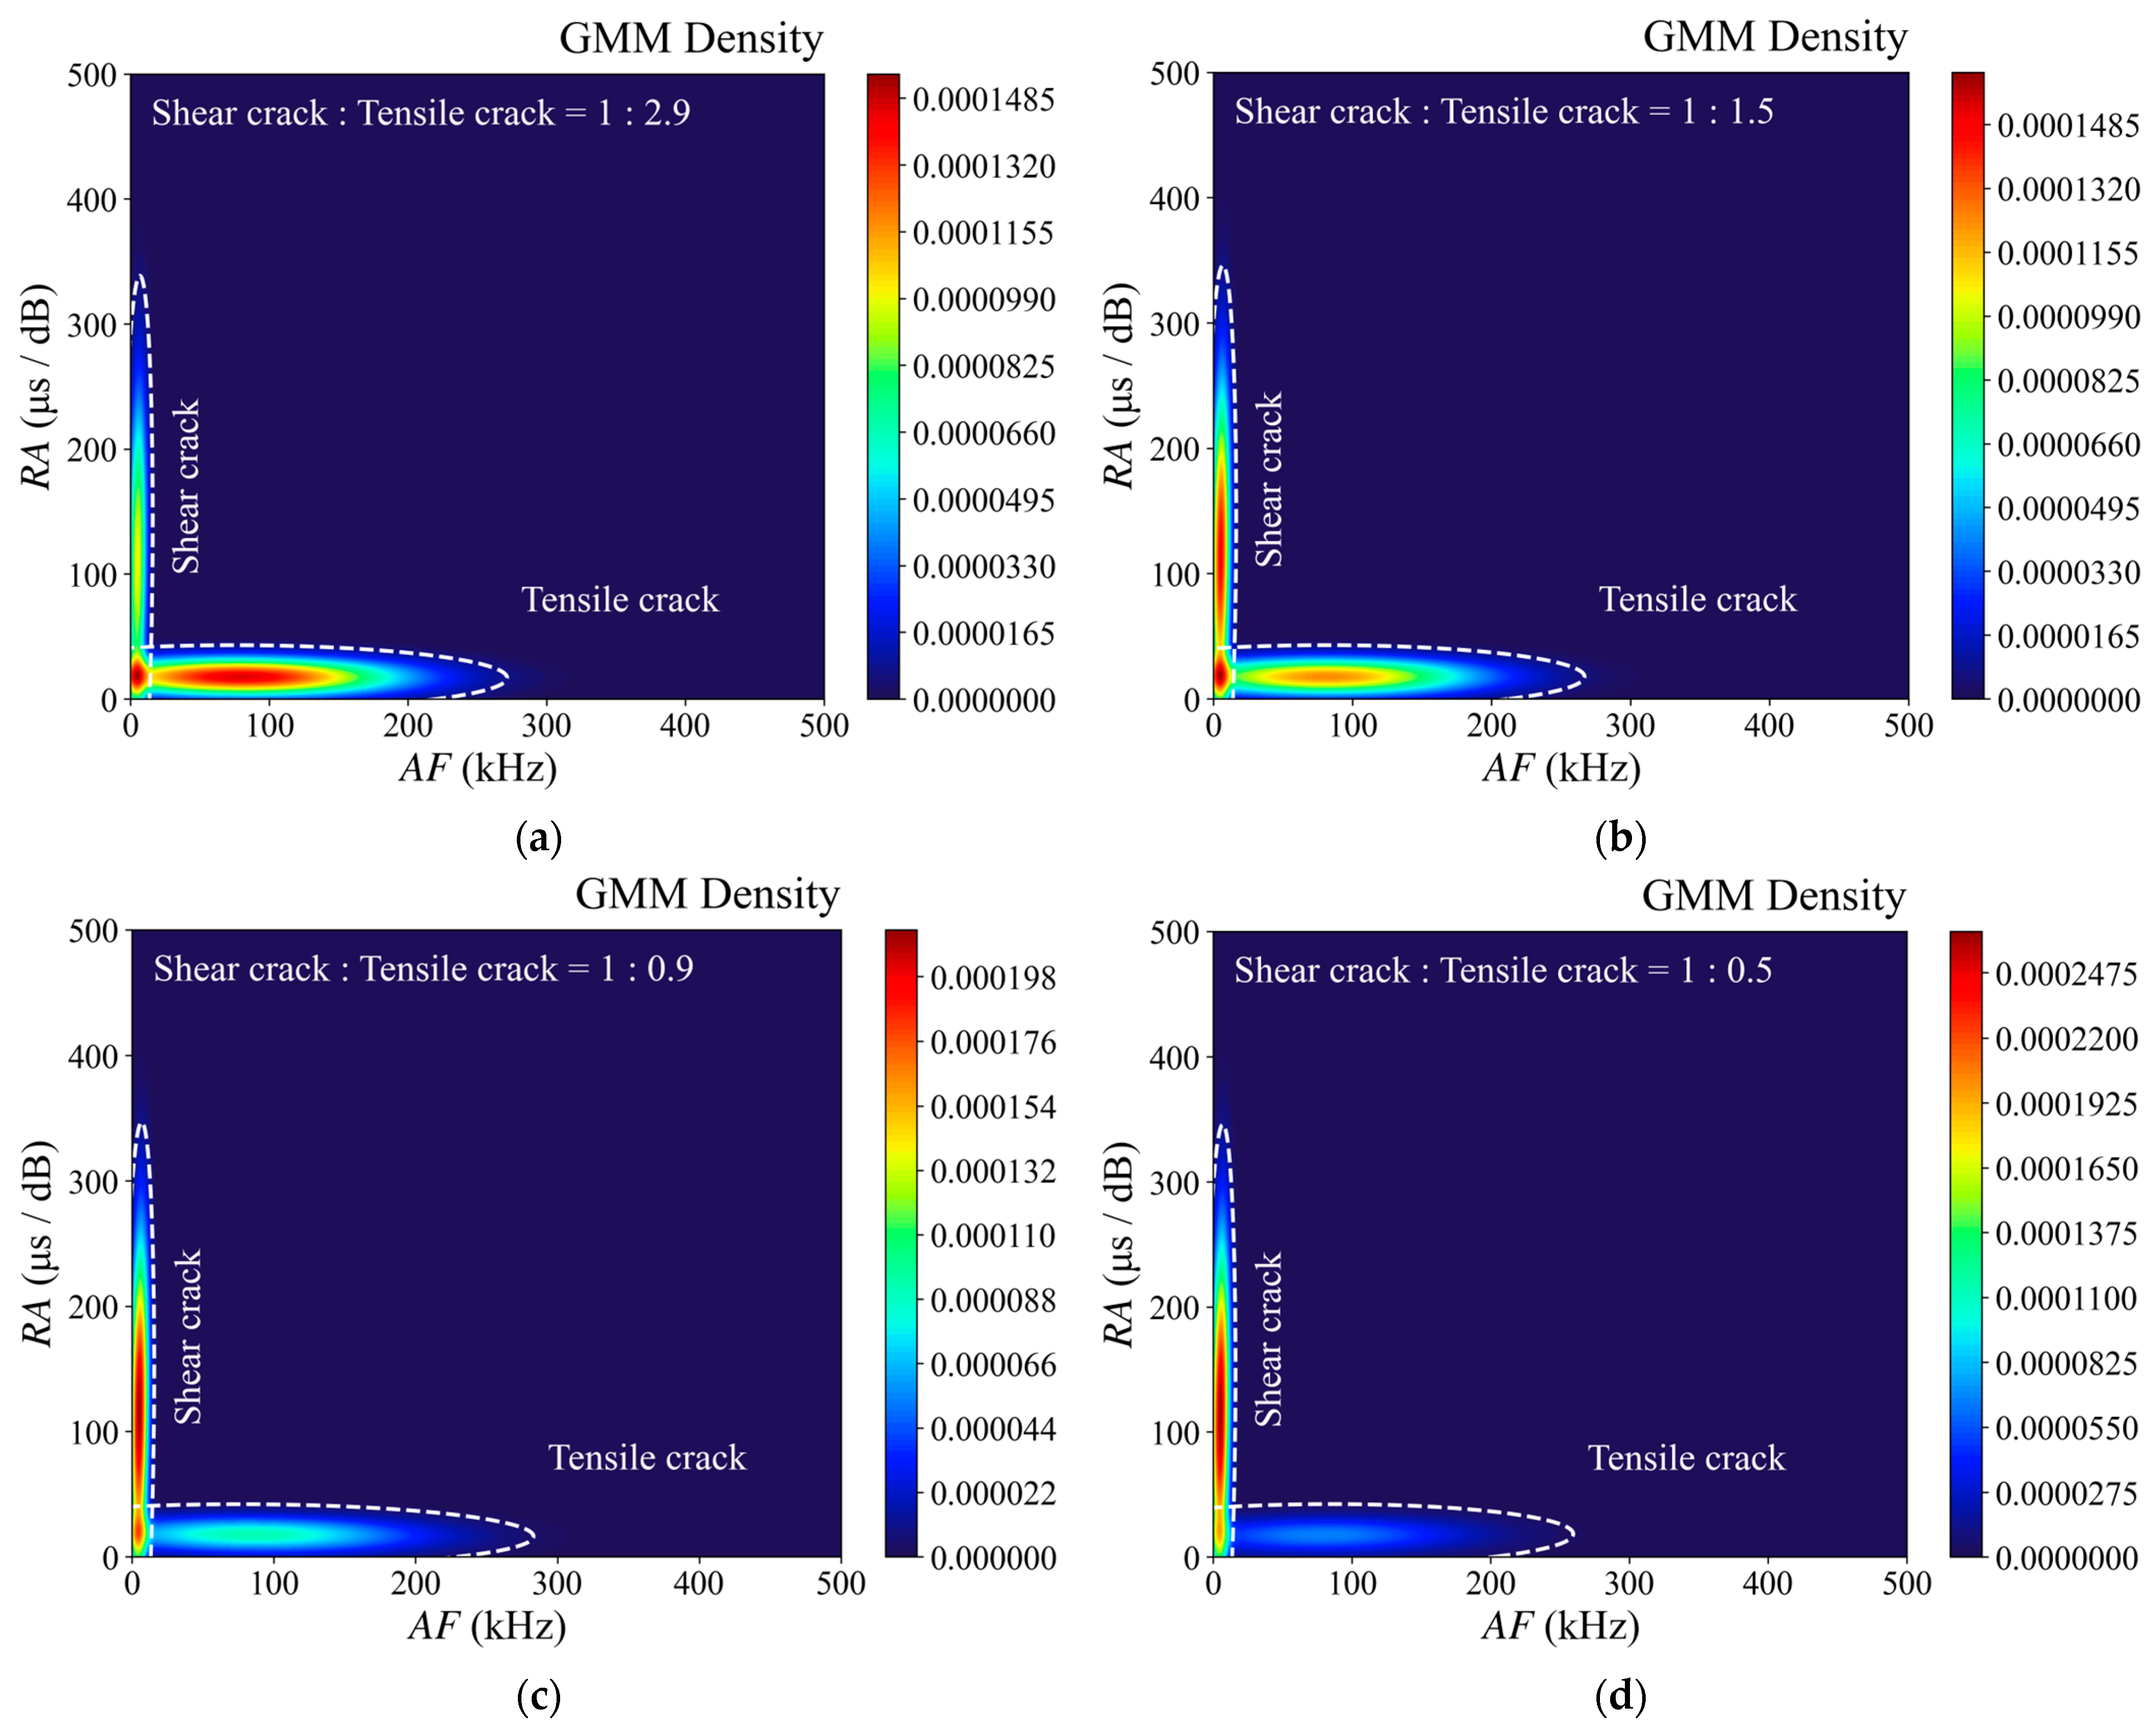
As illustrated by the heatmaps in Figure 16, the dynamic evolution of the macroscopic failure modes in the RCC specimens under varying F-T cycles is clearly visualized. In the dry state, the RA-AF signals are heavily concentrated within the high-AF and low-RA region, where the tensile-type cluster holds absolute dominance. This indicates that the dry matrix predominantly undergoes brittle microscopic splitting under compression. Upon reaching the saturated state, the concentration of high-frequency tensile signals attenuates, and a portion of the signals migrates towards the low-AF and high-RA region. Mechanistically, this phenomenon occurs because moisture infiltration degrades the interfacial adhesion, and the lubricating effect of the pore water film exacerbates the microscopic friction during the closure of native microcracks, thereby increasing the proportion of mixed-mode fractures [18]. With the imposition of F-T cycles, the deterioration of the failure modes accelerates significantly. After 25 F-T cycles, the localized frost-heaving pressure induced by the ice–water phase transition generates a proliferation of nascent micro-defects [11,21]. Consequently, the transition zone of the GMM clustering expands, and the interfacial sliding characteristics during crack propagation become increasingly pronounced. Upon reaching 50 F-T cycles, the RA-AF distribution undergoes a fundamental paradigm shift. The shear-type cluster, characterized by low frequencies and prolonged rise times, secures an absolute advantage in both data point density and coverage area, ultimately transforming into the governing failure mode.
The aforementioned AE evolution laws are in highly consistent agreement with the previous quantitative results obtained from mesoscopic CT. The infiltration of free water initially triggers the relative slippage at the interfaces, whereas the cyclic frost-heaving action ultimately culminates in the spatial coalescence of the mesoscopic pore networks. The compressive failure path of the RCC specimens clearly exhibits a degradation trajectory, transitioning from being dominated by brittle tensile splitting in the dry state to being progressively governed by macroscopic shear sliding in the saturated state and the later stages of F-T deterioration.

3.3.4. b-Value Characteristics

When investigating the dynamic b-value of AE, the conventional GBR linear fitting method is highly susceptible to heavy-tail distortion induced by the sparsity of high-energy events, leading to underestimated and highly fluctuating fitting results. Therefore, Aki’s maximum likelihood estimation method [39] is adopted in this study. Aki’s estimation is strictly sensitive to the determination of the magnitude of completeness, m c . Considering that microcrack propagation—driven by environmental moisture and F-T damage—exacerbates the scattering and attenuation of high-frequency, weak signals within the medium [40], employing a fixed hardware trigger threshold makes the system prone to omitting low-amplitude signals. Consequently, the average amplitude, μ , is artificially increased, thereby generating a spurious drop phenomenon in the b-value.
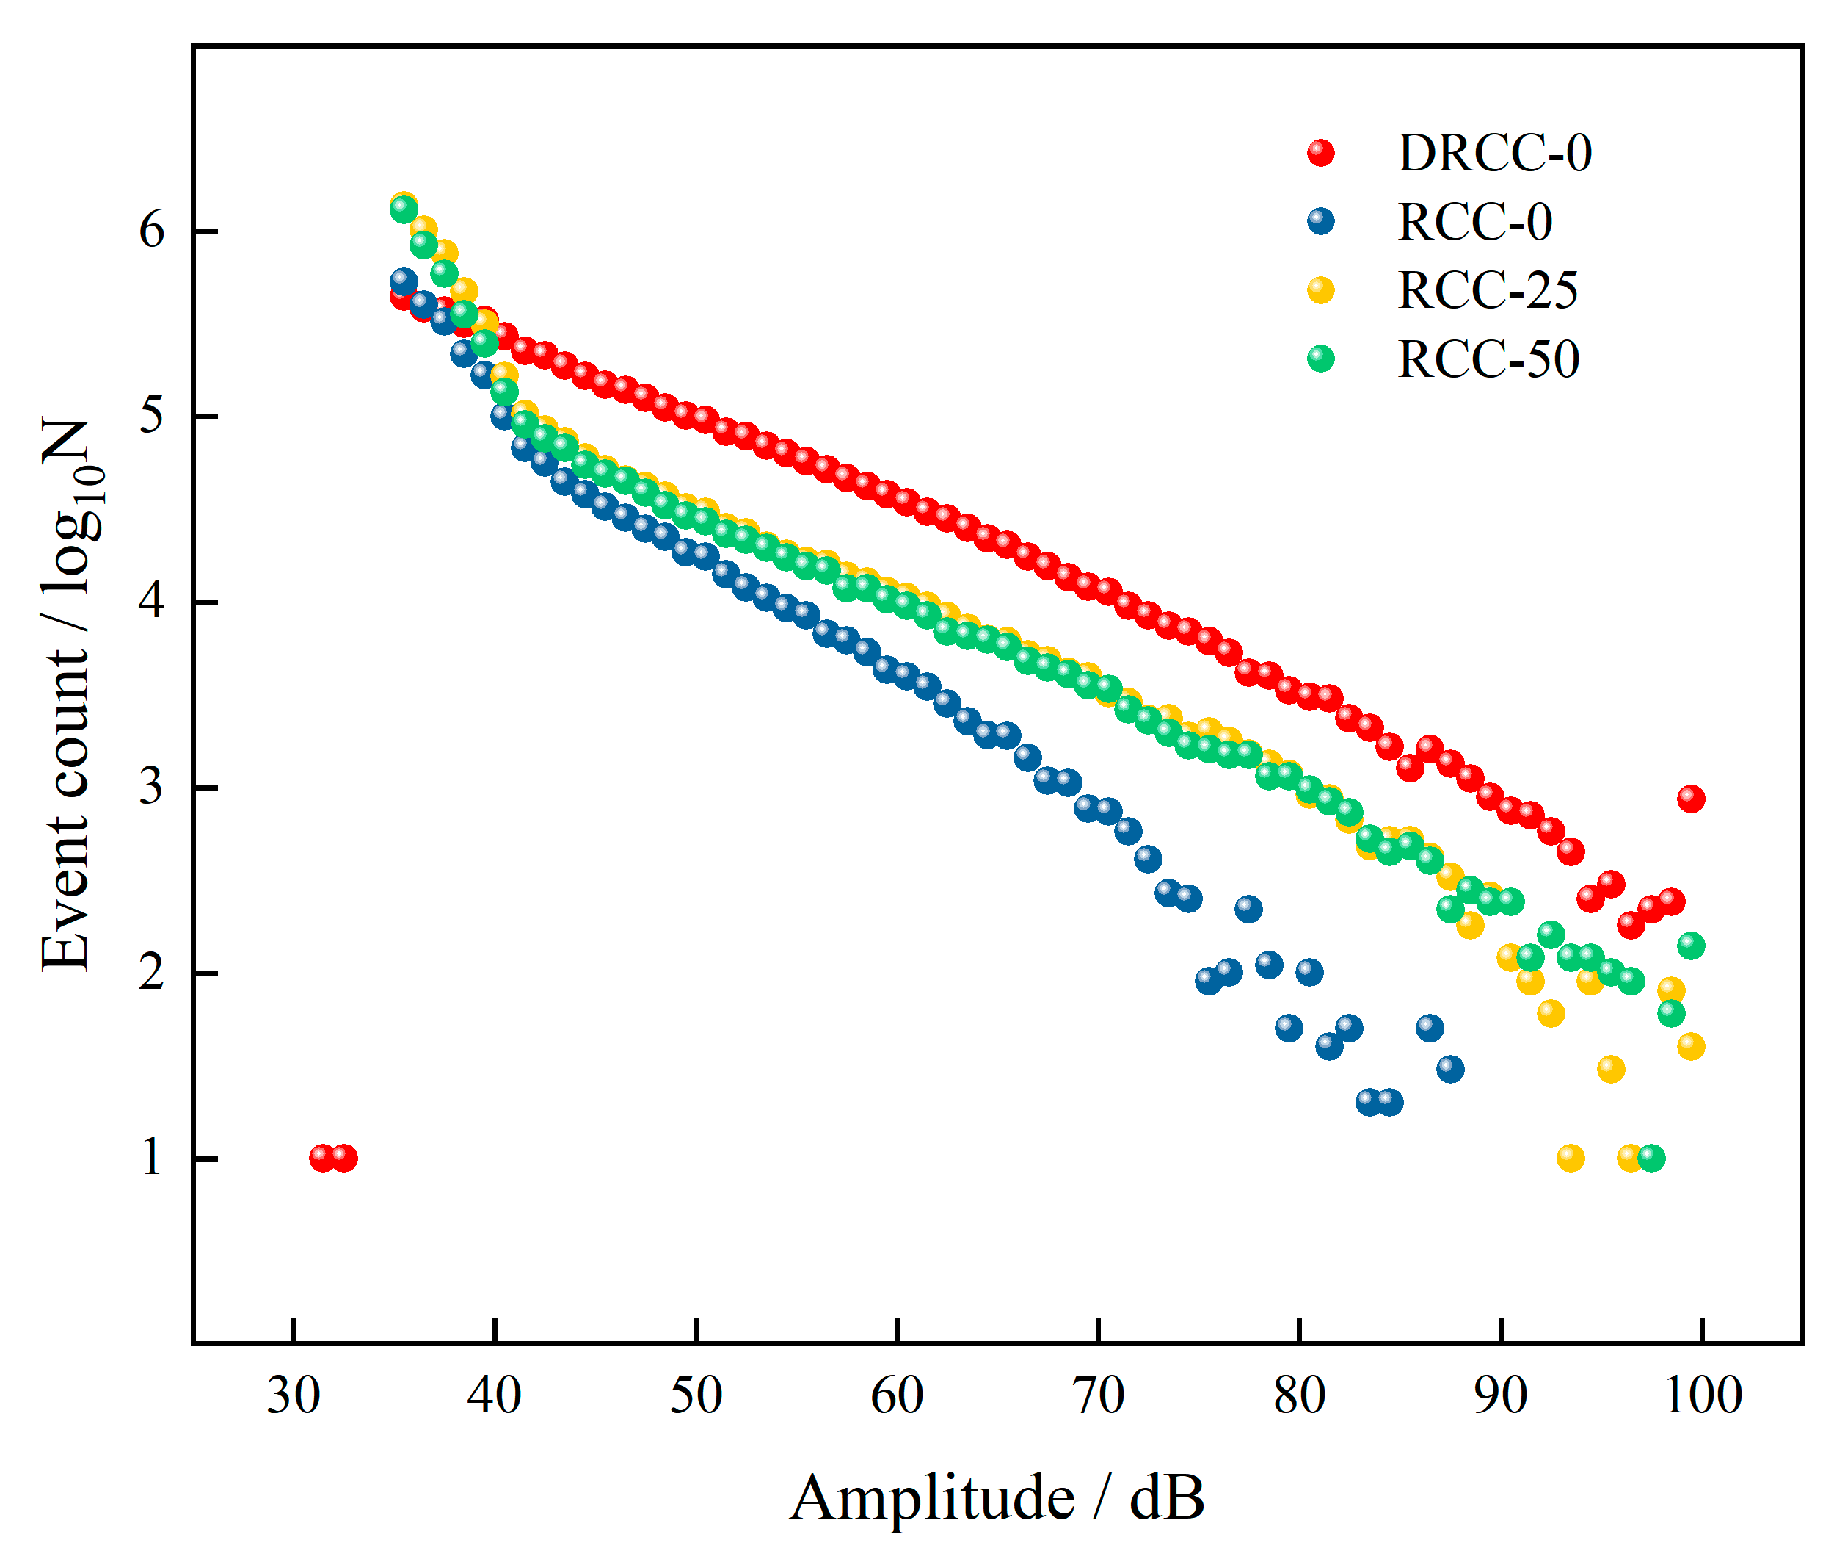
To decouple the signal masking effect from the genuine damage evolution, the maximum curvature (MAXC) method was introduced to dynamically calibrate the magnitude of completeness m c . Mathematically, the MAXC method identifies m c as the specific magnitude bin containing the highest number of acoustic emission (AE) events. Given the inherently discrete nature of the acquired AE magnitude data, this is achieved by directly locating the empirical peak of the non-cumulative frequency–magnitude distribution (FMD), rather than analytically computing the derivative of a continuous curve. As illustrated in Figure 17, although the specimens were subjected to varying degrees of saturation and freeze–thaw cycles, the peaks of the respective curves (i.e., m c ) consistently stabilized around 36 dB without shifting toward the high-amplitude region. Based on this dynamically calibrated m c , Aki’s maximum likelihood estimation method was employed to calibrate the AE b-value. The core mathematical formulation is expressed as follows:
b = log 10 ( e ) m ¯ m c
where e is Euler’s number, m ¯ represents the average magnitude of all AE events equal to or greater than m c , and m c is the dynamically calibrated threshold magnitude. This rigorous mathematical implementation effectively avoids the subjective bias and heavy-tail distortion commonly associated with the conventional Gutenberg–Richter (GBR) linear fitting method.
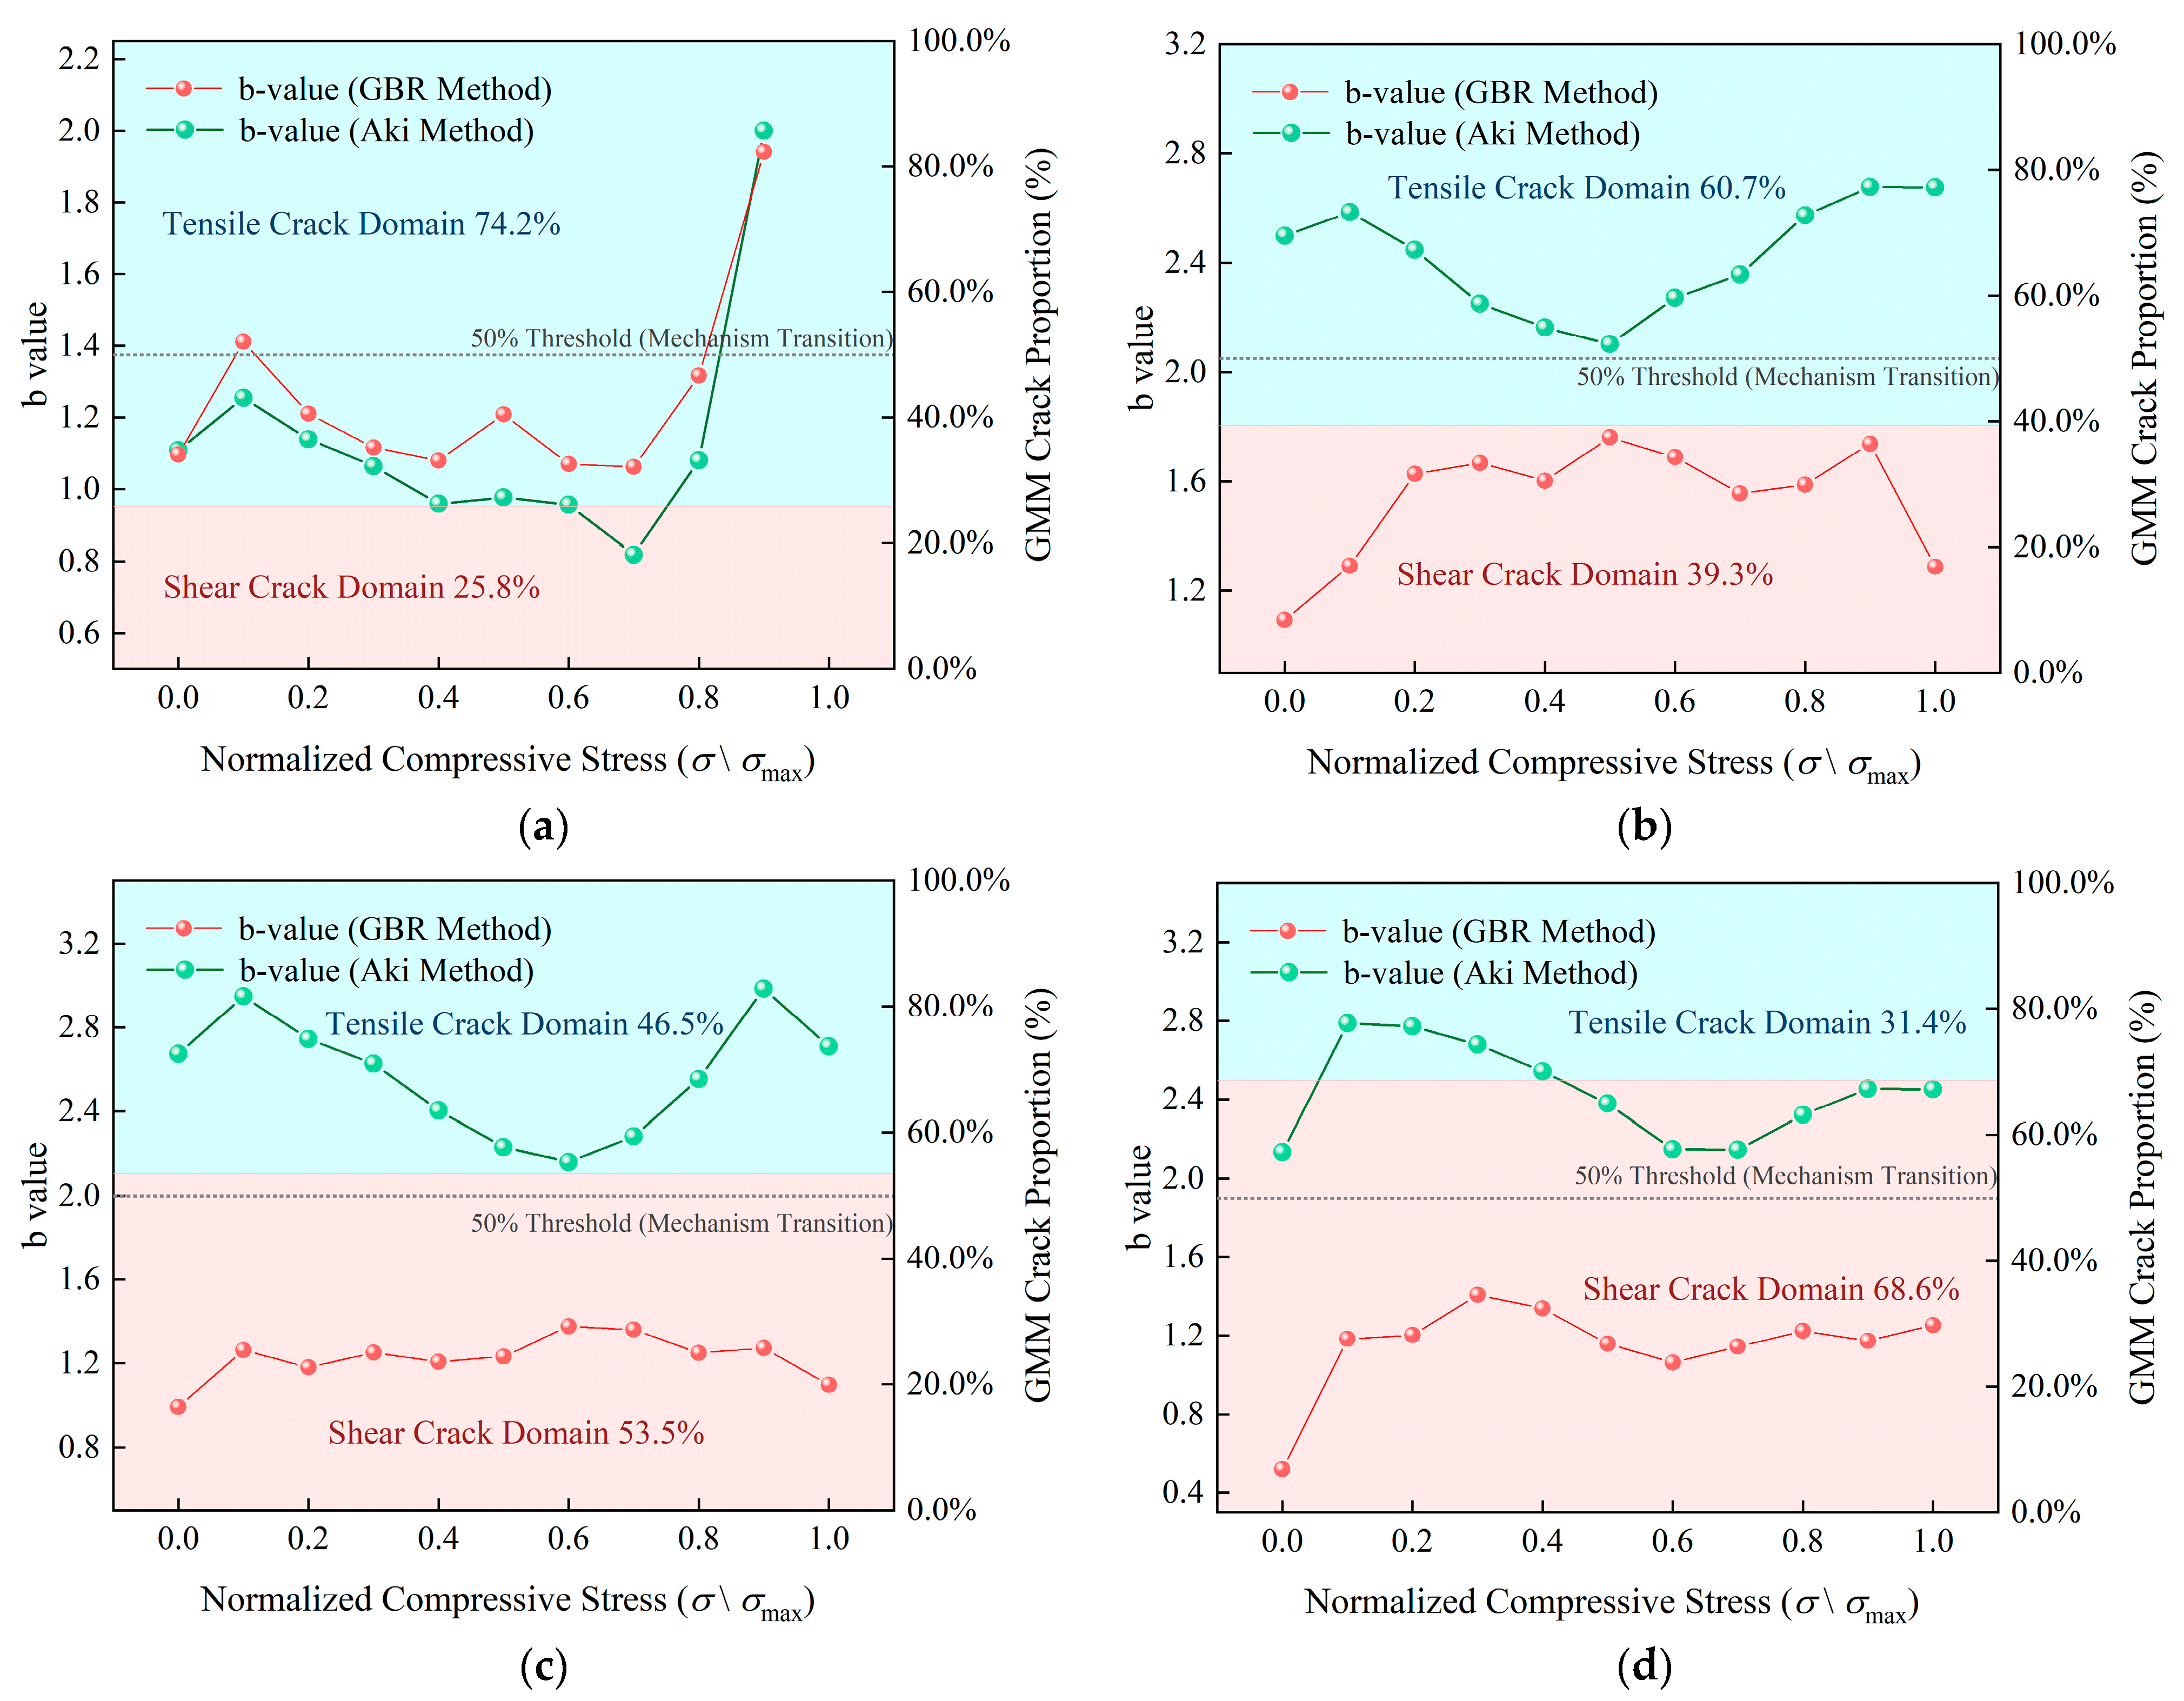
Based on the recalculation using the aforementioned Aki’s formula, combined with the proportions of tensile and shear cracks obtained via GMM clustering, the distribution characteristics of the dynamic b-value of the RCC throughout the entire compression process are illustrated in Figure 18. A comprehensive comparison across various conditions reveals the specific evolutionary laws of the focal mechanisms. The b-value calculated by Aki’s method is generally higher than that obtained via the GBR method, exhibiting a nonlinear dynamic evolution characterized by an initial decrease followed by a rebound during the loading process of 0 ~ 1.0 σ / σ m a x . During the pre-peak nonlinear loading stage of 0.4 ~ 0.8 σ / σ m a x , the b-value displays a typical U-shaped valley evolution (i.e., an initial drop followed by a rise) [41]. This characteristic not only signifies that the internal microcracks begin to undergo massive, unstable coalescence and evolve into large-scale macroscopic cracks [14], but also accurately maps the mechanical essence of these microcracks propagating along mesoscopically interconnected pores to form macroscopic shear planes.
Moisture infiltration exerts a decisive influence on the AE focal mechanisms. A comparison between Figure 18a,b reveals that upon transitioning from the dry to the saturated state, the baseline of the Aki-calculated b-value exhibits a remarkable leap. Concurrently, the GMM clustering results demonstrate that the proportion of tensile cracks decreases from 74.2% to 60.7%, accompanied by an increase in the shear crack proportion. This phenomenon indicates that the increase of the b-value in the saturated state is not merely an artifact of signal attenuation induced by the low-pass filtering effect of pore water. Mechanistically, the infiltration of moisture reduces the friction coefficient and fracture surface energy at the aggregate–matrix interfaces. This lubricating effect induces a massive proliferation of low-energy microscopic shear and frictional sliding events, thereby altering the microscopic fracture mechanism of the material [18,39].
With the accumulation of F-T cycles, the macroscopic failure modes undergo a distinct transition. After 25 and 50 F-T cycles, as illustrated in Figure 18c,d, the frost-heaving pressure induced by the internal ice–water phase transition generates a proliferation of initial defects within the matrix. During the later stages of compression, these defects become highly susceptible to slip instability along the interfaces. This process is clearly captured by the 50% threshold of the GMM mechanism transition boundary in Figure 18. Specifically, at 25 F-T cycles, the proportion of shear cracks surpasses the critical threshold to reach 53.5%. Upon reaching 50 F-T cycles, shear cracks establish a clear dominance at 68.6%. These findings comprehensively demonstrate that the cumulative effect of F-T damage fundamentally alters the brittle tensile splitting mode characteristic of the dry state, driving the RCC toward macroscopic shear-sliding failure. Ultimately, this AE evolution law is in highly consistent agreement with the aforementioned mechanical and CT scanning conclusions.
The cross-scale damage mechanisms elucidated in this study provide a theoretical foundation and methodological reference for the early-stage condition monitoring of actual roller-compacted concrete dams in cold regions. In practical engineering applications, a non-destructive monitoring network can be systematically established by deploying acoustic emission sensors across the water-level fluctuation zones of the dam structure. By continuously capturing acoustic signals and dynamically calibrating the Aki-based b-value, these findings may provide a preliminary reference for the development of AE-based early-warning indicators for RCC dams. Specifically, the pre-peak “U-shaped” valley of the b-value revealed in our laboratory tests aligns highly with the mechanism transition point where the proportion of microscopic shear cracks exceeds the 50% threshold. In field non-destructive monitoring, the emergence of this AE signature holds promise as a potential early-warning indicator that internal freeze–thaw defects are accelerating toward macroscopic shear failure. In summary, this cross-scale evaluation approach, provides a preliminary experimental basis for exploring AE-based microscopic indicators for early-stage damage assessment. thereby contributing to the refinement of existing non-destructive safety assessment frameworks for infrastructure.
Furthermore, while this study establishes a cross-scale physical mapping based on experimental observations, these empirical mechanisms provide a necessary parameter baseline for future theoretical simulations. Specifically, advanced numerical approaches, such as the combined finite-discrete element method (FDEM) and cohesive fracture models [42], will be introduced. Establishing such a reliable numerical analysis platform will enable comprehensive parametric studies across a broader range of mixture designs and degradation environments, thereby theoretically deepening the understanding of the localized fracture process zone (FPZ) evolution.

4. Conclusions

This study comprehensively integrated uniaxial compression testing, industrial CT scanning, and AE monitoring techniques to systematically investigate the cross-scale damage evolution mechanisms of RCC under four distinct conditions: dry, saturated, and subjected to 25 and 50 F-T cycles. The primary conclusions are drawn as follows:
(1)
The macroscopic mechanical properties of RCC undergo profound deterioration under the influence of F-T cycles. As the number of F-T cycles increases, the peak stress decreases progressively with increasing F-T cycles. After 50 cycles, the elastic modulus degrades to approximately 56% of its initial value. On the stress–strain curves, the pre-peak plastic yield zone of the damaged specimens broadens significantly. Correspondingly, the macroscopic failure mode transitions from brittle axial splitting in the dry state to ductile oblique shear failure following severe F-T deterioration.
(2)
The frost-heaving action profoundly alters the internal pore distribution characteristics of the RCC. Mesoscopic pores with equivalent diameters ranging from 500 to 2500 μm are the most sensitive to F-T action. As the F-T cycles increase from 0 to 50, their volume fraction increases from 8.45% to 14.86%. Driven by the crystallization pressure induced by the ice–water phase transition, the native isolated pores continuously propagate and coalesce, ultimately forming a 3D spatially interconnected damage network.
(3)
The GMM clustering results of the AE RA-AF parameters effectively quantify the microscopic fracture modes during the loading process. Under compression, the dry matrix is predominantly governed by tensile cracks, accounting for 74.2%. However, driven by the superimposed effects of interfacial lubrication by pore water films and frost-heaving defects, the proportion of shear cracks reaches 53.5% after 25 F-T cycles, surpassing the 50% criterion adopted herein to indicate the dominance of shear-type fractures. This proportion further increases to 68.6% after 50 F-T cycles, objectively corroborating the mechanical mechanism underlying the transition of the macroscopic failure mode toward shear sliding.
(4)
Dynamically calibrating the AE b-value using Aki’s maximum likelihood method effectively mitigated the masking effect of pore water on the recognition of low-amplitude AE events. Influenced by the lubricating effect of the interfacial water film, the b-value of the intact saturated specimens during the pre-peak nonlinear loading stage increased from 1.08 in the dry state to 2.57. Conversely, after 50 freeze–thaw cycles, this b-value in the damaged specimens dropped back to 2.32. This acoustic evolution characteristic reflects that, during the later stages of compression, microscopic diffuse cracks undergo large-scale frictional sliding along the mesoscopically interconnected pores, subsequently triggering macroscopic oblique shear failure.
Overall, this study demonstrates that freeze–thaw damage not only alters the pore structure characteristics of RCC but also drives a fundamental transition in its compressive failure mechanism from tension-dominated to shear-dominated. The establishment of this cross-scale correlational mechanism provides an initial physical basis for the early-stage microscopic non-destructive warning of massive hydraulic infrastructure. While the current findings are inherently constrained by the specific experimental parameters (i.e., a single C20 mixture and 25/50 F-T cycles), they establish a solid phenomenological baseline for future cross-scale numerical simulations to further explore the localized fracture process zone (FPZ) evolution under diverse and complex degradation environments.

Author Contributions

K.L.: Funding acquisition, Writing—review & editing, Conceptualization, Methodology, Writing—original draft, Resources, Investigation. X.W.: Conceptualization, Methodology, Software, Writing—original draft, Writing—review & editing, Project administration, Data curation, Formal analysis, Investigation, Visualization. Y.X.: Investigation, Visualization, Supervision, Data curation, Formal analysis. W.Y.: Supervision, Conceptualization, Methodology. K.Y.: Conceptualization, Methodology, Supervision. C.S.: Conceptualization, Methodology, Supervision. D.W.: Formal analysis, Data curation, Investigation, Methodology. S.Z.: Software, Formal analysis, Data curation, Investigation. All authors have read and agreed to the published version of the manuscript.

Funding

This work is supported by the National Nature Science Foundation of China (No. 52104222, No. 51909224), the Natural Science Foundation Research Project of Shaanxi Province (2021JLM-48, 2025JCBMS-511, 2019JM-182), and the Special Fund for High-level Talents of Xijing University (XJ18T04, XJ24B12). The authors would like to express thanks to the reviewers for their thorough reviews and valuable advice.

Data Availability Statement

The original contributions presented in this study are included in the article. Further inquiries can be directed to the corresponding author.

Conflicts of Interest

The authors declare no conflicts of interest.

References

  1. Science and Technology Promotion Center of the Ministry of Water Resources. 2023 Advanced and Practical Technologies in Water Conservancy; China Water & Power Press: Beijing, China, 2024; 277p. [Google Scholar]
  2. Su, H.Z.; Xie, W. Review on Frost Damages of Hydraulic Concrete in Cold Region and Its Preventive Control. Bull. Chin. Ceram. Soc. 2021, 40, 1053–1071. [Google Scholar]
  3. Liu, A.; Zhang, Z.T.; Fan, B.J.; Hu, W.; Zhou, K.X.; Liu, Z.; Liu, K.S. Coupled dynamic model of the vibratory roller-unsaturated subgrade and evolution of its dynamic response during vibratory compaction. Soil Dyn. Earthq. Eng. 2026, 209, 110488. [Google Scholar] [CrossRef] [Scilit]
  4. Zhang, Z.T.; Wang, Y.H.; Zhang, J.Q.; Liu, Z.; Gao, W.H. A new gradation equation for coarse-grained subgrade fillers and its applicability based on the fractal theory. Geomech. Geophys. Geo-Energy Geo-Resour. 2025, 11, 20. [Google Scholar] [CrossRef] [Scilit]
  5. Zhao, Z.R.; Zhang, W.M.; Hu, Z.L.; Liu, Y.J.; Yao, W.Y.; Zhong, Y.T.; Shen, Z.Z. Review of Meso-structural Evolution and Mechanical Damage Characteristic of Concrete Subjected to Freeze-thaw Cycles. Water Resour. Hydropower Eng. 2025, 56, 226–242. [Google Scholar]
  6. Wang, Y.; Li, S.J.; Ye, M.; Yong, G.R.; Bai, Y.; Deng, Y.J.; Qin, M.; Zheng, Z. Research Progress on Mesostructural Evolution and Mechanical Damage Characteristics of Concrete under F-T Cycles. Sci. Technol. Eng. 2023, 23, 5853–5874. [Google Scholar]
  7. Zhang, Z.T.; Gao, W.H. Effect of different test methods on the disintegration behaviour of soft rock and the evolution model of disintegration breakage under cyclic wetting and drying. Eng. Geol. 2020, 279, 105888. [Google Scholar] [CrossRef] [Scilit]
  8. Sun, C.W.; Chen, X.Z.; Chai, J.R.; Wei, T.L.; Ma, B. Research on the Uniaxial Compressive Behavior of Hydraulic Roller Compacted Concrete Subjected to Freeze-Thaw Cycles. Hydro-Sci. Eng. 2023, 2023, 83–94. [Google Scholar]
  9. Bai, W.F.; Niu, D.X.; Guan, J.F.; Yuan, C.Y. The Statistical Damage Model of Concrete under Uniaxial Compression Considering Freeze-Thaw Deterioration Effect. Eng. Mech. 2023, 40, 117–129. [Google Scholar]
  10. Hou, S.S.; He, X.; Meng, X.S.; Chen, L.; Feng, Z.; Liu, M.X.; Li, A.; Guo, C.B.; Ji, F. Mesostructure and Strength Characteristics of Granite under Freeze-Thaw Cycles Based on CT Scanning. J. Geomech. 2024, 30, 462–472. [Google Scholar]
  11. Chen, S.J.; Ren, J.X.; Liu, L.; Li, Y.G.; Ren, X.; Fu, Q. Mesoscopic Characteristics and Damage Evolution of Concrete under Coupled Freeze-Thaw and Salt Erosion. J. Chin. Ceram. Soc. 2024, 52, 3524–3536. [Google Scholar]
  12. Aggelis, G.D. Classification of Cracking Mode in Concrete by Acoustic Emission Parameters. Mech. Res. Commun. 2011, 38, 153–157. [Google Scholar] [CrossRef] [Scilit]
  13. Chen, X.D.; Shi, Z.X.; Zhang, Z.C.; Ning, Y.J.; Bai, L.H. Study on Axial Tensile Damage Evolution Mechanism of Wet-Screened Concrete Based on GMM. J. Archit. Civ. Eng. 2024, 41, 1–9. [Google Scholar]
  14. Zhao, Y.F.; Chen, M.H.; Jiang, X.; Cao, X.P.; Qin, B.B. Damage Evolution and Avalanche Characteristics of Concrete under Salt-Freezing Action by Acoustic Emission. Dev. Built Environ. 2025, 21, 100600. [Google Scholar] [CrossRef] [Scilit]
  15. Scholz, C.H. The Frequency-Magnitude Relation of Microfracturing in Rock and Its Relation to Earthquakes. Bull. Seismol. Soc. Am. 1968, 58, 399–415. [Google Scholar] [CrossRef] [Scilit]
  16. Liu, B.; Zheng, K.; Wang, C.L.; Bi, J.; Lian, S.L. Mechanism Analysis on Anisotropic Degradation of Sandstone in F-T Environment Based on Acoustic Emission. Chin. J. Geol. Hazard Control 2024, 35, 132–142. [Google Scholar]
  17. Liu, M.M.; Chen, T.; Chen, S.Z.; Cao, X.F.; Kong, L.Y.; Jia, Y.L. Shear Strength Parameters and Acoustic Emission Deterioration Characteristics of Feldspar Sandstone under Different Numbers of F-T Cycles. Saf. Coal Mines 2026, 57, 190–199. [Google Scholar]
  18. Xue, W.P.; Zhou, Y.Y.; Cheng, H.; Yao, Z.S.; Rong, C.X.; Wang, Z.J.; Wu, H. Seepage Dynamics and Damage Characteristics of Shaft Lining Concrete under Hydraulic Coupling. Coal Geol. Explor. 2026, 54, 136–146. [Google Scholar]
  19. JGJ 55-2011; Specification for Mix Proportion Design of Ordinary Concrete. China Architecture & Building Press: Beijing, China, 2011.
  20. Lyu, C.; Yu, C.; Lu, C.; Pan, L.; Li, W.W.; Liu, J.P. Long-Term Performance and Microstructural Characterization of Dam Concrete in the Three Gorges Project. Engineering 2024, 33, 237–262. [Google Scholar] [CrossRef] [Scilit]
  21. Zhu, X.Y.; Chen, X.D.; Bai, Y.; Ning, Y.J.; Zhang, W. Evaluation of Fracture Behavior of High-Strength Hydraulic Concrete Damaged by Freeze-Thaw Cycle Test. Constr. Build. Mater. 2022, 321, 126359. [Google Scholar] [CrossRef] [Scilit]
  22. Zhou, L.T.; Wang, H.; Chen, B.; Gao, Z.H.; Zhou, C.T. Damage-Acoustic Emission Characterization of Basalt Fiber Foam Concrete under F-T Environment. Acta Mater. Compos. Sin. 2025, 42, 2062–2073. [Google Scholar]
  23. GB/T 50081-2019; Standard for Test Method of Mechanical Properties on Ordinary Concrete. China Architecture & Building Press: Beijing, China, 2019.
  24. GB/T 50082-2024; Standard for Test Method of Long-Term Performance and Durability of Concrete. China Architecture & Building Press: Beijing, China, 2024.
  25. Wang, W.; Hong, Y.L.; Jiang, P.; Zhan, H.H.; Ren, T.X.; Qiu, X.R.; Li, C.H. Critical Review of Basalt Fiber-Reinforced Concrete: Mechanical Properties, Durability, and Micro Mechanisms. Acta Mater. Compos. Sin. 2026, 1–27. [Google Scholar] [CrossRef]
  26. Shi, L.; Myers, M.K. Microstructure-Informed Hyper-Viscoelastic Model Capturing Soft Tissue Tensile Behavior across Large Deformations. J. Mech. Phys. Solids 2026, 206, 106348. [Google Scholar] [CrossRef] [Scilit] [PubMed]
  27. Ji, X.; Liu, Q.; Li, Q.J.; Hou, D.S.; Wang, M.H. Ca/Si Ratio–Dependent Lubrication Mechanisms in Calcium Silicate Hydrate: Implications for Concrete Fluidity. J. Build. Eng. 2026, 120, 115240. [Google Scholar] [CrossRef] [Scilit]
  28. Xie, J.; Si, J.W.; Hang, E.C.; Sun, Y.D. Damage Evolution Law of LNG Tank Concrete Subjected to Cryogenic-Temperature Freeze-Thaw Cycles. J. Build. Mater. 2025, 28, 58–64. [Google Scholar]
  29. Li, J.C.; Li, Y.; Chen, D.H.; Zhao, W.; Zhang, R. Effect of Initial Damage Coupled Freeze-Thaw Cycle on the Properties of Recycled Fine Powder Concrete. Concrete 2026, 61–67. (In Chinese) [Google Scholar]
  30. Zhou, T.; Xiong, X.B.; Li, Y. Influence of F-T Cycles on Dynamic Performance of Steel Fiber Reinforced Concrete. J. Water Resour. Water Eng. 2021, 32, 167–172+178. [Google Scholar]
  31. Yang, T.T.; Li, Z.H.; Hu, J.; Li, Z.X.; Song, C.Y.; Zheng, T.; Pan, S.D.; Guo, L.C. Mechanical Behavior and Deformation Mechanisms of 3D Woven Preforms under Shear Loading Based on Experimental and Numerical Approaches. Thin-Walled Struct. 2025, 215, 113488. [Google Scholar] [CrossRef] [Scilit]
  32. Zhou, Y.B.; Aydin, B.B.; Zhang, F.Q.; Hendriks, M.A.N.; Yang, Y.G. Lattice Modelling of Complete Acoustic Emission Waveforms in the Concrete Fracture Process. Eng. Fract. Mech. 2025, 320, 111040. [Google Scholar] [CrossRef] [Scilit]
  33. Zhao, N.; Lian, S. Study of Damage Mechanism and Evolution Model of Concrete under Freeze–Thaw Cycles. Appl. Sci. 2024, 14, 7693. [Google Scholar] [CrossRef] [Scilit]
  34. ASTM E1441-19; Standard Guide for Computed Tomography (CT). ASTM International: West Conshohocken, PA, USA, 2019.
  35. Ketcham, R.A.; Carlson, W.D. Acquisition, Optimization and Interpretation of X-Ray Computed Tomographic Imagery: Applications to the Geosciences. Comput. Geosci. 2001, 27, 381–400. [Google Scholar] [CrossRef] [Scilit]
  36. Guo, L.Y.; Chen, B.; Gao, Z.H.; Chen, C.Z. Pore Structure and Thermal Conductivity of Basalt Fiber Reinforced Foam Concrete under F-T Cycles. Acta Mater. Compos. Sin. 2025, 42, 3274–3287. [Google Scholar]
  37. Ohtsu, M.; Uchida, M.; Okamoto, T.; Yuyama, S. Damage Assessment of Reinforced Concrete Beams Qualified by Acoustic Emission. ACI Struct. J. 2002, 99, 468–476. [Google Scholar] [CrossRef] [Scilit] [PubMed]
  38. JCMS-III B5706-2003; Monitoring Method for Active Cracks in Concrete by Acoustic Emission. Federation of Construction Materials Industries: Tokyo, Japan, 2003.
  39. Wu, G.; Zhou, Q.; Ran, H.L. The Maximum Likelihood Estimation of b-Value in Magnitude-Frequency Relation and Analysis of Its Influencing Factors. Seismol. Geol. 2019, 41, 21–43. [Google Scholar]
  40. Xu, X.Y.; Su, H.Z.; Yan, X.Q.; Yao, K.F. Damage Detection of Concrete Materials Based on Energy Attenuation of Acoustic Emission Signals. Nondestruct. Test. 2023, 45, 46–51. [Google Scholar]
  41. Liu, L.; Xu, Y.F.; Liu, Y.; Wang, R.Q.; Zhang, Z.J.; Ma, R.Q. Characterization of Acoustic Emissions from Concrete Based on Energy Activity Coefficient. Buildings 2024, 14, 2109. [Google Scholar] [CrossRef] [Scilit]
  42. Wang, W.; Yuan, K.; Liu, Q.; Ren, J.; Ding, Z.; Li, X. Mesh size identification for cohesive fracture model based on experimentally calibrated FPZ length and FDEM simulation. Theor. Appl. Fract. Mech. 2026, 143, 105485. [Google Scholar] [CrossRef] [Scilit]
Figure 1. Flowchart of specimen preparation and freeze–thaw treatments. The yellow arrows denote the sequence of treatments and grouping, while the thick grey arrows indicate major procedural transitions between experimental phases.
Buildings 16 03360 g001
Figure 2. Flowchart of the multi-scale damage characterization methodology. The green and purple arrows denote the specific workflows for the static Micro-CT scanning phase and the dynamic uniaxial compression-AE monitoring phase, respectively. The thick grey arrow indicates the procedural transition between these two main testing phases.
Buildings 16 03360 g002
Figure 3. Evolution of RCC under different freeze–thaw cycles: (a) 0 F-T cycles. (b) 25 F-T cycles. (c) 50 F-T cycles.
Buildings 16 03360 g003
Figure 4. Relationship between mass loss rate and F-T cycles.
Buildings 16 03360 g004
Figure 5. Stress–strain curve of typical water-bearing RCC after freezing and thawing.
Buildings 16 03360 g005
Figure 6. Variation in Elastic Modulus.
Buildings 16 03360 g006
Figure 7. Evolution of damage variable D of RCC under freeze–thaw cycles. The colored dots represent the discrete data points of the three independent replicates, while the dashed line serves as a mean trend guide.
Buildings 16 03360 g007
Figure 8. Relationship between different freeze–thaw cycles and peak stress.
Buildings 16 03360 g008
Figure 9. Failure modes of RCC under uniaxial compression under different freeze–thaw cycles: (a) Dry state. (b) 0 F-T cycles. (c) 25 F-T cycles. (d) 50 F-T cycles.
Buildings 16 03360 g009
Figure 10. Two-dimensional scanning level diagram of RCC before and after freezing and thawing: (a) 0 F-T cycles. (b) 25 F-T cycles. (c) 50 F-T cycles.
Buildings 16 03360 g010
Figure 11. Relationships between time, stress, and AE ringing counts during uniaxial compression of specimens: (a) Dry state. (b) 0 F-T cycles. (c) 25 F-T cycles. (d) 50 F-T cycles.
Buildings 16 03360 g011
Figure 12. Relationships between time, stress, and AE energy during uniaxial compression of specimens: (a) Dry state. (b) 0 F-T cycles. (c) 25 F-T cycles. (d) 50 F-T cycles.
Buildings 16 03360 g012
Figure 13. Three-dimensional distribution diagram of effective pores in RCC before and after freeze–thawing: (a) 0 F-T cycles. (b) 25 F-T cycles. (c) 50 F-T cycles. Different colors are randomly assigned to visually distinguish individual, unconnected pore clusters.
Buildings 16 03360 g013
Figure 14. The ratio of large, medium and small pores in RCC under different freeze–thaw cycles.
Buildings 16 03360 g014
Figure 15. Scatter plots and crack classification based on JCMS standard in RA-AF domain: (a) Dry state. (b) 0 F-T cycles. (c) 25 F-T cycles. (d) 50 F-T cycles.
Buildings 16 03360 g015
Figure 16. Heatmaps of probability density distribution for RA-AF domains using GMM clustering: (a) Dry state. (b) 0 F-T cycles. (c) 25 F-T cycles. (d) 50 F-T cycles.
Buildings 16 03360 g016
Figure 17. Amplitude–frequency distribution and magnitude of completeness calibration of AE signals under different conditions.
Buildings 16 03360 g017
Figure 18. Distribution Characteristics of b-values in RCC Under Different Freeze–thaw Cycles: (a) Dry state. (b) 0 F-T cycles. (c) 25 F-T cycles. (d) 50 F-T cycles.
Buildings 16 03360 g018
Table 1. The RCC Test Mix Ratio.
Compressive Strength GradeAdmixture Dosage
(%)
Water-to-Binder RatioWater
(kg/m3)
Cement
(kg/m3)
Coarse Aggregate
(kg/m3)
Fine Aggregate
(kg/m3)
Fly Ash
(kg/m3)
C204.00.65130120132081080
Table 2. Quality and mass loss rate of RCC.
Specimen IDMass
(g)
F-T CyclesMass Loss
(g)
Mass Loss Rate
(%)
Average Mass Loss
(g)
Average Mass Loss Rate
(%)
RCC-0-1379800000
RCC-0-2395600
RCC-0-3380100
RCC-25-1370025982.581032.66
RCC-25-238141423.59
RCC-25-33732691.82
RCC-50-13611501874.921904.93
RCC-50-237611954.93
RCC-50-336131884.95
Table 3. RCC test parameters and uniaxial test results.
Specimen ID φ
(mm)
H
(mm)
M
(g)
σ
(MPa)
σ ¯
(MPa)
Cv
(%)
ε
(10−3)
ε ¯
(10−3)
E
(GPa)
DRCC-0-199.99199.98384524.6426.095.41.841.8819.64
DRCC-0-2100.05200.05385626.182.0121.63
DRCC-0-399.98199.99389427.451.8020.13
RCC-0-199.98199.98379823.3722.375.92.232.3320.08
RCC-0-299.95200.03379222.862.4119.86
RCC-0-3100.02199.97381420.892.3518.96
RCC-25-1100.08200.04382514.7615.685.52.732.6415.65
RCC-25-299.94199.97384516.482.4616.74
RCC-25-3100.12200.05377715.802.7216.35
RCC-50-199.97199.98380112.1511.575.33.143.0413.69
RCC-50-2100.04199.96378510.922.9612.16
RCC-50-399.99200.03378611.643.0114.35
Disclaimer/Publisher’s Note: The statements, opinions and data contained in all publications are solely those of the individual author(s) and contributor(s) and not of MDPI and/or the editor(s). MDPI and/or the editor(s) disclaim responsibility for any injury to people or property resulting from any ideas, methods, instructions or products referred to in the content.