Article

Multi-Objective Optimization of Building Performance for University Dormitories in Cold Climate Regions During Winter

1
School of Architecture and Fine Art, Dalian University of Technology, Dalian 116024, China
2
Jinshitan Subdistrict Office, Jinpu New Area, Dalian 116650, China
*
Authors to whom correspondence should be addressed.
Buildings 2026, 16(15), 3126; https://doi.org/10.3390/buildings16153126
Submission received: 23 June 2026 / Revised: 30 July 2026 / Accepted: 4 August 2026 / Published: 6 August 2026

Abstract

University dormitories in cold climate regions face the dual challenges of high heating energy consumption and poor outdoor pedestrian comfort during winter. Existing studies on university dormitories have primarily focused on individual building performance optimization, while insufficient attention has been paid to the optimization of dormitory cluster layouts and their multi-objective performance. To address this gap, this study establishes a parametric multi-objective optimization framework to simultaneously minimize building energy use intensity, minimize wind speed at pedestrian height, and maximize outdoor thermal comfort. Based on three floor area ratio scenarios, 24 dormitory prototypes are extracted from three building typologies: row-type buildings, detached buildings, and enclosed buildings. The optimization process was implemented on the Grasshopper platform using the NSGA-II algorithm. Cluster analysis is conducted on the Pareto front, and Pearson correlation analysis is applied to investigate the relationships between six urban morphological parameters and the three optimization objectives. The results indicate that: (1) enclosed buildings (E-1 type) and detached buildings (D-1 type) dominate the Pareto-optimal solution set; (2) high-FAR buildings are predominantly distributed in the northeastern part of the site, while public spaces are concentrated in the central-southern area; (3) correlation analysis indicates that shape coefficient (SC) exhibits the strongest correlations with the three objectives; and (4) compared with dominated solutions, Pareto-optimal solutions reduce WS by 10.46% and EUI by 6.57%, while improving UTCI by 0.05 °C. This study provides quantitative decision-making support for efficient planning and low-carbon design of university dormitory clusters in cold climate regions.

1. Introduction

To effectively address global climate challenges, China has proposed the “dual-carbon” strategic goals, making energy conservation, emission reduction, and comfort improvement in the building sector critical issues [1]. Current research on building performance in cold climate regions remains limited and has predominantly focused on low-latitude areas characterized by high temperature and humidity [2]. However, significant energy consumption issues also exist in cold regions. According to the Standard for Climatic Regionalization of Buildings [3], cold climate regions in China are characterized by long, cold, and dry winters, with average January temperatures ranging from −10 °C to 0 °C and extreme minimum temperatures reaching as low as −30 °C. At present, buildings in these regions generally exhibit poor thermal insulation performance of the envelope, resulting in high heating demand during winter and consequently excessive building energy consumption [4,5]. Studies indicate that although buildings in severe cold and cold regions account for only approximately 50% of the total building area in China, they consume nearly 40% of the national building energy use. Moreover, winter heating demand and resistance to winter monsoon effects are particularly critical in these regions [6]. Therefore, cold climate regions represent one of the most urgent areas for building energy efficiency improvements in China.
With the implementation of higher education expansion policies, the scale of higher education in China has increased year by year, posing new requirements and challenges for university dormitory buildings. According to the Statistical Communiqué on the Development of National Education in 2024 [7], the number of higher education institutions nationwide has reached 3119, with a total enrollment of 48.46 million students, representing a 36% increase compared to 35.59 million in 2014. This rapid growth has led to significant shortages in accommodation resources across many universities. Dormitory areas are high-density zones on campuses, characterized by extensive use of lighting systems, electronic devices, and other electricity-consuming equipment, along with long per capita usage durations and substantial energy consumption, indicating considerable potential for energy efficiency improvement [8]. The per capita energy consumption in university dormitories is approximately four times the national average [9], and the energy use intensity is as high as 5–10 times that of typical residential buildings [10]. This high energy consumption, combined with the substantial heating demand in winter in cold regions, further underscores the urgency of optimizing dormitory building performance. In this context, multi-objective optimization algorithms provide an effective approach to addressing the synergy between energy efficiency and thermal comfort [11,12].
In the field of building performance optimization, multi-objective optimization algorithms have become a core method for enhancing the scientific rigor of design, as they enable the comprehensive balancing of multiple performance indicators on a quantitative basis [13]. Meanwhile, previous studies on energy-efficient building design have demonstrated that passive design strategies can effectively improve building energy performance [14]. By coordinating the trade-offs among building energy consumption, thermal comfort, and cost, these methods provide an effective paradigm for refined building design [13]. For residential buildings in cold climate regions, numerous studies have applied approaches such as genetic algorithms (NSGA-II) [15] and parametric simulations [16] to conduct multi-objective optimization of building performance. For example, Wang et al. [17] focused on winter heating issues in residential buildings in northwestern China and performed multi-objective optimization considering building cost, energy consumption, and environmental sustainability, achieving significant improvements in energy efficiency and cost savings. Similarly, Xi et al. [18] investigated the optimal solutions to winter heating energy consumption in rural housing in cold regions through the coordinated optimization of building energy use and cost. These studies provide valuable paradigms for refined residential design. However, compared with residential buildings, university dormitories—characterized by unique usage patterns and high occupant density—remain underexplored in terms of building performance optimization [19].
Given the high density and distinctive usage patterns of university dormitories, optimizing their building layout and performance is of great significance for reducing overall campus energy consumption, enhancing the comfort of students’ living and activity spaces, and promoting the concept of green campuses [8]. Building form design is a key factor in regulating the microclimate [20], occupying a leading position in the design process and exerting a decisive influence on building performance throughout the entire life cycle [21]. Although research on dormitory building performance has made certain progress, it has predominantly focused on single-objective optimization. In terms of building energy use intensity (EUI), existing studies have mainly investigated the effects of building orientation, shape coefficient, and envelope characteristics on energy performance [22,23,24,25], while research on the relationship between dormitory morphology and energy performance in cold climate regions remains limited. For outdoor thermal comfort, existing studies have primarily evaluated campus outdoor thermal environments through field measurements or microclimate simulations [9,26,27,28,29,30]; however, optimization mechanisms linking building morphology parameters with outdoor thermal comfort remain insufficiently explored. Existing wind environment studies have mainly employed computational fluid dynamics (CFD) simulations for quantitative analysis. For example, Chen et al. [31] applied CFD simulations to optimize the morphology and layout of multi-story dormitory buildings considering wind environment performance. However, integrated multi-objective optimization studies that simultaneously consider energy consumption, outdoor thermal comfort, and wind environment performance remain insufficient, particularly for university dormitories in cold climate regions.
The wind environment is a critical indicator in the optimization of building performance for university dormitories in cold climate regions, with its importance reflected in multidimensional synergistic effects. Specifically, the wind chill effect in cold regions exacerbates human cold stress, thereby reducing outdoor pedestrian comfort [32]. Meanwhile, the wind environment affects indoor comfort and students’ physical and mental health [33]. Furthermore, a well-designed wind environment can improve energy efficiency and building safety in dormitory buildings [31]. In addition to wind conditions, rising temperatures driven by global climate change have further increased the importance of outdoor environmental comfort in buildings [34,35]. Research on outdoor environments in university dormitories has gradually expanded; for instance, some scholars conducted field measurements of outdoor environments at a university in Xi’an and used IBM SPSS Statistics 27.0.1 software to analyze questionnaire data, exploring the relationship between outdoor thermal comfort and solar radiation in winter in cold regions [36]. Against this background, multi-objective optimization studies addressing winter building energy consumption, outdoor thermal comfort, and wind environment in university dormitory areas in cold climate regions have become increasingly important.
Based on this context, this study is guided by the “dual-carbon” strategy and aligned with the concept of green campuses, focusing on the issues of high energy consumption and insufficient outdoor wind and thermal comfort in university dormitory areas. University dormitories in cold climate regions of China were selected as the research object. Building energy use intensity (EUI), wind speed (WS), and Universal Thermal Climate Index (UTCI) are selected as the key multi-objective optimization indicators, while considering daylighting and visual comfort [37]. Building performance simulations are conducted using the Grasshopper platform, integrated with performance simulation plugins such as Honeybee and Butterfly. Taking the minimization of EUI and WS and the maximization of UTCI as the optimization objectives, this study analyzes the Pareto-optimal solution sets of building morphology and layout for university dormitory areas under low-, medium-, and high-floor area ratio (FAR) scenarios in cold climate regions. Furthermore, it investigates the independent and coupled effects of urban morphological parameters on the optimization objectives. The findings provide scientific references and decision-making support for morphological decision-making and performance trade-offs under low-, medium-, and high-FAR scenarios, thereby promoting low-carbon design and outdoor comfort improvement through morphological optimization of university dormitory areas in cold climate regions.

2. Methods

2.1. Research Framework

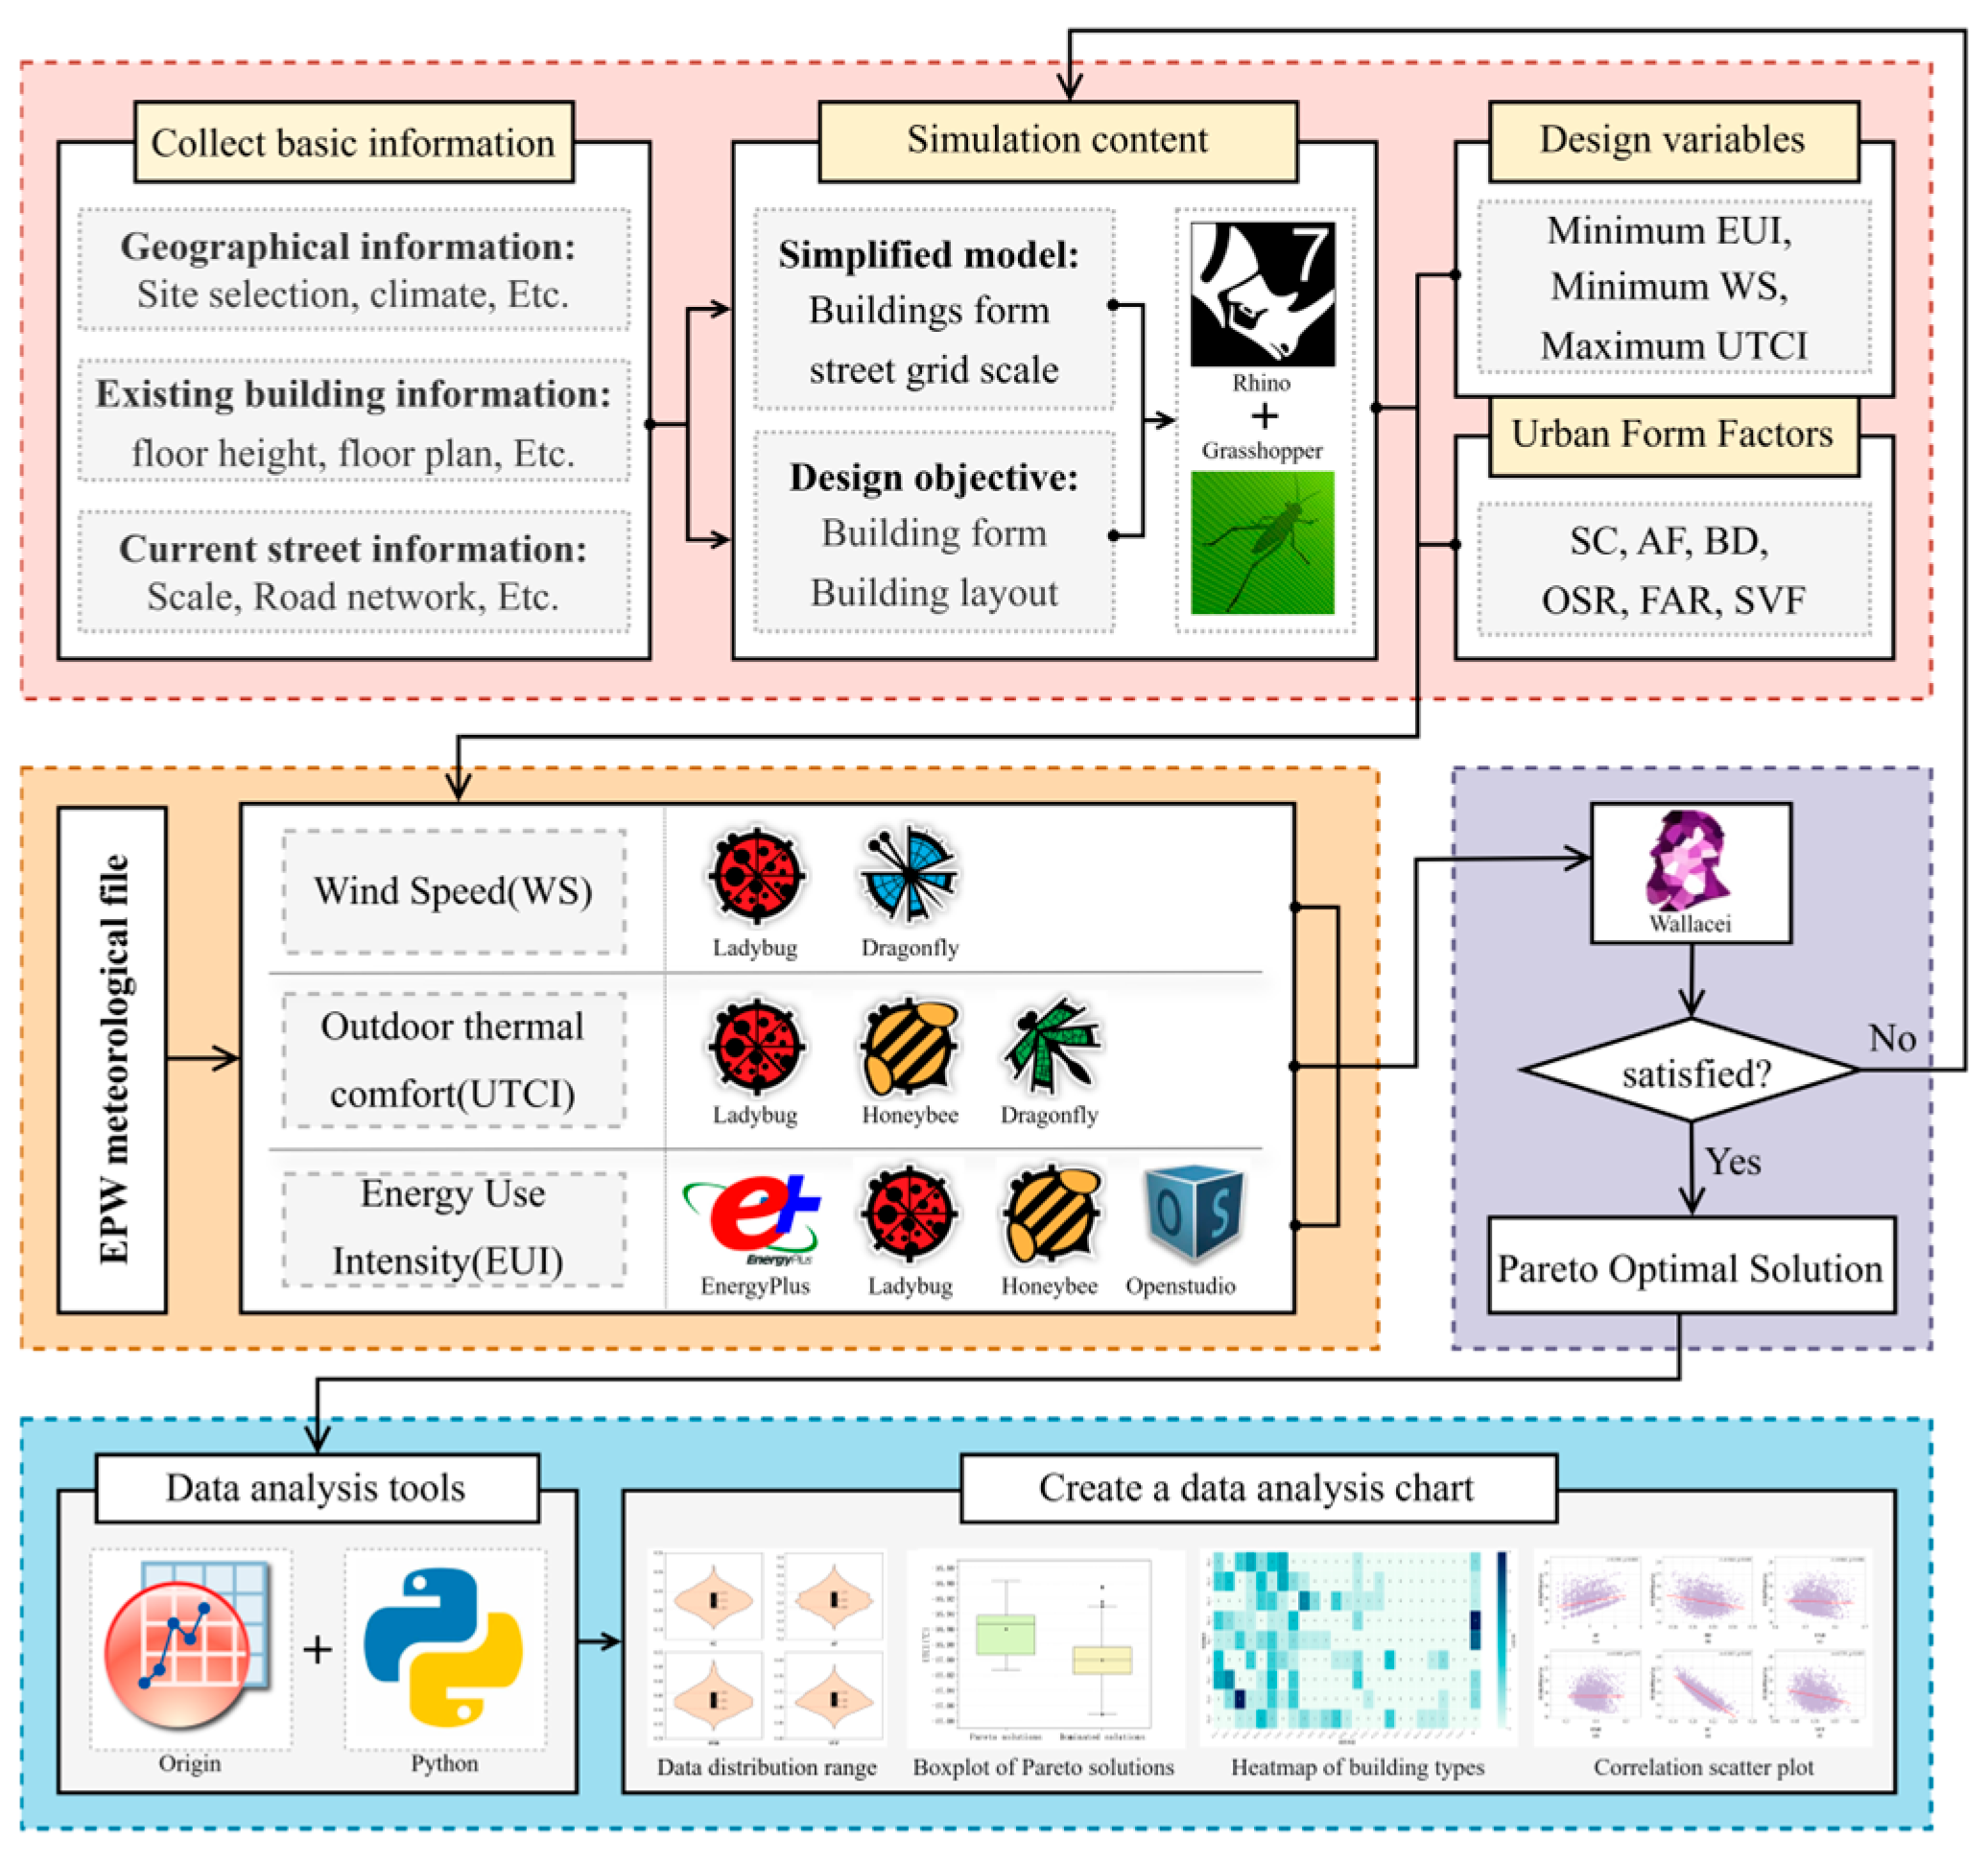
The research methodology for multi-objective optimization of dormitory building performance in cold climate regions consists of four main steps (Figure 1). First, parametric modeling and objective definition are conducted. The geographical context of cold regions is identified, followed by the collection of typical cases of university dormitories in such climates. Based on this, 24 dormitory building prototypes and one canteen building are defined, along with the specification of the site grid dimensions. Parametric modeling of individual dormitory buildings and their site layout is then developed using the Rhinoceros 7.0 and Grasshopper (built-in) platforms. The optimization objectives are defined as minimizing building energy use intensity (EUI), minimizing wind speed (WS), and maximizing Universal Thermal Climate Index (UTCI). In addition, six urban morphological parameters are selected as key variables for analysis. Second, building performance simulations are carried out. Grasshopper plugins are employed to simulate EUI, outdoor wind speed, and outdoor thermal comfort. Specifically, Butterfly 0.0.05 is used to calculate outdoor wind speed, Honeybee 1.9.0 is applied to evaluate outdoor thermal comfort, and EnergyPlus 24.2.0 is utilized for building energy consumption simulation. Third, multi-objective optimization is performed. Based on the predefined objectives, the Wallacei 2.65 plugin is employed to conduct multi-objective optimization and identify Pareto-optimal solutions. Fourth, data analysis is undertaken. During the simulation process, relevant data—including objective variables, building density, and floor area ratio—are recorded using the Data Recorder component. Subsequently, Python 3.9 and Origin 2024 are used to organize and classify the optimal solutions under different variable conditions, enabling analysis of the characteristics of the Pareto front as well as the correlations between optimization objectives and urban morphological parameters. Through this process, an integrated workflow from prototype extraction, parametric modeling, and performance simulation to multi-objective optimization was established, providing quantitative decision support for the early-stage design of university dormitory planning.

2.2. Dormitory Prototype Extraction

To establish a morphological prototype library for layout optimization of university dormitory clusters in cold climate regions, this study identified and summarized the typical morphological characteristics of university dormitory buildings. A building prototype is an abstraction of the common morphological features shared by a large number of real-world building cases and serves as a fundamental basis for parametric generative design. The research samples were obtained from three main sources. First, representative university dormitory clusters were selected for field investigations and parametric modeling. Second, additional samples were collected from publicly available sources, including published campus planning documents and Google Earth satellite imagery. Third, typical cases reported in the literature on dormitory planning and design in cold climate regions, both in China and abroad, were incorporated to enrich the sample set.
The extraction of dormitory prototypes did not involve direct replication of existing cases. Instead, representative parametric design elements, including typical building floor plan layouts and building height, were systematically summarized to establish representative building prototypes that could serve as basic models for subsequent multi-objective optimization. Based on the collected dormitory cases in cold climate regions, the prototypes were classified into three floor area ratio (FAR) categories (1–2, 2–3, and >3) and further grouped into eight typical dormitory building types according to their spatial configuration.
According to urban morphology theory [38], the dormitory prototypes are classified into three categories, including two row-type buildings (R-1-1 and R-2-1, both six stories), three detached buildings (D-1-1, D-2-1, and D-3-1, all six stories), and three enclosed buildings (E-1-1 and E-2-1 with six stories, and E-3-1 with four stories). Under the premise of satisfying the minimum daylight spacing requirements, variations in FAR are achieved primarily by adjusting building heights. For medium-FAR scenarios, the heights of detached buildings are increased to 12 stories (denoted as D-1-2, D-2-2, and D-3-2), while for other types, only the northernmost buildings are increased to 12 stories (denoted as R-1-2, R-2-2, E-1-2, E-2-2, and E-3-2). For high-FAR scenarios, the heights of detached buildings are increased to 24 stories (denoted as D-1-3, D-2-3, and D-3-3), while for other types, the northernmost buildings are increased to 24 stories (denoted as R-1-3, R-2-3, E-1-3, E-2-3, and E-3-3). The resulting 24 dormitory building types cover the majority of university dormitory configurations in cold climate regions and provide representative prototypes for subsequent performance simulations. Table 1 presents the simplified models and relevant information for the 24 dormitory types.

2.3. Urban Morphological Parameters

This study adopts urban morphological parameters as key indicators to analyze the relationship between dormitory form and performance. These parameters are categorized into three groups: site planar parameters, building form parameters, and urban spatial parameters (Table 2) [39,40].
The first category consists of site planar parameters, including building density (BD) and floor area ratio (FAR).
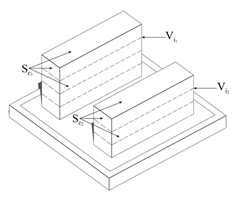
Building density (BD) is mathematically defined as the ratio of the total building footprint area ( i = 1 n f i ) to the site area ( A s ). It reflects the degree of building concentration within a site and serves as a key indicator for controlling ground-level layout, being closely associated with the ventilation potential at the pedestrian level. The calculation formula for BD is as follows:
B D = i = 1 n f i A s
Floor area ratio (FAR) is a key indicator in urban planning for controlling development intensity. It is mathematically defined as the ratio of the total gross floor area ( i = 1 n S i ) to the site area ( A s ). The calculation formula for FAR is as follows:
F A R = i = 1 n S i A s
The second category comprises building form parameters, including average floor number (AF) and shape coefficient (SC).
The average floor number (AF) represents the average vertical development intensity of buildings within a site. It is mathematically defined as the ratio of the total gross floor area ( i = 1 n S i ) to the total building footprint area ( i = 1 n f i ). The calculation formula for AF is as follows:
A F = i = 1 n S i i = 1 n f i
The shape coefficient (SC) is defined as the ratio of the building envelope surface area to the building volume. It is an important thermophysical geometric indicator used to evaluate the compactness of a building. A more compact building corresponds to a lower SC value, making it a key parameter for controlling building energy consumption in cold climate regions. The calculation formula for SC is as follows:
S C = i = 1 n c i i = 1 n h i f i
The third category comprises urban spatial parameters, including the open space ratio (OSR) and the sky view factor (SVF).
The open space ratio (OSR) is defined as the proportion of open space (i.e., areas not covered by buildings) within the total site area. It is used to evaluate the relationship between built-up areas and open spaces within a site. The calculation formula is as follows:
O S R = A s i = 1 n f i i = 1 n S i
The sky view factor (SVF) is an indicator used to characterize the openness of urban spaces, with values ranging from 0 to 1 and showing a positive correlation with sky visibility. In this study, the Ladybug plugin in Grasshopper is employed to simulate the average SVF of the dormitory area. The calculation formula for SVF is as follows:
S V F = 1 i = 1 n s i n γ i n

2.4. Research Plot

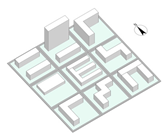
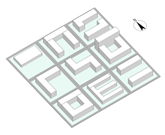
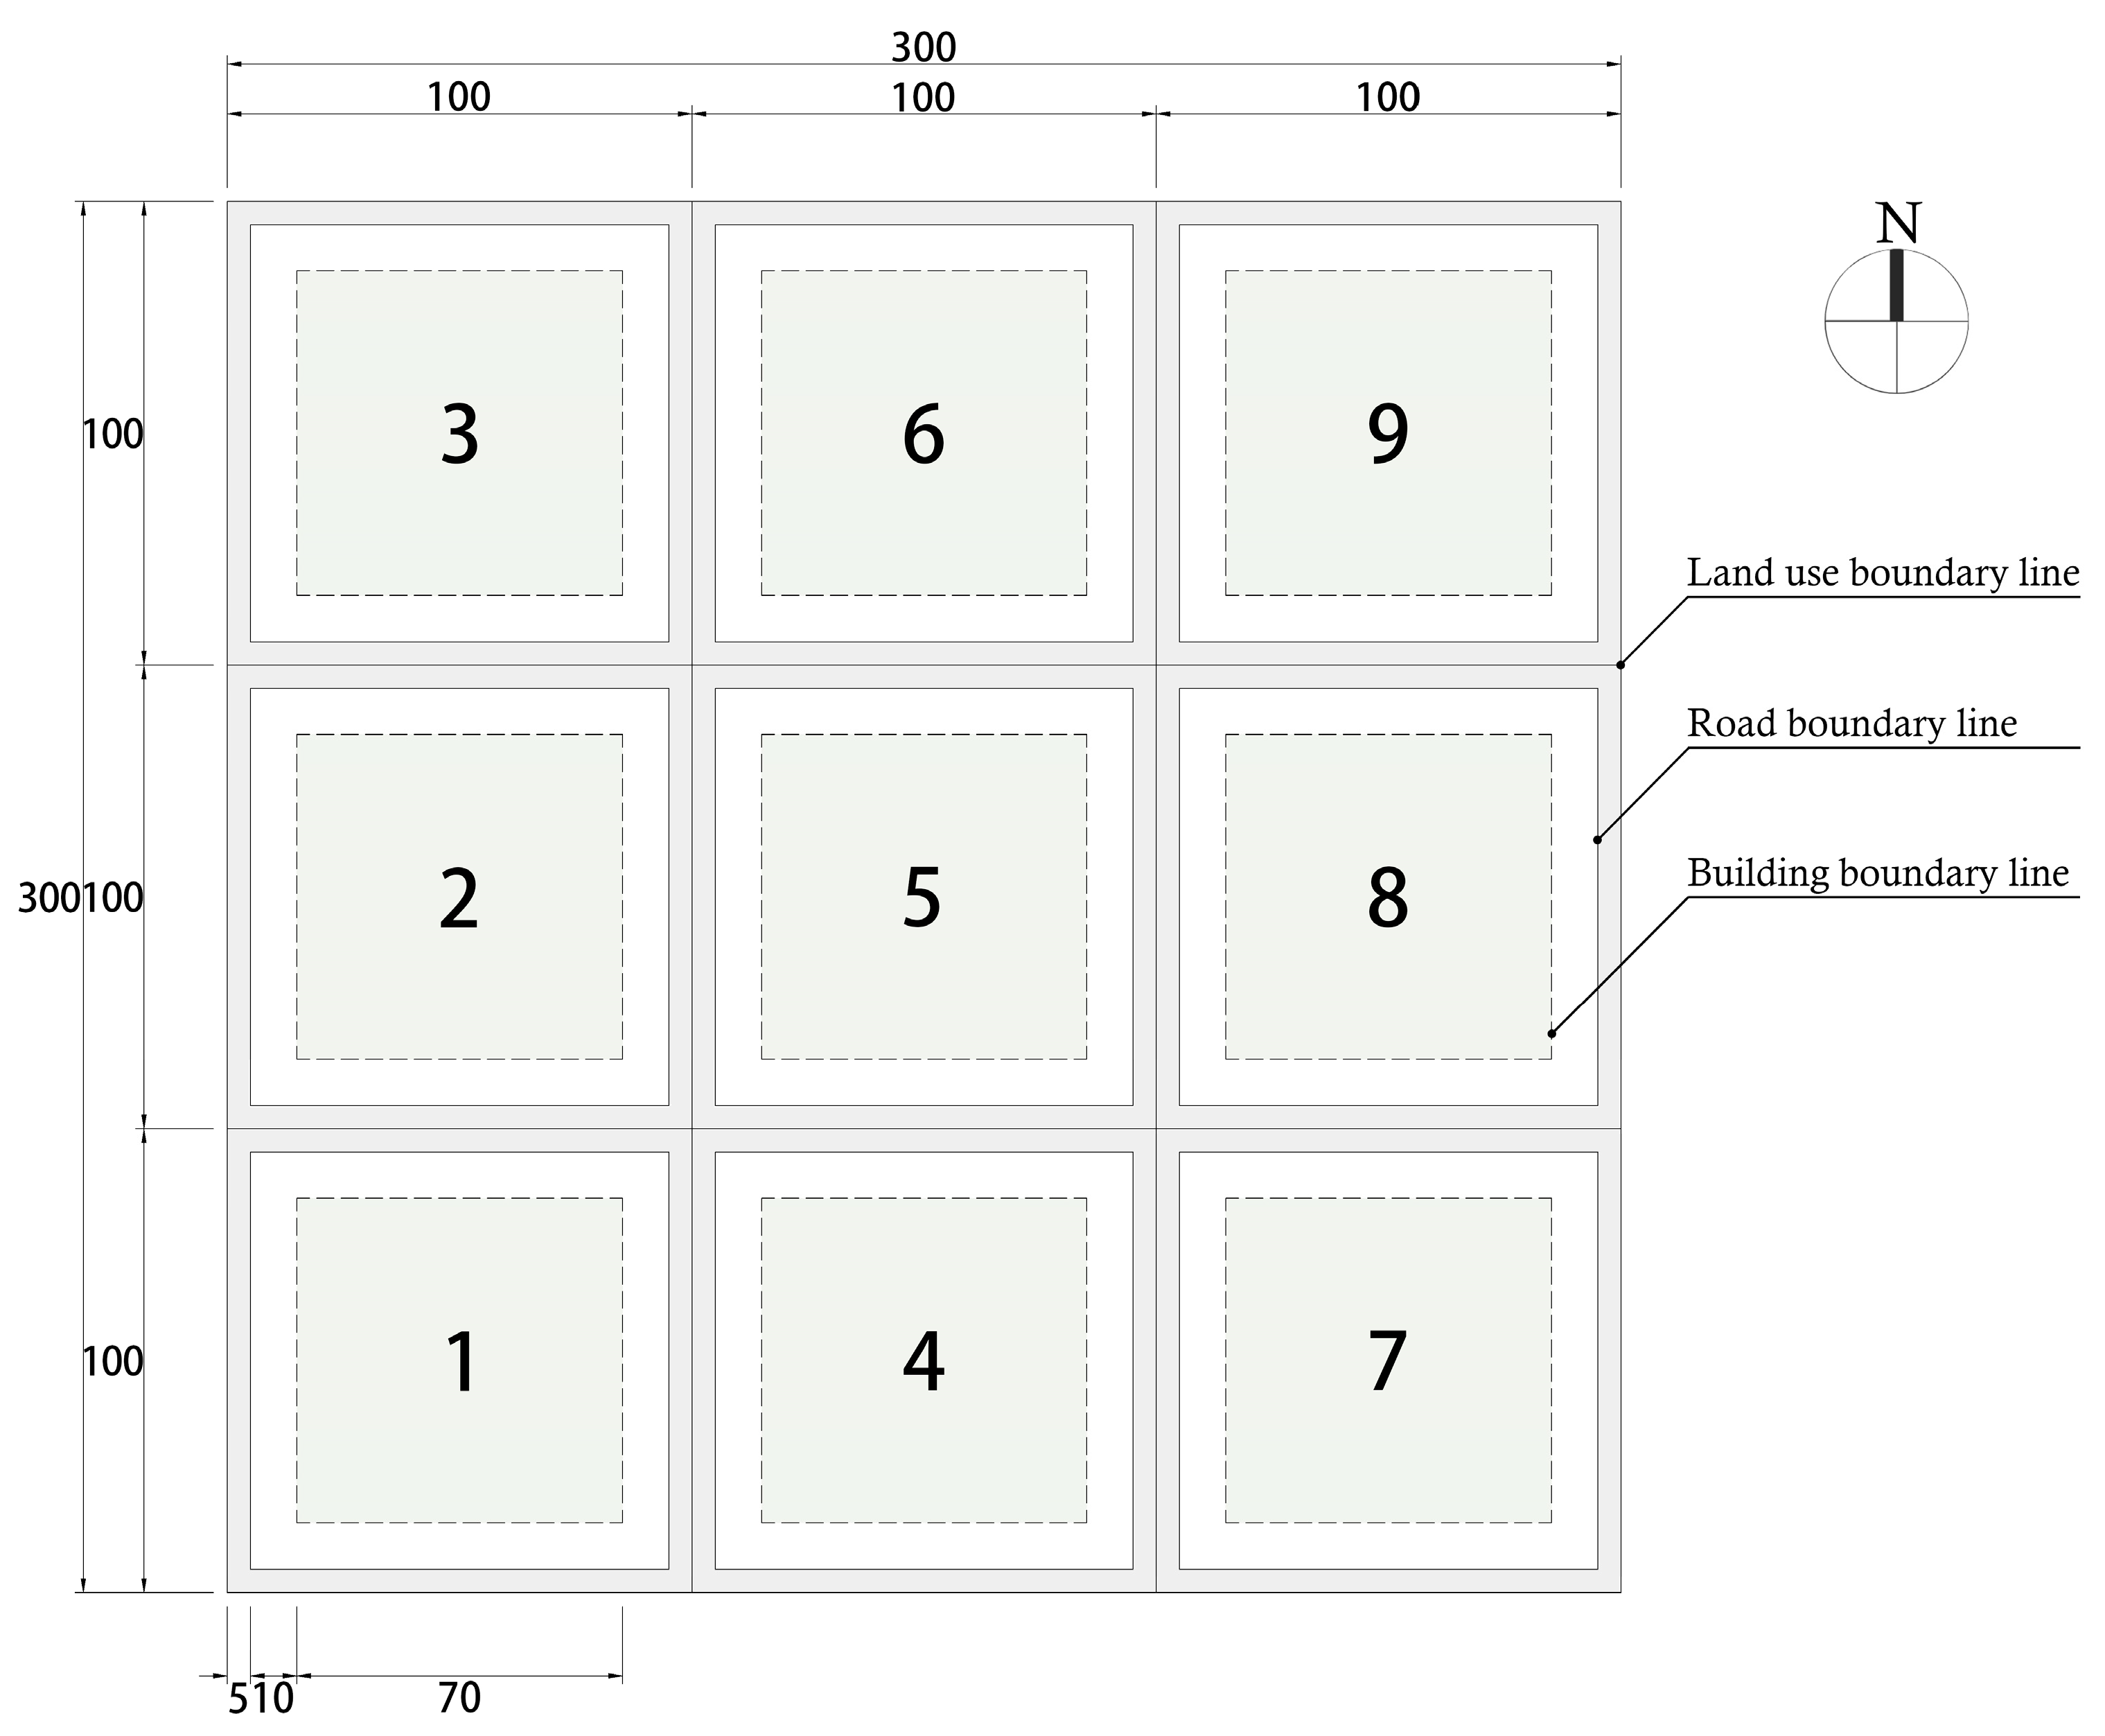
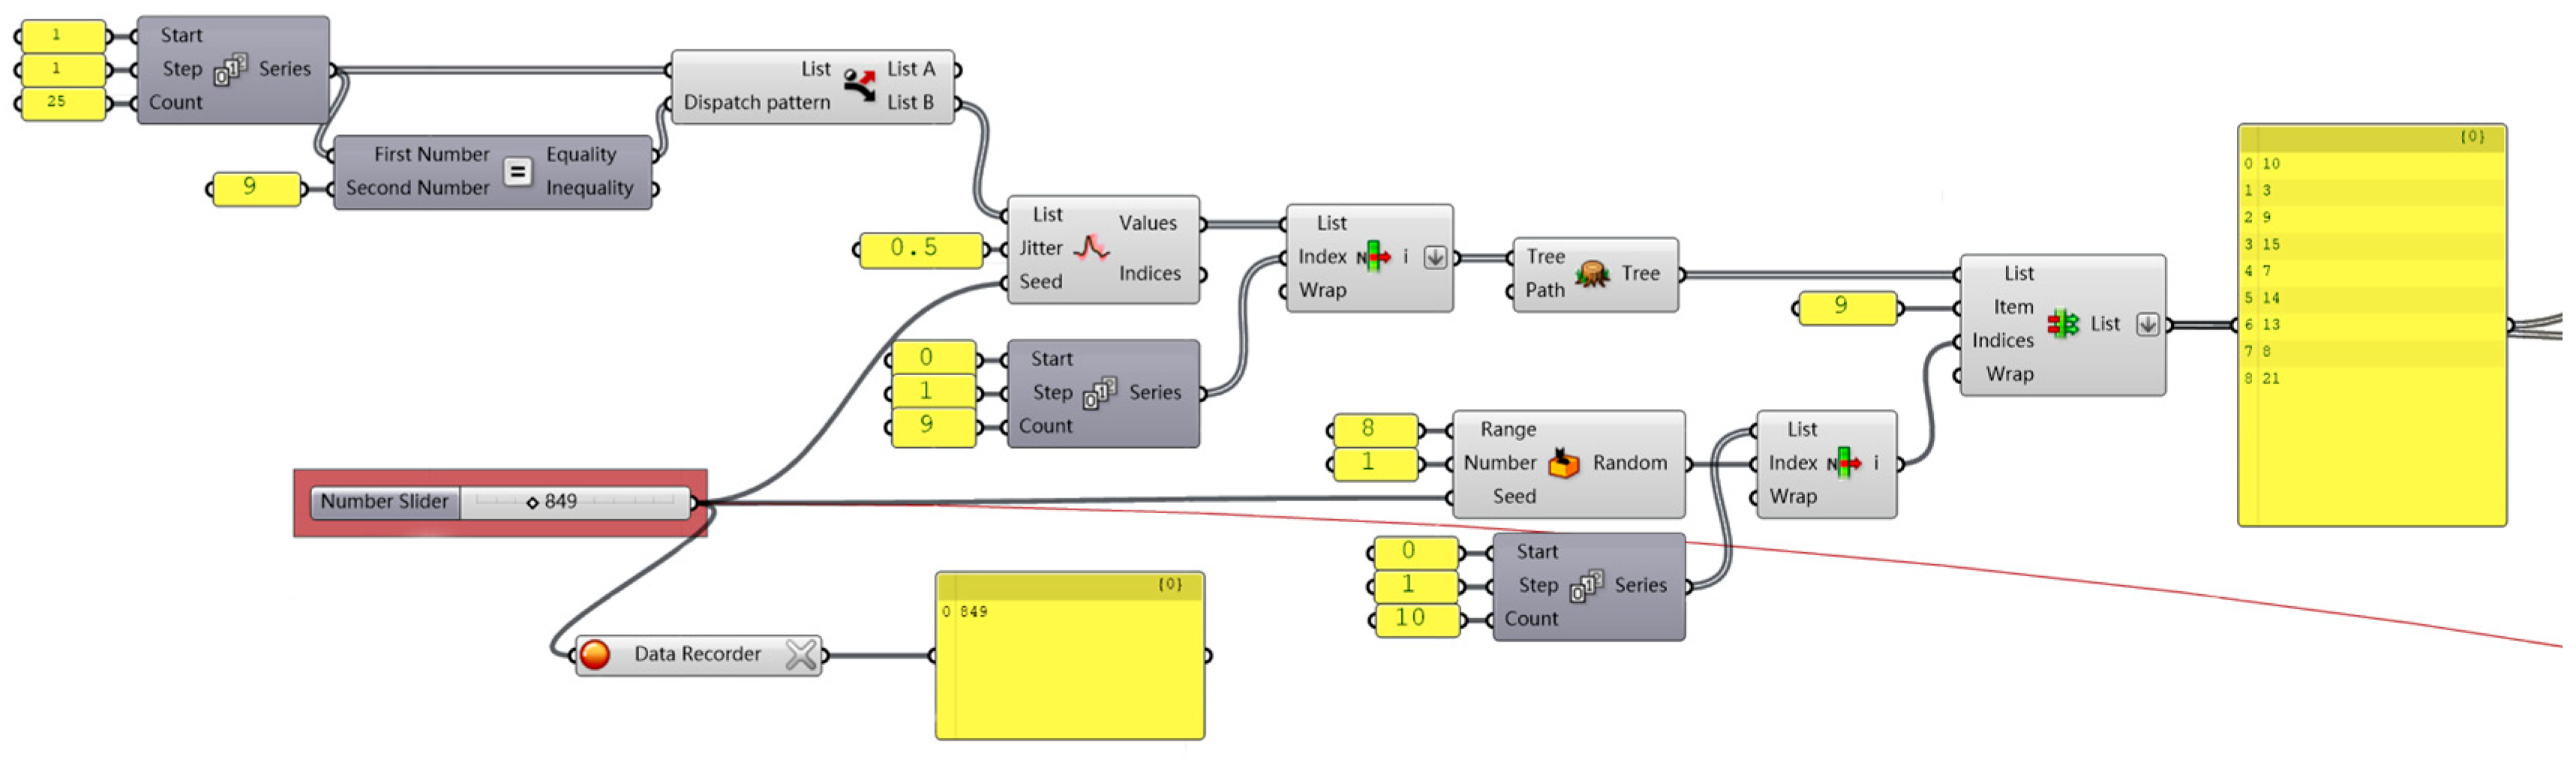
Based on field measurements from case studies and the Grasshopper platform, this study selected a square site with dimensions of 300 m × 300 m as the research plot. This scale represents the spatial characteristics of typical university dormitory clusters while maintaining computational efficiency for multi-objective optimization. The site was subsequently divided into a grid consisting of nine square units, each measuring 100 m × 100 m. A 5 m road setback is defined for each unit, followed by an additional 10 m building setback from the red line, resulting in a 70 m × 70 m developable area. This configuration satisfies the functional requirements and spatial scale of university dormitory buildings while ensuring the reliability of wind environment and outdoor thermal comfort simulations. Subsequently, a candidate identifier pool ranging from 1 to 25 is established, and the 24 dormitory buildings and one public service building (a canteen, as a representative example) are assigned random identifiers. Eight non-repeating dormitory building identifiers are randomly selected from the candidate pool, while the public service building is assigned a fixed identifier of No. 9. The Replace Items component is used to insert identifier No. 9 into the encoding sequence, ensuring that identifier No. 9 is included in every generated layout configuration. A nine-digit non-repetitive encoding sequence consisting of “eight random identifiers + one fixed identifier 9” is therefore generated. Each encoding sequence represents a complete layout scheme, as illustrated in Figure 2. The Seed values of the Jitter and Range components are defined as adjustable random parameters, and different Seed values generate different encoding sequences. Finally, the generated encoding sequences are imported into the Wallacei plugin as design variables to drive the optimization iterations. The generation process is illustrated in Figure 3.

2.5. Building Performance Simulation

2.5.1. Simulation Platform

In this study, the performance simulation of dormitory buildings is conducted using Grasshopper, a visual algorithm editor, in combination with multiple performance simulation plugins from the open-source Ladybug Tools suite. Simulations and calculations are carried out for building energy consumption, outdoor thermal comfort, and wind environment conditions. The Honeybee plugin is employed to convert parametric models into properly formatted input files, which are then integrated with the OpenStudio 3.9.0 interface and the EnergyPlus simulation engine developed by the U.S. Department of Energy for hourly energy consumption analysis. Additionally, Honeybee and Ladybug components are used to calculate key indicators such as the Universal Thermal Climate Index (UTCI), enabling the assessment of outdoor thermal comfort. Furthermore, for wind environment simulation, compared with other computational fluid dynamics (CFD) software packages, such as PHOENICS and Fluent, this study employs the open-source CFD solver OpenFOAM 5.0 (via blueCFD 2017-1), which offers lower cost and greater flexibility. Through the Butterfly plugin, OpenFOAM is seamlessly integrated with the Grasshopper platform to establish a parametric simulation network for outdoor wind environment simulation. Finally, Python scripting is implemented to achieve a fully automated process encompassing parametric modeling, performance simulation, and data analysis, thereby providing a robust computational foundation for subsequent multi-objective optimization.

2.5.2. Simulation Parameter Settings

In this study, winter-period energy use intensity (EUI, kWh/m2) is adopted as the key indicator for evaluating energy performance. It is defined as the ratio of total building energy consumption to the building floor area during the simulation period from 21 December to 21 February, comprehensively reflecting the energy demand of heating, cooling, lighting, and other building systems. The simulation process is conducted using the Honeybee plugin on the Grasshopper platform, with EnergyPlus serving as the simulation engine for building energy analysis. The simulation object is university dormitory buildings, and the performance parameter settings are primarily based on the Code for Design of Dormitory Buildings (JGJ 36-2016) and the General Code for Energy Efficiency and Renewable Energy Application in Buildings (GB 55015-2021). These parameters include lighting power density, operational settings of heating and air-conditioning systems, and occupant density. In addition, the thermal performance parameters of the building envelope—such as the heat transfer coefficients and solar heat gain coefficients of external walls, roofs, and windows—are specified in accordance with relevant standards. The detailed parameter settings are presented in Table 3.
Additionally, the wind environment simulation is conducted based on the Butterfly and OpenFOAM platforms. The prevailing winter wind direction is determined as northwest wind using the Ladybug Wind Rose component based on EPW weather data, with a reference wind speed of 6.30 m/s at a height of 10 m. Subsequently, the inlet wind profile is defined according to the characteristics of the atmospheric boundary layer (ABL), with the terrain roughness category set to 5 to represent the typical rough ground conditions of an urban campus environment. According to the guidelines for building wind environment simulations, the wind tunnel dimensions are configured with an upstream extension (windward_x = 5), lateral extension (sides_x = 5), and downstream extension (leeward_x = 10) relative to the building height, ensuring sufficient flow development and maintaining the blockage ratio below the recommended threshold of 5%. The RNG k-ε turbulence model is adopted for pedestrian-level wind environment simulation. The simulation is considered converged when the residuals decrease below 1 × 10⁻⁴ and the wind speeds at monitoring points remain stable. A mesh convergence test was also conducted in this study. As shown in Table 4, with the increase in mesh density from (1,1) to (4,4), the adjacent variation rate decreased from 22.7% to 8.2%, and further to 3.1%, indicating that the results approached a converged state. Considering the computational time required for 3000 simulations, local mesh refinement was performed based on the (2,2) mesh density, and (2,4) was selected as the final mesh density to balance computational efficiency and resolution.
Outdoor thermal comfort is evaluated using the Universal Thermal Climate Index (UTCI), which is calculated through the HB UTCI Comfort Map component in Honeybee. The UTCI calculation integrates four environmental parameters, including air temperature, mean radiant temperature (MRT), relative humidity, and wind speed, together with human physiological parameters including metabolic rate and clothing insulation. According to ISO 7726 [41], the metabolic rate is set to 135 W/m2, and the clothing insulation is set to 0.9 clo, corresponding to the default parameters of the component. The simulation period is defined from 21 December 2025 to 21 February 2026 to represent typical winter conditions. UTCI values are calculated at the pedestrian height of 1.5 m and are visualized as spatial distribution maps to compare the outdoor thermal comfort performance among different dormitory layout schemes.

2.6. Multi-Objective Optimization

2.6.1. Definition of Multi-Objective Optimization

Multi-objective optimization (MOO) is commonly used to address decision-making problems involving multiple conflicting objectives. Unlike single-objective optimization, which seeks a unique optimal solution, MOO aims to explore trade-off solutions that balance multiple objectives. From a mathematical perspective, MOO can be defined as the process of finding a decision variable vector x that minimizes a multi-component objective function vector F ( x ) , containing m components ( m 2 ), subject to two constraints, g j and h k ( x Ω R , Ω represents the feasible domain of the decision variables).
x = [ x 1 , x 2 , , x n ] T s . t .   g j x 0 , j = 1 , , J h k x = 0 , k = 1 , , K m i n x   F ( x ) = [ f 1 ( x ) , f 2 ( x ) , , f m ( x ) ] T
A solution ( x ) is considered a Pareto optimal solution if none of its objectives can be further optimized without compromising the performance of other objectives. The set of multiple Pareto-optimal solutions generated by the optimization process forms the Pareto set, and its mapping in the objective space is referred to as the Pareto front. By balancing multiple objectives to be optimized, multiple solutions are generated, from which decision-makers can select the most suitable solution based on design requirements or specific design objectives.

2.6.2. Optimization Objectives

Based on prior research, this study sets the minimum wind speed (WS), minimum energy use intensity (EUI), and maximum Universal Thermal Climate Index (UTCI) as optimization objectives. The study explores the winter performance of university dormitories in cold regions, using building layout and building type as the research variables.
Wind speed (WS) is a key parameter for evaluating the outdoor wind environment, typically referring to the horizontal wind speed at pedestrian height (1.5–1.8 m). In this study, a sampling height of 1.5 m was adopted, and sampling points were uniformly arranged at the pedestrian level across the outdoor spaces of the dormitory area, excluding areas occupied by building footprints. Using the Butterfly plugin is primarily used to calculate the average wind speed of the outdoor space through computational fluid dynamics (CFD) simulations.
V - = 1 / N i = 1 N V i
where V - is the calculated average wind speed (m/s); N is the total number of sampling points; and V i is the wind speed at the i -th sampling point.
Energy use intensity (EUI) is a key indicator for evaluating overall building energy performance. In this study, it represents the ratio of the total building energy consumption during the winter period (from 21 December 2025 to 21 February 2026) to the building floor area. The energy consumption of dormitory buildings primarily includes heating, lighting, and equipment. The total energy consumption of the building is denoted as E t o t a l (kW·h), and the building’s floor area is denoted as A (m2). The calculation formula is as follows:
E U I = E t o t a l A
Universal Thermal Climate Index (UTCI) is an indicator used to assess human thermal comfort in outdoor environments, considering four environmental parameters: air temperature ( T a ), mean radiant temperature ( T M R T ), relative humidity ( p v a p o u r ), and wind speed ( U w i n d ). It is evaluated using a ten-point scale, corresponding to physiological responses ranging from “extreme cold stress” to “extreme heat stress”. The calculation formula is as follows:
U T C I = T a + O f f s e t T a , T M R T , U w i n d , p v a p o u r

2.6.3. Optimization Parameter Settings

Compared with traditional optimization tools, such as Galapagos, Wallacei is capable of handling multiple conflicting objectives. Built upon the NSGA-II algorithm, it performs fast non-dominated sorting with an elitist strategy and crowding distance calculation, enabling efficient solutions to multi-objective optimization problems involving conflicting objectives. Therefore, this study employs the Wallacei plugin, which is specifically developed for the Grasshopper platform, to implement the NSGA-II genetic algorithm for investigating the effects of building morphology and layout on building performance. The detailed optimization parameters used in Wallacei are presented in Table 5.

3. Results

3.1. Multi-Objective Optimization Results

The multi-objective optimization process in this study was conducted using the Wallacei plugin on the Grasshopper platform, executed on a computer configured with a Windows 11 operating system, an RTX 4060 Ti graphics card, an Intel(R) Core(TM) i7-13700F processor (16 cores, 2.10 GHz), and 32 GB of memory. The Generation size was set to 60, and the Generation count was set to 50, resulting in a total of 3000 iterations of multi-objective optimization, which took 105 h to complete. During the simulation, parameters such as the crossover rate were not modified [42]. After removing duplicate solutions, a total of 24 Pareto solutions were obtained.

3.1.1. Convergence Analysis

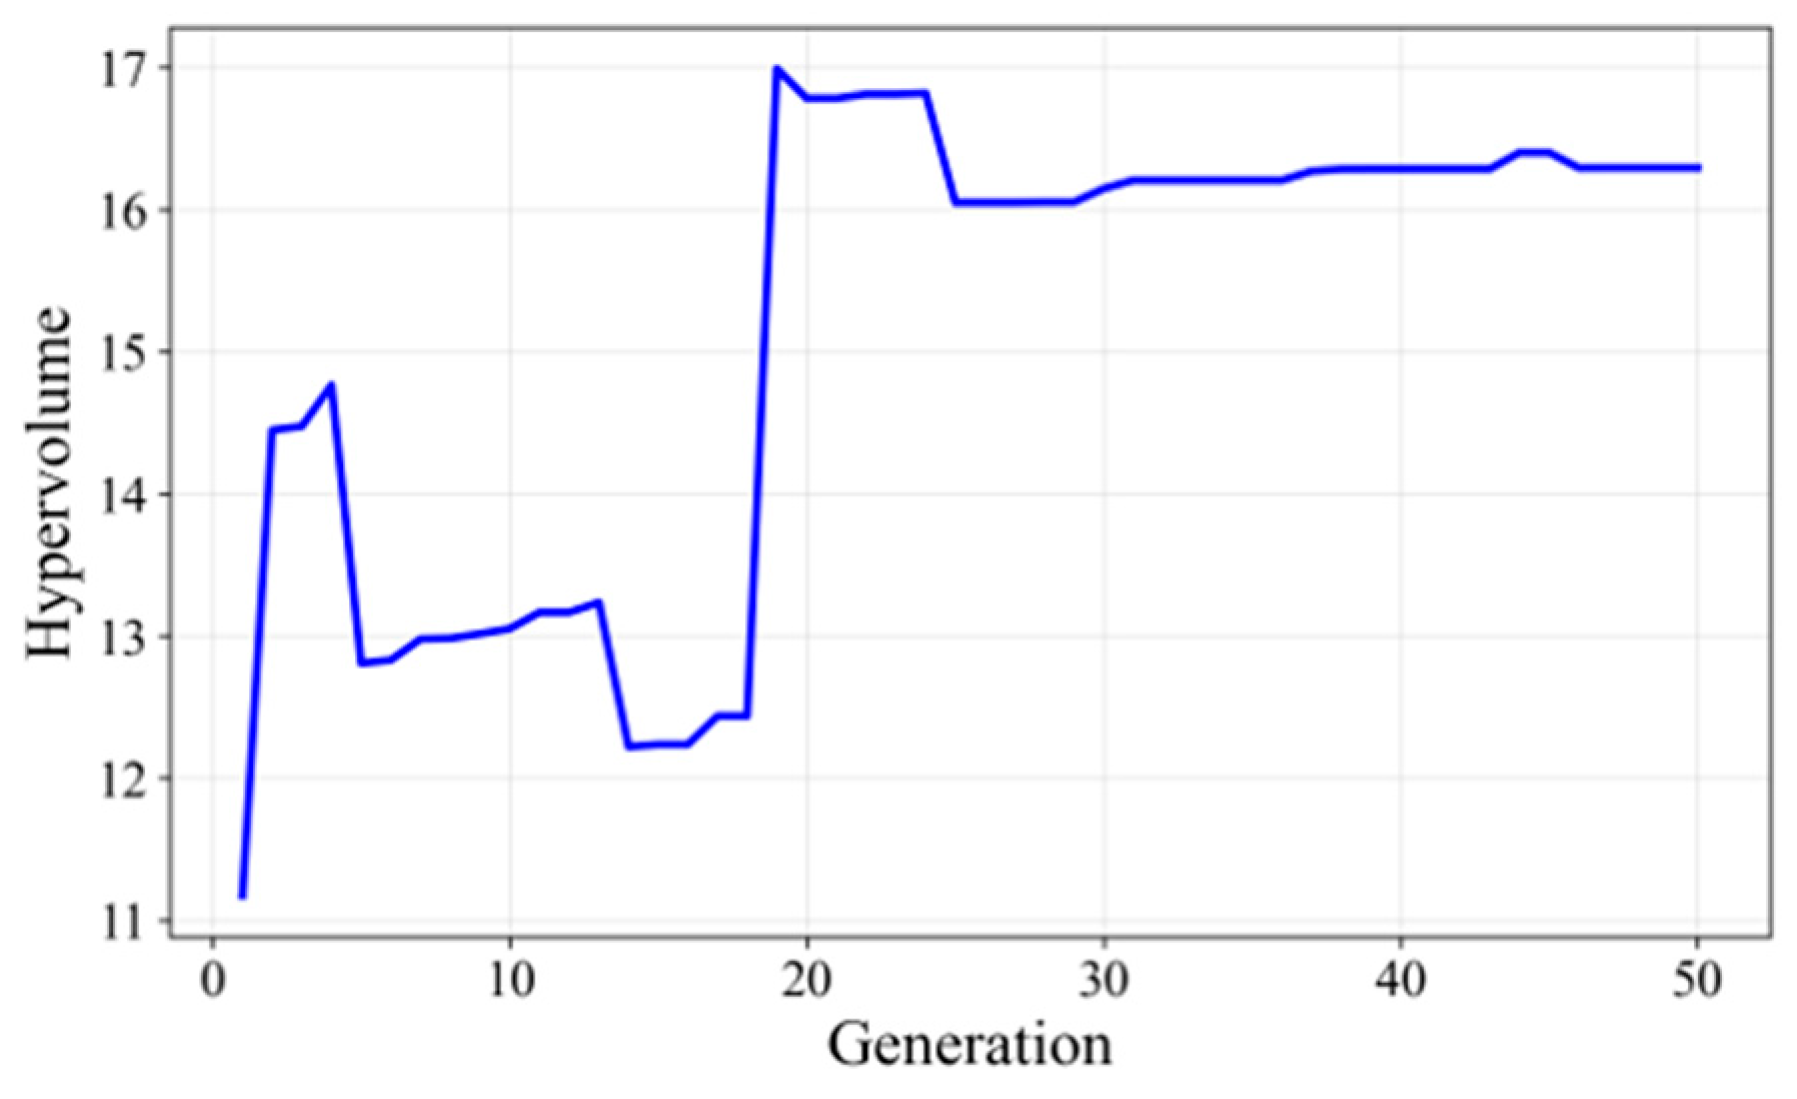
To evaluate the convergence of the Pareto solutions, a hypervolume (HV) indicator was calculated once for the multi-objective optimization results. A larger HV value indicates better convergence and diversity of the Pareto front. Since HV calculation requires minimization objectives, the negative value of UTCI was used for objective transformation. The objective values were shifted according to the minimum values of the Pareto solutions in each generation, and the reference point was dynamically determined based on the maximum values in the shifted objective space. As shown in Figure 4, the HV value increased rapidly during generations 1–2, indicating extensive exploration by the algorithm in the early stage. Subsequently, slight fluctuations occurred, and the HV value gradually stabilized after the 35th generation (HV = 16.21). The HV value reached 16.29 at the 50th generation, with an increase of only 0.49% between generations 35 and 50, which was lower than the 1% empirical convergence criterion adopted in this study, indicating that the optimization process had approached a stable state. These results demonstrate that the NSGA-II algorithm obtained a relatively stable Pareto front after 3000 simulations.

3.1.2. Data Distribution Characteristics of the Pareto Front

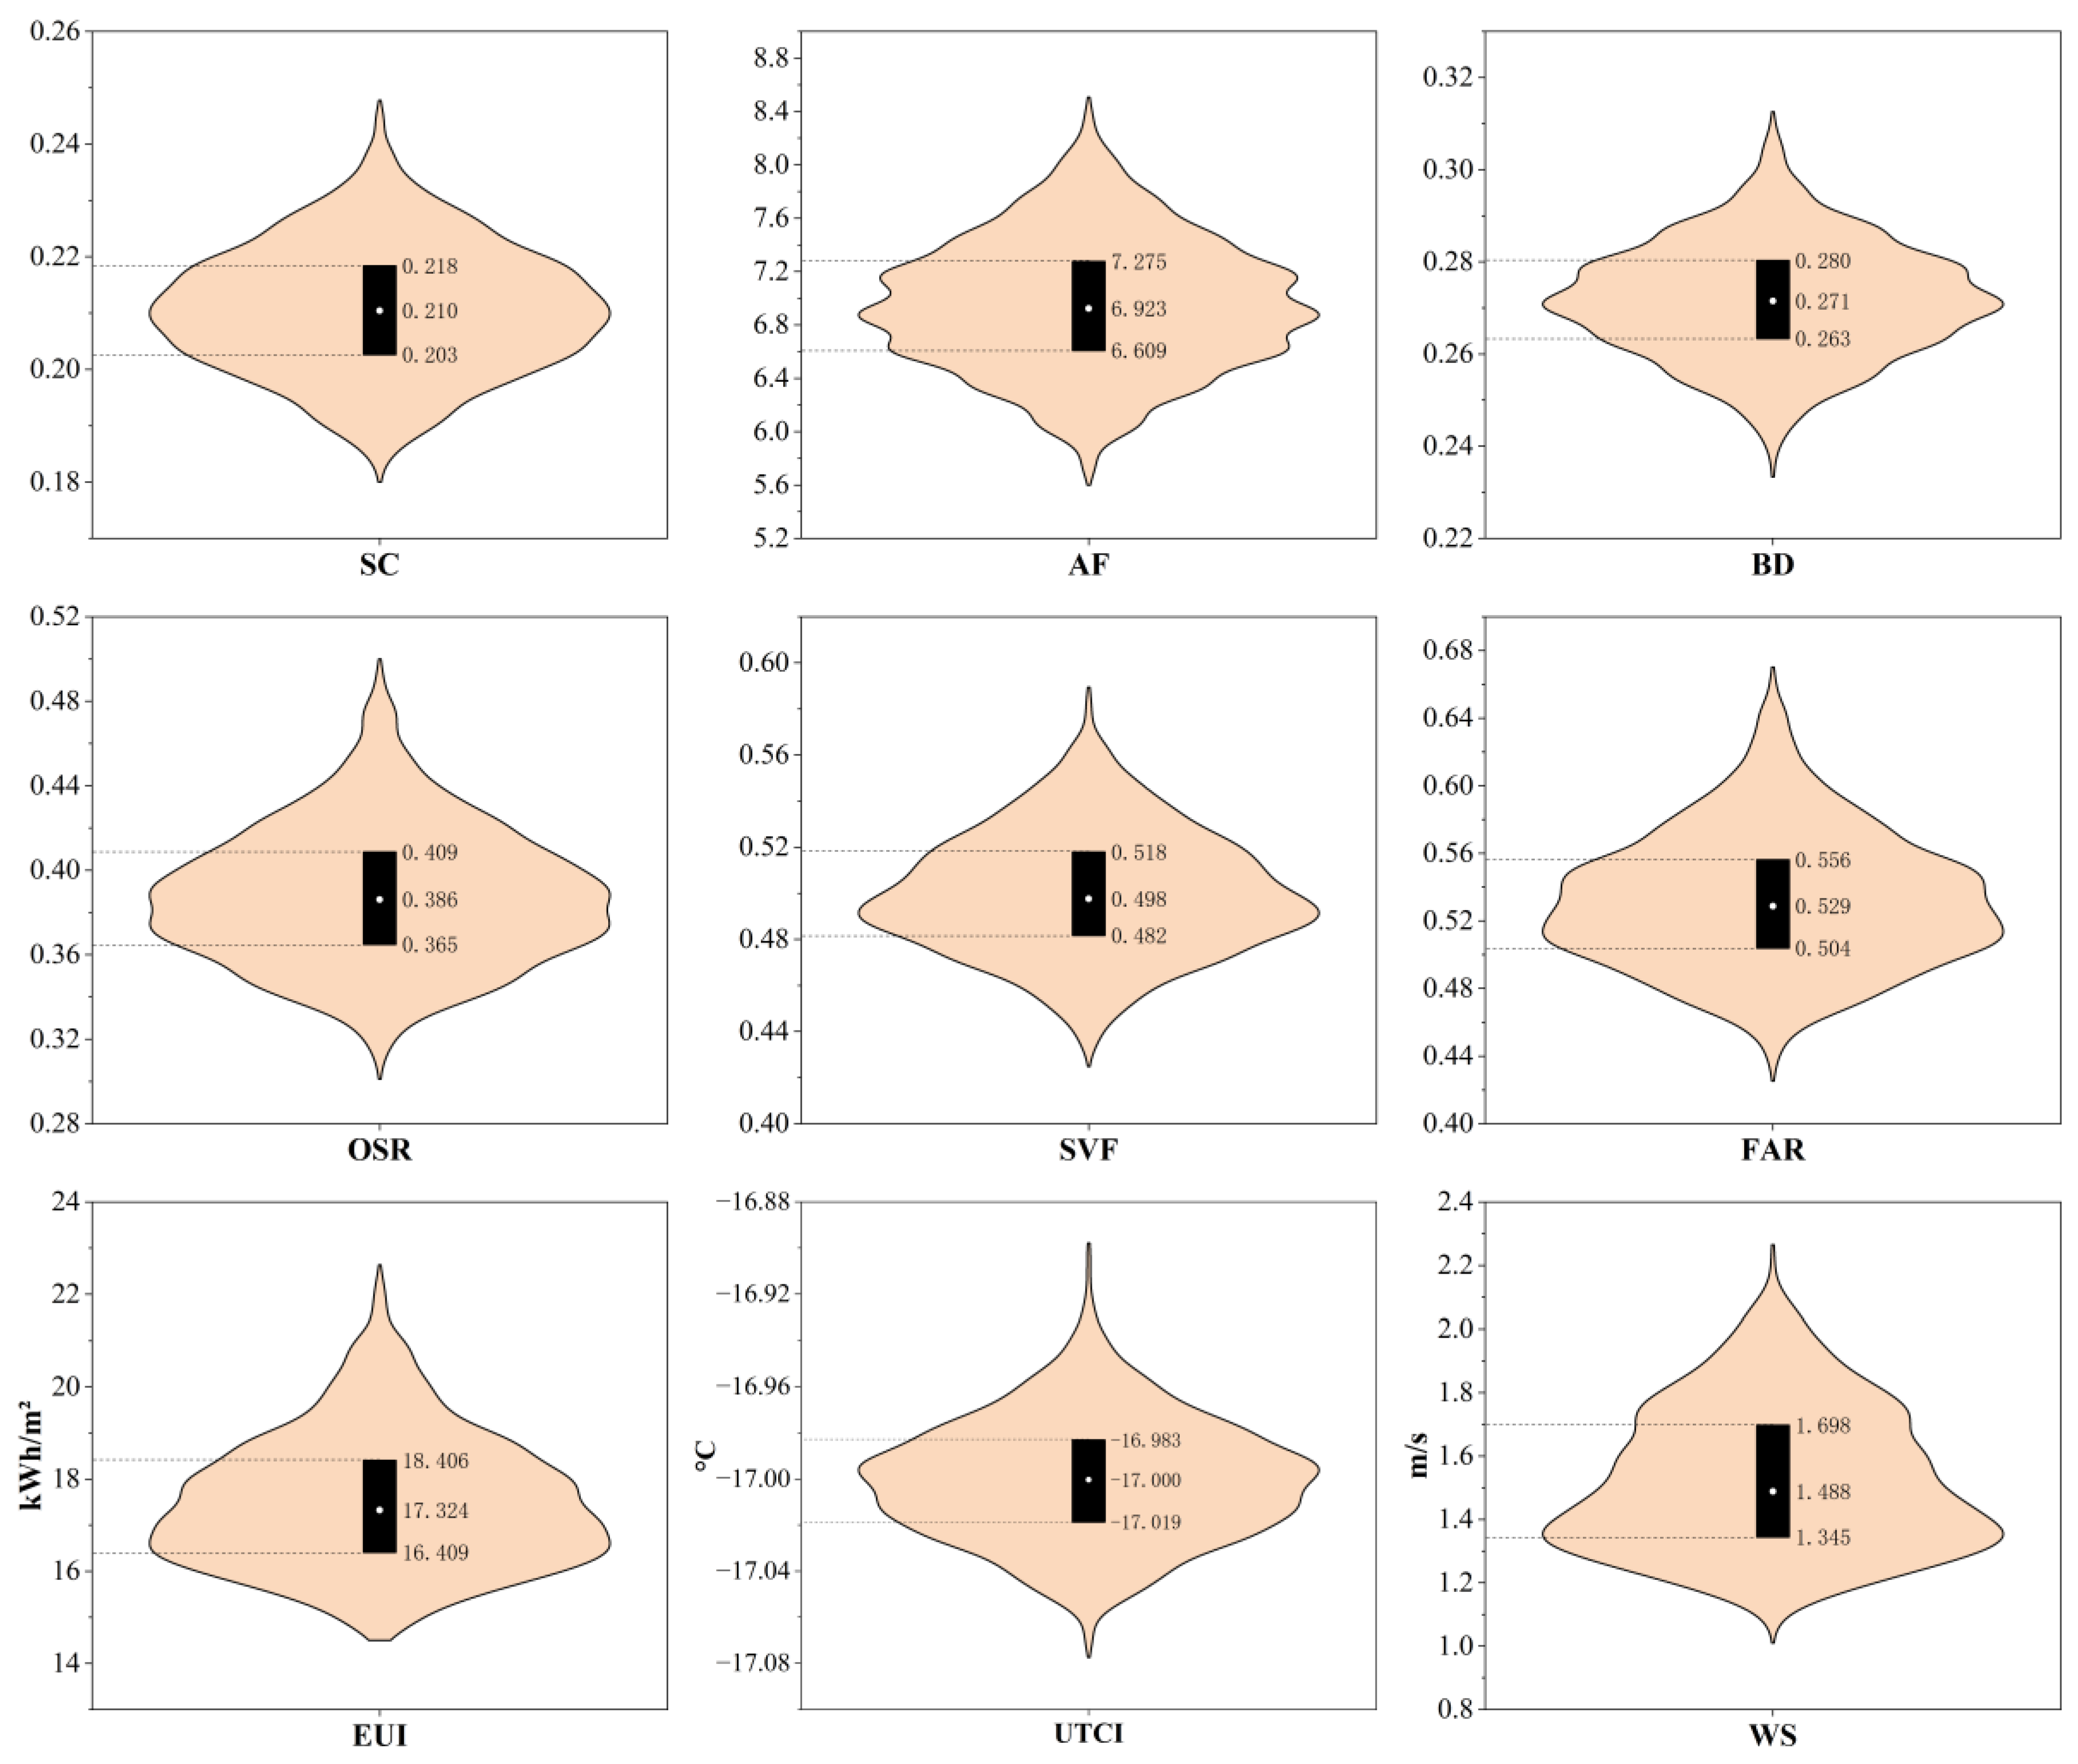
The results of the three optimization objectives and the distribution of design process variables from 3000 simulations are shown in Figure 5. As seen in the figure, the energy use intensity (EUI) is distributed between 14–23 (kWh/m2), with the majority concentrated between 16.409–18.406 (kWh/m2), indicating a broad distribution range and high optimization potential. The Universal Thermal Climate Index (UTCI) is distributed between −17.08 °C and −16.88 °C, with a concentration primarily between −17.019 °C and −16.983 °C. The median value is −17.000 °C. The UTCI variation range is relatively narrow (approximately 0.2 °C), which may be attributed to the dominant influence of meteorological boundary conditions under low-temperature winter conditions in cold regions. The wind speed (WS) is distributed between 1.0–2.3 (m/s), with the majority concentrated between 1.344–1.698 (m/s). The wide interquartile range indicates that wind speed is significantly influenced by the other two objectives during the optimization process.
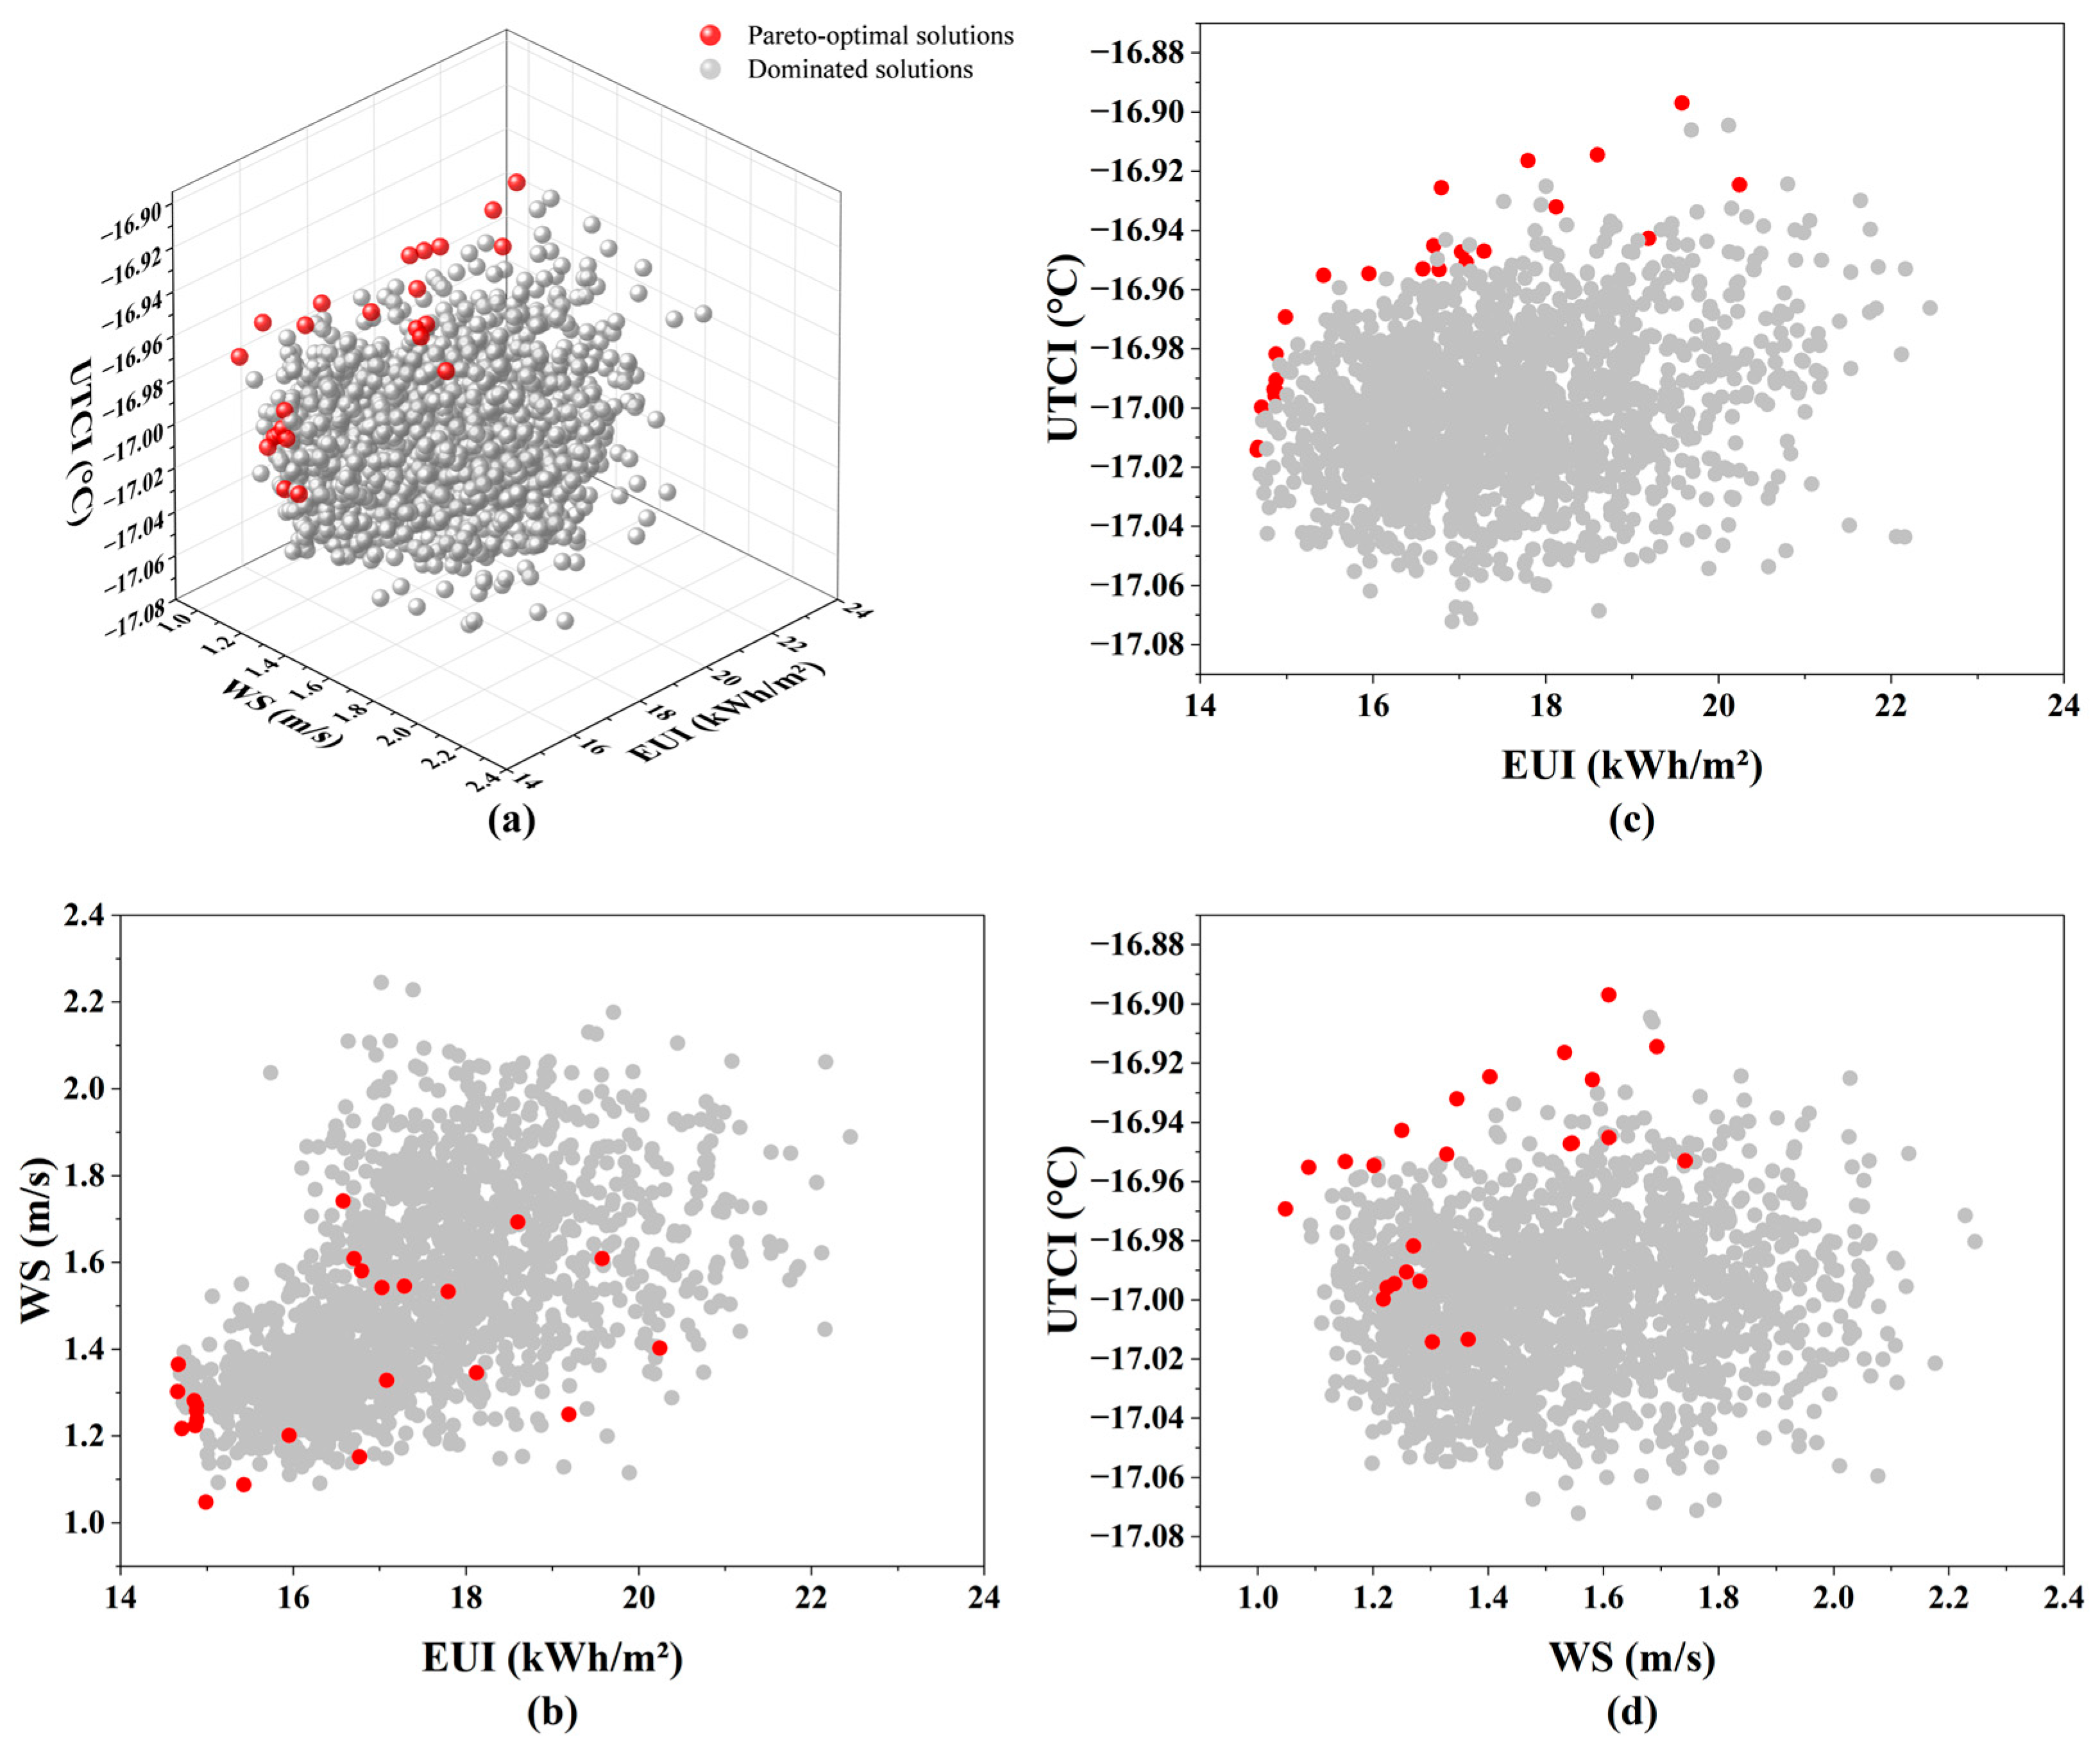
In this study, a total of 24 Pareto-optimal solutions were obtained from 3000 simulations. The three-dimensional scatter plot (Figure 6) illustrates the spatial distribution of Pareto-optimal solutions and feasible solutions, with the three axes corresponding to the optimization objectives of EUI, WS, and UTCI. Red points represent Pareto-optimal solutions, while gray points represent feasible solutions. As shown in the two-dimensional scatter plot in Figure 6b, the data points of WS and EUI are relatively scattered, indicating no significant correlation. In Figure 6c, UTCI and EUI exhibit a significant negative correlation, suggesting a trade-off between reducing building energy consumption and improving outdoor thermal comfort. Figure 6d further shows a weak negative correlation trend between UTCI and WS. The scatter plots above reveal that Pareto-optimal solutions are predominantly located at the frontier of the feasible solutions, confirming that feasible solutions are inferior to optimal solutions in at least one objective. This frontier also represents the theoretical boundary for dormitory performance optimization in this study.

3.1.3. Performance Comparison of Dominated Solutions and Pareto-Optimal Solutions

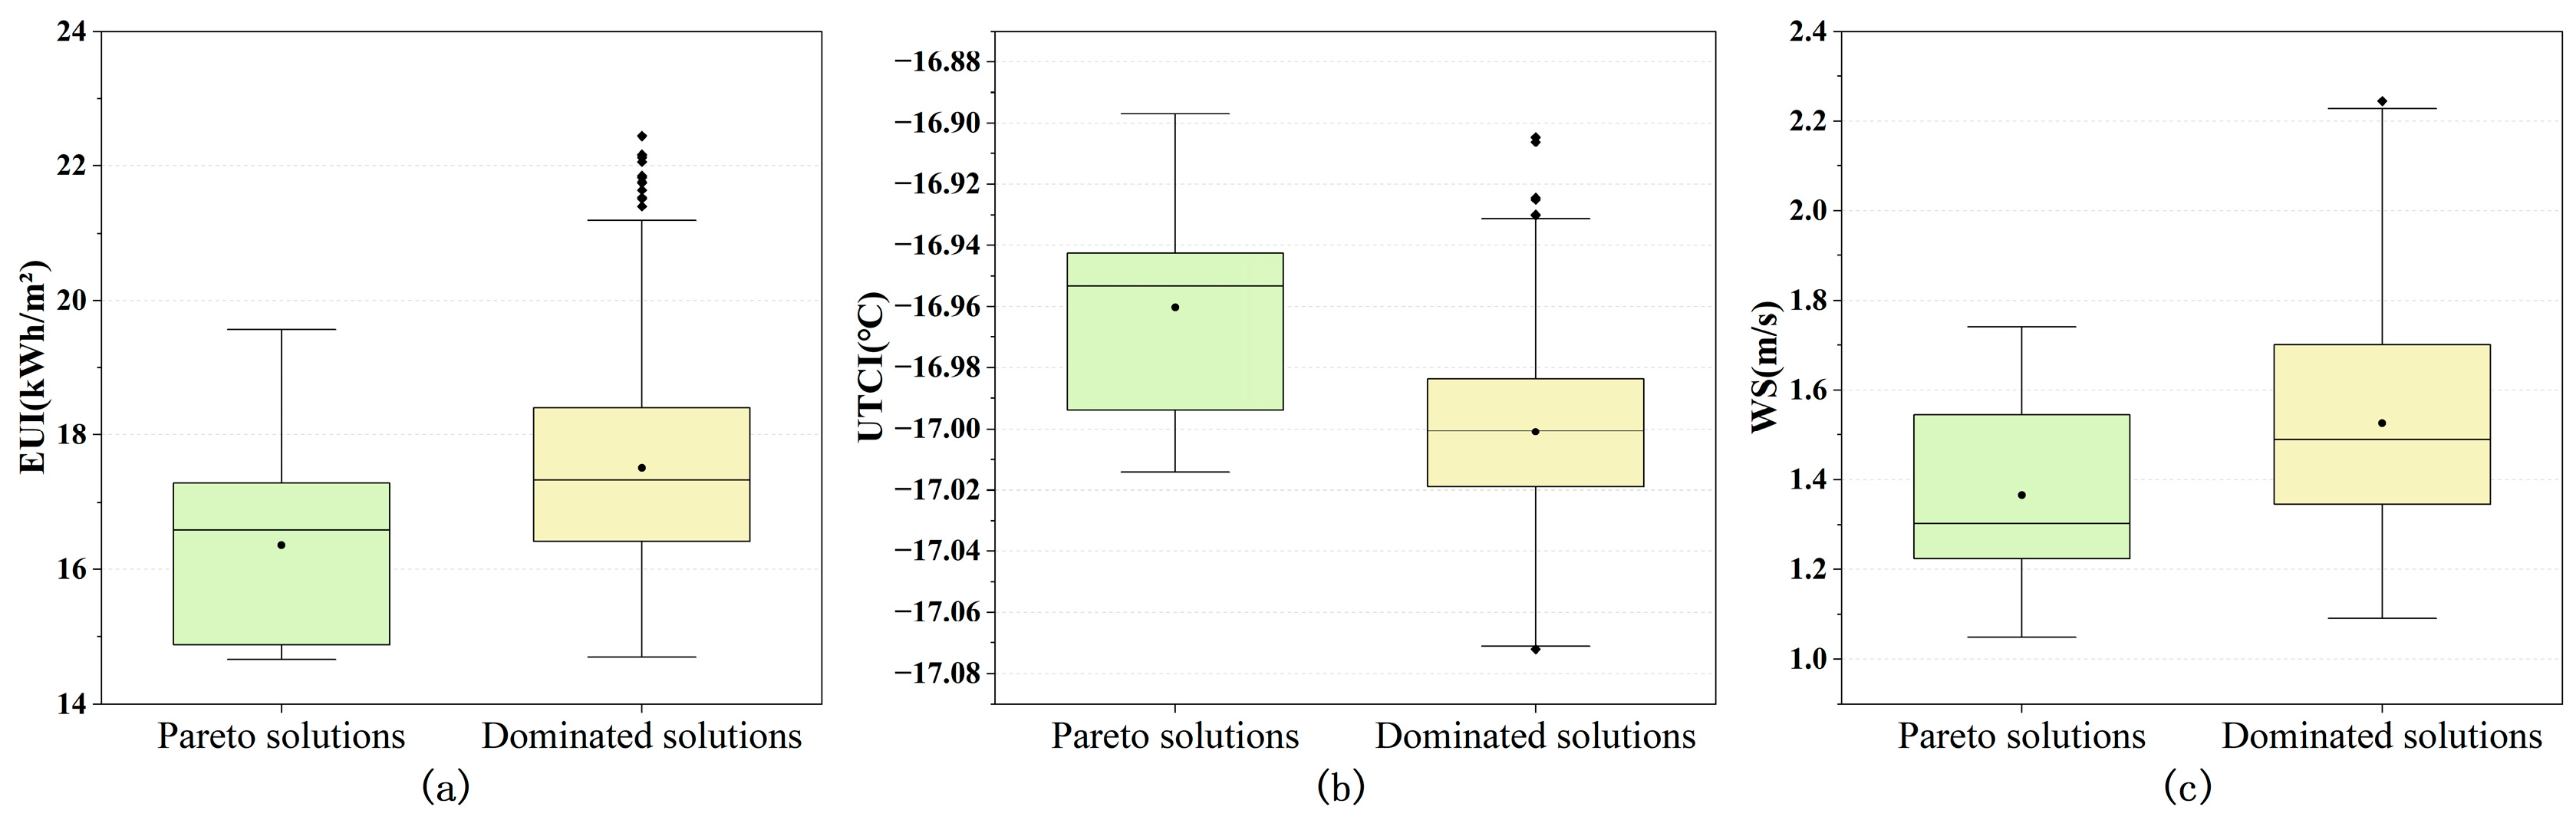
Figure 7 provides a comparative analysis of the spatial distribution characteristics of the dominated solutions and Pareto-optimal solutions for the three optimization objectives: EUI, WS, and UTCI. As shown in Figure 7a, the dominated solutions for EUI (kWh/m2) are mainly distributed between 14.70 and 21.19, with a median of 17.33 and an average value of 17.51, exhibiting a large number of outliers at the upper limit. In contrast, the Pareto-optimal solutions are distributed between 14.66 and 19.58, resulting in a more concentrated distribution. The median (16.58) and average (16.36) of the Pareto-optimal solutions are slightly lower than those of the dominated solutions, with an average reduction of approximately 6.57%, reflecting a more stable optimization result in terms of energy consumption. As shown in Figure 7b, the dominated solutions for UTCI (°C) are mainly distributed between −17.07 and −16.93, with the median and average values being nearly identical (−17.01). The Pareto-optimal solutions are mainly distributed between −17.01 and −16.90, with a median of −16.95 and an average value of −16.96. This indicates a relatively symmetrical distribution of UTCI values, with extreme values having limited impacts on the overall results. Moreover, UTCI remains relatively stable during the optimization process when balanced with other objectives. Compared with the dominated solutions, the Pareto-optimal solutions improve UTCI by 0.05 °C, which may be attributed to the existing constraints that result in UTCI values being concentrated within a relatively narrow range. Figure 7c presents the distribution of WS (m/s). The dominated solutions are mainly concentrated between 1.09 and 2.23, with a median of 1.49 and an average value of 1.53. In comparison, the Pareto-optimal solutions are distributed between 1.05 and 1.74, with both the median (1.30) and average value (1.37) showing improvements compared with the dominated solutions, achieving an approximately 10.46% reduction.
Overall, the dominated solutions exhibit a higher number of outliers, indicating a larger degree of dispersion and instability. In contrast, the Pareto solution set shows a smaller distribution range, demonstrating a more concentrated characteristic. Furthermore, the Pareto solution set presents lower median values for EUI, lower median values for WS, and higher median values for UTCI, which correspond to the optimization objectives of minimizing energy consumption and maximizing thermal comfort. This confirms that the Pareto solution set outperforms the dominated solution set in optimizing these two objectives.

3.2. Pareto Optimal Solution

3.2.1. The Morphological Variation Trend of Pareto-Optimal Solutions

A total of 3000 solutions were generated in this study. After removing duplicates based on the influencing factors, 1738 solutions remained, including 24 Pareto-optimal solutions. The distribution of the Pareto-optimal solutions is as follows: WS (m/s) ranges from 1.048 to 1.742, building energy use intensity (EUI) ranges from 14.659 to 20.243, and UTCI (°C) ranges from −17.014 to −16.897. For the 24 Pareto-optimal solutions, Table 6 is presented, which includes the morphological layout and corresponding values of the three optimization objectives for each solution. As shown in Table 6, the multi-objective optimization algorithm initially explores a wide range of possible solutions, with Pareto solutions occurring less frequently, displaying diverse building types. Among these, Solution 24 has the highest WS value of 1.742, representing the maximum wind speed in the Pareto set, while Solution 284 has the highest EUI value of 20.243, representing the maximum energy consumption. This highlights the instability during the early stages of optimization. As the number of iterations increases, the frequency of Pareto solutions gradually increases. In terms of building morphology, the later-stage solutions tend to favor lower-rise building types, with enclosed buildings and detached buildings occurring more frequently, while row-type buildings appear less frequently. This confirms the significant correlation between spatial morphological parameters and building performance, which is consistent with the conclusions drawn by Qin et al. regarding multi-objective optimization of residential buildings in cold regions [43].
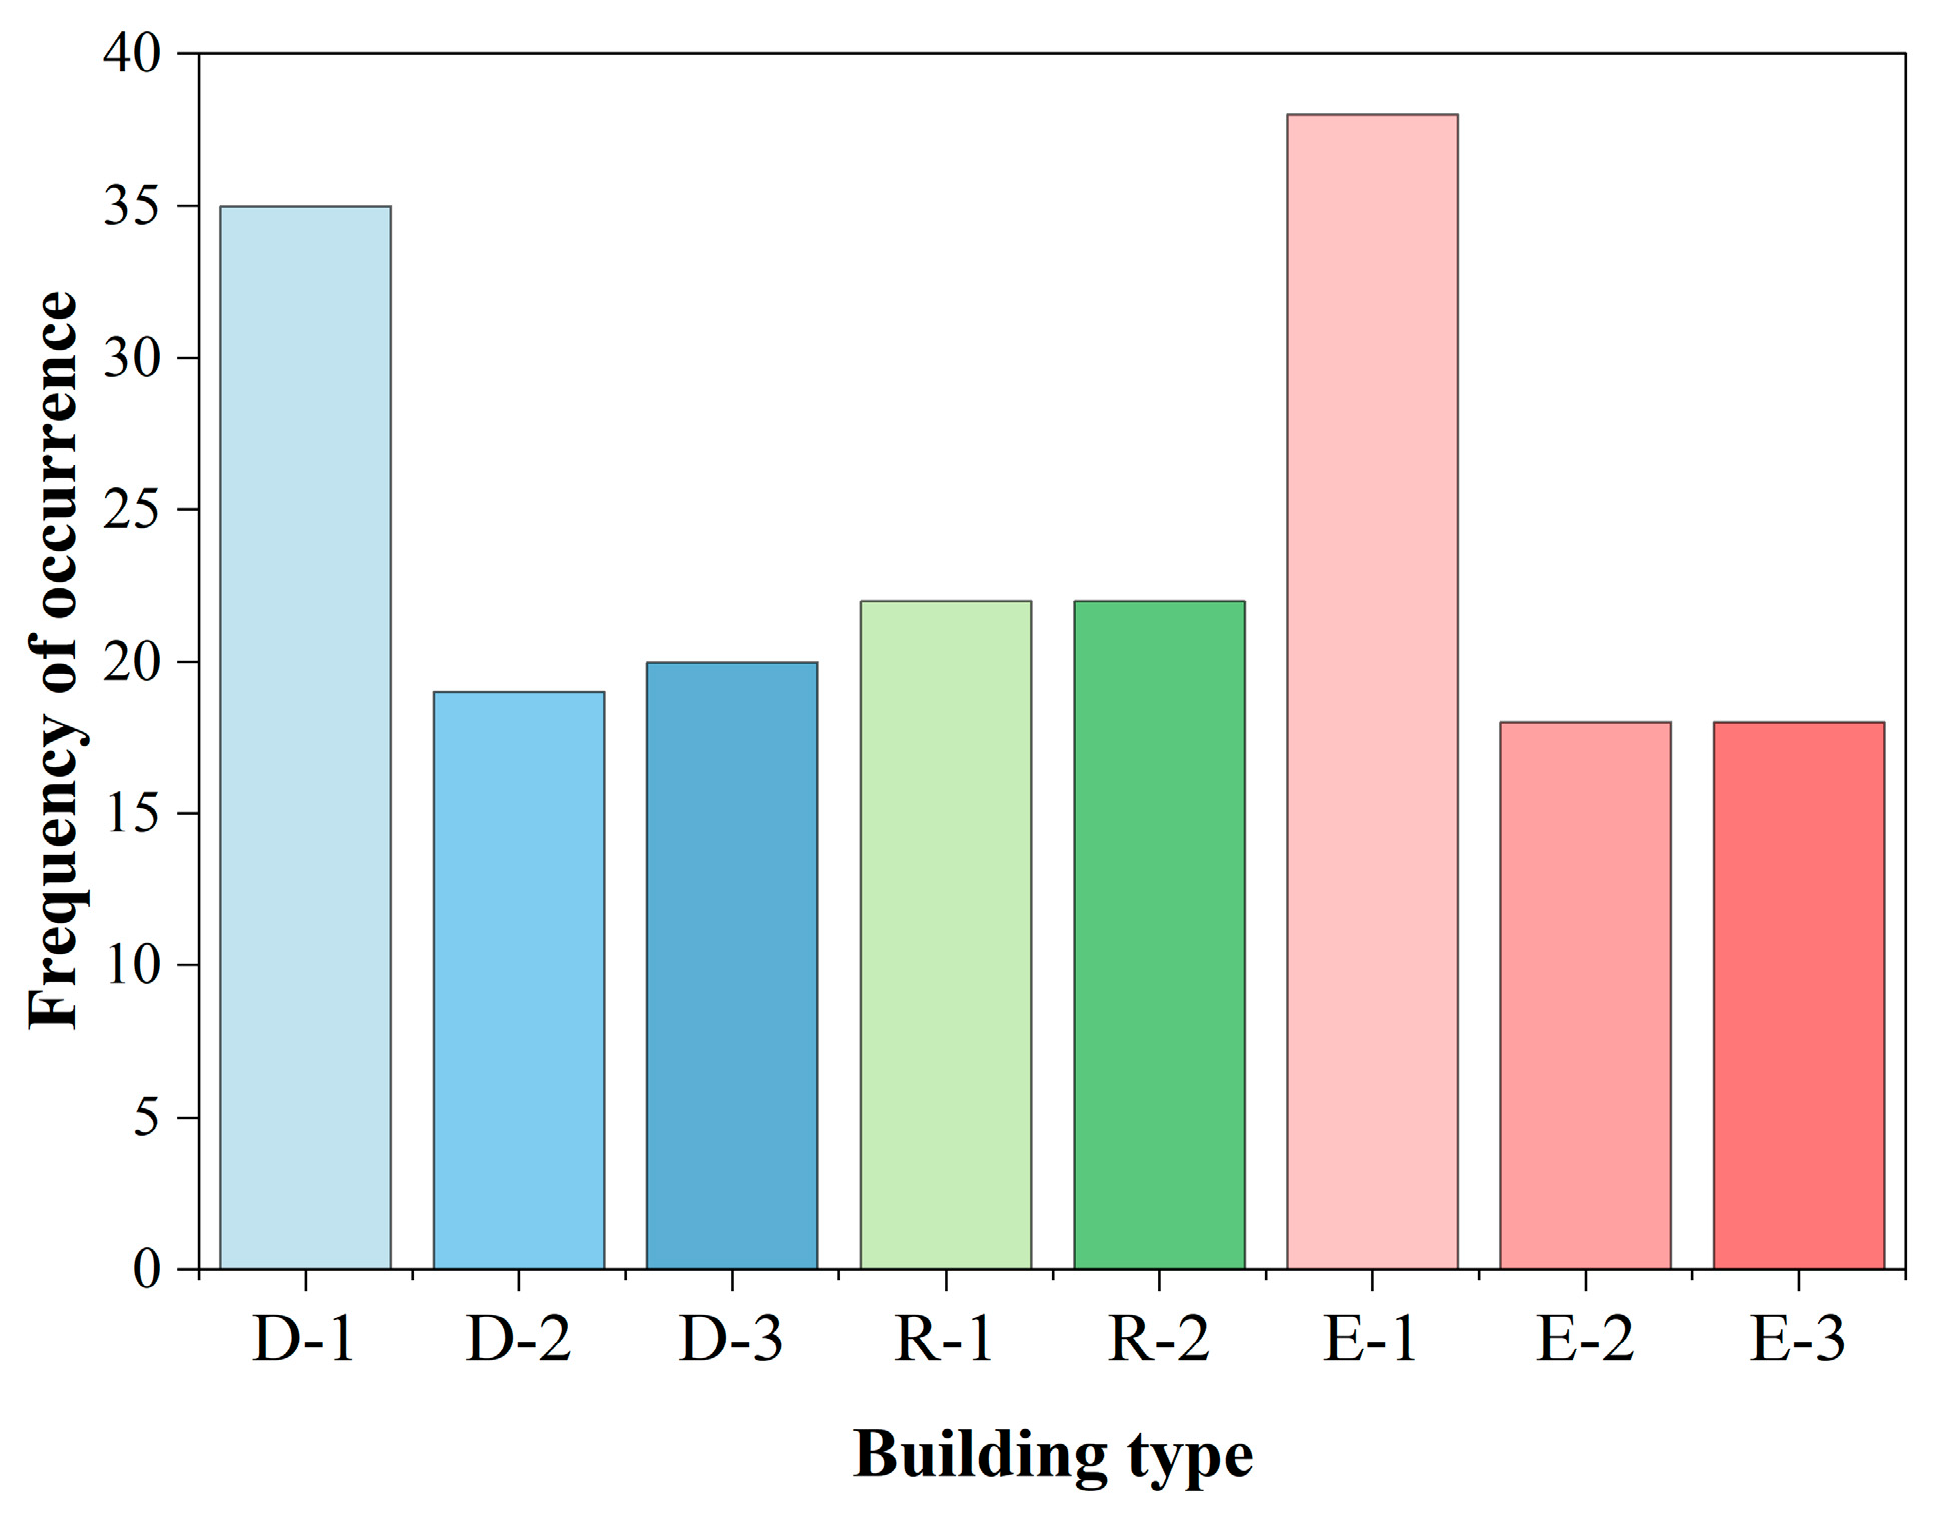
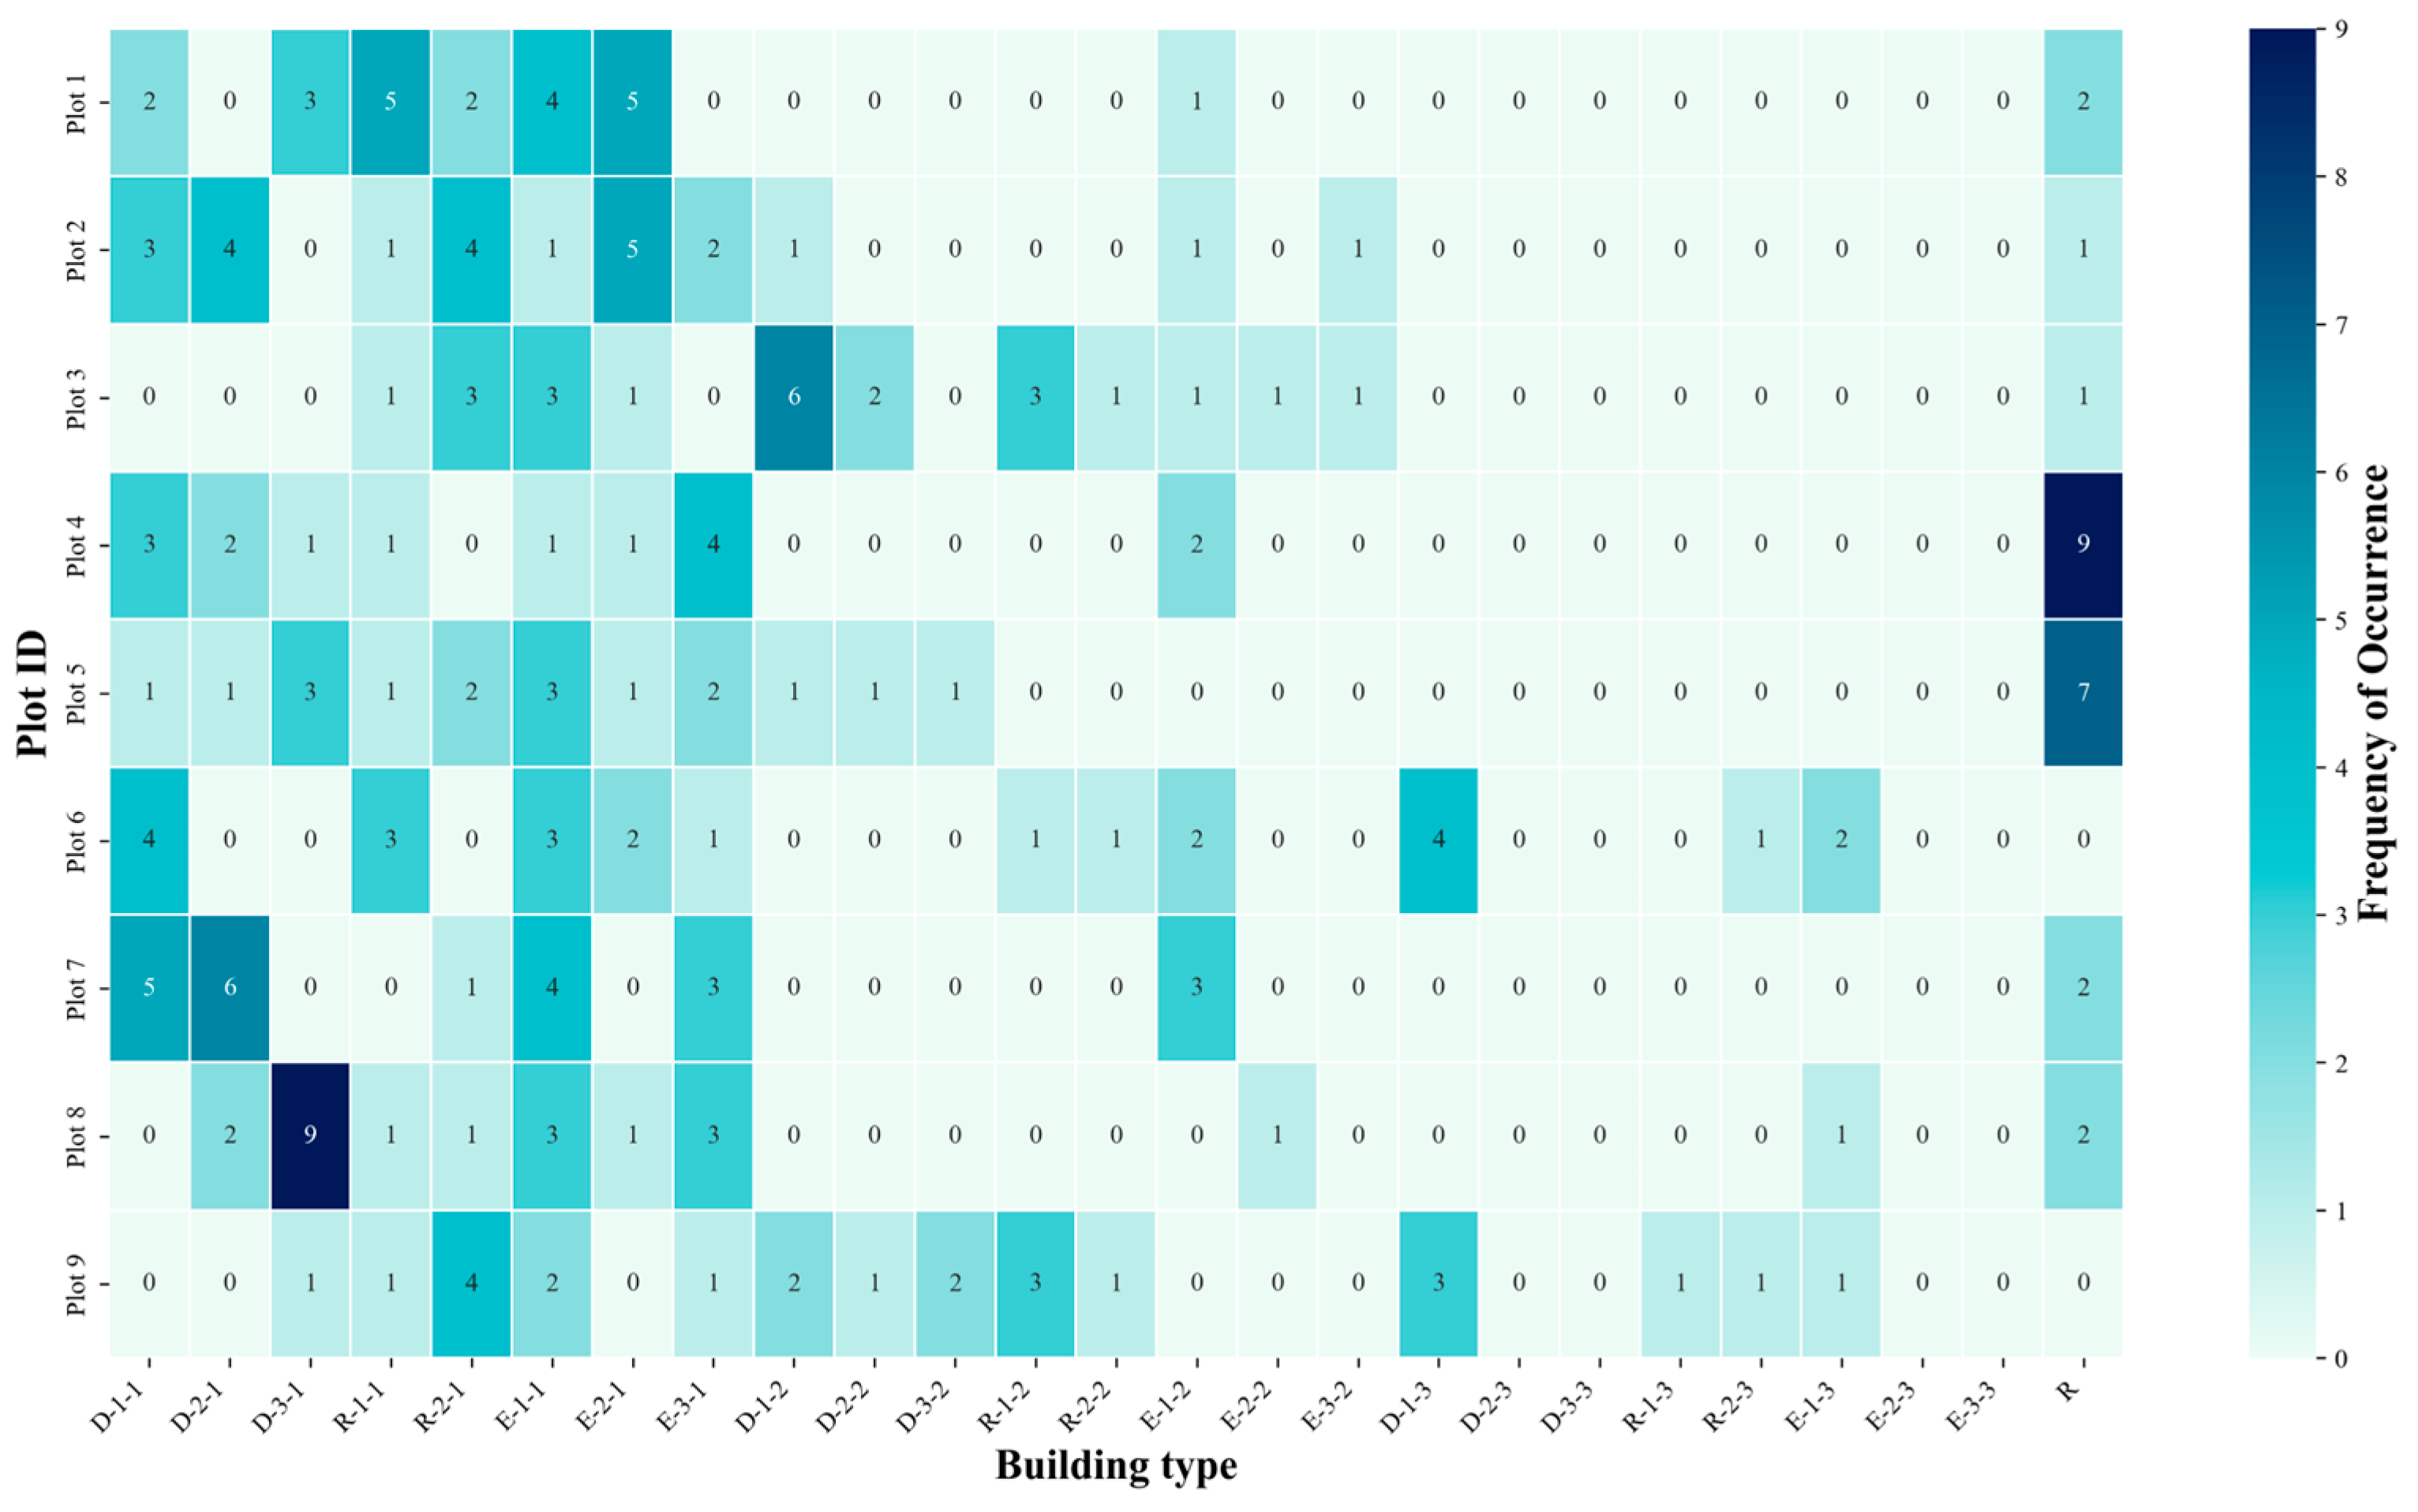
In terms of building types, Figure 8 presents the frequency of occurrence of the eight major building types across the nine plots (Plot 1-Plot 9). Figure 9 illustrates the correlation between the 24 dormitory prototypes and the public building (canteen R) in the Pareto-optimal solutions across the nine plots. As shown in Table 6 and Figure 8, among the 24 solutions, enclosed and detached buildings appeared 74 times each, accounting for 34.26%, respectively, while row-type buildings appeared less frequently, with 44 occurrences (20.37%). Among all building types, E-1 exhibited the highest occurrence frequency, appearing 38 times and being included in all solutions. In particular, the 284th generation (WS = 1.403, UTCI = −16.925) and the 1195th generation (WS = 1.250, UTCI = −16.943) both contained three E-1 prototypes with low, medium, and high FAR values (E-1-1, E-1-2, and E-1-3). Their wind speeds were within the lower-to-middle range of the WS Pareto solutions (1.05–1.74 m/s), and their UTCI values were also higher than the average value of −16.96. Therefore, it is suggested that semi-enclosed building configurations may help shield prevailing northwestern winds and create lower wind-speed outdoor spaces within internal courtyards, thereby improving winter outdoor thermal comfort. However, in plots with a higher occurrence of E-1 buildings, the EUI value tends to be higher, particularly in generations 284 and 1195, with values of 20.243 and 19.19, respectively. This could be attributed to the larger facade area of this building type, and in cold climates during winter, building heat loss is a primary factor influencing EUI, leading to a higher EUI value for the plots. Furthermore, as shown in Figure 9, the correlation of E-1 type buildings with the nine plots is relatively balanced, indicating its general applicability to winter climates in cold regions. In addition, the D-1 type building also appears frequently. According to Figure 8, the D-1 type appears 35 times in total, and in all Pareto-optimal solutions, except for the solution from generation 930, D-1 type buildings appear at least once. Moreover, in generations 456, 715, and 1462, all three variations of D-1 (D-1-1, D-1-2, D-1-3) appear together. Figure 9 also indicates that Plot 3 has the highest correlation with D-1-2 (6 times), and in Plot 6, D-1-1 and D-1-3 are most correlated (4 times). This may be due to the dominance of northwest winds during the winter in cold regions. Additionally, Figure 9 reveals that Plot 8 has a high correlation with D-3-1 (9 times), forming a significant hotspot. This could be because the building layout along the northwest-southeast axis with central symmetry is well-suited for placement in central areas.
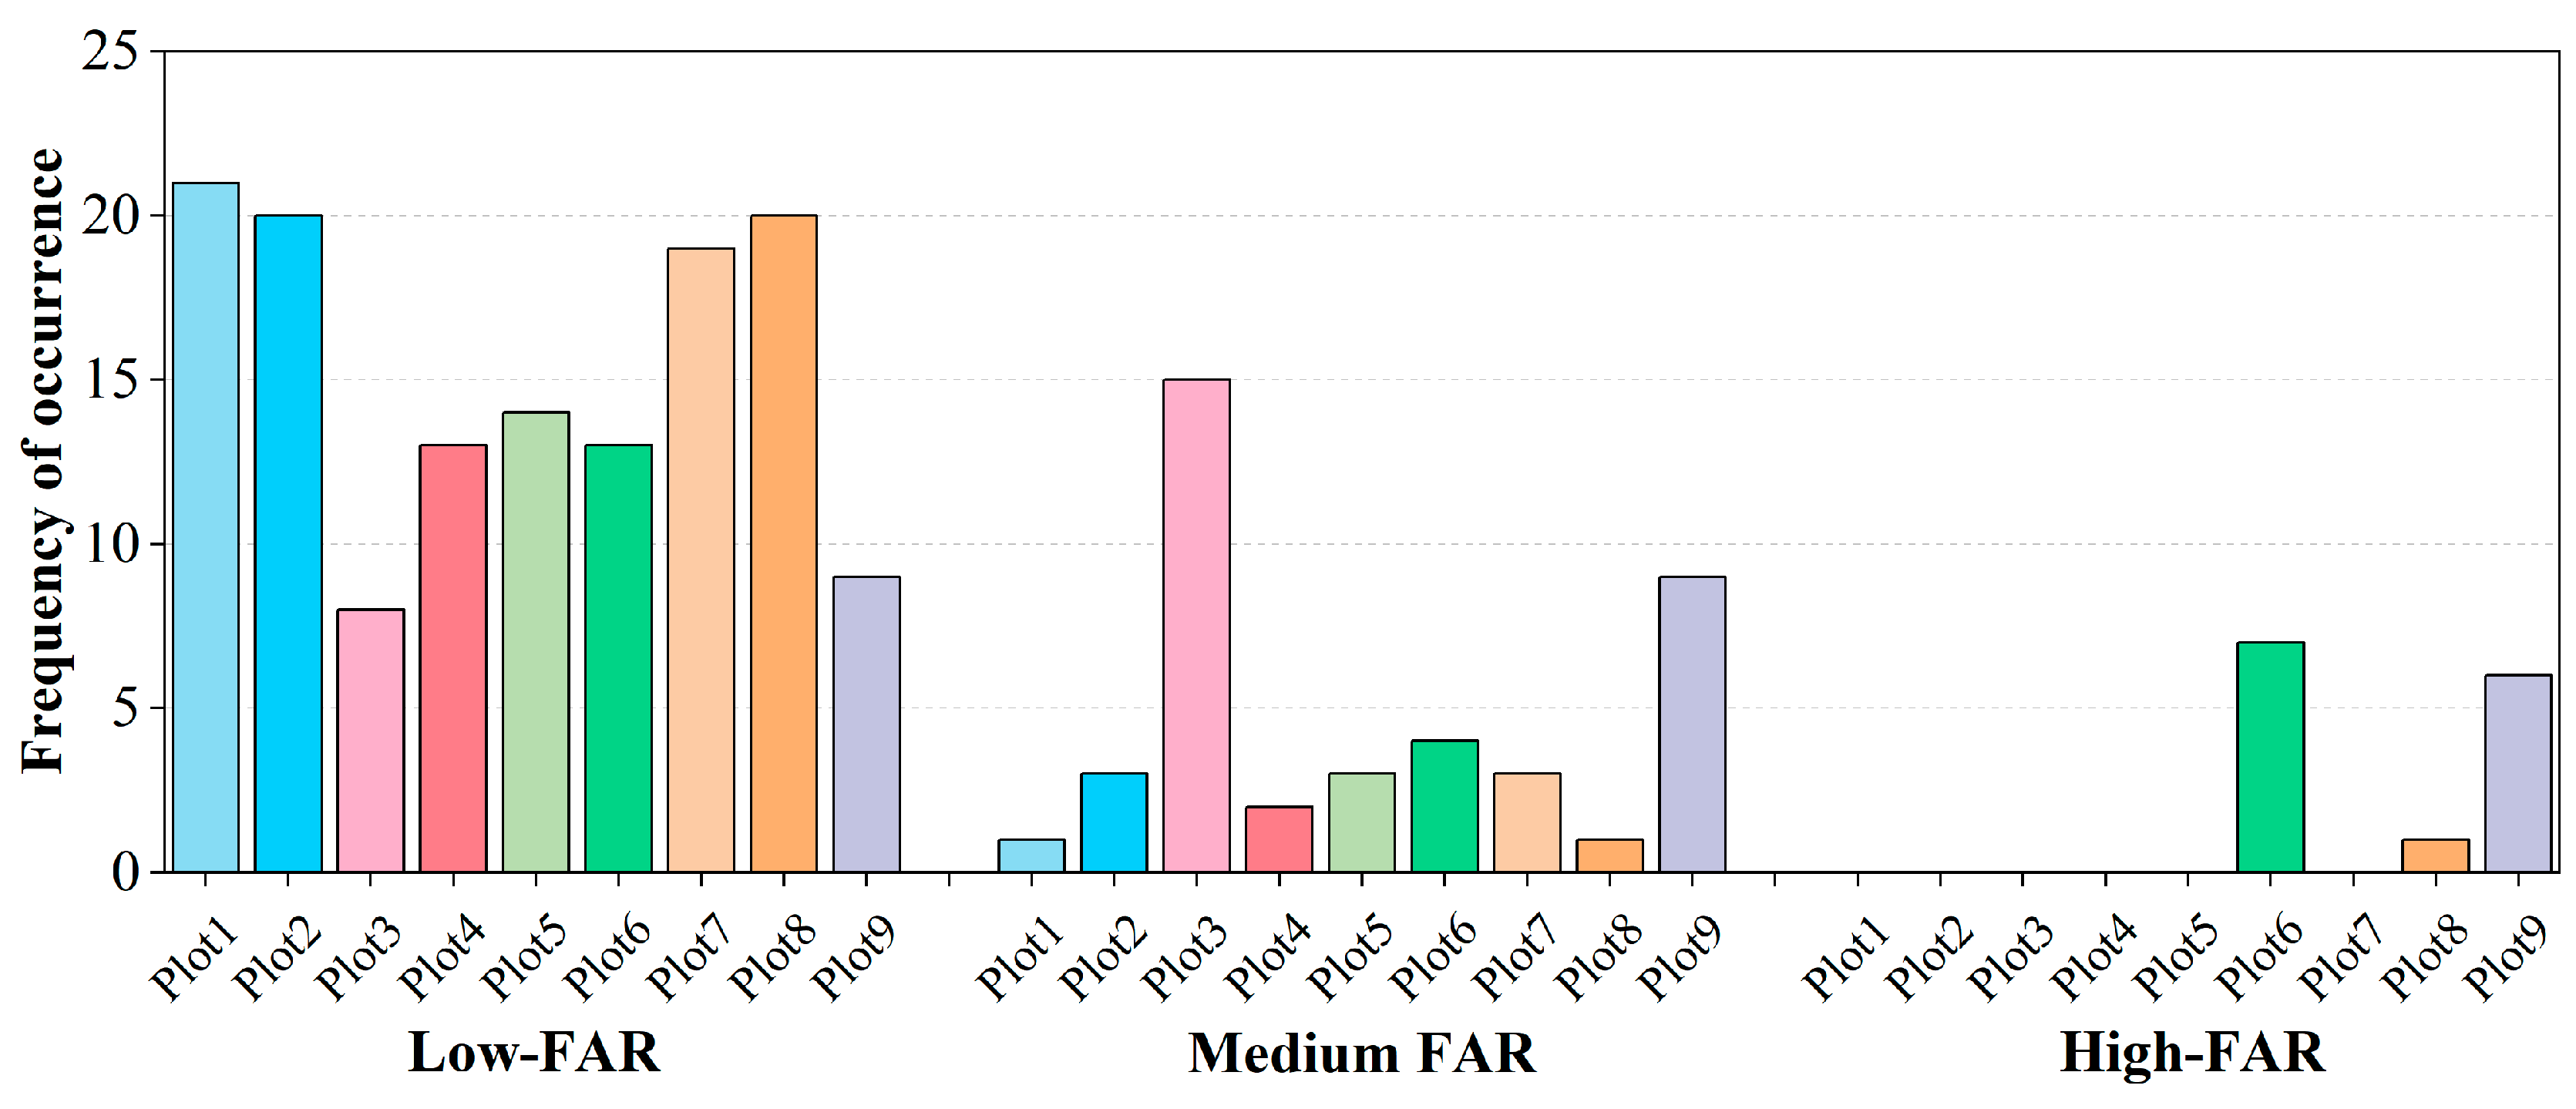
It is noteworthy that the Pareto-optimal solutions exhibit certain regularities in building layout. Figure 10 illustrates the frequency of low, medium, and high building densities across the nine plots (Plot 1–Plot 9). High-density buildings (from D-1-3 to E-3-3) appear less frequently in the Pareto solutions, with a total of 14 occurrences, mostly located in the northeastern part of the site, particularly in Plot 6 and Plot 9, which feature 7 and 6 occurrences, respectively. Medium-density buildings (from D-1-2 to E-3-2) appear 41 times, mostly in the northern part of the site, with the highest frequency of 15 occurrences in Plot 3, followed by 9 occurrences in Plot 9. Low-density buildings (from D-1-1 to E-3-1) are the most frequent, appearing 137 times, with the majority located in the southern part of the site. Plot 1 has the highest number of occurrences, with 21 instances, followed by Plot 2 with 20, while Plot 7 and Plot 8 contain 19 and 20 occurrences, respectively. Additionally, Figure 9 shows that public buildings (canteen R) are mostly located in the central-southern part of the site, particularly in Plot 4 and Plot 5, with 9 and 7 occurrences, respectively. This building layout ensures good sunlight exposure on the site, which is beneficial for improving the thermal environment in winter and enhancing outdoor comfort. This finding aligns with conclusions drawn by Zhang et al. [44] and Liu et al. [45], who state that building layout plays a decisive role in winter thermal conditions.

3.2.2. Clustering Analysis of Pareto-Optimal Solutions

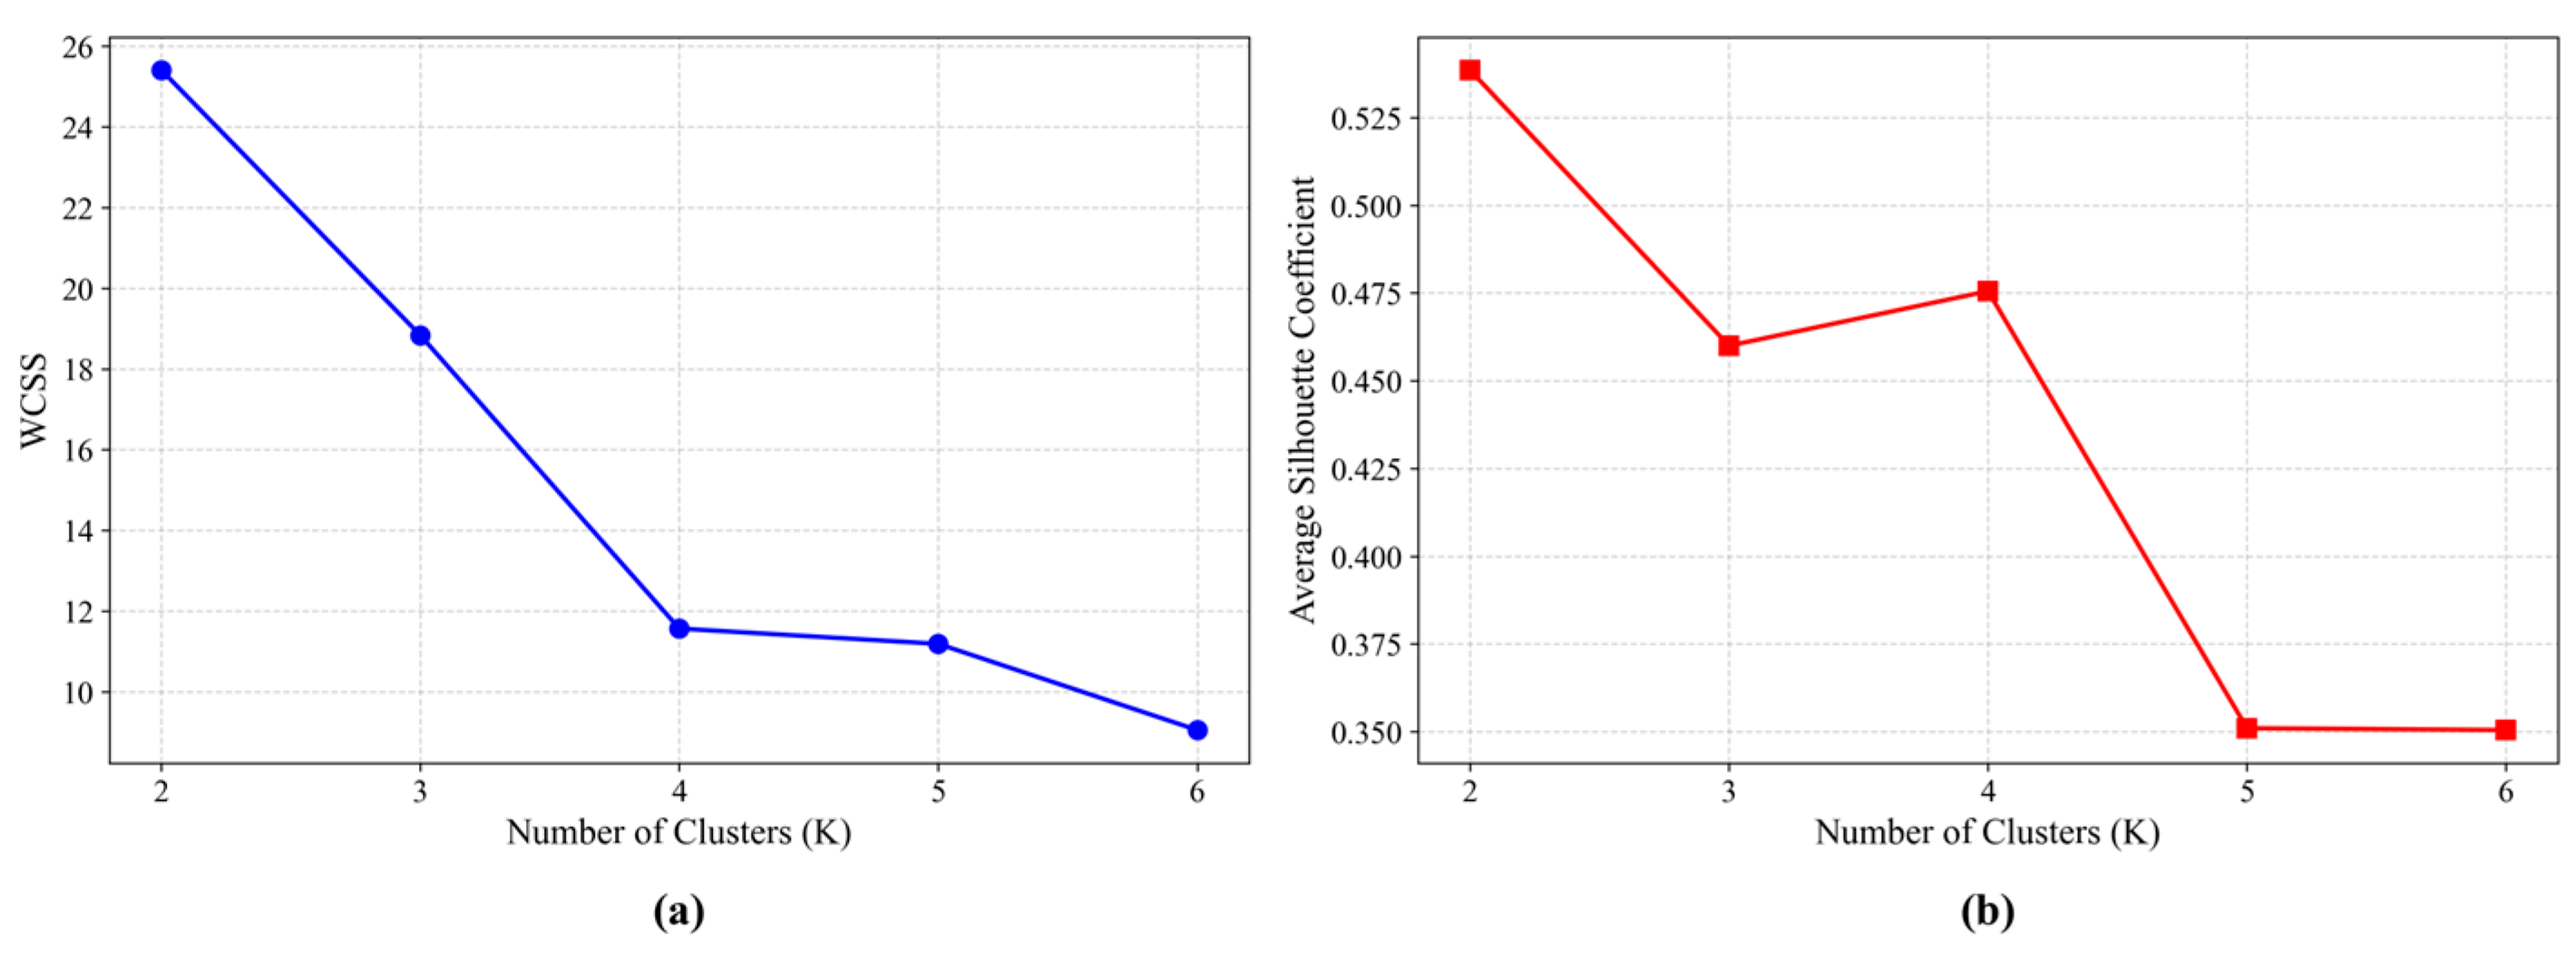
During the planning and design phase, it is often necessary to make trade-offs between multiple factors. Although multi-objective optimization can filter out the Pareto solutions, significant variations exist between these solutions. Therefore, this study performs a clustering analysis of the Pareto solution set to extract the key performance aspects of each type. K-means clustering algorithm is applied to group the Pareto solutions. To enhance the reliability of the study, the clustering tightness is assessed using the elbow method and silhouette coefficient for different values of k . The elbow method analyzes the trend of the sum of squared errors within clusters as k varies and selects the inflection point as the reference for clustering. As shown in Figure 11a, the SSE continuously decreases with increasing numbers of clusters, while the decreasing trend becomes significantly slower after k = 4 , indicating that k = 4 represents the elbow point. The silhouette coefficient evaluates clustering performance by considering intra-cluster compactness and inter-cluster separation, with higher values indicating better compactness and separation. As shown in Figure 11b, although k = 2 achieves the highest silhouette coefficient, this number of clusters is insufficient to distinguish different performance combination characteristics among the Pareto solutions. Considering the elbow analysis results, silhouette coefficient evaluation, and the interpretability of extracting representative design solutions, k = 4 is determined as the number of clusters. Subsequently, the K-means algorithm is repeatedly performed with 10 different random seeds, and the Adjusted Rand Index (ARI) is used to evaluate clustering stability. The average ARI value is 0.963, indicating high stability of the clustering results.
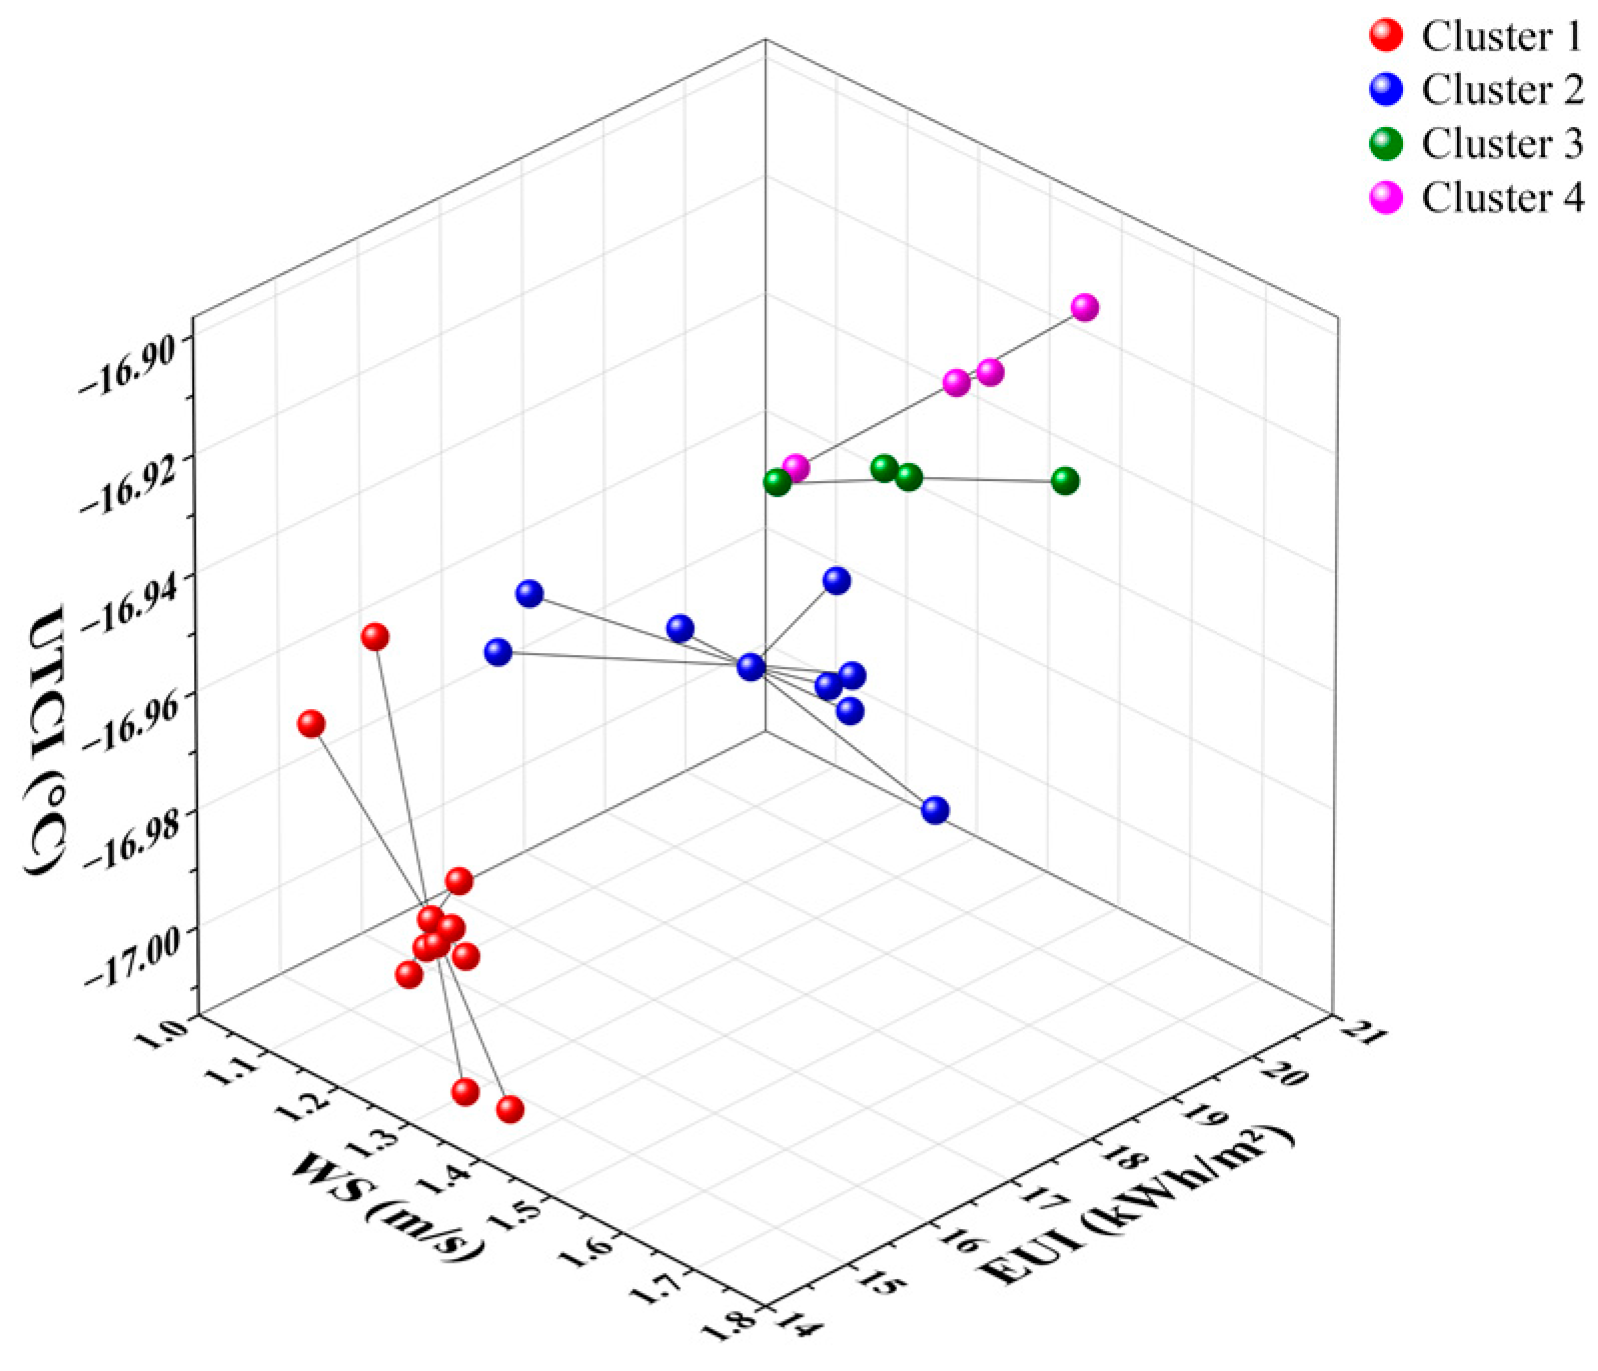
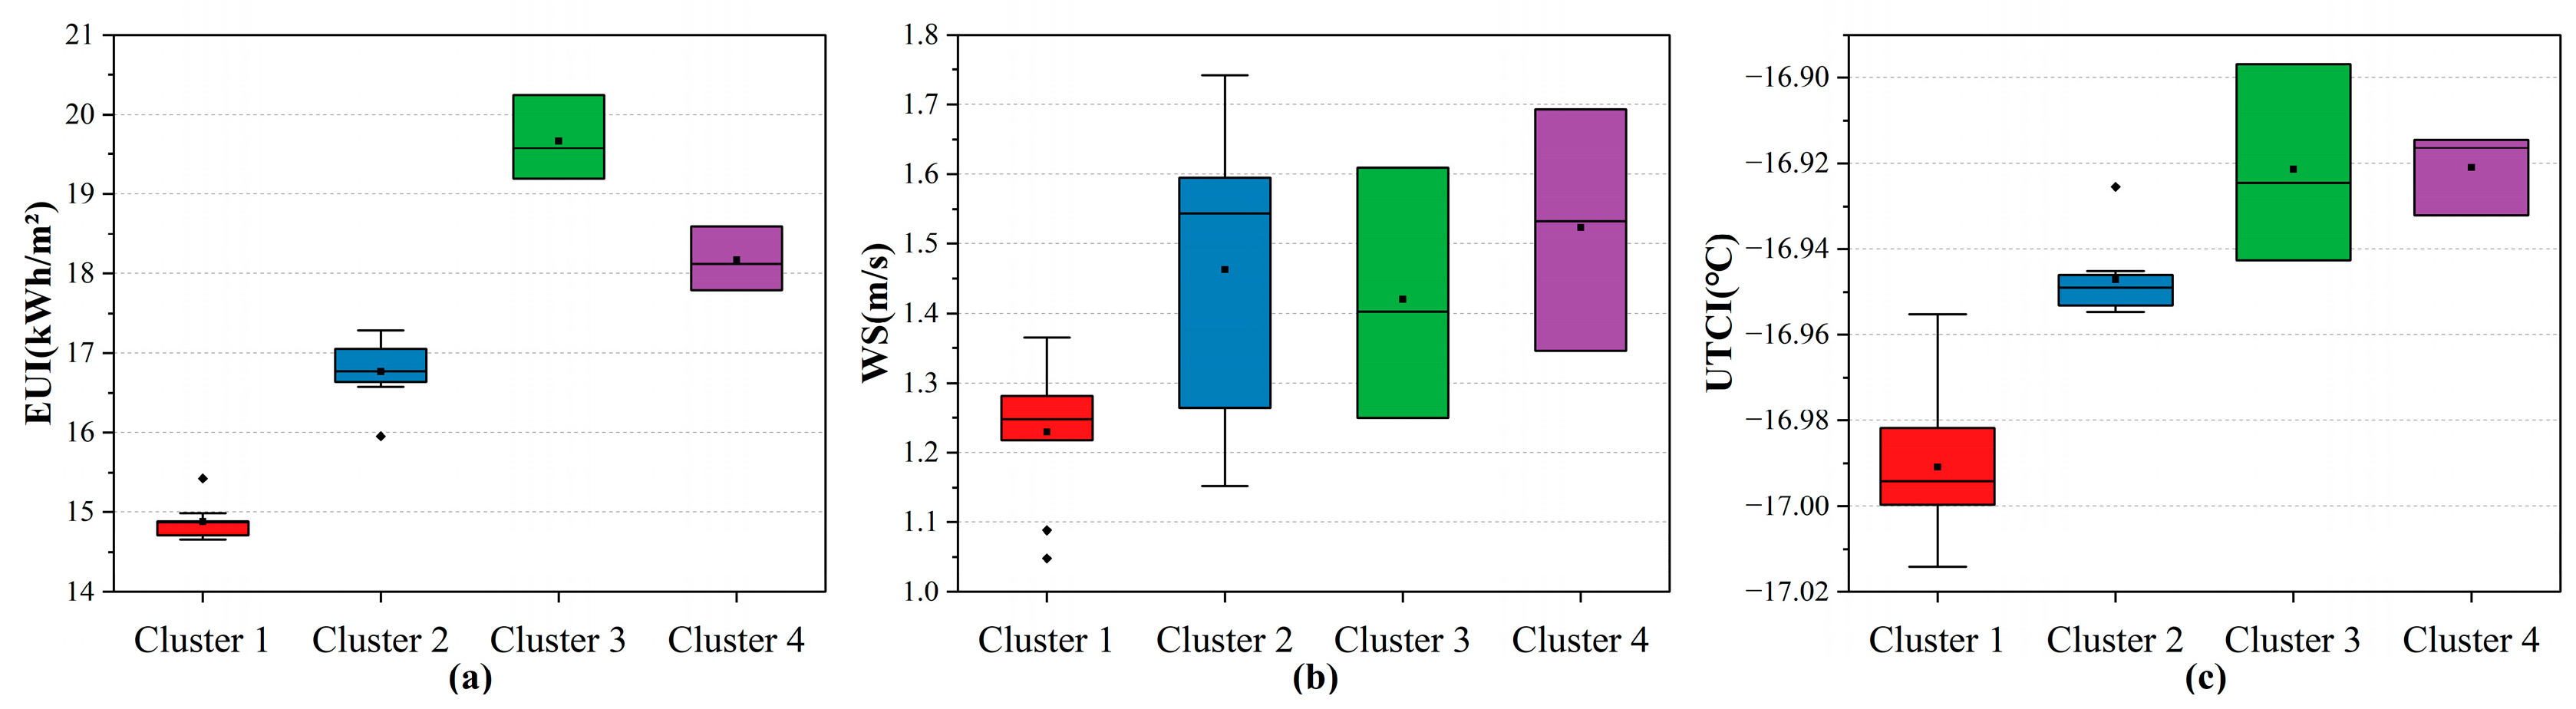
As shown in Table 7, Cluster 1 contains 10 Pareto solutions, Cluster 2 contains 8 Pareto solutions, while Clusters 3 and 4 are smaller, each containing 3 Pareto solutions. Figure 12 and Figure 13 illustrate the spatial distribution characteristics of the four clusters. Cluster 1 performs optimally in terms of EUI and WS but is the least favorable in terms of UTCI. Cluster 3 yields good results for WS and UTCI but is the weakest in terms of EUI. Cluster 4 excels in UTCI but performs poorly in both EUI and WS. In comparison, Cluster 2 shows a more balanced optimization across the three objectives. If a user requires the lowest energy consumption or wind speed, Cluster 1 should be selected. Conversely, if the user seeks the highest comfort level, Cluster 4 should be chosen.

3.3. Urban Morphological Parameters and Optimization Objectives

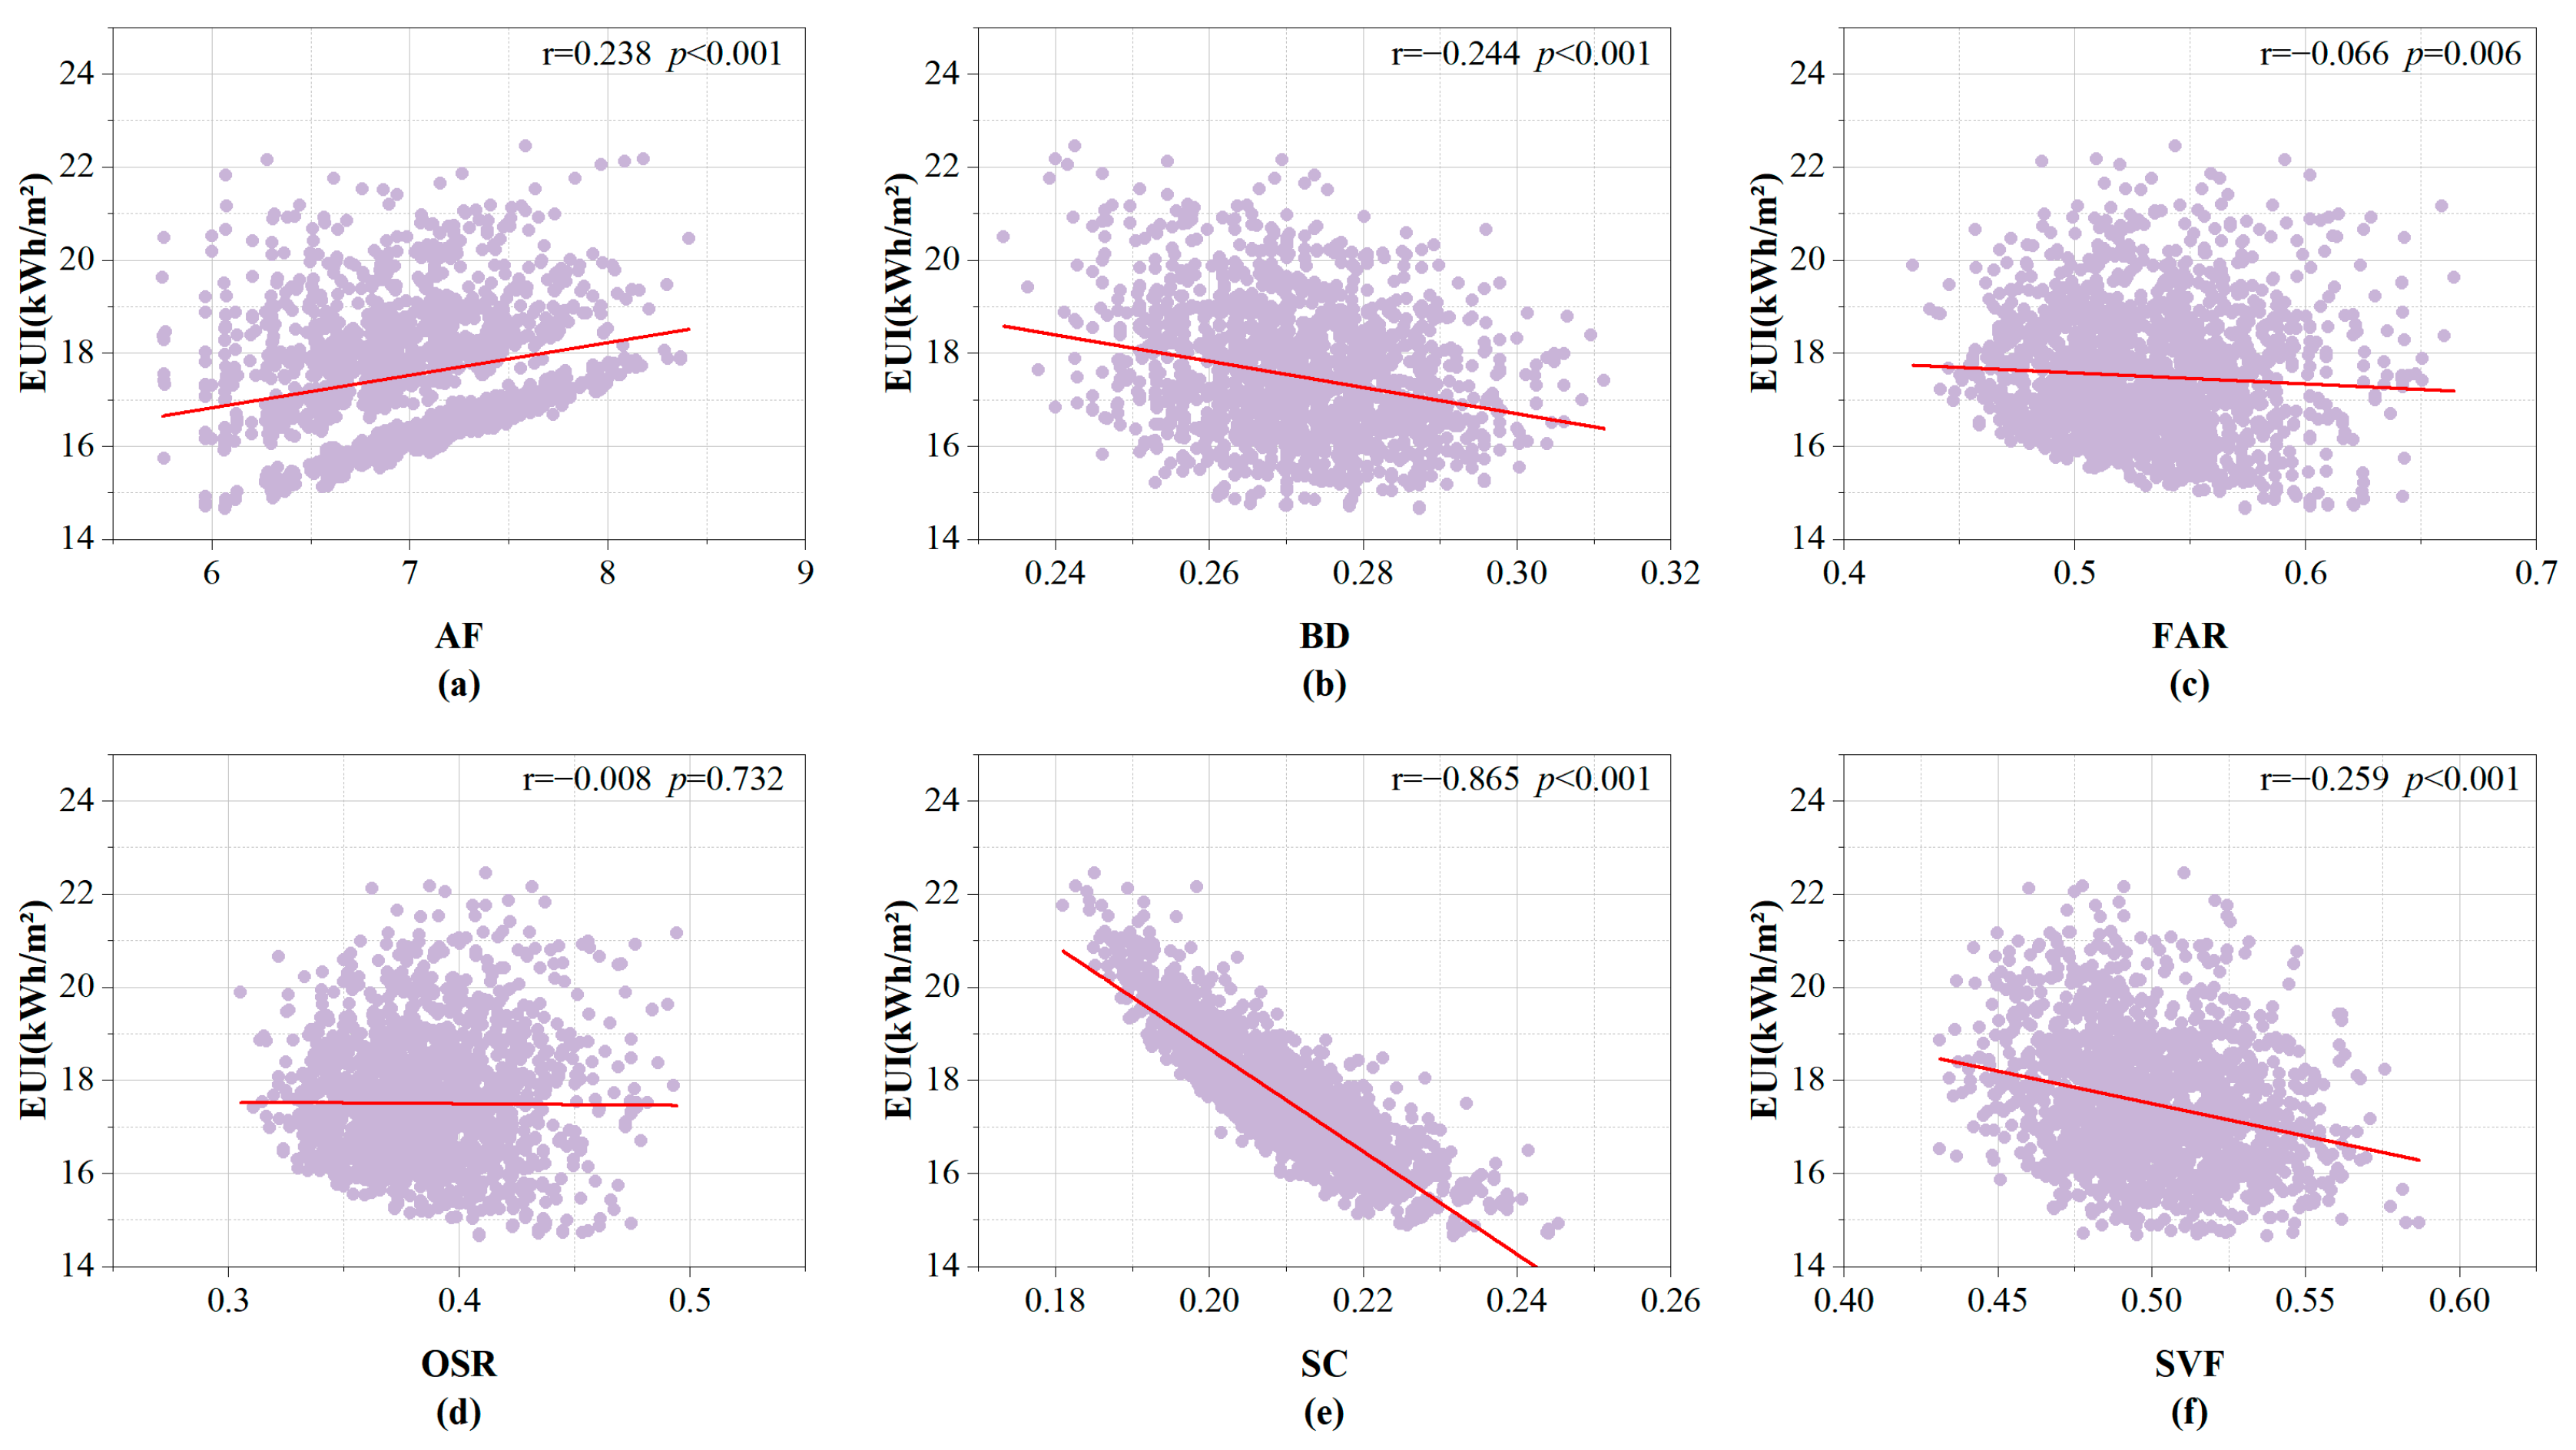
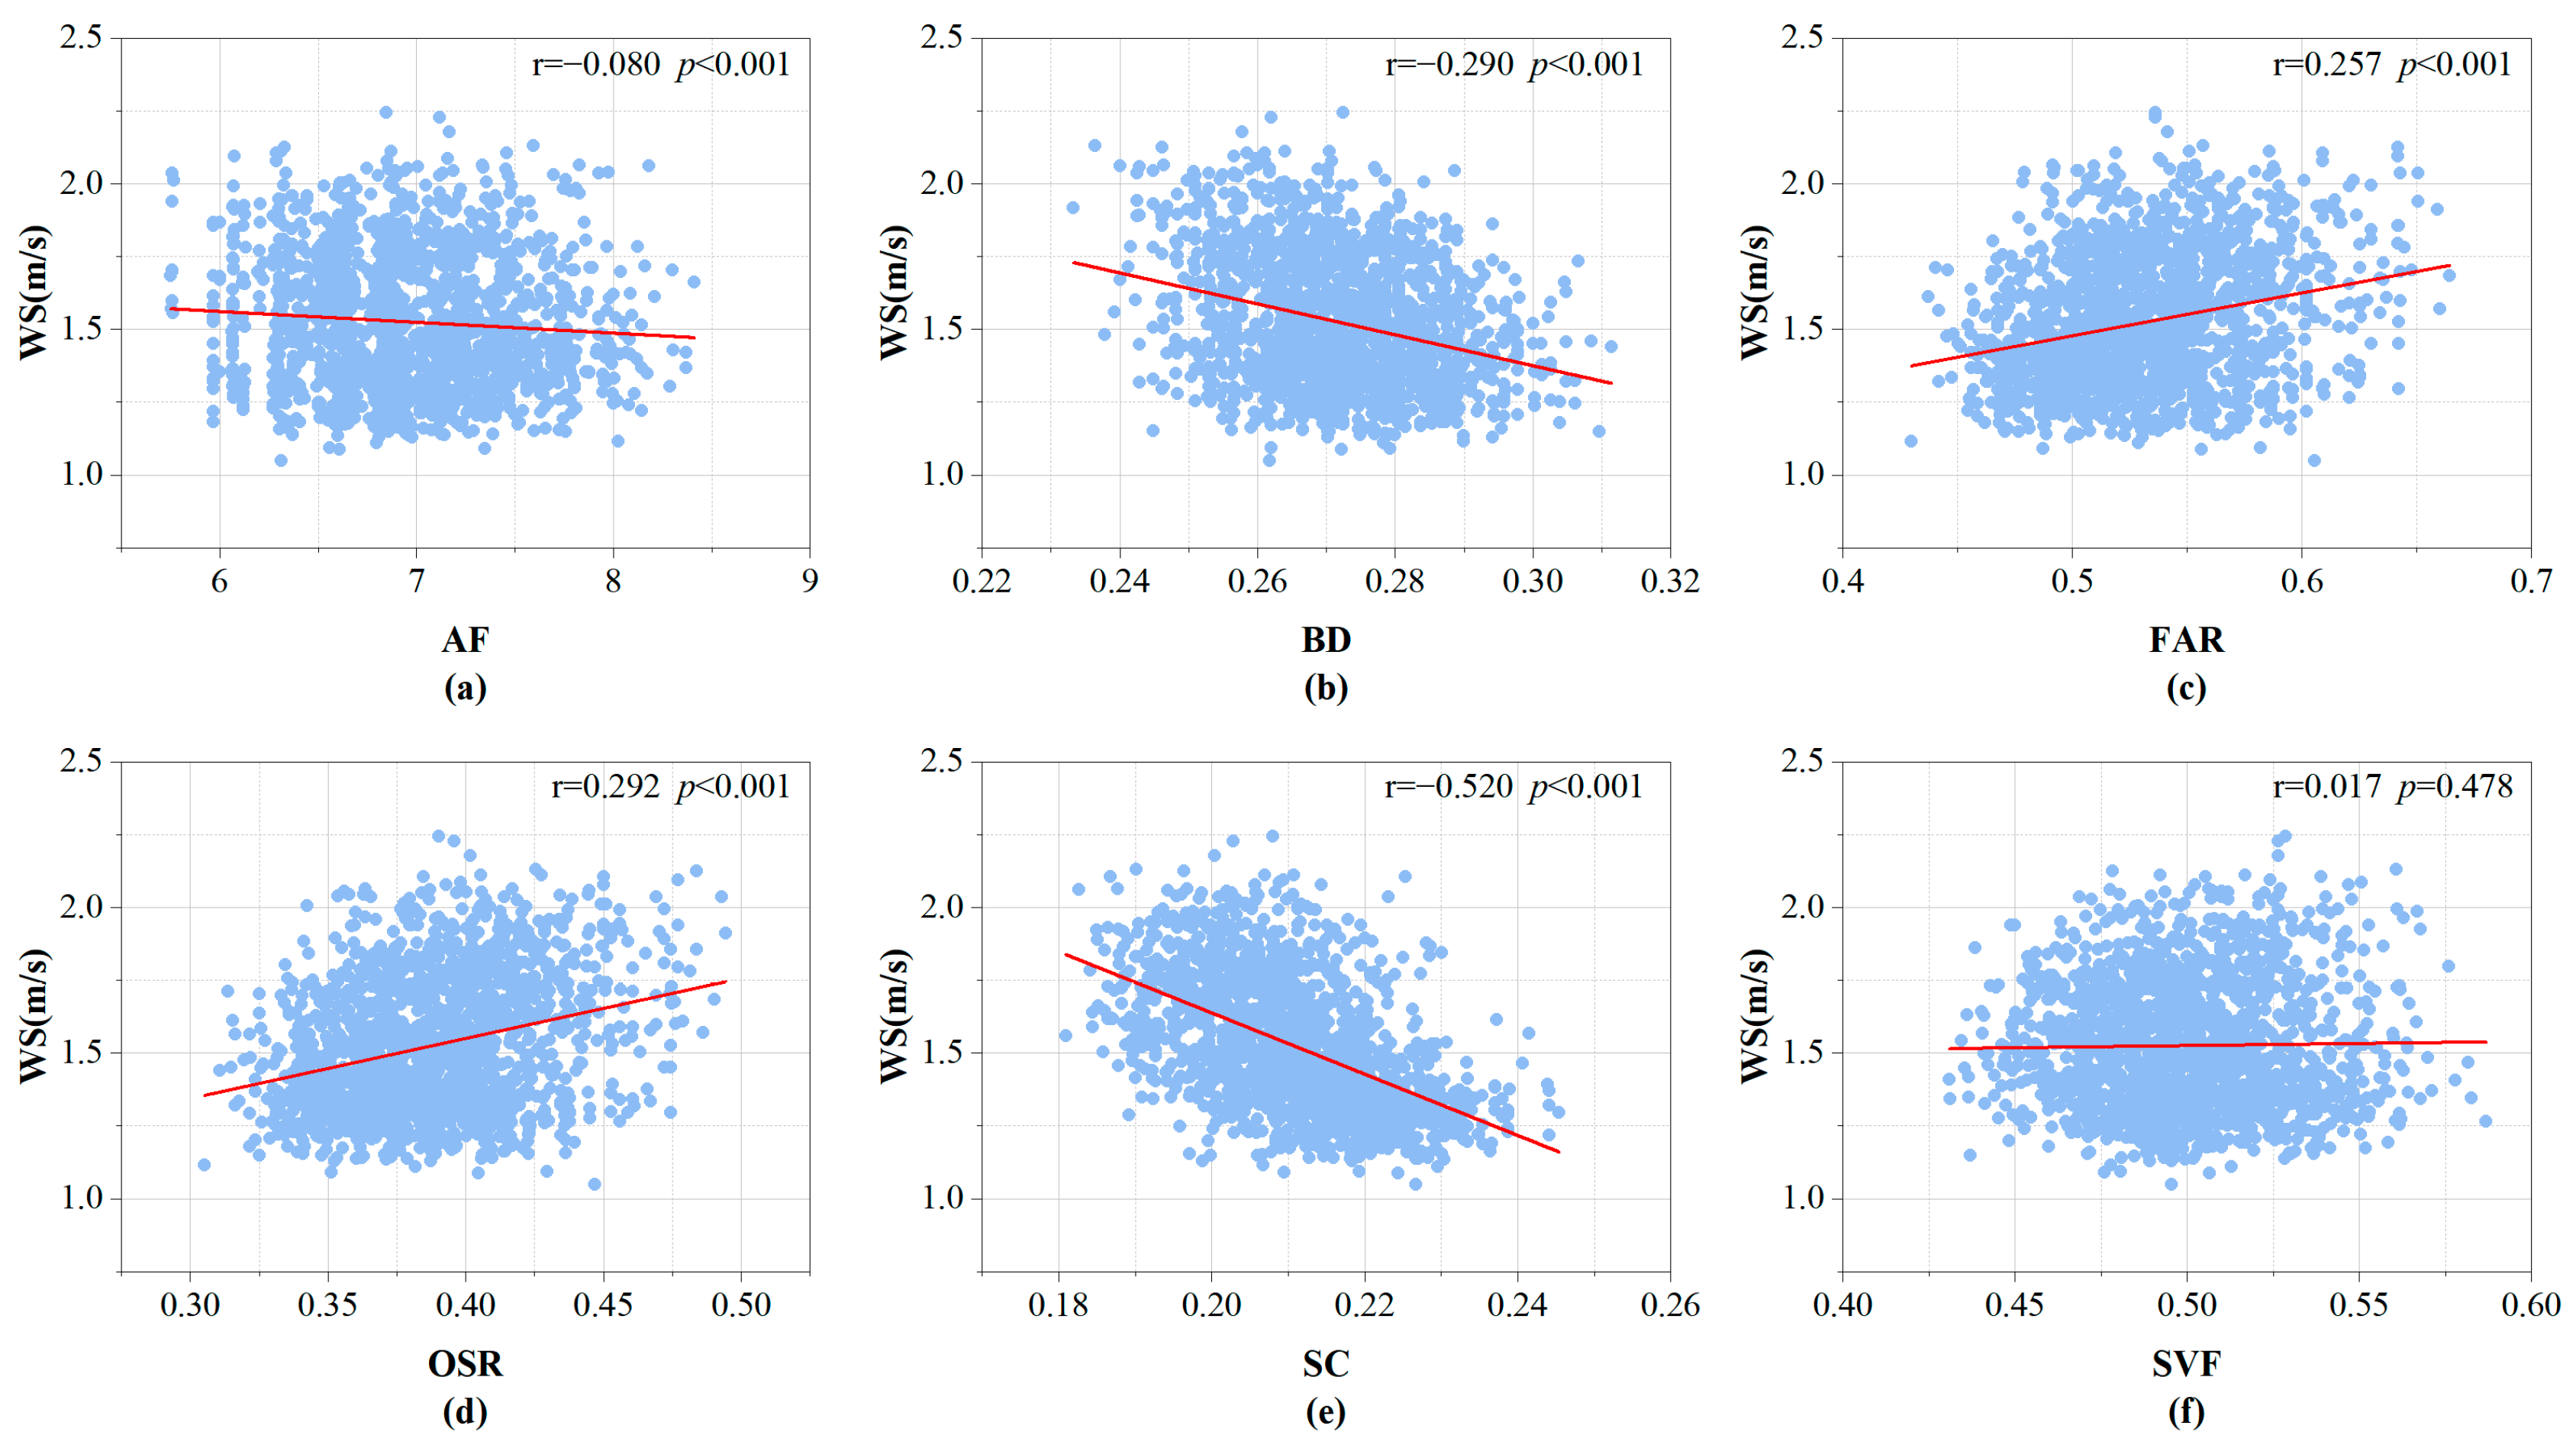
To investigate the relationships between urban morphological parameters and the three optimization objectives—energy use intensity (EUI), wind speed (WS), and the Universal Thermal Climate Index (UTCI)—the six morphological parameters corresponding to all optimization solutions were recorded. After removing duplicate samples from the 3000 generated solutions, a total of 1738 unique samples were retained for the correlation analysis. To identify potential multicollinearity among the morphological parameters, Variance Inflation Factor (VIF) analysis was first performed. Subsequently, Pearson correlation analysis and partial correlation analysis were employed to examine the correlations between each non-redundant parameter and the optimization objectives, as well as the conditional relationships among them. Scatter plots illustrating the Pearson correlations between the three optimization objectives and the morphological parameters are presented in Figure 14, Figure 15 and Figure 16. The results indicate that the shape coefficient (SC) exhibits relatively strong and consistent associations with all three optimization objectives, suggesting that it is a key morphological parameter associated with dormitory cluster performance.

3.3.1. Multicollinearity Analysis

It should be noted that the urban morphological parameters are not mutually independent. Therefore, before conducting the correlation analysis, a multicollinearity analysis was performed to determine whether strong linear dependencies existed among the morphological parameters [46], thereby providing a basis for the subsequent partial correlation analysis to identify the independent correlations between each parameter and the optimization objectives. Since the urban morphological parameters represent different characteristics of the dormitory layout, multicollinearity analysis and Pearson correlation analysis focus on different aspects. The former is used to explain the relationships among the morphological parameters, whereas the latter is used to analyze the overall correlations between the morphological parameters and the optimization objectives. The two methods complement each other and are jointly used to interpret the relationships between the morphological parameters and the optimization objectives.
In this study, the Variance Inflation Factor (VIF) was calculated for six urban morphological parameters, including average floor number (AF), building density (BD), floor area ratio (FAR), open space ratio (OSR), shape coefficient (SC), and sky view factor (SVF), to evaluate multicollinearity [47]. As shown in Table 8, the VIF values of AF and BD are 137.86 and 190.24, respectively, both exceeding the threshold value of 10, indicating severe multicollinearity. In particular, the VIF values of FAR and OSR exceed 4000, suggesting that their independent relationships with the optimization objectives cannot be directly interpreted. Therefore, principal component analysis (PCA) was applied to the four morphological parameters, AF, BD, FAR, and OSR. The first principal component was extracted and defined as the building intensity index (BI). BI explains 68.86% of the total variance of the four variables. As shown in Table 9, FAR and OSR both exhibit positive loading directions, with values of +0.60. In contrast, AF and BD contribute negatively, with loading values of −0.46 and −0.26, respectively, indicating the characteristics of a vertically intensive development pattern. In contrast, the VIF values of SC and SVF are only 1.32 and 1.42, indicating weak multicollinearity with the remaining morphological parameters, allowing their independent relationships with the optimization objectives to be further analyzed. SC, SVF, and BI together constitute the non-redundant parameter set in this study.
Considering the severe multicollinearity identified above, this study further introduces partial correlation analysis. By controlling the effects of the other two variables, partial correlation analysis evaluates the independent relationship between a specific non-redundant parameter and the optimization objectives. Combined with Pearson correlation analysis, this approach explains the relationships between morphological parameters and optimization objectives from both overall correlations and conditional associations.

3.3.2. Correlation Analysis Between Urban Morphological Parameters and Energy Use Intensity

Figure 14 analyzes the correlation between building energy use intensity (EUI) and the average floor number (AF), building density (BD), floor area ratio (FAR), open space ratio (OSR), shape coefficient (SC), and sky view factor (SVF). As shown in the figure, the p-value between EUI and OSR is greater than 0.05, indicating no significant correlation between the two. The remaining p-values are all less than 0.01, suggesting that the other morphological parameters are significantly correlated with EUI. Among these, the correlation coefficient between EUI and SC is −0.865, with an absolute value greater than 0.5, indicating a strong relationship between them. The correlation between EUI and the six morphological parameters, including average floor number (AF), building density (BD), floor area ratio (FAR), open space ratio (OSR), shape coefficient (SC), and sky view factor (SVF), was analyzed. The p-value for FAR was 0.006, while its Pearson correlation coefficient was only −0.066, indicating that FAR exhibited only a very weak linear correlation with EUI. The Pearson correlation coefficients of AF, BD, and SVF with EUI were 0.238, −0.244, and −0.259, respectively, all with absolute values below 0.3, suggesting relatively weak correlations with EUI.
Due to the severe multicollinearity among AF, BD, FAR, and OSR, partial correlation coefficients were calculated for the three non-redundant parameters, namely SC, SVF, and BI. As shown in Table 10, the partial correlation coefficient between SC and EUI is −0.863 (p < 0.001). The partial correlation coefficient is highly consistent with its Pearson correlation coefficient (−0.865), indicating a stable and independent association between SC and EUI. The partial correlation coefficient of SVF is −0.219 (p < 0.001), suggesting that SVF also exhibits an independent association with EUI. Although the p-value of the building intensity index (BI) is statistically significant (p < 0.001), its partial correlation coefficient is only 0.138, indicating a relatively weak independent association with EUI.
As shown in Figure 14e, SC exhibits a significant negative correlation with EUI, which is contrary to conventional expectations. Further analysis reveals that high-FAR buildings in the Pareto solutions are mainly located on the northeast side (Plots 6 and 9), which is the windward side under the prevailing northwestern winds. In particular, the EUI values of Pareto solutions No. 284 and No. 1462 are 20.243 and 19.575, respectively, representing the two highest EUI values among all Pareto solutions. This indicates that although high-FAR buildings have lower SC values, their concentrated distribution on the windward side may intensify cold air infiltration, thereby increasing heating energy consumption. Furthermore, Figure 14f shows that SVF is negatively correlated with EUI, indicating that more open layouts may receive greater solar radiation, thereby potentially reducing heating energy consumption. As shown in Figure 14a–c, AF is positively correlated with EUI, whereas BD is negatively correlated with EUI, which may be because the effects of building height and building density on EUI are not completely independent. Therefore, simply increasing building intensity may not significantly improve energy performance, and energy-efficient design of university dormitory areas should pay greater attention to the relationships between morphological parameters and sky view factor.

3.3.3. Correlation Analysis Between Urban Morphological Parameters and Wind Speed

Figure 15 presents the Pearson correlation analysis and scatter plots between wind speed (WS) and six urban morphological parameters, including average floor number (AF), building density (BD), floor area ratio (FAR), open space ratio (OSR), shape coefficient (SC), and sky view factor (SVF). The p-value between SVF and WS was 0.478, indicating no statistically significant correlation between the two variables. The p-values for the remaining morphological parameters were all below 0.01, indicating statistically significant correlations with WS. However, the Pearson correlation coefficient between AF and WS was only −0.08, indicating a very weak linear correlation. The Pearson correlation coefficient between SC and WS was −0.52, with an absolute value greater than 0.5, demonstrating a strong negative correlation. In contrast, the Pearson correlation coefficients of BD, FAR, and OSR with WS were −0.29, 0.257, and 0.292, respectively, all with absolute values below 0.3, indicating relatively weak correlations.
To eliminate the influence of multicollinearity, partial correlation coefficients between the non-redundant parameters and WS were calculated. As shown in Table 11, the partial correlation coefficient of building intensity (BI) is 0.355 (p < 0.001), indicating that BI has a certain positive independent effect on WS, although this effect is not significant. The partial correlation coefficient of SC is −0.569 (p < 0.001), which is very close to its Pearson correlation coefficient (−0.520), suggesting that the correlation between SC and WS is highly stable and exhibits a strong independent relationship. The partial correlation coefficient of SVF is only 0.025 (p = 0.296), indicating that it has no significant independent relationship with WS and its influence on WS is relatively weak. These results indicate that more compact building forms tend to reduce wind speed. However, under the same morphological parameters and sky view factor conditions, increasing building intensity (BI) may slightly increase wind speed, which may be attributed to the channeling effect associated with high-FAR point-type building layouts. The influence of SVF on WS is mainly achieved indirectly through interactions with other morphological parameters.
As shown in Figure 15e, SC exhibits a significant negative correlation with WS. This may be because the other two optimization objectives indirectly affect the wind environment during the multi-objective optimization process. To achieve lower EUI and higher outdoor thermal comfort under more compact building forms, building layouts and spacing tend to become more consistent, forming smoother outdoor wind corridors, which may be associated with an increase rather than a decrease in wind speed. Therefore, the improvement of the wind environment in university dormitory areas should prioritize the independent association of SC, while further considering the coordinated effects of building intensity (BI) and sky view factor (SVF).

3.3.4. Correlation Analysis Between Urban Morphological Parameters and UTCI

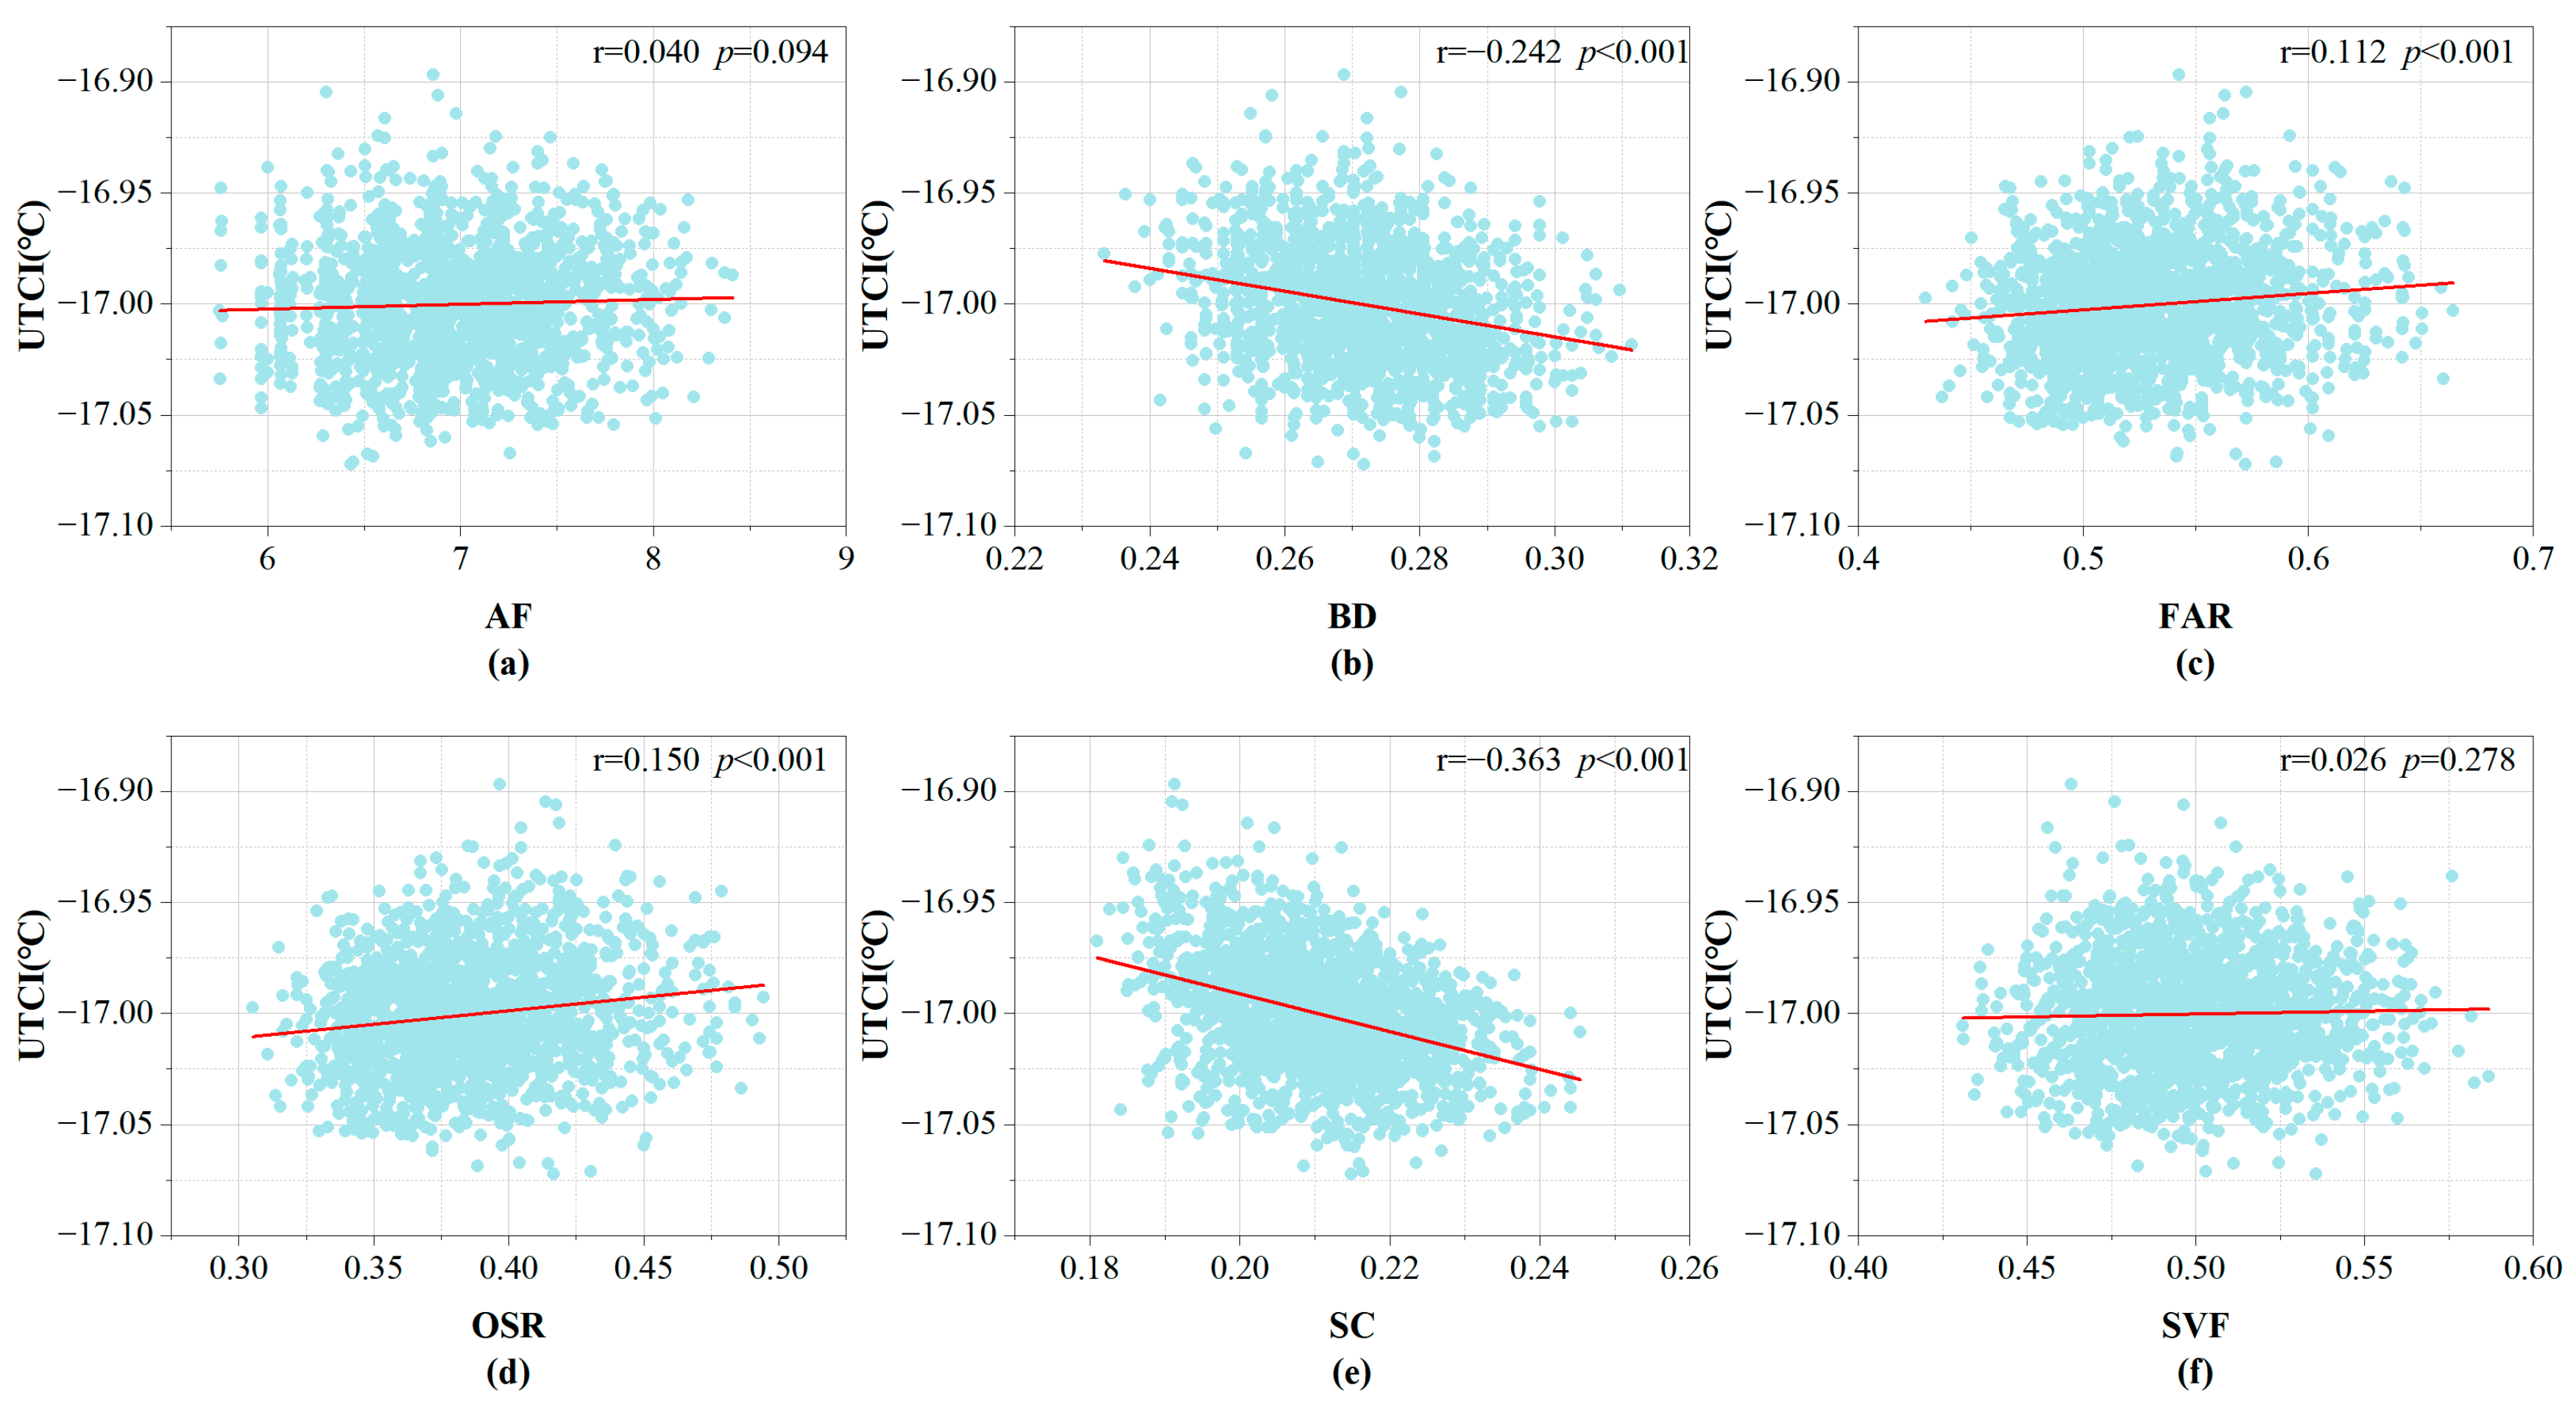
Figure 16 shows that the p-values between outdoor thermal comfort (UTCI) and four morphological parameters, namely building density (BD), floor area ratio (FAR), open space ratio (OSR), and shape coefficient (SC), were all below 0.01, indicating statistically significant correlations. In contrast, the p-values for average floor number (AF) and sky view factor (SVF) were 0.094 and 0.278, respectively, both exceeding 0.05, indicating no statistically significant correlations with UTCI. In addition, the Pearson correlation coefficients between BD, FAR, OSR, SC and UTCI were −0.242, 0.112, 0.150, and −0.363, respectively. Although all four correlations were statistically significant (p < 0.01), their correlation coefficients were all below 0.3, indicating weak linear correlations.
As shown in Table 12, the partial correlation coefficients and p-values between the non-redundant parameters and UTCI were calculated. The partial correlation coefficient of building intensity (BI) is 0.147 (p < 0.001), indicating that its independent association with UTCI is relatively weak, and that increasing building intensity alone has limited association with improvements in outdoor thermal comfort. The partial correlation coefficient of SC with UTCI is −0.384 (p < 0.001), which is close to its Pearson correlation coefficient (−0.363), suggesting that the association between SC and UTCI is relatively stable. The partial correlation coefficient of SVF is only 0.055 (p = 0.022), indicating that its independent association with UTCI is limited.
Based on the optimization objective of improving outdoor thermal comfort in this study, SC shows a negative correlation with UTCI, indicating that more compact building forms may contribute to blocking prevailing winter northwestern winds and improving outdoor thermal comfort. Overall, SC exhibits the most stable association with UTCI among the investigated morphological parameters. The independent associations of building intensity (BI) and sky view factor (SVF) with UTCI are relatively weak, and their relationships with the optimization objective are mainly achieved through coupling with other morphological parameters. Therefore, improving winter outdoor thermal comfort in cold-climate university dormitory areas should prioritize the role of SC while considering the synergistic relationships between building intensity (BI) and sky view factor (SVF).

4. Discussion

4.1. Research Findings

In cold regions, building morphology and layout are essential strategies for resisting harsh climates and creating livable microclimates [48,49,50]. This study focuses on multi-objective optimization of winter building energy use intensity, wind speed, and outdoor thermal comfort for university dormitories in cold regions. Based on the Grasshopper platform integrated with Honeybee, Butterfly, and other performance simulation plugins, this study develops an integrated framework consisting of prototype extraction, parametric modeling, performance simulation, and multi-objective optimization. Compared with previous studies that mainly focus on single-objective optimization, the proposed framework simultaneously considers three objectives: minimizing wind speed (WS), maximizing Universal Thermal Climate Index (UTCI), and minimizing winter-period energy use intensity (EUI). A dormitory prototype library was established based on common dormitory types and typical spatial organization patterns in cold climate regions. Based on urban morphological characteristics, the dormitory prototypes were classified into three types: detached, row-type, and enclosed layouts. The effects of predefined dormitory prototypes and their layout combinations on winter wind speed, energy consumption, and outdoor thermal comfort were investigated.
The optimization results indicate that the Pareto-optimal solutions outperform the dominated solutions across the three objectives, with WS reduced by 10.46%, EUI reduced by 6.57%, and UTCI increased by 0.05 °C. Pareto-optimal solutions occur more frequently in the later stages of the optimization process and tend to favor enclosed buildings and detached buildings, each appearing 74 times and accounting for 34.26% of the Pareto solution set. In contrast, row-type buildings appear less frequently, with 44 occurrences (20.37%). The results indicate that the semi-enclosed or fully enclosed configurations of enclosed buildings can effectively mitigate the winter northwest winds, creating a relatively stable courtyard environment and improving outdoor comfort, with strong general applicability. This effect is particularly evident for the E-1 prototype, which appears 38 times (17.59%) in the Pareto solution set. The complete building mass of detached buildings also effectively weakens the northwest winds, among which the D-1 prototype performs most prominently, with 35 occurrences (16.20%). In contrast, row-type buildings occur less frequently. Although their layout provides favorable solar access, their ability to block winter winds is relatively limited. The K-means clustering analysis produced four clusters. Cluster 1 shows the best performance in terms of WS and EUI, Cluster 2 exhibits a relatively balanced performance, Cluster 3 performs the worst in terms of EUI, and Cluster 4 achieves the best performance in UTCI, thereby meeting different design priorities.
The correlation analysis revealed that different urban morphological parameters exhibited distinct relationships with the three optimization objectives. Partial correlation analysis of the non-redundant parameter set (BI, SC, and SVF) indicates that SC exhibits independent and stable correlations with all three optimization objectives, including EUI, WS, and UTCI, making it a critical parameter for university dormitory optimization in cold climate regions. Pearson correlation analysis showed that SC was significantly negatively correlated with EUI, suggesting that a more compact building form was associated with higher building energy use. This finding is contrary to the results reported by Liu et al. [39] for residential buildings in Jianhu District, which may be attributed to the fact that their study considered year-round climatic conditions, whereas the present study focused exclusively on winter conditions. In addition, SC was also significantly negatively correlated with WS, which may be explained by the tendency of building layouts to form smoother ventilation corridors during the multi-objective optimization process, which may be associated with higher local wind speeds. Furthermore, SVF exhibited a certain degree of independent correlation with EUI but showed no significant correlation with either WS or UTCI. The building intensity index (BI), integrated from AF, BD, FAR, and OSR, has no significant independent associations with the optimization objectives, and its influence mainly occurs through coupling effects with other non-redundant parameters.
The results of this study indicate that the architectural form and layout of dormitory areas have a significant impact on wind environment, energy use intensity, and outdoor thermal comfort. A rational morphological layout can reduce outdoor wind speed, decrease building energy consumption, and improve outdoor comfort. Against the background of rapid expansion of university dormitories, the prototype-based multi-objective optimization framework proposed in this study provides practical technical pathway and optimization strategies for the planning and design of university dormitory buildings. It can improve the efficiency of dormitory planning and design while addressing diverse requirements under complex constraints. Furthermore, the integrated workflow developed for cold-region university dormitories, covering dormitory prototype extraction, parametric modeling, performance simulation, and multi-objective optimization, can be flexibly adjusted according to different design requirements, providing practical insights and references for related research on similar campus buildings in cold climate regions, while also supporting sustainable design practices for university dormitory buildings.

4.2. Limitations and Future Work

The current study has certain limitations, and the following discusses the future directions for optimization of this research.
Firstly, the geographical applicability of this study requires further expansion, as it only focuses on winter conditions in cold climate regions, and the single-season analysis presents certain limitations. Conflicts may exist among building performance optimization objectives across different seasons [51,52,53]. Therefore, future research should focus on year-round performance optimization and comparative studies across different climatic regions.
Secondly, the performance optimization objectives are not comprehensive. In the context of high-density development of university dormitories, the solar access conditions and construction costs of the dormitory area are also crucial factors. Additionally, building layouts designed for winter may lead to excessive solar radiation in the summer, thereby increasing cooling loads [54].
Thirdly, the evaluation indicators considered in this study are limited. Only WS, UTCI, and EUI were included, without incorporating other perceptual factors. Previous studies have shown that emotional perception in campus environments is closely associated with the interactions among thermal, visual, and acoustic conditions [55]. Therefore, future research should introduce a multi-sensory evaluation framework to improve the comprehensiveness of the assessment.
Fourthly, the efficiency of performance simulation calculations is relatively low, and the rationality of the optimization results is closely related to the number of iterations in Wallacei. When dealing with larger campus scales or more complex optimization objectives, the time-consuming nature of physics-based simulations (especially CFD-based wind environment simulations) becomes more pronounced. Therefore, future research will explore the use of machine learning algorithms in conjunction with the MOEA/D algorithm to address this issue.
Fifthly, the dormitory prototype library has certain limitations, and the design variables considered in this study do not include some morphological parameters, such as building spacing and building height. Therefore, the optimization results may be affected by the initial prototype selection. Future studies should further expand the prototype library and incorporate sensitivity analysis methods to evaluate the robustness of optimization results under different prototype configurations, while developing a multi-scale and adjustable design variable system.


5. Conclusions

This study establishes a parametric multi-objective optimization framework for the winter building energy consumption, wind speed at pedestrian height, and outdoor thermal comfort of university dormitories in cold climate regions. Based on simulations of 24 morphological prototypes and Pareto analysis, the following key conclusions are drawn:
(1)
The optimal building forms exhibit a clear tendency. Enclosed and detached buildings each account for 34.26% of the Pareto-optimal solutions and dominate the solution set, whereas row-type buildings account for 20.37% and occur much less frequently. This indicates that in cold regions during winter, compact or semi-enclosed forms that effectively block the prevailing wind direction are most beneficial for improving overall performance.
(2)
The layout exhibits structural regularities. High-FAR buildings are predominantly located on the northeastern side of the site; low-FAR buildings occur most frequently (63.43%) and are concentrated on the southern side; and public spaces are located in the south-central area in 66.67% of the Pareto-optimal solutions, showing a clear tendency. This “low in the south, high in the north, and open in the center” layout pattern helps optimize solar gain and mitigate the impact of winter cold winds.
(3)
The Pareto front can be clustered into four performance-oriented clusters, corresponding to four trade-off modes: “low energy consumption and low wind speed”, “balanced”, “high energy consumption with moderate comfort”, and “high comfort but high energy consumption”. These clusters provide clear selection criteria for different design priorities.
(4)
Urban morphological parameters exhibited significant differences in their correlations with the optimization objectives. The shape coefficient (SC) showed negative correlations with EUI, WS, and UTCI, indicating that it is a morphological parameter closely associated with dormitory performance. Among these relationships, the correlation with EUI was the most pronounced, suggesting that under winter conditions in cold climate regions, more compact building forms may be associated with higher heating energy consumption.
The research framework proposed in this study demonstrates certain transferability. By adjusting climatic boundary conditions, site characteristics, and optimization objectives, it can be applied to other campus and climatic contexts. Future research should further expand the prototype database and investigate dormitory areas across different climatic regions to compare the variations in dormitory layouts under different climatic conditions and improve the generalizability of the research findings.

Author Contributions

P.G.: Conceptualization, Data curation, Formal analysis, Methodology, Writing—Original draft; H.Z.: Conceptualization, Project administration, Supervision, Writing—Review and editing, Funding acquisition; S.D.: Methodology, Writing—Review and editing; L.Y.: Conceptualization, Methodology, Writing—Review and editing. All authors have read and agreed to the published version of the manuscript.

Funding

This research was supported by the Excellent Undergraduate Basic Research Project of Central Universities (No. XJ2025001302), the National Natural Science Foundation of China (No. 52108044), and the Liaoning Provincial Economic and Social Development Research Project (No. 2025lslqnkt-054).

Data Availability Statement

The data that support the findings of this study are available from the corresponding author upon reasonable request.

Conflicts of Interest

The authors declare no conflict of interest.

Abbreviations

The following abbreviations are used in this manuscript:
AcronymsFull Term
EUIEnergy use intensity
WSWind speed
UTCIUniversal Thermal Climate Index
BDBuilding density
SCShape coefficient
FARFloor area ratio
AFAverage floor number
OSROpen space ratio
SVFSky view factor
CFDComputational fluid dynamics
HVHypervolume
BIBuilding intensity index

References

  1. Intergovernmental Panel on Climate Change (IPCC). Climate Change 2022: Mitigation of Climate Change. Working Group III Contribution to the Sixth Assessment Report; Cambridge University Press: Cambridge, UK, 2023. [Google Scholar]
  2. Al-Shatnawi, Z.; Hachem-Vermette, C.; Lacasse, M.; Ziaeemehr, B. Advances in cold-climate-responsive building envelope design: A comprehensive review. Buildings 2024, 14, 3486. [Google Scholar] [CrossRef]
  3. GB 50178-93; Standard for Climatic Regionalization of Buildings. China Planning Press: Beijing, China, 1993. (In Chinese)
  4. Deng, Q.; Wang, G.; Wang, Y.; Zhou, H.; Ma, L. A quantitative analysis of the impact of residential cluster layout on building heating energy consumption in cold IIB regions of China. Energy Build. 2023, 278, 112634. [Google Scholar]
  5. Tan, J.; Peng, S.; Liu, E. Spatio-temporal distribution and peak prediction of energy consumption and carbon emissions of residential buildings in China. Appl. Energy 2024, 376, 124330. [Google Scholar] [CrossRef]
  6. Yu, J.; Chang, W.S.; Zhang, R.; Dong, Y.; Huang, H.; Wang, T.H. In-situ U-value measurements of typical building envelopes in a severe cold region of China: U-value variations and energy implications. Energy Build. 2024, 324, 114947. [Google Scholar] [CrossRef]
  7. Ministry of Education of the People’s Republic of China. Statistical Bulletin of National Education Development in 2024; Ministry of Education of the People’s Republic of China: Beijing, China, 2025. (In Chinese)
  8. Zhang, Y.; Zhang, B.; Hou, J. Simulation study on student residential energy use behaviors: A case study of university dormitories in Sichuan, China. Buildings 2024, 14, 1484. [Google Scholar] [CrossRef]
  9. Wang, D.; Xu, H.; Yang, J.; Luo, Y.; Yang, L. Energy consumption analysis and electricity pricing strategies of university dormitories in hot summer and warm winter region: A case from Guangzhou University, South China. Energy Build. 2025, 335, 115525. [Google Scholar]
  10. Zhong, M.; Dou, Z.; Zhang, X.; Wang, S.; Chen, H. Cluster Analysis of the Electricity Consumption of Student Dormitories in Institutions of Higher Education Located in the Hot Summer and Cold Winter Region in China. In Proceedings of the 2021 IEEE 5th Conference on Energy Internet and Energy System Integration (EI2), Taiyuan, China, 22–25 October 2021; pp. 3080–3084. [Google Scholar]
  11. Zou, Y.; Zhong, N.; Chen, Z.; Zhao, W. Bridging digitalization and sustainability in universities: A Chinese green university initiative in the digital era. J. Clean. Prod. 2024, 469, 143181. [Google Scholar] [CrossRef]
  12. Yang, K.; Zhang, W.; Li, Z.; Zeng, X.; Guo, J.; Zou, R.; Wang, X. Coordinated optimization of university dormitories based on student energy behavior profiles and renewable energy integration. Sustain. Energy Technol. Assess. 2025, 84, 104724. [Google Scholar] [CrossRef]
  13. Li, R.; Shari, Z.; Kadir, M.Z.A.A. A review on multi-objective optimization of building performance—Insights from bibliometric analysis. Heliyon 2025, 11, e42480. [Google Scholar] [CrossRef] [PubMed]
  14. Ibrahim, A.; Alsukkar, M.; Dong, Y.; Saleem, F.; Hamza, A.; Hu, P.; Hu, M. Enhancing energy efficiency in shipping container house: A novel approach using hybrid louver systems. Energy Built Environ. 2026, 7, 278–294. [Google Scholar] [CrossRef]
  15. Deb, K.; Pratap, A.; Agarwal, S.; Meyarivan, T. A fast and elitist multiobjective genetic algorithm: NSGA-II. IEEE Trans. Evol. Comput. 2002, 6, 182–197. [Google Scholar] [CrossRef]
  16. Wu, C.; Pan, H.; Luo, Z.; Liu, C.; Huang, H. Multi-objective optimization of residential building energy consumption, daylighting, and thermal comfort based on BO-XGBoost-NSGA-II. Build. Environ. 2024, 254, 111386. [Google Scholar] [CrossRef]
  17. Wang, Y.; Zhou, J.; Ma, Y.; Zhao, Y. Multi-objective optimization and operation characteristics analysis of multi-energy complementary heating systems in cold regions. Therm. Sci. Eng. Prog. 2025, 65, 103897. [Google Scholar] [CrossRef]
  18. Xi, H.; Gao, H.; Hou, W.; Yin, B.; Zuo, J.; Zhao, H. Multi-objective optimization for winter heating retrofit in rural houses of cold regions: A case study in the Wusu area. Appl. Sci. 2024, 14, 3760. [Google Scholar] [CrossRef]
  19. Yang, Y.; Gang, W.; Yuan, J.; Zhang, Z.; Tian, C. Energy consumption patterns and characteristics of college dormitory buildings based on unsupervised data mining method. Buildings 2023, 13, 666. [Google Scholar] [CrossRef]
  20. Chen, S.; Cui, P.; Mei, H. A sustainable design strategy based on building morphology to improve the microclimate of university campuses in cold regions of China using an optimization algorithm. Math. Probl. Eng. 2021, 2021, 2304796. [Google Scholar] [CrossRef]
  21. Li, L.; Qi, Z.; Ma, Q.; Gao, W.; Wei, X. Evolving multi-objective optimization framework for early-stage building design: Improving energy efficiency, daylighting, view quality, and thermal comfort. Build. Simul. 2024, 17, 2097–2123. [Google Scholar] [CrossRef]
  22. Harshalatha; Patil, S.; Kini, P.G. A review on simulation based multi-objective optimization of space layout design parameters on building energy performance. J. Build. Pathol. Rehabil. 2024, 9, 69. [Google Scholar] [CrossRef]
  23. Cruz, A.; Caldas, L.; Mendes, V.; Mendes, J.; Bastos, L. Multi-objective optimization based on surrogate models for sustainable building design: A systematic literature review. Build. Environ. 2024, 266, 112147. [Google Scholar] [CrossRef]
  24. Liu, Q.; Ma, S.; Guo, Y.; Yan, Y.; Xu, X. Research on the coupling relationship between energy consumption and architectural form design of university dormitory buildings under the target of low energy consumption. Energy Build. 2025, 337, 115664. [Google Scholar] [CrossRef]
  25. Wang, A.; Yu, S.; Shi, C.; An, Y. Optimization of university dormitory renovation in severe cold regions under the impact of climate change. Results Eng. 2025, 26, 105384. [Google Scholar] [CrossRef]
  26. Liu, T.; Wang, Y.; Zhang, L.; Xu, N.; Tang, F. Outdoor thermal comfort research and its implications for landscape architecture: A systematic review. Sustainability 2025, 17, 2330. [Google Scholar] [CrossRef]
  27. Qi, Y.; Chen, L.; Xu, J.; Liu, C.; Gao, W.; Miao, S. Influence of university campus spatial morphology on outdoor thermal environment: A case study from Eastern China. Energy Built Environ. 2025, 6, 43–56. [Google Scholar] [CrossRef]
  28. Li, L.; Ai, Z.; Jia, Z.; Zhang, X.; Xiang, Y.; Zhou, Y.; Zhang, G. Building morphology–microclimate interactions and outdoor thermal comfort across university campus spatial types. Urban Clim. 2026, 68, 102993. [Google Scholar] [CrossRef]
  29. Zhang, S.; Li, S.; Shu, L.; Xiao, T.; Shui, T. Landscape configuration effects on outdoor thermal comfort across campus—A case study. Atmosphere 2023, 14, 270. [Google Scholar] [CrossRef]
  30. Su, Y.; Sun, J.; Li, S.; Li, J.; Wu, Z.; Li, J.; Li, X.; Wang, D.; Wang, W. UTCI assessment of outdoor thermal comfort in arid-hot university campuses during summer. Energy Build. 2026, 351, 116683. [Google Scholar] [CrossRef]
  31. Chen, X.; Kang, H.; Zhao, J.; Liu, Q. Optimization design research of architectural layout and morphology in multi-story dormitory areas based on wind environment analysis. Buildings 2025, 15, 1747. [Google Scholar] [CrossRef]
  32. Zhen, M.; Chen, Z.; Zheng, R. Outdoor wind comfort and adaptation in a cold region. Buildings 2022, 12, 476. [Google Scholar] [CrossRef]
  33. Alnusairat, S.; Al-Shatnawi, Z.; Ayyad, Y.; Alwaked, A.; Abuanzeh, N. Rethinking outdoor courtyard spaces on university campuses to enhance health and wellbeing: The anti-virus built environment. Sustainability 2022, 14, 5602. [Google Scholar] [CrossRef]
  34. Liu, Z.; Li, J.; Xi, T. A review of thermal comfort evaluation and improvement in urban outdoor spaces. Buildings 2023, 13, 3050. [Google Scholar] [CrossRef]
  35. Zhang, H.; Wang, Y.; Guo, F.; Zhao, J.; Dong, J.; Zhu, P. Factors Influencing Outdoor Thermal Comfort in a Coastal Park during the Transition Seasons in Cold Regions of China. Urban Clim. 2024, 55, 101856. [Google Scholar] [CrossRef]
  36. Song, J.; Liu, Y.; Li, W.; Zou, Y.; Yang, M.; Zhang, Y.; Liu, H. Investigation on the influence of insolation on winter thermal comfort of outdoor activity space on campus in a cold region of China. In Proceedings of the 3rd International Civil Engineering and Architecture Conference (CEAC 2023); Lecture Notes in Civil Engineering; Springer: Singapore, 2024; Volume 389, pp. 477–490. [Google Scholar]
  37. Wang, L.; Ibrahim, A.; Jiang, Y. Multi-Objective Optimization of Atrium Form Variables for Daylighting, Energy Consumption and Thermal Comfort of Teaching Buildings at the Early Design Stage in Cold Climates. Buildings 2025, 15, 4434. [Google Scholar] [CrossRef]
  38. Liu, K.; Xu, X.; Zhang, R.; Kong, L.; Wang, W.; Deng, W. Impact of urban form on building energy consumption and solar energy potential: A case study of residential blocks in Jianhu, China. Energy Build. 2023, 280, 112727. [Google Scholar] [CrossRef]
  39. Zeka, E.; Yuzer, M.A. A methodology for measuring the form of organic settlements. MethodsX 2019, 6, 368–376. [Google Scholar] [CrossRef] [PubMed]
  40. Elzeni, M.; Elmokadem, A.; Badawy, N. Classification of urban morphology indicators towards urban generation. Port Said Eng. Res. J. 2021, 26, 43–56. [Google Scholar]
  41. ISO 7726:1998; Ergonomics of the Thermal Environment—Instruments for Measuring Physical Quantities. International Organization for Standardization: Geneva, Switzerland, 1998.
  42. van den Berg, E.; Friedlander, M.P. Probing the Pareto frontier for basis pursuit solutions. SIAM J. Sci. Comput. 2009, 31, 890–912. [Google Scholar] [CrossRef]
  43. Qin, Y.; Li, S.; Kuang, Y. Optimization analysis of residential space in cold region based on building performance simulation. Therm. Sci. 2023, 27, 4333–4344. [Google Scholar] [CrossRef]
  44. Zhang, H.; Sun, C.; Zhang, L.; Yan, B.; Liu, Y.; Dong, Q. A field study on thermal comfort and adaptive behaviour of university open-plan offices in severe cold regions of China. J. Asian Archit. Build. Eng. 2026, 25, 157–175. [Google Scholar] [CrossRef]
  45. Liu, Y.; Luo, Z.; Grimmond, S. Impact of building envelope design parameters on diurnal building anthropogenic heat emission. Build. Environ. 2023, 234, 110134. [Google Scholar] [CrossRef]
  46. Lim, J.; Ooka, R.; Lim, H. Multicollinearity issue for the parameterization of urban ventilation potential with urban morphology. Sustain. Cities Soc. 2022, 87, 104218. [Google Scholar] [CrossRef]
  47. Hair, J.F.; Babin, B.J.; Anderson, R.E. Multivariate Data Analysis, 8th ed.; Cengage Learning: Boston, MA, USA, 2018. [Google Scholar]
  48. Guo, L.; Guo, X.; Li, B.; Wang, E. The impact of block morphology on urban microclimates: A case study of three cities in cold regions of China. Urban Clim. 2024, 57, 102098. [Google Scholar] [CrossRef]
  49. Zhang, H.; Wang, Y.; Chen, B.; Bai, J.; Zhao, J.; Guo, F.; Zhu, P. Analyzing spatial disparities in thermal comfort in a coastal city: A multi-parameter comparative study based on local climate zones. Sustain. Cities Soc. 2026, 136, 107031. [Google Scholar] [CrossRef]
  50. Zhang, H.; Gao, J.; Zhao, J.; Guo, F.; Bai, J.; Wang, Z.; Zhu, P. Applicability of local climate zones in assessing urban heat risk: A survey of coastal city. Cities 2025, 164, 106068. [Google Scholar] [CrossRef]
  51. Xu, Z.; Wu, H.; Han, C.; Chang, J. Research on the method of automatic generation and multi-objective optimization of block spatial form based on thermal comfort demand. Buildings 2025, 15, 2098. [Google Scholar] [CrossRef]
  52. Wang, R.; Lu, S.; Feng, W.; Xu, B. Tradeoff between heating energy demand in winter and indoor overheating risk in summer constrained by building standards. Build. Simul. 2021, 14, 987–1003. [Google Scholar] [CrossRef]
  53. Li, Y.; Zeng, Y.; Tu, W.; Ao, G.; Li, G. Research on outdoor thermal comfort strategies for residential blocks in hot-summer and cold-winter areas: Taking Wuhan as an example. Buildings 2025, 15, 1615. [Google Scholar] [CrossRef]
  54. Zhai, X.; He, Z.; Wang, R.; Lu, S.; Zhang, L. Multi-objective optimization of building envelope of rural housing in the severely cold region of China based on energy consumption, thermal comfort and cost-effectiveness. Indoor Built Environ. 2024, 34, 627–643. [Google Scholar] [CrossRef]
  55. Chen, B.; Qu, J.; Guo, P.; Lu, X.; Zhang, H. Multi-sensory campus: The impact of thermal-visual-acoustic interactions on emotional perception in campus environments. Build. Environ. 2026, 295, 114444. [Google Scholar] [CrossRef]
Figure 1. Workflow of This Study.
Buildings 16 03126 g001
Figure 2. Grid Division of the Study Site.
Buildings 16 03126 g002
Figure 3. Random factor generation.
Buildings 16 03126 g003
Figure 4. Hypervolume convergence curve of NSGA-II.
Buildings 16 03126 g004
Figure 5. Distribution of Optimization Data.
Buildings 16 03126 g005
Figure 6. Scatter Plot of Feasible Solutions in Multi-Objective Optimization: (a) 3D Distribution of Feasible Solutions.; (b) 2D Projection of EUI-WS; (c) 2D Projection of EUI-UTCI; (d) 2D Projection of WS-UTCI.
Buildings 16 03126 g006
Figure 7. Comparative Analysis of Pareto Solutions and Dominated Solutions: (a) EUI; (b) UTCI; (c) WS.
Buildings 16 03126 g007
Figure 8. Frequency of Occurrence of Building Types.
Buildings 16 03126 g008
Figure 9. Correlation Heatmap.
Buildings 16 03126 g009
Figure 10. Comparative Analysis of Low-, Medium-, and High-Density Dormitories.
Buildings 16 03126 g010
Figure 11. Elbow method and silhouette coefficient analysis: (a) the elbow method; (b) the silhouette coefficient.
Buildings 16 03126 g011
Figure 12. Clustering Spatial Layout of Pareto-optimal Solutions.
Buildings 16 03126 g012
Figure 13. Relationship Between Objective Solutions and Clusters: (a) EUI; (b) WS; (c) UTCI. The square markers inside the boxes represent the mean values, and the diamond markers indicate outliers.
Buildings 16 03126 g013
Figure 14. Correlation Analysis Between Six Urban Morphological Parameters and EUI: (a) AF-EUI; (b) BD-EUI; (c) FAR-EUI; (d) OSR−EUI; (e) SC−EUI; (f) SVF−EUI. The red lines indicate the linear regression results.
Buildings 16 03126 g014
Figure 15. Correlation Analysis Between Six Urban Morphological Parameters and WS: (a) AF-WS; (b) BD-WS; (c) FAR-WS; (d) OSR−WS; (e) SC−WS; (f) SVF−WS. The red lines indicate the linear regression results.
Buildings 16 03126 g015
Figure 16. Correlation Analysis Between Six Urban Morphological Parameters and UTCI: (a) AF-UTCI; (b) BD-UTCI; (c) FAR-UTCI; (d) OSR−UTCI; (e) SC−UTCI; (f) SVF−UTCI. The red lines indicate the linear regression results.
Buildings 16 03126 g016
Table 1. Basic Information of the 24 Prototypes.
TypeBuilding PrototypeGround Floor PlanCodeModelNumber of LayersFloor Area ( m 2 )
R-1Buildings 16 03126 i001Buildings 16 03126 i002R-1-1Buildings 16 03126 i0031–617,712
R-1-2Buildings 16 03126 i0041–6
1–12
26,568
R-1-3Buildings 16 03126 i0051–6
1–24
44,280
R-2Buildings 16 03126 i006Buildings 16 03126 i007R-2-1Buildings 16 03126 i0081–615,120
R-2-2Buildings 16 03126 i0091–6
1–12
22,680
R-2-3Buildings 16 03126 i0101–6
1–24
37,800
D-1Buildings 16 03126 i011Buildings 16 03126 i012D-1-1Buildings 16 03126 i0131–613,176
D-1-2Buildings 16 03126 i0141–1226,352
D-1-3Buildings 16 03126 i0151–2452,704
D-2Buildings 16 03126 i016Buildings 16 03126 i017D-2-1Buildings 16 03126 i0181–613,176
D-2-2Buildings 16 03126 i0191–1226,352
D-2-3Buildings 16 03126 i0201–2452,704
D-3Buildings 16 03126 i022Buildings 16 03126 i023D-3-1Buildings 16 03126 i0211–613,176
D-3-2Buildings 16 03126 i0241–1226,352
D-3-3Buildings 16 03126 i0251–2452,704
E-1Buildings 16 03126 i026Buildings 16 03126 i027E-1-1Buildings 16 03126 i0281–618,792
E-1-2Buildings 16 03126 i0291–1226,352
E-1-3Buildings 16 03126 i0301–2441,472
E-2Buildings 16 03126 i031Buildings 16 03126 i032E-2-1Buildings 16 03126 i0331–622,464
E-2-2Buildings 16 03126 i0341–1230,024
E-2-3Buildings 16 03126 i0351–2445,144
E-3Buildings 16 03126 i036Buildings 16 03126 i037E-3-1Buildings 16 03126 i0381–611,712
E-3-2Buildings 16 03126 i0391–1218,432
E-3-3Buildings 16 03126 i0401–2428,512
Table 2. Urban Morphological Parameters.
Parameter NameCalculation FormulaSchematic Diagram
BD B D = i = 1 n f i A s Buildings 16 03126 i041
FAR F A R = i = 1 n S i A s Buildings 16 03126 i042
AF A F = i = 1 n S i i = 1 n f i Buildings 16 03126 i043
SC S C = i = 1 n c i i = 1 n h i f i Buildings 16 03126 i044
OSR O S R = A s i = 1 n f i i = 1 n S i Buildings 16 03126 i045
SVF S V F = 1 i = 1 n s i n γ i n Buildings 16 03126 i046
S i is the product of the floor area ( A f i ) and the number of floors of each building ( F i ).
Table 3. EnergyPlus Parameter Settings.
Parameter TypeParameter NameSettings
Weather Data EPW file modified based on microclimate simulation results from the Urban Weather Generator (UWG)
Simulation Date From 21 December 2025 to 21 February 2026
ConstructionRoofU value = 0.8 W/m2·K
External WallU value = 0.8 W/m2·K
Floor SlabU value = 0.5 W/m2·K
WindowsU value = 2.2 W/m2·K (SHGC = 0.35)
Internal LoadsPeopleOccupied Area: 8 m2/person
LightingPower Density: 4 W/m2
Electrical EquipmentPower Density: 13 W/m2
HVAC SystemOperating Hours: 8:00–21:00
HVAC SystemHeating Setpoint Temperature18 °C
Infiltration1 ACH
Table 4. Mesh convergence study results for wind speed at the pedestrian-level sampling domain.
Mesh LevelNumber of CellsWind Speed (m/s)Relative Change
(1,1)83881.9829
(2,2)10,2551.532722.7%
(3,3)18,5761.40768.2%
(4,4)48,8071.36363.1%
Table 5. Wallacei Optimization Parameter Settings.
Algorithmic ParameterParameter EffectsParameter Settings
Population SizeTotal number of individuals per generation involved in the evolutionary algorithm60
Max GenerationsDetermines the longest number of generations for which the algorithm will run50
Crossover ProbabilityControls the probability that two parent individuals will exchange genes (parameters). The larger the value, the faster the emergence of novel populations, generally taking the value 0.1–0.990.9
Mutation ProbabilityThe probability that an individual undergoes random variation. High probability increases diversity but may deviate from the optimal solution; low probability tends to fall into local optimality.1.0
Crossover Distribution IndexSmaller values mean that the crossover process children are farther away from the parent, introducing more variation. Larger values mean that the crossover process children are close to the parent, retaining more of the parent’s characteristics.20
Mutation Distribution IndexA smaller value means that the mutation process offspring are far away from the parent, introducing more variation. Larger values mean that the offspring of the mutation process are close to the parent, retaining more of the parent’s characteristics.20
Random SeedThe value determines in which way the algorithm is initialized.1
Table 6. Iterative Trends of Pareto Solutions.
No. 9 (Pareto solutions)No. 24 (Pareto solutions)No. 284 (Pareto solutions)No. 440 (Pareto solutions)
Buildings 16 03126 i047Buildings 16 03126 i048Buildings 16 03126 i049Buildings 16 03126 i050
WS (m/s)1.247WS (m/s)1.742WS (m/s)1.403WS (m/s)1.152
EUI (kWh/m2)14.883EUI (kWh/m2)16.578EUI (kWh/m2)20.243EUI (kWh/m2)16.764
UTCI (°C)−16.995UTCI (°C)−16.953UTCI (°C)−16.925UTCI (°C)−16.953
No. 456 (Pareto solutions)No. 566 (Pareto solutions)No. 603 (Pareto solutions)No. 715 (Pareto solutions)
Buildings 16 03126 i051Buildings 16 03126 i052Buildings 16 03126 i053Buildings 16 03126 i054
WS (m/s)1.346WS (m/s)1.542WS (m/s)1.328WS (m/s)1.533
EUI (kWh/m2)18.119EUI (kWh/m2)17.026EUI (kWh/m2)17.08EUI (kWh/m2)17.794
UTCI (°C)−16.932UTCI (°C)−16.947UTCI (°C)−16.951UTCI (°C)−16.916
No. 811 (Pareto solutions)No. 822 (Pareto solutions)No. 930(Pareto solutions)No. 989 (Pareto solutions)
Buildings 16 03126 i055Buildings 16 03126 i056Buildings 16 03126 i057Buildings 16 03126 i058
WS (m/s)1.224WS (m/s)1.088WS (m/s)1.218WS (m/s)1.258
EUI (kWh/m2)14.867EUI (kWh/m2)15.426EUI (kWh/m2)14.711EUI (kWh/m2)14.879
UTCI (°C)−16.996UTCI (°C)−16.955UTCI (°C)−17UTCI (°C)−16.991
No. 1125 (Pareto solutions)No. 1133 (Pareto solutions)No. 1195 (Pareto solutions)No. 1295 (Pareto solutions)
Buildings 16 03126 i059Buildings 16 03126 i060Buildings 16 03126 i061Buildings 16 03126 i062
WS (m/s)1.609WS (m/s)1.581WS (m/s)1.250WS (m/s)1.365
EUI (kWh/m2)16.704EUI (kWh/m2)16.789EUI (kWh/m2)19.19EUI (kWh/m2)14.669
UTCI (°C)−16.945UTCI (°C)−16.926UTCI (°C)−16.943UTCI (°C)−17.013
No. 1398 (Pareto solutions)No. 1462 (Pareto solutions)No. 1494 (Pareto solutions)No. 1500 (Pareto solutions)
Buildings 16 03126 i063Buildings 16 03126 i064Buildings 16 03126 i065Buildings 16 03126 i066
WS (m/s)1.201WS (m/s)1.609WS (m/s)1.270WS (m/s)1.282
EUI (kWh/m2)15.952EUI (kWh/m2)19.575EUI (kWh/m2)14.876EUI (kWh/m2)14.853
UTCI (°C)−16.955UTCI (°C)−16.897UTCI (°C)−16.982UTCI (°C)−16.994
No. 1610 (Pareto solutions)No. 1641(Pareto solutions)No. 1642(Pareto solutions)No. 1673(Pareto solutions)
Buildings 16 03126 i067Buildings 16 03126 i068Buildings 16 03126 i069Buildings 16 03126 i070
WS (m/s)1.048WS (m/s)1.693WS (m/s)1.303WS (m/s)1.546
EUI (kWh/m2)14.986EUI (kWh/m2)18.598EUI (kWh/m2)14.659EUI (kWh/m2)17.285
UTCI (°C)−16.969UTCI (°C)−16.914UTCI (°C)−17.014UTCI (°C)−16.947
Table 7. Clustering Results of Non-Dominated Solutions.
ClusterDatasetCluster Centers
WS (m/s)EUI (kWh/m2)UTCI (°C)
Cluster 1101.2293714.8809−16.99081
Cluster 281.4626716.77225−16.94704
Cluster 331.4205419.66933−16.92139
Cluster 431.5237618.17033−16.92097
Table 8. Multicollinearity test results for urban morphological parameters.
ParameterVIFDegree of Multicollinearity
AF138Severe
BD190Severe
FAR4448Severe
OSR4715Severe
SC1.32Acceptable
SVF1.42Acceptable
Table 9. Loadings of the Building Intensity Index (BI).
ParameterAFBDFAROSR
BI loadings−0.46−0.26+0.60+0.60
Table 10. Partial correlation analysis of non-redundant parameters and EUI.
ParameterPartial rp-Value
BI0.138<0.001
SC−0.863<0.001
SVF−0.219<0.001
Table 11. Partial correlation analysis of non-redundant parameters and WS.
ParameterPartial rp-Value
BI0.355<0.001
SC−0.569<0.001
SVF0.0250.296
Table 12. Partial correlation analysis of non-redundant parameters and UTCI.
ParameterPartial rp-Value
BI0.147<0.001
SC−0.384<0.001
SVF0.0550.022
Disclaimer/Publisher’s Note: The statements, opinions and data contained in all publications are solely those of the individual author(s) and contributor(s) and not of MDPI and/or the editor(s). MDPI and/or the editor(s) disclaim responsibility for any injury to people or property resulting from any ideas, methods, instructions or products referred to in the content.