1. Introduction
With the advancement of the Yangtze River Economic Belt’s green development, waterfront excavation projects are increasing rapidly. Unlike inland excavations, the sharp-bend and rapid-flow sections of the Yangtze River feature special hydrogeological conditions [
1,
2]: large river-stage fluctuations (over 17 m), high permeability (highly permeable gravel layers), and complex flow patterns (maximum velocity up to 6 m/s). Under such conditions, the coupled effects of superimposed unloading and seepage disturbance during multi-pit excavation can readily induce deformation of adjacent building piles, threatening structural safety.
Under the aforementioned complex hydrogeological conditions, simultaneous or sequential excavation of multiple foundation pits generates a pronounced superimposed unloading effect on the surrounding soil, which poses a far greater influence on the deformation of adjacent building piles than single-pit excavation. Among the resulting challenges, controlling ground settlement between pits and horizontal displacement of piles emerges as a critical engineering difficulty. Nevertheless, existing studies have yet to systematically clarify how key parameters—such as excavation sequence, pit spacing, and depth ratio—regulate this superimposed effect and subsequently affect pile deformation and inter-pit settlement. Therefore, systematic research is urgently needed to address these knowledge gaps.
The impact of foundation pit excavation on adjacent building piles has been extensively studied. In the field of passive piles, Poulos et al. [
3] proposed a two-stage analysis method, and Huang et al. [
4] developed a simplified approach for the lateral response of pile groups in non-homogeneous soils. Regarding settlement induced by dewatering, Terzaghi’s effective-stress principle [
5] and Biot’s three-dimensional consolidation theory [
6] laid the theoretical foundation [
7,
8]. However, most existing studies focus on single excavations and are limited to soft soil areas.
For multi-pit excavations, some researchers have begun to investigate the superimposed effects of pit group. Shen et al. [
9] found that pit group causes superimposition of ground settlement; Wang et al. [
10] summarized deformation control techniques for large-scale grouped pits in soft soils. He et al. [
11] indicated that simultaneous excavation can reduce settlements of sensitive buildings, and Tao et al. [
12] reported that simultaneous excavation produced a favorable deformation control effect in their case study. Hu et al. [
10] quantified how zoned excavation can reduce ground settlement by more than 25%. Regarding the complex water environment of the Yangtze River, existing studies have mainly focused on deep-water cofferdams and anti-seepage technologies for bridge foundations [
13,
14,
15], with little systematic reporting on the superimposed effects of waterfront multi-pit clusters and the associated deformation control of adjacent building piles.
Existing studies have examined groundwater control in retained excavations and gravel aquifers [
16,
17,
18,
19,
20], excavation-induced pile response [
21], and interaction effects between adjacent excavations or nearby underground structures [
22,
23,
24]. However, these topics have usually been treated separately, with each research stream emphasizing a different aspect of the excavation problem. Groundwater-related studies mainly focus on seepage control, drawdown and settlement, whereas pile-response studies generally emphasize the mechanical response of piles to excavation-induced soil movement. Studies on adjacent excavations or pit groups have provided useful insights into excavation sequence and spacing effects, but they rarely combine these factors with river-stage disturbance and highly permeable gravel aquifers. Therefore, limited evidence is available for cases that simultaneously involve river-stage variation, highly permeable pebble-gravel deposits, excavation sequence, and pit-group spacing. This gap motivates a coupled seepage–stress analysis of the Yidu waterfront multi-pit project.
Groundwater-induced deformation and pit-to-pit interaction are two key issues in the excavation of adjacent foundation pits in highly permeable pebble or gravel strata. In sand–gravel aquifers, dewatering can significantly change the seepage field, groundwater level, water inflow, and ground settlement [
25]. Field and numerical studies have shown that cut-off wall depth, pumping well depth, and hydraulic head difference are important factors controlling groundwater drawdown and deformation in gravel aquifers [
26,
27]. For foundation pits located in river terrace deposits, the high permeability of sand–gravel layers and possible river recharge can further increase the complexity of groundwater control [
28]. Nevertheless, most existing groundwater-control studies are based on single-pit or isolated dewatering systems, and they provide limited discussion of how groundwater redistribution interacts with the superimposed unloading effects generated by multiple adjacent pits. Therefore, groundwater effects should be carefully considered together with excavation sequence and pit-group interaction in deep excavations near rivers or other water bodies [
29].
For adjacent foundation pits and foundation pit groups, excavation sequence and pit spacing strongly affect retaining wall displacement, ground settlement, and structural response. Recent studies on foundation pit groups indicate that smaller spacing–depth ratios can lead to stronger pit-to-pit interaction, especially when the pit spacing is less than the excavation depth [
18]. Field monitoring also confirms that adjacent pits may produce deformation coupling during staged or simultaneous excavation [
19]. Numerical studies further show that different excavation sequences can change the deformation pattern of retaining structures [
30]. In addition to continuum finite-element approaches, discrete-element modeling has also been used to characterize the micro-mechanical behavior of geomaterials and composite materials, such as polymer-modified asphalt mixtures [
31]. For two adjacent pits excavated simultaneously, the pit-to-pit interaction can cause asymmetric wall movement and additional ground settlement [
32]. However, most pit-group studies have been conducted for urban soft-soil excavations or underground structures, and their conclusions may not be directly transferable to waterfront gravel deposits with strong river–groundwater connectivity. In addition, few studies have quantified whether opposite-side excavations can produce a counteracting effect on adjacent pile displacement. A carefully coordinated excavation sequence is therefore necessary to reduce adverse effects on nearby structures and surrounding ground [
22].
In summary, the research gaps lie in the lack of quantitative understanding of how key parameters—excavation sequence, pit spacing, and depth ratio—influence the horizontal displacement of adjacent piles and inter-pit ground settlement under the highly permeable gravel layer and large water-level fluctuation conditions typical of sharp-bend and rapid-flow sections of the Yangtze River. In particular, two core questions remain unanswered: whether simultaneous excavation produces a counteracting (offsetting) effect, and how the inter-pit ground deformation pattern evolves with pit spacing. To address these gaps, this study relies on the Yidu multi-pit project and employs seepage–stress-coupled numerical simulations to systematically reveal the superimposed effect mechanisms of multi-pit excavation and to identify project-specific reference values for key control parameters.
2. Methodology
2.1. Project Description and Site Conditions
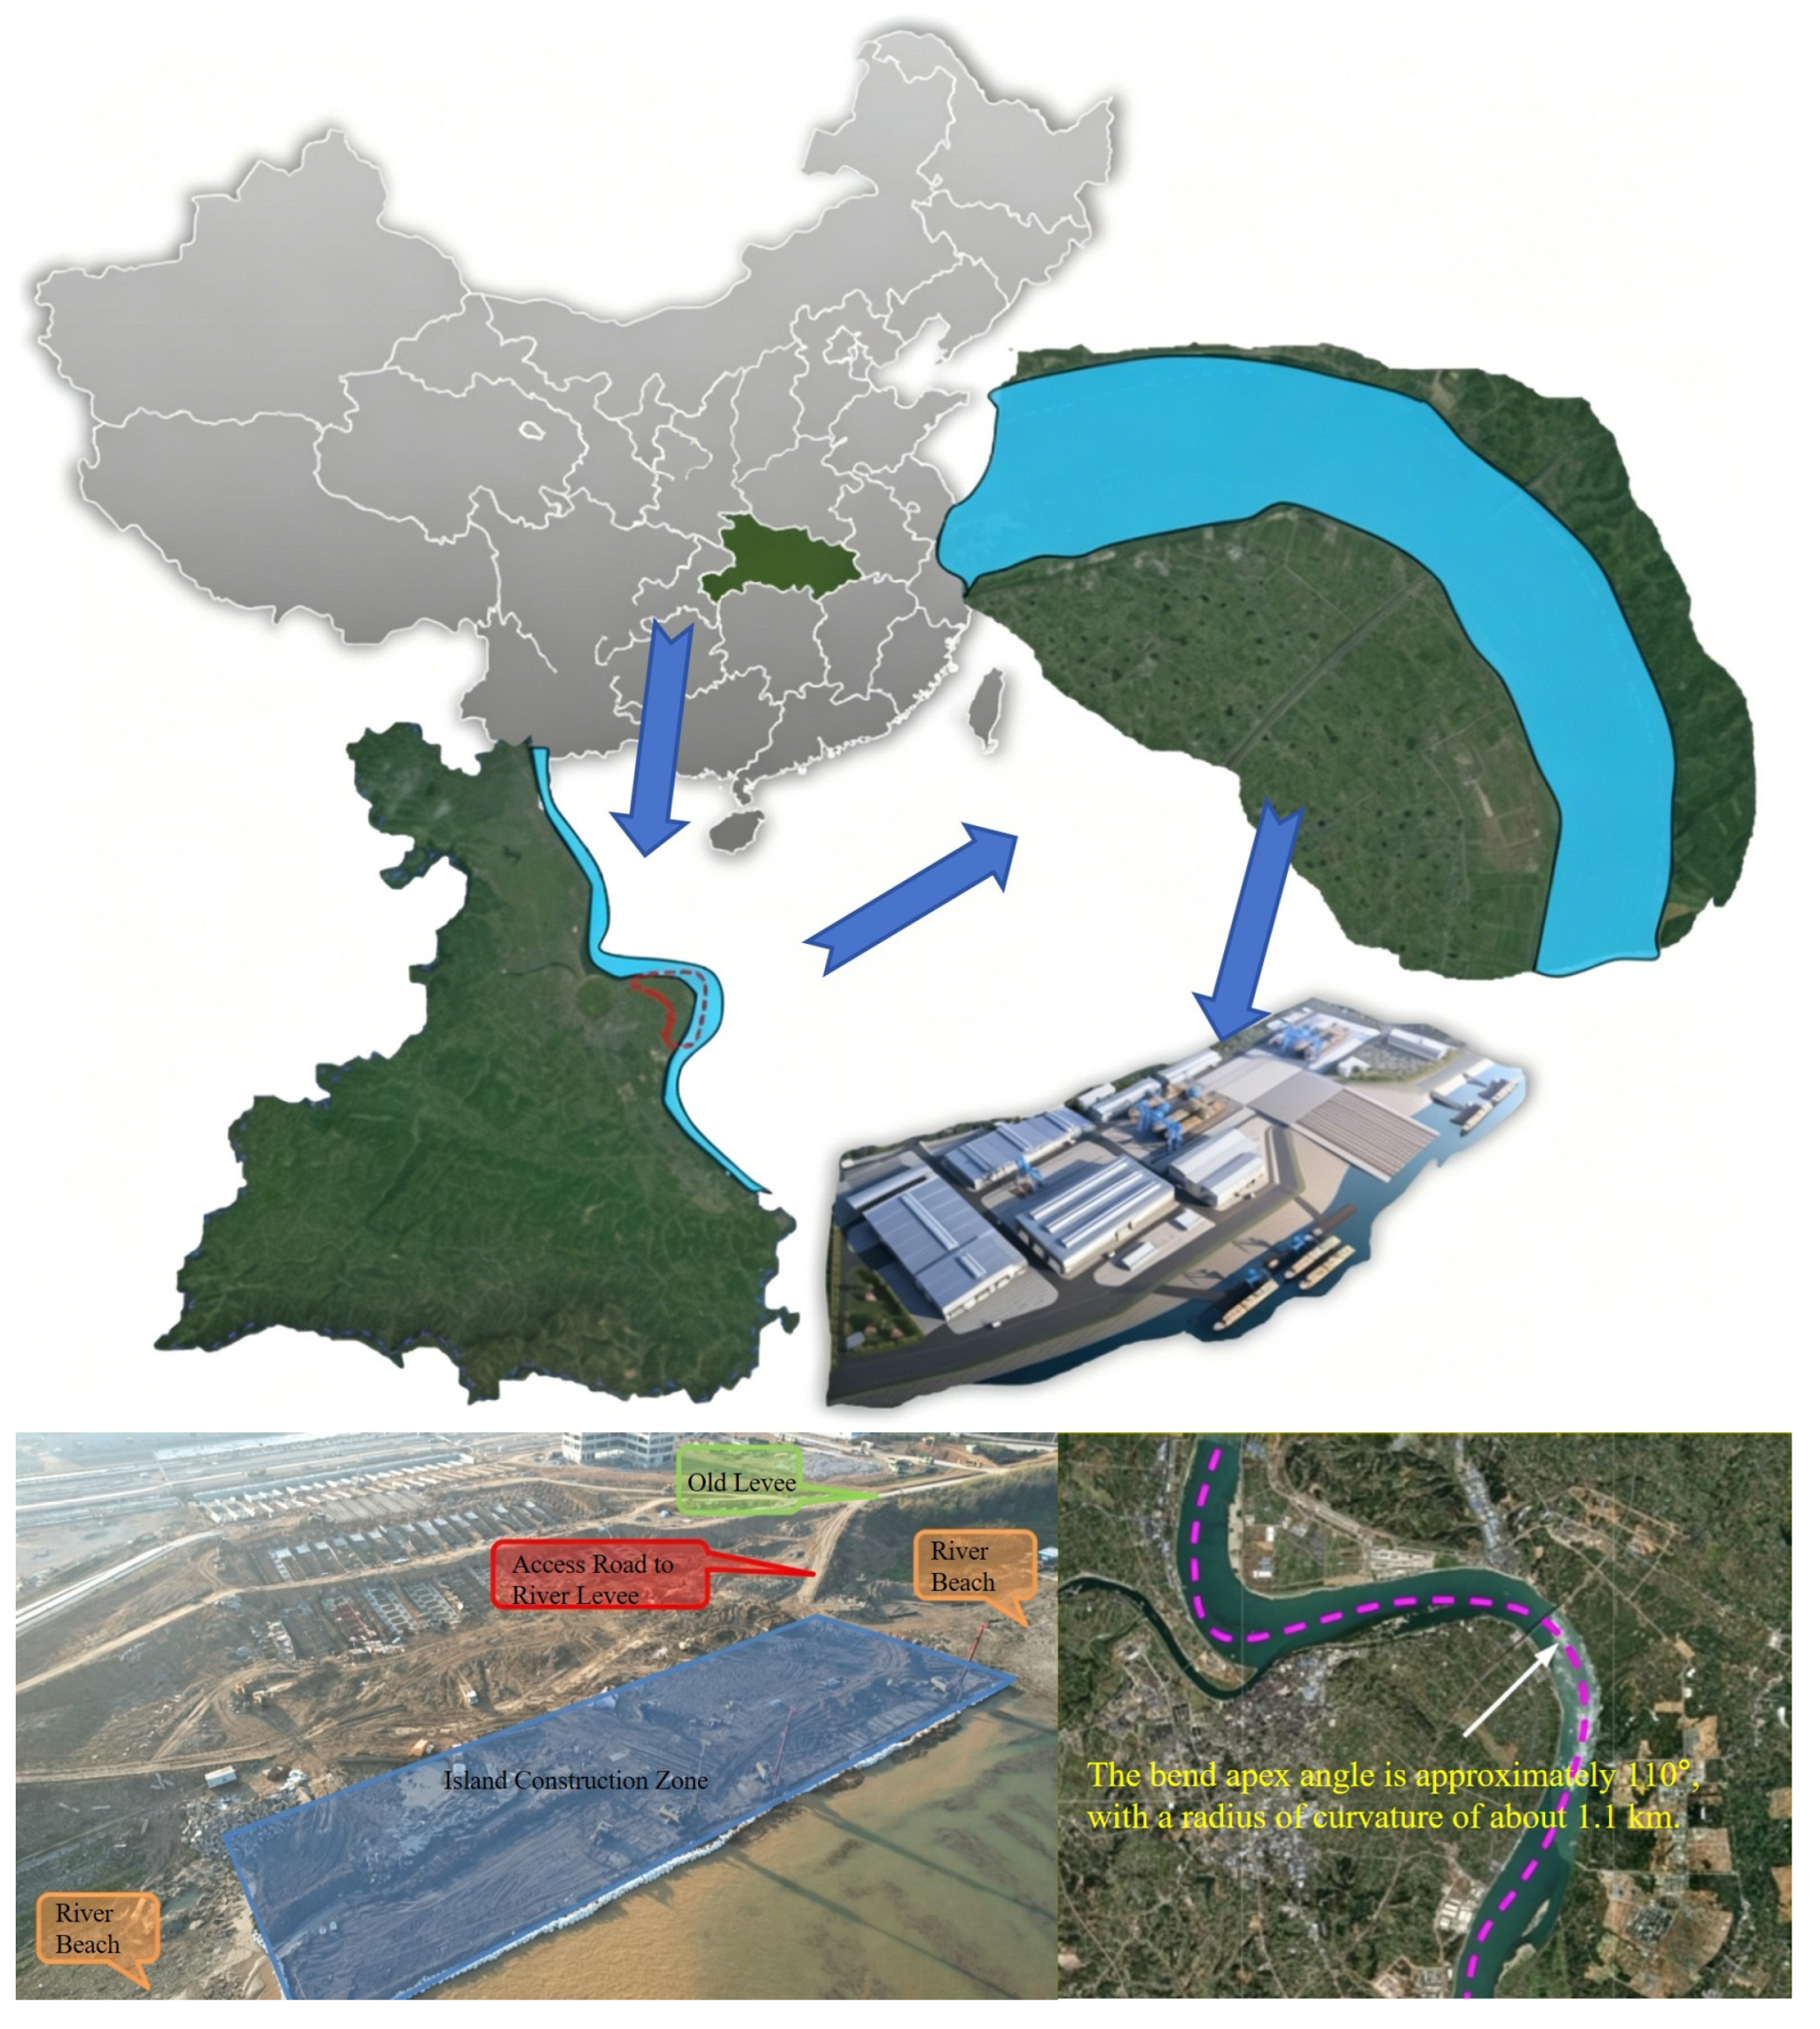
The study was based on the Yidu Green Intelligent Shipbuilding Industrial Park project in Yidu, China. The project is located on the right bank of the Yangtze River, within a sharp-bend and rapid-flow river reach. The construction area was formed on a waterfront working platform approximately 200 m long and 70 m wide. During the dry-season construction period, the ground elevation of the working platform was approximately 37.0 m, and the adjacent Yangtze River stage was approximately 36.1 m.
The investigated excavation system consisted of one deep slipway foundation pit and six shipbuilding foundation pits. The slipway pit had a plan size of approximately 150 m by 78.8 m and an excavation depth of 10.5 m. Each shipbuilding pit was excavated to approximately 10.0 m. The pits were arranged close to an existing pile-supported production auxiliary building, with minimum clear distances of approximately 28.0 m (slipway pit) and 27.5 m (shipbuilding pits) from the building facade. This layout produced a typical waterfront multi-pit excavation problem involving excavation unloading, seepage redistribution, and pile–soil interaction.
2.2. Geological and Hydrogeological Conditions
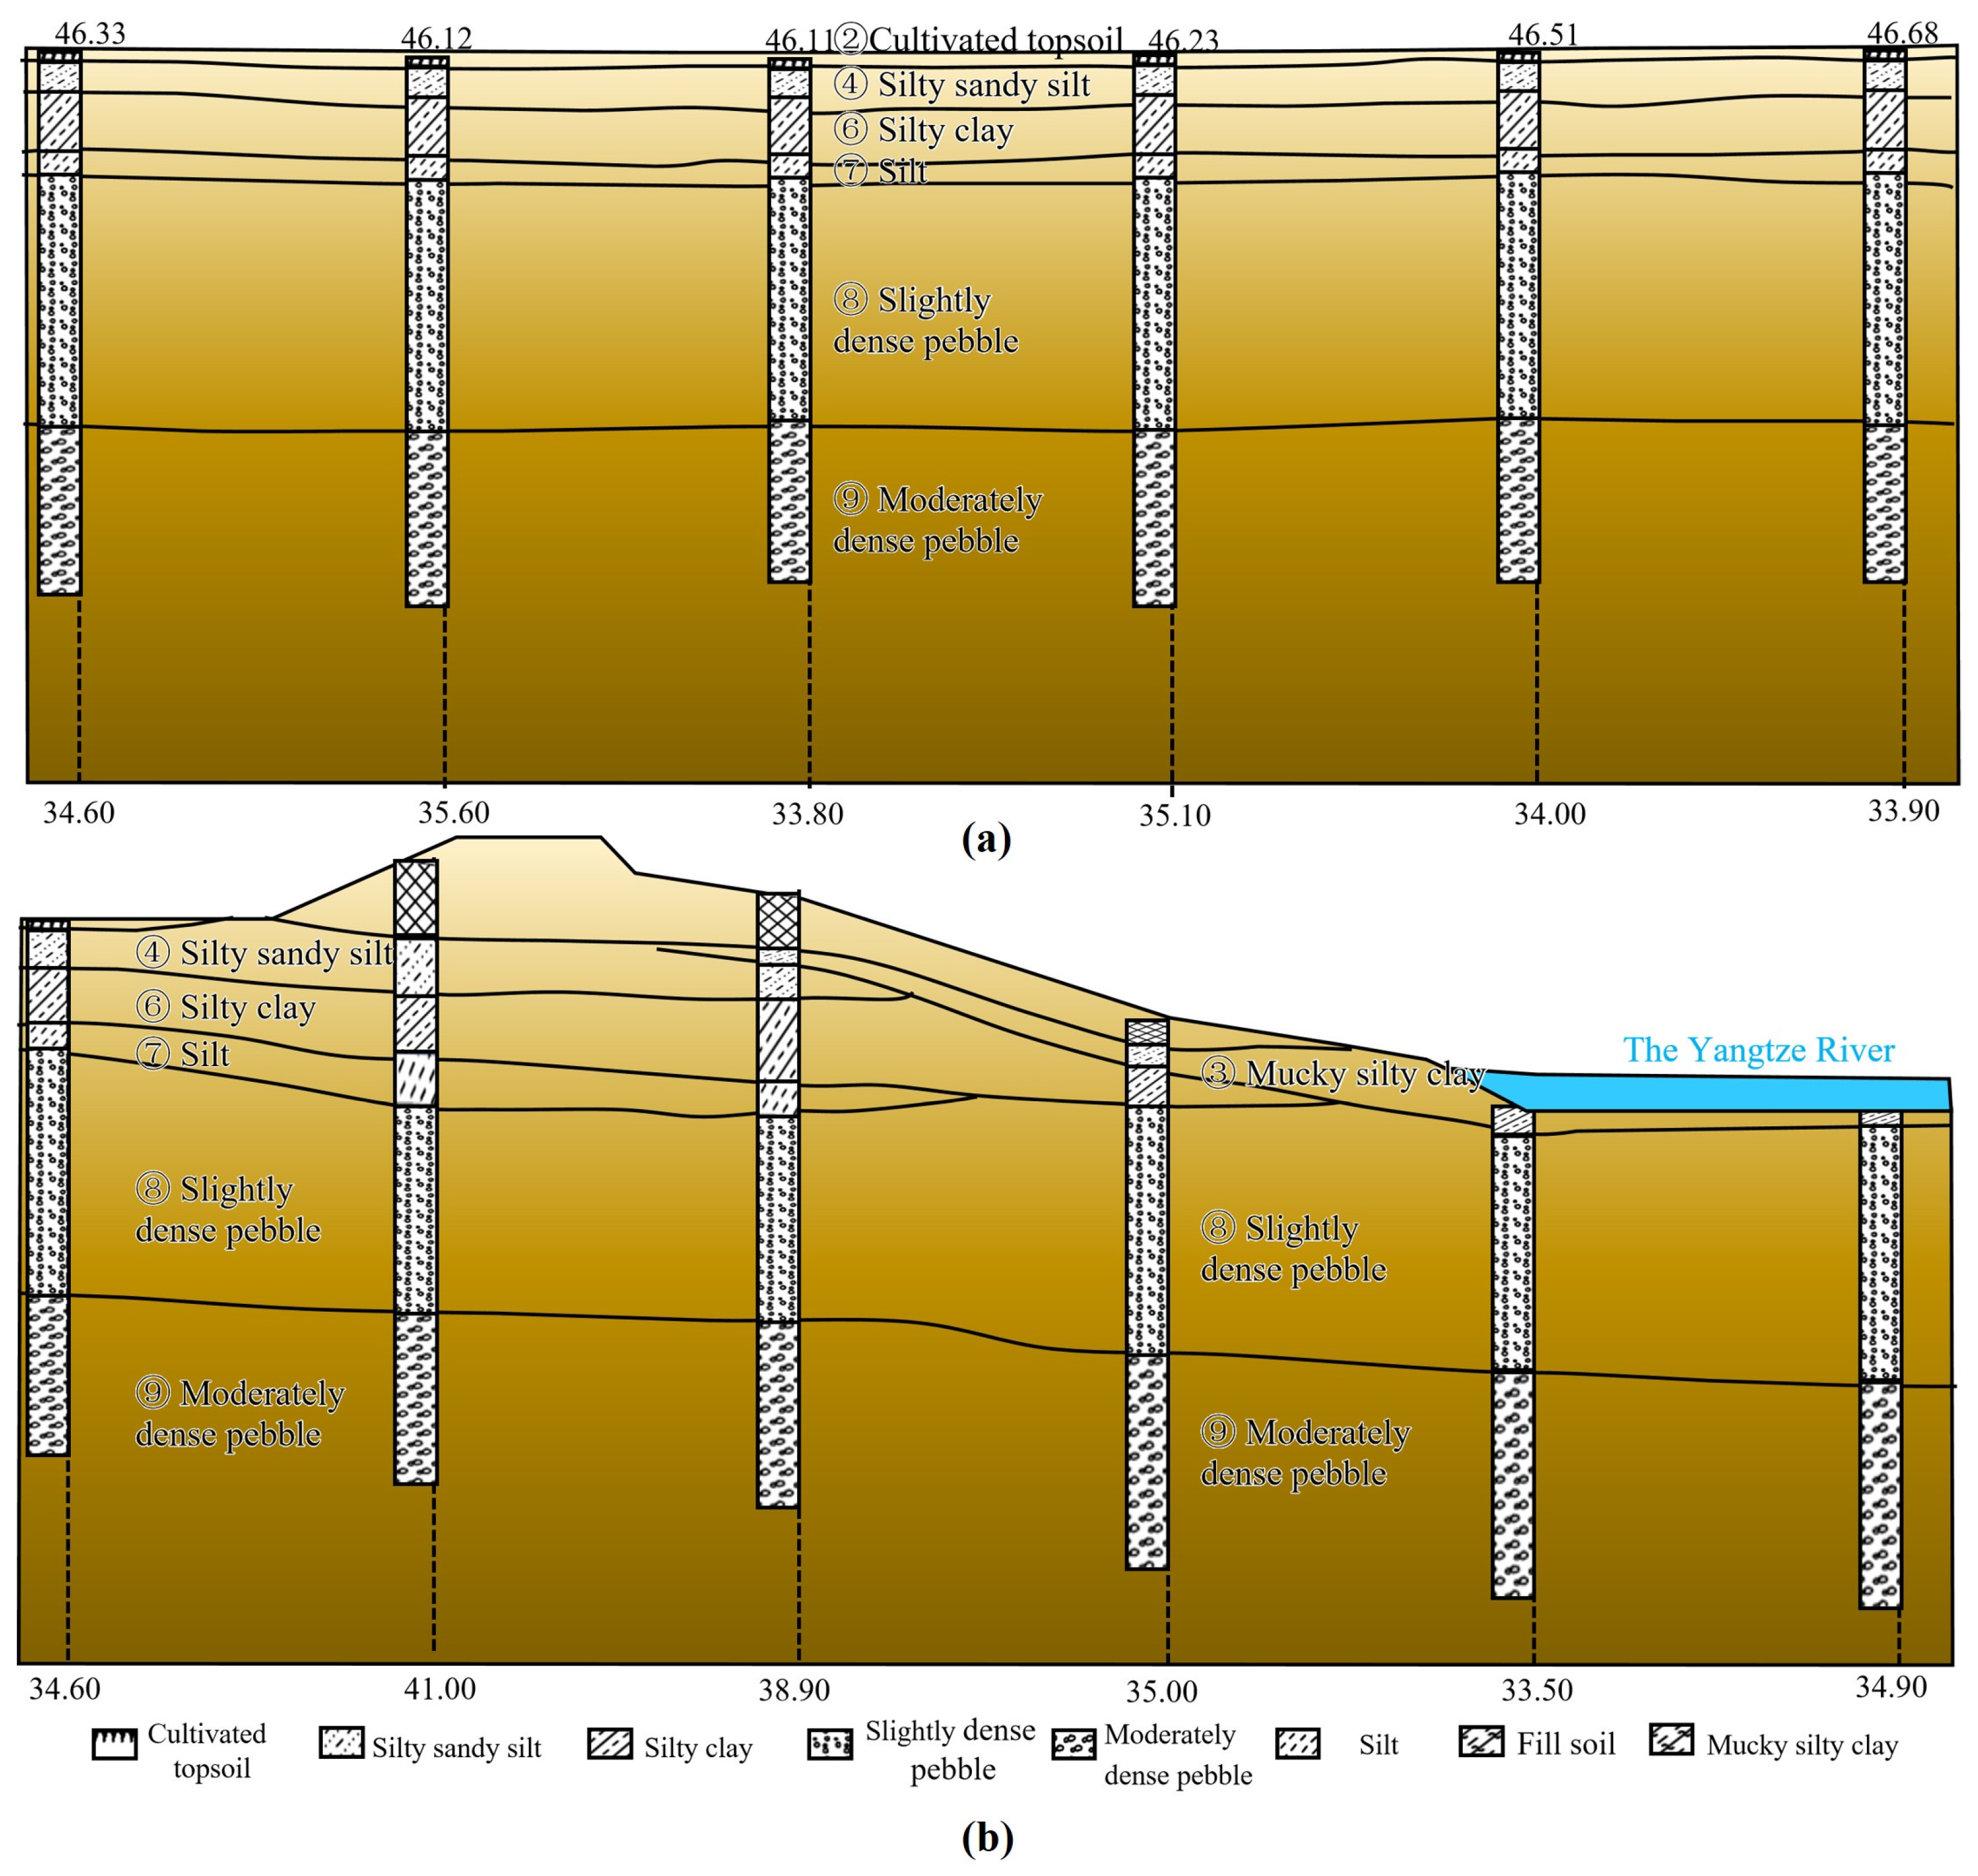
As illustrated in
Figure 1, the project site is located on the first terrace of the right bank of the Yangtze River. The land-side ground elevation ranges from 45.40 m to 46.80 m, whereas the water-side elevation ranges from 36.15 m to 40.20 m. The overall terrain is relatively flat, but the site is directly affected by river stage, riverbank seepage, and local scour in the curved river reach.
According to the geological investigation report, the ground profile was divided into nine layers from top to bottom, as shown in
Figure 2 and
Table 1, including fill soil, cultivated topsoil, muddy silty clay, sandy silt, silty clay, stiff silty clay, silt, slightly dense pebble, and moderately dense pebble. The upper fill, topsoil, and soft cohesive layers are relatively loose and compressible. The lower pebble layers are denser and form the main permeable strata at the site. The slightly dense pebble layer contains pebbles with particle sizes mainly between 2 cm and 8 cm, with local boulders. The moderately dense pebble layer contains a higher pebble fraction and locally includes boulders with diameters up to approximately 60 cm.
The Yangtze River is the dominant surface-water body around the project area, and the site groundwater is mainly recharged by river water. Hydrological records from the nearby Yidu station indicate a multi-year average river stage of approximately 38.62 m. Recent maximum river stages have reached approximately 49.18 m, while the maximum river stage during the September to January construction window was approximately 41.00 m. The curved reach is characterized by nonuniform flow, transverse circulation, eddy scour, and strong seasonal variation in hydraulic action. These conditions may increase hydraulic disturbance around the waterfront pits.
The high-permeability pebble strata are hydraulically connected to the Yangtze River, so the groundwater level can respond rapidly to river-stage fluctuations. This hydraulic connection increases the difficulty of groundwater control during excavation and may amplify pore-pressure redistribution and effective-stress variation during staged dewatering. The combined effects of permeable pebble strata, river-water recharge, excavation unloading, and groundwater drawdown were therefore incorporated into a three-dimensional seepage–stress-coupled numerical analysis. In this study, the gravel aquifer was represented as an equivalent continuum, and the seepage field was governed by Darcy flow. This assumption is suitable for engineering-scale deformation analysis, but local non-Darcy flow near pumping wells or seepage concentration zones was not explicitly considered.
2.3. Numerical Model and Boundary Conditions
To model staged seepage–stress response during excavation and dewatering, three-dimensional finite-element models were established using Midas GTS NX 2022 (
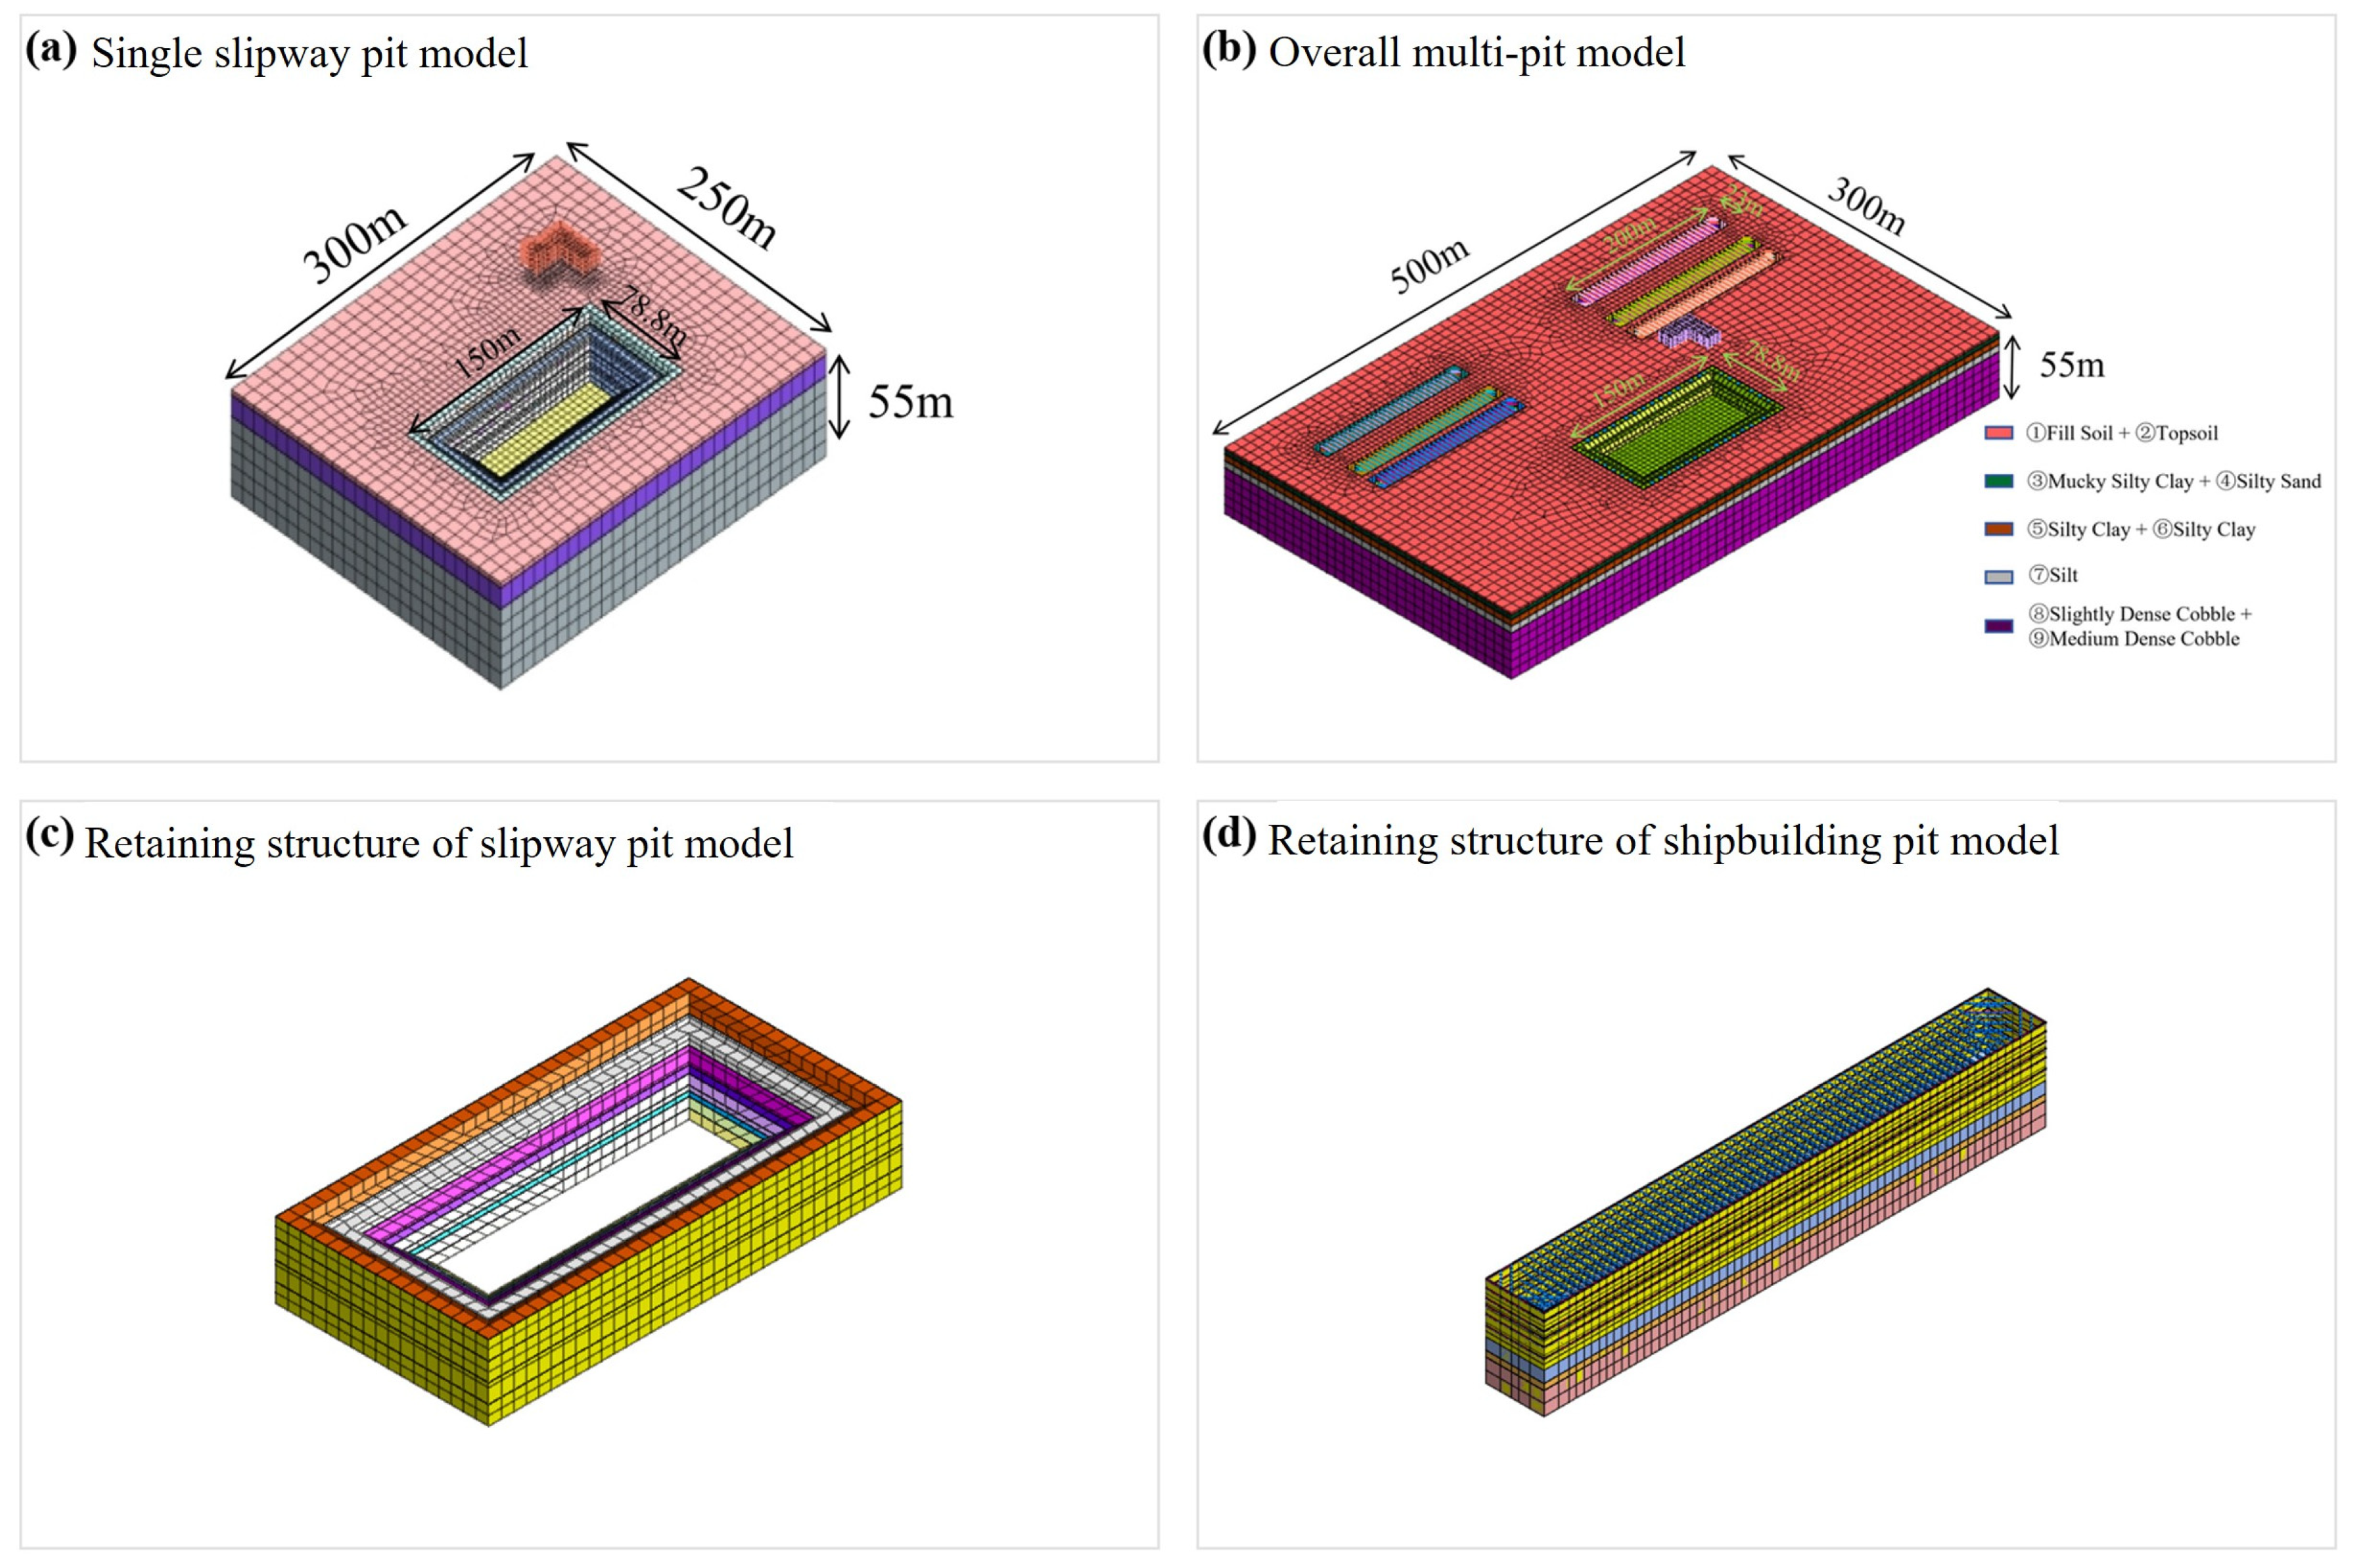
https://www.midasit.com/) (R1), MIDAS Information Technology Co., Ltd., Seongnam, Republic of Korea. According to the analysis objective, two types of models were developed: a single-pit model and a global multi-pit model. The single-pit model was used to simulate the excavation and dewatering process of the slipway pit. It also served for model validation and single-factor parametric analyses. The global multi-pit model was further extended from the independent model by incorporating one slipway pit, six shipbuilding pits, and the adjacent production auxiliary building. This model was used to investigate the effects of excavation sequence, pit spacing, excavation depth, and support parameters on pile deformation and inter-pit ground movement.
As shown in
Figure 3, the single-pit model was 300 m long, 250 m wide, and 55 m high. The slipway pit had a plan size of approximately 150 m × 78.8 m and an excavation depth of 10.5 m. The model boundaries were placed at least three times the excavation depth away from the pit edge to reduce boundary effects on the calculated deformation and seepage field. The global multi-pit model was approximately 500 m long, 300 m wide, and 55 m high. A convergence analysis was conducted for the model dimensions by comparing key deformation responses under different computational domains. The results showed only minor changes in peak pile displacement and ground deformation after further domain enlargement, indicating that the adopted model dimensions were sufficient to reduce boundary effects. It explicitly represented the spatial relationship among the slipway pit, the shipbuilding pit group, and the adjacent building. Each shipbuilding pit was 200 m long and 23 m wide, with an excavation depth of 10 m. The minimum clear distance was approximately 27.5 m between the shipbuilding pits and the production auxiliary building, and approximately 28 m between the slipway pit and the building.
Both models used the same stratigraphic profile, soil constitutive models, and boundary-condition settings to ensure comparability among different cases. The bottom boundary was fixed in the vertical direction, and the lateral boundaries were restrained in the horizontal direction. Both models used the same stratigraphic profile, soil constitutive models, and displacement-boundary settings to ensure comparability among different cases. The bottom boundary was fixed in the vertical direction, and the lateral boundaries were restrained in the horizontal direction. By establishing both the single-pit model and the global multi-pit model, the analysis could capture the detailed excavation-dewatering response of a single pit while also representing soil unloading, seepage redistribution, and pile–soil interaction under the combined effects of multiple excavations. By establishing both the single-pit model and the global multi-pit model, the analysis could capture the detailed excavation-dewatering response of a single pit while also representing soil unloading, seepage redistribution, and pile–soil interaction under the combined effects of multiple excavations.
For displacement boundary conditions, vertical displacements are fixed at the bottom boundary. This simulates the incompressibility of the deep foundation strata. Horizontal displacements are restrained on the four lateral boundaries. This represents the stationary state of the soil far from the excavation zone. The vertical displacement of the lateral boundaries was not restrained, allowing vertical ground deformation near the far-field boundaries.
For hydraulic boundaries, all elevations were reported using the same site elevation datum. The construction ground elevation of the slipway pit was approximately +37.0 m, and the final excavation bottom elevation was +26.5 m. According to the site investigation and construction documents, the groundwater level was generally at elevations of +35.21 to +37.46 m, while the Yangtze River water level near the site was approximately +35.50 to +36.50 m during the construction period. The river-facing side of the model was therefore assigned as a constant-head boundary to represent the hydraulic connection with the Yangtze River, whereas the other lateral boundaries and the bottom boundary were treated as impermeable zero-flux boundaries. In the river-stage comparison, the river stage was varied as +35 m, +37 m, +39 m, and +41 m. During staged excavation, the dewatering wells were simplified as prescribed-head boundaries at the well locations to reproduce the required groundwater-level control. According to the construction scheme, the groundwater level was lowered below +33.0 m, +29.5 m, and +26.0 m before the first, second, and third excavation stages, respectively. This prescribed-head treatment is suitable for reproducing the staged groundwater-control target in the numerical model, but it does not explicitly simulate the transient pumping rate of each dewatering well.
The project adopted open drainage, drainage ditches, sumps, deep wells, and steel sheet piles for groundwater control. The construction documents recorded 59 existing dewatering wells, with additional wells arranged near the pit crest and secondary platform when required. The well depth was about 35 m, and the well pipe diameter was about 250 mm. This information was used to define the staged dewatering process and the prescribed-head boundaries in the numerical model.
2.4. Constitutive Models and Material Parameters
Additional rotational constraints are applied to all piles to prevent rigid body rotation. The cut-off wall is rigidly connected to the surrounding soil. Interface elements at the pile–soil boundaries adopt a shear stiffness equal to 1% of the normal stiffness. This value is standard and recommended by the Midas GTS NX manual for granular soils. The interface and constraint settings were checked by comparing the calculated deformation pattern with the field monitoring results, and no abnormal rigid-body movement or unrealistic interface separation was observed during the staged excavation analysis.
The modified Mohr–Coulomb constitutive model was adopted for the soil. This elastoplastic model provides a practical representation of shear failure and overall deformation in engineering-scale excavation analysis. The model parameters were mainly obtained from the site geological investigation report, standard penetration tests, laboratory tests, and in situ pumping tests, as summarized in
Table 1. In the Table,
c denotes cohesion,
φ denotes the internal friction angle,
fd denotes the characteristic bearing capacity,
E0 denotes the deformation modulus,
Es1–2 denotes the compression modulus,
γ denotes the unit weight, and
k denotes the permeability coefficient. All permeability coefficients were converted to m/s to avoid unit inconsistency.
The gravel layers are Layers 8 and 9. Their permeability coefficients were assigned according to the in situ pumping-test results and the values used in the numerical model. The previously inconsistent unit expression of
k was corrected in
Table 1 and the text. The initial stress field was generated by geostatic stress analysis under self-weight. Poisson’s ratio, dilatancy angle, and the at-rest earth pressure coefficient K0 were assigned according to the site investigation information, the empirical Jaky relationship
K0 = 1 − sin
φ, and the MIDAS GTS NX material-model settings. Other advanced parameters, including stress-dependency parameters, tensile cut-off, and unloading/reloading stiffness, were not independently calibrated because corresponding laboratory tests were not available for all strata; therefore, they were assigned according to the MIDAS GTS NX default settings and common engineering practice.
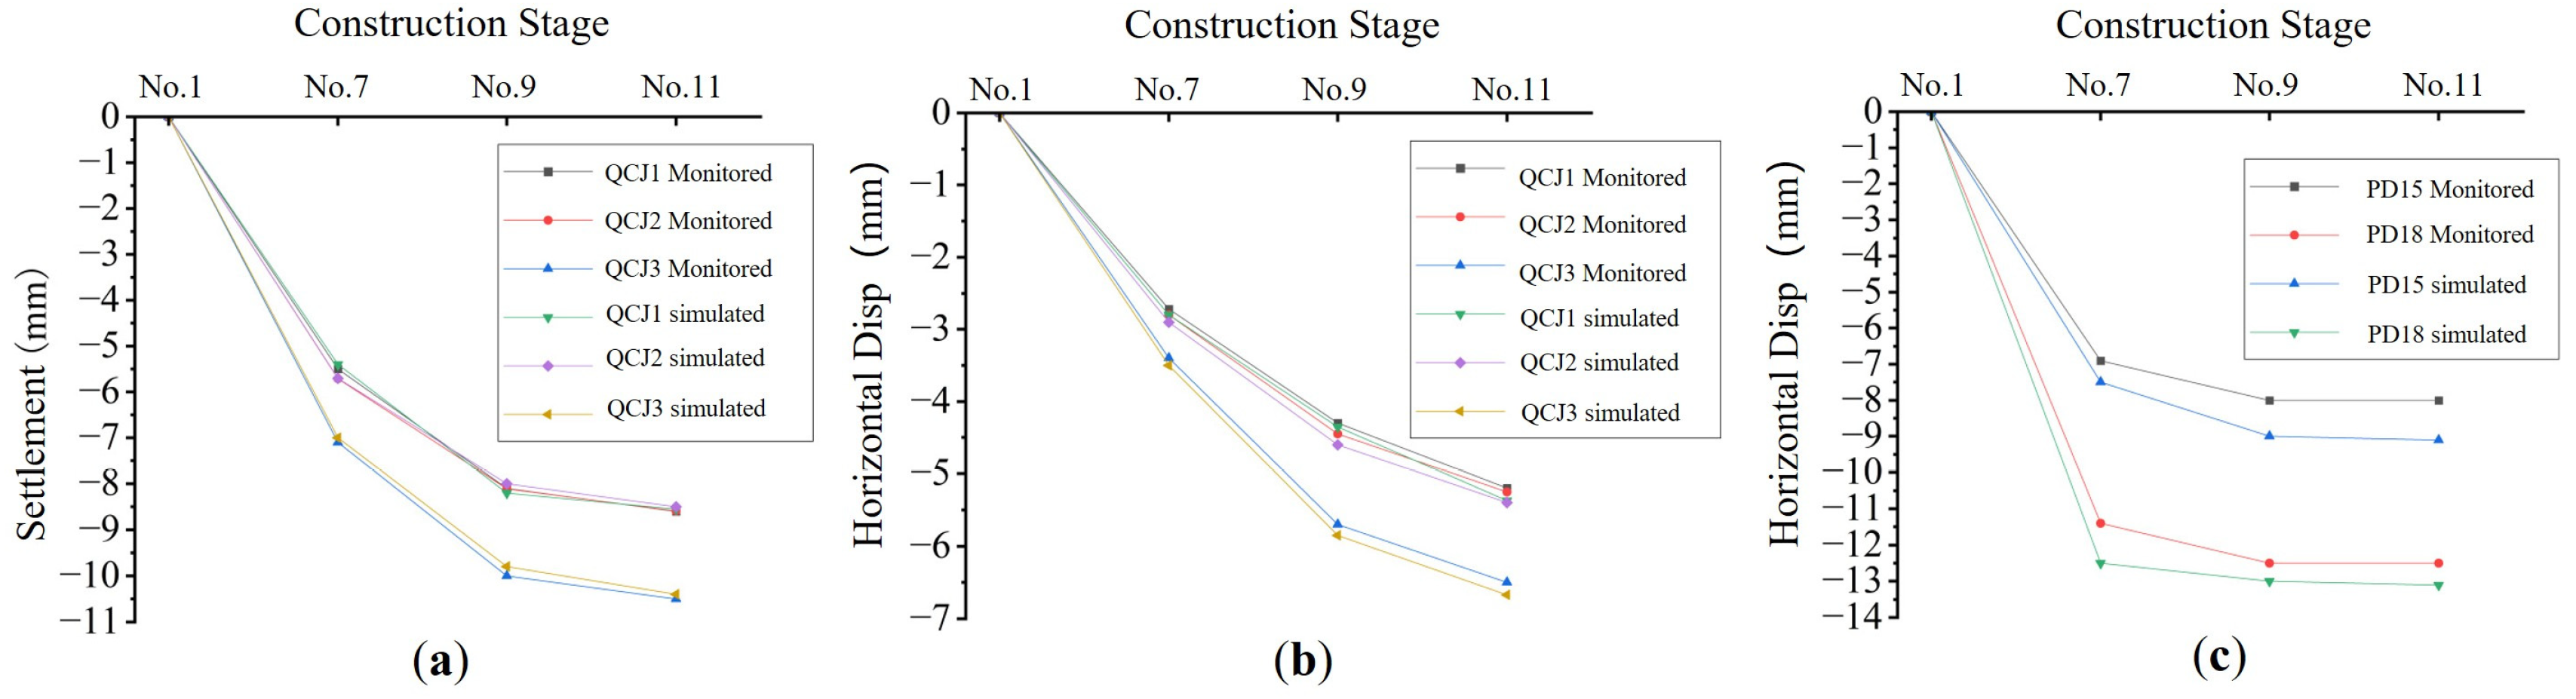
Because the main objective of this study was to compare deformation responses under different excavation and dewatering schemes, the modified Mohr–Coulomb model was considered adequate for capturing the overall deformation trend. Its adequacy was further evaluated through field-monitoring validation of the slipway-pit excavation. As shown in
Figure 4, the calculated building settlement, pile horizontal displacement, and retaining-wall displacement were generally consistent with the monitoring results, indicating that the adopted parameters and constitutive model can reproduce the main deformation response of this project. More advanced hardening models, such as the Hardening Soil or HS-Small model, may improve small-strain settlement prediction, but they require additional stiffness parameters that were not available for all strata. Therefore, the calculated thresholds and recommended values in this study should be interpreted as project-specific reference values rather than deterministic universal limits.
Steel sheet piles are made of Q235 steel. They are modeled as linear elastic with an elastic modulus of 206 GPa. This modulus is taken from the Chinese national standard GB/T 700-2006. Internal struts and waling beams use the same steel grade. Building piles are made of C30 concrete. They are also linear elastic with an elastic modulus of 30 GPa, according to GB 50010-2010. The pile diameter is 800 mm and the length is 22.5 m. These dimensions follow the as-built drawings of the existing auxiliary building.
The element types, cross-sectional dimensions, and material assignments for all structural components are summarized in
Table 2.
2.5. Mesh Generation and Construction Simulation
A mixed tetrahedral mesh was used for the numerical model. The mesh was locally refined in high-stress and large-deformation regions, including the pit interior, retaining structures, building piles, and pile–soil interaction zones. To reduce the influence of mesh size on the calculated deformation, a mesh-independence verification was conducted using three mesh schemes: a coarse mesh with an element size of approximately 2 m in the pit area, a baseline mesh with an element size of approximately 1 m, and a fine mesh with an element size of approximately 0.5 m. The maximum horizontal displacement of the retaining structure and the maximum settlement of the building pile were selected as the evaluation indices. The maximum relative difference in the key deformation responses among the different mesh schemes was less than 3%, and the difference between the baseline and fine meshes was also less than 3%, indicating that further mesh refinement had limited influence on the calculated deformation. Therefore, the baseline mesh was adopted in the subsequent analyses, with an element size of approximately 1 m in the refined regions and gradually increasing to approximately 8 m in areas far from the excavation.
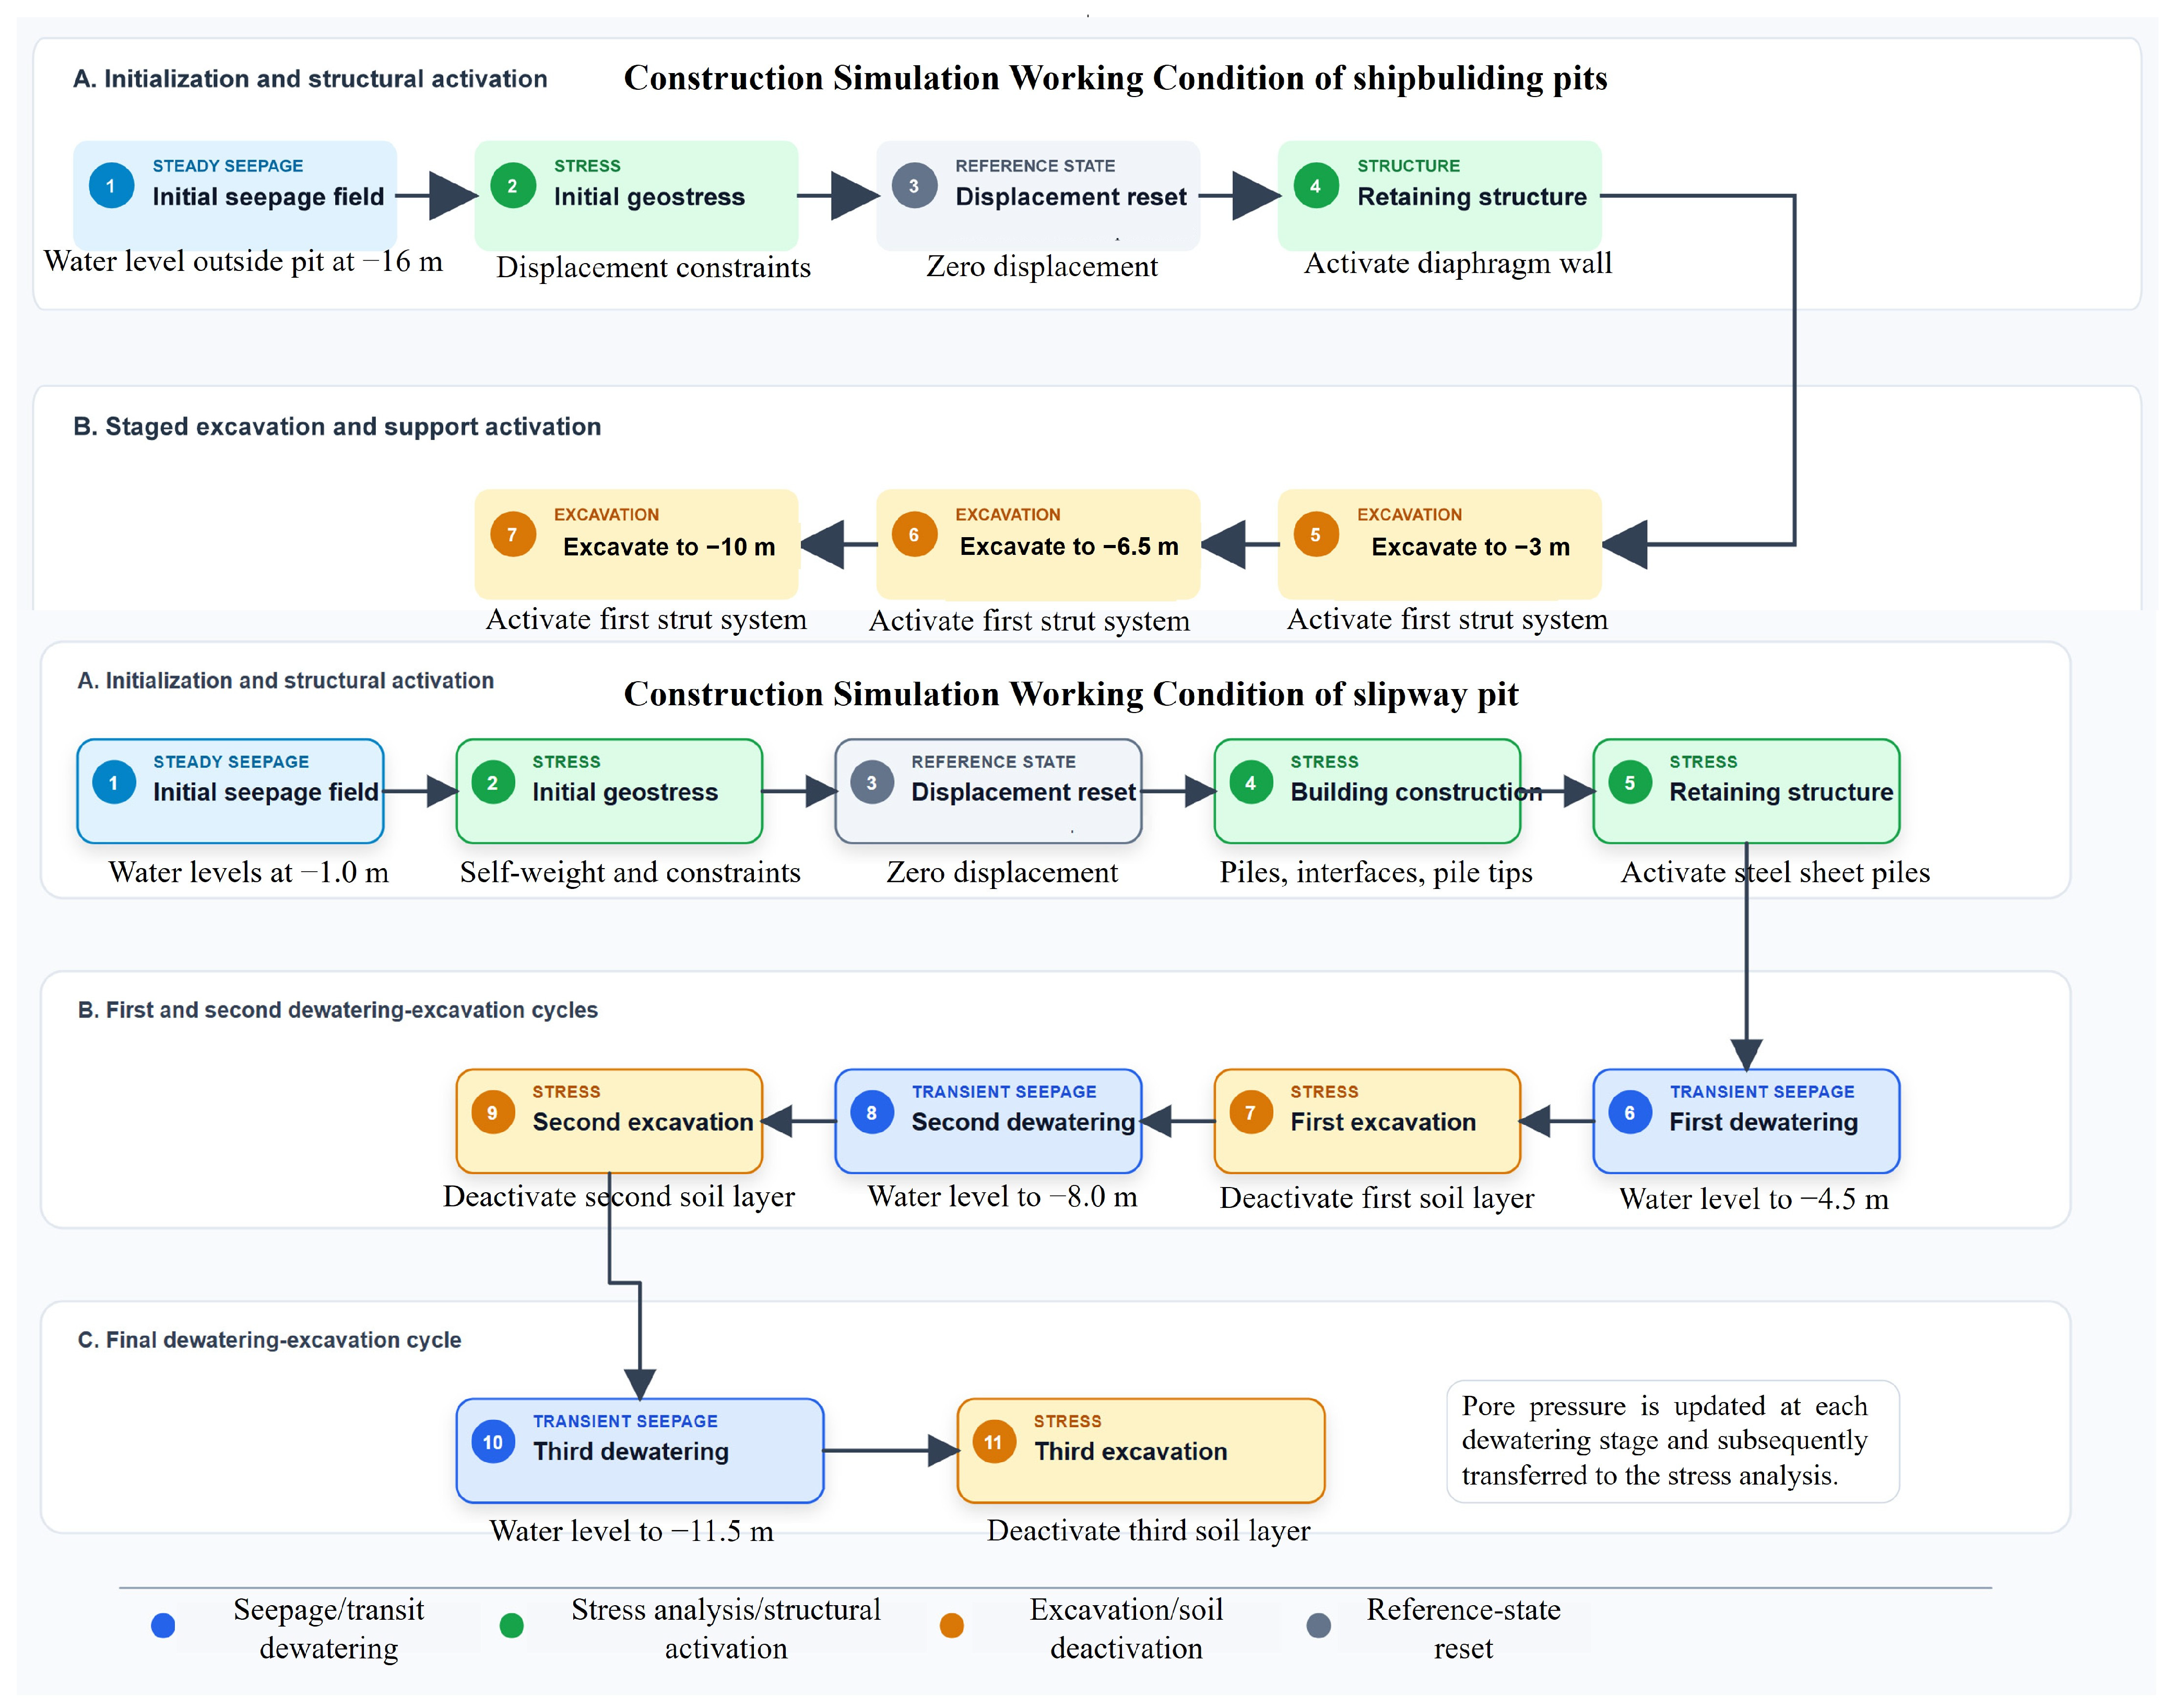
Numerical simulation of the construction process was performed using the element deactivation and reactivation technique. Separate analyses were carried out for the shipbuilding pit and the slipway pit, with 7 and 11 calculation steps defined respectively. As detailed in
Figure 5, each step corresponds strictly one-to-one with the actual construction progress documented on site. The sequence began with the initial steady-state seepage analysis and geostatic stress analysis, followed by building construction, retaining-structure installation, three dewatering stages, and three excavation stages. A sequential seepage–stress coupling procedure was used. In this study, seepage–stress coupling refers to a staged sequential procedure rather than a fully monolithic hydro-mechanical formulation. At each dewatering stage, the seepage field was first updated with the corresponding hydraulic boundary conditions. The resulting pore-pressure distribution was then transferred to the stress analysis to calculate the effective-stress change and deformation response. This procedure captures the main influence of staged dewatering on excavation-induced deformation while maintaining a transparent and reproducible calculation process.
2.6. Multi-Pit Excavation Scenarios
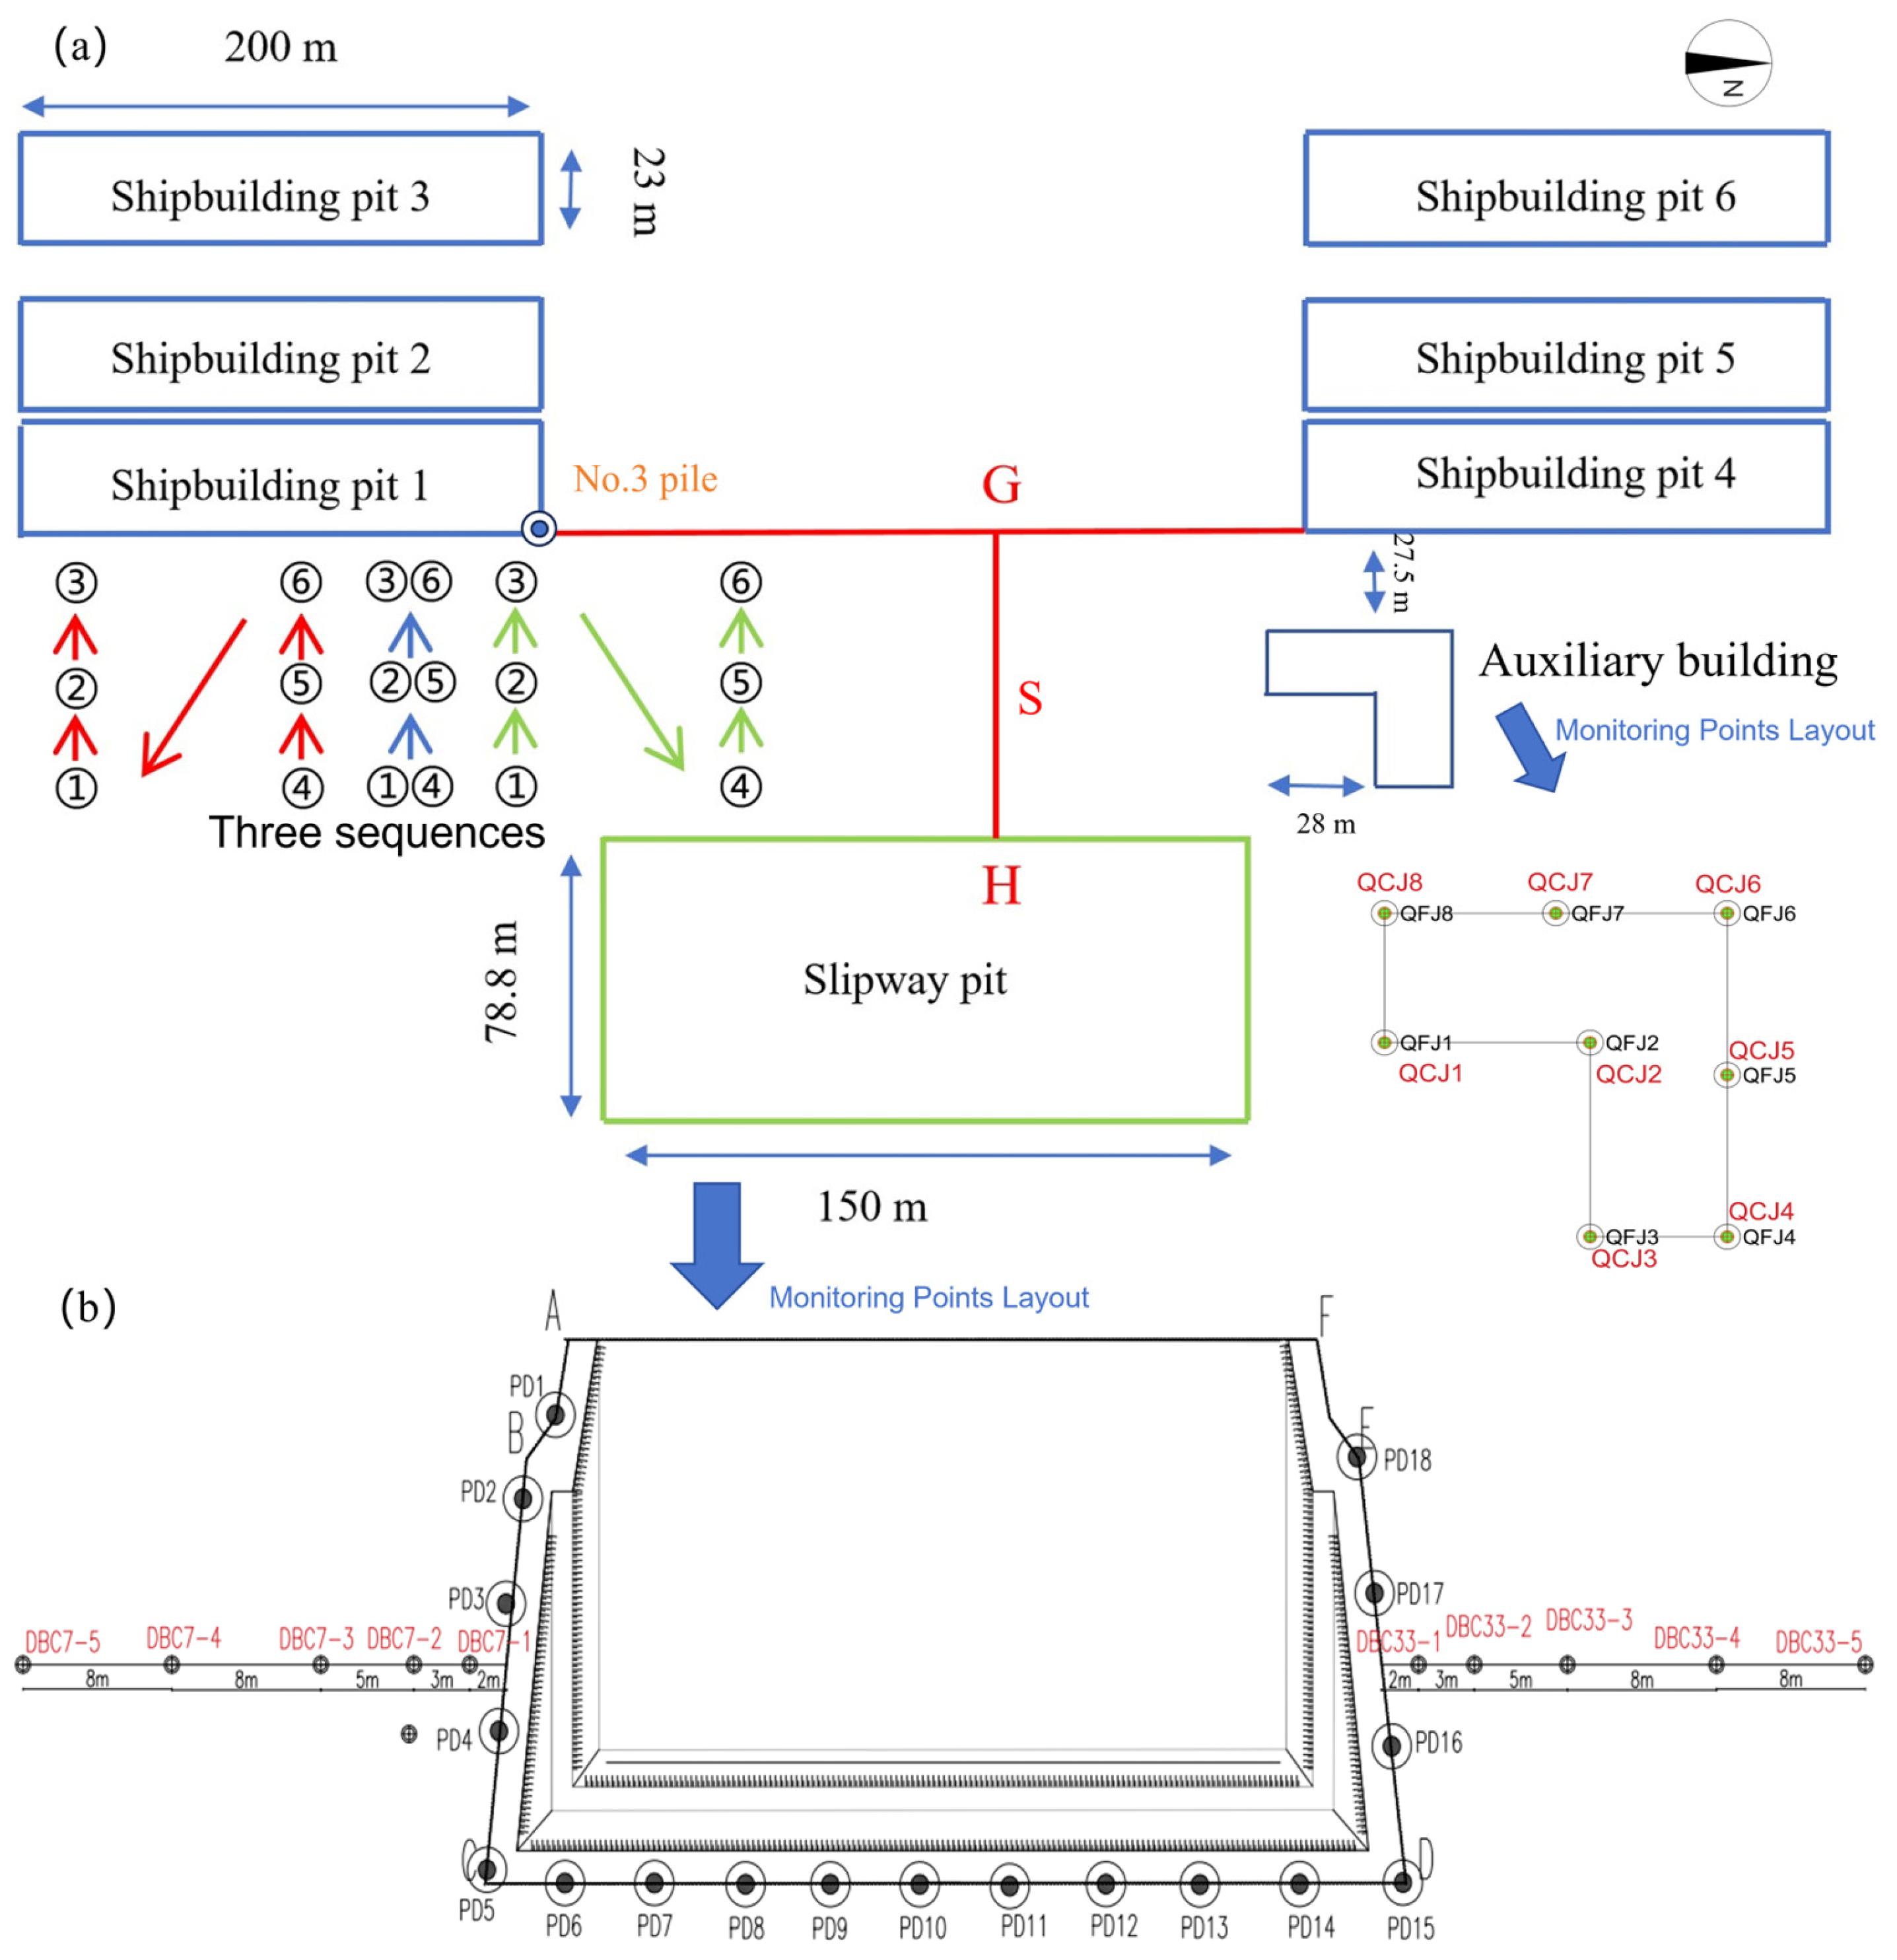
To investigate the superimposed effects of multi-pit excavation, six shipbuilding pits were arranged on the west side of the production auxiliary building, while the slipway pit was located on the opposite side. The clear distance between the shipbuilding pits and the building facade was 27.5 m, and the clear distance between the slipway pit and the building facade was 28.0 m. In this study, clear distance refers to the shortest horizontal distance between the pit edge and the building facade, whereas pit-group spacing refers to the clear horizontal distance between the edges of the slipway pit and the shipbuilding pit group. Each shipbuilding pit was retained by steel sheet piles with an embedded depth of 18 m and three internal struts. Four excavation schemes were designed: Scheme A involved only the slipway pit and served as the single-pit baseline; Scheme B excavated the slipway pit first, and then the shipbuilding pits; Scheme C excavated the shipbuilding pits first, and then the slipway pit; and Scheme D examined a simultaneous-excavation scenario. In Scheme D, simultaneous excavation means that the slipway pit and the shipbuilding pits were dewatered and excavated in the same numerical stages, and each pit group reached the corresponding excavation depth at the same calculation step. All four schemes used identical material parameters, boundary conditions, and dewatering strategies, and the element deactivation/reactivation technique was applied according to the staged construction process.
Figure 6 presents the layout of the numerical model and monitoring system: (a) the relative positions of the slipway pit, the six shipbuilding pits, the production auxiliary building, section lines G and H, and the defined clear distances; and (b) the arrangement of monitoring points for building settlement, pile horizontal displacement, ground surface settlement, and retaining-structure lateral displacement. The location of the No. 3 pile is shown in
Figure 6; it was selected as the representative pile for the following displacement analysis because it was located near the excavation influence zone and showed the largest monitored deformation.
2.7. Model Validation
The numerical results are compared with field monitoring data collected during the excavation of the slipway pit.
Figure 4a presents the comparison of building settlement, and
Figure 4b presents the comparison of horizontal displacement.
Figure 4c presents the comparison of retaining-wall horizontal displacement. The monitored and simulated values in 5 were further digitized at the main construction stages to provide additional quantitative validation. For building settlement, the mean absolute error (MAE), root mean square error (RMSE), and maximum absolute error were approximately 0.08 mm, 0.10 mm, and 0.20 mm, respectively, with R
2 = 0.996. For building horizontal displacement, the corresponding values were approximately 0.12 mm, 0.13 mm, and 0.20 mm, with R
2 = 0.990. For retaining-wall horizontal displacement, the MAE, RMSE, and maximum absolute error were approximately 0.83 mm, 0.87 mm, and 1.15 mm, respectively, with R
2 = 0.855. Although the retaining-wall displacement showed a larger error than the building responses, the overall deformation trend was still reasonably captured. These results indicate that the numerical model can reproduce the main deformation behavior of the monitored slipway-pit excavation.
Direct seepage field validation (e.g., pore-pressure or pumping rate measurements) is not available because no piezometers were installed during construction. However, the close agreement of deformation responses is consistent with the coupled seepage–stress model, as the computed settlements and displacements are driven by effective stress changes induced by dewatering. The hydraulic boundaries and permeability coefficients were assigned based on field pumping tests and regional hydrological data, providing a reasonable basis for the seepage field.
Although the monitoring data were collected only during the excavation of the slipway pit, the shipbuilding pits share identical soil parameters, boundary conditions, and dewatering strategies. Therefore, the validated model reliability can be reasonably extended to the shipbuilding pits.
3. Result and Discussion
3.1. Single-Pit Excavation: Baseline Deformation of Adjacent Piles
Before evaluating the superimposed effects of multi-pit excavation, single-pit analyses were performed to establish a reference case. Two factors were considered: the clear distance between the slipway pit and the building, and the excavation depth. The soil profile, dewatering scheme, and support system were kept the same as those described in
Section 2.
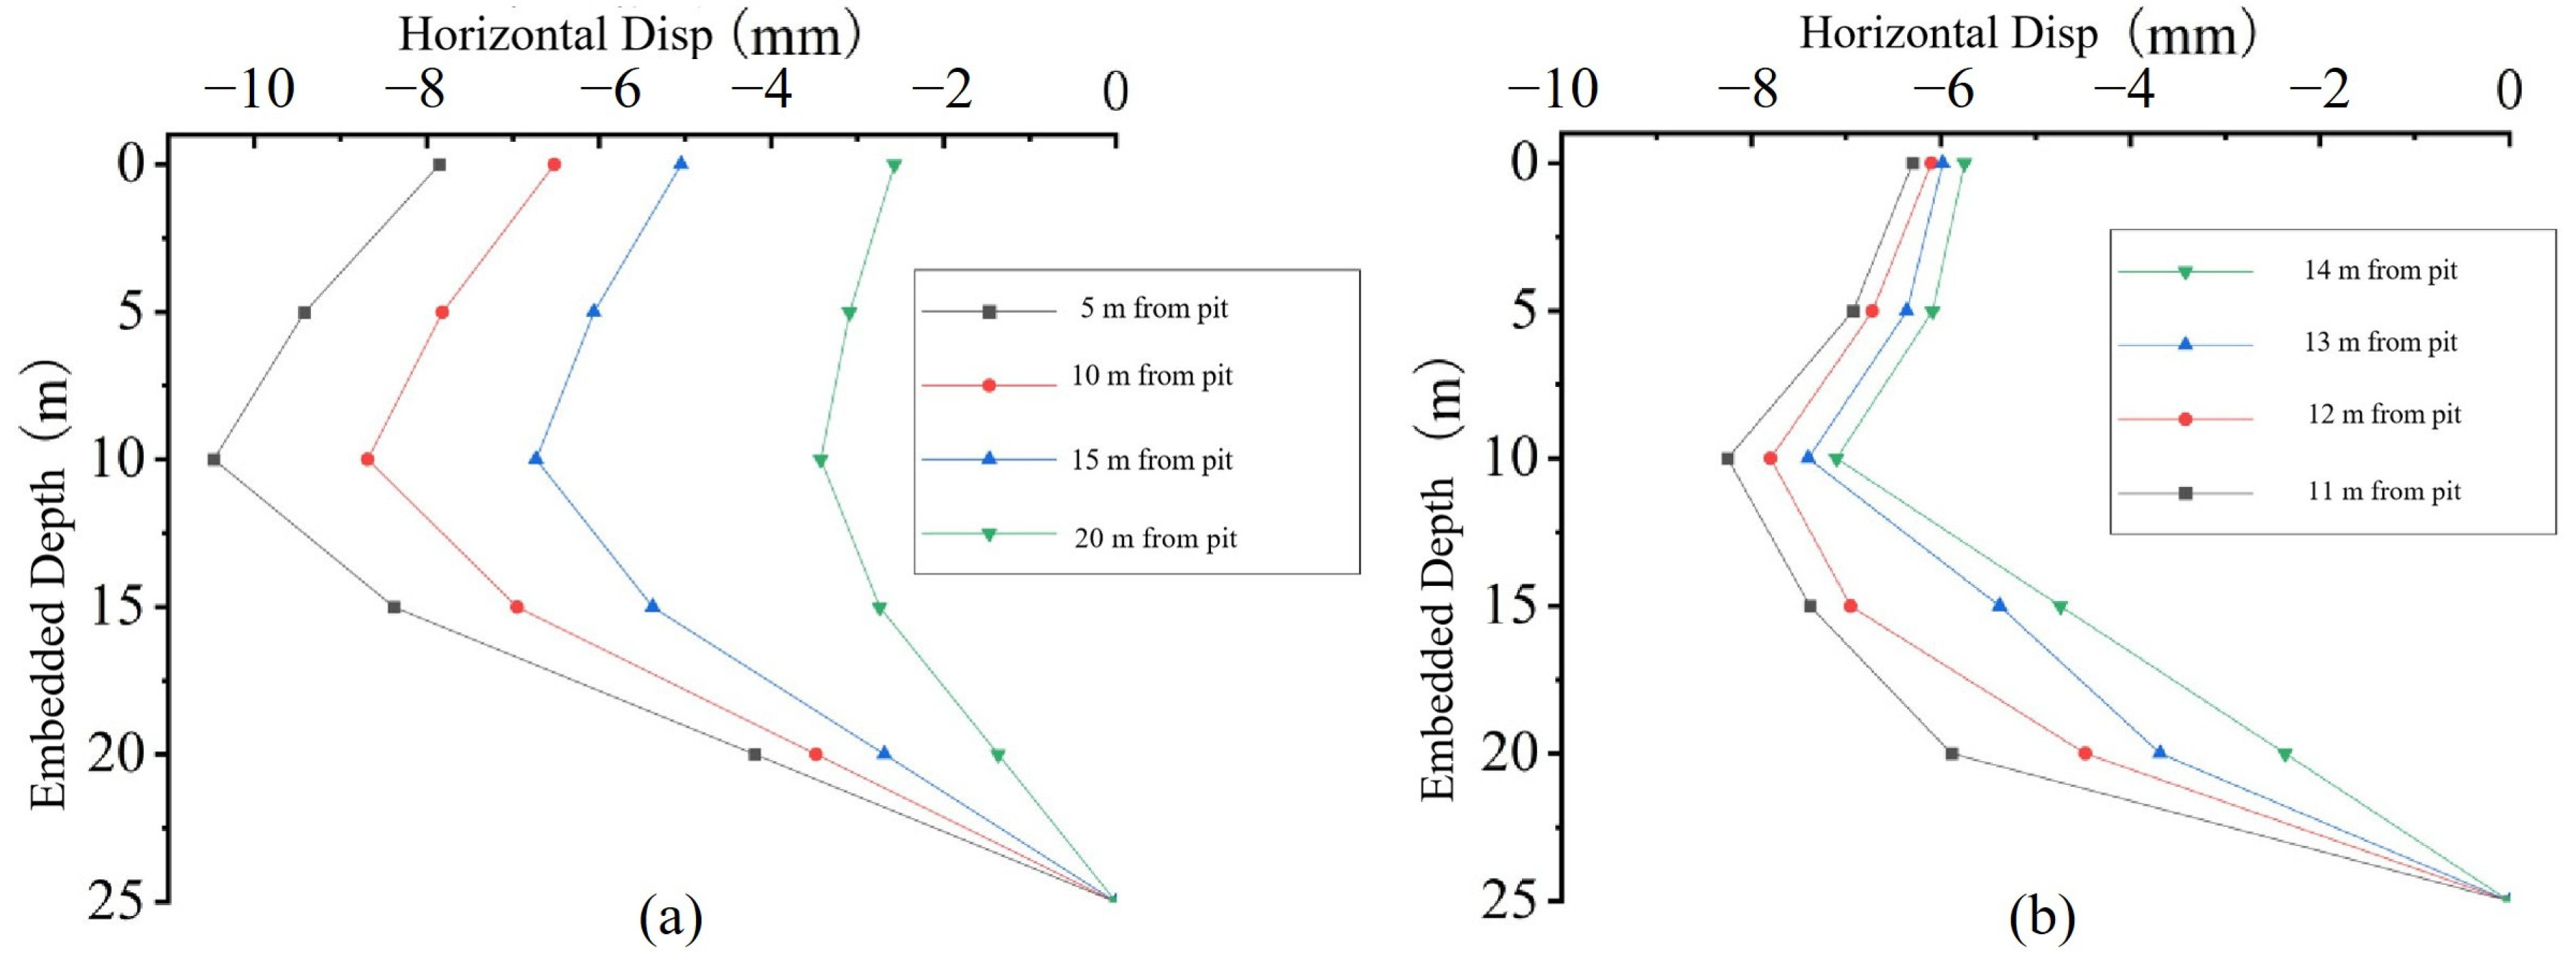
Figure 7 shows the horizontal displacement of the building pile at four normalized pit-building distances, expressed as d/H. Here, H is the excavation depth of the slipway pit, equal to 10.5 m. As d/H increased from 0.5 to 2.0, the peak horizontal displacement decreased from 10.45 mm to 3.45 mm. This corresponds to a reduction of 67.0%. The displacement profiles had similar shapes in all cases. The maximum displacement occurred at about 0.6 H below the ground surface and then gradually decreased toward the pile toe.
This reduction indicates that a larger soil buffer between the pit and the building limits the transfer of lateral soil movement to the pile. When d reached 1.3 H, or about 13.7 m, the peak horizontal displacement decreased to 7.40 mm. This value was lower than the project-specific warning limit of 8 mm. Therefore, a clear distance of at least 1.3 H is recommended for this site.
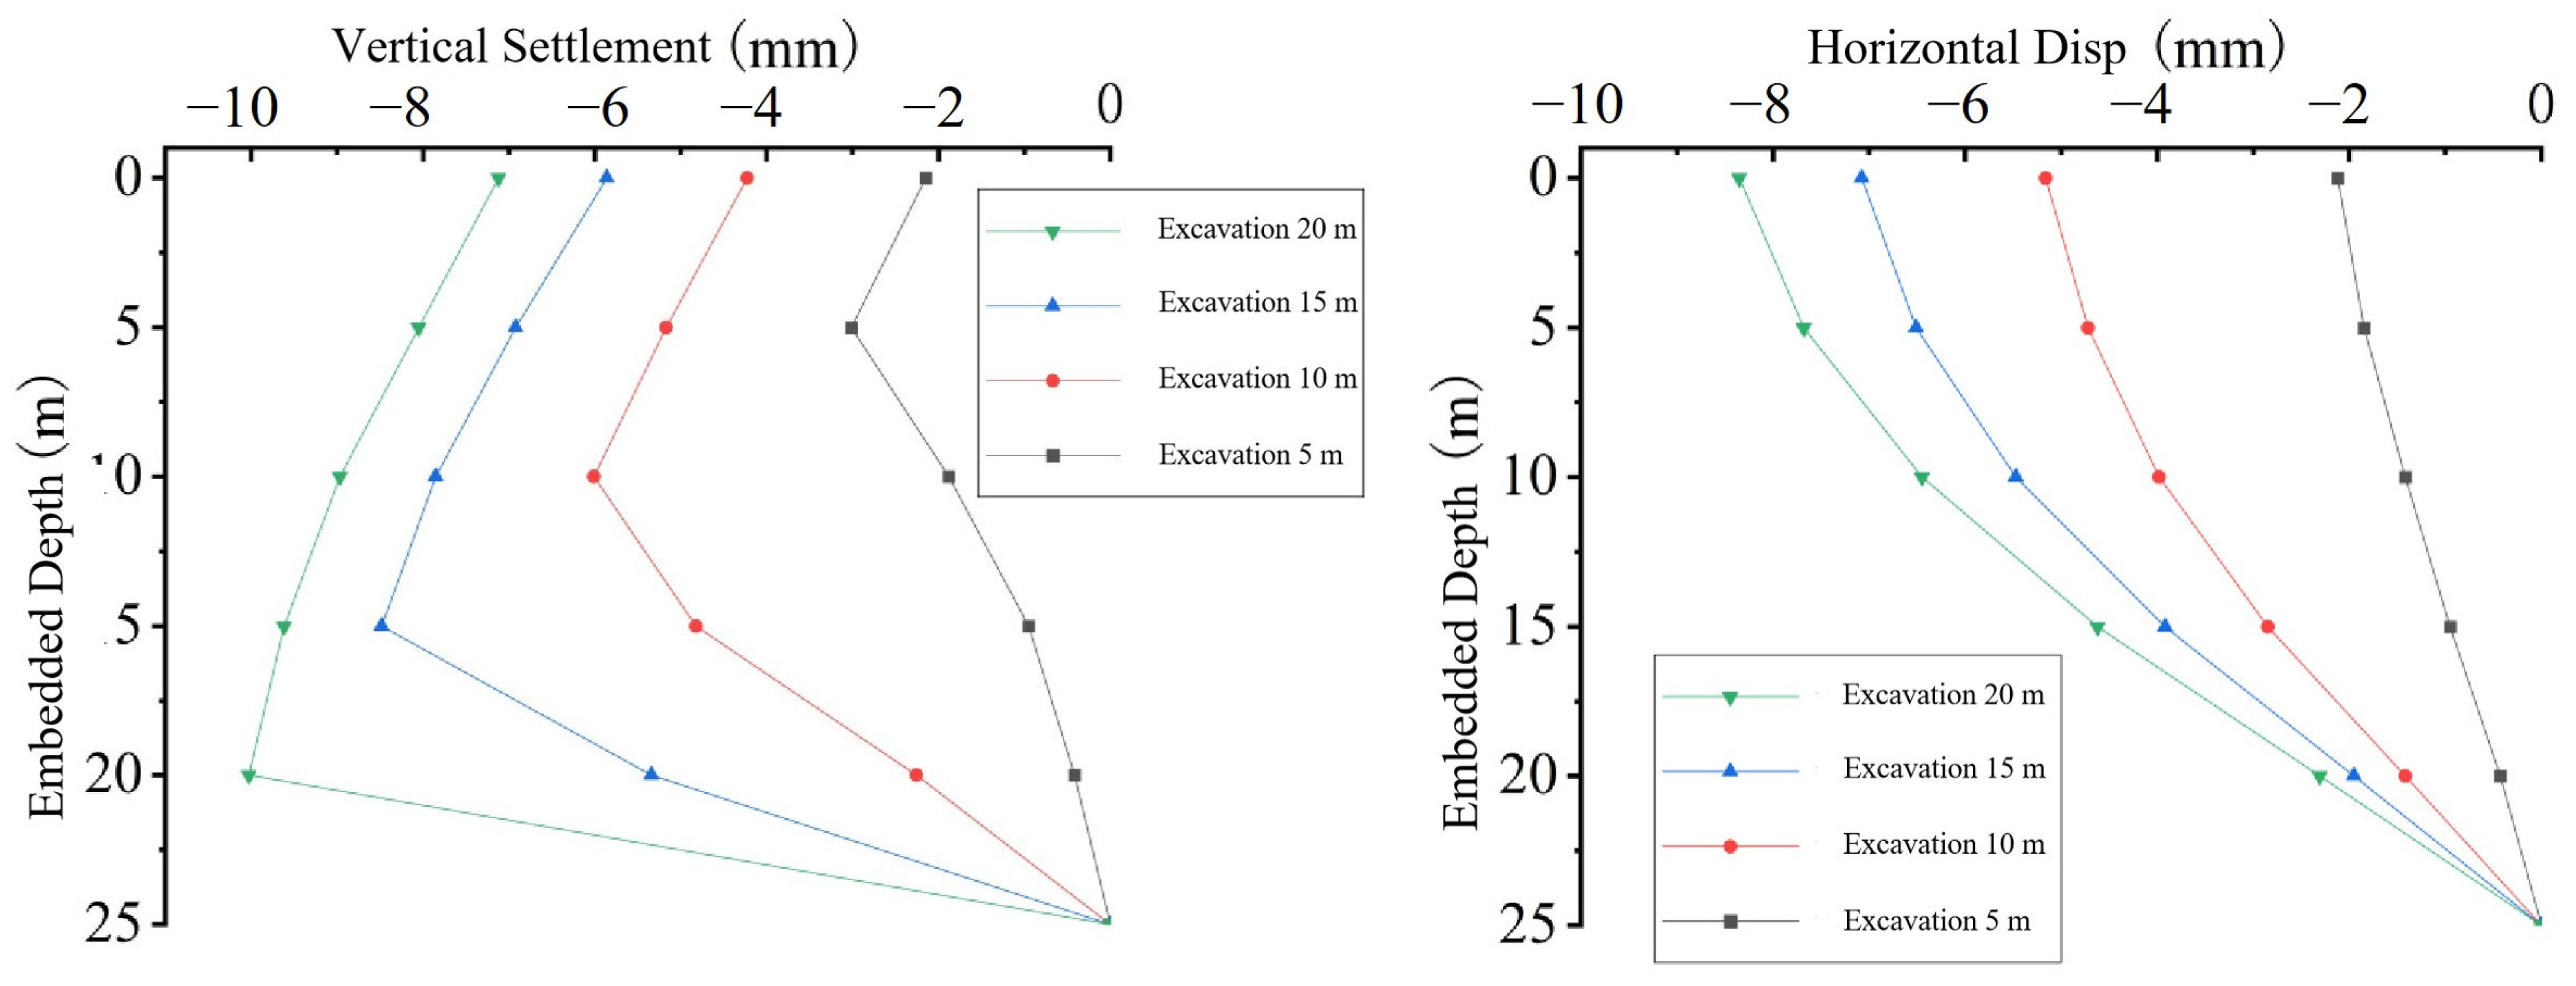
Figure 8 presents the pile displacement for excavation depths ranging from 5 m to 20 m, with the pit-building distance fixed at 30 m. As shown in
Table 3, increasing the depth from 5 m to 20 m raises the peak displacement from 3.02 mm to 10.03 mm, an increase of 232%. Notably, the growth rate is not linear; the displacement increments from 5 m to 10 m, 10 m to 15 m, and 15 m to 20 m are 99%, 41%, and 18%, respectively. This diminishing marginal trend indicates that beyond a certain depth (approximately 15 m in this case), further deepening causes only limited additional deformation.
Under the tested conditions, the 10 m case remained below the 8 mm warning threshold, whereas the 15 m case exceeded it. The 8 mm threshold was used as a warning-level deformation criterion in this project. It was determined as 80% of the project-specific control limit of 10 mm for pile horizontal displacement and settlement, with reference to GB 50497-2019, JGJ 8-2016 [
33,
34], and the deformation control requirements of the Yidu project. Therefore, results lower than 8 mm indicate that the calculated pile deformation remains within the warning-control range, whereas results exceeding this value suggest that the excavation scheme requires further adjustment or additional protection measures. Therefore, the allowable excavation depth should be lower than 15 m, or further refined between 10 m and 15 m. These single-pit results provide the reference against which the beneficial effects of simultaneous multi-pit excavation will be evaluated in
Section 3.2 and
Section 3.3.
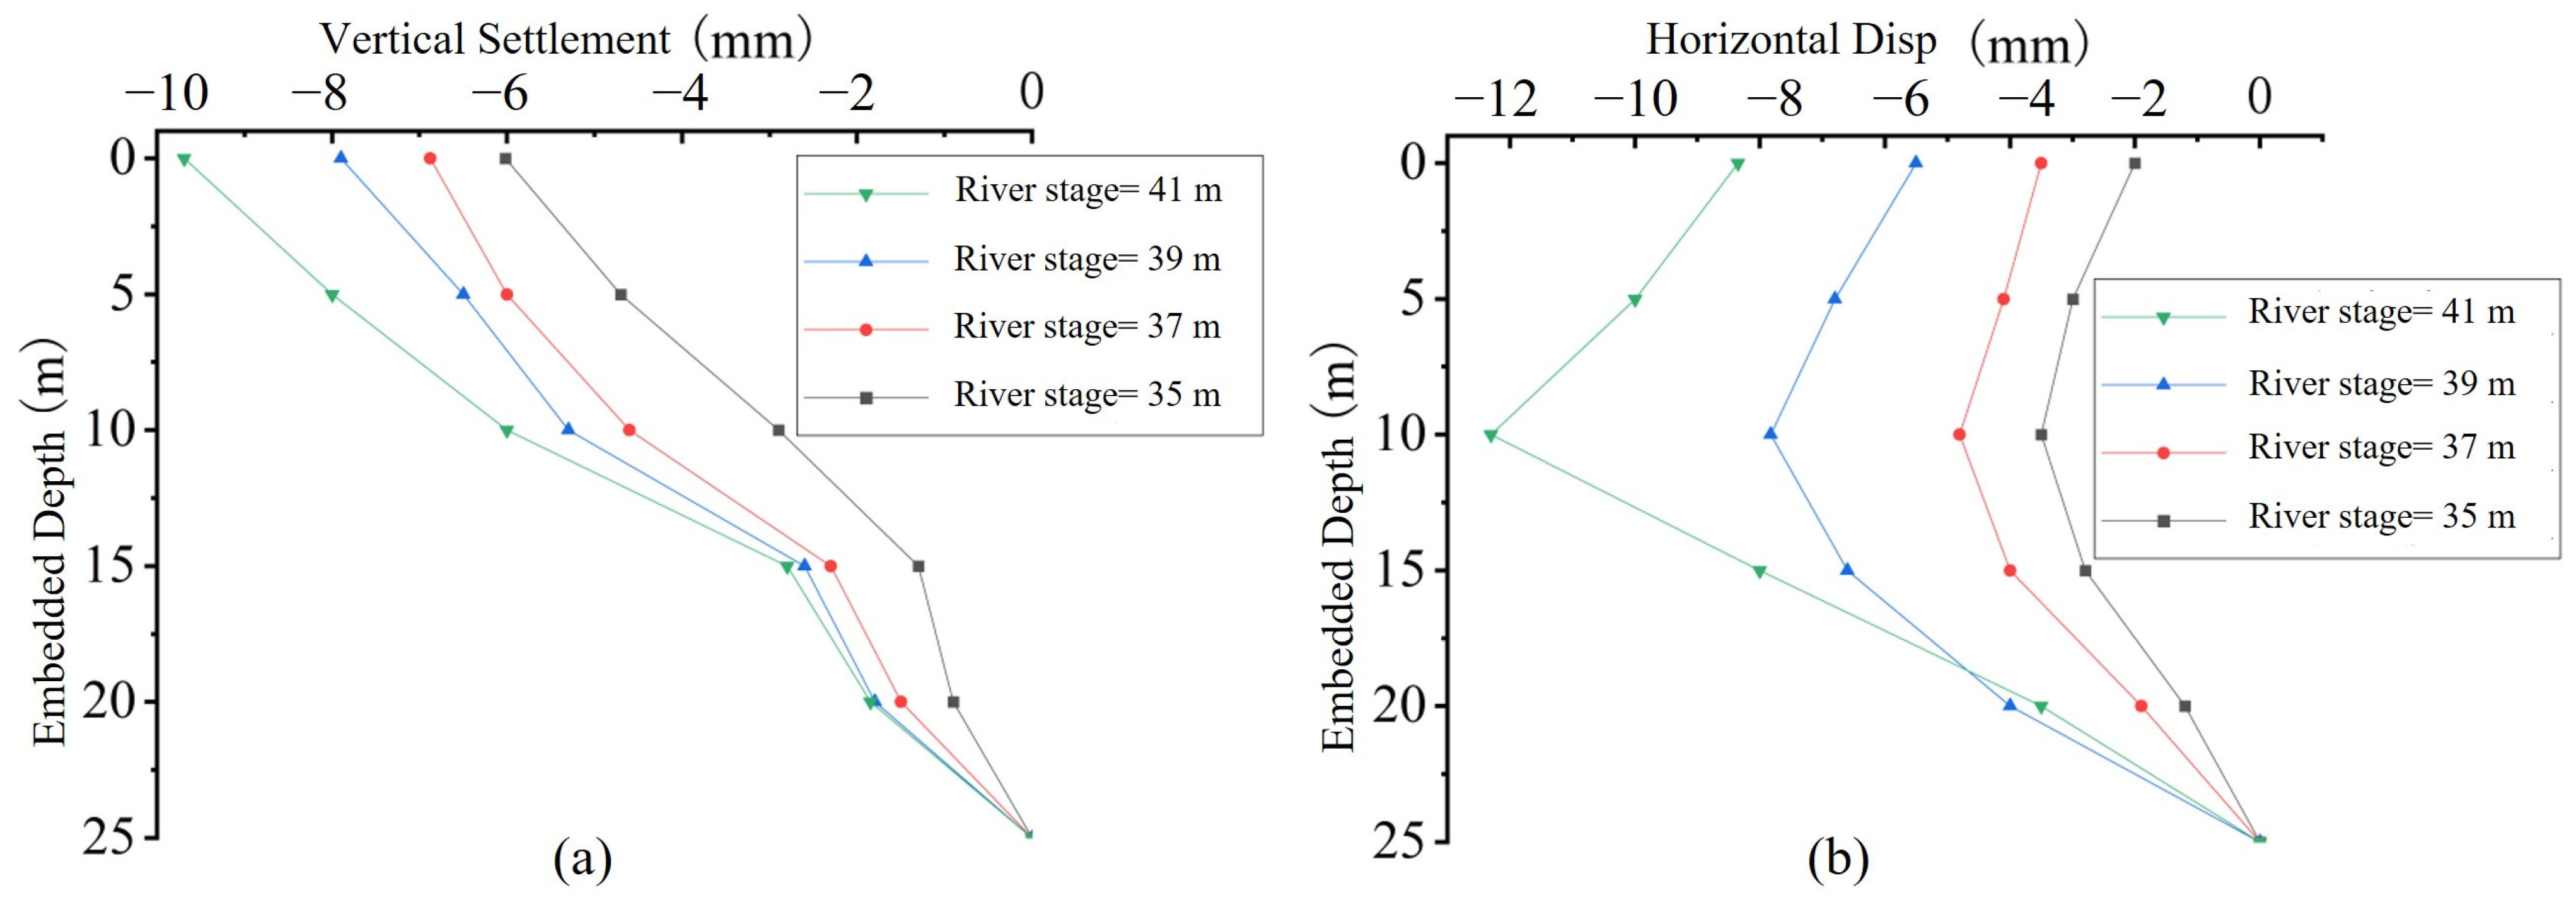
To further examine the hydraulic effect of the Yangtze River, four river-stage conditions of 35 m, 37 m, 39 m, and 41 m were analyzed using the single-pit reference model. These values represent the dry-season and high-water construction conditions of the Yidu river reach. In these simulations, only the river-side hydraulic head was varied, while the excavation depth, pit-building distance, retaining system, soil parameters, and dewatering procedure were kept unchanged.
As shown in
Figure 9a, the peak horizontal displacement of No. 3 pile increased from 3.50 mm to 12.30 mm as the river stage rose from 35 m to 41 m. Compared with the 35 m case, the peak horizontal displacement increased by 37.4%, 123.7%, and 251.4% at river stages of 37 m, 39 m, and 41 m, respectively. This indicates that the horizontal pile response is highly sensitive to river-stage rise in the highly permeable gravel strata.
The vertical displacement showed a similar increasing trend, as shown in
Figure 9b. The peak vertical displacement increased from 6.02 mm at 35 m to 9.69 mm at 41 m, corresponding to a 61.0% increase relative to the 35 m case. Although the vertical displacement at 41 m remained slightly below the project control value, it exceeded the warning-level criterion, indicating that construction under high river-stage conditions requires strengthened groundwater control and deformation monitoring.
The increase in pile deformation can be attributed to the direct hydraulic connection between the Yangtze River and the highly permeable gravel layer. A higher river stage increases the hydraulic head on the river-facing boundary, enhances seepage disturbance around the excavation, and changes the effective-stress state of the soil surrounding the pile. Therefore, river-stage variation should be considered as an important hydraulic factor in waterfront excavation analysis.
3.2. Superimposed Effects of Excavation Sequence in Multi-Pit Conditions
Based on the single-pit baseline established in
Section 3.1, this section examines how excavation sequence affects building pile deformation and inter-pit ground settlement when multiple pits are constructed simultaneously. Two scenarios are considered: (i) six shipbuilding pits located on the same side of the building, and (ii) the slipway pit and the six shipbuilding pits located on opposite sides of the building. The transition of the inter-pit ground deformation pattern with pit spacing is then discussed.
The six shipbuilding pits (Nos. 1–6) are arranged parallel to the southwest facade of the building at a clear distance of 27.5 m. Three excavation sequences were compared, as illustrated in
Figure 6:
Sequence I: Excavate pits 4-5-6 (closest to the building) first, then pits 1-2-3 (farthest).
Sequence II: Alternate pattern: pits 1-4 first, then 2-5, and then 3-6.
Sequence III: Excavate pits 1-2-3 (farthest) first, then pits 4-5-6 (closest).
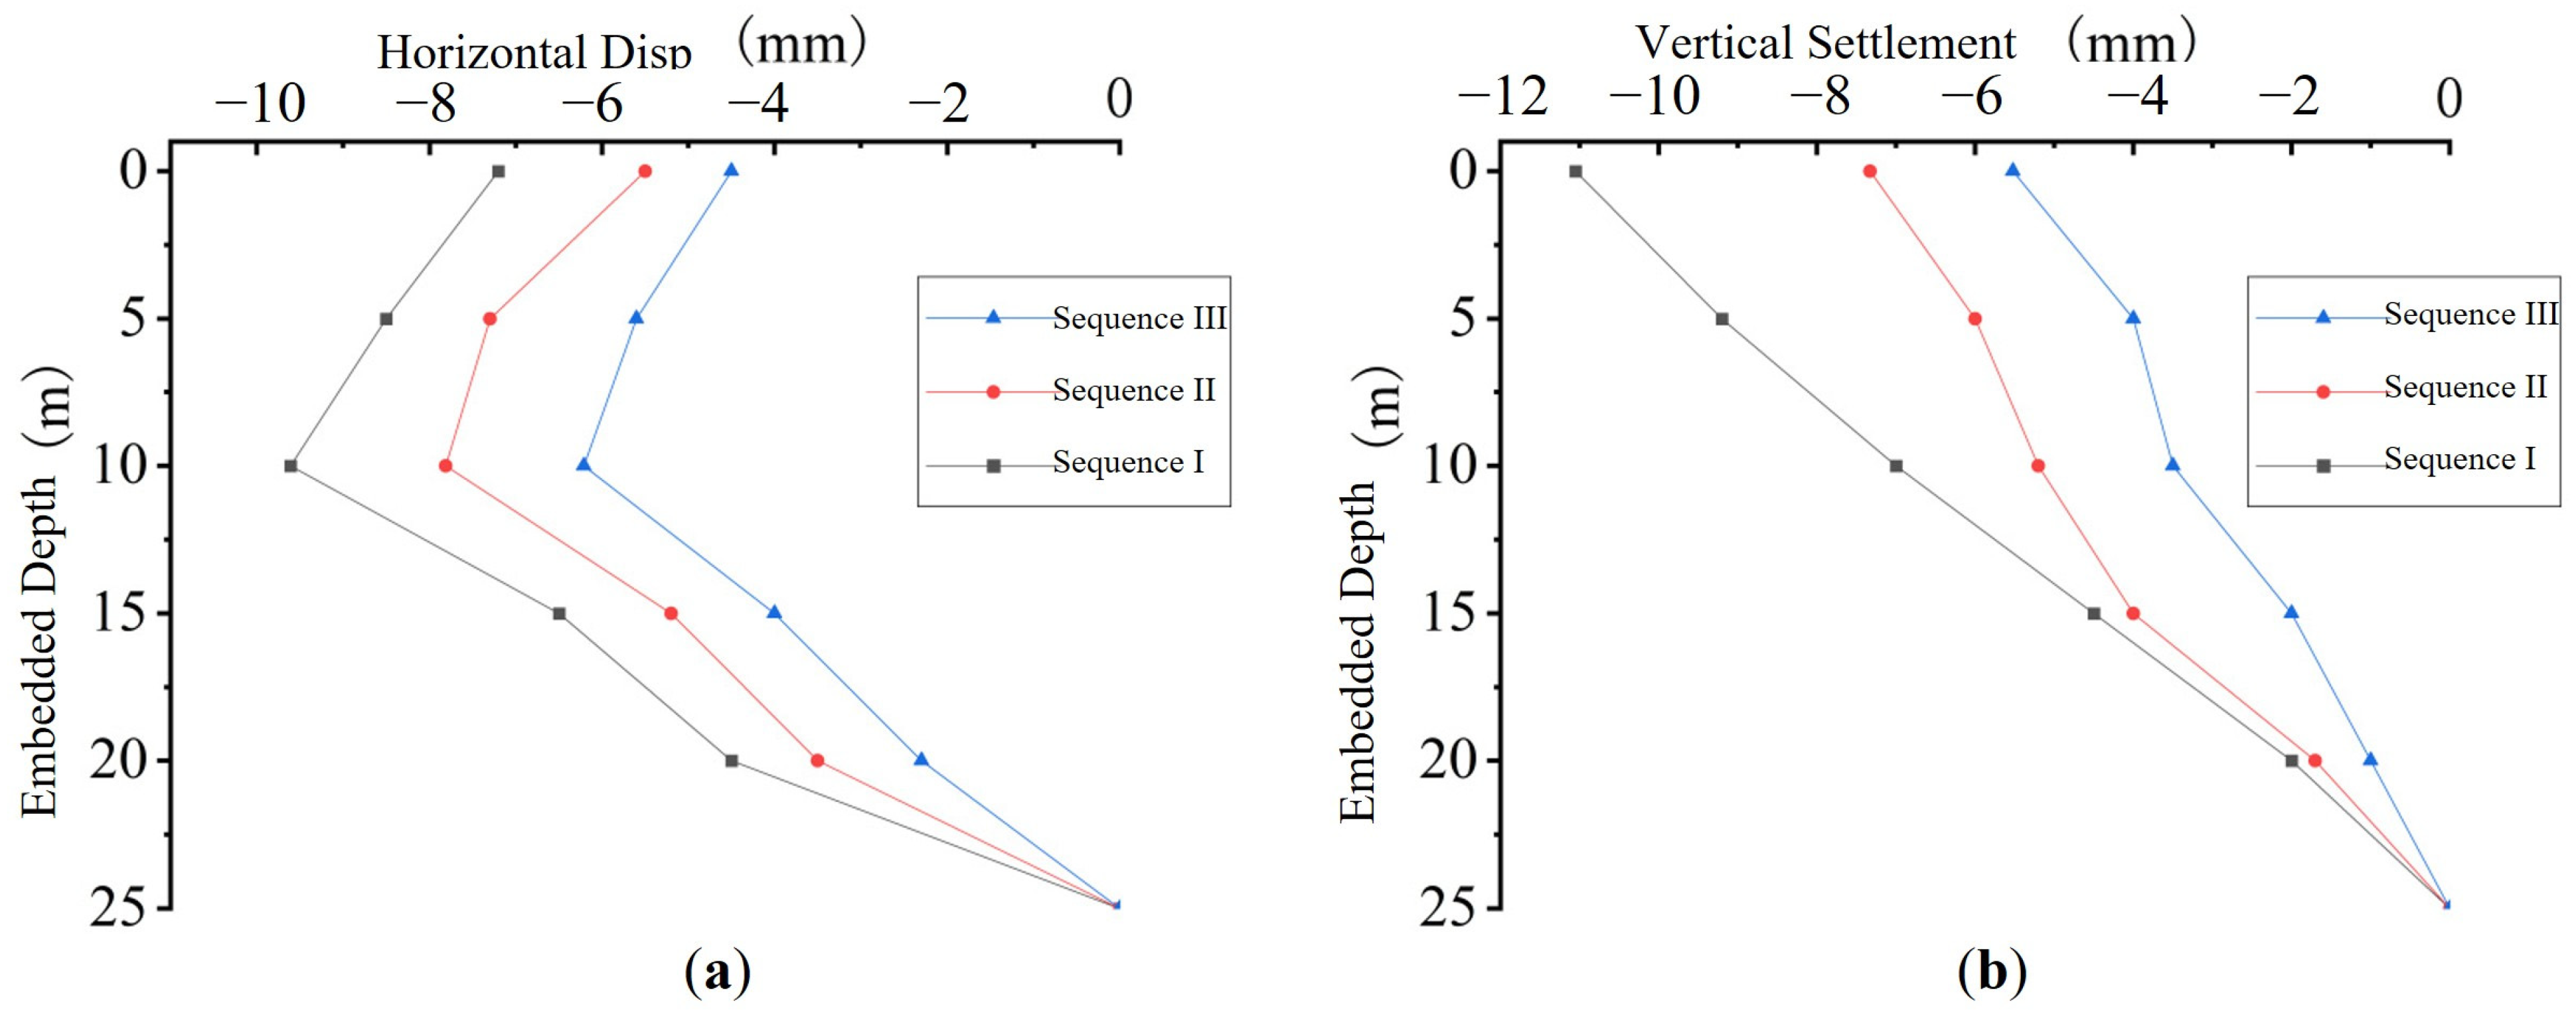
Figure 10a shows the horizontal displacement profiles of the building pile and under the three sequences. Sequence III produced the smallest peak horizontal displacement, with a value of 6.21 mm. This was 35.4% lower than that in Sequence I, which reached 9.61 mm. Sequence II gave an intermediate value of 7.81 mm. The vertical displacement showed the same order. Sequence III reduced the peak settlement from 11.05 mm to 5.52 mm, equal to a reduction of 50.0%.
The better performance of Sequence III is mainly related to the lateral confinement of the soil near the building. When the distant pits were excavated first, the soil adjacent to the building remained less disturbed during the early stages. The unloading-induced deformation then propagated toward the building more gradually. In contrast, Sequence I removed the soil confinement near the building at the beginning of excavation, which caused a larger cumulative deformation. These results indicate that a far-to-near sequence is preferable when multiple pits are located on the same side of a building.
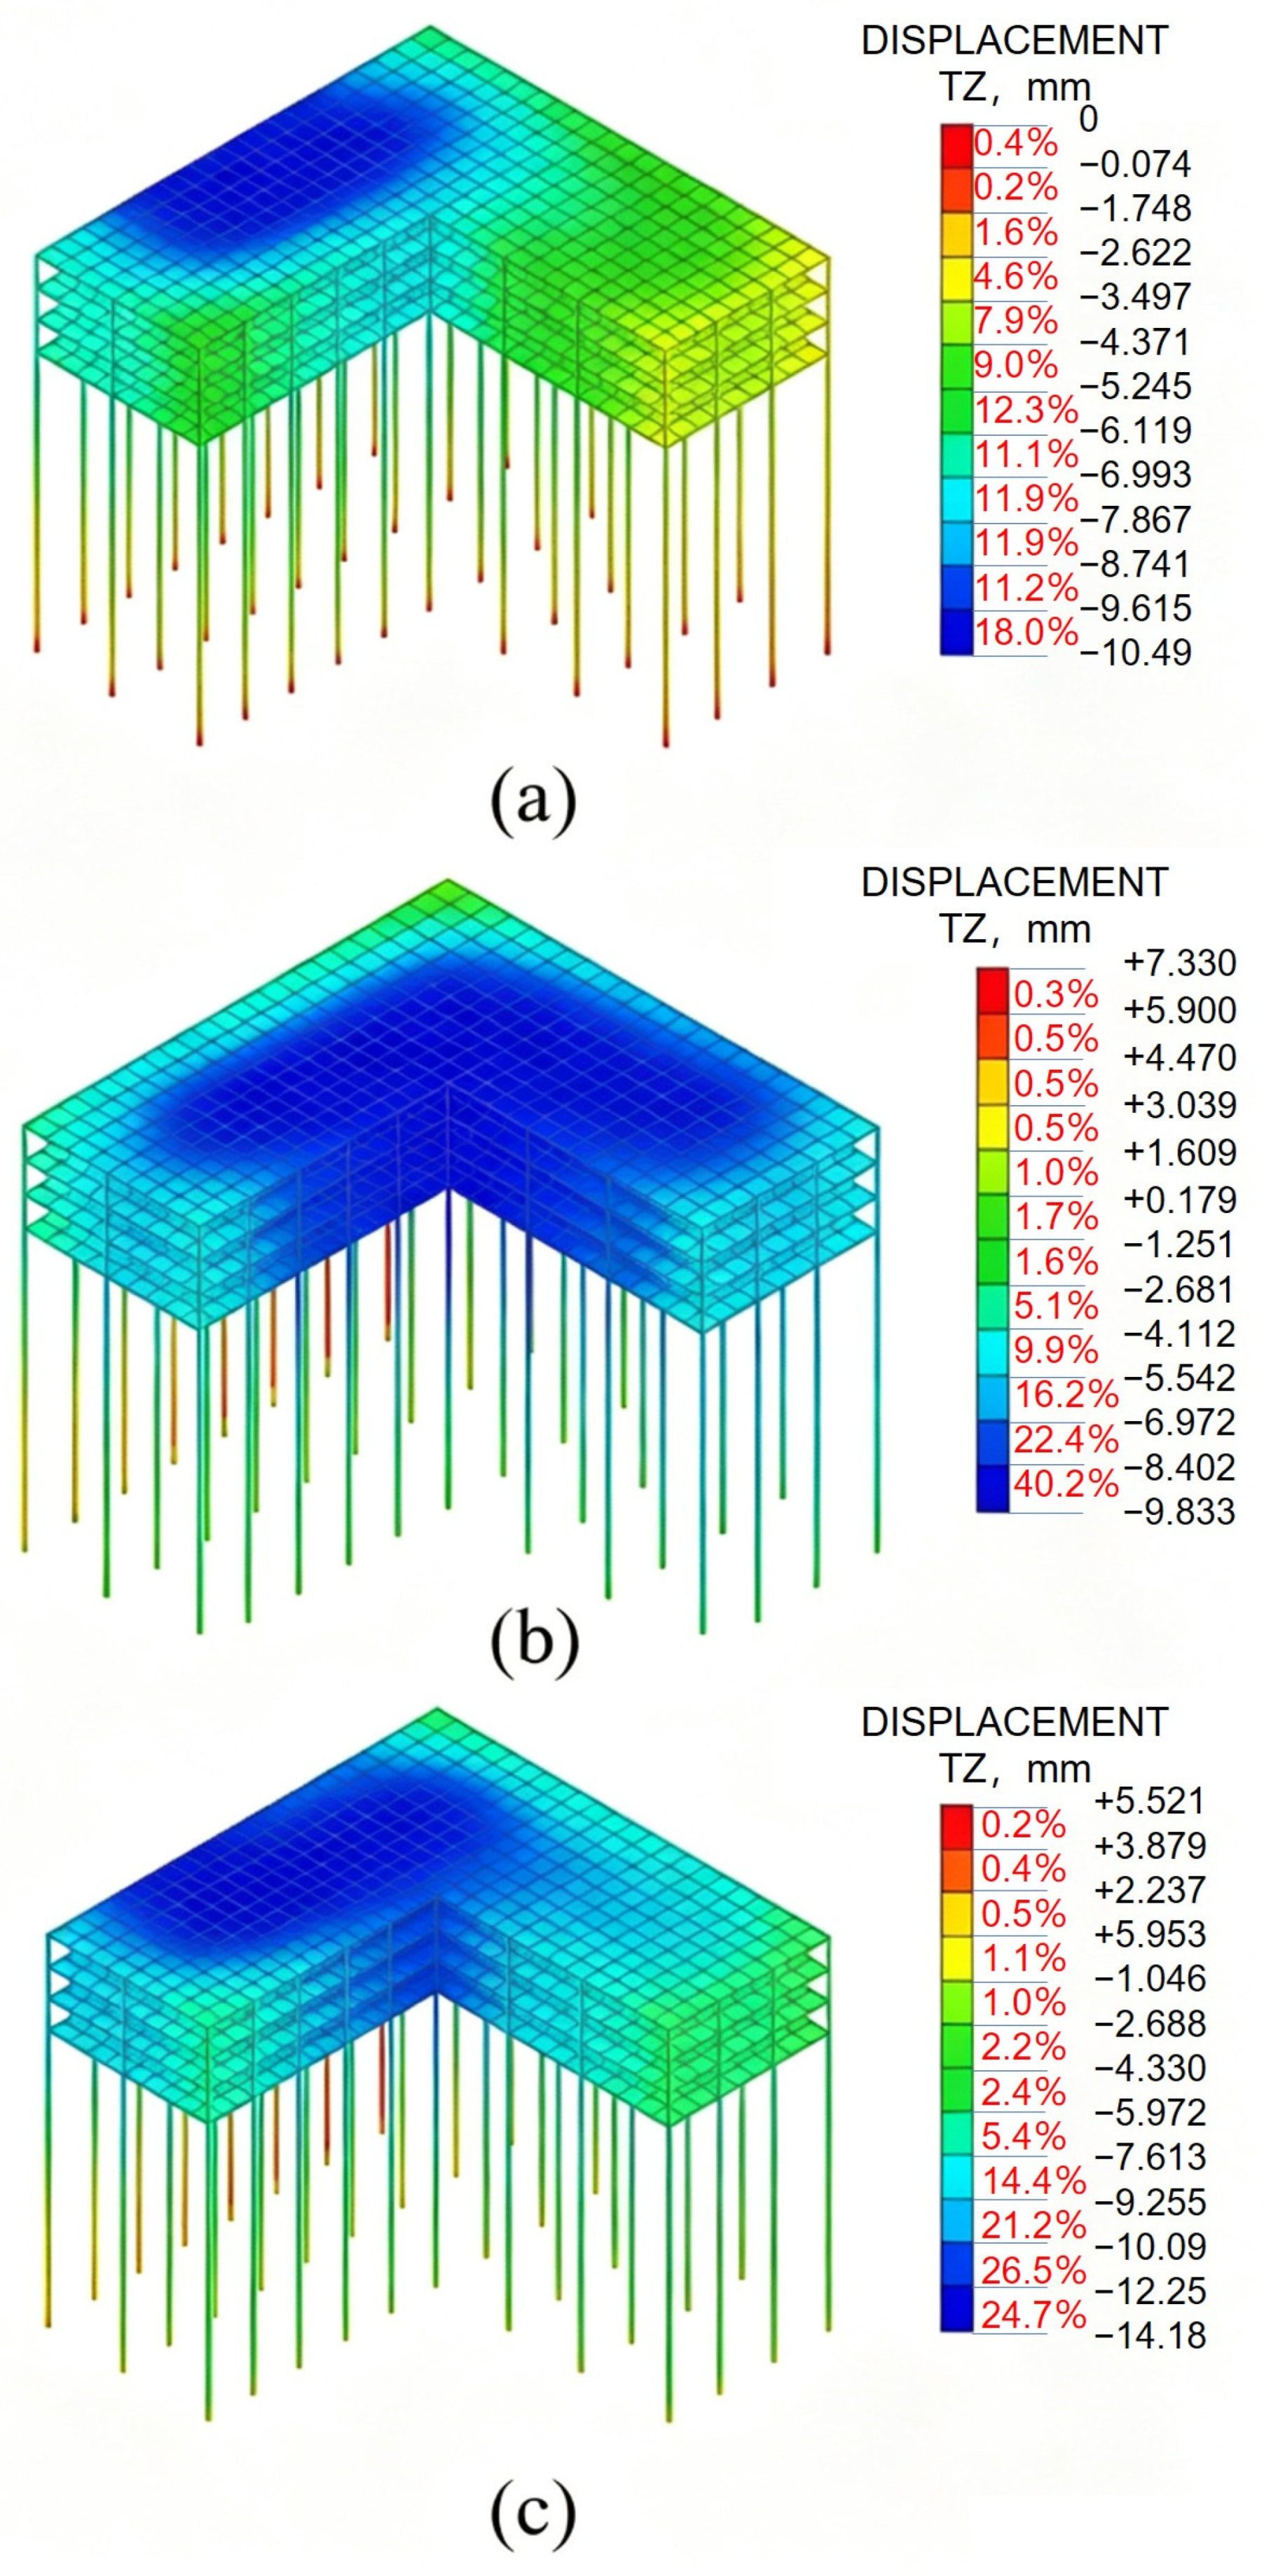
Figure 10b shows the vertical displacement profiles of the building pile, and
Figure 11 presents the vertical settlement contours of the building under the three sequences. Sequence III produced the smallest peak vertical displacement, with a value of 5.52 mm. This was 50.0% lower than that in Sequence I, which reached 11.05 mm. Sequence II gave an intermediate value of 7.33 mm, corresponding to a reduction of 33.7% relative to Sequence I. The horizontal displacements exhibited the same order of magnitude, with Sequence III again yielding the minimum response.
The better performance of Sequence III is mainly attributed to the reduced unloading disturbance and maintained lateral confinement of the soil near the building. When the distant pits were excavated first, the soil adjacent to the piles remained stable during the early stages, and the degradation of pile–soil skin friction was minimized. In contrast, Sequence I removed the soil confinement adjacent to the building at the beginning of excavation, causing full unloading and severe friction degradation, which resulted in the largest structural displacements. Sequence II adopted an alternate excavation pattern that dispersed the unloading disturbance, producing a moderate deformation response.
These results indicate that a far-to-near sequence, excavating Pits 1–3 before Pits 4–6, is preferable when multiple pits are located on the same side of a building, as it effectively minimizes both vertical and horizontal disturbances, reducing deformation risk under the simulated conditions.
The slipway pit was located on the east side of the building, and the six shipbuilding pits were located on the west side. Their minimum clear distances from the building were 28.0 m and 27.5 m, respectively. Four excavation schemes were simulated. Scheme A considered the slipway pit alone as the single-pit benchmark. Scheme B excavated the slipway pit first and then the shipbuilding pits. Scheme C excavated the shipbuilding pits first and then the slipway pit. Scheme D excavated all pits simultaneously.
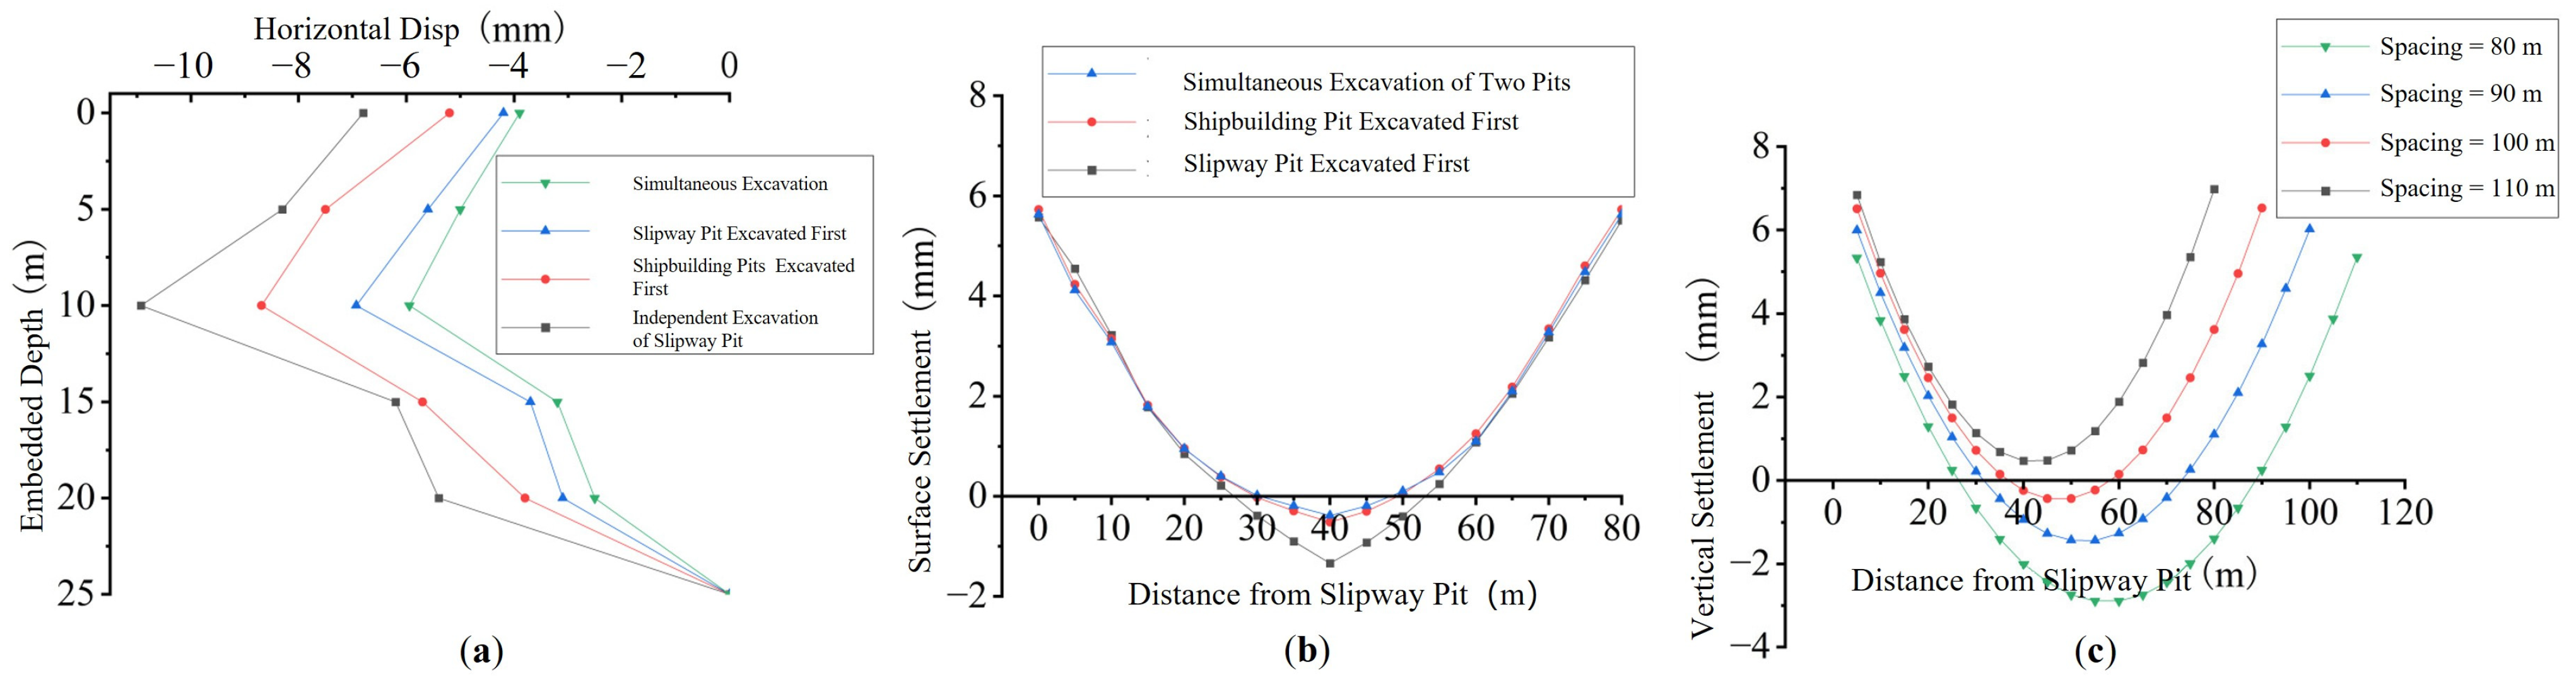
Figure 12a shows the horizontal displacement profiles of the building pile. Scheme D reduced the peak horizontal displacement to 5.94 mm. This value was 45.7% lower than the single-pit benchmark in Scheme A, which was 10.93 mm. It was also 31.6% lower than the value in Scheme B, which was 8.69 mm. Scheme C produced a peak displacement of 6.93 mm, which was still lower than that in Scheme B.
The superior performance of simultaneous excavation can be attributed to the mutual cancelation of lateral soil displacements induced by the two oppositely located excavation fronts. When the slipway pit is excavated alone, the building pile experiences a strong lateral push toward the east, which is taken as the positive direction. When the shipbuilding pits are added on the west side, they generate a counteracting lateral movement toward the west. Under simultaneous excavation, these two opposing soil movements partially offset each other, resulting in a much smaller net pile displacement. In sequential excavation, however, the building pile undergoes two consecutive deformation events, and the cumulative displacement becomes significantly larger.
The inter-pit ground settlement also demonstrates a clear advantage of simultaneous excavation. The settlement was monitored along the centerline between the two pit groups, as shown in
Figure 12b. Scheme D, which is the simultaneous excavation scheme, produces the smallest inter-pit settlement at only 0.38 mm. Scheme B, where the slipway pit is excavated first, gives the largest settlement at 1.34 mm. All settlement profiles exhibit a typical central trough shape, with the maximum settlement occurring at the midpoint between the two pit groups. These results indicate that for building-centered multi-pit projects, simultaneous excavation is the most effective strategy among the tested schemes to minimize both pile deformation and ground settlement.
Although excavation sequence is the primary controlling factor, the distance between the two pit groups also significantly influences the inter-pit ground deformation pattern.
Figure 12c presents the ground settlement profiles for pit spacings ranging from 80 m to 110 m, with the slipway pit excavated first in all cases. At a spacing of 80 m, the inter-pit ground is dominated by heave, with a maximum heave of 6.98 mm and a minimum of 0.47 mm. As the spacing increases to 100 m, settlement begins to appear in the central zone. At 110 m, the central settlement reaches 2.89 mm, while the edge heave decreases to 5.36 mm. In the tested spacing cases, the deformation pattern changed between 90 m and 100 m. Taking the slipway-pit excavation depth H = 10.5 m as the reference depth, this range corresponds to S/H = 8.57–9.52, where S is the clear spacing between the two pit groups.
This transition can be interpreted as the competition between excavation-induced rebound and dewatering-induced settlement. When the pit spacing is small, the unloading effects induced by the two pit groups overlap in the inter-pit zone, reducing the vertical total stress and causing elastic or plastic rebound of the soil. Therefore, the inter-pit ground tends to heave. At the same time, dewatering increases the effective stress of the soil and tends to induce settlement. The final ground deformation depends on which mechanism is dominant. In the 80 m spacing case, unloading-induced rebound was dominant, and the maximum heave reached 6.98 mm. In contrast, when the spacing increased to 110 m, the interaction between the two pit groups weakened, the rebound effect decreased, and dewatering-induced settlement became more evident, with the central settlement reaching 2.89 mm. Therefore, the heave-to-settlement transition should be understood as the result of competing unloading and dewatering effects rather than as a direct consequence of compressive stress generation.
3.3. Regulation Mechanisms of Key Multi-PIT Parameters
This section further examines parameters that affect the interaction between the slipway pit and the shipbuilding pits. Three factors were considered: the excavation depth of the shipbuilding pits relative to the slipway pit, the horizontal spacing between the two pit groups, and the steel sheet pile properties of the shipbuilding pits. These simulations were based on the numerical model described in
Section 2.
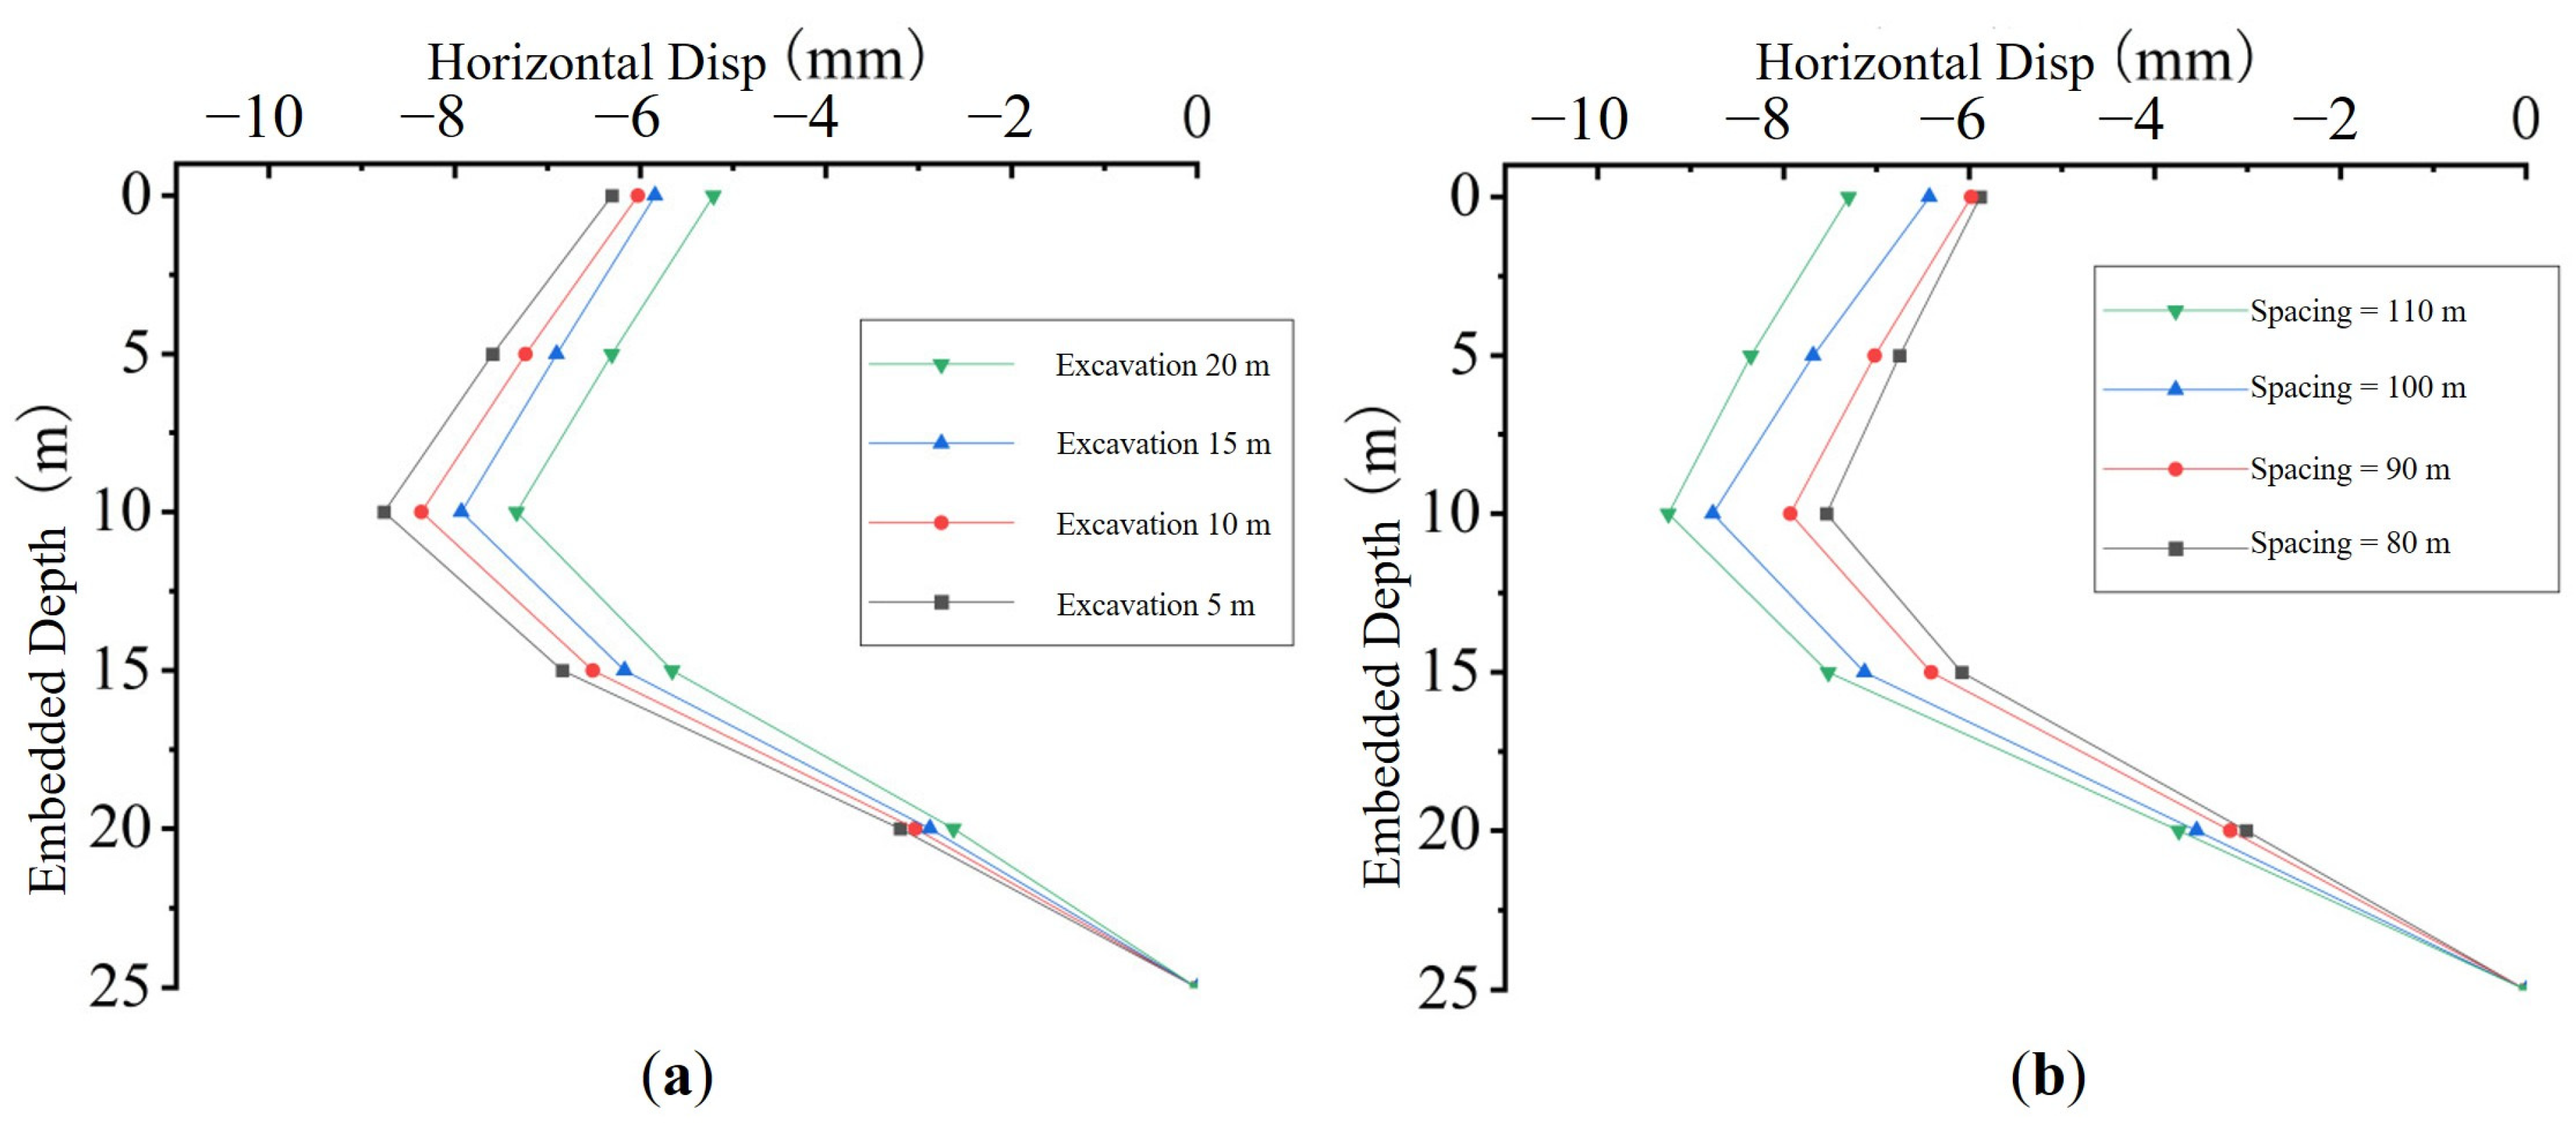
In this analysis, the slipway pit depth was fixed at 10.5 m. The depth of the shipbuilding pits was varied from 5 m to 20 m. These depths corresponded to depth ratios of 0.48, 0.95, 1.43, and 1.90 relative to the slipway pit. The excavation sequence was fixed as slipway pit first, followed by the shipbuilding pits.
Figure 13a shows that increasing the depth of the shipbuilding pits reduced the peak horizontal displacement of the building pile. As the shipbuilding pit depth increased from 5 m to 20 m, the peak displacement decreased from 8.76 mm to 7.33 mm. This corresponds to a reduction of 16.3%.
This reduction occurred because the unloading effect from the shipbuilding pits increased as they became deeper. When the shipbuilding pits were shallow, the slipway pit dominated the deformation pattern and produced a stronger lateral movement toward the slipway pit. As the shipbuilding pits deepened, their unloading effect increasingly counteracted this movement. The reduction became limited after the shipbuilding pit depth reached about 1.5 times the slipway pit depth. The peak displacement decreased only from 7.93 mm to 7.33 mm when the shipbuilding pit depth increased from 15 m to 20 m. Therefore, for this layout, a shipbuilding pit depth of about 1.5 times the slipway pit depth can be regarded as a project-specific reference value for balancing deformation control and excavation scale, rather than a formally optimized depth ratio.
Figure 13b shows that the clear spacing between the slipway pit and the shipbuilding pits was varied from 80 m to 110 m. Other parameters were kept unchanged. The slipway pit was excavated first, followed by the shipbuilding pits.
Reducing the spacing from 110 m to 80 m decreased the peak horizontal displacement of the building pile from 9.24 mm to 7.54 mm. From the viewpoint of the 8 mm warning criterion, the 80 m spacing kept the peak pile displacement within the warning-control range, whereas the 110 m spacing exceeded it. This indicates that smaller pit-group spacing can improve pile-deformation control for this project. This corresponds to a reduction of 22.6%. However, the same reduction in spacing increased the inter-pit ground heave at the edge of the slipway pit from 5.36 mm to 6.98 mm. This represents an increase of 30.2%. Therefore, pile displacement should not be used as the only design criterion. Ground heave, retaining-wall response, groundwater control and construction feasibility should also be checked before adopting a smaller spacing.
This result indicates a trade-off between pile deformation control and ground heave. Smaller spacing strengthens the interaction between the slipway pit and the shipbuilding pits. It also improves the lateral confinement of the inter-pit soil, which helps reduce pile displacement. At the same time, it may induce excessive heave in the soil between the two pit groups. This heave can affect underground utilities or foundation stability. Based on these results, a spacing of about 90 m or less can be used as a project-specific reference when the priority is to keep pile displacement below the 8 mm warning limit. Additional ground improvement may be required if the predicted heave is not acceptable. A more detailed separation of the unloading effect, seepage effect, lateral confinement, and retaining-wall interaction requires additional component analyses, such as excavation-only, dewatering-only, and combined loading cases, which will be considered in future work. Because only discrete spacing cases were considered, this spacing value should not be interpreted as a precise optimized boundary. A refined parametric grid and additional sensitivity analyses for soil stiffness and hydraulic parameters are needed before applying this value to other projects.
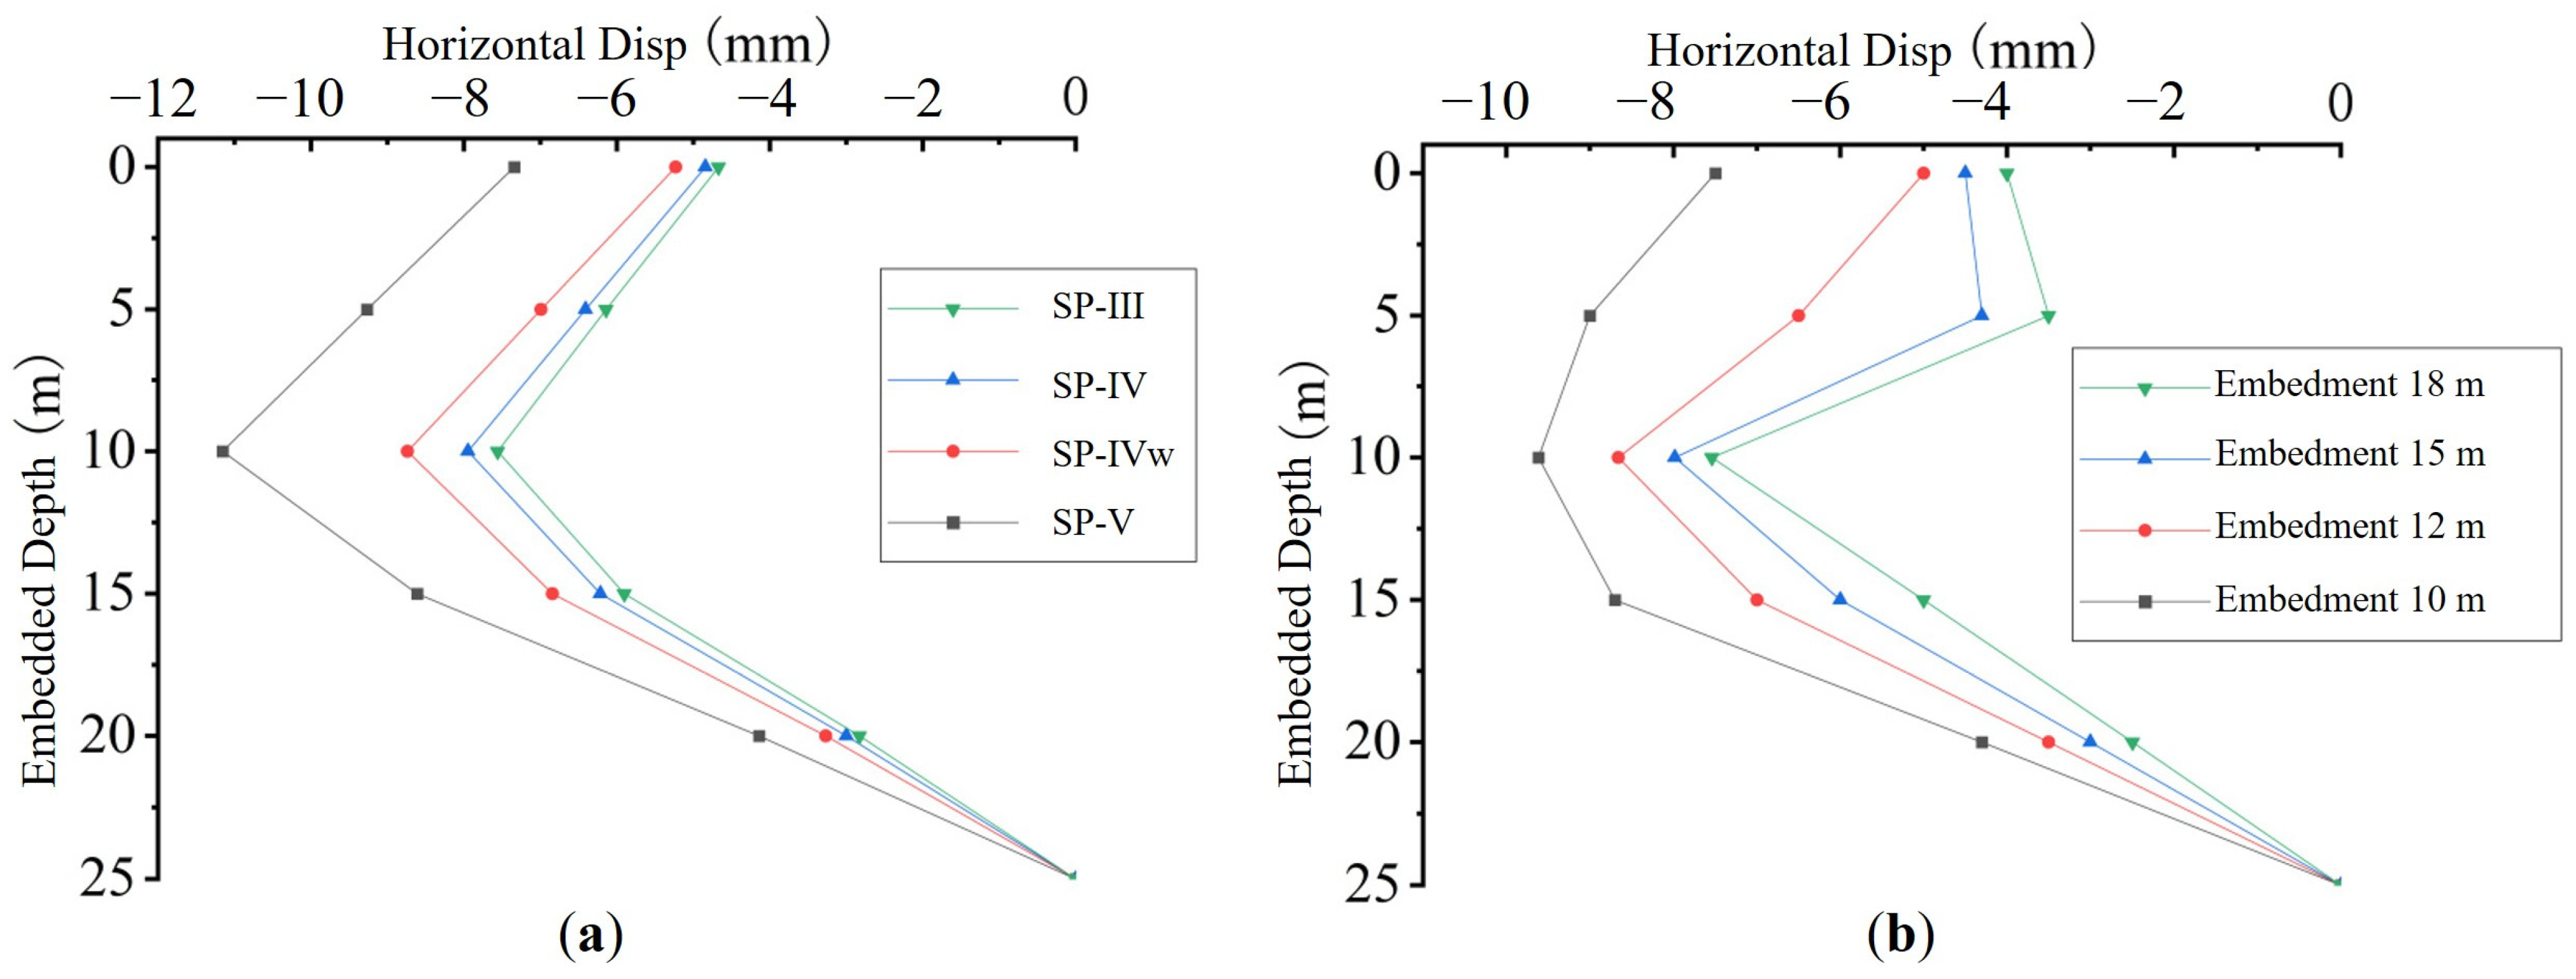
Two design parameters of the steel sheet pile retaining system were investigated: sectional stiffness (expressed by the standard Chinese designations SP-III, SP-IV, SP-IVw, and SP-V) and embedded depth. All simulations were performed for the shipbuilding pits with the slipway pit excavated first.
The sheet-pile stiffness cases were defined according to standard hot-rolled U-type steel sheet-pile designations. The moment of inertia per meter was 2.86 × 104 cm4/m for SP-III, 4.67 × 104 cm4/m for SP-IV, 7.29 × 104 cm4/m for SP-IVw, and 1.08 × 105 cm4/m for SP-V. The corresponding web thicknesses were 10.3 mm, 15.5 mm, 18.0 mm, and 22.0 mm, respectively. In the numerical model, these cases were represented by the equivalent bending stiffness of the retaining wall rather than by explicitly modeling the detailed U-shaped cross-section.
Figure 14a shows the pile horizontal displacement as a function of steel sheet pile type. Increasing the stiffness from SP-III to SP-V reduces the peak displacement from 12.31 mm to 7.50 mm, a total reduction of 39.1%. However, the marginal benefit diminishes sharply: the reduction from SP-III to SP-IV is 18.8%, from SP-IV to SP-IVw is 17.4%, but from SP-IVw to SP-V is only 9.5%. Beyond SP-IVw, further stiffening yields limited additional control.
Figure 14b presents the effect of embedded depth De (from 10 m to 18 m). Increasing embedded depth from 10 m to 18 m reduces the pile displacement from 9.62 mm to 7.54 mm, a reduction of 21.6%. The reduction per increment decreases with depth as follows: from 10 m to 12 m, a decrease of 9.98%; from 12 m to 15 m, 7.85%; and from 15 m to 18 m, only 5.84%. Beyond 15 m, the displacement curve becomes nearly flat.
These diminishing returns are typical for stiff retaining structures in high-permeability gravel layers: once the wall is sufficiently stiff and deep to prevent excessive lateral flow and deformation, further increases in stiffness or depth provide little additional benefit. For this project, SP-IVw steel sheet piles with an embedded depth of at least 15 m are recommended, balancing deformation control efficiency with construction cost and drivability in gravel strata. This recommendation is based on both the 8 mm warning criterion and the diminishing marginal reduction in pile displacement after SP-IVw or an embedment depth of 15 m. Therefore, the proposed support parameters should be regarded as project-specific design values rather than general limits for all gravel excavation projects.
3.4. Discussion
To facilitate comparison among the investigated scenarios, the key quantitative results are summarized in
Table 4. The Table highlights the effects of excavation depth, excavation sequence, pit-group spacing, and retaining-system parameters on pile deformation, and provides a basis for discussing their engineering implications.
The results show that the deformation response of building piles depends on whether the excavation is controlled by a single pit or by the interaction between pit groups. Under single excavation of the slipway pit, the pile moved mainly toward the slipway pit. When the slipway pit and shipbuilding pits were excavated on opposite sides of the building, their induced soil movements interacted and partly counteracted each other.
The most important finding is that simultaneous excavation of the slipway pit and shipbuilding pits reduced the peak horizontal displacement of the building pile by 45.7% compared with single excavation of the slipway pit. This reduction was calculated from the decrease in peak pile displacement from 10.93 mm in Scheme A to 5.94 mm in Scheme D. The reduction is mainly controlled by the relative position of the two pit groups, the timing of excavation unloading, and the opposite directions of excavation-induced lateral soil movement. It also reduced the displacement by 31.6% compared with the slipway-first sequence.
This reduction can be explained by the partial counteraction of lateral soil movements induced by the two oppositely located pit groups. In the single-slipway-pit case, excavation unloading mainly occurs on one side of the building, causing the surrounding soil and adjacent piles to move toward the slipway pit. When the shipbuilding pits are excavated on the opposite side at the same time, the unloading-induced soil movement develops in the opposite direction. Therefore, the two lateral deformation tendencies partly offset each other, reducing the net horizontal displacement of the building pile. In contrast, when the pits are excavated sequentially, the pile first accumulates deformation toward the pit excavated earlier, and the later excavation cannot fully reverse this accumulated displacement.
Simultaneous excavation is recommended mainly for building-centered pit layouts in which pit groups are located on opposite sides of the protected structure, and the excavation-induced lateral soil movements can act in opposite directions. Its application also requires sufficient retaining-system stiffness, reliable groundwater control, and a construction schedule that allows the main excavation stages of the pit groups to be coordinated. In practice, this strategy may be limited by site access, equipment allocation, pumping capacity, support installation sequence, and safety monitoring requirements. Therefore, simultaneous excavation should be adopted only when the construction organization and groundwater-control system can maintain stable excavation and dewatering conditions.
It should also be noted that this study mainly evaluated the deformation response of adjacent building piles and inter-pit ground movement. A full multi-criteria safety assessment, including stage-by-stage internal forces of piles and retaining structures, strut forces, basal stability, hydraulic stability, pore-pressure evolution, and pumping demand, was not performed. Therefore, the simultaneous excavation case should not be regarded as universally optimal. It represents a favorable deformation control case under the specific layout, geological conditions, groundwater-control assumptions, and construction sequence considered in this project.
The displacement reduction observed in this study appears more pronounced than the deformation interaction reported in several soft-soil excavation cases [
22,
24,
26]. This difference may be related to the gravel-dominated ground at the present site. Gravel layers have higher stiffness and permeability than soft clay or deep silt, which may allow excavation-induced stress redistribution to be transmitted more efficiently and over a longer distance. As a result, the counteracting effect between the slipway pit and the shipbuilding pits became more pronounced. In contrast, plastic deformation, creep, and excess pore-pressure dissipation in soft soil may weaken the opposing soil movements, thereby reducing the degree of displacement cancelation.
The heave-to-settlement transition occurred when the spacing between the slipway pit and the shipbuilding pits increased to about 90–100 m. Previous excavation databases and case histories show that ground movement is strongly affected by ground condition, support stiffness, excavation geometry, and construction method [
35,
36]. Therefore, the 90–100 m transition should be treated as an approximate project-specific range rather than a deterministic threshold or a general empirical rule. Similarly, the 45.7% reduction in pile displacement depends on the specific excavation geometry, opposite-side pit arrangement, gravel-dominated strata, river-connected groundwater condition, and retaining-system parameters in this project. These values should therefore be used as quantitative evidence for the present case rather than directly transferred to other projects without additional validation.
Several limitations should be noted. First, each soil layer was treated as homogeneous and isotropic, although natural gravel deposits often show spatial variability and anisotropic permeability. Second, the modified Mohr–Coulomb model was used to represent the soil behavior. This model is suitable for comparing overall deformation trends in engineering-scale excavation analysis, but it may not fully capture small-strain stiffness, stress-path-dependent hardening, or progressive stiffness degradation. Third, the gravel aquifer was represented as an equivalent continuum, and the seepage field was described by Darcy flow. Therefore, local non-Darcy flow near pumping wells, seepage concentration zones, or coarse gravel channels was not explicitly simulated. Fourth, the pile–soil interface was represented using a constant shear stiffness ratio, and more advanced interface models may improve predictions under repeated loading or progressive degradation. Finally, this study focused on a specific pit layout, geological profile, groundwater condition, and retaining system. More complex layouts, including staggered pits or pits on three or four sides of a building, may produce different interaction patterns. Long-term consolidation settlement and tidal effects were also not considered and should be examined in future studies.