1. Introduction
Permafrost on the Tibetan Plateau is warming and degrading, with consequences that include active-layer deepening, rising ground temperatures, and declining frozen-ground thermal stability [
1,
2,
3,
4]. Because these changes couple thermal, hydrological, ecological, and infrastructure questions, their evaluation increasingly requires cross-disciplinary evidence [
5]. They are especially important along the Qinghai–Tibet Engineering Corridor (QTEC), which contains the Qinghai–Tibet Highway (QTH), Qinghai–Tibet Railway (QTR), pipelines, transmission lines, and other infrastructure [
6]. Permafrost degradation, thaw of ice-rich soil, and development of thaw bulbs can contribute to settlement, embankment deformation, cracking, drainage disturbance, and loss of serviceability [
7,
8,
9,
10,
11,
12].
Published evidence also shows that the economic context is substantial. A regional engineering review reported RMB 0.35–0.47 billion in direct losses associated with frozen-ground environmental damage before 2005 [
12]. More recent scenario-based studies have projected billion-dollar-scale future lifecycle or replacement burdens for infrastructure along the QTEC and QTR [
13,
14]. These estimates differ in spatial scope, price basis, discounting, infrastructure inventory, and adaptation assumptions. They establish the importance of the engineering problem, but they cannot be used to convert a small improvement in ALT estimation into proportional monetary savings. Moreover, ALT is only one component of thaw-settlement hazard: the engineering response to active-layer change also depends on ground-ice content, thaw compressibility, drainage, loading, and asset condition [
8,
9,
11].
Air temperature is the dominant climatic control on permafrost thermal state, but precipitation can modify active-layer dynamics through several opposing pathways. Additional water changes soil thermal conductivity, heat capacity, latent-heat demand, evapotranspiration, and near-surface hydrological connectivity [
15,
16,
17,
18]. Precipitation can also promote vegetation growth; associated changes in canopy shading, litter and organic-layer properties, snow trapping, and evapotranspiration alter surface energy partitioning and may dampen, enhance, or redistribute heat transfer into the ground [
18,
19]. Consequently, a precipitation predictor need not have a spatially uniform causal sign. Along the QTEC, precipitation is strongly seasonal: approximately 80% was previously reported to fall during May–September [
19], and the site-extracted TPMFD climatology used here assigns 87.1% of annual precipitation to May–September and 63.2% to June–August. These months overlap with active-layer development, vegetation activity, and strong surface–atmosphere exchange.
Previous studies have shown that non-temperature environmental conditions modulate Tibetan Plateau permafrost and that borehole records can retain antecedent climatic information [
20,
21]. These findings motivate, but do not answer, the present question. The remaining gap is whether seasonally organized precipitation contains reproducible out-of-sample information after stable site differences, long-term change, previous-year ALT, and air temperature have already been considered. Addressing that gap requires more than a full-sample association: candidate windows must be selected without access to test outcomes, uncertainty must respect repeated observations within boreholes, temporal-null tests [
22] must retain serial structure, and monitored-site temporal updating must be distinguished from transfer to geographically excluded sites.
The magnitude of any increment is as important as its statistical reproducibility. A small reduction in aggregate prediction error can persist across held-out years without representing millimeter-scale physical resolution at an individual borehole-year or a material change in an engineering decision. Measurement scale, candidate-selection optimism, dependence among sites and years, and the availability of target-year information must therefore be considered together.
We treated predictive improvement, physical interpretation, geographic transfer, and engineering value as four separate questions. The objectives were to (1) construct annual, warm-season, core-monsoon, and cold-season precipitation windows from monthly TPMFD data; (2) compare post-screening fixed candidates with a pipeline that repeated window selection within each training period; (3) evaluate temporal alignment using corrected, selection-aware circular-shift tests; (4) examine sensitivity to season boundaries, predictor cutoff, rolling start year, learner, and permafrost thermal state; and (5) test strict spatial-block × time transfer. This hierarchy estimates the magnitude and domain of a predictive increment. It does not identify a unique hydrothermal mechanism, demonstrate a pre-season forecast, or quantify infrastructure maintenance benefits.
2. Materials and Methods
2.1. Study Area, Borehole Observations, and Metadata Screening
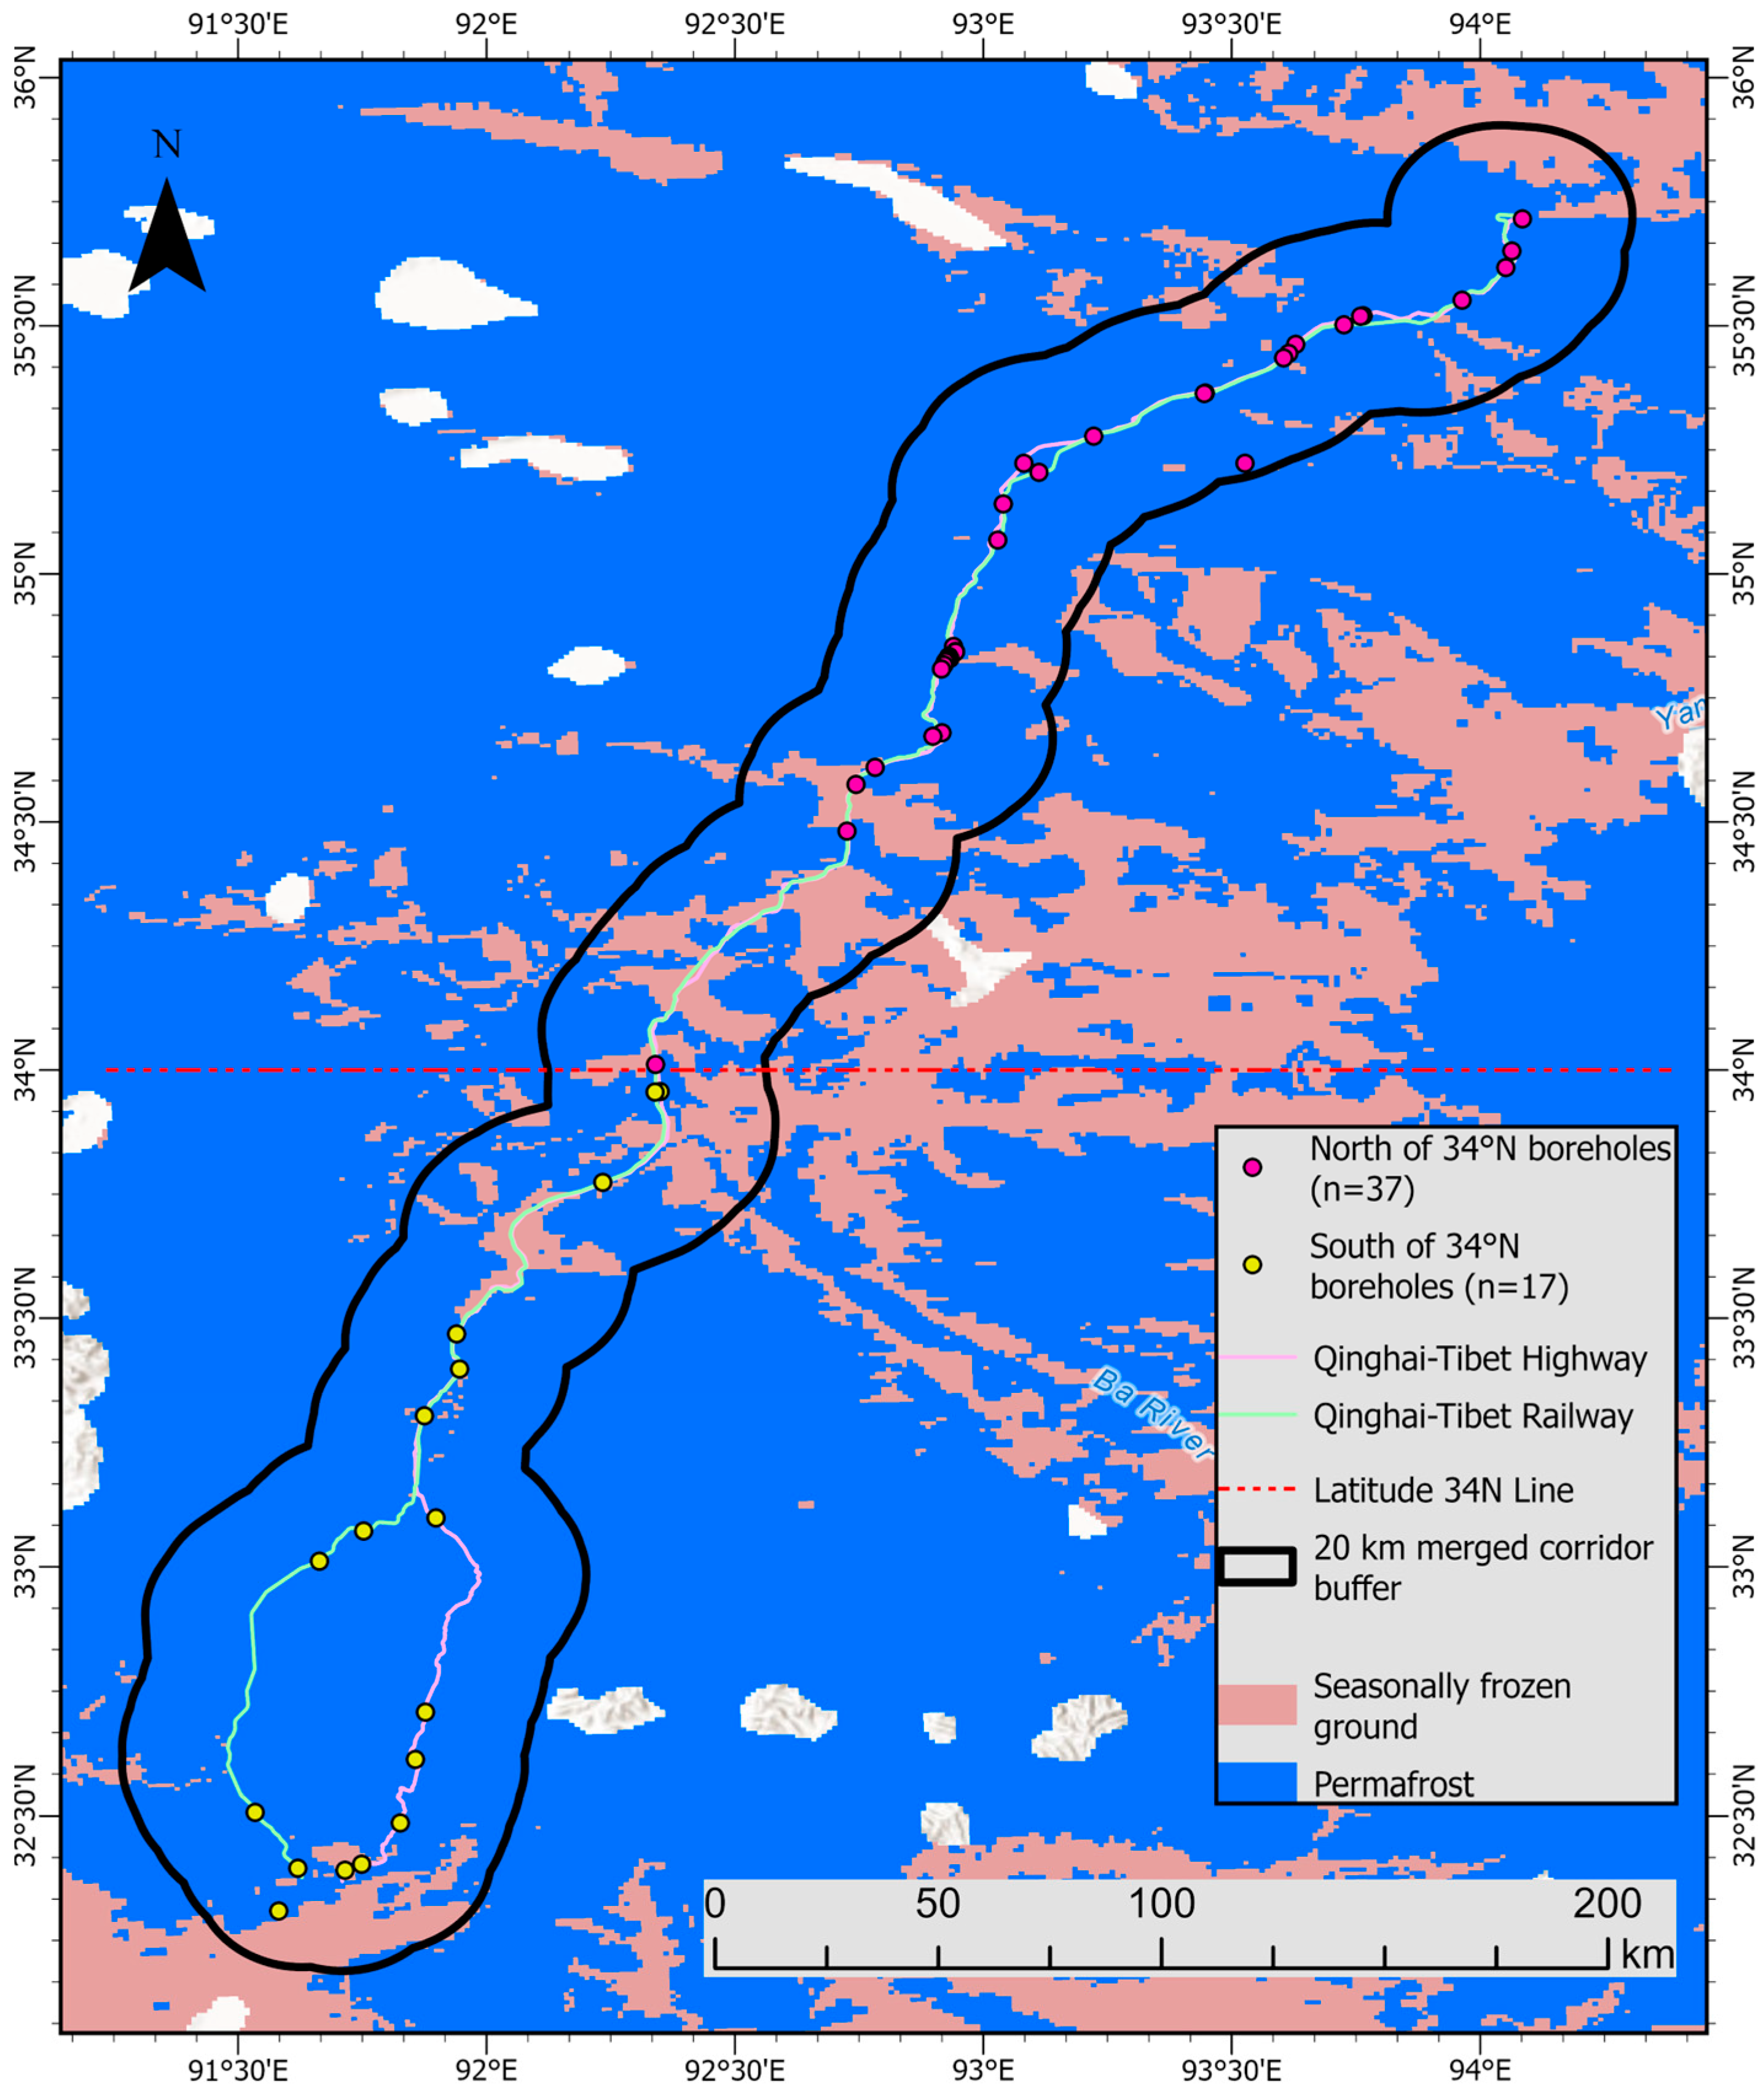
The study area covers the Xidatan–Anduo section of the QTEC on the central Tibetan Plateau, extending from approximately 91.53 to 94.08° E and from 32.31 to 35.72° N [
6,
10]. This section traverses pronounced gradients in latitude, elevation, vegetation, geomorphic setting, and hydrothermal conditions. The 54 boreholes retained for analysis range from 4464 to 5059 m a.s.l. and therefore constitute a heterogeneous monitored transect rather than a single local cluster [
20]. For map-based site screening, 20 km buffers [
6,
23] were constructed around the QTH and QTR alignments between Xidatan and Anduo and dissolved into a single analysis boundary of approximately 24,094 km
2. All 54 retained boreholes are located within this boundary, as shown in
Figure 1.
Permafrost observations were obtained from the public borehole dataset described by Fu et al. in 2025 [
20]. The principal response variable was annual ALT for 2001–2020. The ALT, TTOP, PT10_m, and PT15_m sheets in the released workbook each contained 55 borehole identifiers, whereas the accompanying SITE metadata sheet contained 54. WL3 was the only identifier present in the four observation sheets without a corresponding SITE record; it therefore lacked the coordinates and site attributes required for climate extraction and spatial analysis. In addition, the WL3 columns contained no valid ALT or TTOP values, although PT10_m and PT15_m values were present. WL3 consequently lacked both the ALT response and the spatial metadata required for the ALT–climate analysis and was excluded before model construction. The resulting analytical panel comprised 54 boreholes with complete annual ALT records for all 20 years, yielding 1080 site-year observations.
Observed ALT ranged from 0.82 to 7.80 m, with a median of 2.755 m. These values characterize the monitored panel and should not be interpreted as a spatially uniform thaw regime. TTOP and the annual mean ground-temperature fields at 10 and 15 m depth (source fields PT10_m and PT15_m) were retained for contextual interpretation and cross-variable consistency checks; they were not included as predictors in the primary rolling-origin ALT models. Source missing-value symbols were converted to missing values, and no interpolation or model-based imputation was introduced in the present study. According to the accompanying documentation, ALT was interpreted from temperature–depth profiles with a typical uncertainty of approximately ±0.05 m [
20,
21], and source-level quality control addressed outliers, instrument errors, and data gaps. This measurement uncertainty remains part of the response data and is not removed by subsequent statistical modeling.
Available site metadata included longitude, latitude, elevation, ecological type, vegetation cover, volumetric moisture content, source-provided MAGT, geomorphic unit, and soil type. Because MAGT was subsequently used for thermal-state effect-modification and engineering-classification analyses, its consistency with the annual ground-temperature and ALT records was examined before those analyses [
15,
24]. The released files did not document the measurement depth or reference period represented by the static MAGT field. TG2 was the only site with a positive static MAGT and therefore the only site for which that omission created a material thermal-state provenance question. The source value was retained without correction. TG2 remained in the 54-site primary prediction panel because static MAGT was not part of the primary rolling-origin predictor set, but it was excluded from the principal thermal-state interpretation. The source-record evidence and analysis rule are specified in
Section 2.8, and the corresponding 54-site/53-site prediction sensitivity is reported in
Supplementary Table S1.
Table 1 summarizes the study coverage, sample construction, response uncertainty, validation period, and principal interpretation boundaries.
2.2. Monthly TPMFD and Regional Precipitation Climatology
Monthly near-surface air temperature and precipitation were sampled at the 54 borehole coordinates from TPMFD [
25,
26] for 1986–2020, yielding a complete panel of 22,680 site-month records (54 sites × 35 years × 12 months). The archived extraction script selected the nearest TPMFD grid cell to each borehole coordinate; no spatial interpolation between grid cells was applied. Temperature was converted from kelvin to degrees Celsius, and the annual air-temperature variable used in the models was the arithmetic mean of the 12 extracted monthly values. The extracted precipitation field is a monthly mean rate in mm h
−1. Monthly total precipitation was calculated as
where
is the monthly total (mm),
is the monthly mean precipitation rate (mm h
−1), and
is the number of calendar days in month
. Aggregated annual totals reconstructed from the monthly panel agreed with the independently prepared annual TPMFD table within floating-point precision, providing a consistency check on unit conversion and temporal aggregation.
For climatological justification, seasonal fractions were calculated for every complete site-year during 1986–2020 and then summarized across sites. Site-mean annual precipitation ranged from 426.6 to 713.8 mm yr
−1. May–September contributed 87.1% of the all-site-year total precipitation; mean site climatological fractions ranged from 72.2% to 91.2%. June–August contributed 63.2%, with site climatological means ranging from 50.4% to 67.2%. These data, together with regional climatological literature [
19,
27,
28,
29], support May–September as the broad thaw/warm season and June–August as a compact core-monsoon window. Because monsoon onset and withdrawal vary, adjacent boundaries were treated as sensitivities rather than independent mechanistic discoveries. The complete climatological summary is reported in
Supplementary Table S2a.
2.3. Seasonal and Multi-Year Precipitation Candidates
Four principal seasonal totals were constructed: January–December annual precipitation, May–September warm-season precipitation, June–August core-monsoon precipitation, and the preceding October through current April cold-season precipitation. The cold season was assigned to its ending year, and
Table 2 summarizes these four principal definitions. June–September, May–October, preceding November–current March, and preceding October–current May were evaluated separately as boundary sensitivities.
For site
, target year
, season
, and a four-year block beginning at lag
, the multi-year seasonal-precipitation predictor was defined as
where
is the total precipitation for season
at lag
. Four lag blocks (0–3, 4–7, 8–11, and 12–15 years) crossed with the four principal seasonal definitions to create 16 fixed candidates. Because predictors were standardized within each training fold, the four-year mean rather than the corresponding sum changes only scale, not fitted predictions. The 0–3-year block spans the target year and its three preceding years. The monsoon version reported as the best fixed candidate was identified after comparing all 16 out-of-sample candidate results and is therefore a post-screening descriptive estimate. A separate pipeline selected one of the sixteen candidates using only the training data within each rolling fold.
The annual, warm-season, and monsoon 0–3-year windows include precipitation from target year . Exact within-year ALT observation dates were unavailable in the public data product. Rolling-origin fitting prevents future years from entering model fitting, but it does not create an operational lead time within year . Accordingly, the main analysis is interpreted as retrospective or end-of-season annual estimation, not a pre-season forecast. A stricter sensitivity used only June–August precipitation from years − 1 to − 4.
2.4. Rolling-Origin Linear Models
The external test years were 2012–2020. With previous-year ALT required, the first origin used 10 complete model years (2002–2011; 540 site-year records) for training and retained nine consecutive annual test sets, following the principle of rolling-origin time-series evaluation [
30,
31]. Starting in 2011 or 2013, we examined the sensitivity. At every origin
, only years before
were used for fitting, standardization, temperature-lag selection, precipitation-window selection, and hyperparameter selection. Each test fold contained 54 boreholes, giving 486 held-out site-year predictions across the principal evaluation. Test-year ALT values were used only after predictions had been generated; they did not enter any preprocessing, model selection, fitting, or tuning step.
The baseline model was calculated as
where
is a site fixed effect,
is a quadratic time trend,
is previous-year ALT, and
is annual air temperature at lag
. The lag
was selected by Bayesian information criterion using the training set only. Continuous predictors were standardized using training means and standard deviations and then applied unchanged to the test year.
For every precipitation candidate, an otherwise identical model added the standardized precipitation window. Performance was pooled over all 486 external predictions. Incremental gain was calculated as
Positive indicates lower out-of-sample error after adding precipitation. A fixed candidate and the training-selected pipeline answer different questions: the former estimates the performance of a named window, whereas the latter estimates the attainable gain when the window must be selected without observing test outcomes.
2.5. Cluster Bootstrap and Corrected Temporal-Null Tests
Uncertainty in
was summarized using 5000 site-cluster bootstrap repetitions [
32]. The paired baseline and precipitation-model squared errors were grouped by borehole; boreholes were sampled with replacement, and all nine held-out errors from a sampled borehole were retained. This preserves both the pairing of competing predictions and within-site dependence across test years. Models were not refitted within each bootstrap repetition, so the interval quantifies site-cluster variation in the realized external prediction errors rather than uncertainty from repeating the complete training process.
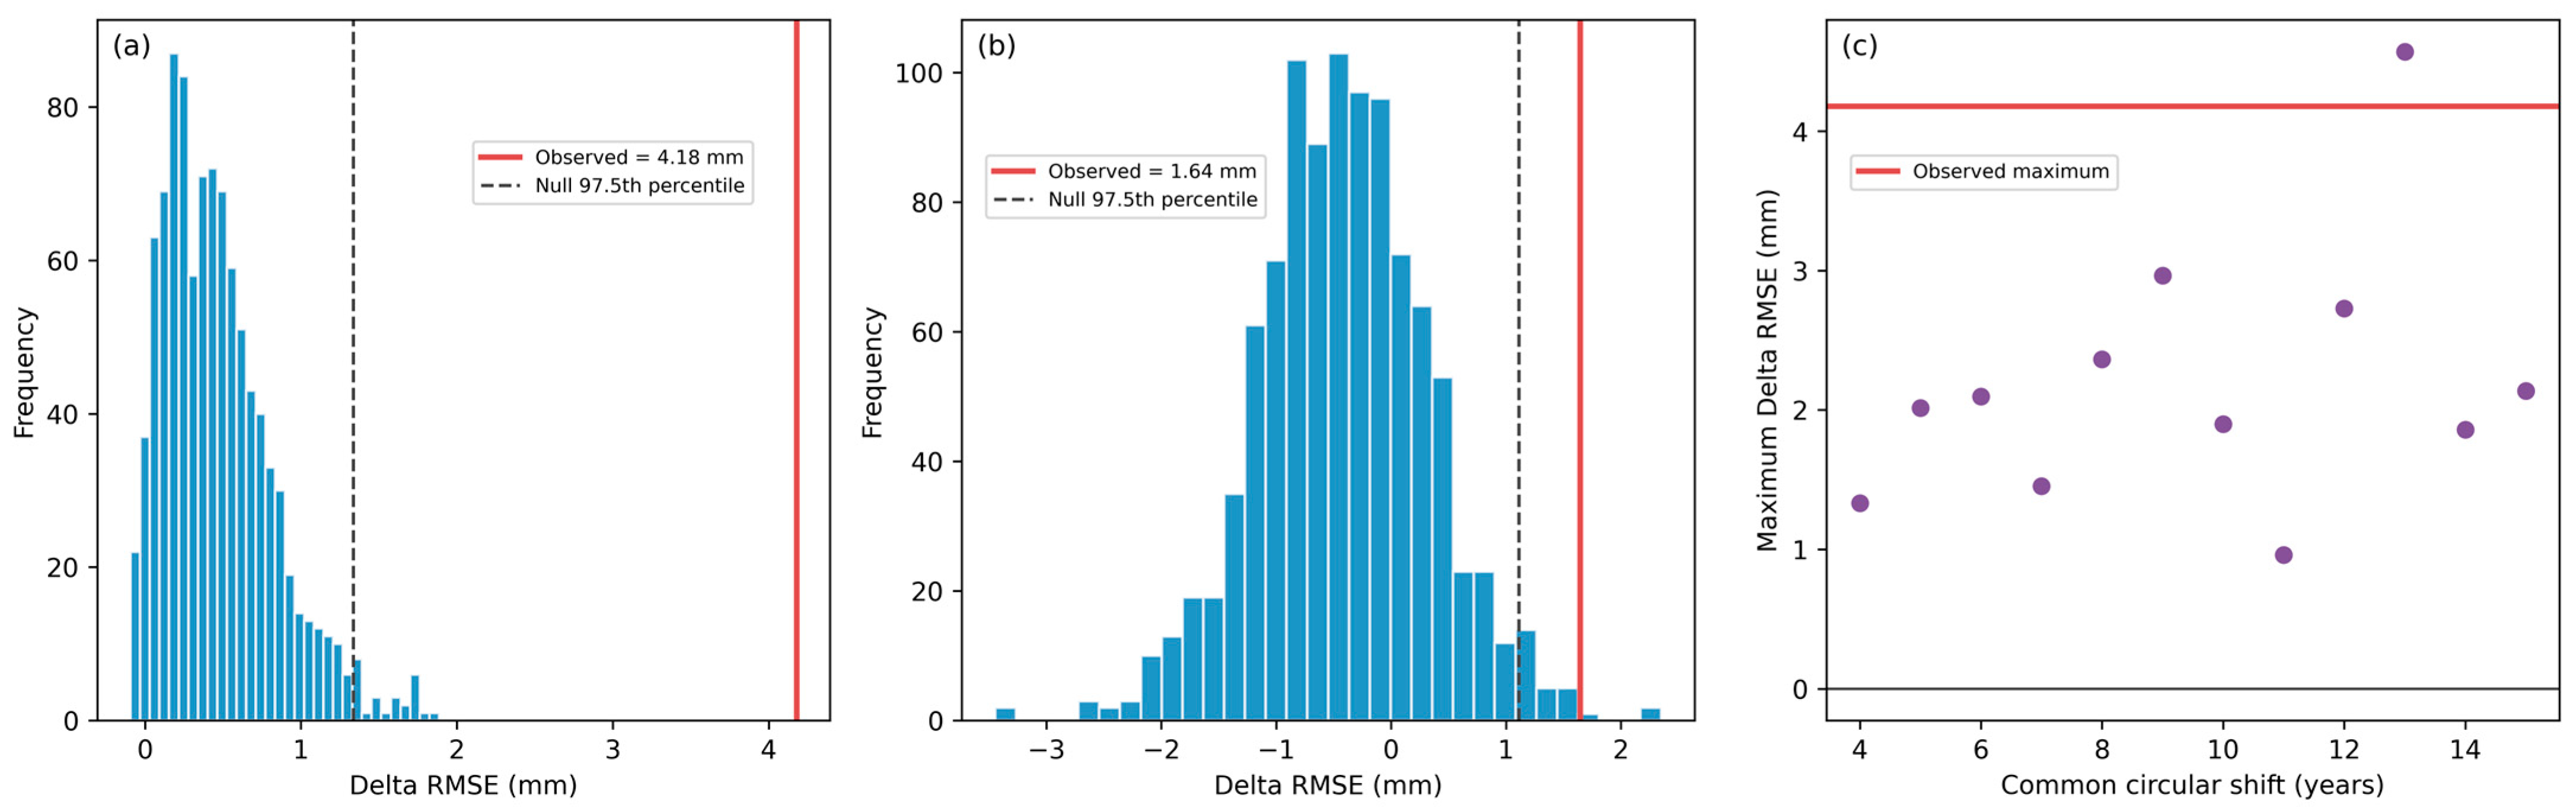
A 999-repetition within-site circular-shift test evaluated whether the observed temporal alignment exceeded alignments generated by shifting precipitation in time [
22]. All 16 candidate columns were shifted jointly within each site so their mutual structure was retained. For a series of length
, a shift
has circular distance
. The conservative null allowed only
years. With the 19-year complete series, admissible shifts were 4–15; shifts 16–18 were excluded because their reverse circular distances are only 3–1 years. The full rolling evaluation, including training-only candidate selection where applicable, was repeated for every null realization.
Two selection-aware statistics were evaluated in every null repetition: (1) the maximum external
among all 16 fixed candidates and (2) the
of the pipeline that repeated training-only BIC selection within every rolling fold. Candidate-specific, maximum-statistic, and training-selected null summaries are provided in
Supplementary Table S3. The one-sided finite-sample
p values used were calculated as
where
is the RMSE reduction obtained from each circularly shifted precipitation series,
is the RMSE reduction obtained from the correctly aligned observed series, and
is the total number of circular-shift repetitions (999 in this study). The addition of 1 to both the numerator and denominator provides a finite-sample correction and prevents a zero
p value.
Independent site-specific shifts preserve each site’s marginal distribution and temporal dependence but weaken synchronous cross-site climate structure. We therefore added a common-shift sensitivity in which all sites received the same admissible circular shift. This retains cross-site coherence but yields only 12 distinct shifts, limiting attainable finite-sample significance.
2.6. Seasonal-Boundary, Prediction-Cutoff, and Rolling-Start Sensitivities
Eight unique seasonal definitions were reconstructed directly from the monthly panel: the four principal definitions and four adjacent-boundary alternatives. Each was evaluated with the same baseline specification, rolling origins, sign convention for , borehole-cluster bootstrap, and corrected circular-distance null. To avoid treating several nearby warm-season calendars as independent confirmations, a maximum statistic was also calculated across the eight displayed boundaries. Predictor availability was examined separately by replacing the target-year-inclusive 0–3-year mean with a June–August mean over years − 1 to − 4. Finally, the rolling evaluation was repeated with the first test years 2011, 2012, and 2013, corresponding to 9, 10, and 11 initial complete training years. These checks address calendar choice, information cutoff, and evaluation-start dependence without changing the primary model after observing their outcomes.
2.7. Algorithm Benchmarks
Algorithm dependence was examined with ridge regression, random forest, and histogram gradient boosting [
33,
34]. Every learner used the same outer 2012–2020 rolling origins and the same baseline information: quadratic year terms, previous-year ALT, the training-selected air-temperature lag, and site identity for already monitored sites. Each algorithm was fitted both without and with the fixed monsoon 0–3-year precipitation predictor. Hyperparameters were selected using the two latest training-only inner rolling origins, preserving temporal order inside every outer fold.
The prespecified ridge penalties were 0.1, 1, 10, and 100. Random forests used 200 trees and crossed maximum-feature fractions of 0.5 or 1.0 with minimum leaf sizes of 2 or 5. Histogram gradient boosting used a learning rate of 0.05 and 250 iterations; four combinations of 7 or 15 terminal nodes, minimum leaf sizes of 10 or 20, and L2 regularization of 0, 1, or 5 were evaluated as coded. The identical outer folds and paired feature sets make the within-learner RMSE difference interpretable as the precipitation increment, whereas absolute RMSE differences among learners also reflect their distinct functional forms and regularization.
2.8. Thermal-State Analysis
Before testing thermal-state effect modification, we examined the source fields for TG2 in greater detail. The site has a static source-provided MAGT of +0.66 °C; its ALT was 4.38 m in 2001 and 7.05 m in 2020, mean PT10_m over 2001–2020 was +0.136 °C, and no valid PT15_m series was available. These observations describe an unusually warm and changing ground-thermal setting, but they do not distinguish among very warm or degrading permafrost, possible talik development, and differences in the depth or reference period represented by the static MAGT field. We therefore did not relabel TG2 or treat its MAGT as a confirmed error. All principal ALT-prediction models retained TG2, while the thermal-state diagnostics described below used the 53-site panel. The core rolling-origin model comparisons were also repeated without TG2 to evaluate whether the prediction result depended on this data-provenance decision (
Supplementary Table S1).
Potential effect modification was assessed primarily by adding a centered, standardized interaction to the same rolling model. Because site fixed effects absorb the time-invariant MAGT main effect, the interaction tests whether the precipitation slope varies with thermal state. External RMSE of the interaction model was compared with that of the precipitation-only model. Site-level gain was calculated from each of the borehole’s paired held-out baseline and precipitation-model errors before its association with MAGT were assessed using Spearman correlation. An exploratory full-panel coefficient used site-clustered covariance. The continuous interaction was the primary diagnostic; engineering groups were used only for descriptive stratification because sample sizes were unequal and the thresholds were not estimated from these data.
For engineering-oriented description, sites were grouped following GB 50324–2014 [
35]: stable (MAGT < −2.0 °C), basically stable (−2.0 ≤ MAGT < −1.0 °C), unstable (−1.0 ≤ MAGT < −0.5 °C), and extremely unstable (MAGT ≥ −0.5 °C). Excluding TG2, these groups contained 6, 15, 14, and 18 sites. A −1 °C QTR-oriented high-/low-temperature split was secondary. Thresholds were treated as engineering classifications, not universal natural discontinuities.
2.9. Strict Spatial-Block × Time Transfer
The boreholes were ordered by latitude and assigned once to five contiguous blocks containing 10–11 sites; membership remained fixed across all nine test years. For every target year from 2012 to 2020, one block was held out and the model used only earlier years from the other four blocks. Site fixed effects were not used. Two transfer modes were evaluated. The conditional mode retained from each held-out site and therefore represents geographic coefficient transfer when local monitoring history exists; it is not a cold-start test. A deliberately stringent no-target-history mode removed all target-site ALT outcomes and used only year terms, air temperature, latitude, longitude, elevation, volumetric moisture content, and MAGT. Neither mode represents evidence of successful deployment unless precipitation improves its matched baseline.
2.10. Reproducibility and Analytical Workflow
All analyses were conducted from immutable local input snapshots using explicit random seeds, machine-readable intermediate outputs, and traceable scripts. Each main and supplementary figure is linked to its plotting dataset, and every numerical table is linked to its source result file.
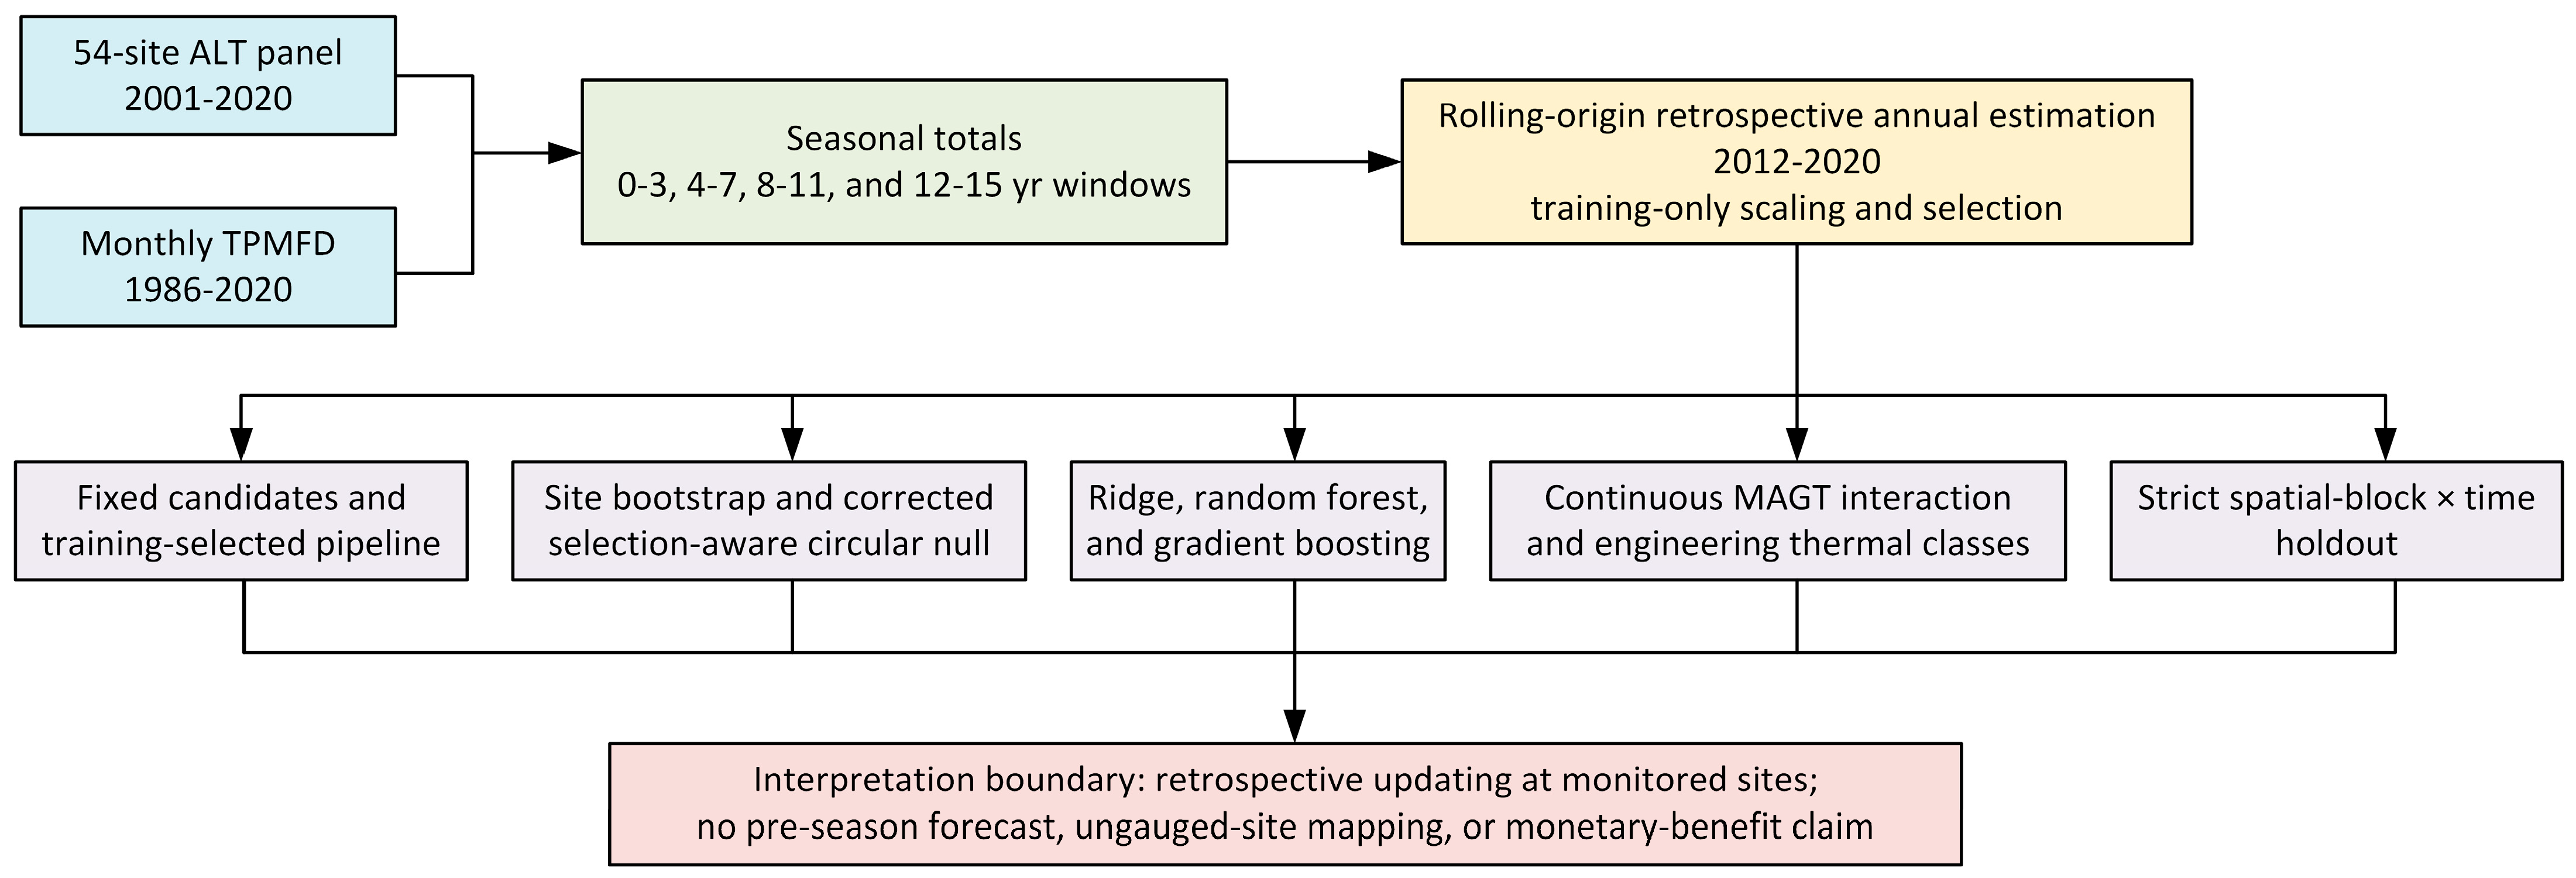
Figure 2 summarizes the analytical workflow and validation hierarchy.
4. Discussion
4.1. Contribution and Magnitude
Recent Tibetan Plateau studies have shown that non-temperature environmental conditions can modulate warming-induced permafrost degradation and that borehole records retain decadal-scale climatic memory [
20,
21]. Those findings establish that ground conditions reflect more than contemporaneous air temperature, but they do not determine whether monthly precipitation can be reorganized into seasonal windows that add out-of-sample information after local baseline behavior and antecedent ALT have been considered. The present study addresses that narrower question. It is therefore a seasonal incremental-prediction analysis rather than a broad attribution analysis of permafrost degradation.
The main contribution is not a large improvement in ALT estimation. It is an explicit estimate of the small information increment associated with precipitation timing after stable site differences; temporal trend, previous-year ALT, and temperature have already been considered. This is a deliberately conditional quantity: it asks whether precipitation reduces the residual predictive error of a strong monitored-site baseline, not whether precipitation is a dominant control of ALT.
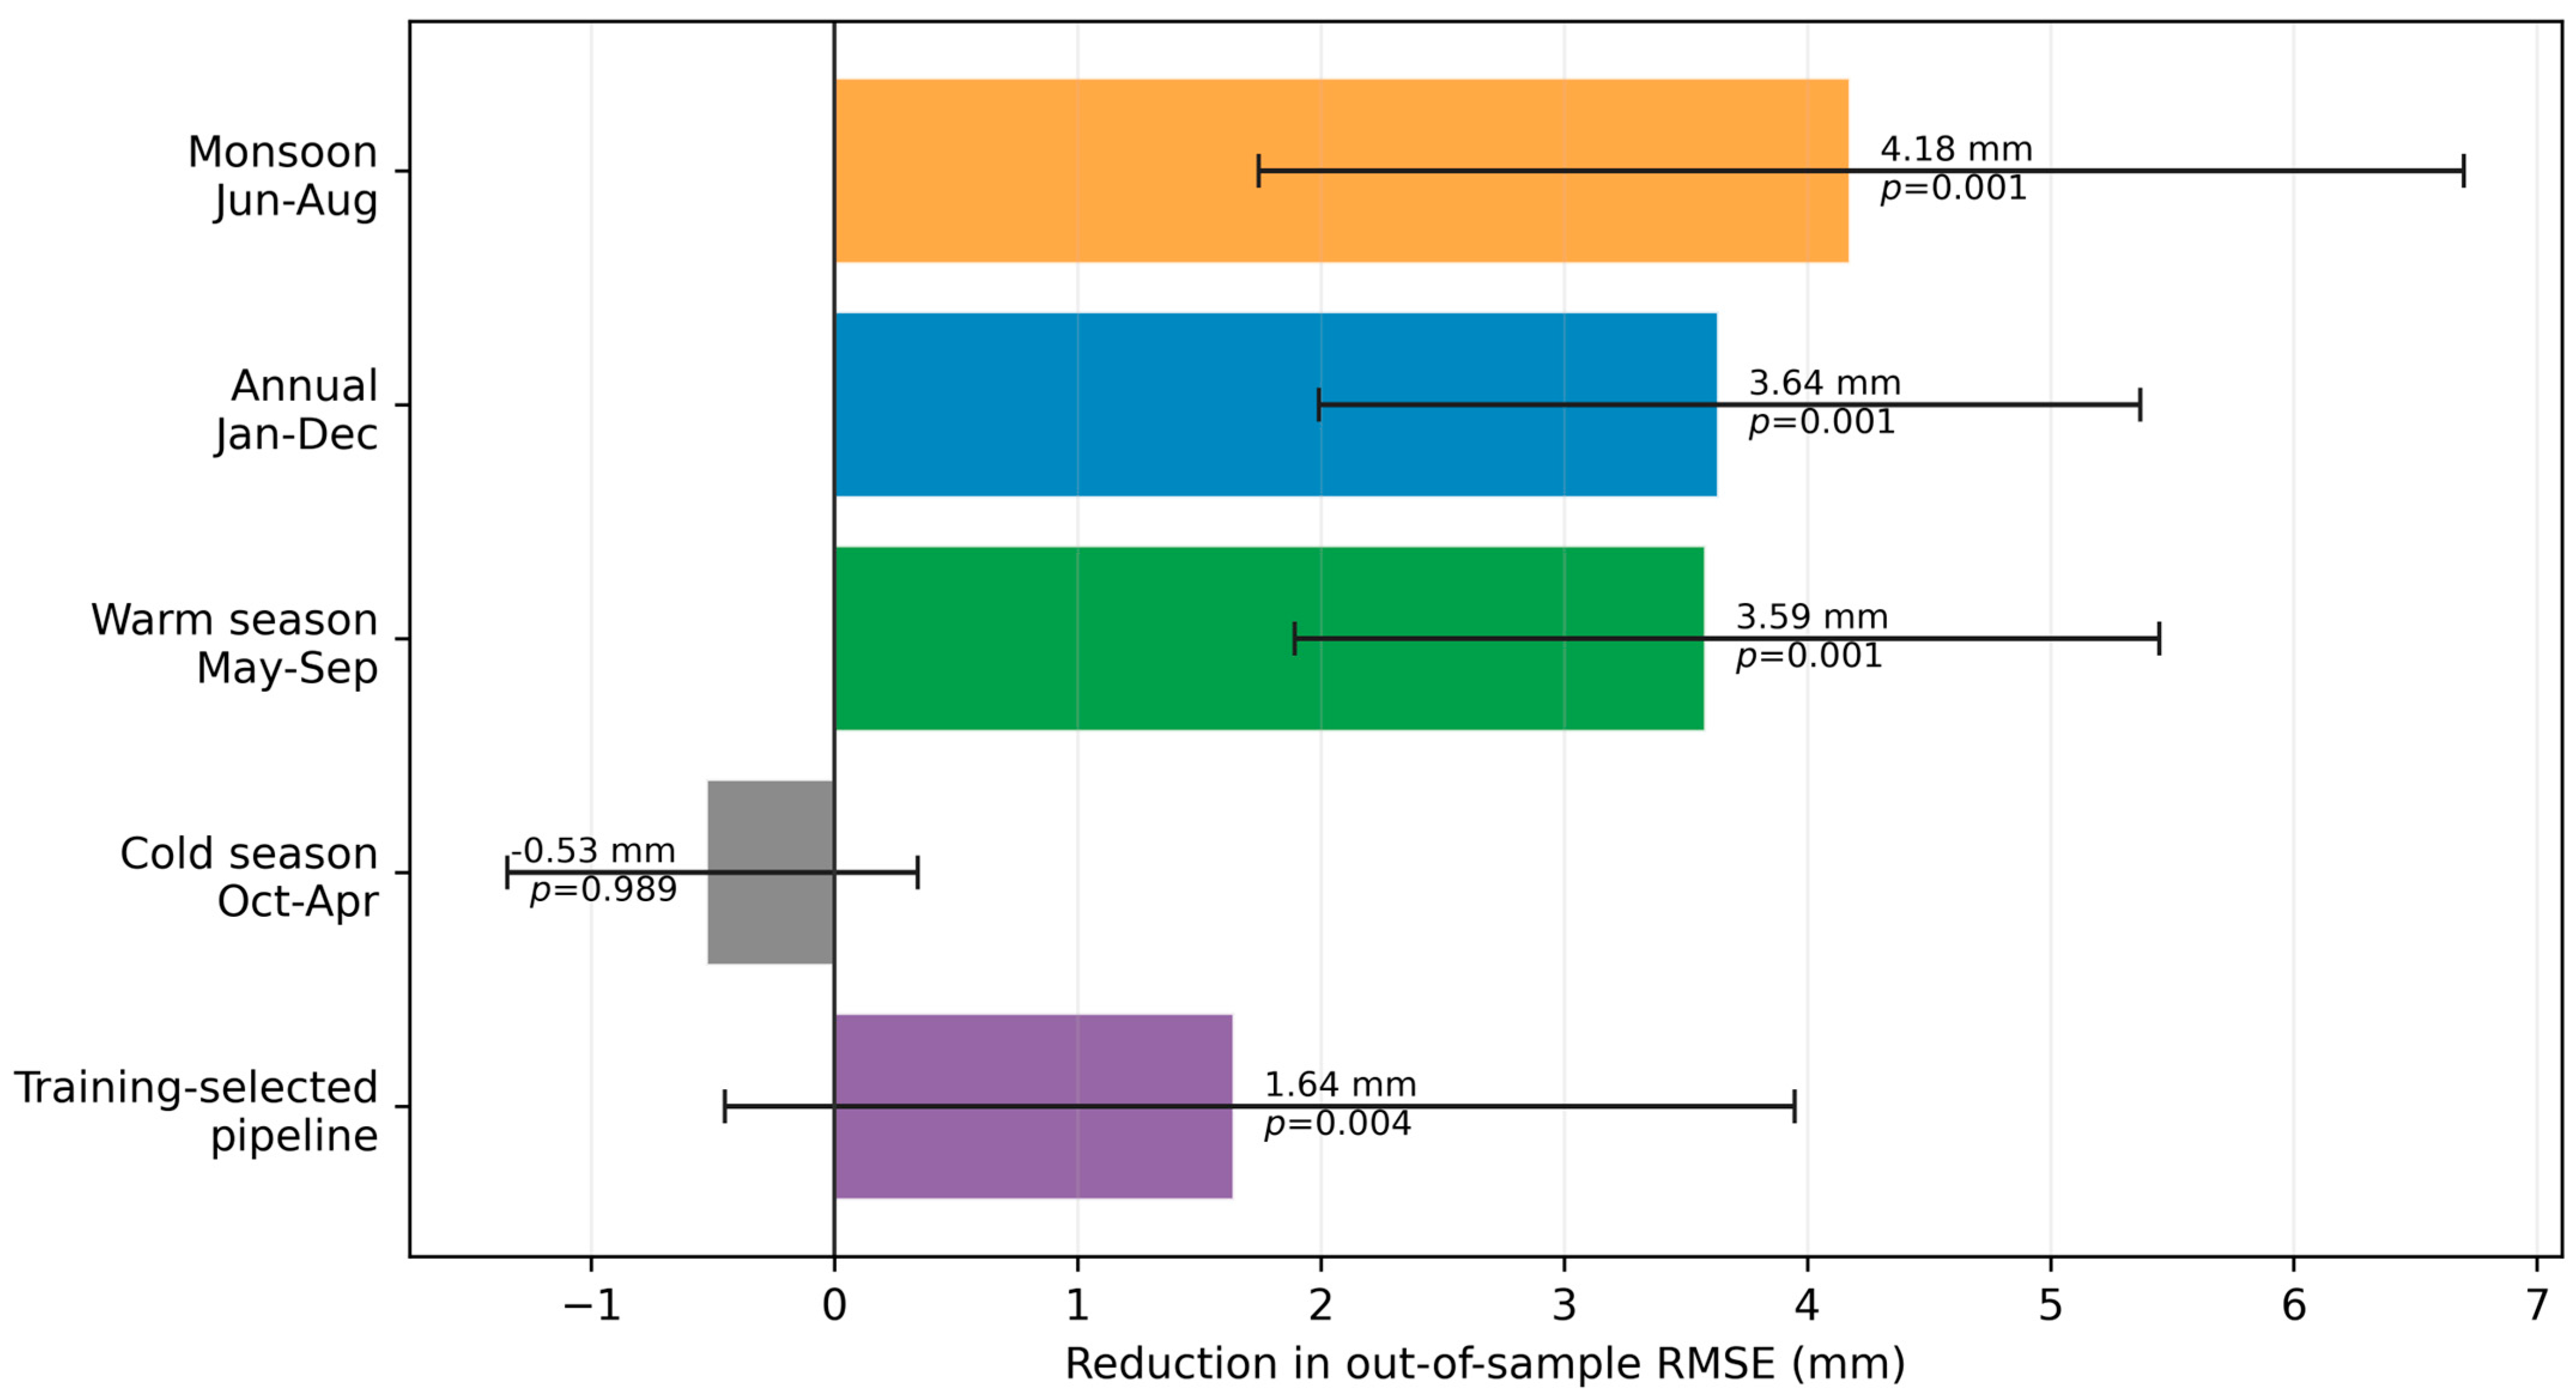
The post-screening and training-selected results describe different estimands. The strongest fixed candidate reduced pooled RMSE by 4.179 mm after the 16 candidates had been compared, whereas the pipeline that had to choose its window from training data alone reduced it by 1.645 mm. The difference provides an empirical indication of selection optimism. Selection-aware sitewise temporal-null tests remained supportive, but the common-shift test preserving synchronous cross-site climate structure was inferentially inconclusive. Site-cluster bootstrap intervals additionally describe variation in the realized paired errors across boreholes; because models were not refitted in each bootstrap repetition, they should not be interpreted as uncertainty for the entire model-development process. This evidence hierarchy is more informative than describing the result simply as robust.
The magnitude also needs to be interpreted against measurement scale. The source-reported ±0.05 m uncertainty is more than ten times the fixed-window RMSE reduction and approximately thirty times the training-selected reduction. Aggregate RMSE differences can be reproducible across 486 predictions even when they are smaller than individual-observation uncertainty because RMSE pools information over sites and years. Nevertheless, the gain cannot be interpreted as millimeter-scale physical measurement accuracy, a directly observable change at a single site-year, or evidence that the model corrects source-level measurement error. Response uncertainty may also attenuate weak climatic relationships and limit the practical distinguishability of competing predictions.
4.2. Physical Interpretation of Warm-Season Timing
The warm-season timing is process-consistent but does not constitute physical proof. During thaw, rainfall can increase liquid-water availability and soil thermal conductivity, while additional water also increases heat capacity and latent-heat demand. Drainage, soil texture, ground ice, and surface water determine whether water promotes downward heat transfer or buffers temperature change [
15,
16,
17,
18]. Precipitation-driven vegetation growth can further modify shading, litter, roughness, evapotranspiration, and snow trapping [
18,
19]. These pathways can produce different net effects among sites.
These competing pathways also mean that the sign of a fitted precipitation coefficient is conditional on the selected covariates, temporal window, and training sample. The present design estimates predictive increment rather than a causal dose–response relationship; predictive gain does not establish that more precipitation increases ALT or engineering risk. The lack of evidence for systematic MAGT moderation further argues against a simple, warmer permafrost–stronger rainfall effect explanation.
The annual candidate likely performs well because it contains the dominant warm-season component. The local TPMFD climatology assigns 87.1% of annual precipitation to May–September and 63.2% to June–August, while neighboring warm-season boundaries yield similar gains. The evidence therefore points to information concentrated in the thaw-season hydroclimatic state, not equal contributions from all months.
4.3. Possible Explanations for the Lack of Cold-Season Predictive Gain
The absence of a cold-season gain was consistent across alternative calendar definitions rather than being an artifact of one boundary. The preceding October–current April, preceding November–current March, and preceding October–current May totals all produced negative
values; for the October–May definition, the borehole-cluster interval was also entirely below zero. Thus, none of the three cold-season totals added predictive information to the matched temperature-and-persistence baseline (
Table 3;
Supplementary Table S4; Figure S1). This convergence across adjacent calendars is more informative than the result from any single boundary.
This predictive result does not imply that winter snow is thermally unimportant. The surface insulation relevant to frozen-ground temperature depends on snow depth, density, thermal conductivity, stratigraphy, duration, onset, melt timing, sublimation, and liquid-water refreezing, not simply on accumulated precipitation [
36,
37]. Rain–snow partitioning can also vary within a nominal cold season. In the windy alpine corridor, preferential deposition, scouring, and redistribution may create large differences in snow cover over short distances even when grid-cell precipitation totals are similar [
36]. Consequently, TPMFD cold-season precipitation is an incomplete proxy for the snowpack properties that control surface thermal resistance.
The conditional model structure provides a second explanation for the small marginal contribution. Annual air temperature represents a major component of atmospheric forcing, while may proxy integrated information from the previous surface energy balance, soil moisture, snow regime, and ground thermal state. If cold-season precipitation affects ALT mainly through processes already expressed in these variables, little independent information will remain after conditioning. In addition, the spatial scale of gridded forcing may be mismatched to borehole-scale snow redistribution, and a seasonal sum cannot resolve whether snowfall occurred early enough to insulate the ground, late enough to delay thaw, or during transient melt–refreeze events.
The appropriate interpretation is therefore conditional and scale specific: aggregated cold-season precipitation did not improve annual ALT estimation in the present data and model, but this is not evidence against snow insulation as a physical control or against its relevance to engineering design. Direct observations of snow depth, snow-water equivalent, density, accumulation and disappearance dates, wind redistribution, surface temperature, and freeze–thaw energy fluxes would be needed to test the winter mechanism. Until such observations are available, the negative predictive result should be used to delimit the current covariate set, not to dismiss winter surface processes.
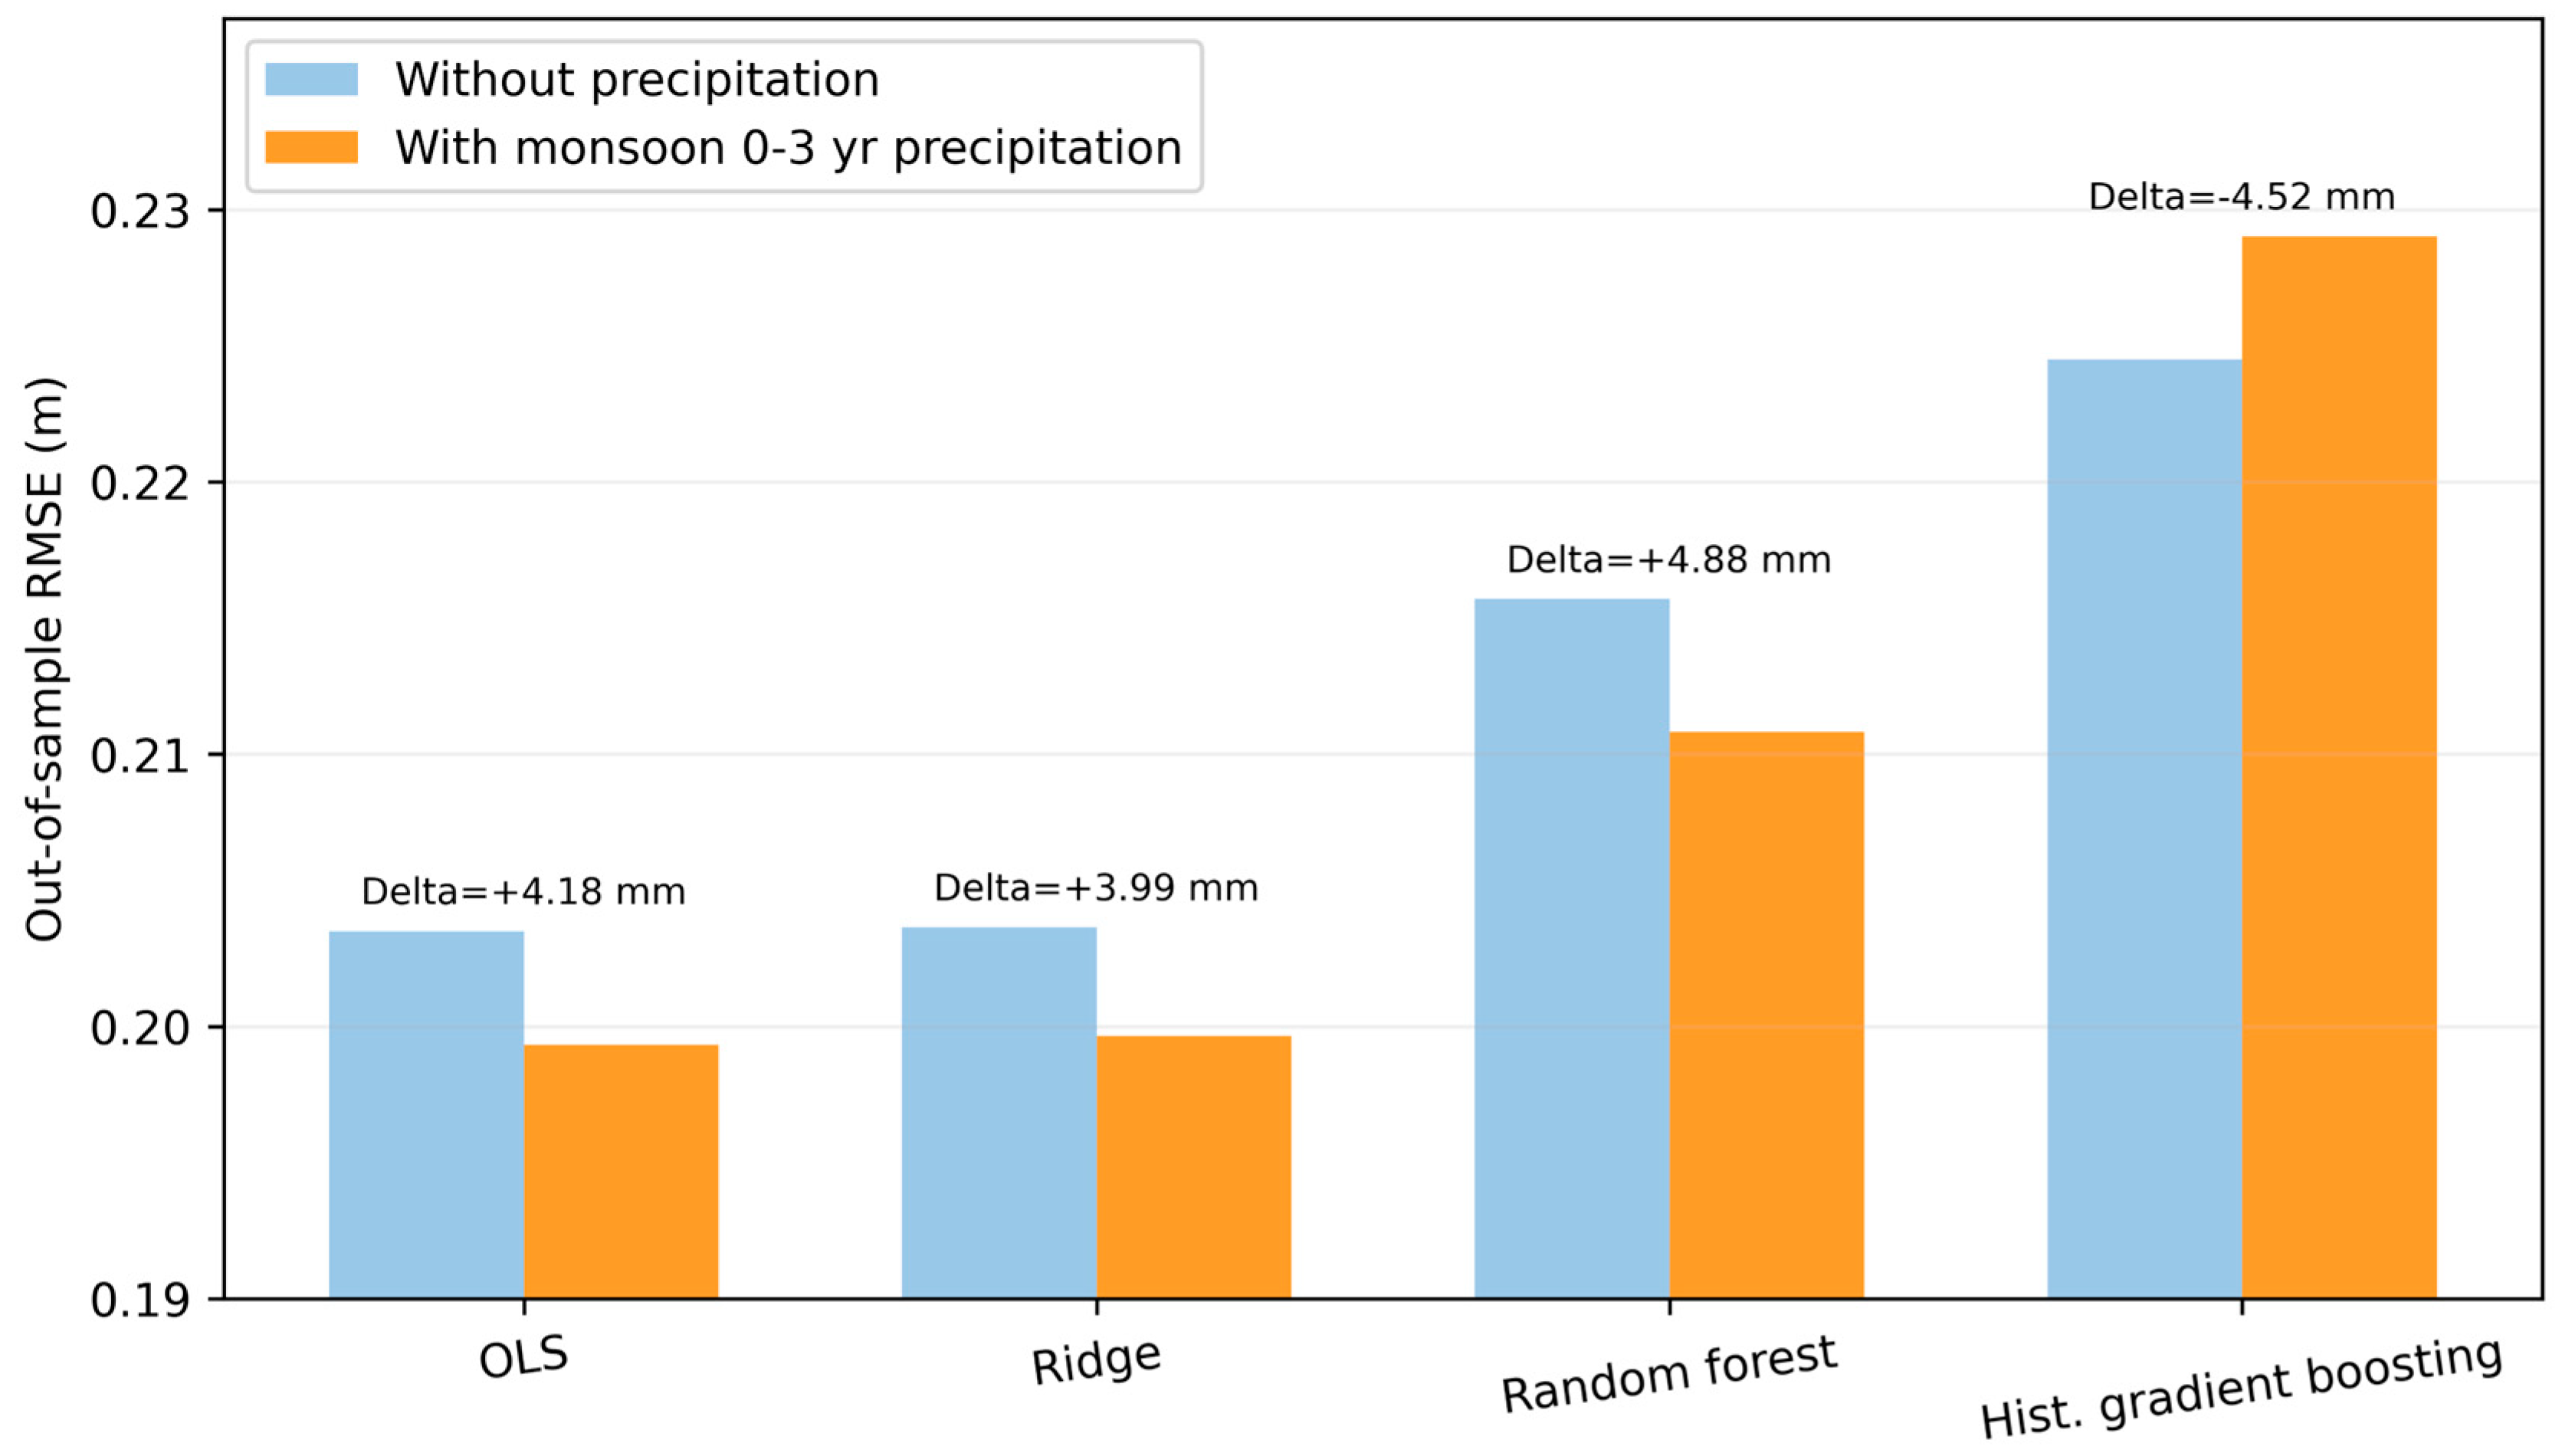
4.4. Algorithm and Model-Selection Dependence
Ridge regression and random forest reproduced a small paired precipitation gain, whereas histogram gradient boosting did not. Complex learners do not automatically improve a short panel with strong site persistence and only nine external annual origins. The linear model encodes the dominant structure explicitly through site effects, temporal trend, autoregression, and temperature. Ridge regression retains that structure while shrinking coefficients, and random forest can represent limited nonlinearities and interactions [
33]. Histogram gradient boosting partitions the feature space more aggressively; with correlated predictors and a modest number of temporally independent test origins, that flexibility may increase estimation variance or allocate capacity to patterns that do not persist out of sample.
The negative gradient-boosting result is therefore scientifically useful, but it is not proof that nonlinear hydrothermal responses are absent. It shows that the tested precipitation increment was not invariant to learner and tuning grid under the available sample. Conversely, positive paired differences for OLS, ridge, and random forest do not constitute three independent significance tests because the learners used the same observations, folds, and precipitation predictor. OLS remains a defensible primary framework because it had the lowest augmented-model RMSE and makes the conditioning structure transparent, not because the benchmark establishes universal linear superiority.
The distinction between fixed and selected candidates is equally important. The 4.179 mm value describes the best named candidate after broad comparison; the 1.645 mm value better represents a model that must choose a window without test outcomes. Both are reported, rather than retrospectively labeling the best candidate as prespecified.
4.5. Temporal Updating Versus Geographic Transfer
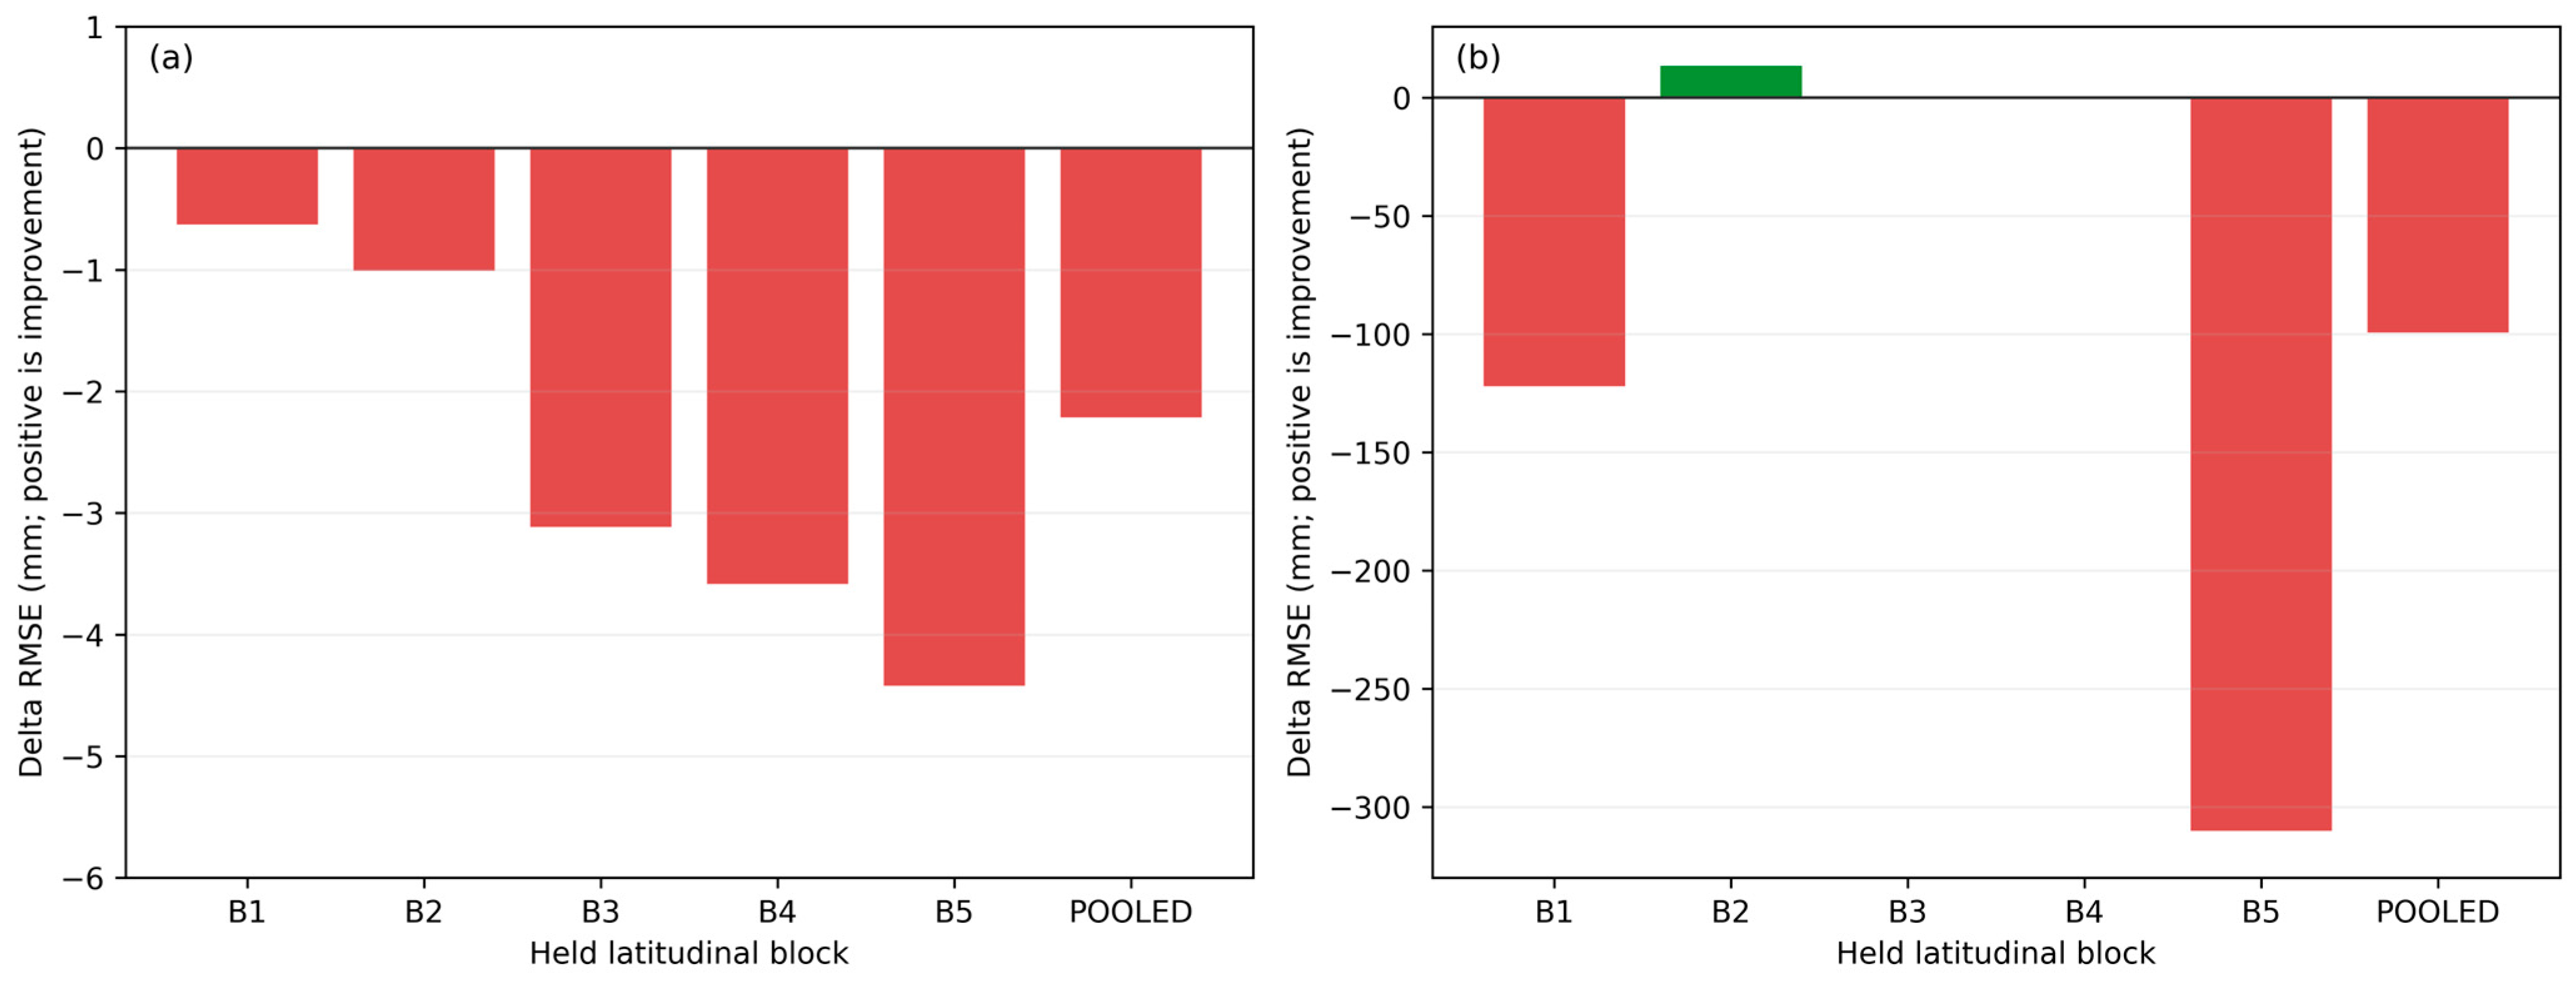
Temporal and geographic validation answer different questions and can legitimately produce different conclusions. Temporal evaluation asks whether precipitation history improves retrospective estimation after a monitored site’s own persistence, baseline level, and previous ALT have been learned. Strict geographic validation removes the held block’s site effects and asks whether relationships estimated from other corridor blocks transfer into later years [
21]. The conditional spatial test still supplies
for the held site, yet precipitation worsened performance in all five blocks. This indicates that the small within-site temporal increment did not translate into a stable cross-block coefficient adjustment.
The no-target-history mode is more stringent. Its large absolute error reflects the loss of site-specific ALT level and persistence as well as limited transferability of the available static covariates; it should not be attributed to precipitation alone. The paired comparison nevertheless remains informative because adding precipitation also worsened that matched baseline. Together, the two modes separate, local history is known but coefficients are imported from no local ALT outcome has ever been observed, avoiding the common mistake of treating a held-site lag as evidence for ungauged deployment.
Weak geographic transfer narrows the domain of use. Local ground ice, soil, vegetation, topography, drainage, disturbance, and engineering structure mediate precipitation–ground interactions [
7,
8,
9,
20,
26,
29,
38]. These properties are not adequately represented by a single gridded precipitation term. Prediction at never-monitored locations requires transferable subsurface and surface covariates and independent validation at sites excluded from every stage of model development.
4.6. Engineering Relevance and Economic Boundary
The engineering relevance is limited but identifiable. At a site with an established ALT record, seasonal precipitation history can be added to a multi-source annual assessment to quantify whether a temperature-and-persistence baseline is less adequate in a particular year [
23]. Whether that information could help prioritize data review is a value-of-information hypothesis that requires prospective decision records; it has not been demonstrated here. The immediate implication is instead to motivate closer integration with direct thermal and deformation observations. However, the no-target-year-precipitation sensitivity showed no gain, so the present model is not an advance-warning trigger. Nor should precipitation be used as a design parameter, stand-alone hazard index, or substitute for deformation, ground-temperature, and ground-ice observations.
This study contains no infrastructure deformation, damage, inspection, intervention, maintenance, or cost outcomes. It therefore cannot show that a 0.81–2.05% RMSE reduction yields measurable maintenance savings. The historical and scenario-based economic literature [
11,
12,
13] establishes that permafrost-related infrastructure impacts can be large, but it does not monetize this model’s incremental information. A value-of-information analysis would require asset-specific deformation, ground ice, damage thresholds, inspection decisions, treatment costs, avoided losses, and evidence that the estimate changes a decision.
The defensible practical conclusion is therefore modest: seasonal precipitation is a contextual covariate for retrospective assessment at already monitored sites. Its potential value lies in enriching a broader evidence system, not in independently triggering engineering intervention.
4.7. Limitations and Future Work
Several limitations remain. First, exact within-year ALT observation dates were unavailable, and the main windows contain target-year climate. The model is retrospective; the fully prior-year precipitation sensitivity did not improve prediction. Second, the best fixed gain is much smaller than individual ALT uncertainty and was selected after candidate comparison. Although maximum-statistic and training-selected null tests were supportive, a common-shift null preserving cross-site coherence was inconclusive because only 12 phases were available.
Third, TPMFD is gridded. Microtopography, vegetation patches, drainage, engineering disturbance, and wind-driven snow redistribution can make borehole conditions differ from grid-cell climate [
22,
25,
34,
36]. Fourth, no soil moisture time series, snow measurements, surface-energy fluxes, or ground-ice profiles were available to isolate mechanisms. Coefficient signs from these conditional predictive models must not be generalized causally.
Fifth, the released static MAGT field lacks a documented measurement depth and reference period; this limitation is particularly consequential for the positive value at TG2 and prevents an unambiguous classification of that site. Thermal-state inference was therefore based on 53 sites, while the 54-site/53-site comparison showed that the core prediction result was not dependent on TG2. The stable engineering class contained only six sites, limiting subgroup precision. Sixth, the 2012–2020 evaluation provides nine annual test origins rather than a long independent record. Finally, strict spatial transfer failed, and no infrastructure-response or cost data were available.
Future work should collect observation timing, snow depth and snow-water equivalent, soil moisture, vegetation dynamics, ground-ice content, deformation, and asset-condition data. Prospective models should define an explicit predictor cutoff and lead time. Spatial models should be validated at fully excluded sites and coupled to physical and engineering covariates. Economic value should be assessed only after model output can be linked to real decisions and observed outcomes.