Article

Dynamic Response and Fatigue Life Evaluation of Expansion Joint Anchorage Zones Made with Engineered Cementitious Composites Based on a Vehicle–Expansion Joint Coupled Model

1
Shandong Hi-Speed Company Limited, Jinan 250014, China
2
School of Qilu Transportation, Shandong University, Jinan 250002, China
*
Author to whom correspondence should be addressed.
Buildings 2026, 16(15), 2978; https://doi.org/10.3390/buildings16152978
Submission received: 23 June 2026 / Revised: 15 July 2026 / Accepted: 22 July 2026 / Published: 27 July 2026
(This article belongs to the Section Building Materials, and Repair & Renovation)

Abstract

Expansion joint anchorage zones are prone to premature cracking and fatigue deterioration under repeated wheel impact and interfacial stress concentration. Engineered cementitious composites (ECCs) are promising anchorage materials because of their tensile strain-hardening behavior, multiple fine cracking, and high deformation capacity. However, how ECC strength–ductility characteristics affect vehicle-induced stress redistribution and fatigue damage accumulation remains unclear. This study develops a material–structure–fatigue framework for ECC anchorage zones. Three PVA-ECC mixtures were tested, and their measured constitutive relationships were incorporated into a three-dimensional vehicle–expansion joint coupled finite element model validated using reported field strain data from a C50 concrete anchorage zone. Critical tensile stress histories were extracted for rainflow counting and Miner-based fatigue assessment. Results show that ECC reduced tensile stress concentration and increased tensile safety margins compared with C50 concrete. Under the defined loading scenario, the estimated fatigue life increased from 9.93 years for C50 concrete to 83.15 years for the best-performing ECC scheme. Ten-year comparative field observations supported the predicted durability trend. By linking ECC strength–ductility characteristics with vehicle-induced stress redistribution and cumulative fatigue damage, the proposed framework provides a quantitative basis for fatigue-resistant material selection and durability-oriented design of expansion joint anchorage zones.

1. Introduction

Bridge expansion joints are critical components connecting adjacent bridge spans or bridge spans and abutments. During service, the anchorage zone of an expansion joint is subjected to repeated vehicle impact, temperature-induced deformation, concrete shrinkage and creep, and complex interfacial load transfer [1,2]. Because of the discontinuity in geometry and stiffness between the pavement, anchorage material, and steel edge beam, stress concentration readily occurs in the anchorage zone. Conventional anchorage zones are commonly constructed using cement-based concrete or fiber-reinforced concrete materials. However, these materials may still suffer from limited tensile deformability, localized cracking, interfacial debonding, spalling, and fatigue deterioration under repeated wheel-impact loading [3,4,5]. Therefore, improving the crack-control and fatigue-resistance performance of expansion joint anchorage materials is important for enhancing the durability of bridge expansion joints.
Engineered cementitious composites (ECCs) have attracted increasing attention because of their tensile strain-hardening behavior, multiple fine cracking, high tensile ductility, and fatigue resistance [6,7,8,9,10]. ECC is a high-performance fiber-reinforced cementitious composite designed based on micromechanics theory [8]. Unlike ordinary concrete, ECC can maintain tensile load-carrying capacity after first cracking through fiber bridging and distributed microcracking [11]. Previous studies have shown that ECC can improve ductility, crack control, energy dissipation, and durability when used in critical structural regions such as bridge piers, beam–column joints, bridge decks, and link slabs [12,13,14,15]. These characteristics indicate that ECC has potential to improve the failure mode of expansion joint anchorage zones from localized brittle cracking to more distributed damage evolution.
Cement-based materials in transport infrastructure are also affected by repeated dynamic loading and aggressive environmental actions. Alternating dynamic impacts and cyclic loading can accelerate crack initiation and damage accumulation, while chloride ingress, sulfate attack, wetting–drying cycles, freeze–thaw cycles, heating–cooling cycles, and their coupled effects can further promote matrix deterioration, reinforcement corrosion, interface degradation, and loss of mechanical performance [16,17,18,19,20]. Although these studies have improved the understanding of material durability and damage mechanisms, most of them focus on material-level deterioration rather than the structural-level stress redistribution and fatigue damage evolution of local bridge components under repeated vehicle impact. For expansion joint anchorage zones, the key issue is not only whether the material has good mechanical or durability properties, but also how these properties influence the local stress response and fatigue damage accumulation under vehicle-induced dynamic loading [21].
Several material modification approaches have been investigated for bridge expansion joint anchorage zones. Mao et al. studied emulsified-asphalt-modified ECC for expansion joint applications and showed that material flexibility and deformation capacity could be improved [22]. Sun et al. investigated fast-hardening polymer cement composite materials for expansion joint anchorage zones and evaluated their mechanical response through experiments and finite element analysis [23]. Wang et al. prepared polyurethane concrete and applied it to bridge expansion joint anchorage zones, demonstrating its potential to improve local mechanical performance [24]. Tian et al. further analyzed the fatigue properties of polyurethane concrete anchorage zones and showed that alternative materials can reduce fatigue damage compared with ordinary cement-based materials [5]. These studies confirm that material replacement is an effective strategy for improving anchorage-zone performance. Nevertheless, polymer-modified cement composites and polyurethane concrete differ fundamentally from strain-hardening ECC in material mechanism. They do not clarify how ECC tensile strength, tensile ductility, elastic modulus, multiple cracking, and post-cracking stress transfer jointly influence stress concentration and fatigue damage accumulation under repeated vehicle impact.
In parallel, vehicle–bridge coupling and expansion joint dynamic-response studies have provided useful methods for analyzing vehicle-induced impact effects. Hou et al. analyzed vehicle–bridge coupling vibration considering expansion joint parameters and demonstrated that expansion joint characteristics can significantly affect vehicle–bridge dynamic response [25]. Ding et al. investigated the dynamic impact generated by vehicles passing over modular bridge expansion joints and clarified its influence on bridge design [26]. Fatigue-life studies of bridge components and expansion joint systems have also provided useful methods for fatigue assessment under traffic loading [27,28]. However, many of these studies focus on the global vehicle–bridge response, the expansion joint device itself, or empirical fatigue evaluation. The material-level tensile behavior of ECC has not been sufficiently connected with the transient stress response and fatigue damage evolution of the expansion joint anchorage zone.
Despite these advances, the material–structure–fatigue mechanism of ECC expansion joint anchorage zones remains insufficiently understood. Previous studies have demonstrated the strain-hardening and crack-control capacity of ECC, but they have not sufficiently clarified how ECC strength–ductility characteristics affect vehicle-induced stress redistribution and fatigue damage accumulation in local anchorage zones. Studies on PCC, PUC, SFC, and other modified anchorage materials have verified the feasibility of material improvement, but most of them focused on specific material performance or engineering applicability rather than the coupling between material constitutive behavior, local dynamic tensile stress history, and cumulative fatigue damage. Vehicle–bridge coupling studies have clarified the dynamic response of bridges and expansion joint systems, but the influence of anchorage-zone material properties on local stress concentration and fatigue life has not been systematically evaluated. Therefore, a quantitative framework that links ECC material properties with vehicle-induced stress response and fatigue damage evolution is still needed.
To address this issue, this study develops a material–structure–fatigue evaluation framework for ECC expansion joint anchorage zones. Three PVA-ECC mixtures with different strength–ductility characteristics were designed and tested. Their measured constitutive parameters were introduced into a three-dimensional vehicle–expansion joint coupled finite element model to obtain local tensile stress histories under vehicle loading. Rainflow counting and Miner’s cumulative damage theory were then used to evaluate fatigue damage and estimated fatigue life. Finally, long-term field performance observations were used to examine whether the predicted durability trend was consistent with engineering performance.

2. Materials and Methods

2.1. Raw Materials

The raw materials used to prepare the ECC mixtures included ordinary Portland cement, fly ash, gold tailings sand (GTS), hydroxypropyl methylcellulose (HPMC), a polycarboxylate-based high-range water-reducing admixture, tap water, and polyvinyl alcohol (PVA) fibers.
P·O 42.5 ordinary Portland cement supplied by Jinan Shanshui Cement Co., Ltd. (Jinan, China) was used. Grade I low-calcium fly ash supplied by Henan Wuhu Environmental Protection Technology Co., Ltd. (Zhengzhou, China) was used. The chemical compositions of the cement and fly ash are listed in Table 1 and Table 2, respectively.
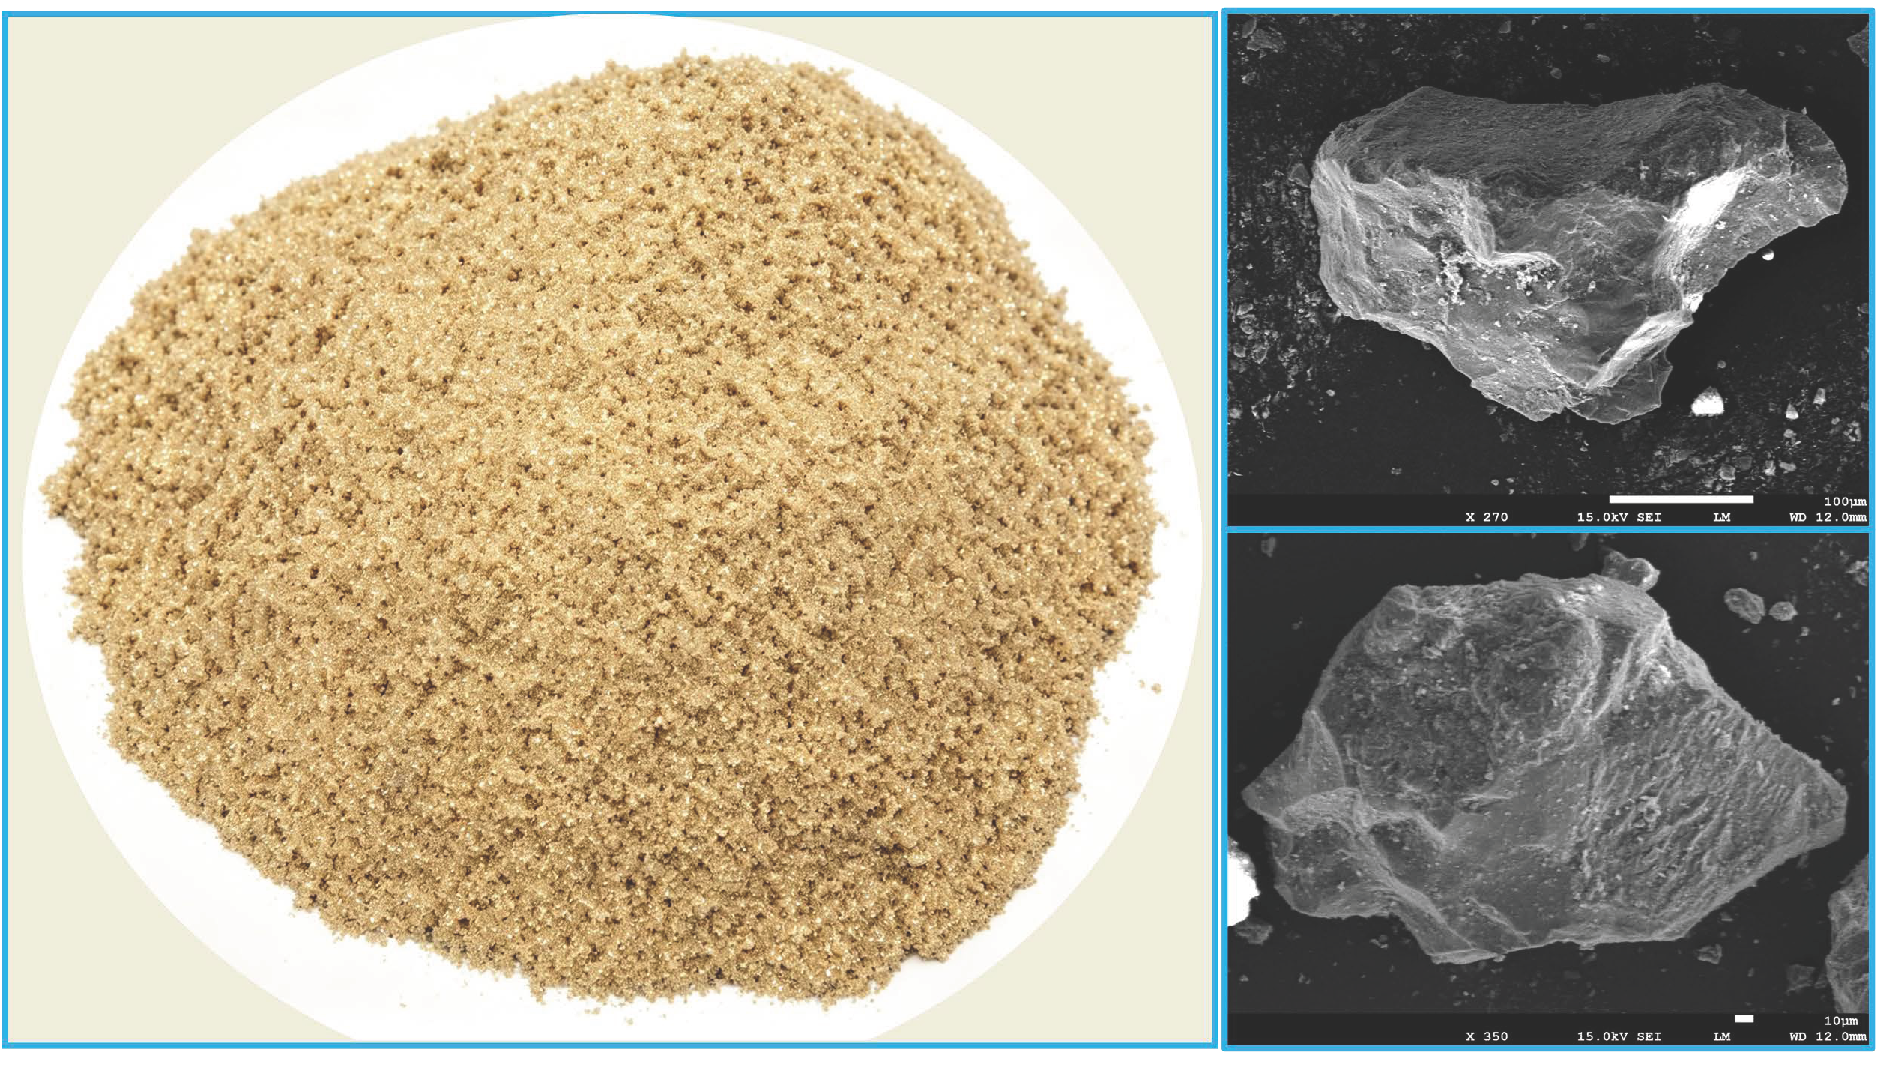
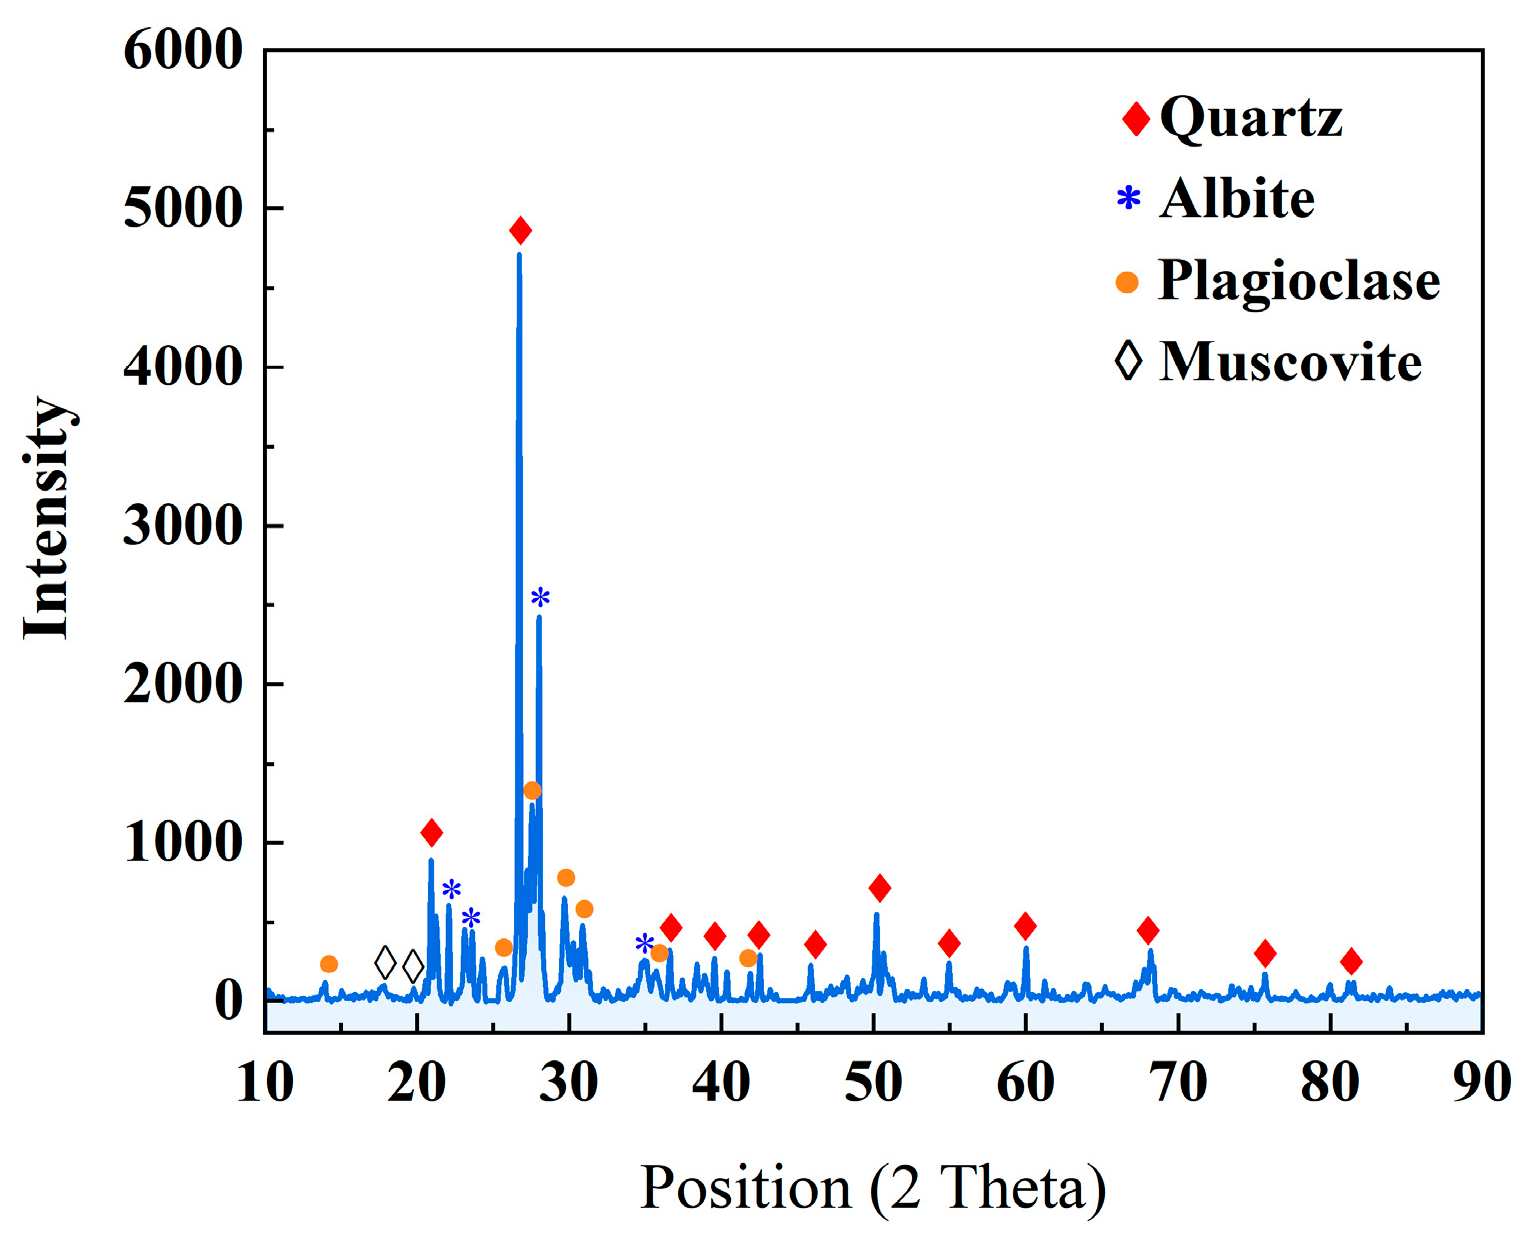
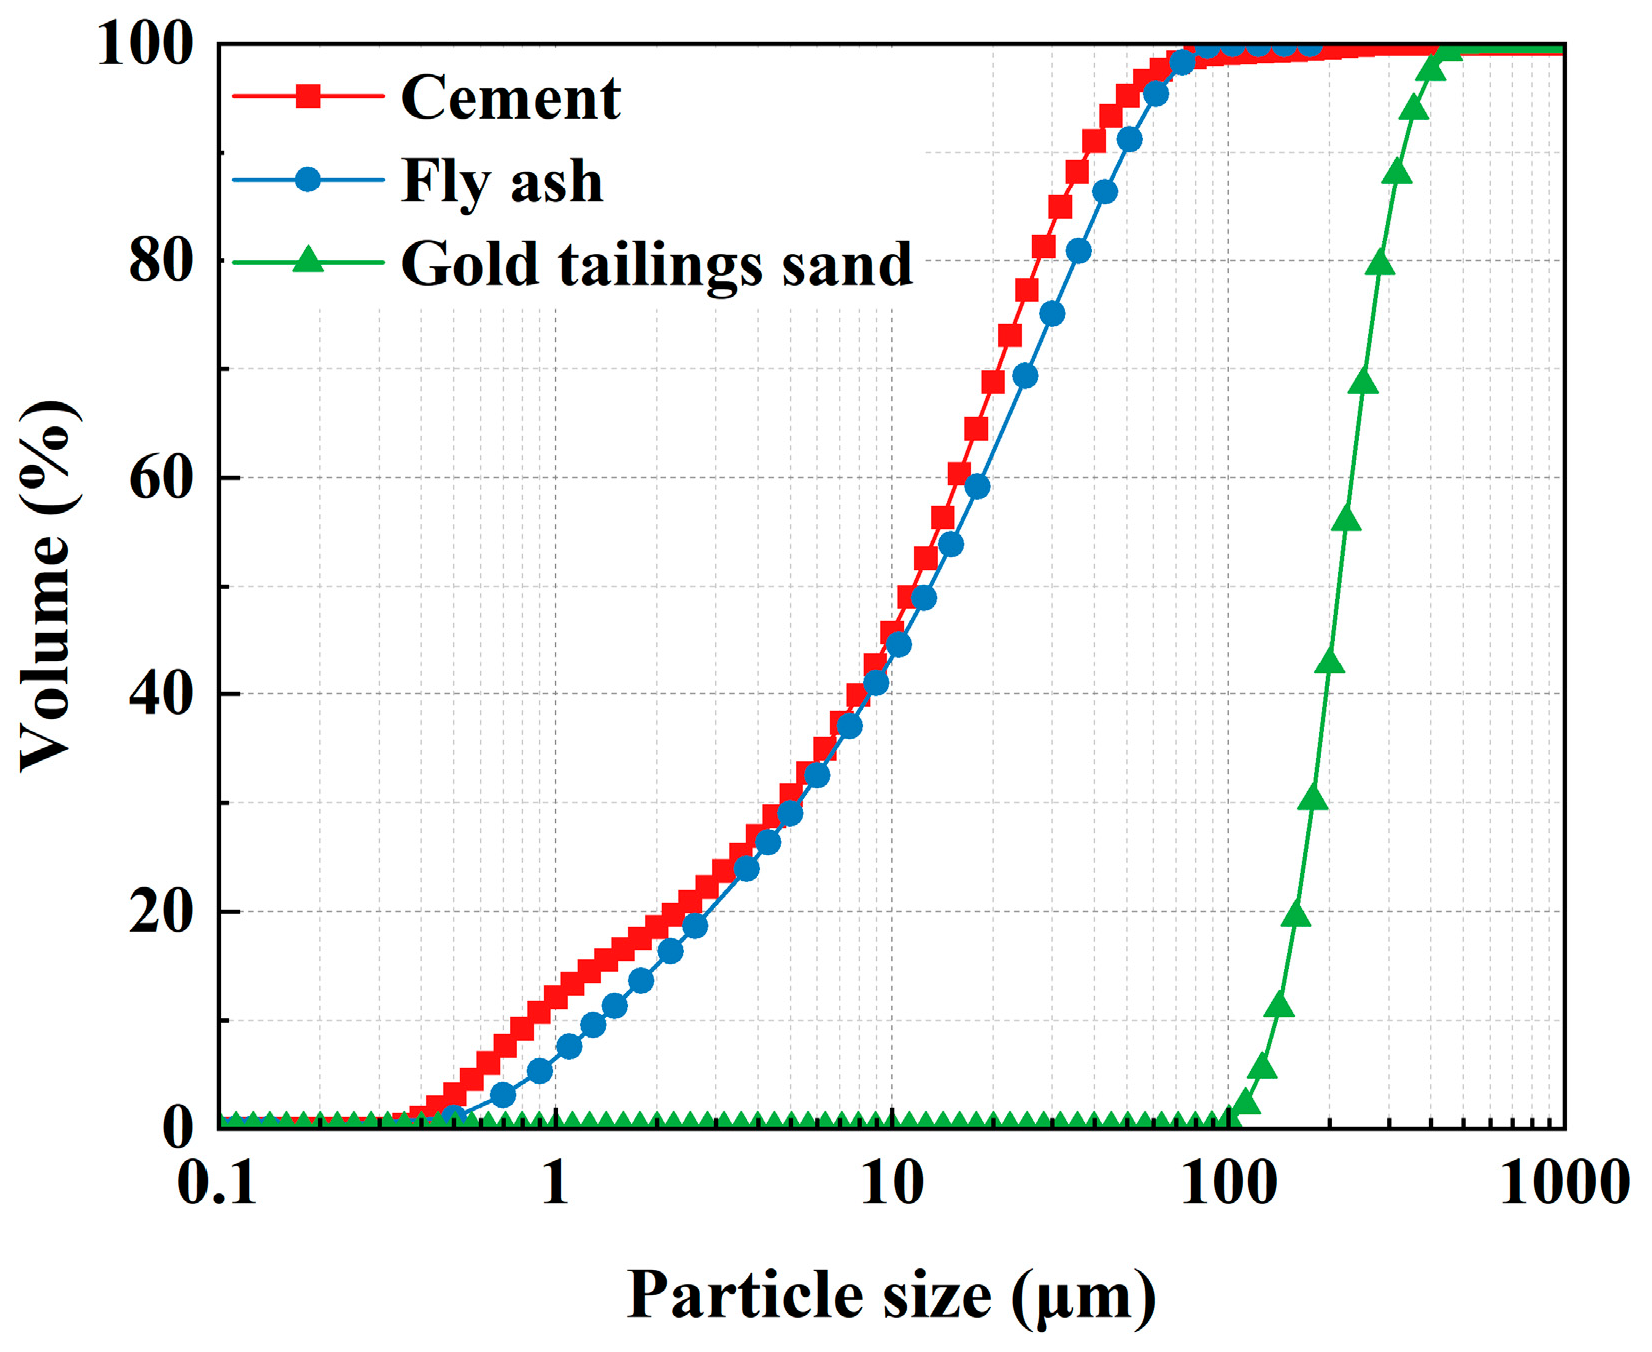
The gold tailings sand was collected from a gold-mine tailings deposit located in Qixia, Yantai, China. Its main chemical component was SiO2, and it exhibited a hard texture, high wear resistance, and good chemical stability. Its morphology and X-ray diffraction pattern are shown in Figure 1 and Figure 2, respectively. The particle-size distributions of the cementitious materials and gold tailings sand are presented in Figure 3.
HPMC with a viscosity of 150,000 mPa·s, supplied by Henan Qimeng Chemical Technology Co., Ltd. (Zhengzhou, China), was used as a thickener. A polycarboxylate-based high-range water-reducing admixture with a water-reduction rate of approximately 30%, supplied by Jiangsu Sobute New Materials Co., Ltd. (Nanjing, China), was used. Laboratory tap water was used as the mixing water. PVA fibers supplied by Yongan Baohualin Industrial Development Co., Ltd. (Yongan, China) were used, and their physical and mechanical properties are listed in Table 3.

2.2. Mix Proportion Design and Specimen Preparation

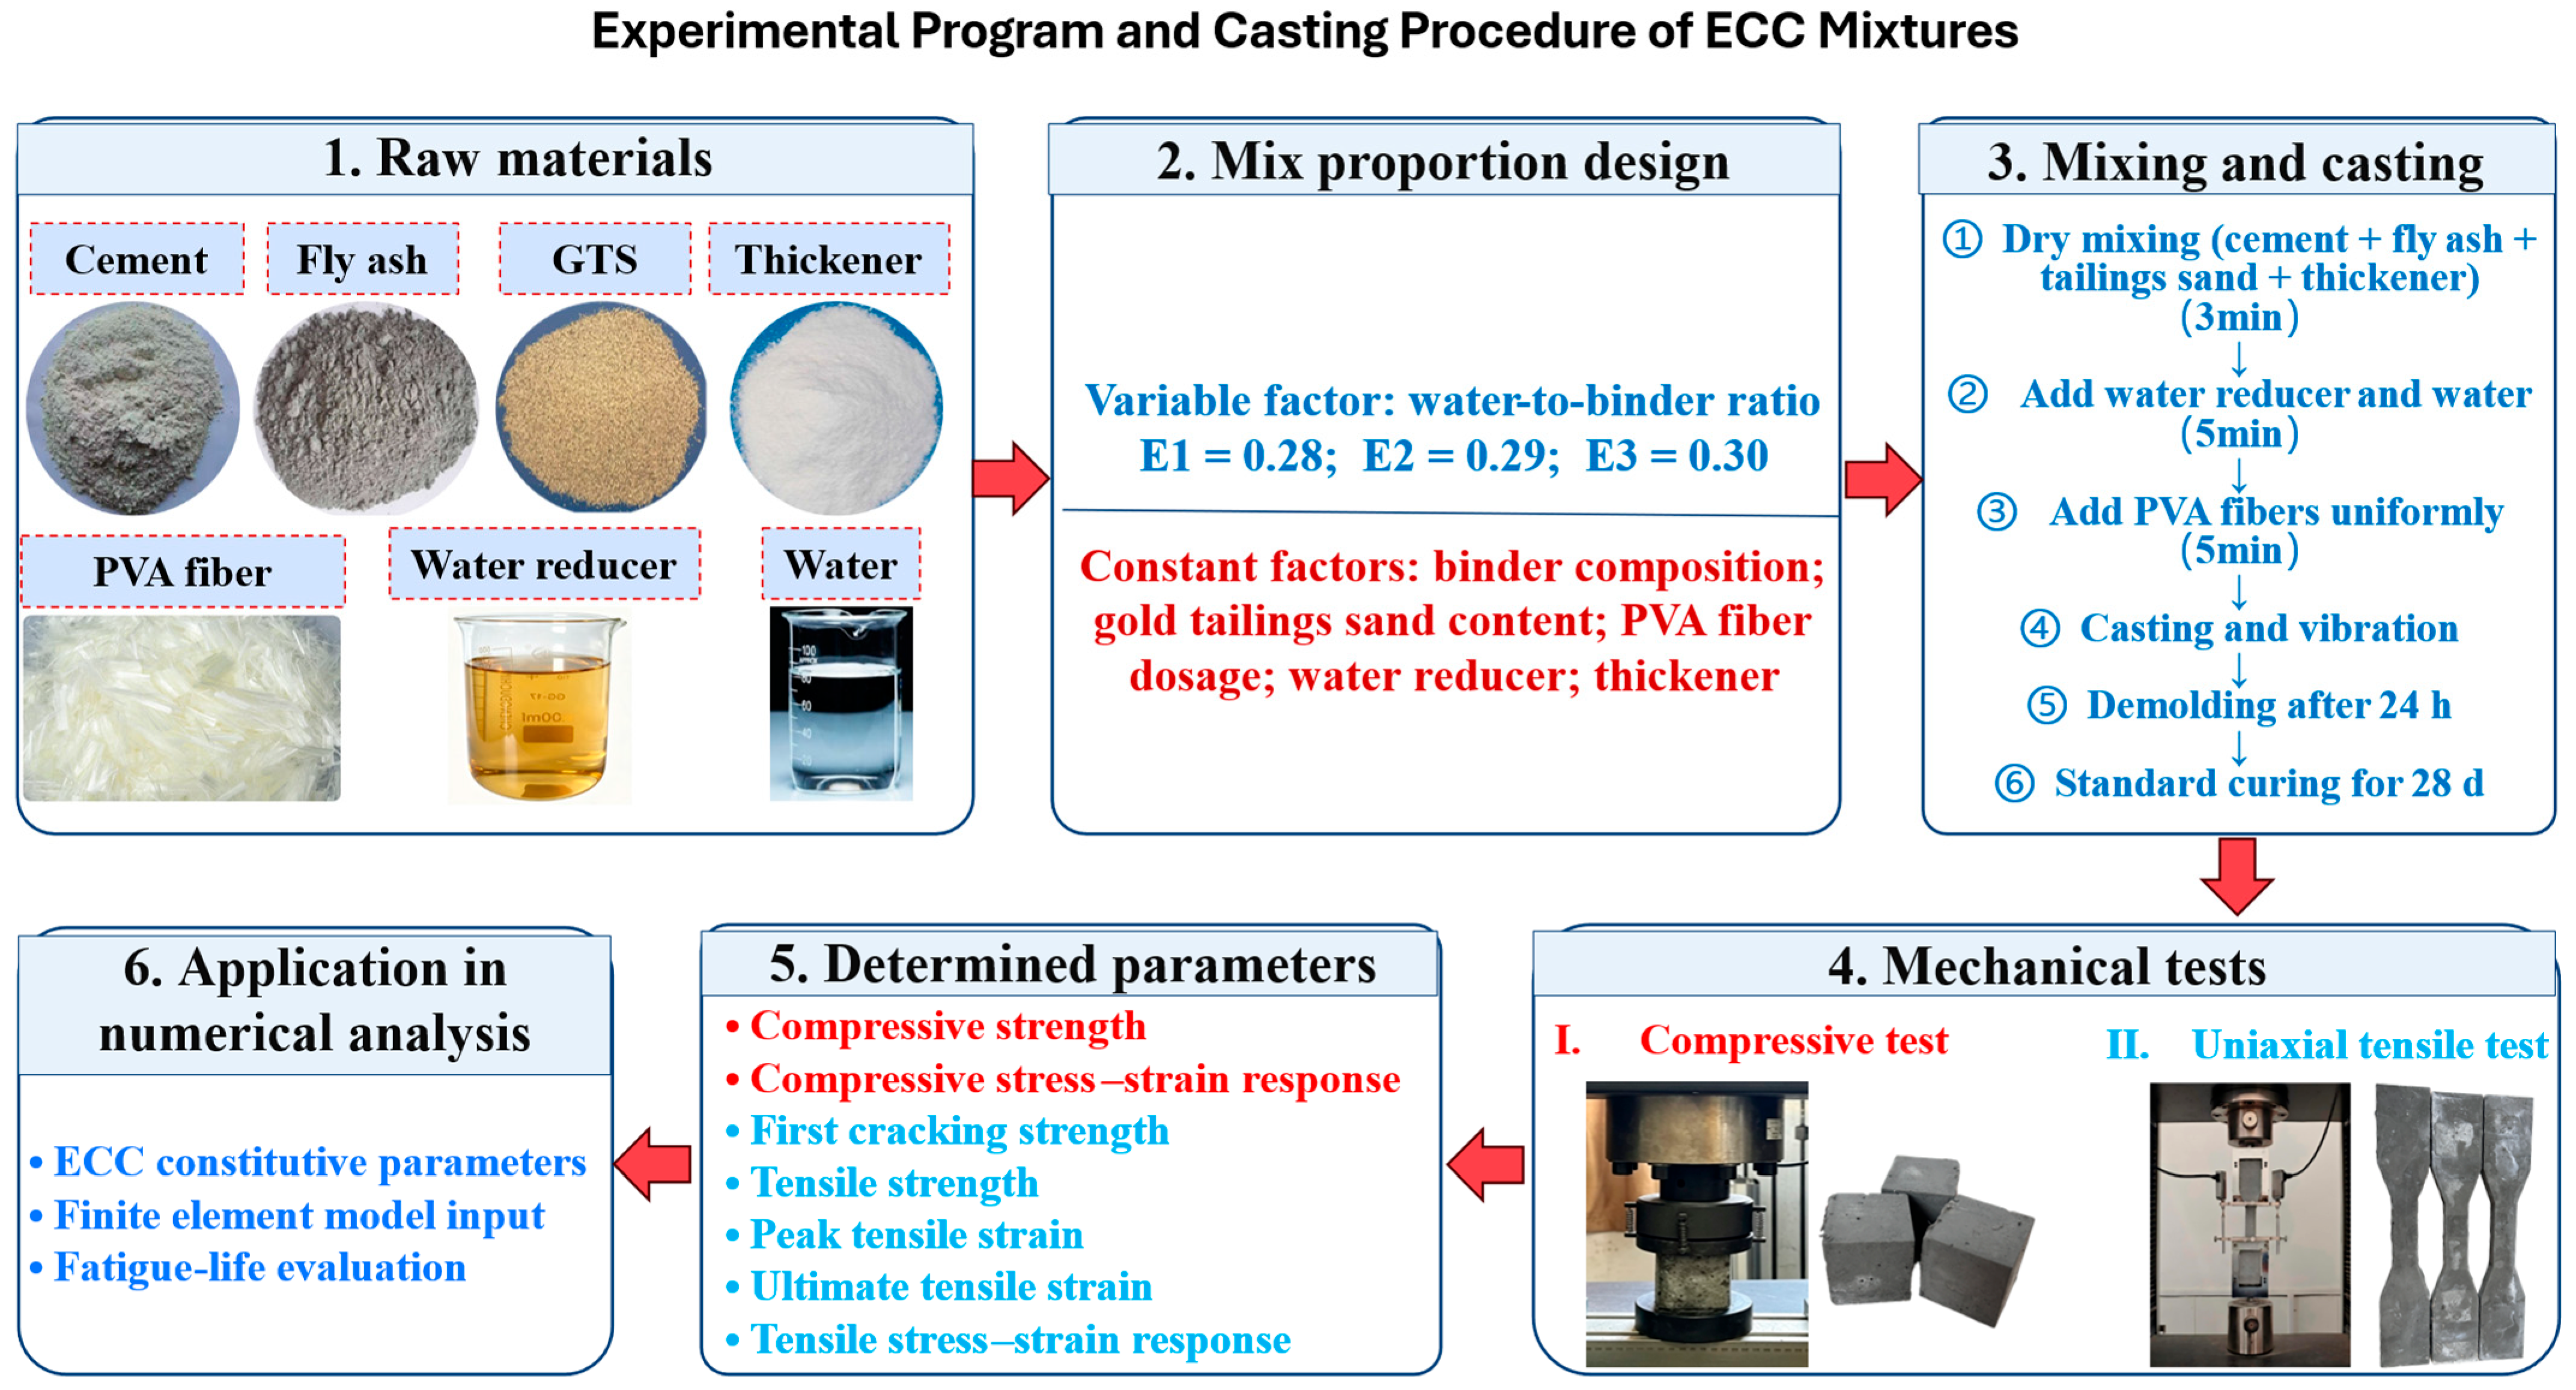
The experimental program, including the varied factor, specimen preparation, mechanical tests, and parameters used for numerical modeling, is summarized in Figure 4. To investigate the effect of ECC mechanical properties on the dynamic response and fatigue performance of expansion-joint anchorage zones, three water-to-binder ratios of 0.28, 0.29, and 0.30 were selected. Previous studies on expansion-joint anchorage materials have commonly used C40–C50 cement-based concrete or fiber-reinforced concrete as reference materials, while newly developed high-performance anchorage materials can reach compressive strengths above 60 MPa [5]. Therefore, a relatively low water-to-binder ratio range was adopted in this study to maintain a high matrix strength level while improving tensile deformability and crack-control capacity [29]. This design produced a controlled strength–ductility variation within the same gold-tailings-sand PVA-ECC system. The binder composition, gold tailings sand content, PVA fiber dosage, and admixture system were kept constant, and only the water-to-binder ratio was varied. The detailed mix proportions are presented in Table 4.
After weighing the raw materials according to the prescribed mix proportions, the dry ingredients (including ordinary Portland cement, fly ash, gold tailings sand, and thickener) were first mixed at low speed for 3 min. Then the water reducer and water were added, followed by low-speed mixing for 2 min and high-speed mixing for another 3 min. Finally, the PVA fibers were uniformly added and mixing continued for 5 min to ensure uniform fiber dispersion.
After casting, the specimens were compacted using a vibrating table, and the surface was finished smooth. After 24 h, the specimens were demolded and then cured for 28 days in a standard curing room at a relative humidity of not less than 95% and a temperature of (20 ± 2) °C.

2.3. Mechanical Properties of ECC

2.3.1. Compressive Test

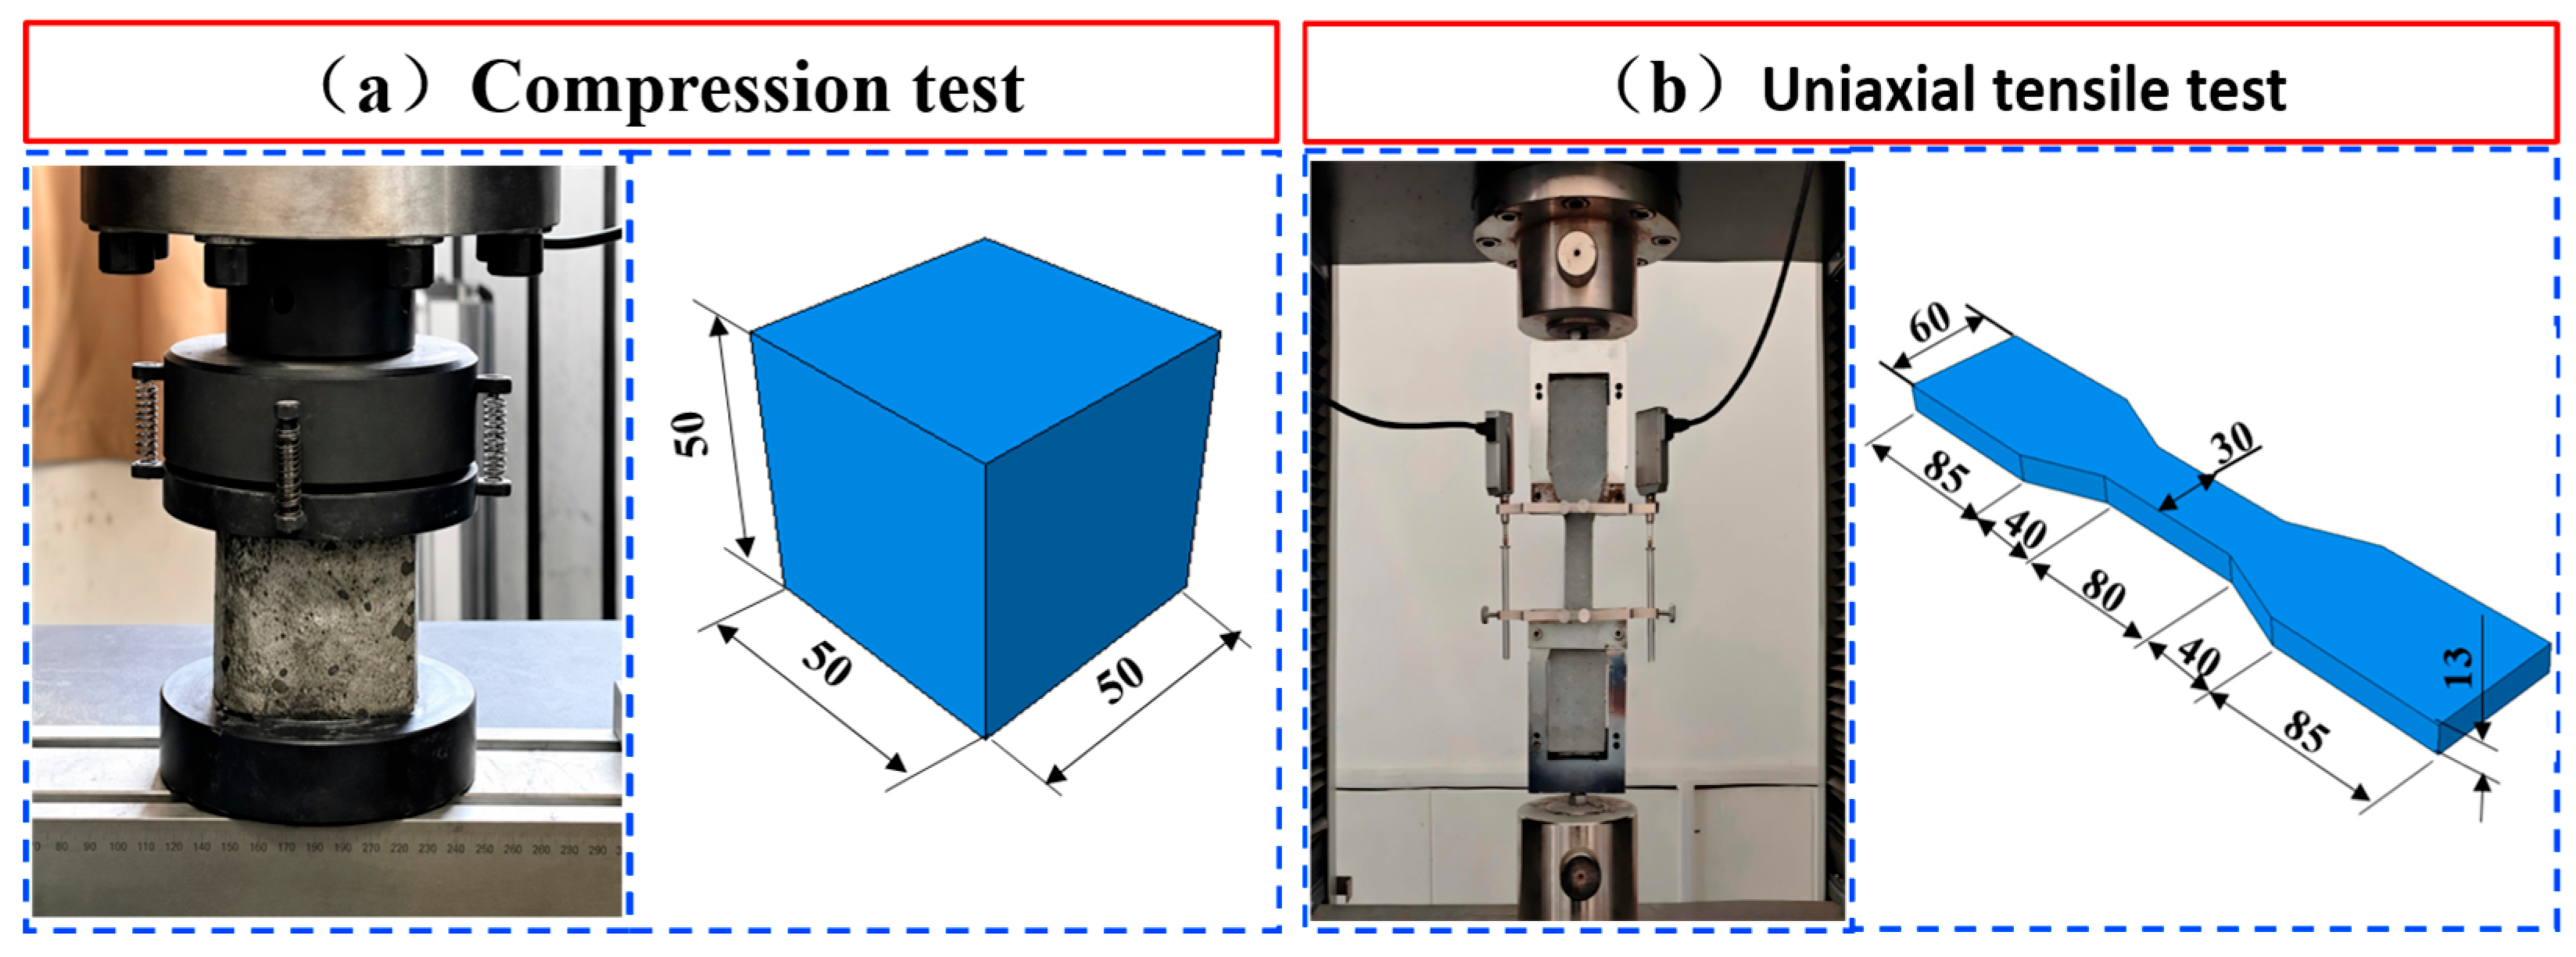
The compressive test procedure and specimen geometry were determined according to relevant published methods [30]. Cubic specimens with dimensions of 50 mm × 50 mm × 50 mm were used, as shown in Figure 5a. Three specimens were prepared for each mixture. The test was conducted at a loading rate of 0.5 MPa/s until failure, and the average compressive strength was calculated.
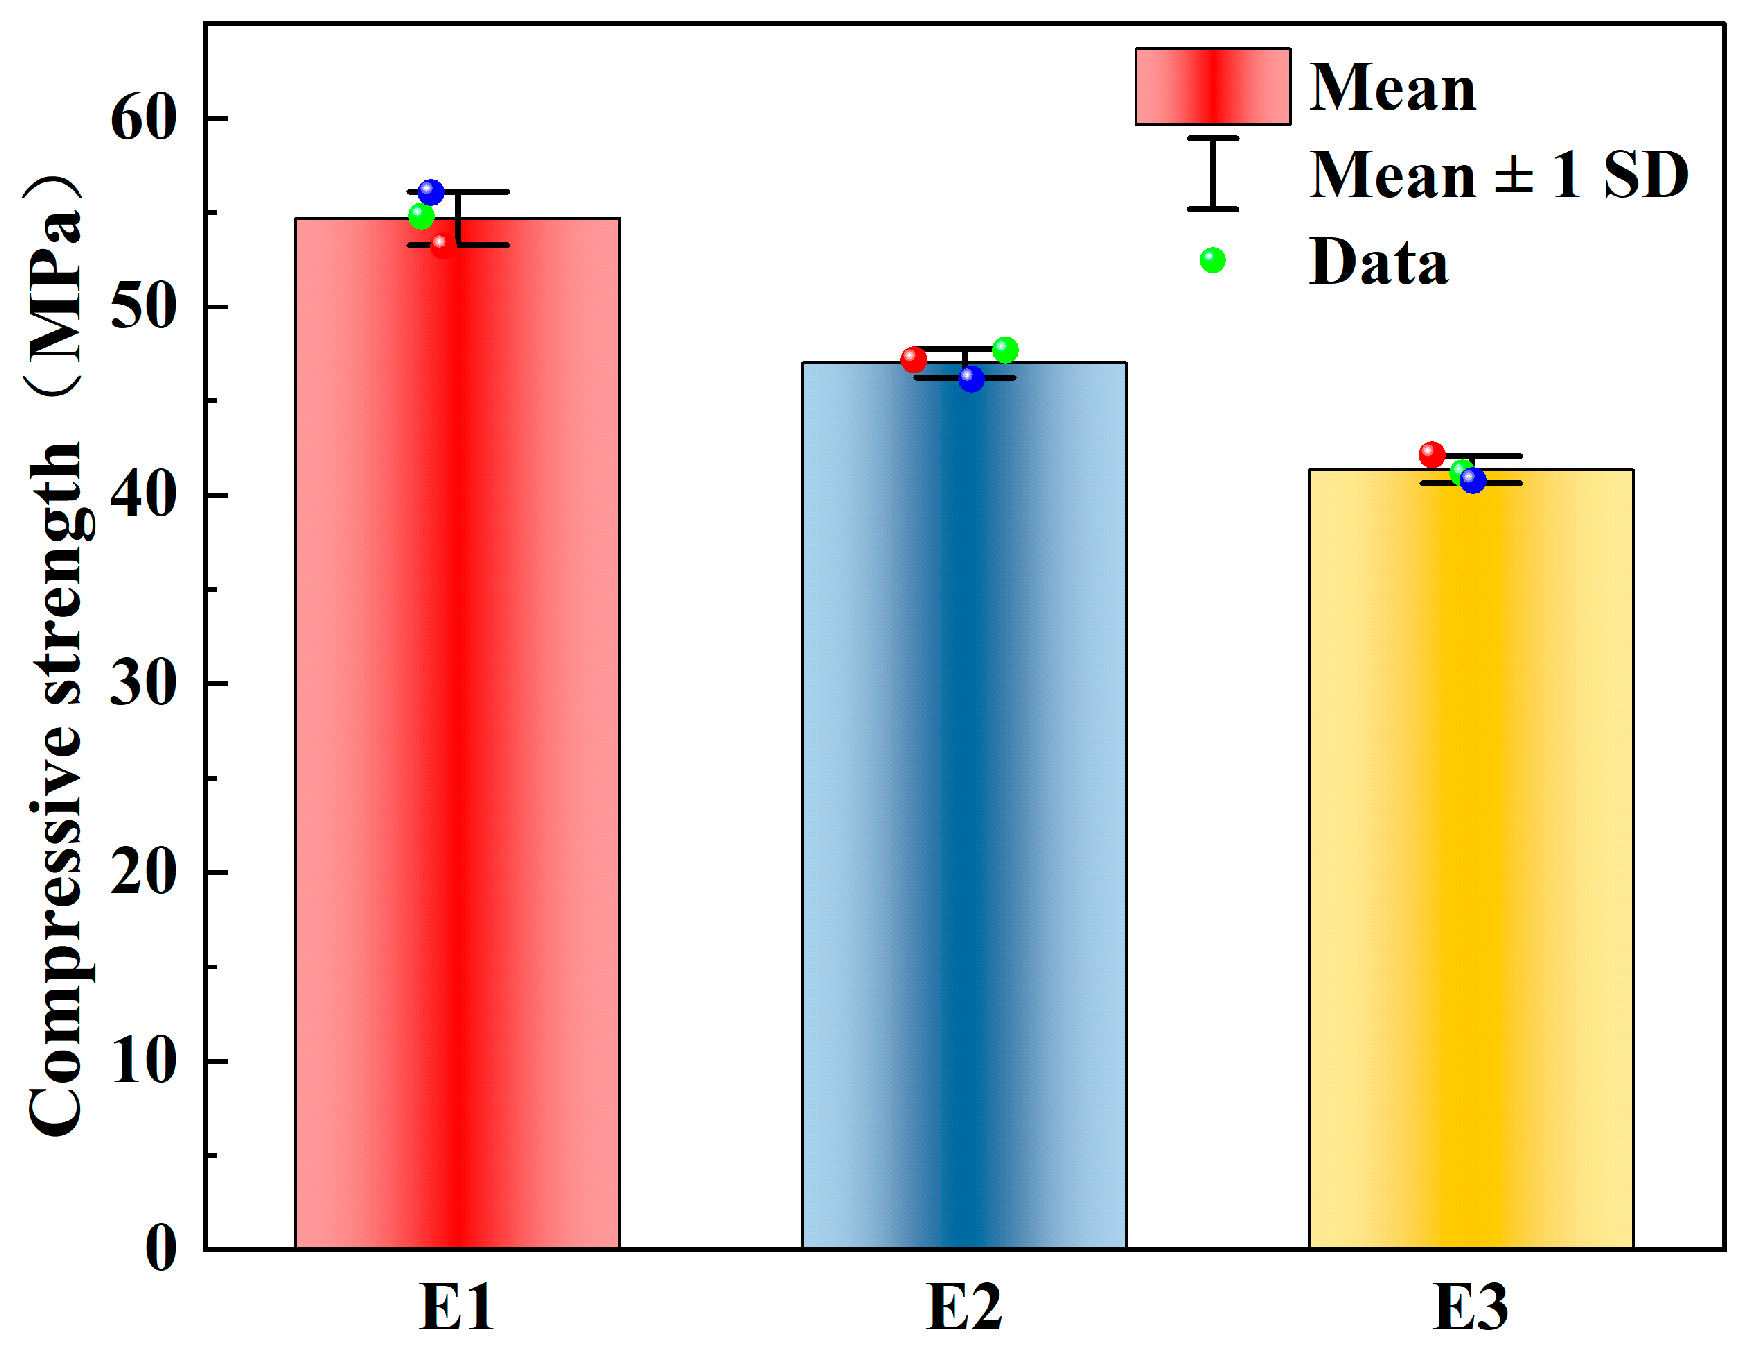
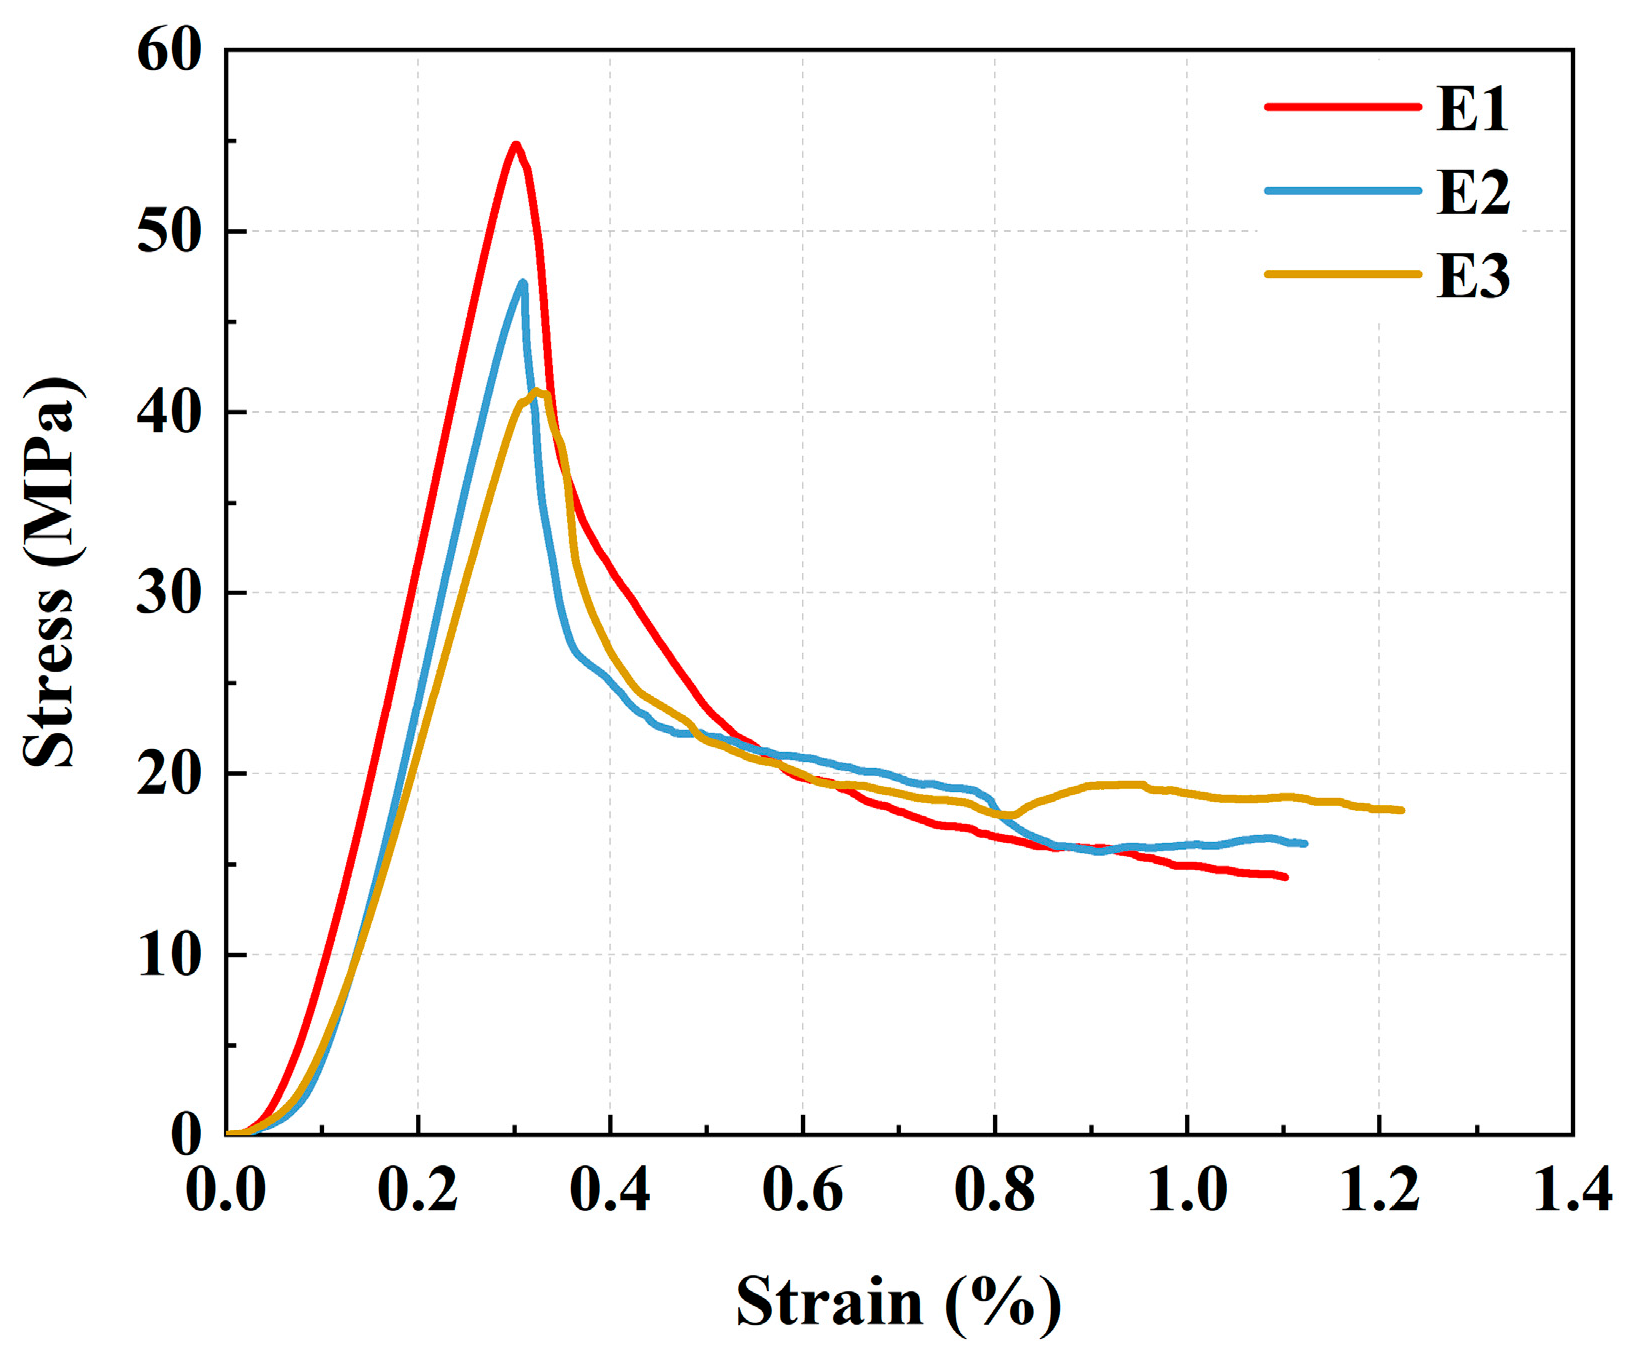
The compressive strengths of E1, E2, and E3 were 54.79 MPa, 47.18 MPa, and 41.17 MPa, respectively, as shown in Figure 6. With increasing water-to-binder ratio, the compressive strength decreased gradually. Compared with E1, the compressive strengths of E2 and E3 decreased by 13.89% and 24.86%, respectively. This indicates that a lower water-to-binder ratio is beneficial for improving matrix compactness and compressive load-bearing capacity.
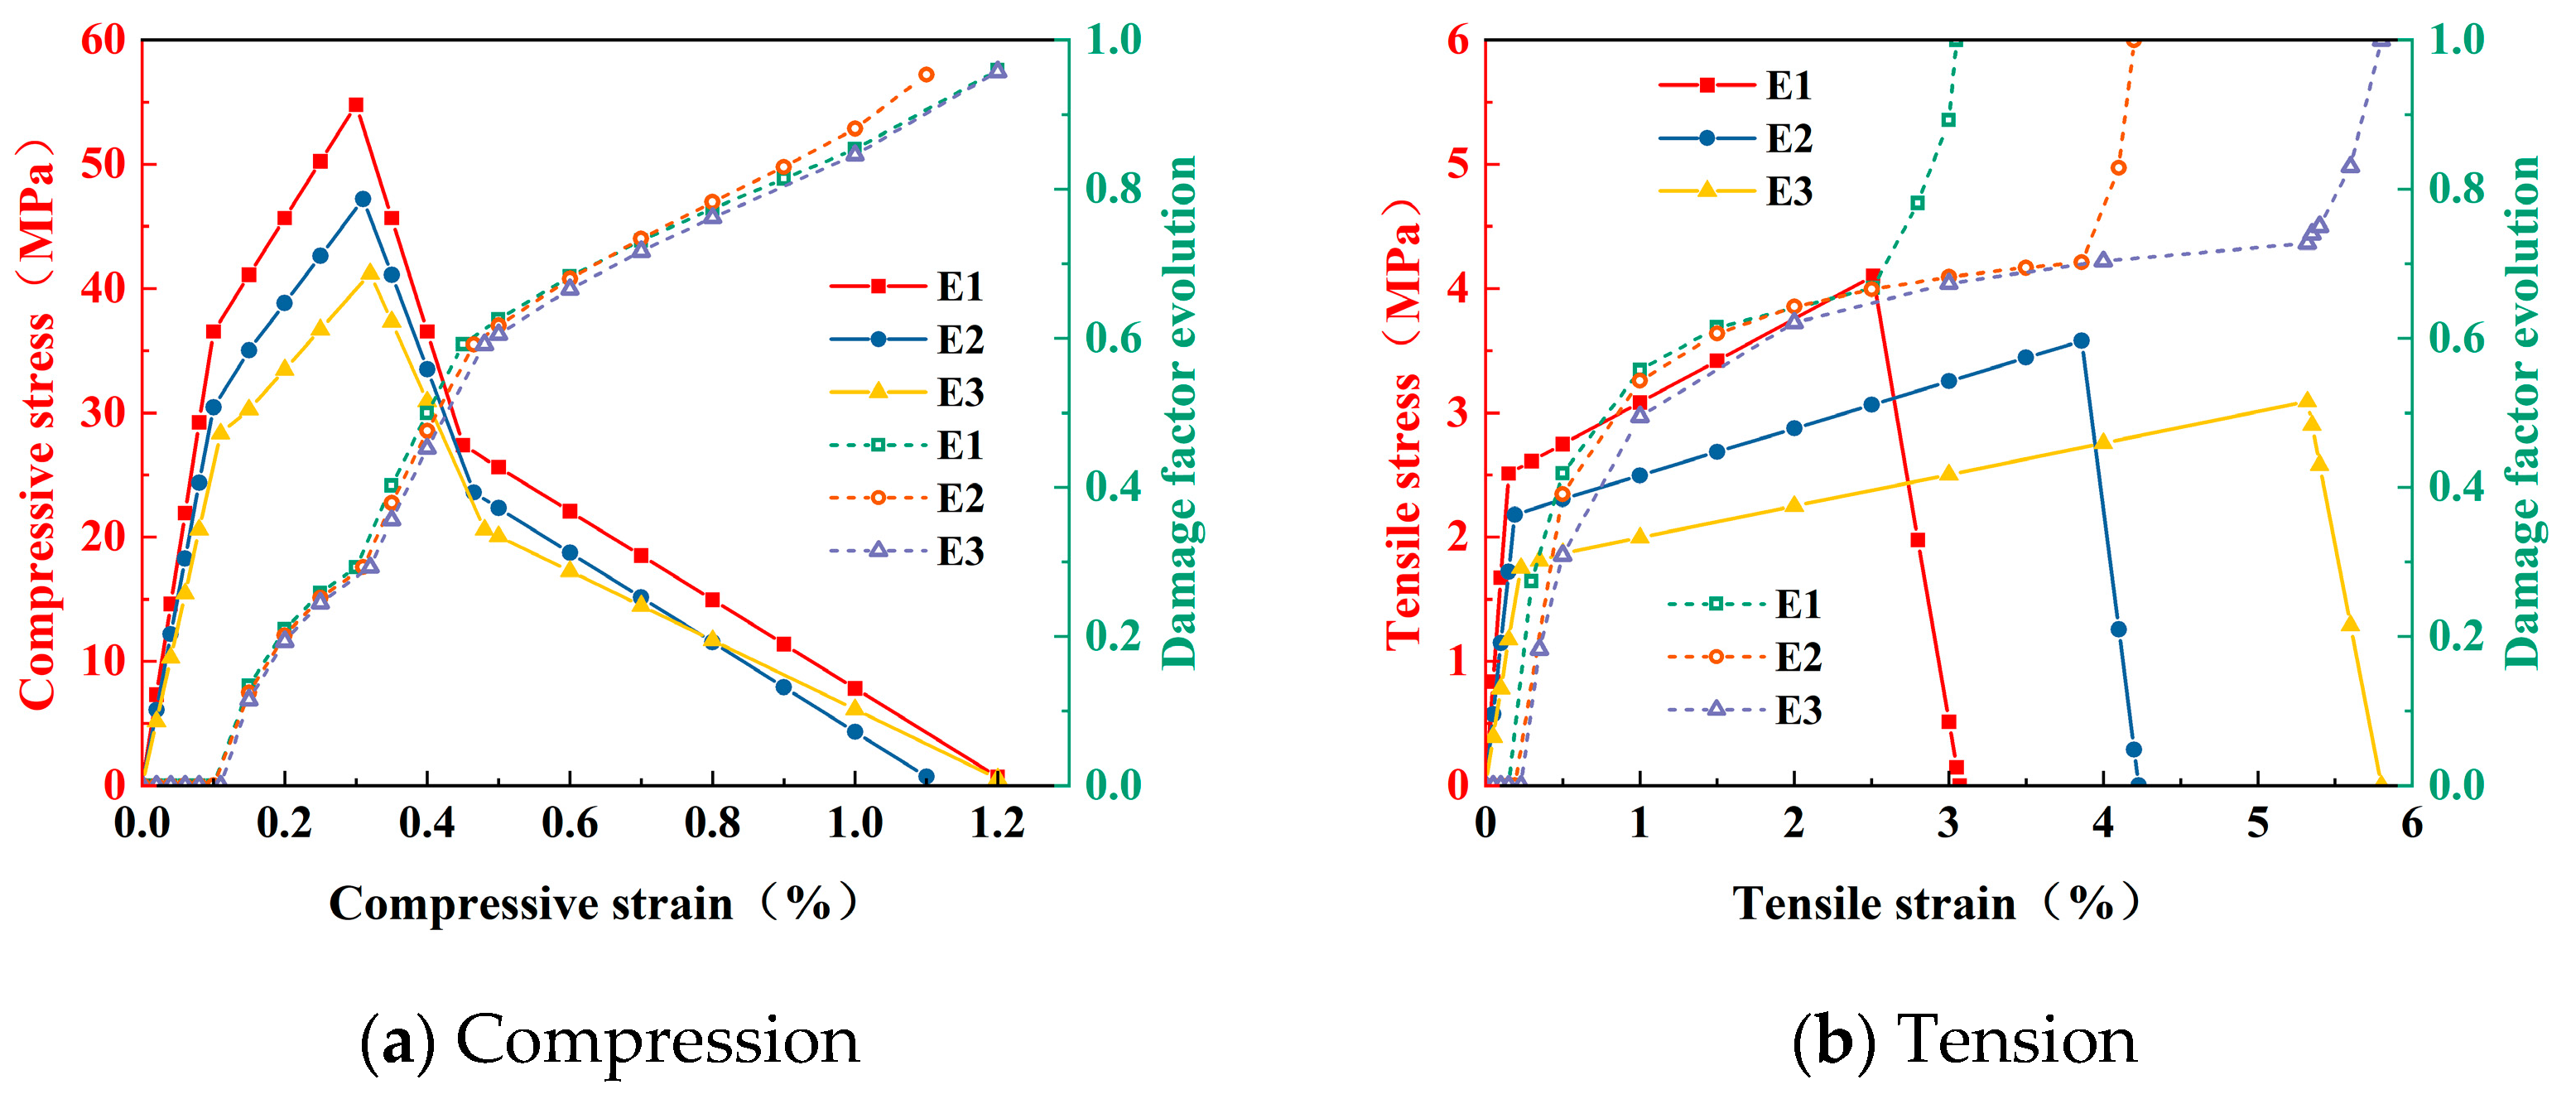
The average compressive stress–strain curves are shown in Figure 7. All mixtures exhibited a typical nonlinear compressive response, including an initial linear stage, a nonlinear ascending stage, and a post-peak softening stage. E1 showed the highest peak stress and the steepest ascending branch, indicating higher compressive stiffness. These measured compressive properties were used to define the ECC compressive constitutive parameters in the finite element model.

2.3.2. Uniaxial Tensile Test

Uniaxial tensile tests were performed on dog-bone specimens according to JSCE recommendations [31], as shown in Figure 5b. Three specimens were prepared for each mixture. The tests were conducted under displacement control at a loading rate of 0.5 mm/min until tensile failure.
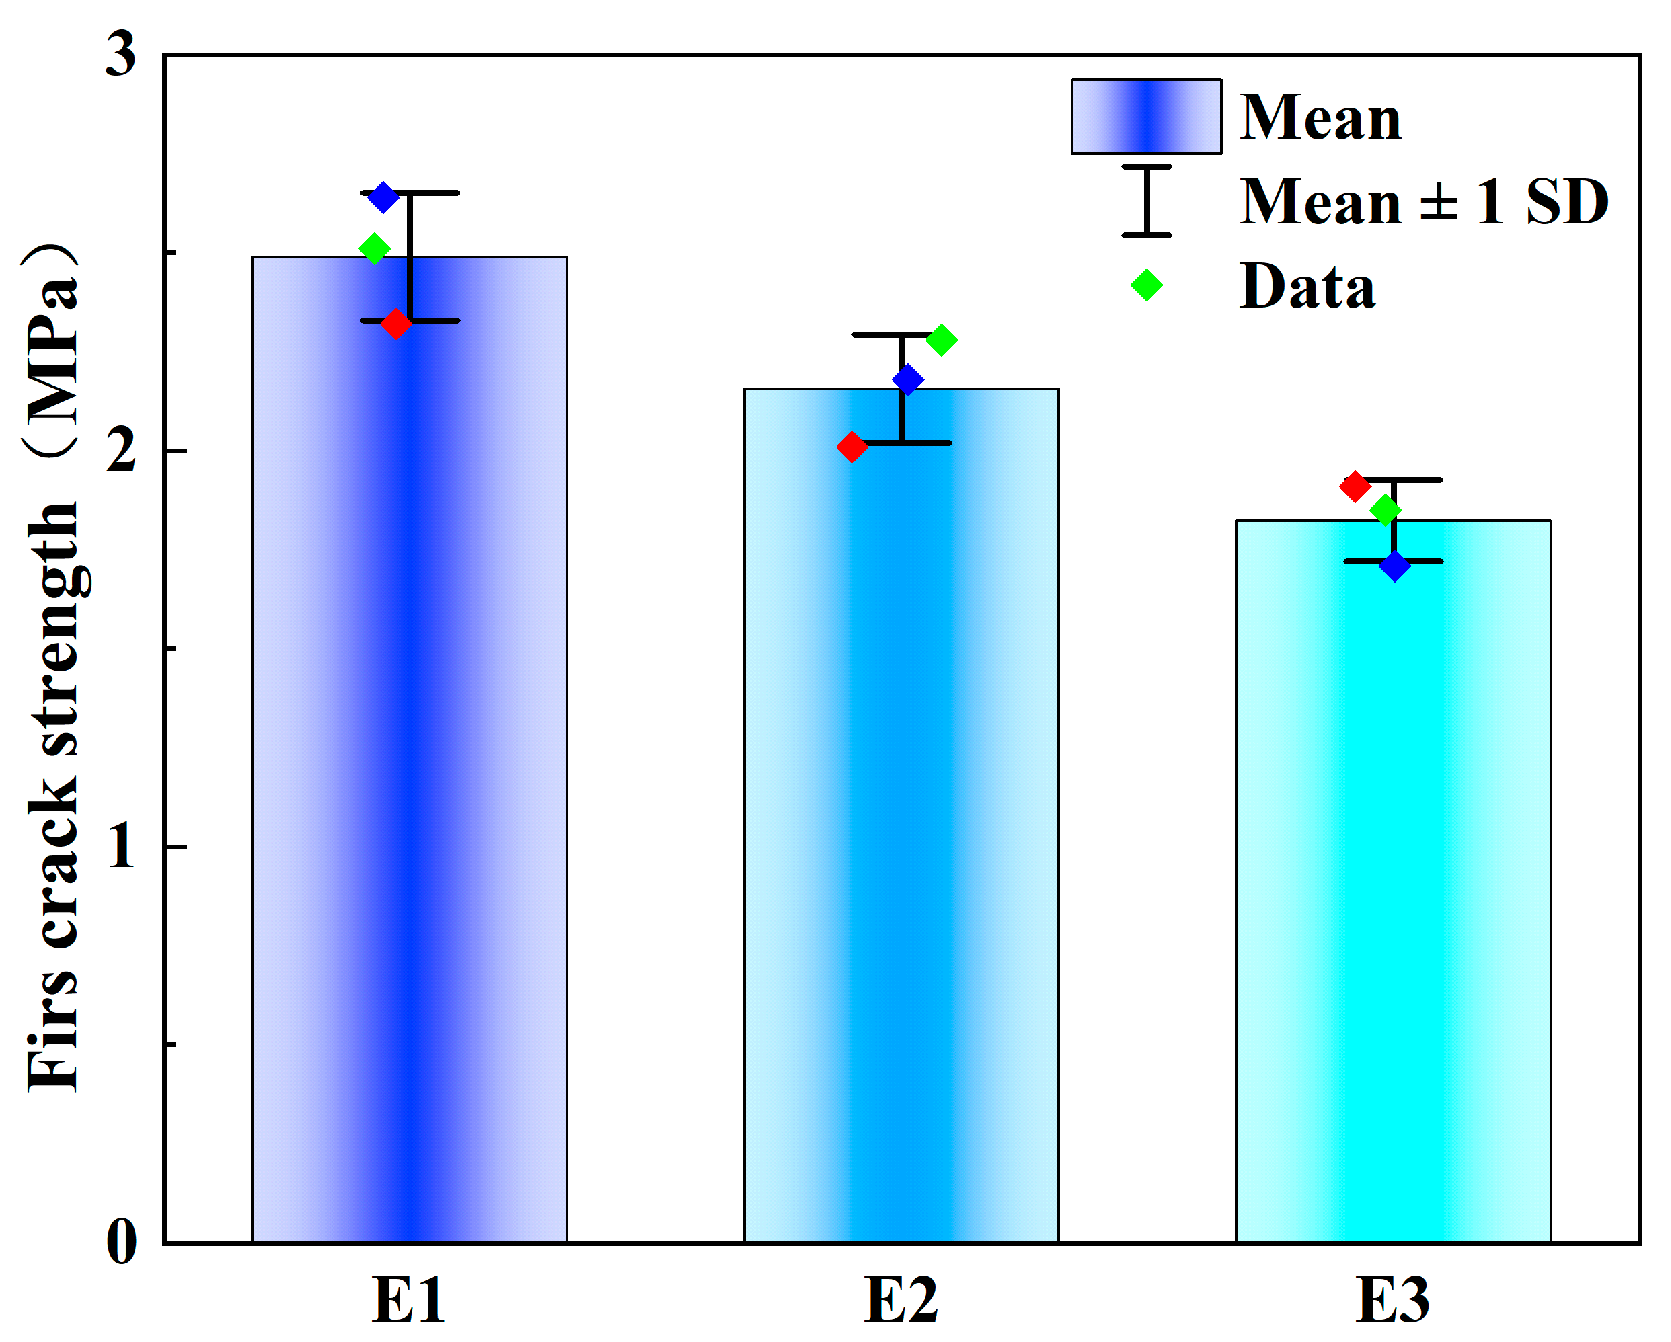
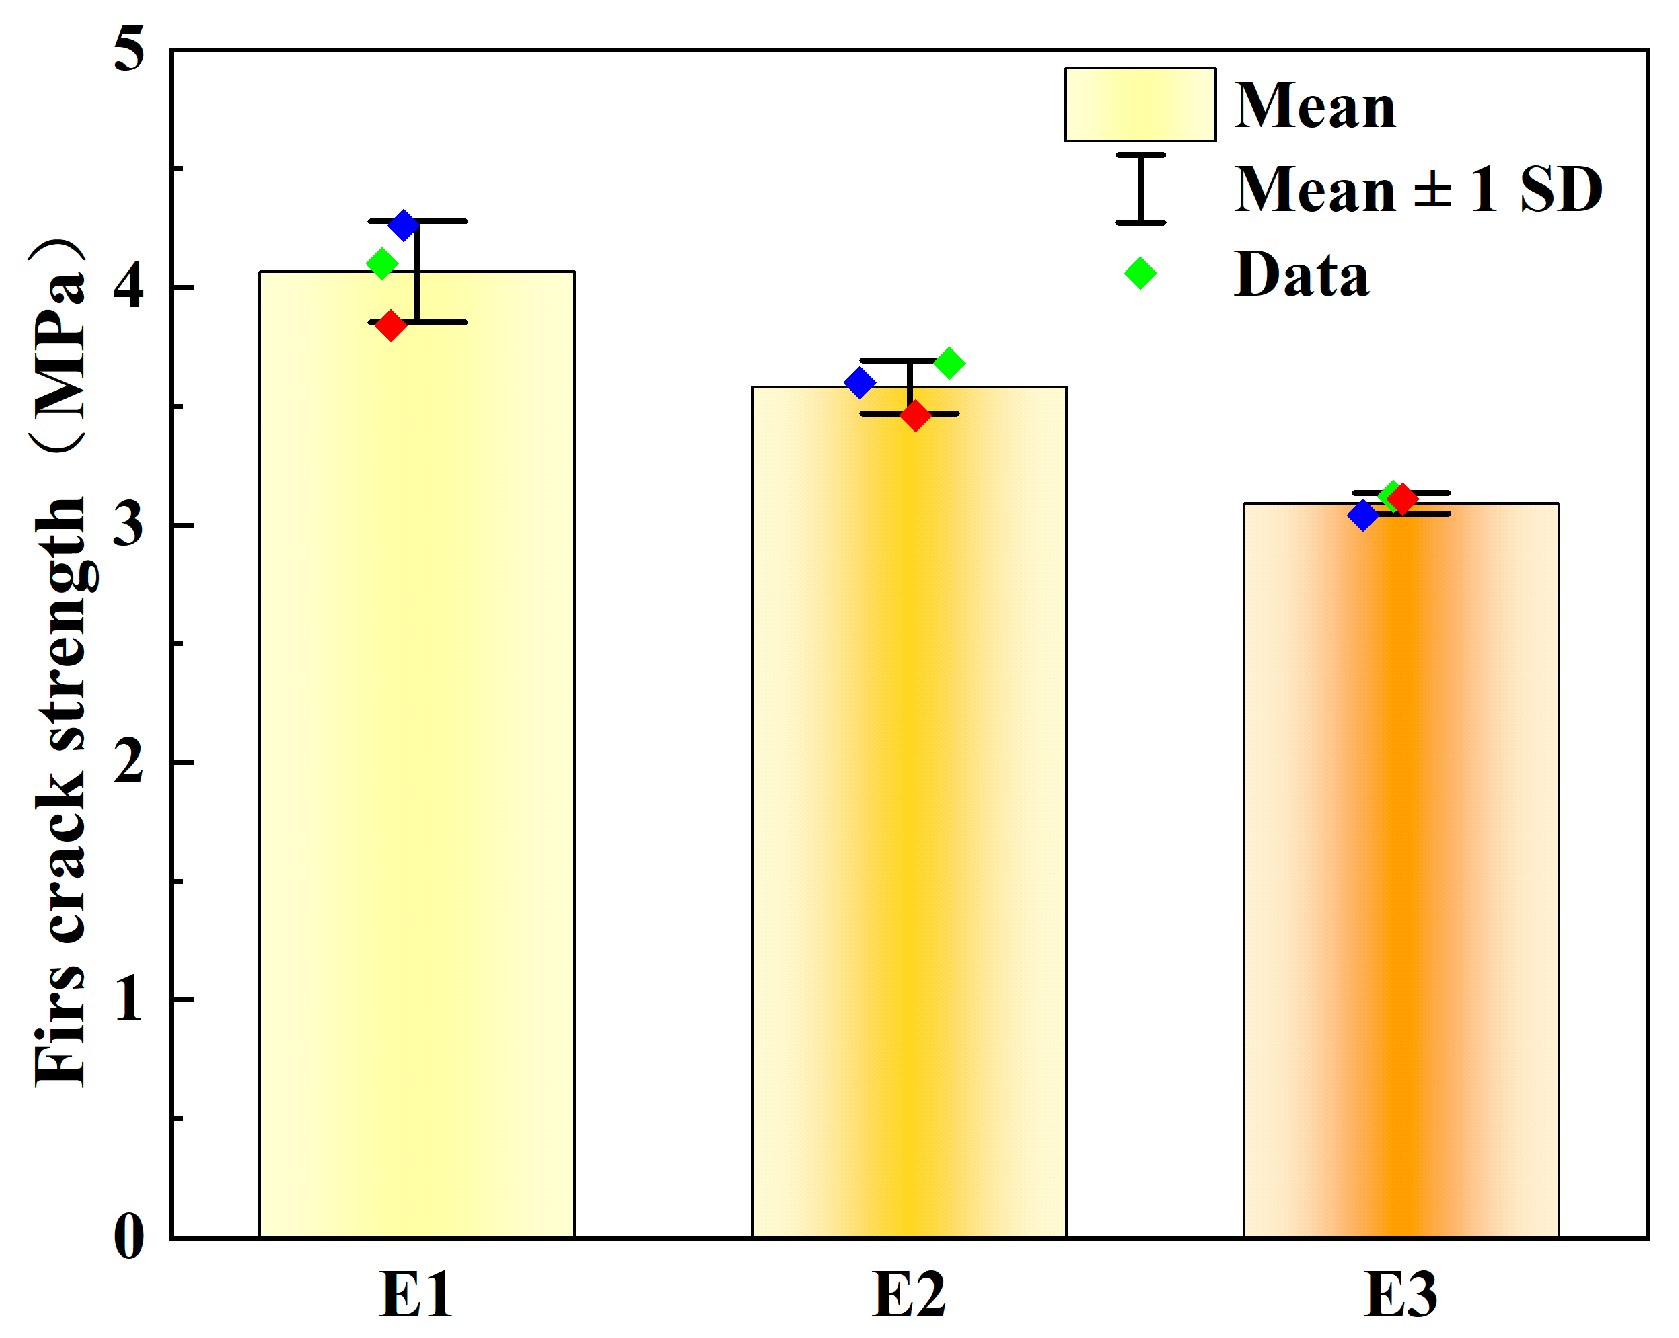
The first cracking strengths of E1, E2, and E3 were 2.51 MPa, 2.18 MPa, and 1.85 MPa, respectively, while their tensile strengths were 4.10 MPa, 3.58 MPa, and 3.09 MPa, as shown in Figure 8 and Figure 9. Both first cracking strength and tensile strength decreased with increasing water-to-binder ratio, indicating a reduction in matrix cracking resistance and tensile load-bearing capacity.
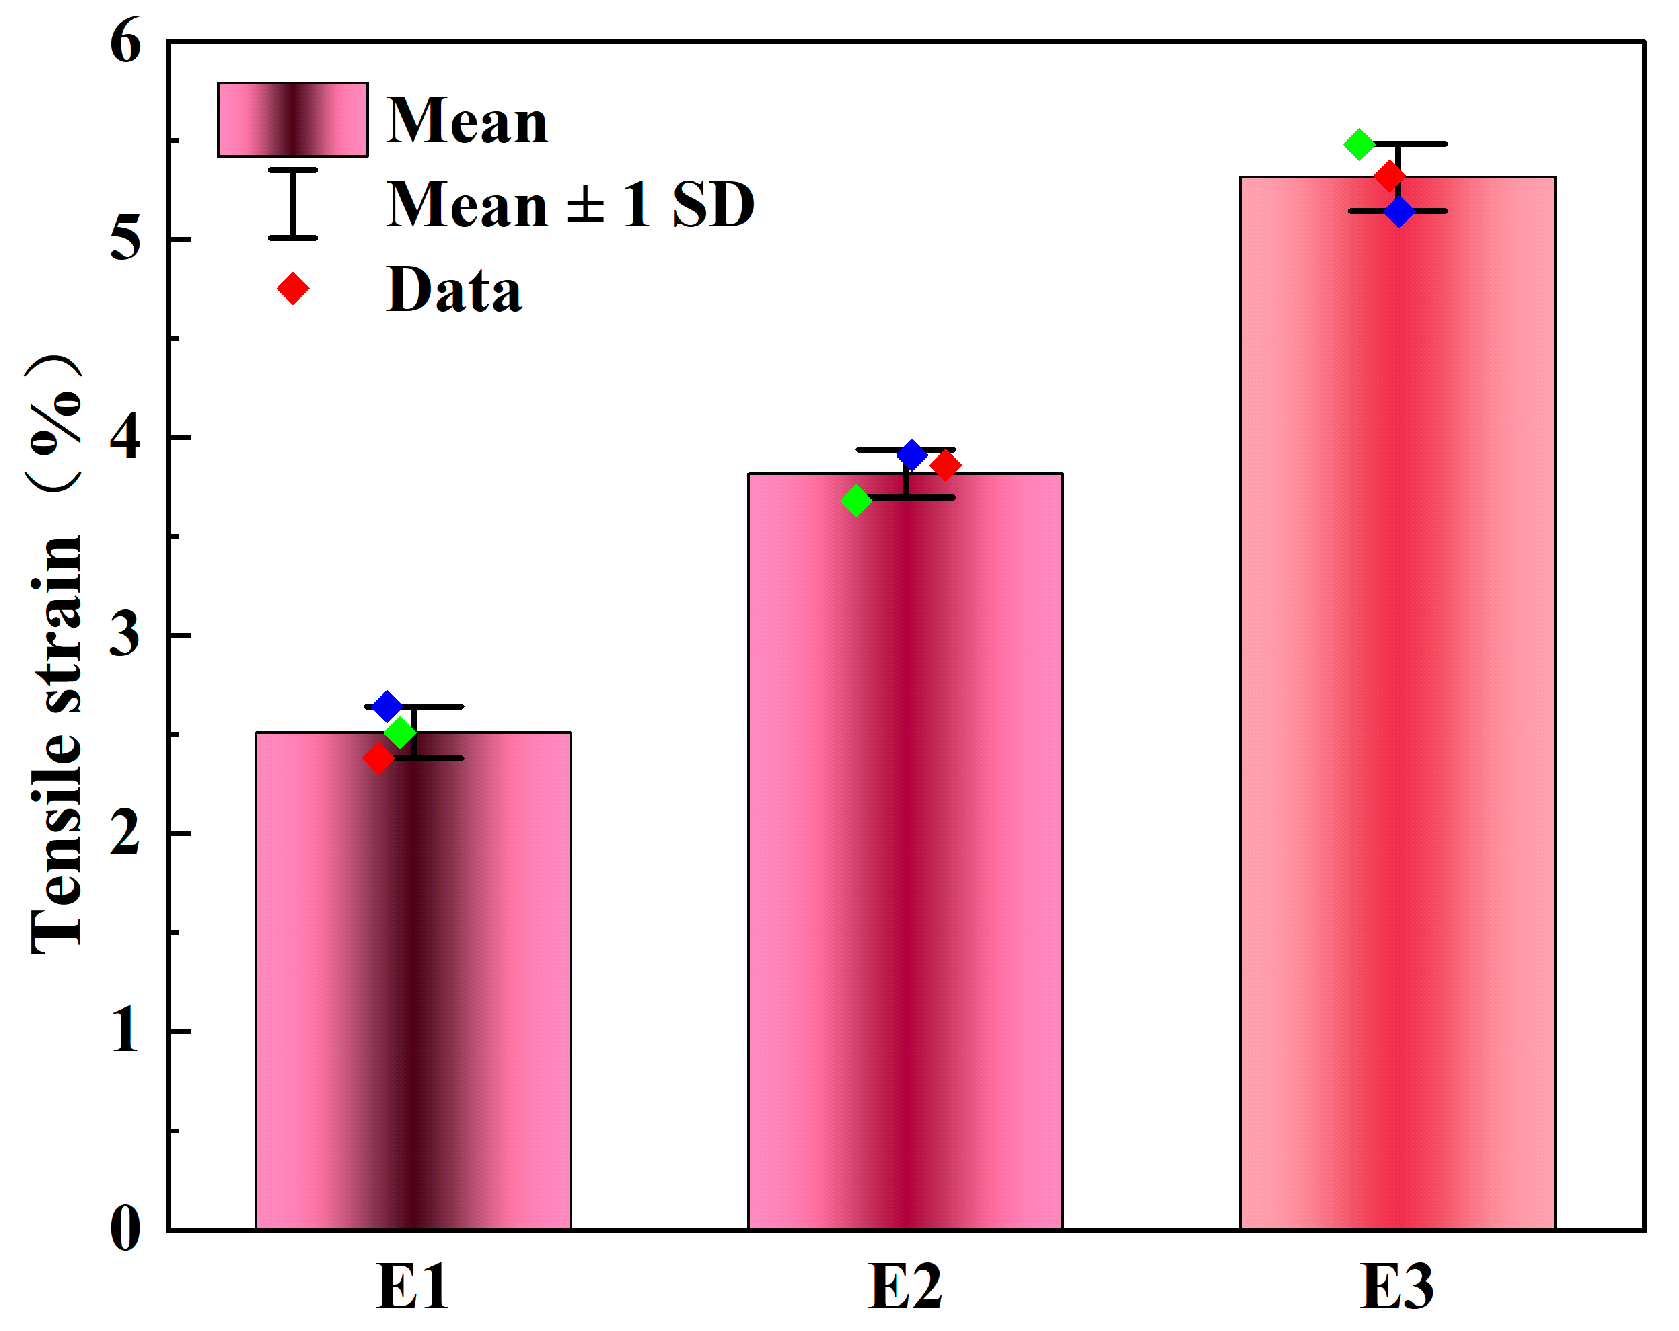
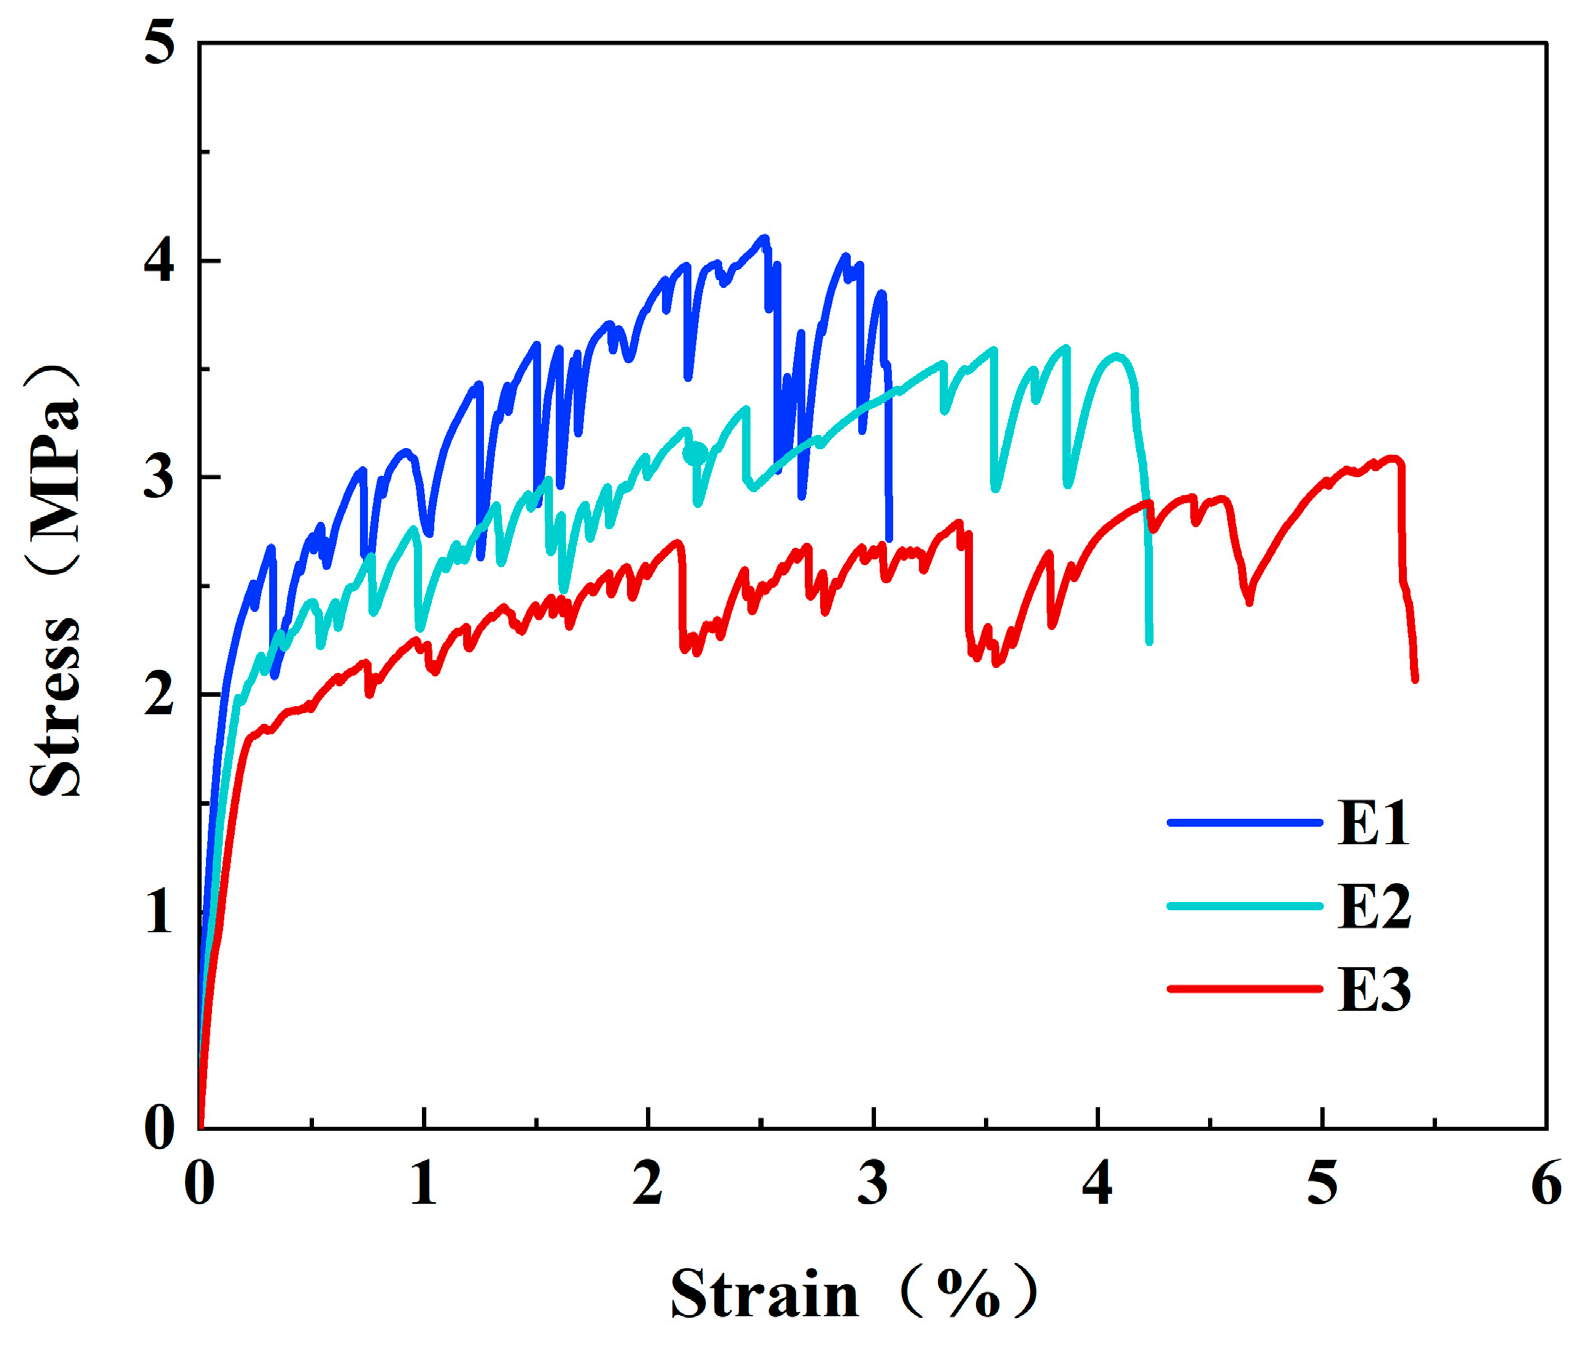
The peak tensile strains of E1, E2, and E3 were 2.51%, 3.86%, and 5.32%, respectively, as shown in Figure 10. In contrast to strength, the tensile deformation capacity increased with increasing water-to-binder ratio. The tensile stress–strain curves in Figure 11 show that all three ECC mixtures exhibited strain-hardening behavior after first cracking. These tensile properties were used to define the ECC tensile constitutive parameters in the subsequent finite element model.

3. Theoretical Estimation of Fatigue Damage Life of Expansion Joints

In the fatigue-life analysis of expansion joints, the time history of the maximum principal stress at vulnerable locations of the expansion joint under wheel loading is first obtained either through finite element simulation or by installing sensors on the bridge. The stress history is then simplified into stress cycles, and the number of cycles corresponding to each stress level is determined using the rainflow counting method, thereby obtaining the fatigue stress spectrum [32]. Subsequently, the fatigue life is determined using the material S-N curve [33]. However, since the S-N curve only considers fatigue life under constant-amplitude loading, whereas the fatigue problem of expansion joint structures involves variable-amplitude fatigue under wheel-impact loading, the present study adopts Miner’s linear cumulative fatigue damage theory [34] to linearly accumulate fatigue damage under different stress cycles and obtain the total fatigue damage, denoted by D. When nD = 1, the modular expansion joint is considered to have failed, where n is the fatigue life of the modular expansion joint, in years. The calculation procedure for the fatigue life of concrete in the expansion joint anchorage zone is shown in Figure 12. Rainflow counting and Miner-based cumulative fatigue-damage calculations were performed using MATLAB R2023b (The MathWorks, Inc., Natick, MA, USA).
According to Miner’s theory, the total fatigue damage D is calculated using Equation (1):
D = k D k = k N k N f k
where Nfk is the fatigue life corresponding to the stress amplitude △σk on the S-N curve, k = 1, 2, 3, …; Nk is the number of cycles of the stress amplitude △σk within one year, with Nk = 365 Ndk, and Ndk is the number of cycles of the stress amplitude △σk within one day.
For the fatigue-life calculation of C50 concrete in the expansion joint anchorage zone, the concrete axial tensile fatigue equation proposed in Ref. [35] is used:
f t max / f t = 0.9873 0.04 lg N
where N is the fatigue life of concrete, and ft and ftmax are the axial tensile strength and the maximum tensile stress of the concrete, respectively.
For the fatigue-life calculation of ECC in the expansion joint anchorage zone, the ECC axial tensile fatigue equation proposed in Ref. [36] is used:
S = 1.22405 0.09542 lg N
where N is the fatigue life of ECC, and S is the stress level, i.e., the ratio of the maximum tensile stress of ECC to its tensile strength.
The ECC fatigue relationship in Ref. [36] was selected because it was established from constant-amplitude uniaxial tensile fatigue tests on PVA-ECC specimens and expressed fatigue life in terms of the tensile stress level (S), which is consistent with the fatigue evaluation framework adopted in this study. The ECC specimens in Ref. [36] contained 2 vol.% PVA fibers with a length of 12 mm, a diameter of 0.04 mm, a tensile strength of 1600 MPa, and an elastic modulus of 40 GPa, and were cured for 28 days at 20 ± 2 °C and relative humidity greater than 95%. The material parameters and curing conditions reported in Ref. [36] are comparable to those adopted in the present study, providing a relevant reference for the fatigue evaluation of PVA-ECC materials. Ref. [36] established ECC tensile fatigue relationships under five stress levels (Smax = 0.90, 0.85, 0.80, 0.75, 0.70; Smin = 0.10), providing a suitable basis for estimating tensile fatigue damage of PVA-ECC materials. Since the objective of this analysis is to compare the relative fatigue resistance of different anchorage materials under the same vehicle-loading and cumulative-damage framework, the calculated fatigue lives are considered estimated values under the defined loading scenario.
The above procedure provides the basis for evaluating fatigue damage accumulation in the anchorage zone. Since stress histories at critical locations are required as input, a vehicle–expansion joint coupled finite element model is established in the following section to obtain the transient tensile stress responses of different anchorage-zone materials during vehicle passage. These stress histories are then used for rainflow counting and Miner-based fatigue damage evaluation.

4. Finite Element Model

4.1. Expansion Joint Modeling

4.1.1. Establishment of the Expansion Joint Finite Element Model

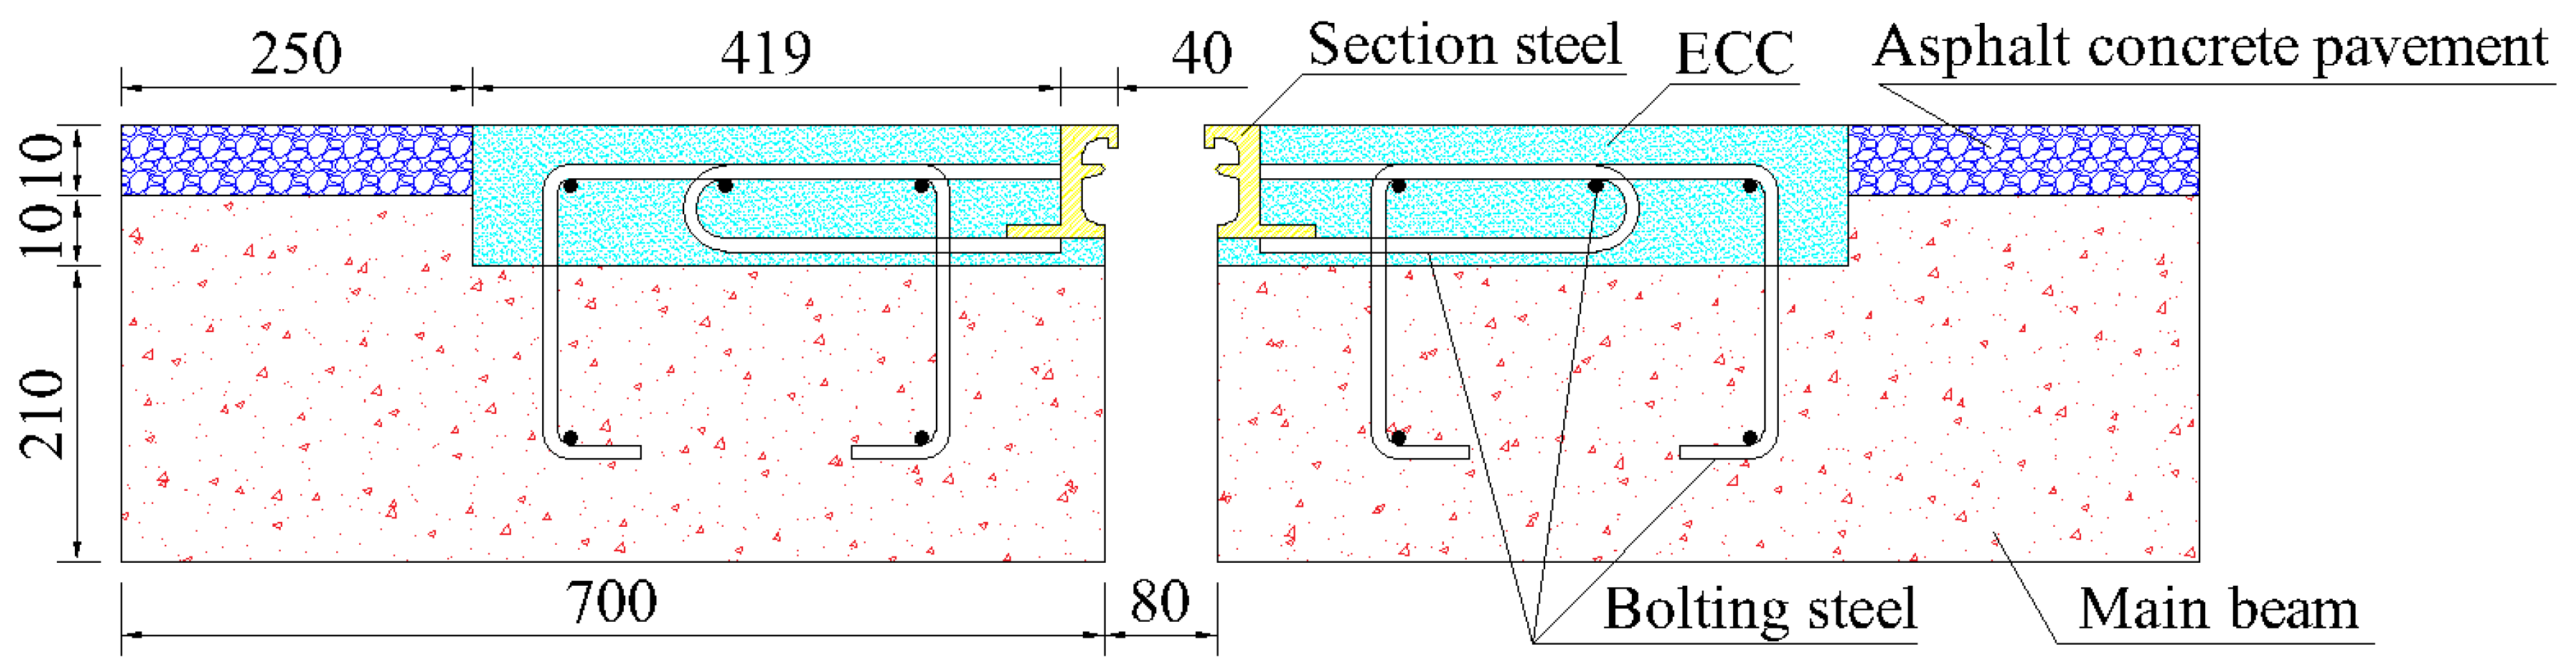
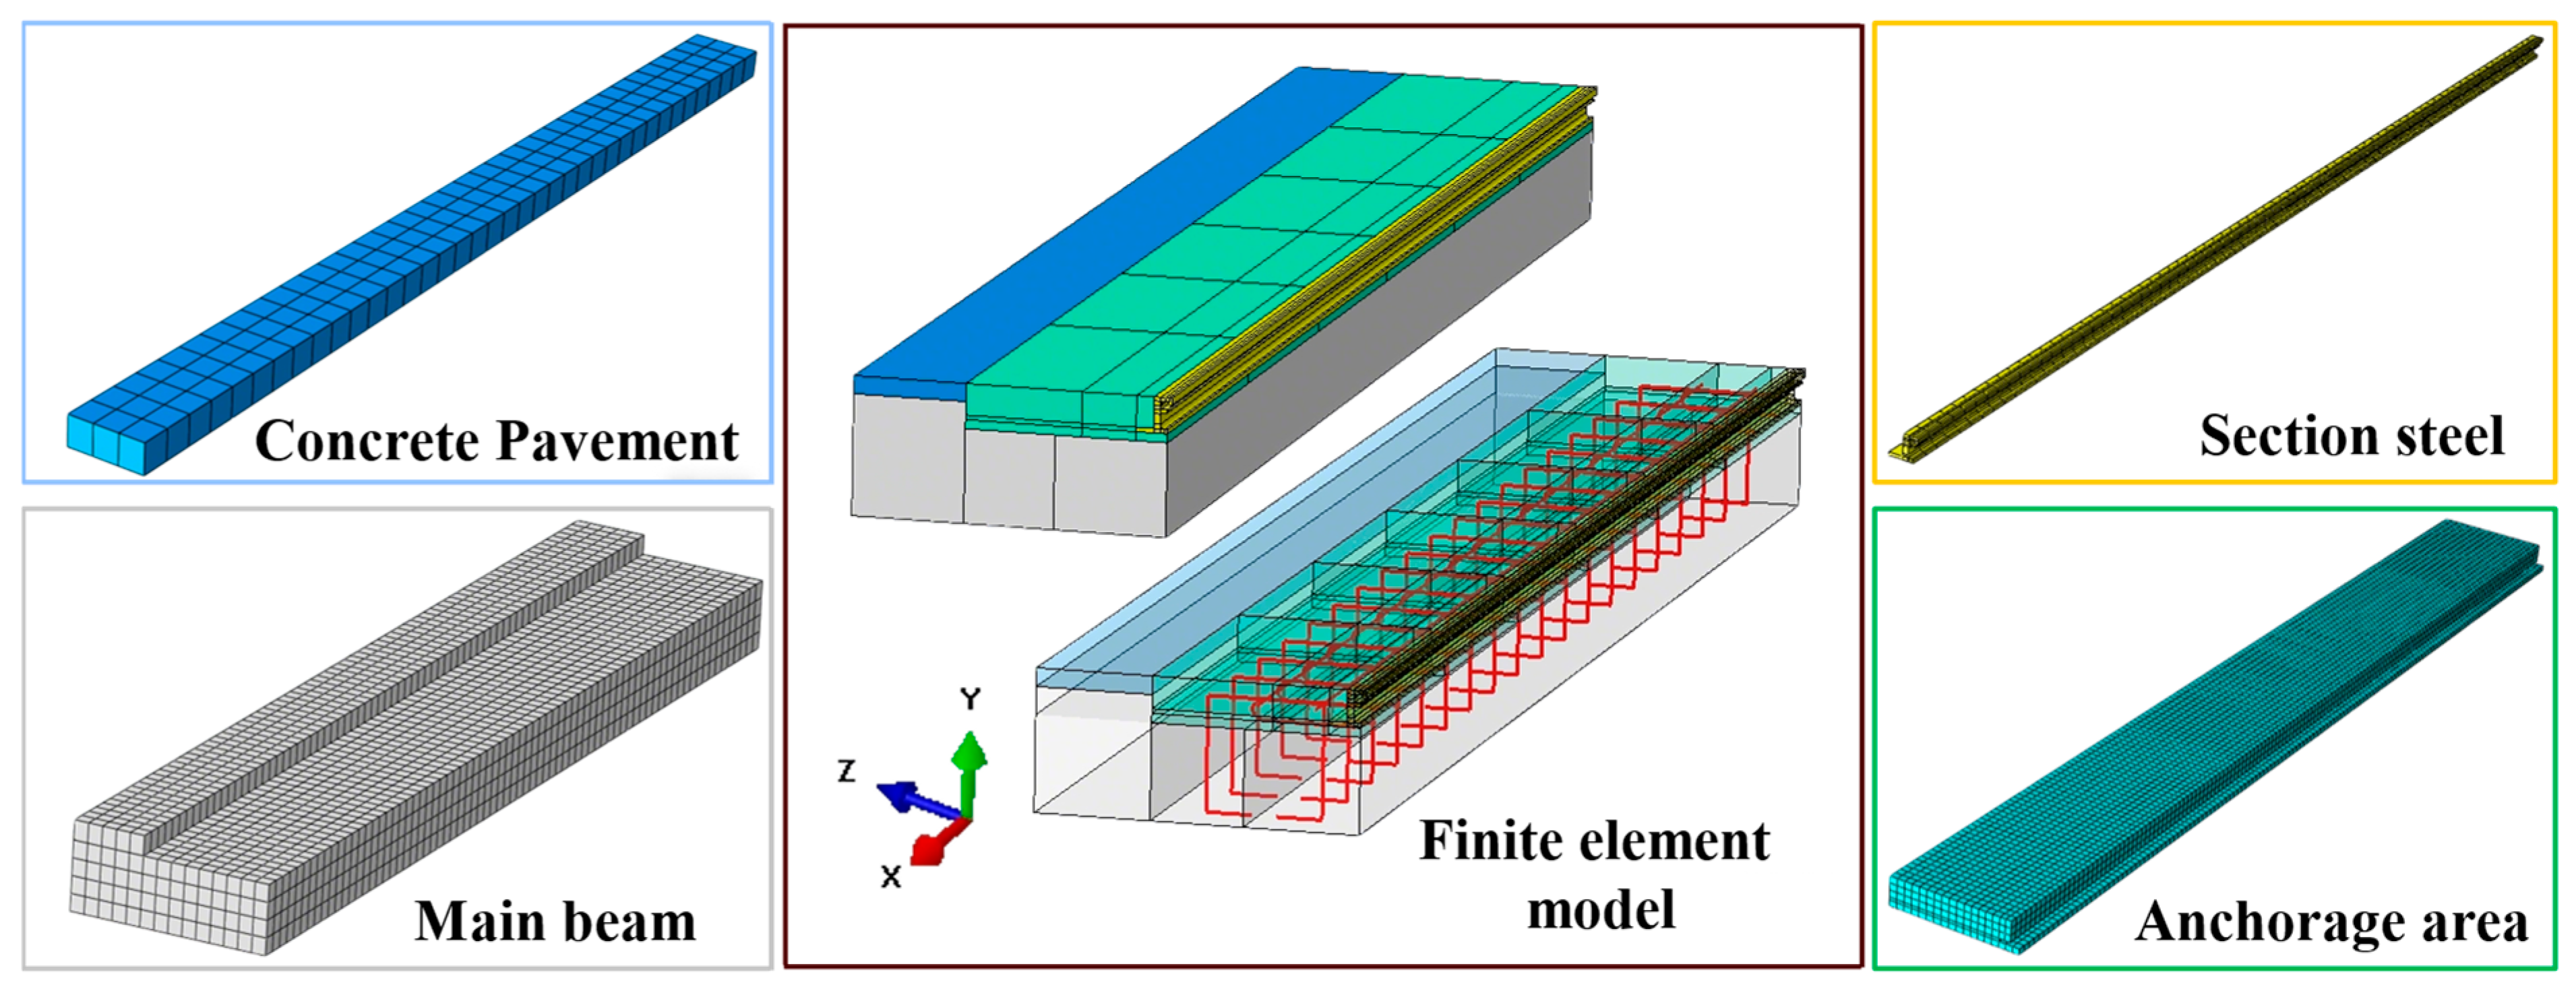
The three-dimensional vehicle–expansion joint coupled finite element model was established using Abaqus 2025 (Dassault Systèmes SIMULIA Corp., Johnston, RI, USA). In this study, a D80 single-gap steel expansion joint with special-shaped steel sections was adopted. Its structural components include the anchorage-zone concrete, bridge deck pavement layer, and F-shaped steel edge beams [37]. Steel plates are welded to the lower flange of the F-shaped steel section and are reliably connected to the anchorage reinforcement through these plates. A schematic of the structure is shown in Figure 13.
The steel edge beam, as the main load-bearing component of the expansion device, is generally made of low-carbon steel with good corrosion resistance. In this study, corrosion-resistant Q345 steel was selected as the material for the steel edge beam. The anchorage zone materials included three types of ECC (E1, E2, and E3) as well as C50 ordinary concrete. HRB400 reinforcing bars with a diameter of 16 mm were used as anchorage reinforcement. Bituminous concrete was used for the bridge deck pavement layer, and C50 concrete was used for the girder. The material properties are listed in Table 5.
In establishing the finite element model, the anchorage reinforcement was modeled using two-node linear three-dimensional truss elements, while the remainder of the model was represented using eight-node linear hexahedral elements with relatively high accuracy. Reduced integration was adopted in the analysis to balance computational efficiency and result accuracy. To make the stress analysis results more consistent with actual engineering conditions, mesh refinement was applied to the steel edge beam and the anchorage-zone concrete region, thereby improving simulation accuracy.
The interaction properties in the model were set as follows: a tie constraint was used between the bridge deck pavement layer and the girder, while for all other contact interfaces, the tangential behavior was defined as “rough” and the normal behavior as “hard” contact, so as to realistically simulate force transfer between components.
The boundary conditions of the expansion joint model were set with reference to the local expansion joint model analysis of relevant scholars [23] and adjusted reasonably according to the actual size effect of the present local model. Specifically, the bottom surface of the expansion joint structure (Y-direction) was fully fixed, with constraints of U1 = U2 = U3 = UR1 = UR2 = UR3 = 0. The back face of the model (Z-direction) was set as rotationally fixed, with constraints of U1 = UR1 = UR2 = UR3 = 0. The left and right sides of the model (X-direction) were assigned symmetry constraints, with U3 = UR1 = UR2 = 0. The established finite element model of the expansion joint is shown in Figure 14.

4.1.2. Material Constitutive Models

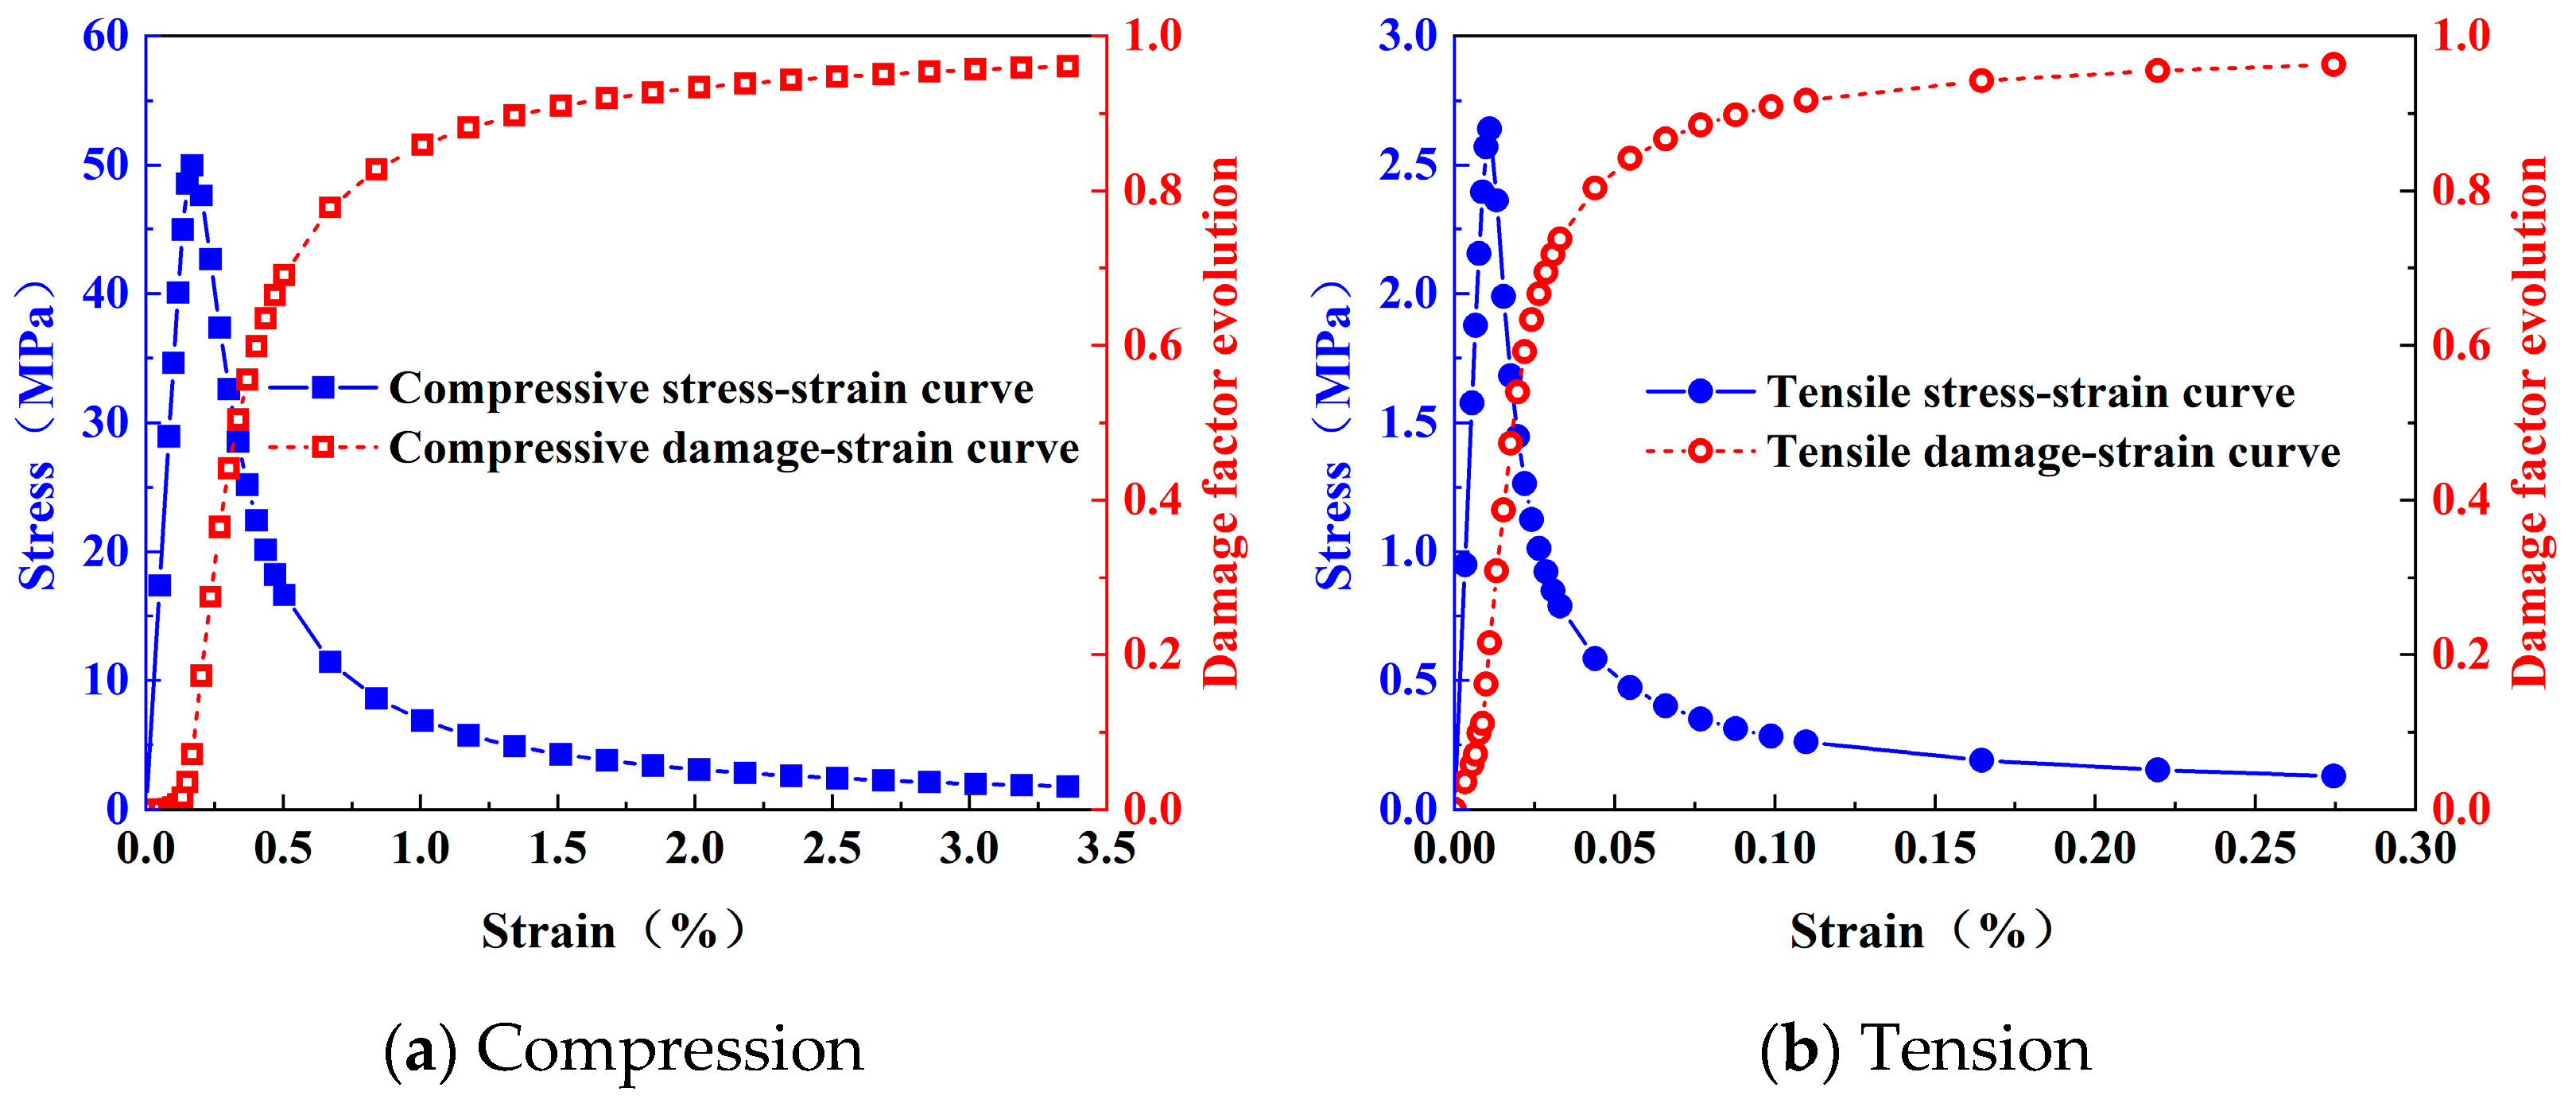
Both C50 concrete and ECC were modeled using the concrete damage plasticity (CDP) model, which can describe the different tensile and compressive responses of cementitious materials and the stiffness degradation caused by damage development [38]. The constitutive relationship of C50 concrete was determined according to the Code for Design of Concrete Structures [39].
For ECC, the constitutive parameters were determined from the material tests in Section 2.3 and relevant constitutive models in the literature. The elastic modulus of each ECC mixture was obtained from the initial linear segment of the measured compressive stress–strain curve, and Poisson’s ratio was taken as 0.20. The compressive strength, peak compressive strain, and ultimate compressive strain were obtained from the compression tests and are listed in Table 6. Based on these parameters, the compressive stress–strain relationship of ECC was generated using the model proposed by Zhou et al. [40] as expressed by Equation (4). For tensile behavior, a trilinear constitutive model was adopted according to Ref. [41], as expressed by Equation (5). The initial cracking strength, peak tensile strength, initial cracking strain, peak tensile strain, and ultimate tensile strain were extracted from the direct tensile test curves and are listed in Table 7. Therefore, the tensile constitutive curves used in the numerical model were directly linked to the measured tensile strength and deformation capacity of each ECC mixture.
The tensile and compressive damage factors of C50 concrete and ECC were calculated separately based on the energy-equivalence method [42], as expressed by Equation (6). The constitutive curves of C50 concrete and ECC are shown in Figure 15 and Figure 16, respectively.
The same CDP parameters were used for all cementitious materials, whereas the stress–strain and damage evolution curves were defined separately according to the experimentally determined properties of C50 concrete and each ECC mixture. In this way, the numerical model reflected the differences between ordinary concrete and ECC in tensile ductility, post-cracking load-carrying capacity, compressive nonlinearity, and damage evolution. The anchorage reinforcement was modeled using an ideal elastic–plastic constitutive law.
σ c = { 2 σ c 0 ε c ε c 0 0 ε c ε c 0 3 σ c 0 ε c 2 ε c 0 + σ c 0 2 ε c 0 3 < ε c ε c 0 2 σ c 0 σ c 0 ε c ε c 0 ε c 0 < ε c 3 ε c 0 2 f c 0 ( ε c ε c u ) 3 ε c 0 2 ε c u 3 ε c 0 2 < ε c ε c u
where σ c is the compressive stress; σ c 0 is the axial compressive strength; ε c 0 is the peak axial compressive strain; ε c u is the ultimate compressive strain; and ε c is the compressive strain.
σ t = { σ t 0 ε t ε t 0 ε t ε t 0 σ t 0 + ( σ t p σ t 0 ) ε t ε t 0 ε t p ε t 0 ε t 0 < ε t ε t p σ t p ( ε t u ε t ε t u ε t p ) ε t p < ε t ε t u
where σ t is the tensile stress; σ t 0 is the initial cracking strength; σ t p is the peak tensile strength; ε t 0 is the initial cracking strain; ε t p is the ECC peak strain corresponding to the peak tensile strength; ε t u is the ultimate tensile strain; and ε t is the tensile strain.
d c , t = 1 σ c , t E 0 ε c , t
where d(c,t) is the damage factor of ECC, denoted as dc under compression and dt under tension; E0 is the initial elastic modulus; and σ(c,t) and ε(c,t) are the stress and strain under compression or tension, respectively.

4.2. Vehicle Modeling

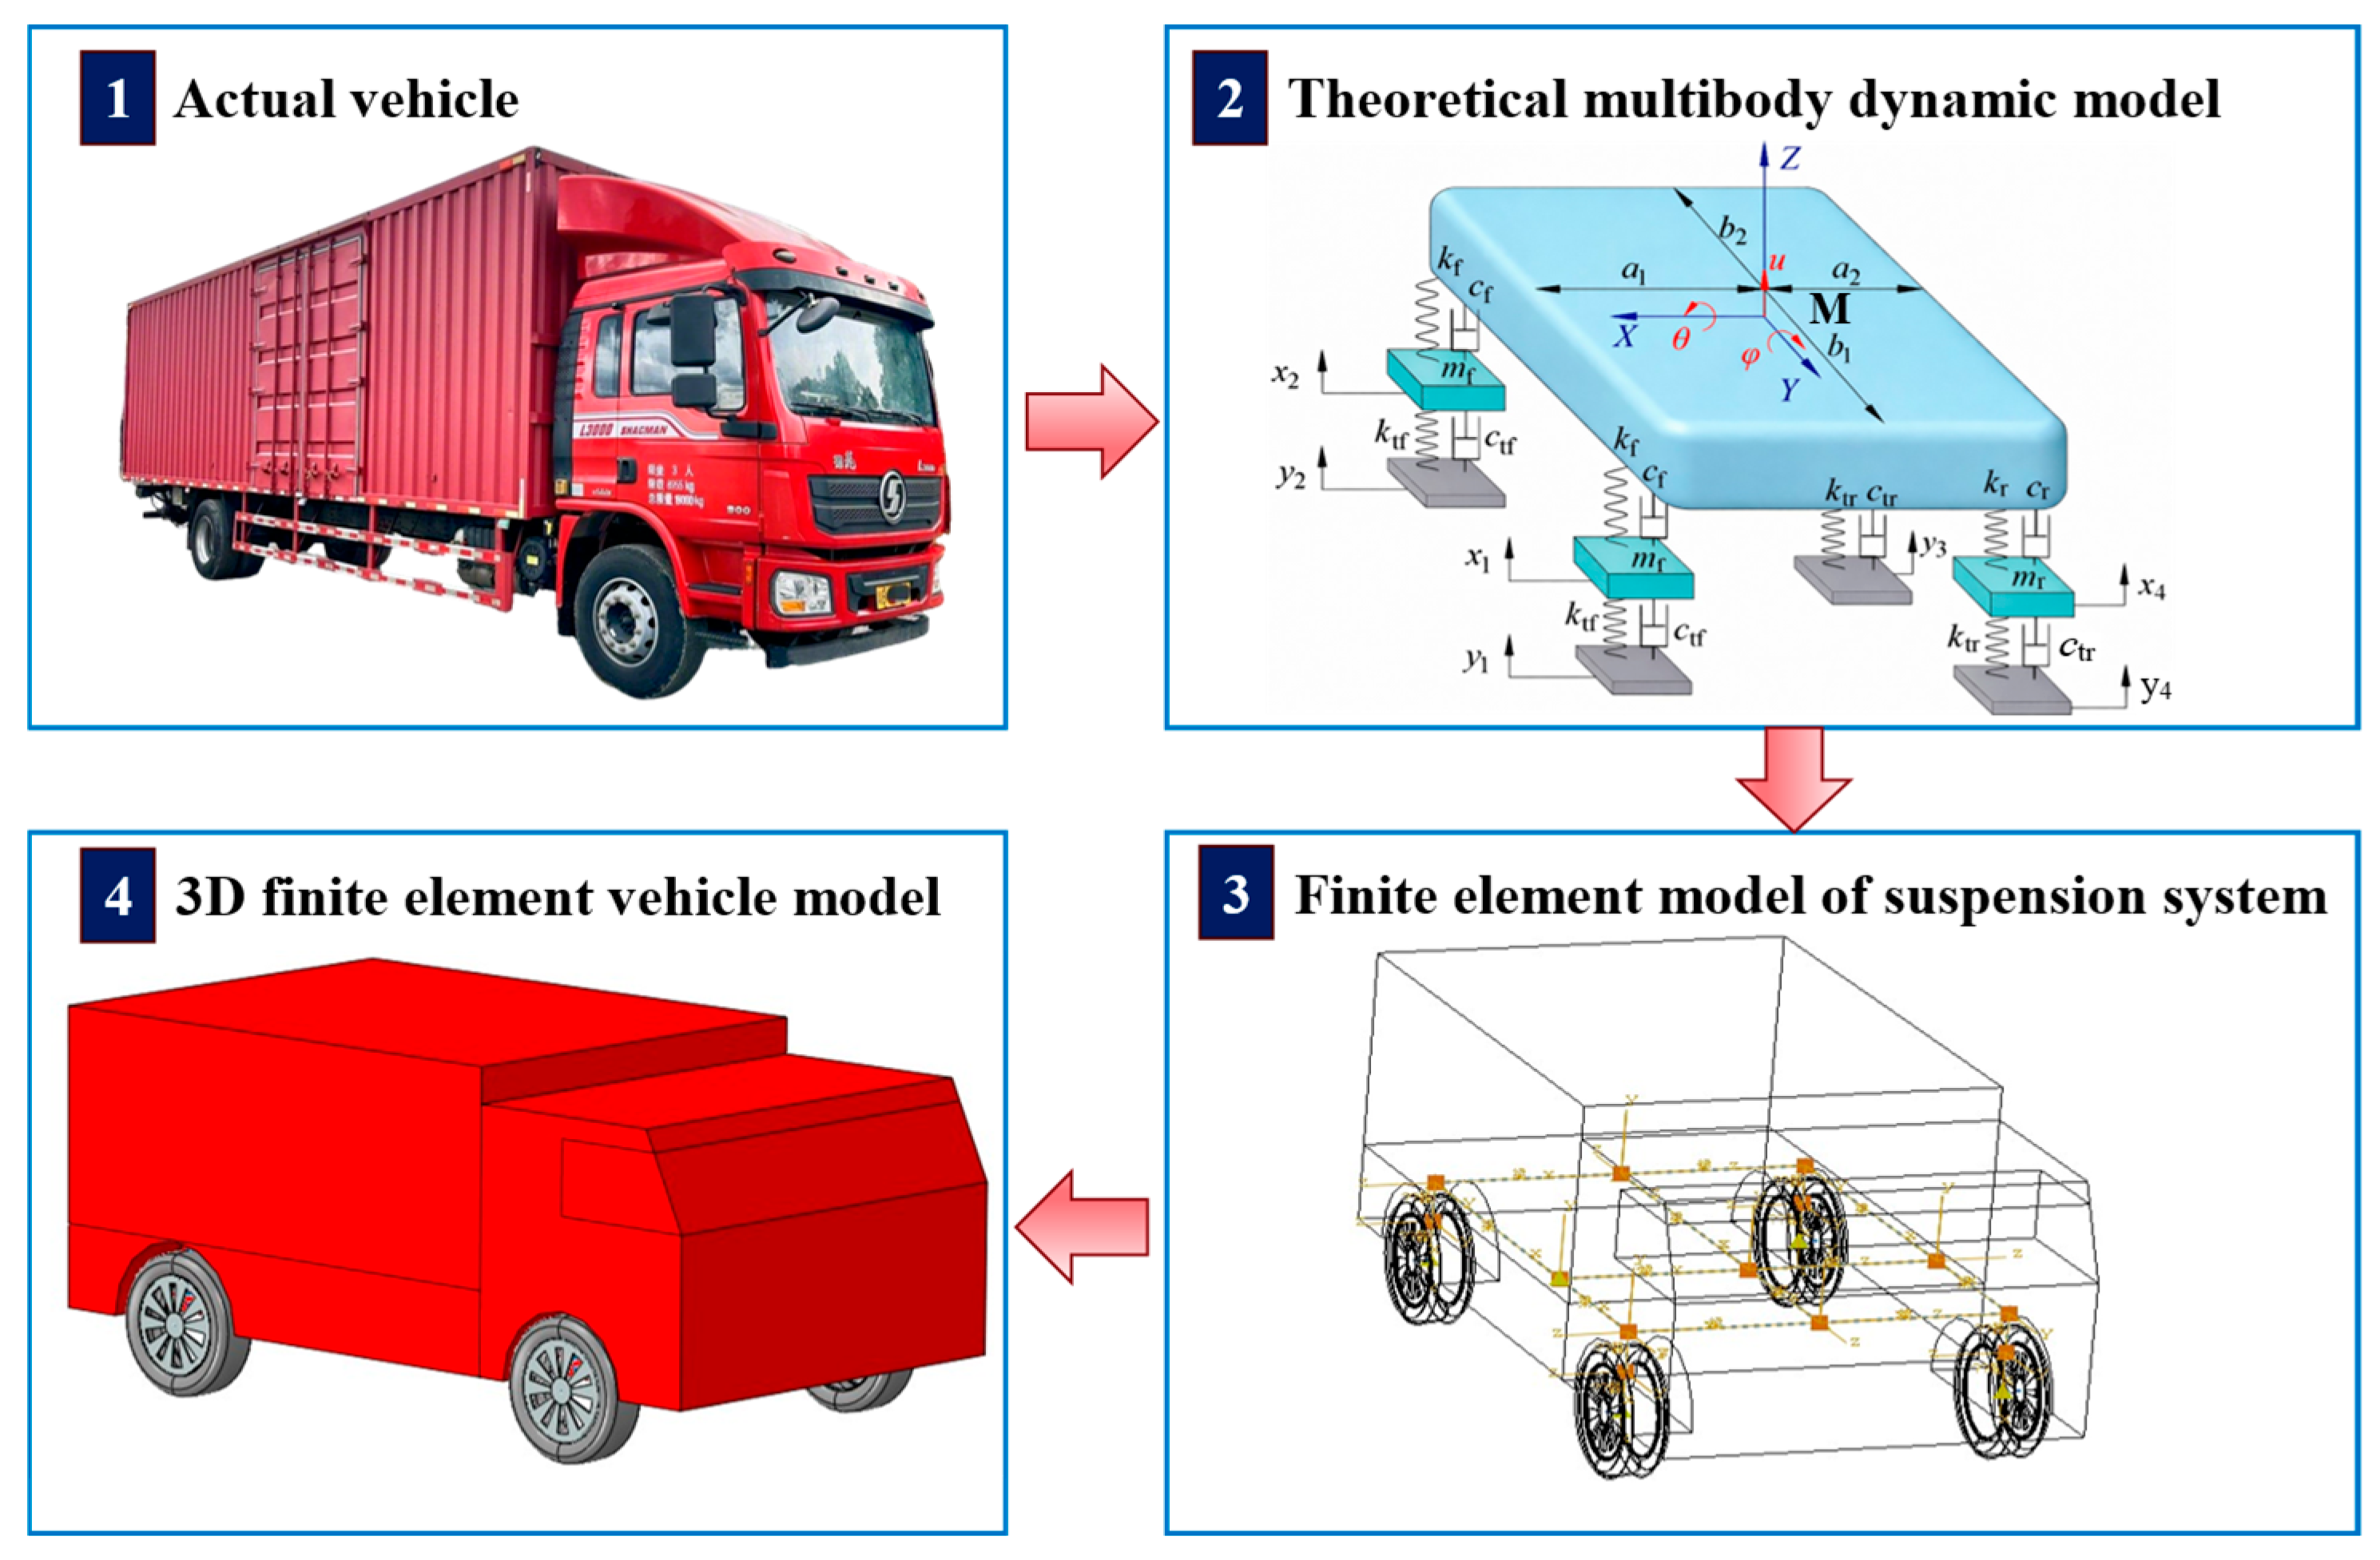
To accurately reproduce the vibration and impact effects when a vehicle passes over a bridge expansion joint, a three-dimensional vehicle dynamics model was established based on multibody dynamics theory [43]. In Abaqus, the entire vehicle was simplified into a multirigid-body system connected by rigid beams, in which the vehicle body and tires were defined as rigid bodies, while the damping and stiffness characteristics of the suspension system and tires were equivalently simulated using spring–damper elements.
The constructed vehicle model mainly consisted of a vehicle body, front axle, rear axle, and four wheels, with force and motion transmitted among the components through the suspension system. The model fully considered key dynamic degrees of freedom during vehicle travel, including vertical vibration, pitching motion, and rolling motion, and was thus able to accurately reflect the complex stress response characteristics of the vehicle in the expansion joint region. The geometry of the vehicle finite element model is shown in Figure 17, and the mechanical parameters are listed in Table 8 [44].

4.3. Mesh Sensitivity Analysis

To ensure that the numerical response was not significantly affected by mesh discretization, a mesh sensitivity analysis was conducted before model validation and subsequent dynamic-response analysis. All solid components, including the steel edge beam, anchorage-zone material, asphalt pavement layer, and main girder concrete, were modeled using eight-node linear hexahedral reduced-integration elements (C3D8R). The anchorage reinforcement was represented using two-node linear three-dimensional truss elements (T3D2).
A non-uniform meshing strategy was adopted according to the expected stress gradients in different structural regions. The anchorage zone, F-shaped steel edge beam, anchorage reinforcement, and adjacent interface regions were treated as critical regions because local stress concentration was expected in these areas. The adopted local mesh size for these regions was 25 mm. The asphalt pavement layer and main girder concrete, which were located away from the critical load-transfer path, were meshed using a coarser nominal element size of 50 mm to reduce the computational cost. The overall mesh configuration of the finite element model is shown in Figure 14.
The EJ-C50 model was selected as the representative case for the mesh sensitivity analysis. The vehicle-passing condition was set to 20 km/h, which was identical to the condition used in the subsequent field-based model validation. All material properties, contact definitions, boundary conditions, vehicle parameters, and analysis settings were kept unchanged among the mesh schemes. Three local mesh sizes, namely 50 mm, 25 mm, and 12.5 mm, were considered for the anchorage zone, steel edge beam, anchorage reinforcement, and adjacent interface regions, whereas the mesh density of the pavement layer and main girder concrete was kept unchanged.
A fixed numerical monitoring point was defined within the C50 anchorage zone at the same geometric location as the strain-measurement position used in the subsequent validation case. The axial strain component in the sensor direction was extracted from this point for all mesh schemes. Only numerical results were used in this section to assess mesh convergence, whereas the field-measured strain was used separately in Section 4.4 for model validation.
As summarized in Table 9, the peak compressive strain gradually converged as the local mesh was refined. The peak compressive strain decreased from 40.85 με for the 50 mm mesh to 35.84 με and 34.18 με for the 25 mm and 12.5 mm meshes, respectively. Taking the 12.5 mm mesh as the reference, the relative deviations of the 50 mm and 25 mm mesh schemes were 19.54% and 4.87%, respectively. The 50 mm mesh was therefore considered insufficient for accurately capturing the local dynamic response of the anchorage zone. In contrast, further refinement from 25 mm to 12.5 mm resulted in only a limited change in the peak strain, whereas the calculation time increased from 7.5 h to 16.9 h. Therefore, the 25 mm local mesh was adopted for the subsequent model-validation, dynamic-response, and fatigue-life analyses because it satisfied the adopted 5% convergence criterion while maintaining reasonable computational efficiency.

4.4. Model Validation

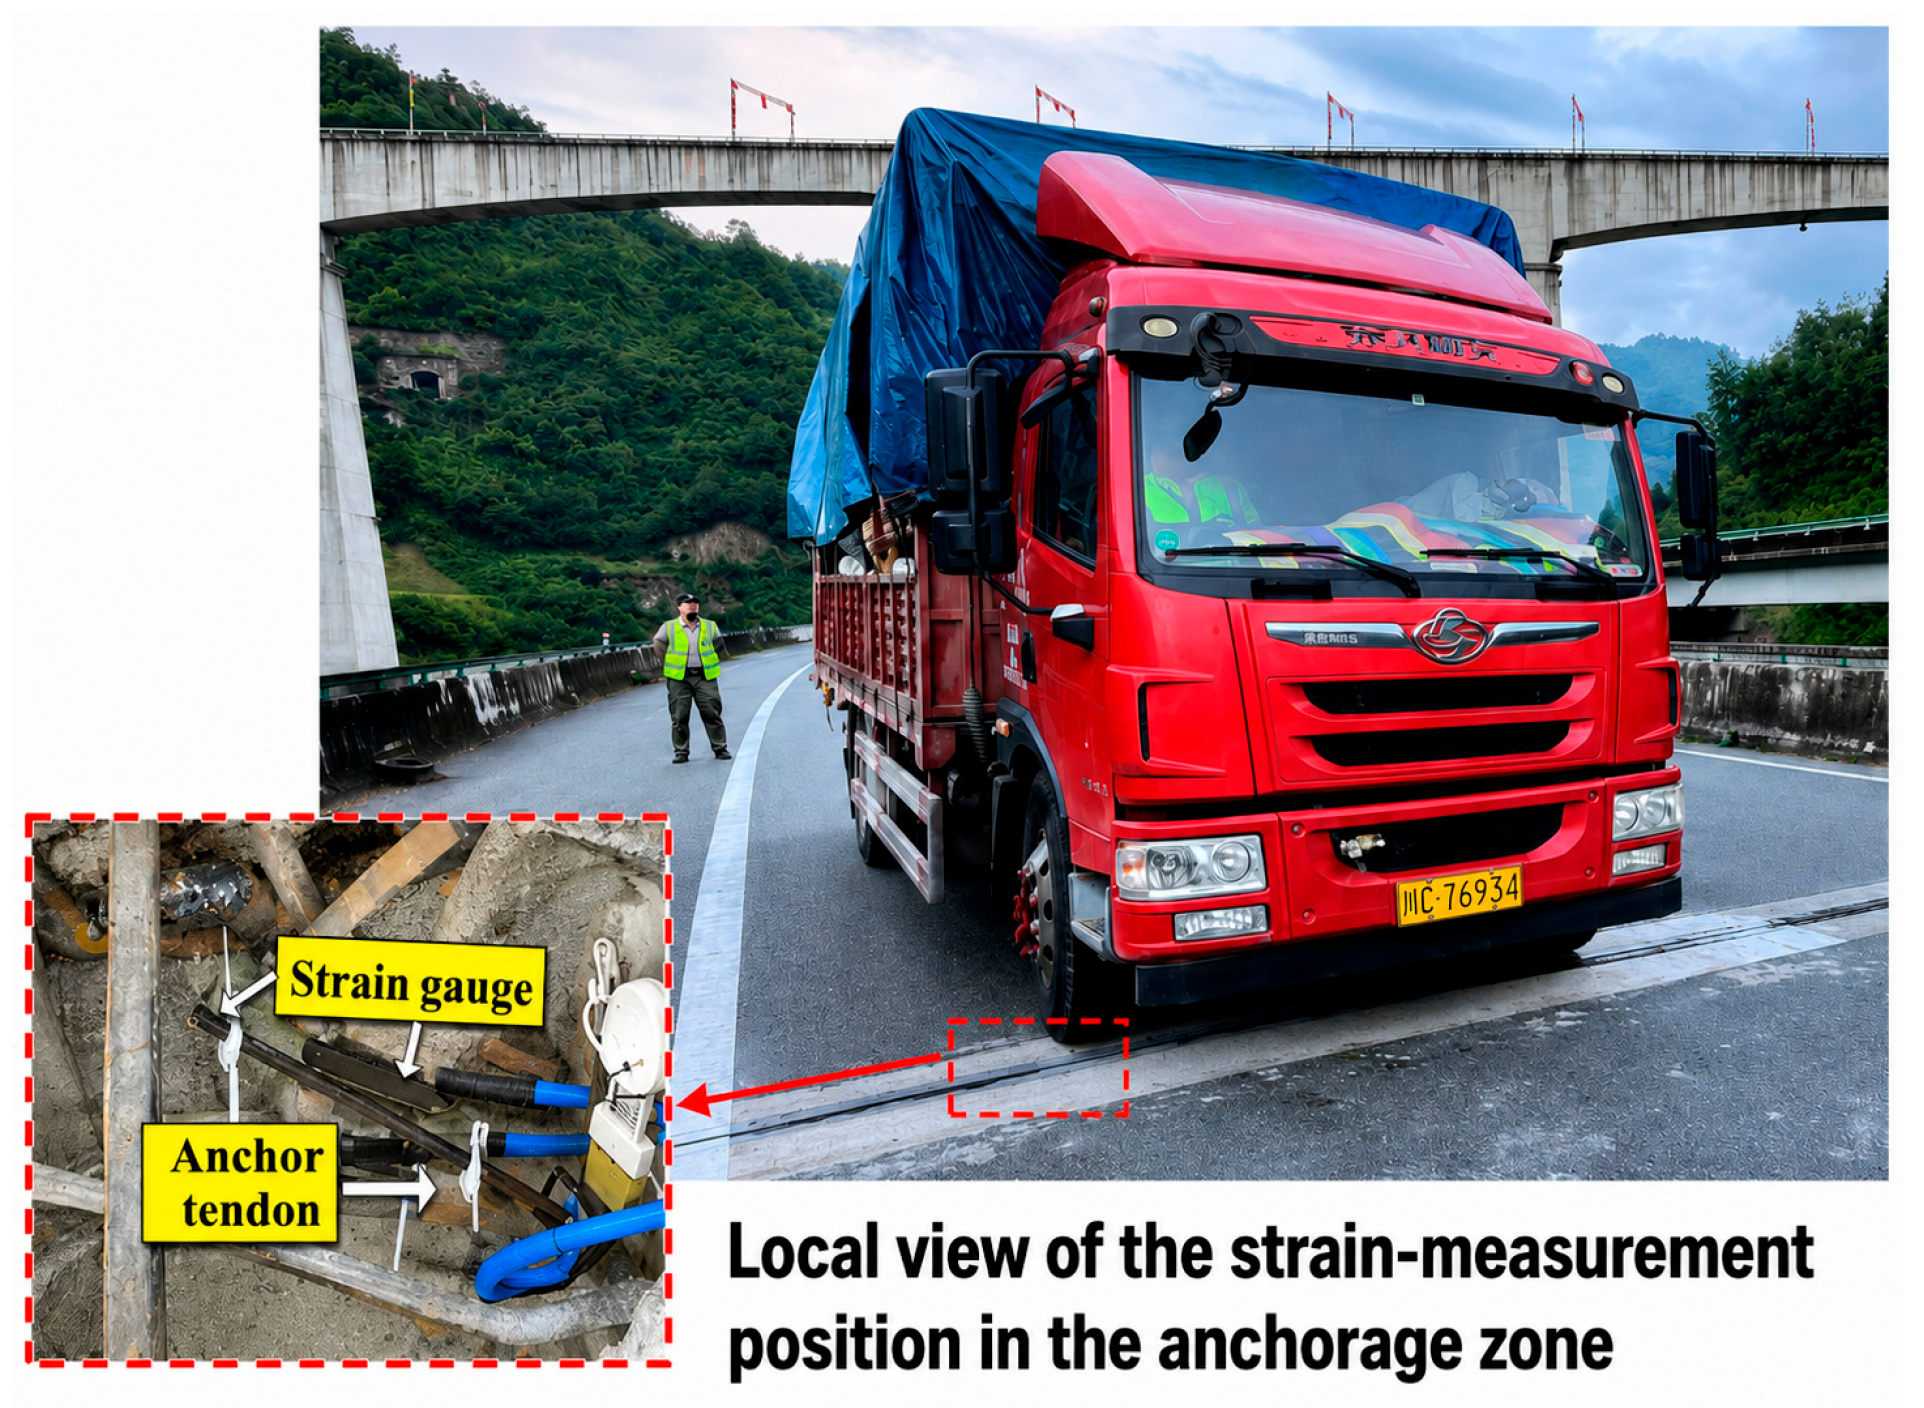
After the mesh sensitivity analysis, the finite element model with the selected 25 mm local mesh was validated against the field-test results reported by Zhao [45]. In that test, a truck passed over an expansion joint with a C50 concrete anchorage zone at a speed of 20 km/h, and embedded resistance-type concrete strain sensors were installed in the anchorage zone to record the strain response in real time. The test arrangement is shown in Figure 18.
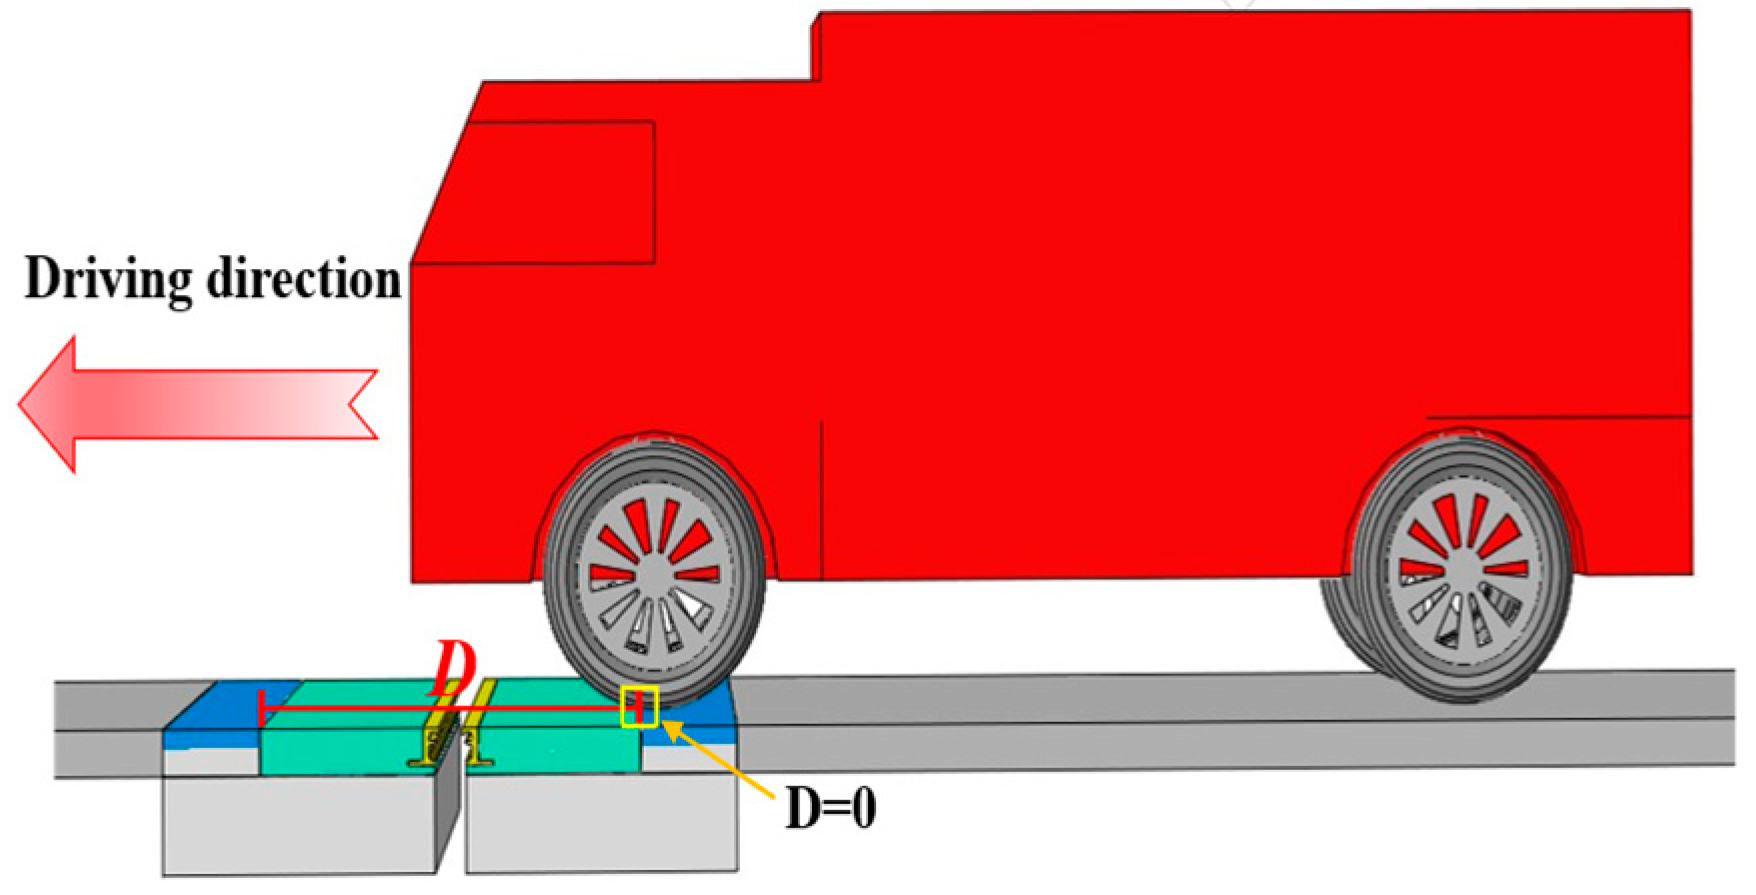
Following the above test scheme strictly, a three-dimensional truck model was established in Abaqus to simulate the truck passing over the expansion joint at the same speed (20 km/h). For convenient comparison, a parameter D was introduced to represent the relative wheel position: D was defined as the distance between the wheel centerline and the interface between the expansion joint anchorage zone and the bridge deck pavement layer (see Figure 19). D takes a negative value before the wheel centerline crosses the interface and a positive value after crossing.
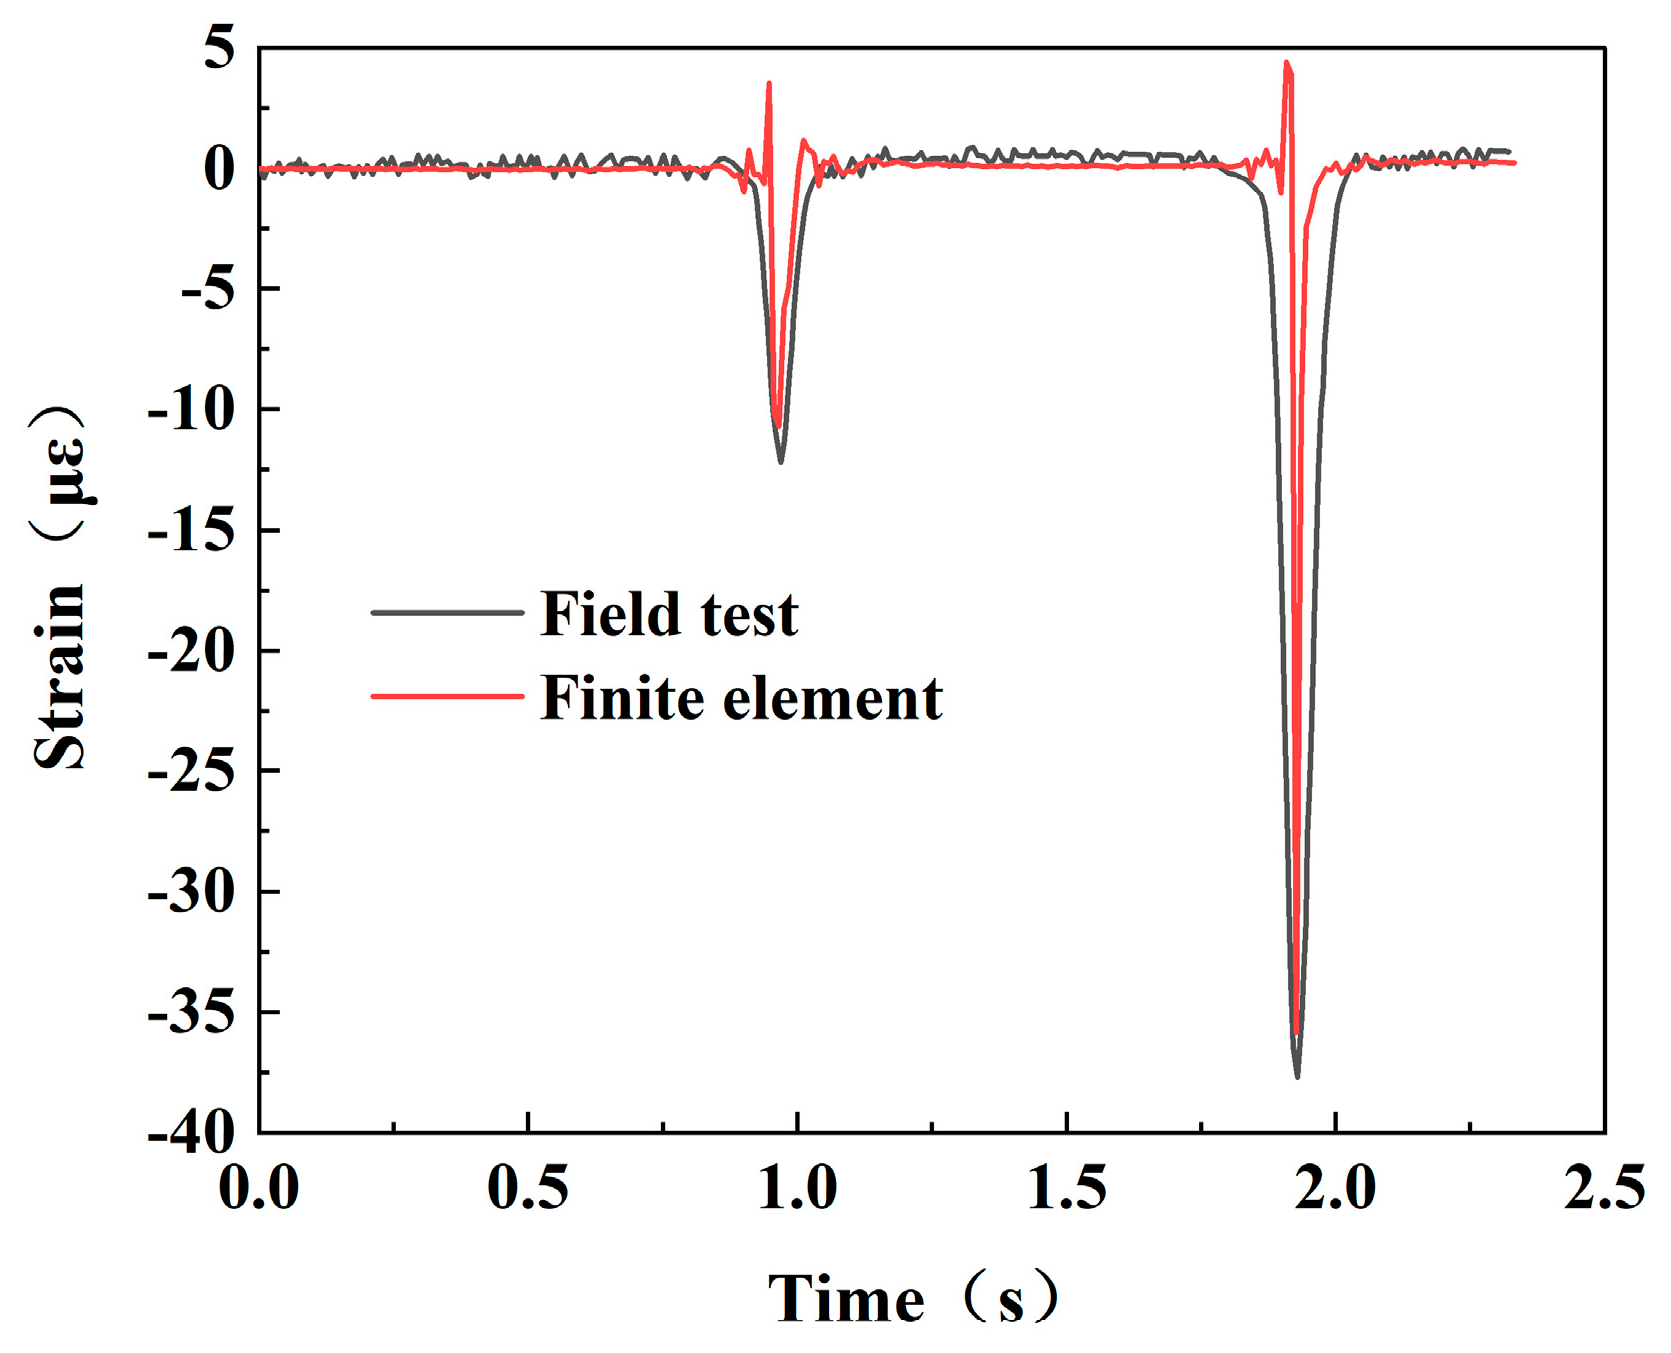
The time–history curve of concrete strain in the anchorage zone at travel distance D was extracted and compared with the reported field test data (see Figure 20). The results show that throughout the process of the vehicle passing over the expansion joint, the strain time–history curve obtained from the finite element simulation agrees well with the field test curve in overall trend. The maximum compressive strains obtained from the simulation and field test were 35.84 με and 37.70 με, respectively, with a relative error of 4.93%, indicating acceptable agreement for engineering comparison.
The above comparison validates the vehicle–expansion joint coupled dynamic framework used in this study, including the vehicle-passing process, contact definition, boundary condition, mesh scheme, and local dynamic strain response of the anchorage zone. After validation, the same geometric model, boundary conditions, contact settings, vehicle model, loading process, and stress extraction method were adopted for all material schemes. Therefore, under identical structural and loading conditions, the differences in the dynamic response of C50 concrete and ECC anchorage zones are governed primarily by their material constitutive behavior. As described in Section 4.1.2, the ECC material models were defined using the experimentally determined compressive and tensile constitutive relationships and damage parameters. Thus, the validated coupled framework provides a reasonable basis for comparing the stress response and fatigue damage tendency of anchorage zones made of different materials.
Based on the mesh convergence analysis and model validation, the established model was used in the following section to analyze the spatial distribution and peak values of the principal tensile and compressive stresses in C50 concrete and ECC anchorage zones. The extracted critical tensile stress histories were further combined with the fatigue-life evaluation procedure introduced in Section 3 to estimate fatigue damage accumulation.
The following assumptions and limitations should be noted. First, the bridge expansion joint was modeled as a local structural system, and equivalent boundary constraints were applied to represent the restraint effect of the surrounding bridge structure. Therefore, full-bridge vibration and long-distance wave propagation were not explicitly considered. Second, the vehicle was simplified as a multirigid-body system, and the suspension and tire effects were represented using spring–damper elements. Complex tire deformation, braking or acceleration, wheel-path deviation, and random pavement roughness were not included. Third, the contact conditions between different structural components were idealized using predefined contact settings, and long-term interface degradation, debonding, material wear, and environmental deterioration were not explicitly simulated. Finally, the fatigue lives obtained in this study should be interpreted as comparative estimates under the defined vehicle-loading scenario, rather than as absolute service lives for all field conditions.

5. Results and Discussion

Based on the fatigue-life calculation framework established in Section 3 and the validated vehicle–expansion joint coupled model described in Section 4, the dynamic response and fatigue performance of different anchorage-zone materials were analyzed in this section. Four working conditions were considered, corresponding to anchorage zones made of E1, E2, E3, and C50 concrete, denoted as EJ-E1, EJ-E2, EJ-E3, and EJ-C50, respectively. The principal stress response was first analyzed to identify critical stress regions, and the extracted tensile stress histories were then used for fatigue-damage and fatigue-life evaluation.

5.1. Principal Stress Response Analysis of the Anchorage Zone

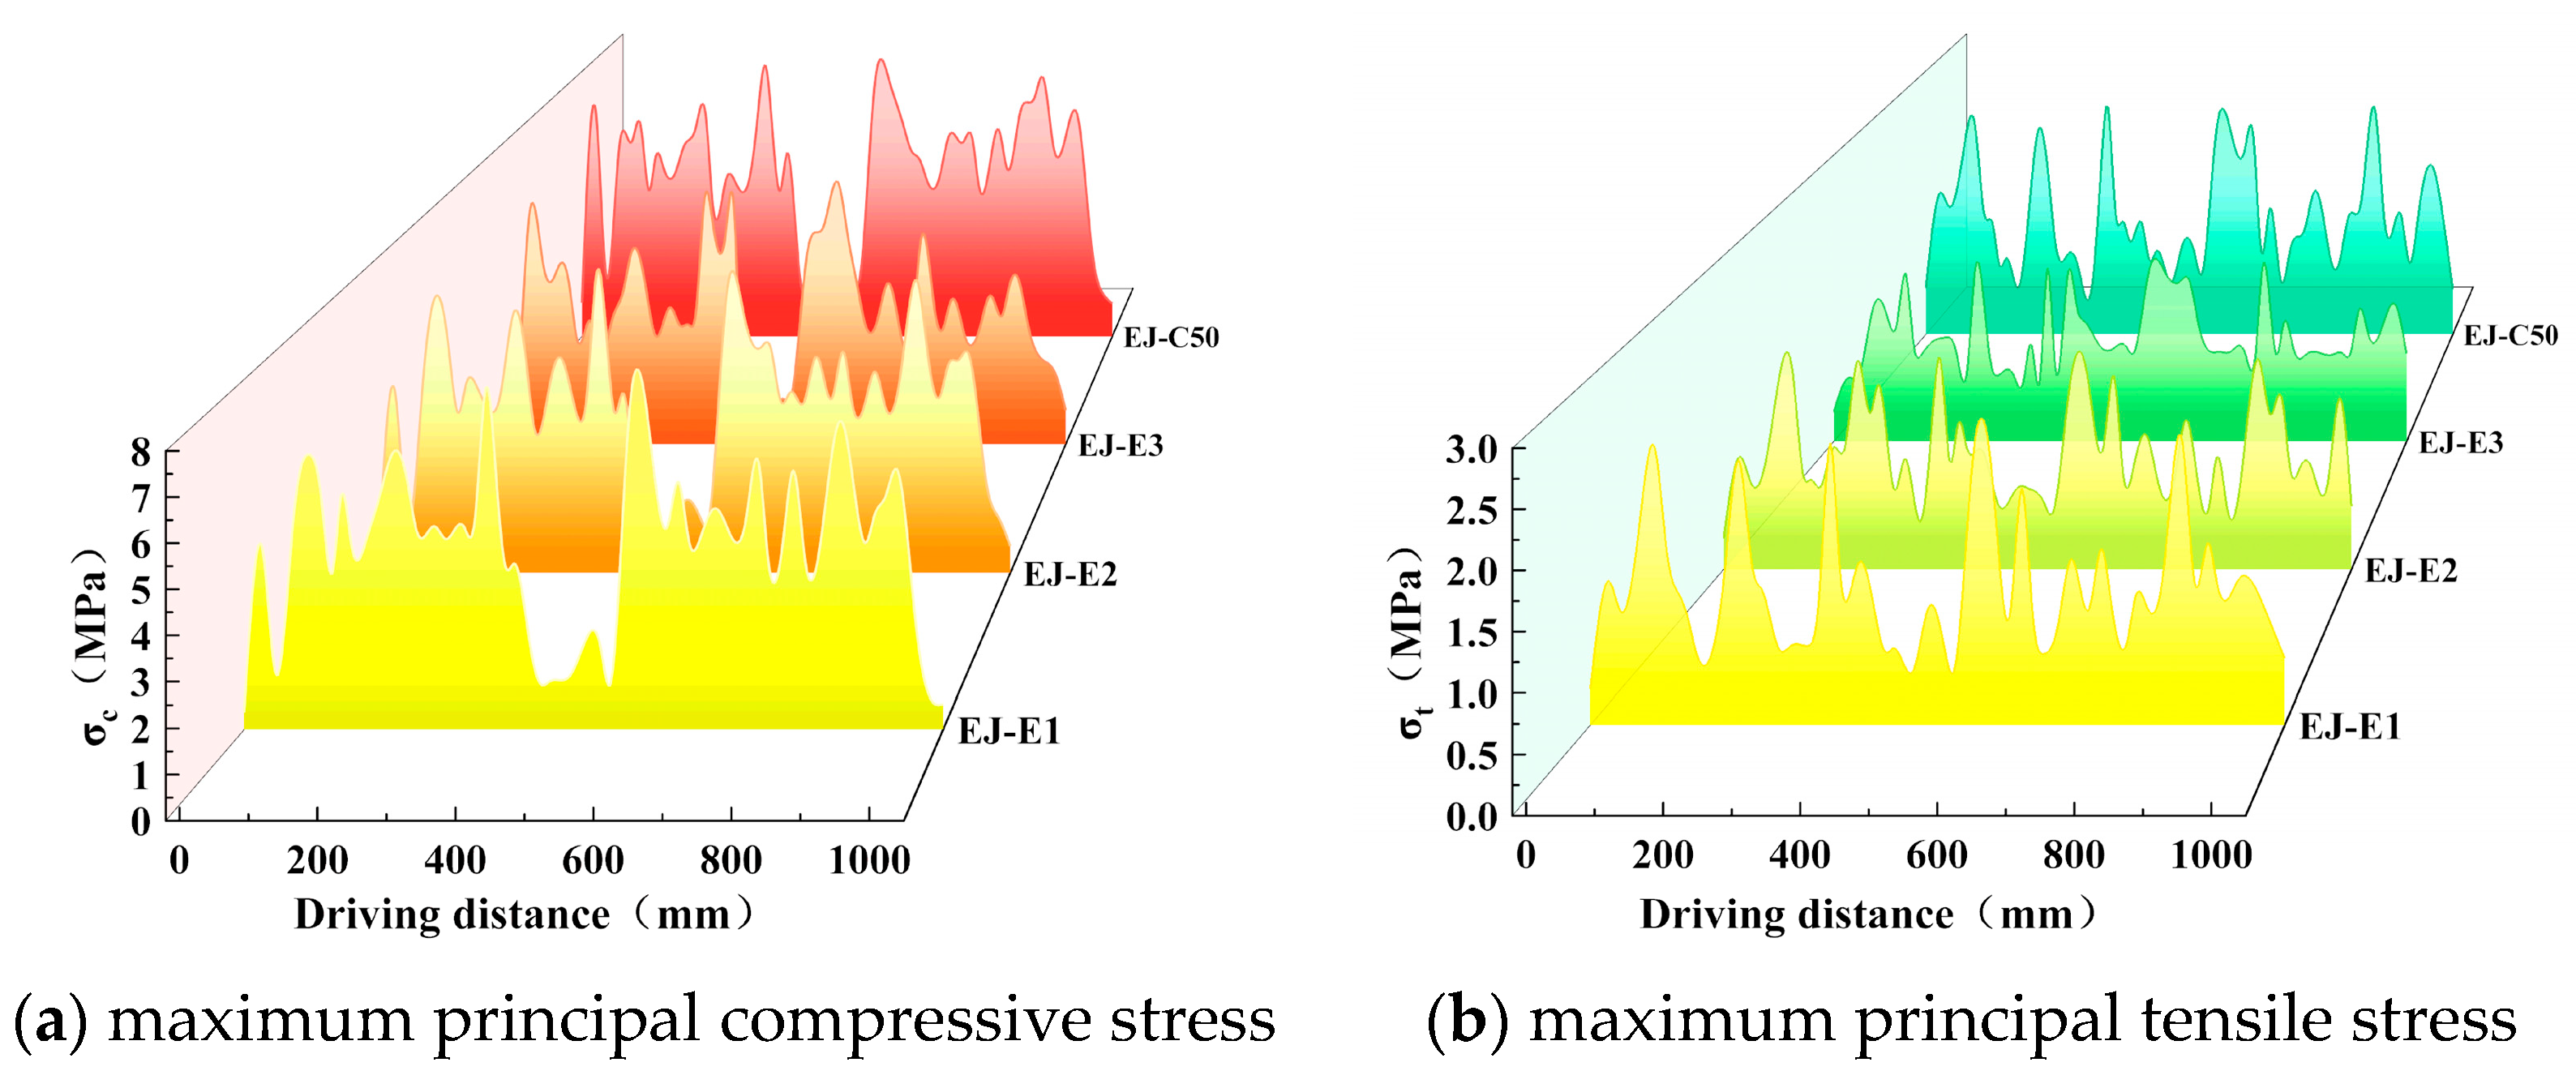
Figure 21 shows the variation in the maximum principal compressive and tensile stresses in the anchorage zone along the driving direction under different material schemes. The stress responses exhibit a clear multi-peak fluctuation pattern. The peak locations are generally consistent among different materials, while the peak magnitudes vary with the anchorage-zone material. This indicates that the spatial distribution of principal stress is mainly governed by the wheel-load position and structural configuration, whereas the material properties primarily affect the stress level.
The main stress peaks occur near the pavement–anchorage-zone interface ((D = 0) − 100 mm and (D = 900) − 1000 mm) and the steel-edge-beam–anchorage-zone interface ((D = 300) − 400 mm and (D = 600) − 700 mm). These regions correspond to abrupt changes in stiffness, geometry, and boundary restraint, which disturb the load-transfer path and produce local stress concentration when the wheel load passes through the expansion joint.
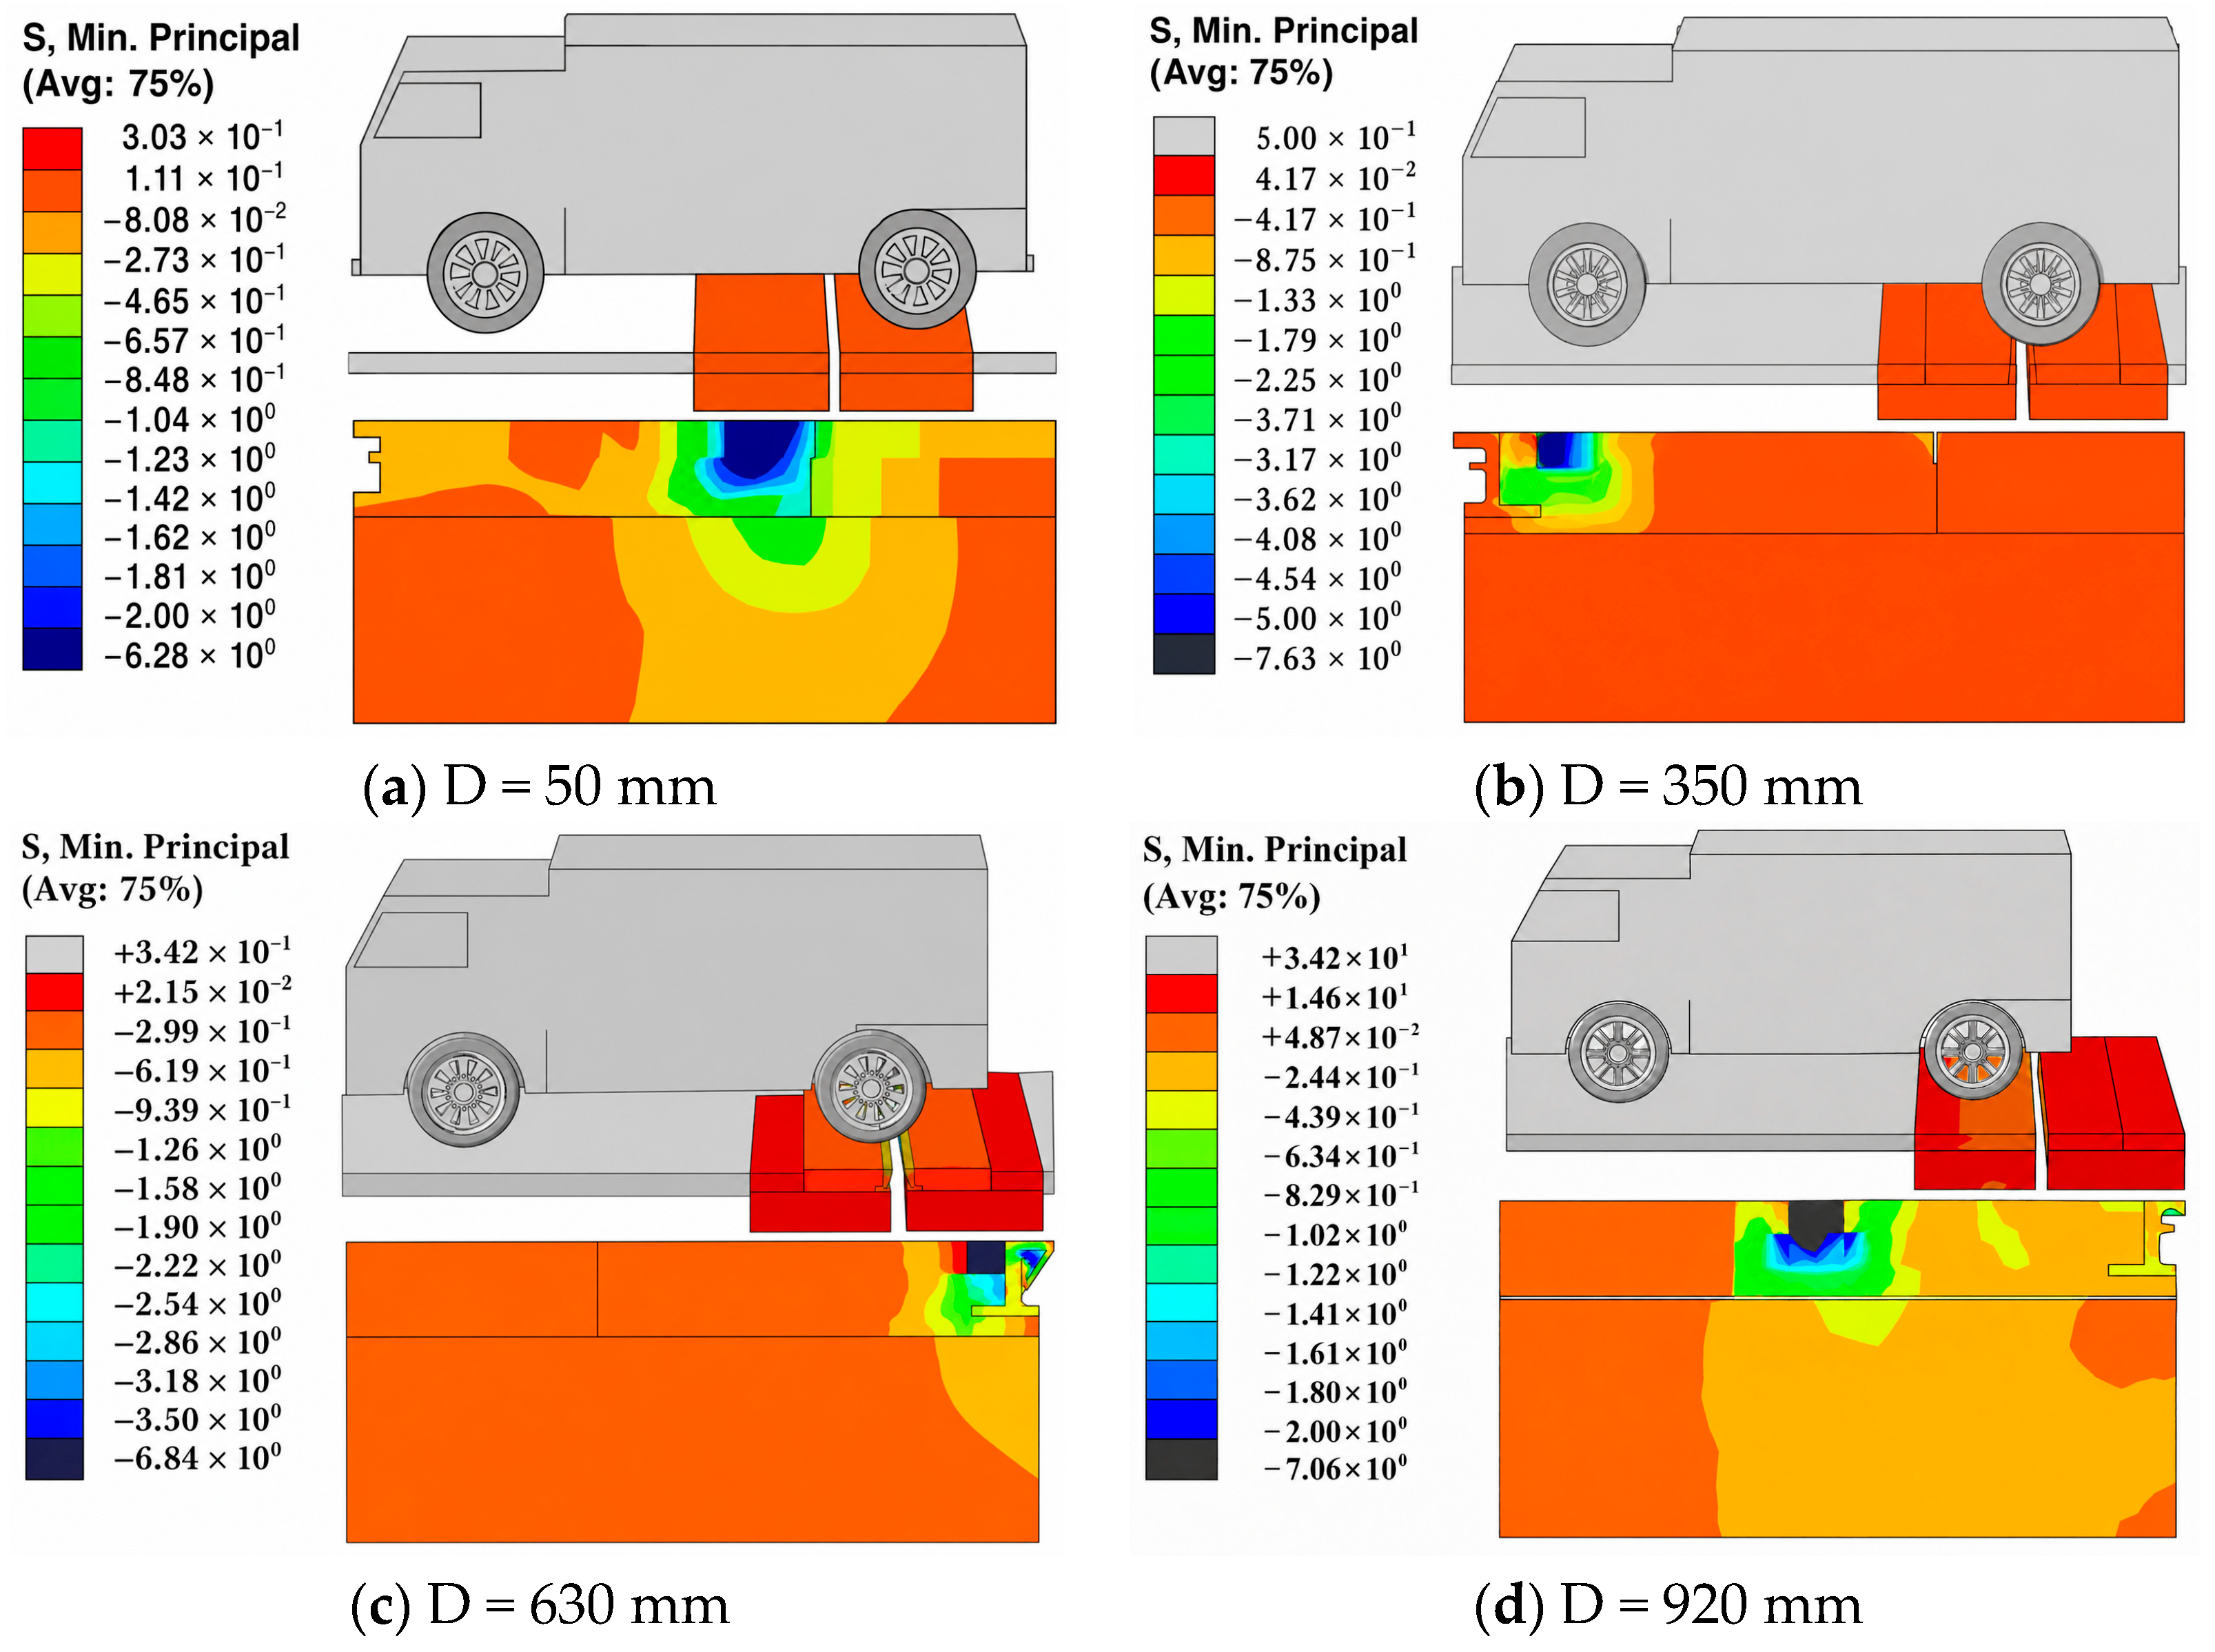
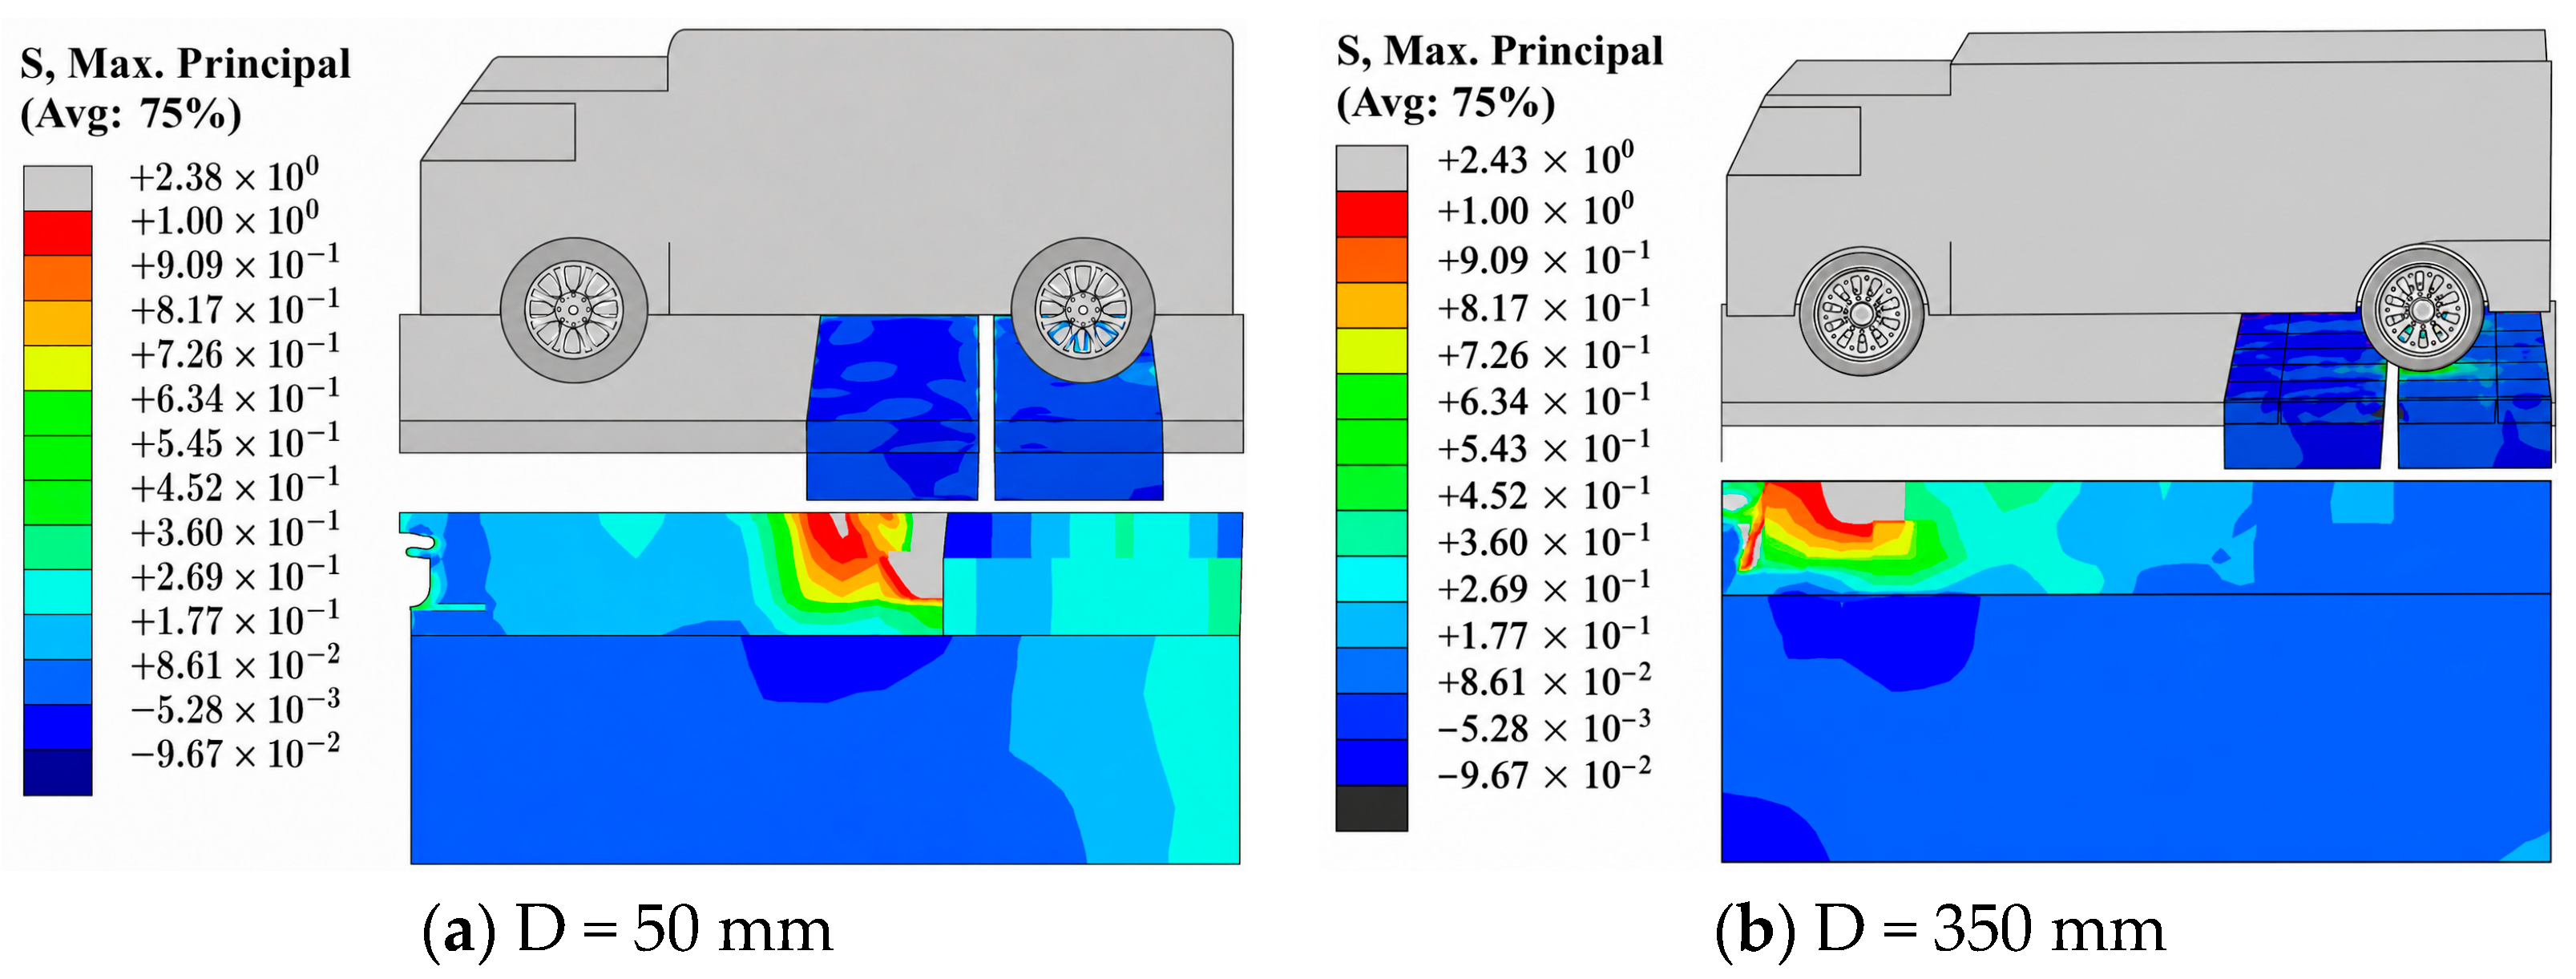
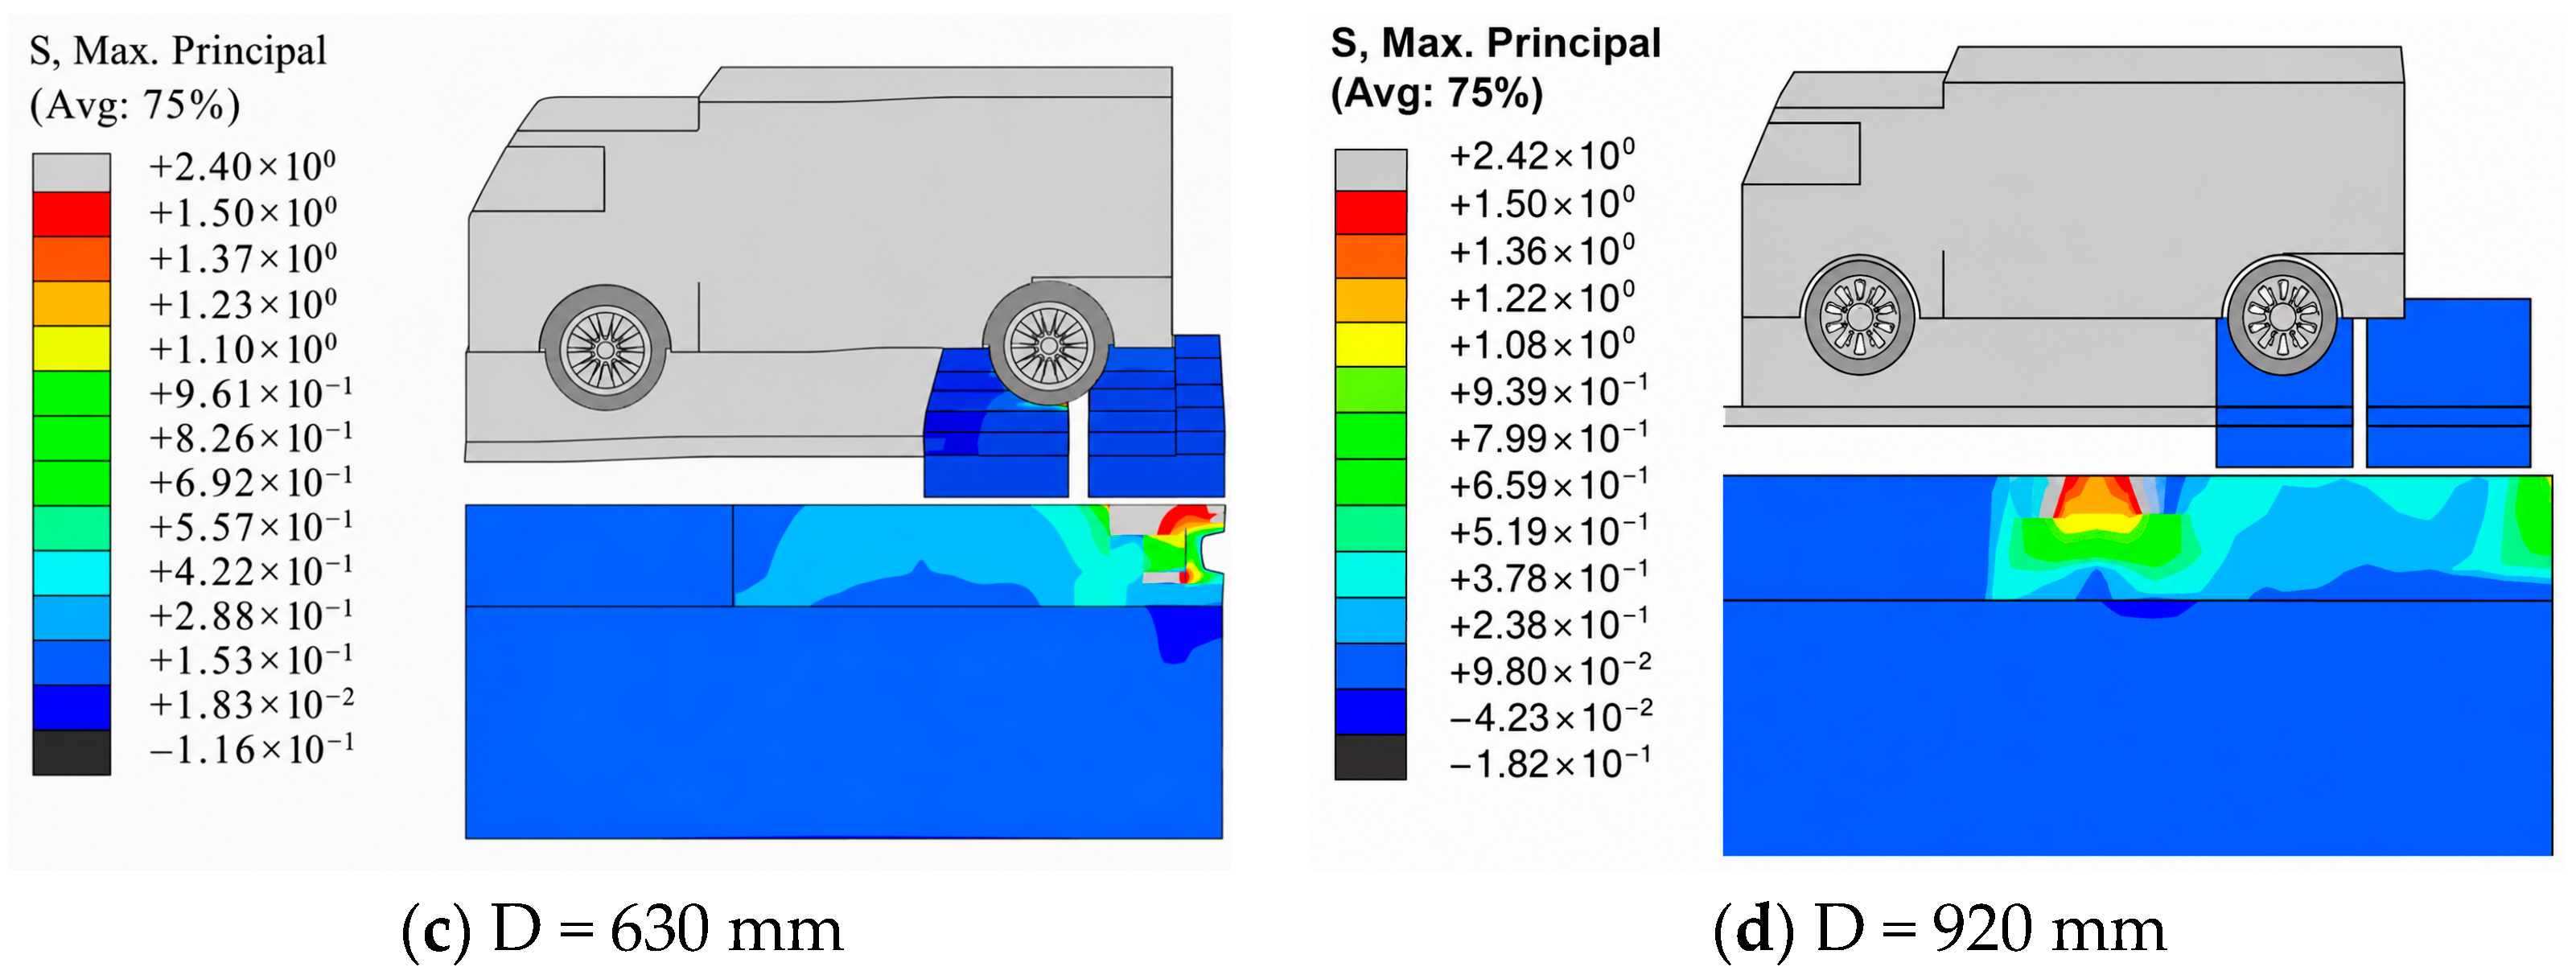
Figure 22 and Figure 23 show the principal compressive and tensile stress contours at representative wheel positions under the EJ-E1 condition. The high-stress regions are mainly located beneath the wheel contact area and near the above-mentioned interfaces, confirming the localized nature of the stress response. Therefore, the pavement–anchorage-zone interface and the steel-edge-beam–anchorage-zone interface are identified as the critical regions for subsequent compressive stress, tensile stress, and fatigue-damage analyses.

5.2. Analysis of Maximum Principal Compressive Stress in the Anchorage Zone

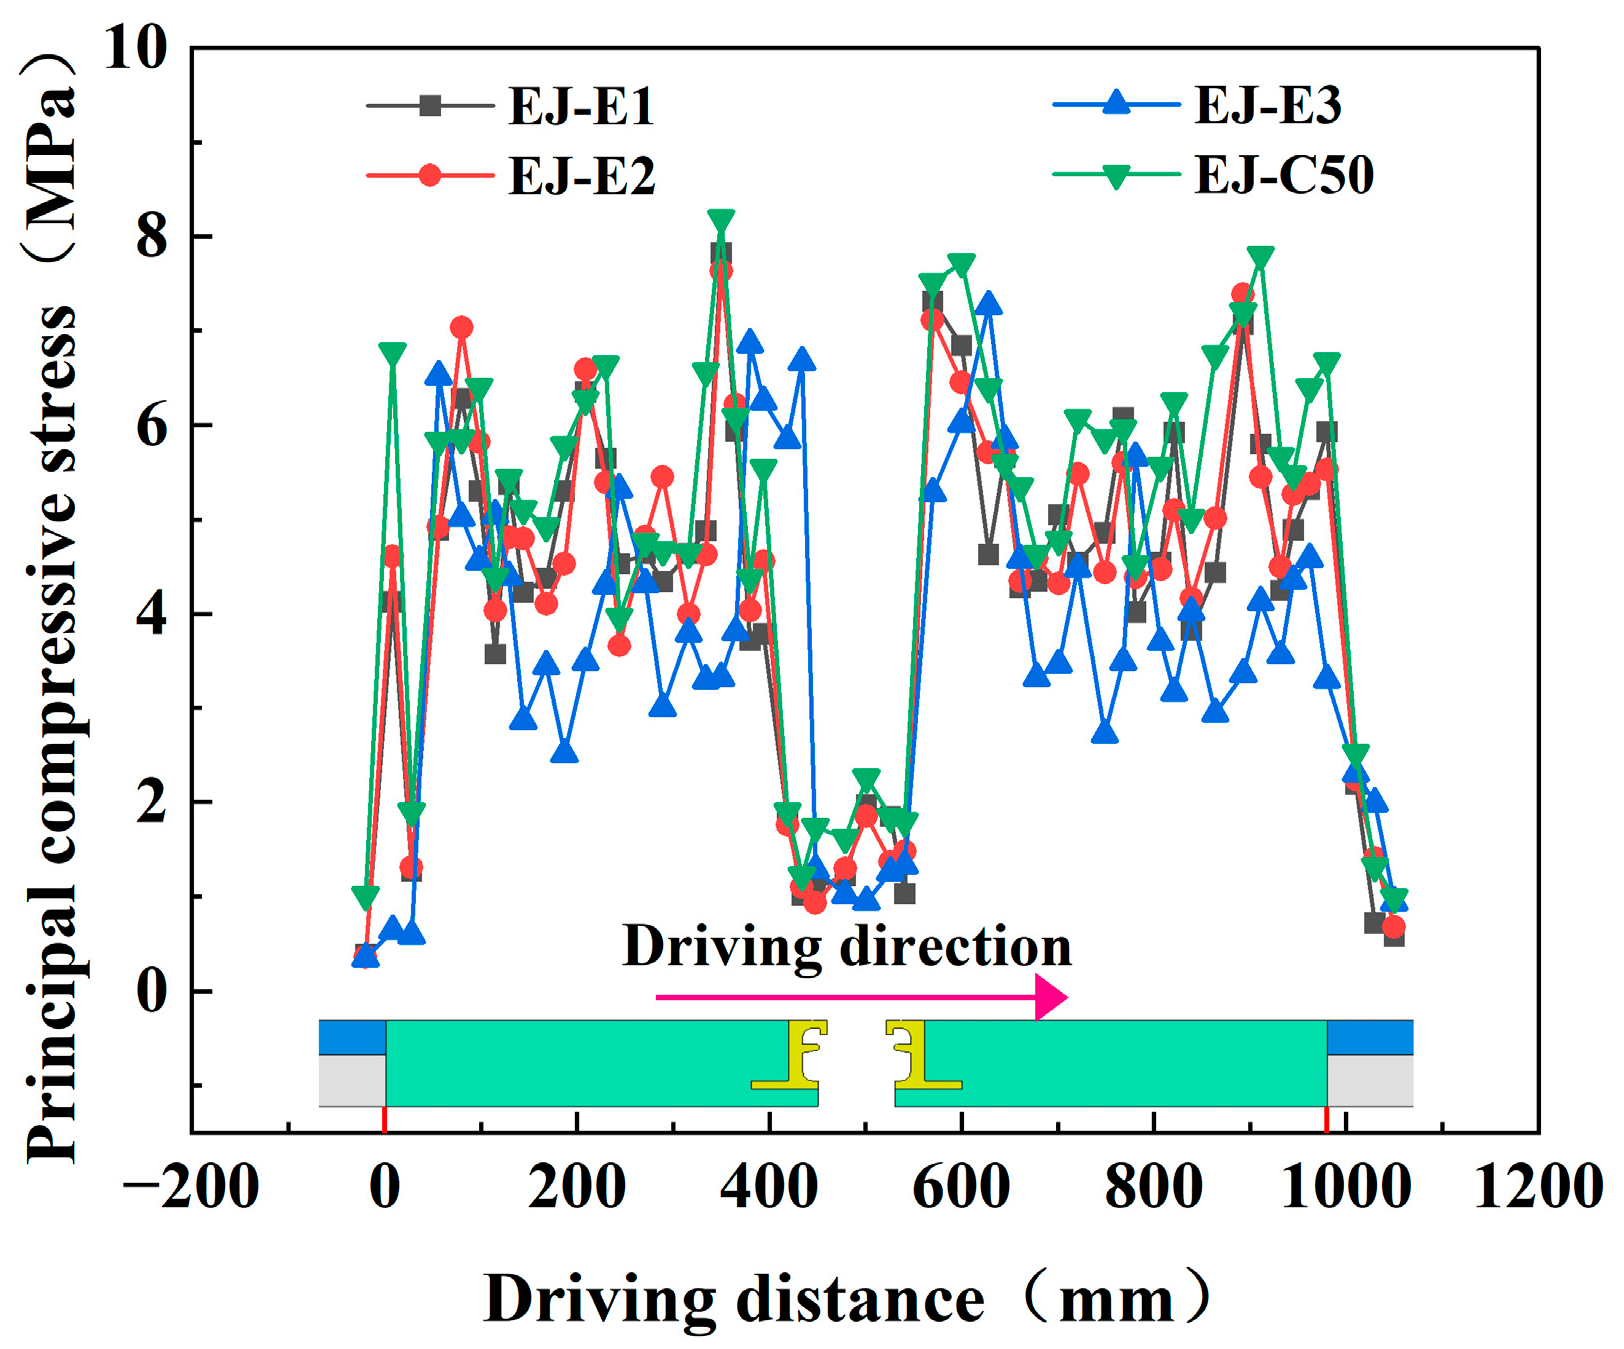
Figure 24 shows the variation in the maximum principal compressive stress in the anchorage zone with travel distance (D) for different materials. The compressive stress response presents a clear multi-peak fluctuation pattern, with stress peaks mainly concentrated near the pavement–anchorage-zone interface and the steel-edge-beam–anchorage-zone interface. This indicates that the compressive stress distribution is strongly affected by the wheel-load position, interface stiffness difference, and local boundary restraint.
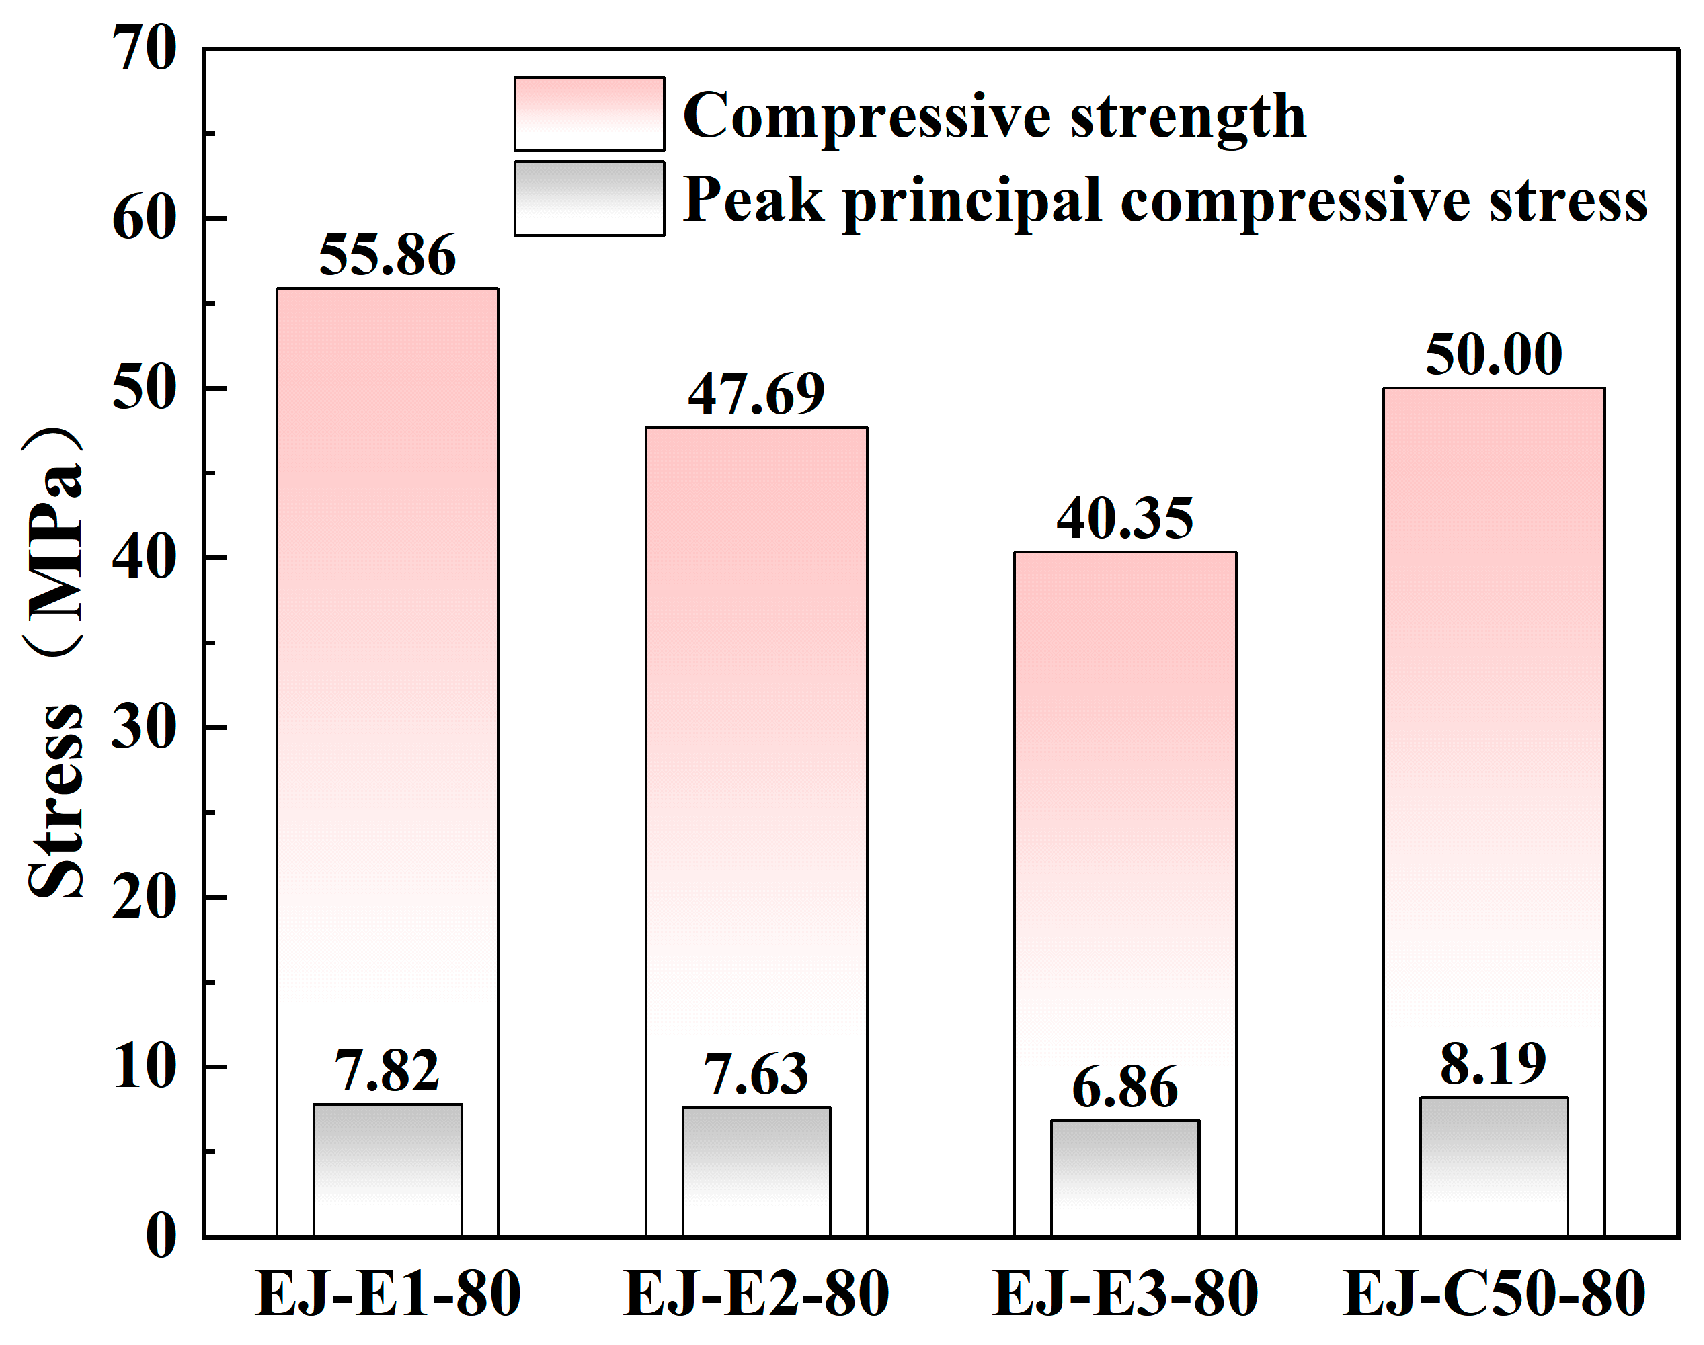
Figure 25 compares the peak values of the maximum principal compressive stress and their ratios to the corresponding compressive strengths. The peak compressive stresses of EJ-E1, EJ-E2, EJ-E3, and EJ-C50 were 7.82 MPa, 7.63 MPa, 6.86 MPa, and 6.78 MPa, respectively, and the corresponding stress-to-strength ratios were 0.14, 0.16, 0.17, and 0.14. Although the peak values varied among different materials, all ratios remained far below 1.0, indicating that all anchorage-zone materials had sufficient compressive capacity reserve under the defined vehicle-loading condition.
Therefore, compressive failure is not the controlling failure mode of the anchorage zone in this study. The subsequent analysis focuses mainly on the principal tensile stress response and tensile fatigue damage, which are more directly related to cracking and long-term deterioration of expansion joint anchorage zones.

5.3. Analysis of Maximum Principal Tensile Stress in the Anchorage Zone

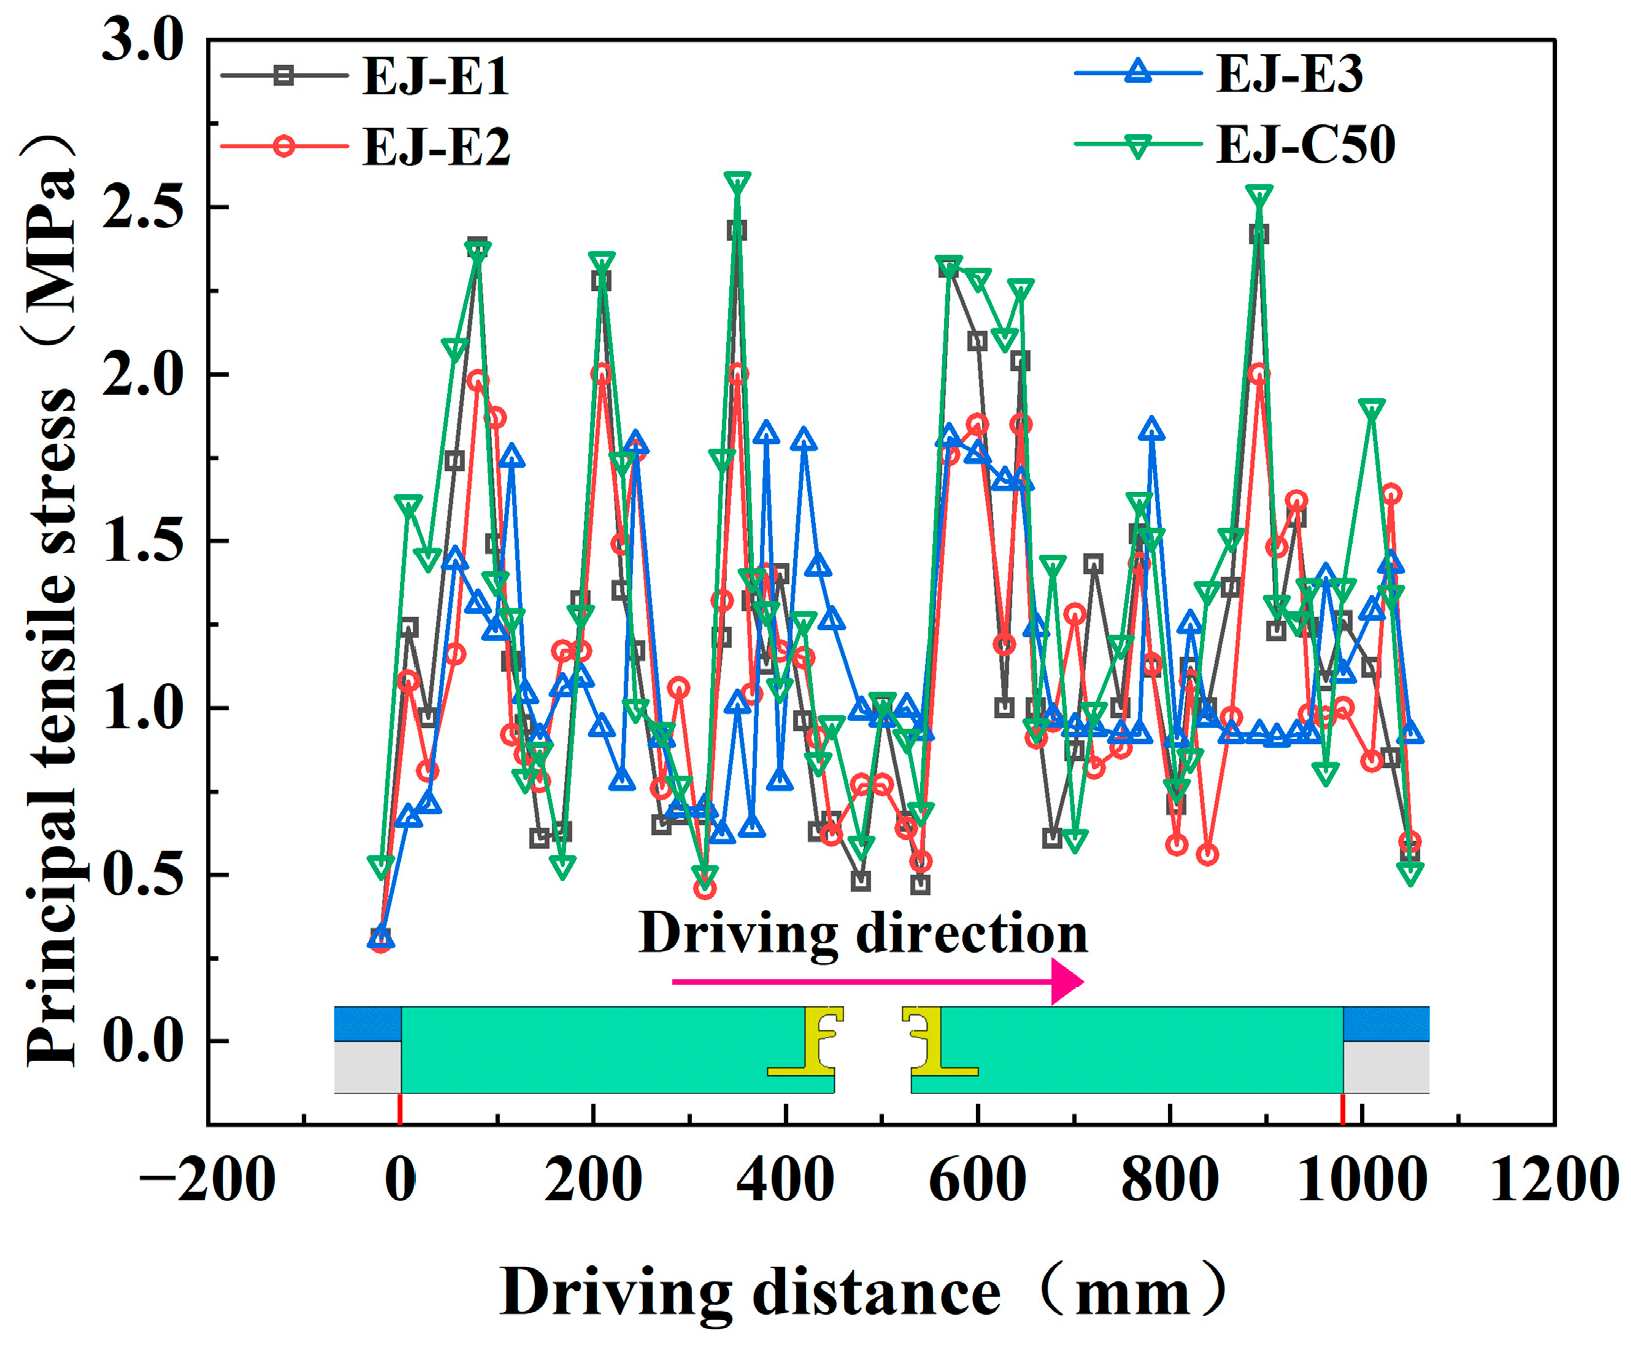
Figure 26 shows the variation in the maximum principal tensile stress in the anchorage zone with travel distance (D) for different materials. Similar to the compressive stress response, the tensile stress also exhibits a multi-peak fluctuation pattern along the driving direction. The stress peaks are mainly concentrated near the pavement–anchorage-zone interface and the steel-edge-beam–anchorage-zone interface, indicating that these regions are the most critical locations for tensile cracking under wheel-impact loading.
Compared with the C50 concrete anchorage zone, the ECC anchorage zones showed lower principal tensile stress peaks and smoother stress fluctuations. This indicates that replacing ordinary concrete with ECC can improve tensile stress redistribution in the anchorage zone and reduce local tensile stress concentration. Among the ECC schemes, EJ-E3 exhibited the lowest peak tensile stress because of its lower elastic modulus and stronger deformation adaptability. However, the tensile safety margin should also consider the tensile strength of the material.
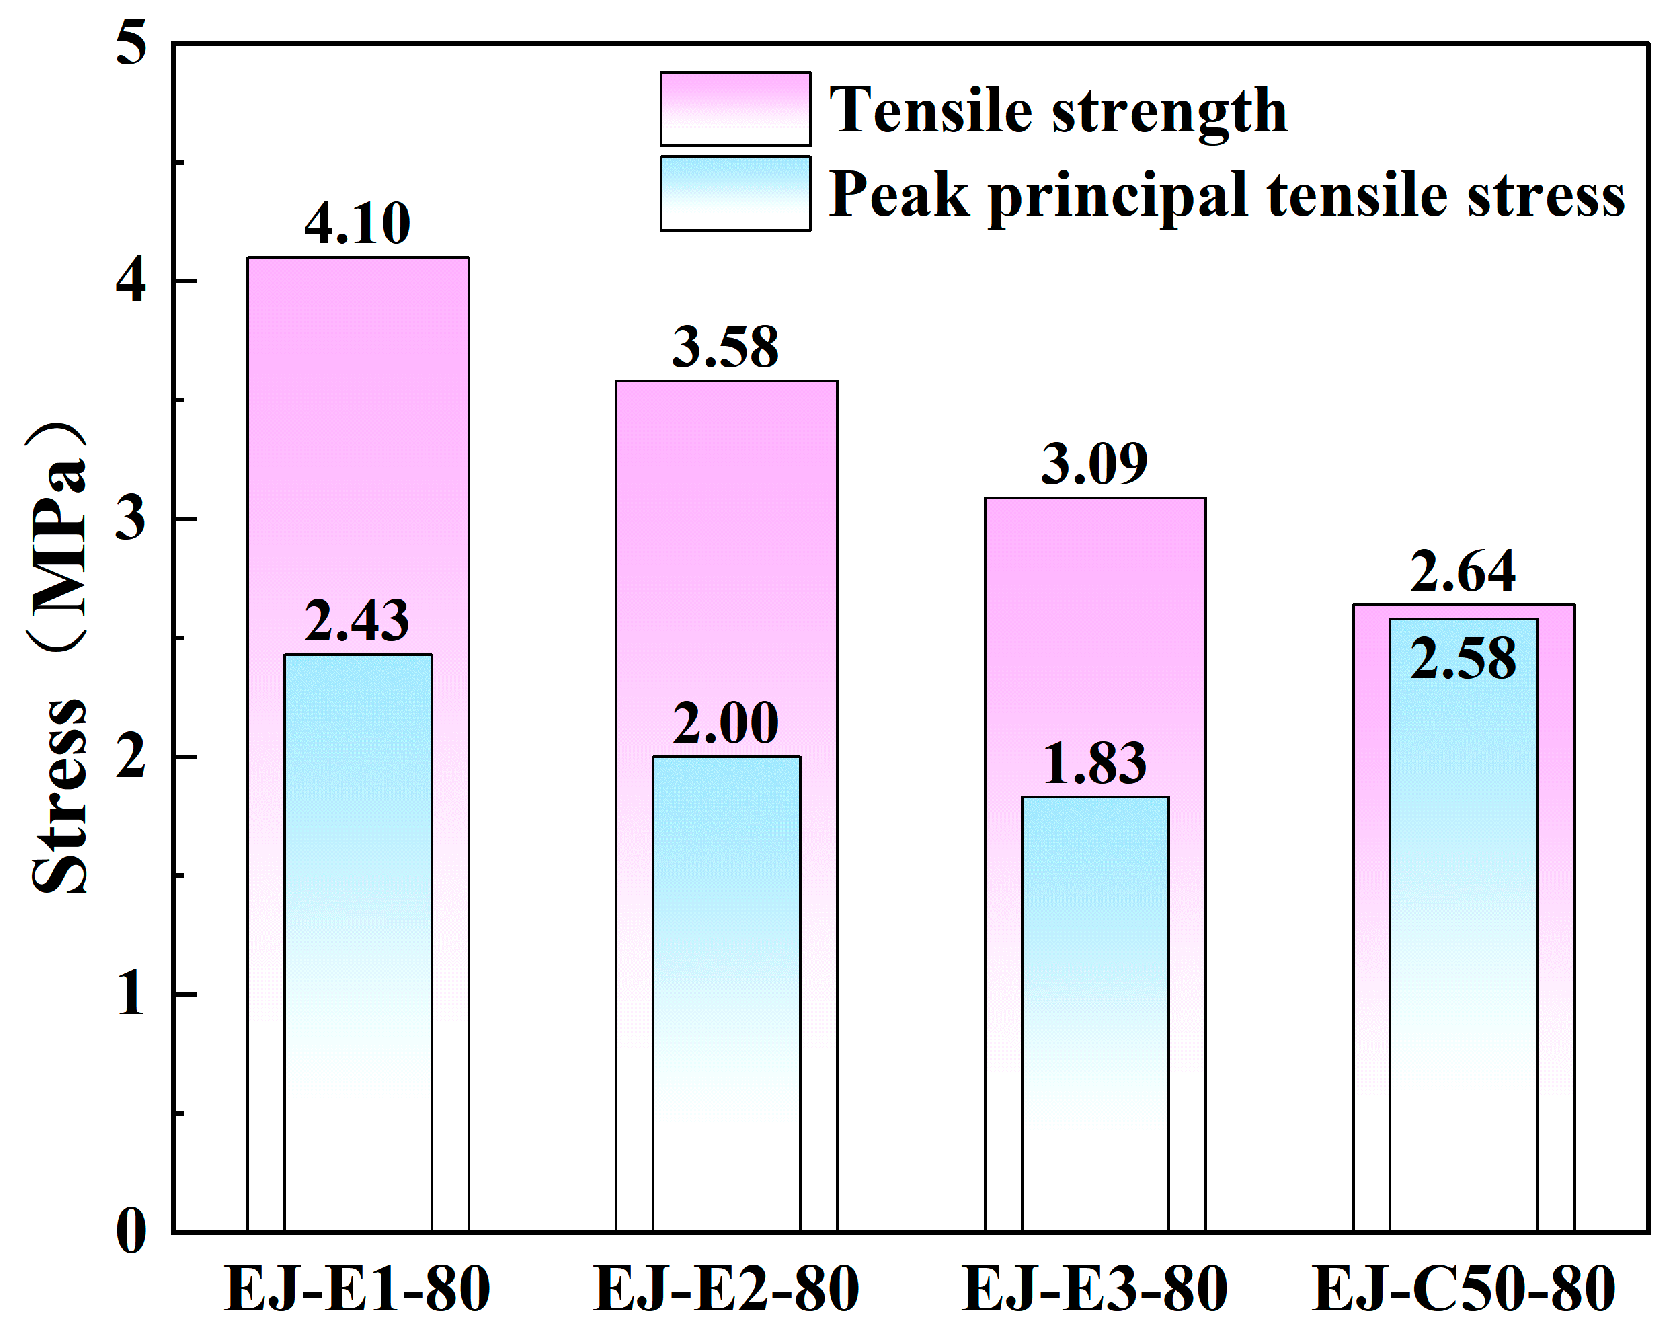
Figure 27 compares the peak principal tensile stress and its ratio to the corresponding tensile strength. The peak tensile stresses of EJ-E1, EJ-E2, EJ-E3, and EJ-C50 were 2.43 MPa, 2.00 MPa, 1.83 MPa, and 2.58 MPa, respectively. The corresponding stress-to-strength ratios were 0.59, 0.56, 0.59, and 0.98. The ratio for EJ-C50 was close to 1.0, indicating that the C50 anchorage zone was close to its tensile strength limit under the defined vehicle-loading condition. In contrast, the stress-to-strength ratios of all ECC anchorage zones remained below 0.60, showing a larger tensile safety margin. These results indicate that ECC can effectively reduce tensile stress concentration and improve the cracking resistance of expansion joint anchorage zones.

5.4. Estimated Fatigue Damage Life of Anchorage Zones with Different Materials

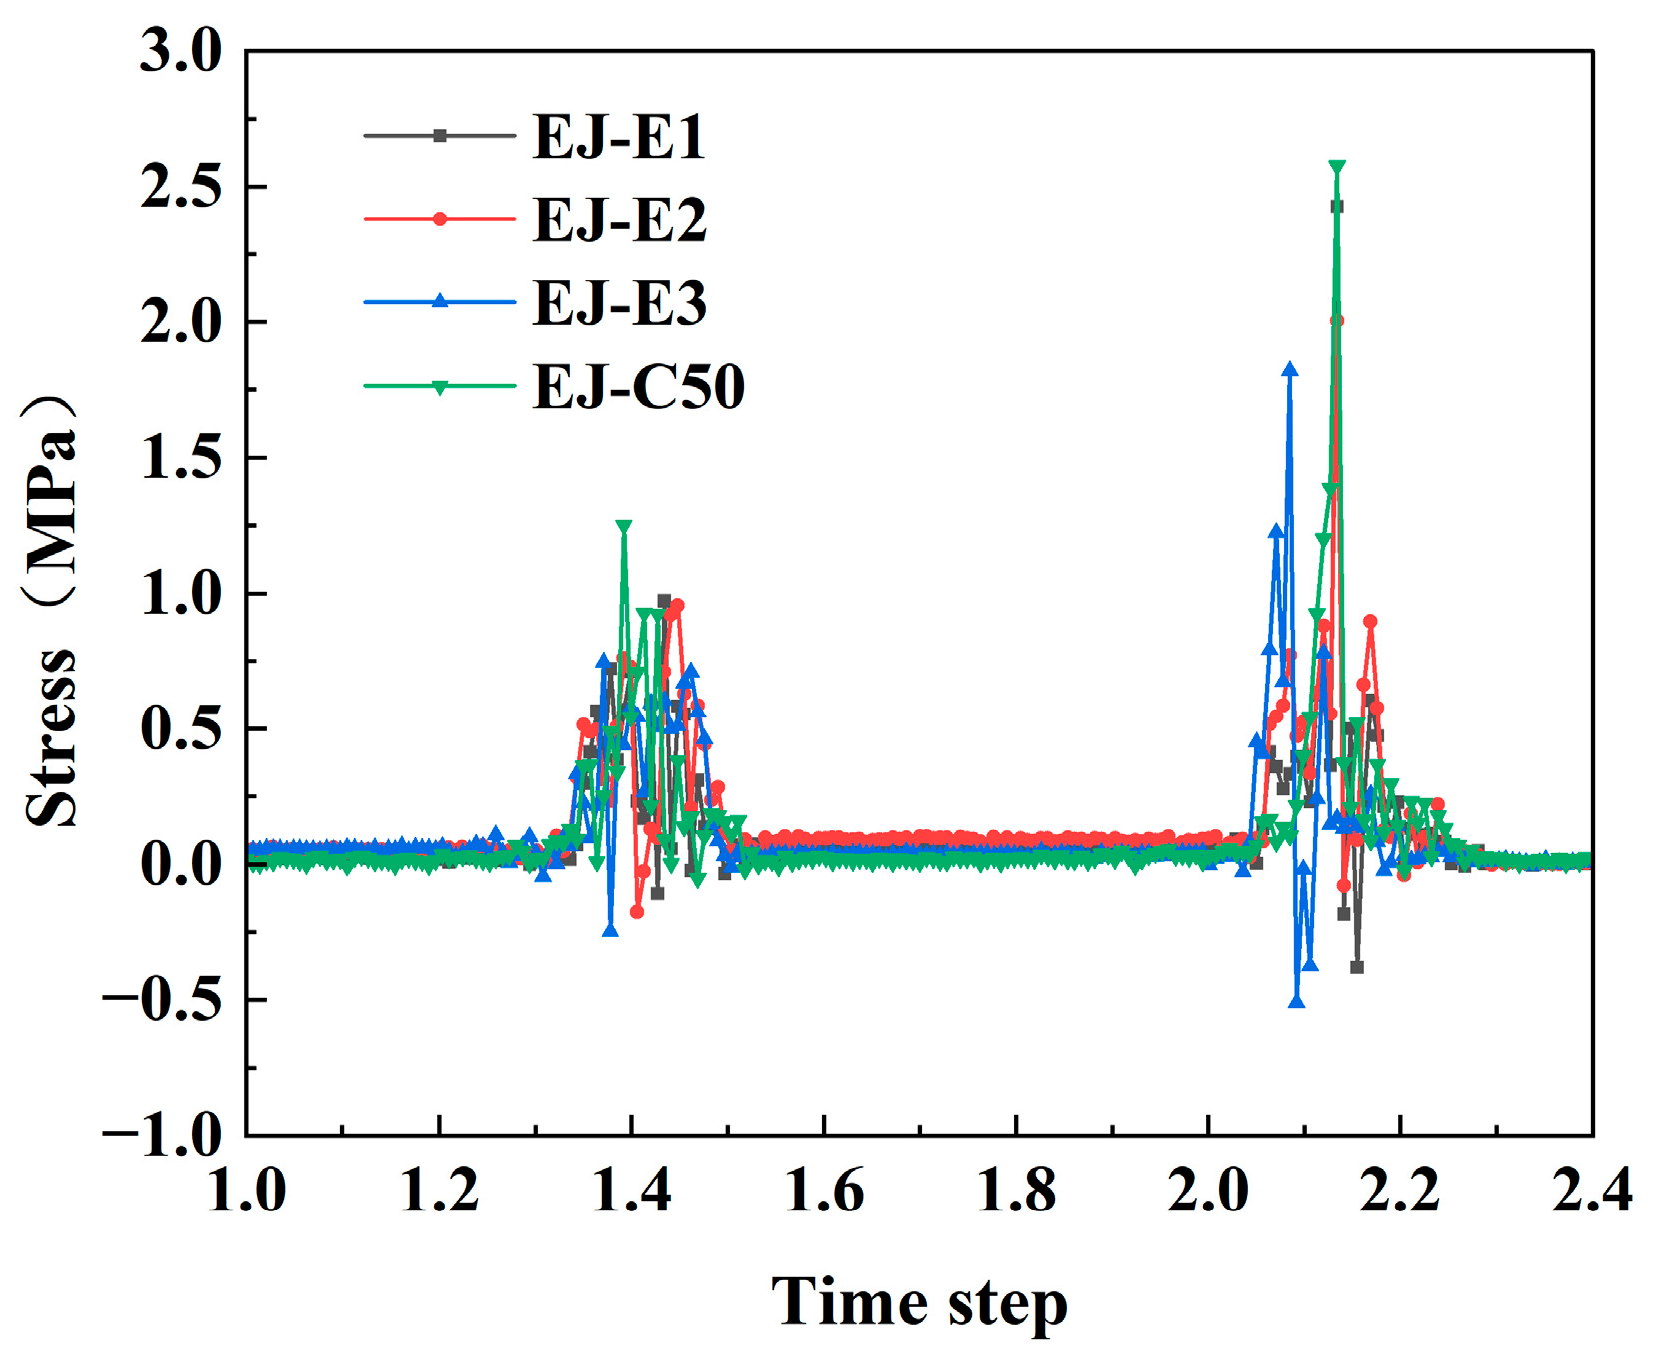
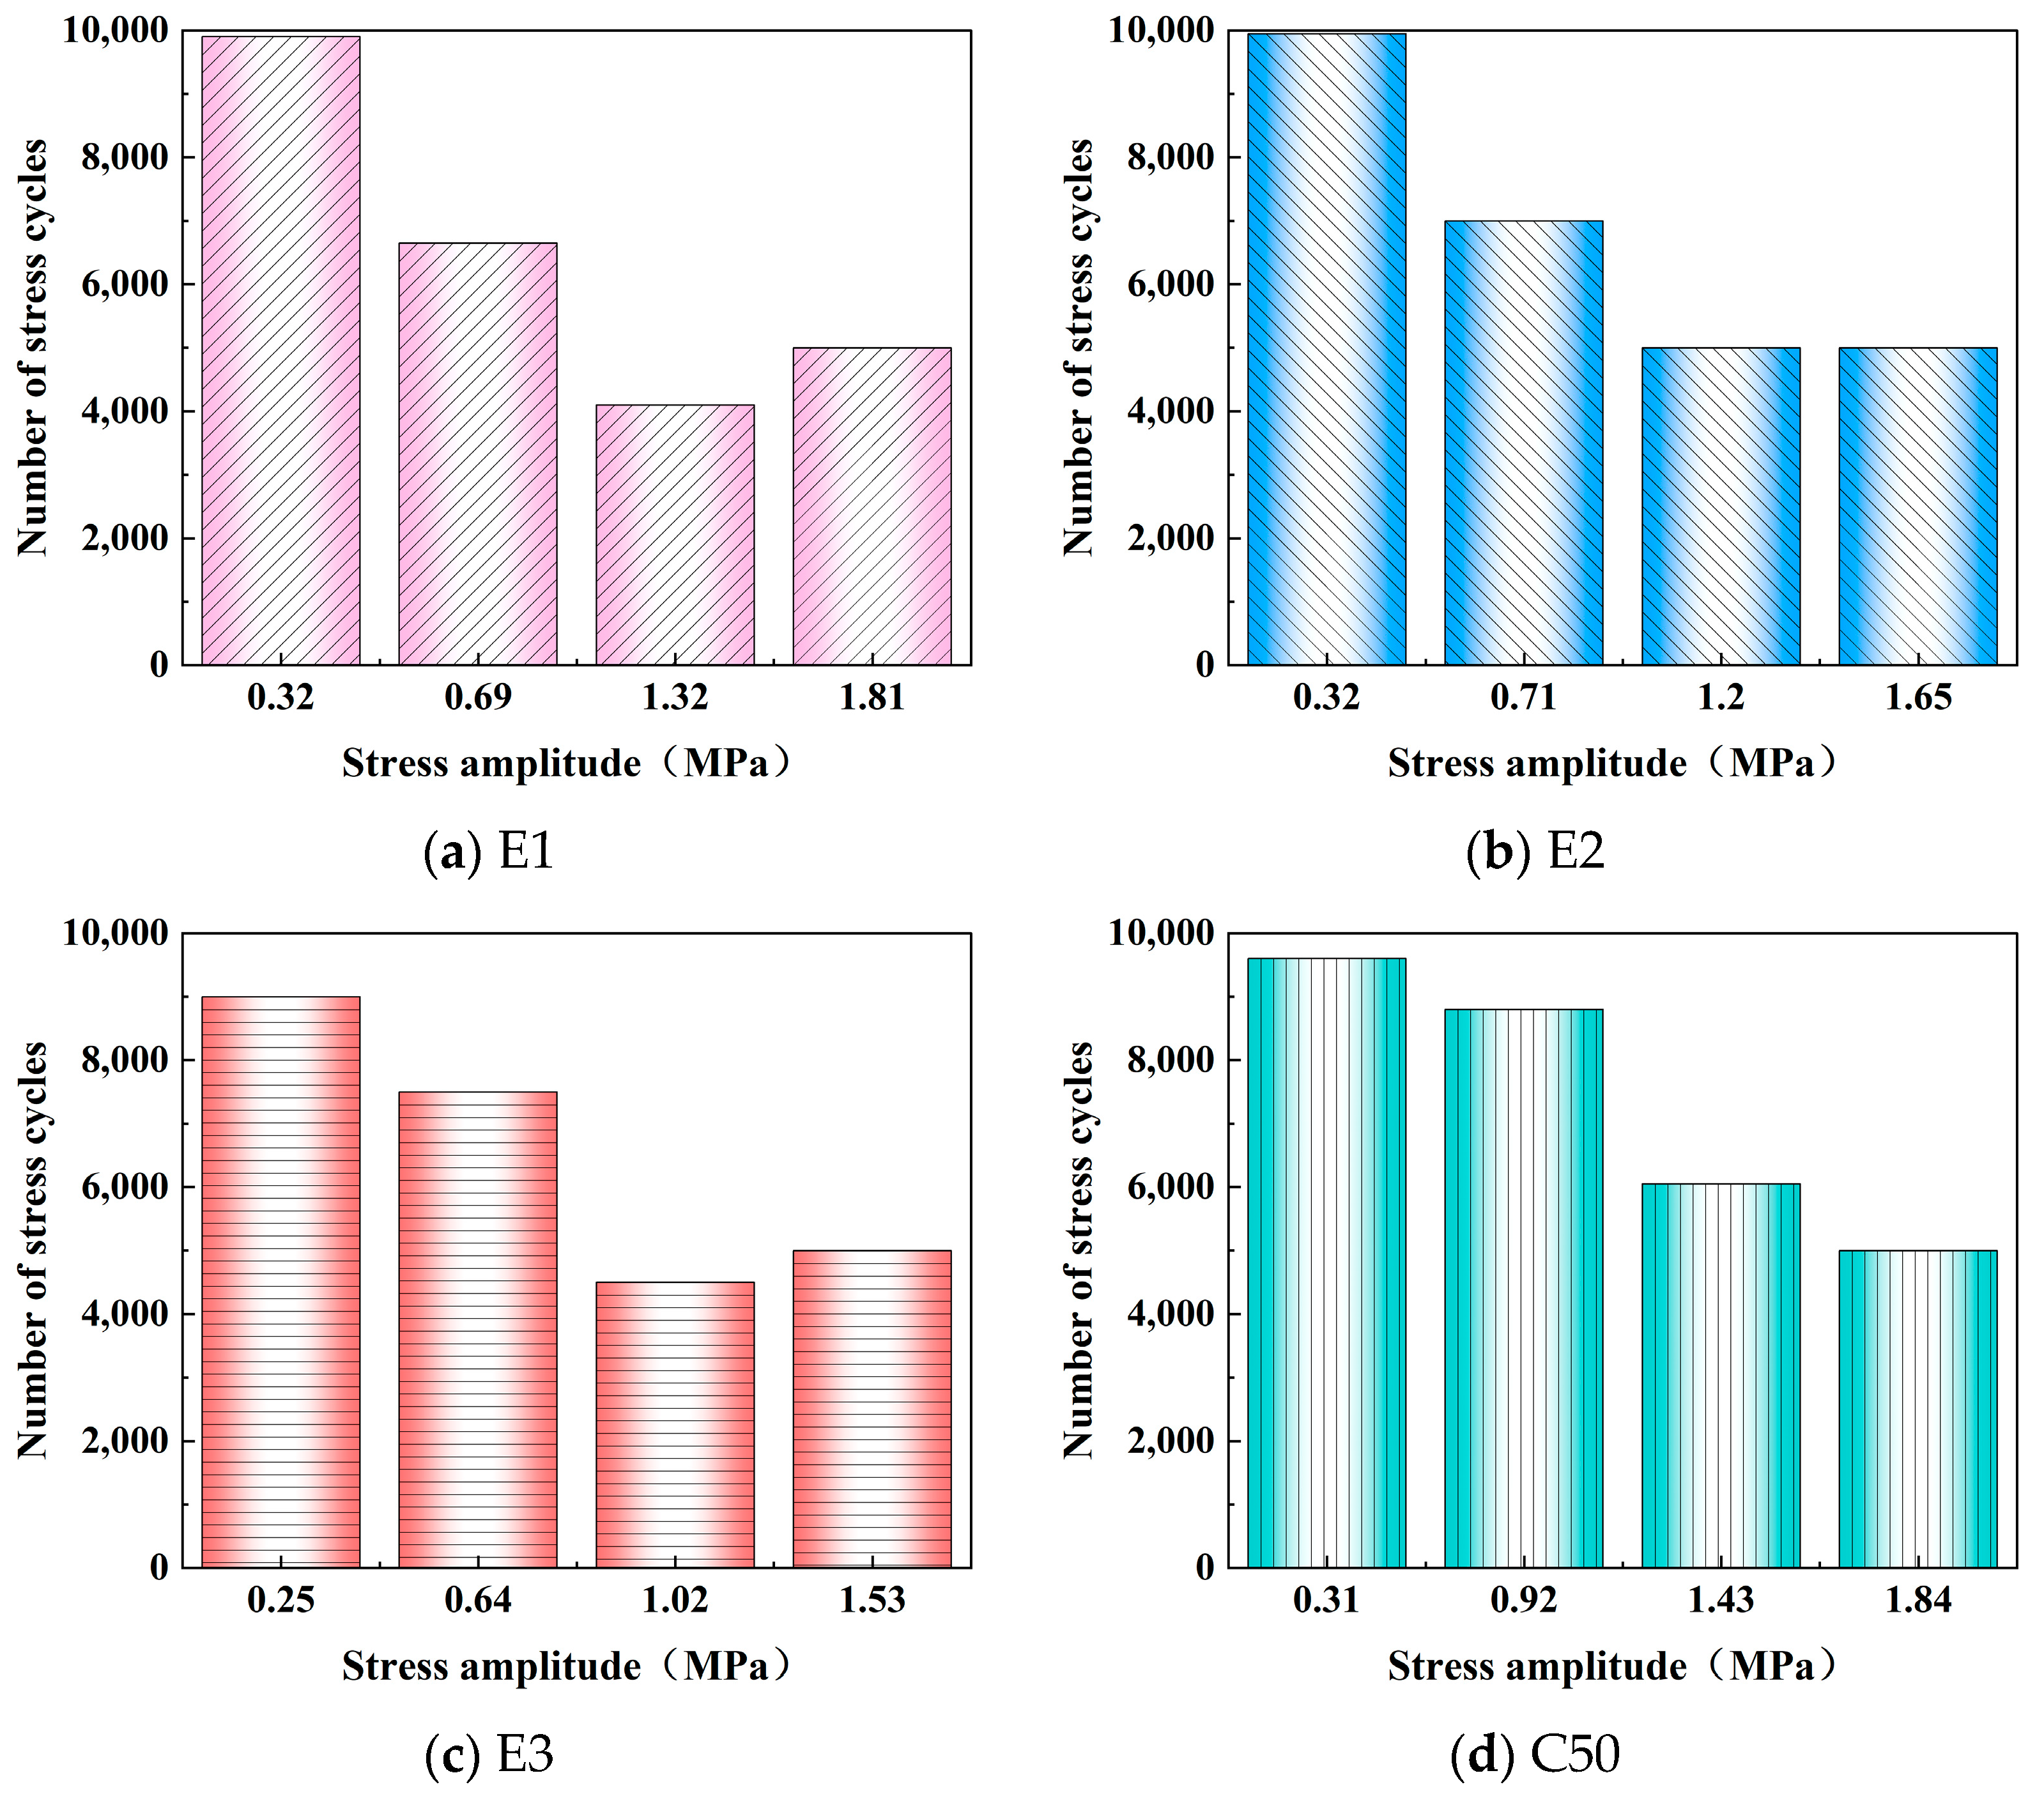
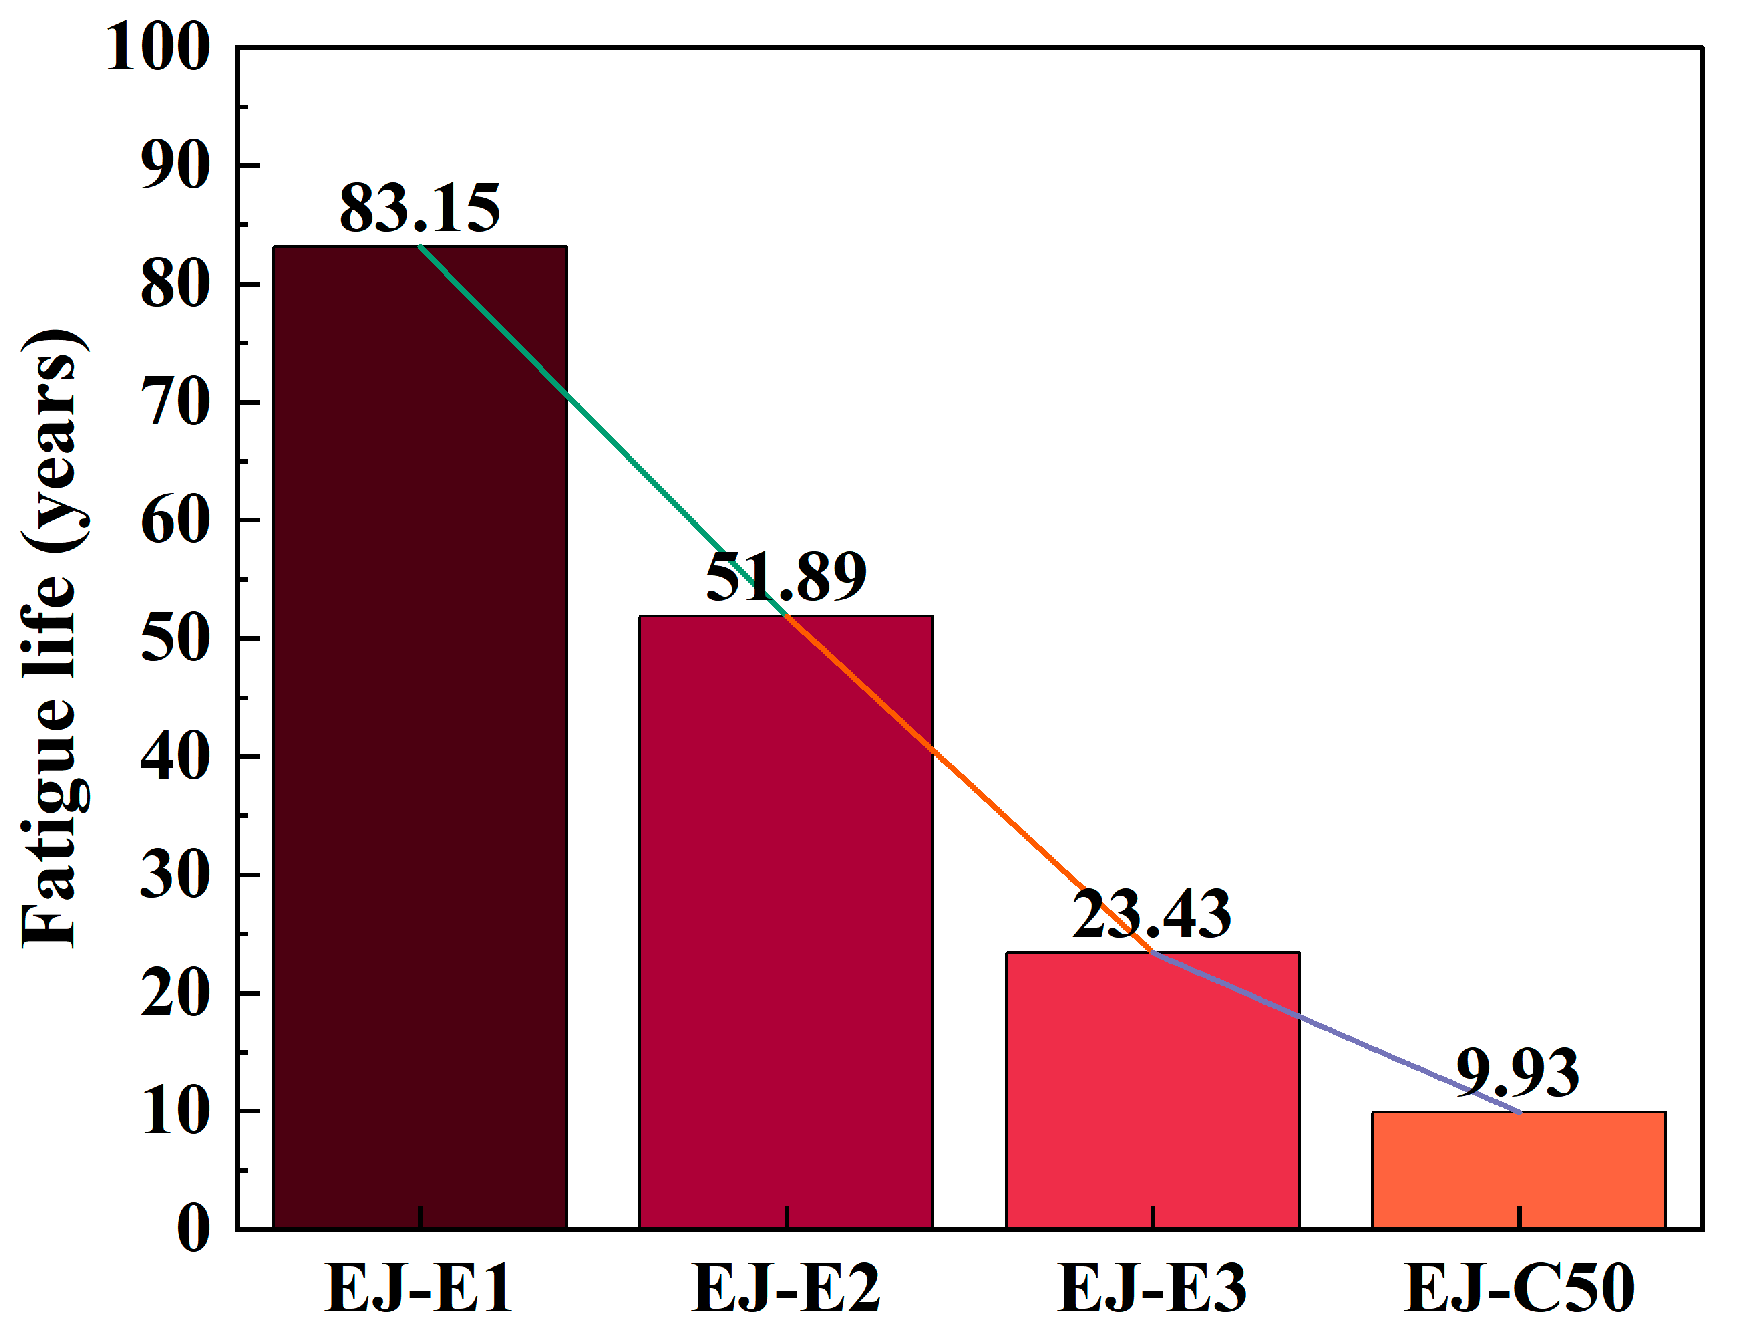
Based on the tensile stress analysis, the critical tensile stress histories in the anchorage zone were extracted from the finite element model, as shown in Figure 28. The stress cycles were then counted using the rainflow method to obtain the fatigue stress spectra of different materials, as shown in Figure 29. Based on the fatigue-life calculation procedure described in Section 3, the fatigue damage and estimated fatigue lives were obtained, as listed in Table 10 and Figure 30.
The estimated fatigue life of the C50 concrete anchorage zone was 9.93 years. In comparison, the estimated fatigue lives of EJ-E3, EJ-E2, and EJ-E1 were 23.43, 51.89, and 83.15 years, respectively. This indicates that all ECC anchorage zones showed lower fatigue damage accumulation than C50 concrete under the same vehicle-loading condition and fatigue evaluation framework. Among them, EJ-E1 exhibited the longest estimated fatigue life, mainly because it maintained the highest tensile strength reserve and the lowest fatigue stress level.
The fatigue damage results further explain this difference. The maximum fatigue damage increment of EJ-C50 reached 0.101, whereas those of EJ-E1, EJ-E2, and EJ-E3 were 0.012, 0.018, and 0.042, respectively. The faster damage accumulation of C50 concrete is related to its low tensile strength reserve and high tensile stress-to-strength ratio. In contrast, ECC can maintain tensile load-carrying capacity after first cracking through strain-hardening and multiple fine cracking, which helps redistribute stress at the pavement–anchorage-zone and steel-edge-beam–anchorage-zone interfaces and delays localized crack development.
The comparison among the ECC mixtures shows that fatigue resistance is not governed by tensile ductility alone. Although EJ-E3 had the largest tensile deformation capacity and the lowest tensile stress peak, its lower tensile strength resulted in a higher fatigue stress level and a shorter estimated fatigue life than EJ-E1 and EJ-E2. Therefore, the fatigue performance of ECC anchorage zones depends on the combined effects of tensile strength reserve, tensile ductility, elastic modulus, and dynamic stress response. Under the defined loading scenario, E1 provided the most favorable balance among these factors.
It should be emphasized that the fatigue lives reported in this section are estimated values under the defined vehicle-loading scenario. They are mainly used to compare the relative fatigue resistance of different anchorage-zone materials within the same stress-extraction, rainflow-counting, and Miner-based damage framework.

5.5. Fatigue Damage Comparison of Anchorage Zones with Different Materials

To further evaluate the fatigue-resistance advantage of ECC anchorage zones, fast-hardening polymer cement composite (PCC), polyurethane concrete (PUC), and steel fiber-reinforced concrete (SFC) were introduced for comparison based on recent studies [5,23,46]. The material parameters used in the finite element analysis are listed in Table 11.
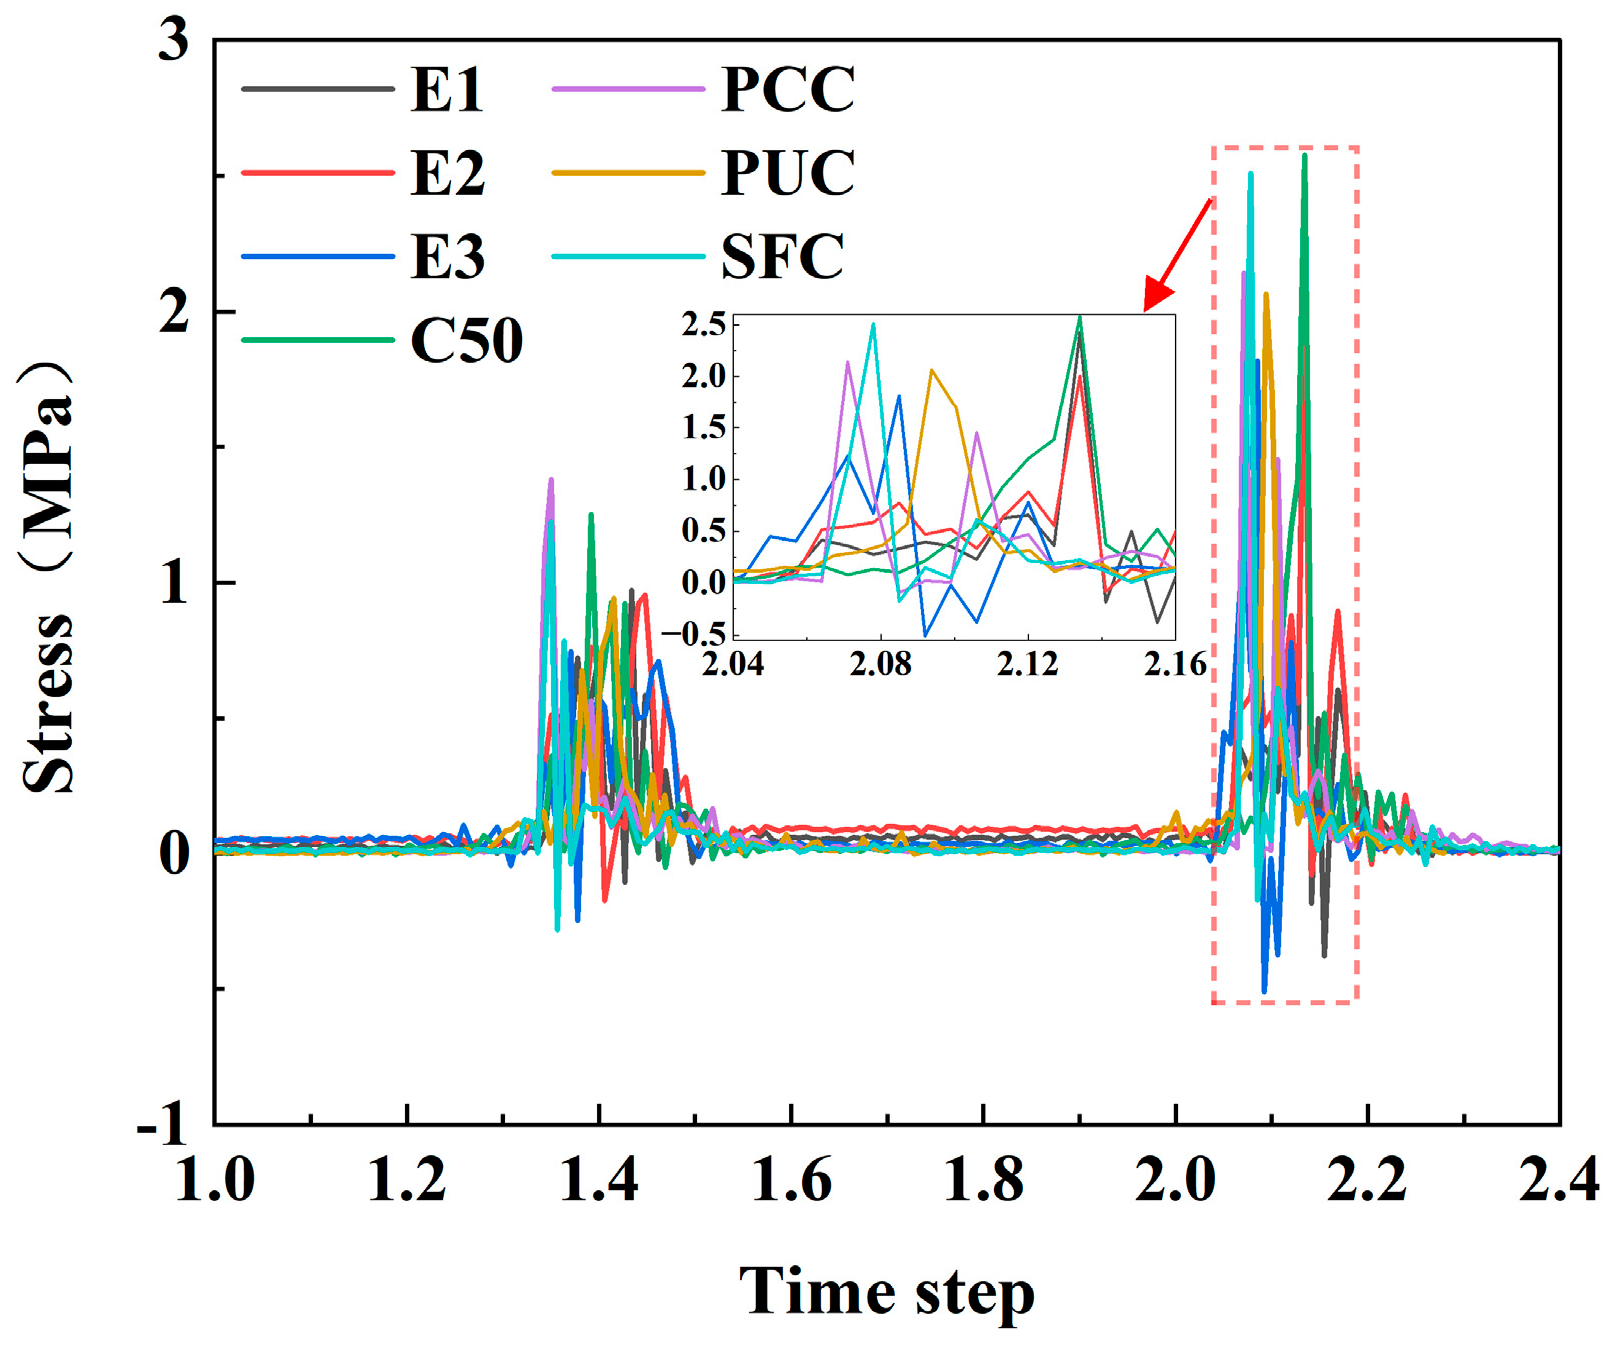
Figure 31 shows the maximum principal tensile stress histories of anchorage zones made with different materials. The C50 and SFC anchorage zones exhibited relatively high tensile stress peaks, indicating stronger tensile stress concentration under wheel-impact loading. In comparison, the ECC, PCC, and PUC anchorage zones showed lower tensile stress responses. Among the polymer-modified materials, PUC produced a slightly lower tensile stress response than PCC, which is consistent with previous findings that PUC can reduce stress response through its lower modulus and higher deformation capacity.
Table 12 compares the calculated fatigue damage values of different anchorage materials. C50 showed the highest fatigue damage, followed by SFC, indicating that ordinary concrete and steel-fiber-reinforced concrete had relatively limited fatigue-damage control under the present loading condition. Among the ECC mixtures, E1 exhibited the lowest fatigue damage of all compared materials, while E2 showed a damage level close to PUC and lower than PCC and SFC. Although E3 reduced fatigue damage compared with C50 and SFC, its lower tensile strength resulted in higher fatigue damage than E1 and E2.
These results indicate that the fatigue advantage of ECC depends on the balance between tensile strength reserve and deformation capacity, and that E1 and E2 provide more favorable fatigue-damage control for expansion joint anchorage zones. This comparison also shows that the fatigue performance of an anchorage material cannot be evaluated only from its material type or deformation capacity. Instead, it should be assessed by combining its tensile strength reserve, deformation capacity, elastic modulus, and vehicle-induced tensile stress response. Compared with previous studies that mainly focused on modified anchorage materials, polymer-based repair materials, or the dynamic response of expansion joint systems, the present study further connects the measured strength–ductility characteristics of ECC with local tensile stress histories and cumulative fatigue damage. This provides a more direct basis for evaluating strain-hardening cementitious composites as fatigue-resistant anchorage materials for bridge expansion joints.

5.6. Engineering Application of ECC in Expansion Joint Anchorage Zones

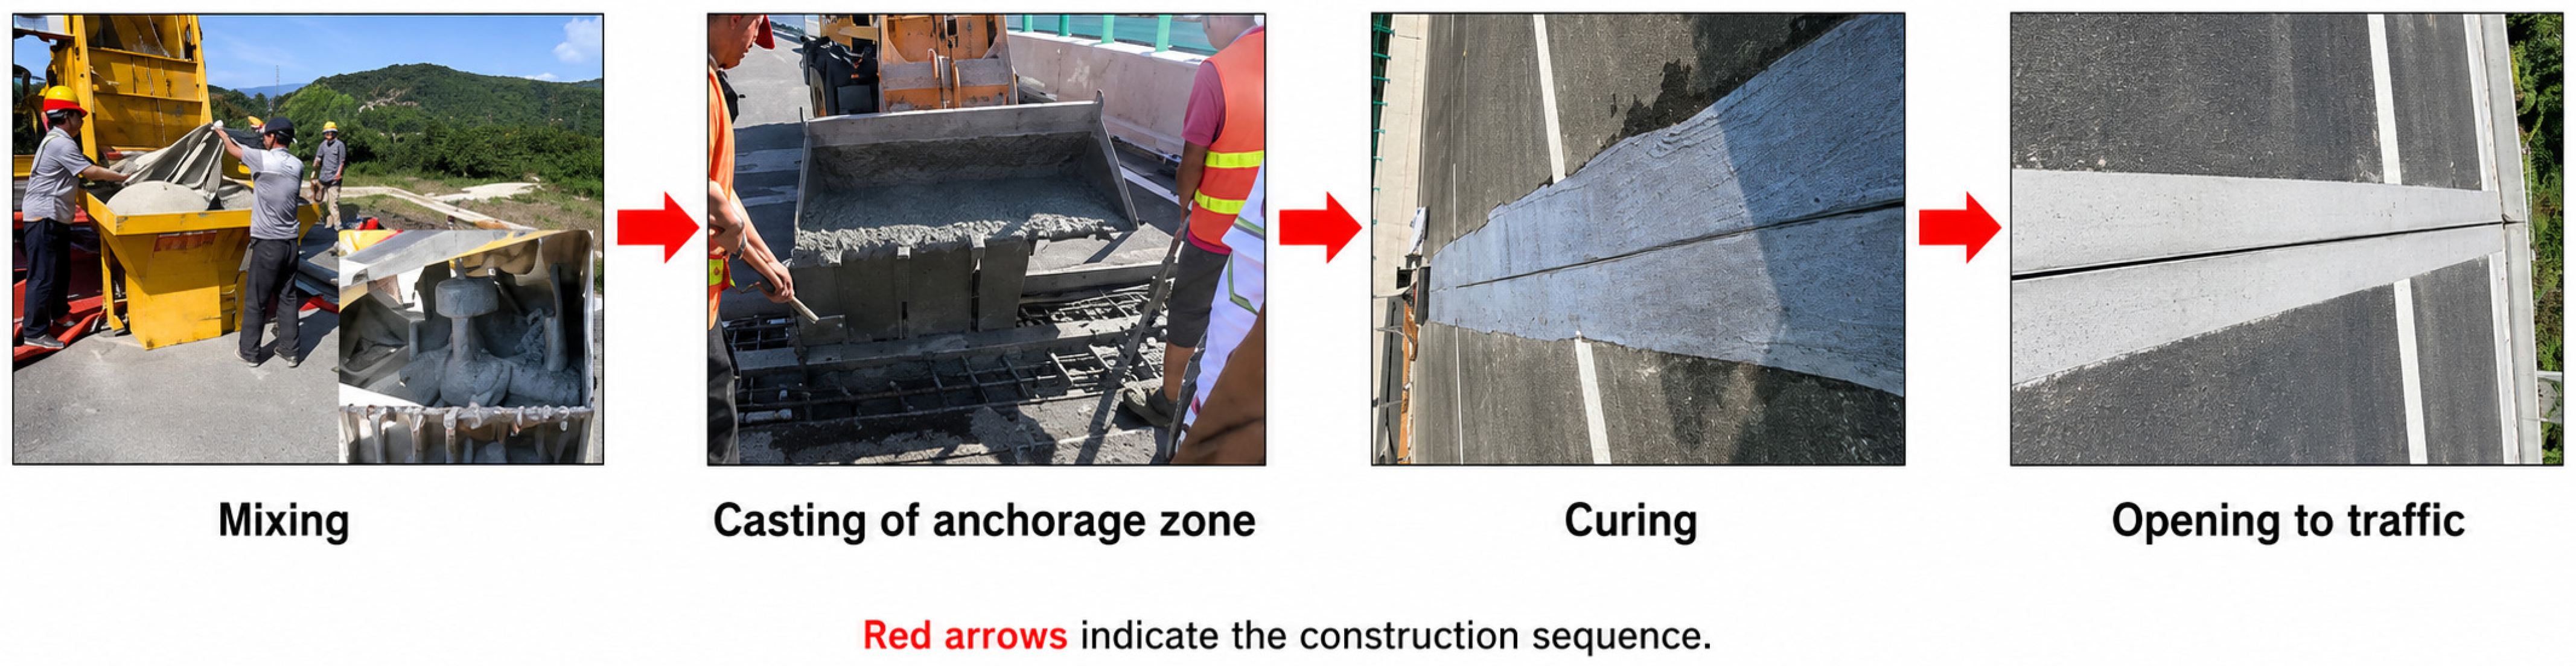
In October 2016, the E1-ECC mixture was applied to the anchorage zone of an expansion joint in a bridge reconstruction and expansion project in Shandong Province, replacing ordinary concrete in a short-span bridge. The ECC was prepared according to the designed mix proportion, and the bridge was opened to traffic after casting, curing, and performance confirmation. The construction procedure is shown in Figure 32.
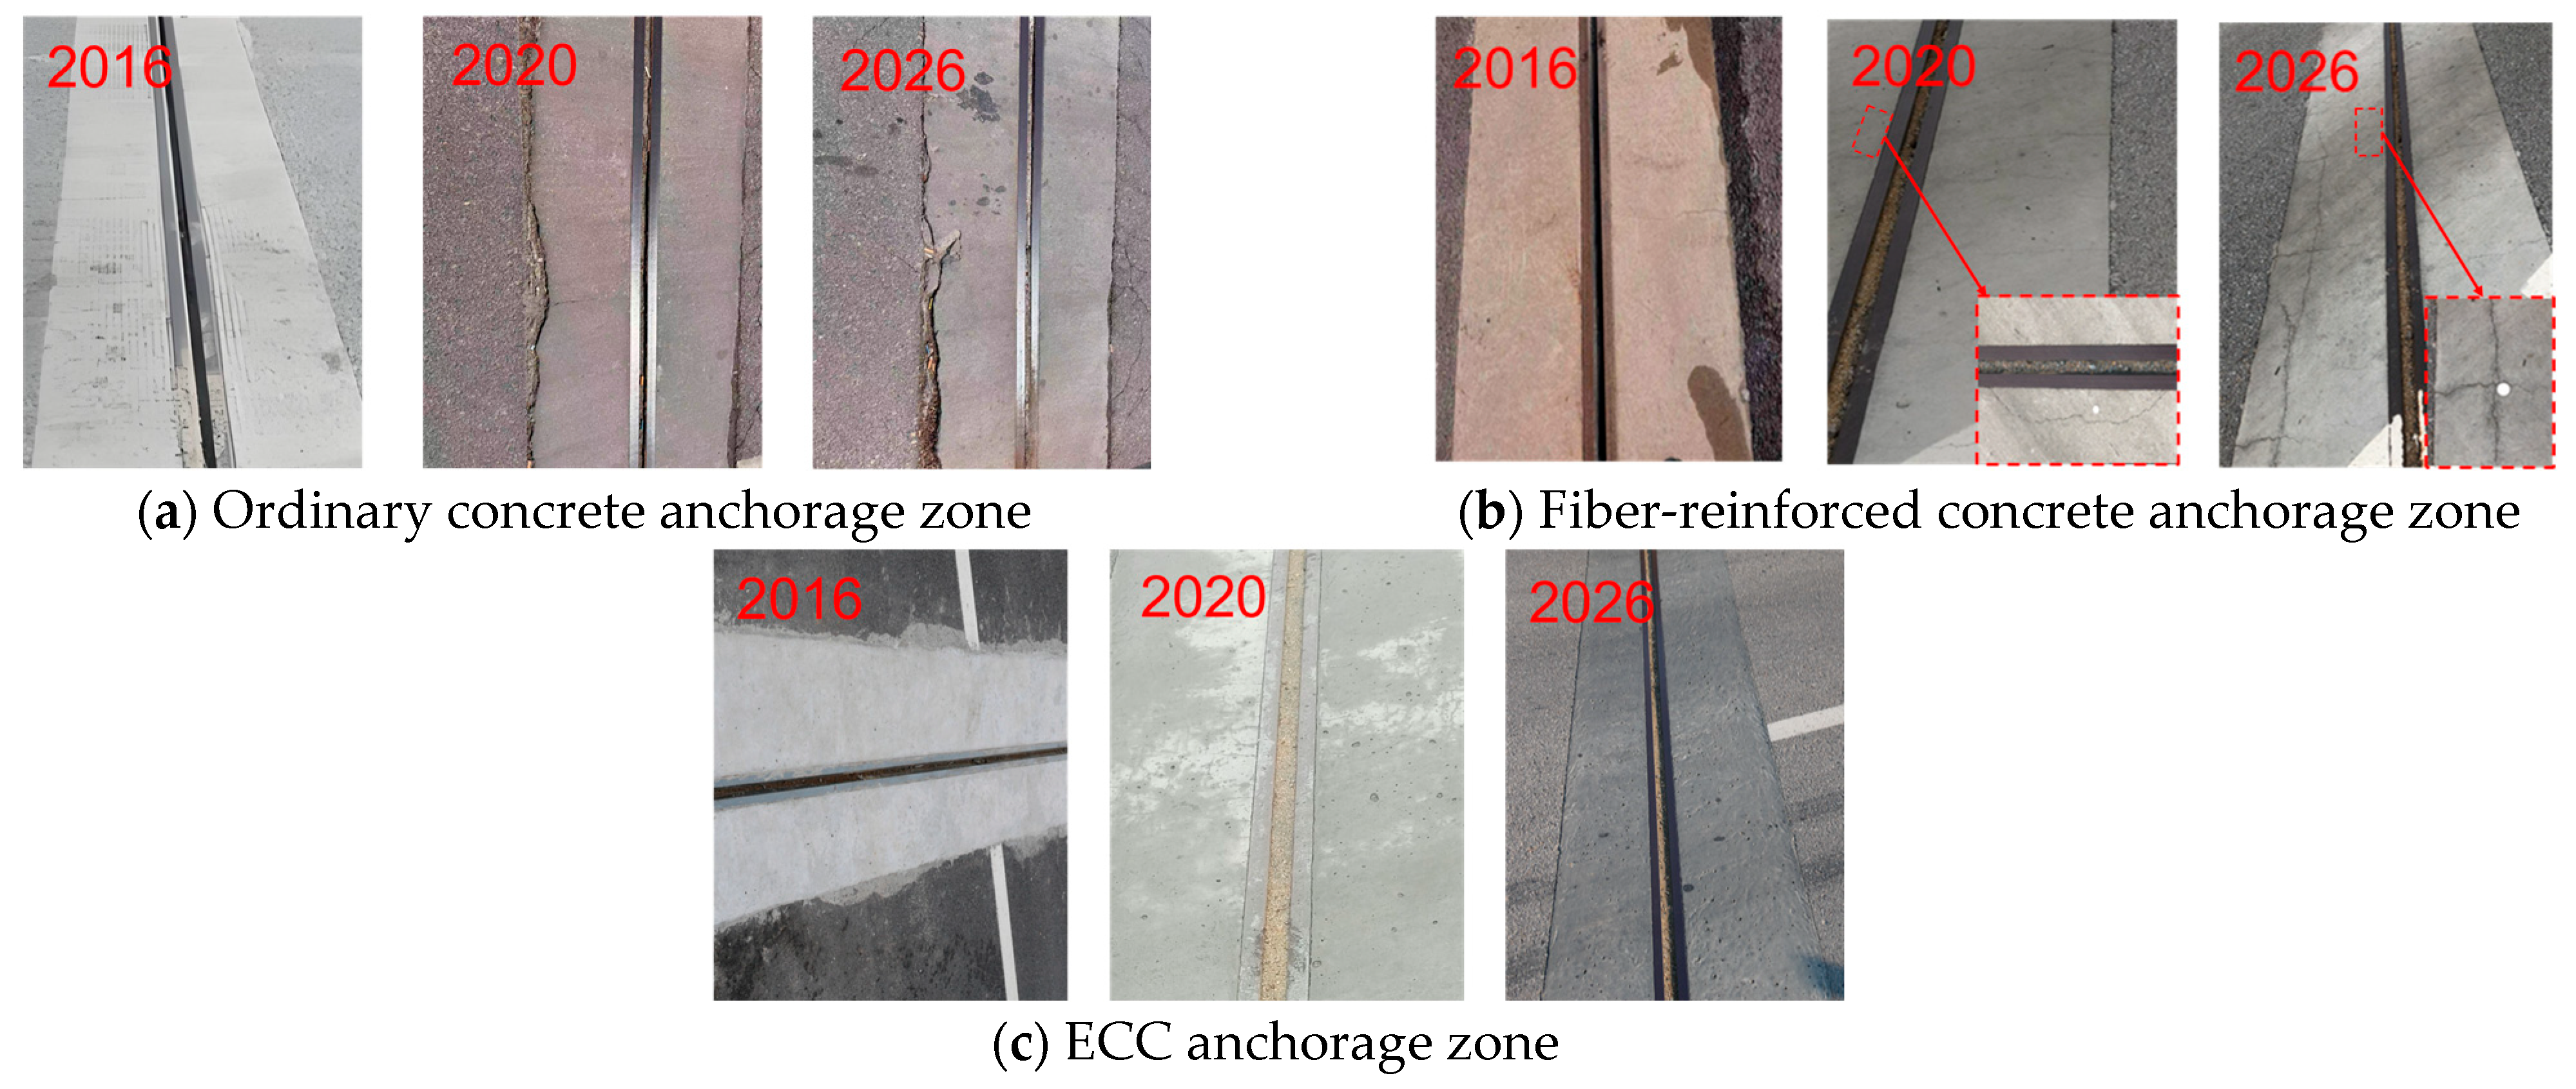
Long-term comparative field performance observations were conducted on the same road section from 2016 to 2026. Three anchorage materials were compared: ordinary concrete, fiber-reinforced concrete, and E1-ECC. These anchorage zones adopted the same type of expansion joint system and were exposed to similar traffic loading, climatic conditions, temperature–moisture variations, drainage conditions, and maintenance environment. The service states of the different anchorage zones are shown in Figure 33.
The ordinary concrete anchorage zone exhibited visible cracking, spalling, and joint damage after approximately 3–5 years of service. The fiber-reinforced concrete anchorage zone showed improved early-stage performance, but visible cracks appeared after approximately 3–5 years and developed into relatively extensive through-cracks after approximately 10 years. In contrast, the E1-ECC anchorage zone maintained good surface integrity after nearly 10 years of service, with no obvious visible cracking, spalling, or interfacial damage.
These observations were based on service-condition inspection rather than continuous sensor-based monitoring. Therefore, they were used as comparative engineering evidence supporting the predicted durability trend of ECC, rather than as direct calibration of the absolute fatigue-life values obtained from the Miner-based model.
From the perspective of practical application, ECC can be prepared, cast, and cured using procedures similar to those for conventional cementitious repair materials, with additional attention to workability control and fiber dispersion. Although the unit material cost of ECC is higher than that of ordinary concrete, the anchorage zone of an expansion joint is a local high-risk region with a relatively small repair volume. Therefore, the increase in initial material cost may be partly offset by the reduction in cracking, spalling, repeated repair, lane closure, and traffic-interruption costs. The nearly ten-year field performance of the E1-ECC anchorage zone further indicates its practical applicability. However, a quantitative life-cycle cost analysis was not included in this study and should be addressed in future work.

6. Conclusions

This study evaluated the dynamic response and fatigue performance of ECC expansion joint anchorage zones through material testing, vehicle–expansion joint coupled finite element analysis, Miner-based fatigue assessment, and long-term field performance observations. The main conclusions are as follows:
(1)
The three ECC mixtures exhibited a clear strength–ductility variation. As the water-to-binder ratio increased, compressive and tensile strengths decreased, while tensile deformation capacity increased. This provided a suitable material basis for evaluating the influence of ECC strength, stiffness, and ductility on anchorage-zone response.
(2)
The principal stress response of the anchorage zone was mainly concentrated near the pavement–anchorage-zone interface and the steel-edge-beam–anchorage-zone interface. These regions are the critical locations for stress concentration, cracking risk, and fatigue damage under vehicle impact.
(3)
Compared with C50 concrete, ECC anchorage zones showed lower principal tensile stress and larger tensile safety margins. The improvement was mainly related to the combined effects of tensile strength reserve, lower elastic modulus, tensile ductility, and post-cracking stress redistribution.
(4)
Under the defined vehicle-loading scenario, the estimated fatigue life increased from 9.93 years for the C50 anchorage zone to 83.15 years for the best-performing ECC anchorage zone. The ECC schemes also showed lower fatigue damage than C50 concrete and steel fiber-reinforced concrete, indicating their advantage in fatigue-damage control.
(5)
Long-term field performance observations from 2016 to 2026 showed that the E1-ECC anchorage zone maintained good surface integrity after nearly ten years of service, while ordinary concrete and fiber-reinforced concrete anchorage zones developed visible cracking or spalling. These observations support the practical applicability and predicted durability advantage of ECC in expansion joint anchorage zones. Future studies should incorporate measured traffic spectra, wheel-path distribution, environmental actions, and long-term in-situ stress monitoring to refine absolute fatigue-life prediction.

Author Contributions

Conceptualization, B.F. and Y.R.; Methodology, Q.Z.; Software, K.X.; Validation, Q.Z. and Z.F.; Formal analysis, K.X. and Y.W.; Investigation, B.F., Y.L., Y.G. and Y.W.; Resources, Y.G. and Z.F.; Data curation, Y.L.; Writing—original draft, B.F.; Writing—review & editing, Y.R. and R.S.; Visualization, R.S. All authors have read and agreed to the published version of the manuscript.

Funding

This research was funded by the Natural Science Foundation of Shandong Province, China (grant numbers ZR2019MEE110, ZR2021ME215), and Shandong Hi-Speed Company Limited. The APC was funded by Shandong Hi-Speed Company Limited.

Data Availability Statement

The original contributions presented in this study are included in the article. Further inquiries can be directed to the corresponding author.

Conflicts of Interest

Authors Baixian Fu, Qingtao Zhang, Kunmiao Xu, Yufei Wang and Zhenwang Fan were employed by the company Shandong Hi-Speed Company Limited. The authors declare that this study received funding from Shandong Hi-Speed Company Limited. The funder was not involved in the study design, collection, analysis, interpretation of data, the writing of this article, or the decision to submit it for publication.

References

  1. He, J.; Huang, Y.; Yin, M. Experimental study on seismic performance of steel-hinged modular expansion joints for highway bridges. Struct. Infrastruct. Eng. 2025, 1–17, Early Access. [Google Scholar] [CrossRef] [Scilit]
  2. Li, C.; Yang, S.; Li, H.; He, L.; Xia, Y.; Jiang, J. Impact Resistance Research and Performance Characterization of Hybrid Fiber-Reinforced UHPC in the Anchorage Zone of Bridge Expansion Joints. J. Mater. Civ. Eng. 2025, 37, 13. [Google Scholar] [CrossRef] [Scilit]
  3. Shams, M.A.; Bheel, N.; Abid, M.M.; Alraeeini, A.S.; Almaliki, A.H.; Dodo, Y.A.; Benjeddou, O. Exploring Fracture Energy in Engineered Cementitious Composites: A Comprehensive Review. Int. Int. J. Concr. Struct. Mater. 2025, 19, 20. [Google Scholar] [CrossRef] [Scilit]
  4. Mahmoud, M.A.A.; Issa, M.A.; Alawieh, A.F.; Gancarz, D. Evaluating Performance and Cost-Effectiveness of Expansion Joint Systems at Approach Slab to Transition Approach Slab on Illinois Tollway Bridges: A Comparative Analysis. J. Perform. Constr. Facil. 2025, 39, 8. [Google Scholar] [CrossRef] [Scilit]
  5. Tian, J.; Sun, Q.; Zhai, D.; Wang, L.; Ding, H.; Mi, B.; Zhao, Y.; Guo, Y.; Liu, R.; Liu, J. Fatigue properties of polyurethane concrete expansion joint anchorage zone. Case Stud. Constr. Mater. 2024, 20, 20. [Google Scholar] [CrossRef] [Scilit]
  6. Sun, F.; Lu, C.; Zhang, Z.; Abdalla, J.A.; Hawileh, R.A.; Zhang, X. High strength Engineered Cementitious Composites (ECC) with recycling waste glass powder: Mechanical properties and environmental benefits. Case Stud. Constr. Mater. 2025, 22, 16. [Google Scholar] [CrossRef] [Scilit]
  7. Yao, Z.; Xu, T.; Dong, M.; Huang, H.; Zeng, Q.; Xu, H.; Lin, J.; Pan, H.; Guo, Y. Engineered cementitious composites with 100% coral sand aggregate: Effect of water-to-binder and sand-to-binder ratios on mechanical properties and cracking behavior. J. Build. Eng. 2025, 115, 19. [Google Scholar] [CrossRef] [Scilit]
  8. Lu, C.; Wang, J.; Leung, C.K.Y.; Yao, Y.; Yu, B. Micromechanics-based model of single crack propagation in Engineered cementitious composites (ECC). Constr. Build. Mater. 2023, 369, 13. [Google Scholar] [CrossRef] [Scilit]
  9. Lu, C.; Shen, Q.; Zhang, Z.; Zhang, X.; Hawileh, R.A. Synergistic effect of waste steel slag powder and fly ash in sustainable high strength engineered cementitious composites: From microstructure to macro-performance. J. Build. Eng. 2025, 113, 20. [Google Scholar] [CrossRef] [Scilit]
  10. Rambabu, D.; Sharma, S.K.; Akbar, M.A. Evaluating engineered cementitious composite for fatigue resistance in pavement applications. Int. J. Pavement Eng. 2025, 26, 21. [Google Scholar] [CrossRef] [Scilit]
  11. Chen, W.; Liang, L.; Jiang, F.; Tang, Z.; Sun, X.; Yu, J.; Li, V.C.; Yu, K. New opportunity: Materials genome strategy for engineered cementitious composites (ECC)design. Cem. Concr. Comp. 2025, 159, 29. [Google Scholar] [CrossRef] [Scilit]
  12. Chen, S.; Ma, S.; Ma, W. Seismic performance study of plastic hinge region using PVA-ECC composite bridge piers. Eng. Struct. 2025, 323, 14. [Google Scholar] [CrossRef] [Scilit]
  13. Chu, Y.; Yi, G.; Huang, H.; Xiao, Y. Study on seismic performance of the RC beam-column edge joint strengthened with PVA-ECC. Struct. Concr. 2025, 26, 4868–4884. [Google Scholar] [CrossRef] [Scilit]
  14. Shanmugasundaram, N.; Praveenkumar, S.; Kumar, P.S.A. Structural behavior of engineered cementitious composite substrate slab overlays for bridge deck and pavement applications. Constr. Build. Mater. 2025, 459, 15. [Google Scholar] [CrossRef] [Scilit]
  15. Lak, E.Z.; Valikhah, F.; Das, S.; Booya, E. Application of Ultrahigh-Performance Concrete and Sustainably Engineered Cementitious Composites for Link Slabs. J. Bridge Eng. 2026, 31, 14. [Google Scholar] [CrossRef] [Scilit]
  16. Ma, J.; Yang, Q.; Peng, X.; Xia, K. Review on Durability Deterioration and Mitigation of Concrete Structures. Coatings 2025, 15, 982. [Google Scholar] [CrossRef] [Scilit]
  17. Yuan, M.; Zhang, L.; Wan, J.; Li, Y.; Xu, W.; Qi, Y.; Xie, Z.; Xu, W. Analysis of factors affecting structural durability based on reinforced concrete corrosion-induced cracking. Structures 2025, 75, 13. [Google Scholar] [CrossRef] [Scilit]
  18. Li, F.; Luo, D.; Niu, D. Durability evaluation of concrete structure under freeze-thaw environment based on pore evolution derived from deep learning. Constr. Build. Mater. 2025, 467, 15. [Google Scholar] [CrossRef] [Scilit]
  19. Liu, Y.; Wu, W.; Zhang, Y.; Hou, W.; Zhang, H.; Peng, L. Engineered/strain-hardening cementitious composites (ECC/SHCC) for resilient cold-region infrastructure: A critical review of freeze-thaw durability. Case Stud. Constr. Mater. 2025, 22, 21. [Google Scholar] [CrossRef] [Scilit]
  20. Xia, J.; Jiang, H.; Chen, J. A comparative study of durability design standards for concrete structures exposed to marine chloride environments. Constr. Build. Mater. 2026, 528, 21. [Google Scholar] [CrossRef] [Scilit]
  21. Dong, S.; Gu, J.; Ouyang, X.; Jang, S.; Han, B. Enhancing mechanical properties, durability and multifunctionality of concrete structures via using ultra-high performance concrete layer: A review. Compos. Part B-Eng. 2025, 297, 24. [Google Scholar] [CrossRef] [Scilit]
  22. Mao, Q.; Zhang, Z.; Ma, H. Flexural Performance of Emulsified-Asphalt-Modified ECC for Expansion Joint Use. Adv. Civ. Eng. 2021, 2021, 9. [Google Scholar] [CrossRef] [Scilit]
  23. Sun, H.; Yuan, H.; Sun, Y.; Li, X.; Luo, L. Experimental Study and Finite Element Analysis on the Modification of Fast-Hardening Polymer Cement Composite Material Applied to the Anchorage Zone of Expansion Joint. Buildings 2023, 13, 2910. [Google Scholar] [CrossRef] [Scilit]
  24. Wang, Y.; Sun, Q.; Liu, Y.; Rim, C.; Kim, C. Preparation of polyurethane concrete and its novel application in bridge expansion joint anchorage zone. J. Reinf. Plast. Comp. 2024, 43, 1356–1374. [Google Scholar] [CrossRef] [Scilit]
  25. Hou, J.; Wang, J.; Xu, W.; Chen, Y.; Wang, B.; Liu, J.; Shen, B.; Li, Y.; Sun, H. An analysis method of vehicle-bridge coupling vibration considering effects of expansion joint parameters and its application. Struct. Control Health Monit. 2022, 29, 29. [Google Scholar] [CrossRef] [Scilit]
  26. Ding, Y.; Zhang, W.; Au, F.T.K. Effect of dynamic impact at modular bridge expansion joints on bridge design. Eng. Struct. 2016, 127, 645–662. [Google Scholar] [CrossRef] [Scilit]
  27. Ji, W.; Shao, T.; Li, J. Analytical Investigation of Fatigue Behavior in a Modified Composite Steel Box Concrete Girder Bridge with Corrugated Steel Webs under Pavement and Expansion Joint Deterioration. J. Bridge Eng. 2024, 29, 17. [Google Scholar] [CrossRef] [Scilit]
  28. Ma, Y.; Peng, A.; Wang, L.; Zhang, C.; Li, J.; Zhang, J. Fatigue performance of an innovative shallow-buried modular bridge expansion joint. Eng. Struct. 2020, 221, 13. [Google Scholar] [CrossRef] [Scilit]
  29. Zhang, H.; Wu, Z.; Liu, H.; Hu, X.; Tian, Z.; Shi, C. Insight into the effect of sand size, sand-to-binder ratio, and water-to-binder ratio on micro-and macro-mechanical properties of HS-ECC. Cem. Concr. Comp. 2025, 164, 26. [Google Scholar] [CrossRef] [Scilit]
  30. Liao, Q.; Li, B.; Dai, F.; Mao, J.; Ye, J. Polyethylene fiber-reinforced expansive engineered cementitious composites incorporating high-volume fly ash: Expansion mechanism, mechanical behaviour and application recommendation. Constr. Build. Mater. 2026, 514, 16. [Google Scholar] [CrossRef] [Scilit]
  31. Rokugo, K.; Kanda, T.; Yokota, H.; Sakata, N. Applications and recommendations of high performance fiber reinforced cement composites with multiple fine cracking (HPFRCC) in Japan. Mater. Struct. 2009, 42, 1197–1208. [Google Scholar] [CrossRef] [Scilit]
  32. Guan, S.; Wang, A.; Wang, H.; Liu, Z.; Hou, S. Fatigue life prediction of rubber bushings under multiaxial random loads based on the rainflow counting method. Results Eng. 2025, 28, 8. [Google Scholar] [CrossRef] [Scilit]
  33. Zhang, D.; Li, X.; Han, X.; Zhang, Q.; Wang, S. Unified fatigue life prediction method for Q450NQR1 lockbolt joints using structural stress. J. Constr. Steel Res. 2025, 227, 21. [Google Scholar] [CrossRef] [Scilit]
  34. Ge, X.; Zhang, C.; Zhang, W.; Zhang, X.; Xu, K. A nonlinear fatigue damage accumulation model for rolling bearing life prediction considering coupled load -variation effects. Int. J. Damage Mech. 2026, 35, 293–323. [Google Scholar] [CrossRef] [Scilit]
  35. Hanson, J.M.; Ballinger, C.A.; Linger, D. Considerations for Design of Concrete Structures Subjected to Fatigue Loading. J. Aci 1974, 71, 97–120. [Google Scholar] [CrossRef] [Scilit]
  36. Gao, S.; Xu, Q.; Wang, Z.; Zhu, Y. Effect of water saturation on uniaxial constant amplitude tensile fatigue performance of ECC and its statistical analysis of fatigue life. Int. J. Fatigue 2025, 190, 21. [Google Scholar] [CrossRef] [Scilit]
  37. Cheng, X.; Song, X.; Li, G. Noise generation and contribution of a single-gap bridge expansion joint: An experimental and numerical study. Appl. Acoust. 2025, 229, 15. [Google Scholar] [CrossRef] [Scilit]
  38. Han, J.; Zhang, D.; Xu, W.; Wang, G.; Zhang, Z.; Liu, L.; Li, Y. Experimental and numerical study on seismic performance of RC/ECC hybrid frame structures supported by foundations with different elevations. Constr. Build. Mater. 2025, 468, 19. [Google Scholar] [CrossRef] [Scilit]
  39. GB 50010-2010; Code for Design of Concrete Structures. China National Standard: Beijing, China, 2011.
  40. Zhou, J.; Pan, J.; Leung, C.K.Y. Mechanical Behavior of Fiber-Reinforced Engineered Cementitious Composites in Uniaxial Compression. J. Mater. Civ. Eng. 2015, 27, 04014111. [Google Scholar] [CrossRef] [Scilit]
  41. Meng, D.; Huang, T.; Zhang, Y.X.; Lee, C.K. Mechanical behaviour of a polyvinyl alcohol fibre reinforced engineered cementitious composite (PVA-ECC) using local ingredients. Constr. Build. Mater. 2017, 141, 259–270. [Google Scholar] [CrossRef] [Scilit]
  42. Krajcinovic, D.; Fonseka, G.U. The continuous damage theory of brittle materials, part 1: General theory. J. Appl. Mech. 1981, 48, 809–815. [Google Scholar] [CrossRef] [Scilit]
  43. Li, X.; Cai, Y.; Lv, X.; Mao, J.; Li, L. Theoretical and experimental research on extracting modal frequencies of thin-walled curved bridges using a 3D vehicle. Eng. Struct. 2025, 342, 18. [Google Scholar] [CrossRef] [Scilit]
  44. Nunia, B.; Koli, M.; Pandey, S.; Naik, S.; Dixit, A.K. Computational model on influence of prestress level on vehicle-bridge coupled vibrations. Int. J. Interact. Des. Manuf. 2023, 17, 2731–2743. [Google Scholar] [CrossRef] [Scilit]
  45. Zhao, Z.Y. Experimental and Simulation Research on Axial Load of Anchorage Zone for Reinforced Bridge Expansion Device. Master’s Thesis, Chang’an University, Xi’an, China, 2024. [Google Scholar]
  46. Shen, B.; Ding, Y.; Xu, B.; Shi, L.; Wang, L.; Xu, S. Fatigue behavior of modified polyurethane concrete for bridge deck pavement considering temperature coupling and failure probability. Constr. Build. Mater. 2026, 533, 13. [Google Scholar] [CrossRef] [Scilit]
Figure 1. Morphological characteristics of gold tailings sand.
Buildings 16 02978 g001
Figure 2. XRD pattern of gold tailings sand.
Buildings 16 02978 g002
Figure 3. Particle size distribution of raw materials.
Buildings 16 02978 g003
Figure 4. Experimental program and casting procedure of ECC mixtures.
Buildings 16 02978 g004
Figure 5. Test setup and specimen dimensions: (a) compressive test, (b) uniaxial tensile test (unit: mm).
Buildings 16 02978 g005
Figure 6. Compressive strength.
Buildings 16 02978 g006
Figure 7. Compressive stress–strain curves.
Buildings 16 02978 g007
Figure 8. First crack strength.
Buildings 16 02978 g008
Figure 9. Tensile strength.
Buildings 16 02978 g009
Figure 10. Peak tensile strain.
Buildings 16 02978 g010
Figure 11. Tensile stress–strain curves.
Buildings 16 02978 g011
Figure 12. Flowchart for calculating the fatigue life of concrete in the anchorage zone.
Buildings 16 02978 g012
Figure 13. Schematic of the D80 modular expansion joint structure (unit: mm).
Buildings 16 02978 g013
Figure 14. Finite element model of the expansion joint.
Buildings 16 02978 g014
Figure 15. Constitutive relationship curve of concrete.
Buildings 16 02978 g015
Figure 16. Constitutive relationship curve of ECC.
Buildings 16 02978 g016
Figure 17. Three-dimensional vehicle finite element model.
Buildings 16 02978 g017
Figure 18. Field test.
Buildings 16 02978 g018
Figure 19. Schematic of vehicle movement.
Buildings 16 02978 g019
Figure 20. Comparison between experimental and finite element results of concrete strain in the anchorage zone.
Buildings 16 02978 g020
Figure 21. Variation in maximum principal compressive and tensile stresses in the anchorage zone with travel distance (D).
Buildings 16 02978 g021
Figure 22. Principal compressive stress contours at typical locations of the anchorage zone under the EJ-E1 condition.
Buildings 16 02978 g022
Figure 23. Principal tensile stress contours at typical locations of the anchorage zone under the EJ-E1 condition.
Buildings 16 02978 g023aBuildings 16 02978 g023b
Figure 24. Response curves of maximum principal compressive stress in the anchorage zone under different working conditions.
Buildings 16 02978 g024
Figure 25. Peak values of maximum principal compressive stress in the anchorage zone under different working conditions.
Buildings 16 02978 g025
Figure 26. Response curves of maximum principal tensile stress in the anchorage zone under different working conditions.
Buildings 16 02978 g026
Figure 27. Peak values of maximum principal tensile stress in the anchorage zone under different working conditions.
Buildings 16 02978 g027
Figure 28. Stress history curves of the element with the peak principal tensile stress in the anchorage zone under different working conditions.
Buildings 16 02978 g028
Figure 29. Fatigue stress spectrum.
Buildings 16 02978 g029
Figure 30. Fatigue life of anchorage zones under different working conditions.
Buildings 16 02978 g030
Figure 31. Maximum principal tensile stress histories of anchorage zones with different materials.
Buildings 16 02978 g031
Figure 32. On-site construction of the E1-ECC expansion joint anchorage zone.
Buildings 16 02978 g032
Figure 33. Field performance of anchorage zones made with different materials on the same road section.
Buildings 16 02978 g033
Table 1. Main chemical composition of cement/%.
Chemical
Composition
CaOSiO2Al2O3Fe2O3SO3MgOK2OMnO
Content (%)63.2118.486.743.453.163.240.530.27
Table 2. Main chemical composition of fly ash/%.
Chemical
Composition
SiO2Al2O3Fe2O3CaOSO3TiO2
Content (%)54.2829.768.814.212.061.35
Table 3. Performance parameters of PVA fibers.
Fiber TypeLength
(mm)
Diameter
(μm)
Elastic Modulus (GPa)Tensile Strain
(%)
Tensile Strength (MPa)Density
(g/cm3)
PVA1240406.5 ± 1≥16001.28
Table 4. Mix proportions of ECC (kg/m3).
Sample NumberCementFly AshGold Tailings SandThickenerWater ReducerWaterFiber
E15546644380.595.2234126
E25546644380.585.0935326
E35546644380.574.9736526
Table 5. Material properties.
Material TypeElastic Modulus/MPaPoisson’s RatioDensity/kg·m−3
Section steel206,0000.37850
Bolting steel210,0000.37850
Bituminous concrete14210.252400
C50 concrete38,0000.22500
E122,0000.21910
E221,0000.21890
E319,5000.21870
Table 6. Compressive parameters of the ECC.
Sample Number σ cp (MPa) ε cp (%) ε cu (%)
E154.790.301.22
E247.180.311.12
E341.170.321.22
Table 7. Tensile parameters of the ECC.
Sample Number σ t 0 (MPa) ε t 0 (%) σ tp (MPa) ε tp (%) ε tu
E12.510.154.102.513.07
E22.180.193.583.864.23
E31.850.233.095.325.41
Table 8. Vehicle properties.
NameProperties
Mass of vehicle body (M)24,808.00 kg
Moment of inertia of the vehicle body about xy (Ixy)172,160.00 kg·m2
Moment of inertia of the vehicle body about xz (Ixz)172,160.00 kg·m2
Moment of inertia of the vehicle body about zy (Izy)31,496.00 kg·m2
Mass of front tire and suspension system (mf)725.40 kg
Mass of rear tire and suspension system (mr)1160.00 kg
Stiffness of primary suspension system (front axle, Kf)727,812.00 N/m
Stiffness of primary suspension system (rear axle, Kr)1,969,034.00 N/m
Stiffness of secondary suspension system (front axle, Ktf)1,972,900.00 N/m
Stiffness of secondary suspension system (rear axle, Ktr)4,735,000.00 N/m
Damping of primary suspension system (front axle, Cf)2189.60 Ns/m
Damping of primary suspension system (rear axle, Cr)7181.80 Ns/m
Damping of secondary suspension system (front axle, Ctf)0.00 Ns/m
Damping of secondary suspension system (rear axle, Ctr)0.00 Ns/m
Table 9. Mesh sensitivity analysis results of the anchorage-zone local mesh.
Mesh SchemeNominal Local Mesh Size of Anchorage Zone
/mm
Peak Strain at Numerical Monitoring Point
/με
Relative Deviation Relative to Finest Mesh
/%
Calculation Time
/h
Coarse mesh50.040.8519.543.2
Adopted mesh25.035.844.877.5
Finest tested mesh12.534.18-16.9
Table 10. Fatigue-damage under different working conditions.
Specimen NumberStress Amplitude/MPaNdkNkNfkΔDkD
EJ-E1-801.8150001.83 × 1061.59 × 1081.15 × 10−21.21 × 10⁻²
1.3241001.50 × 1062.84 × 1095.26 × 10−4
0.6966502.43 × 1061.16 × 10112.09 × 10−5
0.3299003.61 × 1061.02 × 10123.53 × 10−6
EJ-E2-801.6550001.83 × 1069.95 × 1071.83 × 10−21.92 × 10⁻²
1.2050001.83 × 1062.07 × 1098.83 × 10−4
0.7170002.56 × 1065.62 × 10104.55 × 10−5
0.3299503.63 × 1067.79 × 10114.66 × 10−6
EJ-E3-801.5350001.83 × 1064.35 × 1074.19 × 10−24.27 × 10⁻²
1.0245001.64 × 1062.34 × 1097.03 × 10−4
0.6475002.74 × 1064.54 × 10106.02 × 10−5
0.2590003.29 × 1069.55 × 10113.44 × 10−6
EJ-C50-801.8450001.83 × 1061.81 × 1071.01 × 10−11.01 × 10⁻¹
1.4360502.21 × 1061.38 × 10111.60 × 10−5
0.9288003.21 × 1069.34 × 10153.44 × 10−10
0.3196003.50 × 1065.58 × 10216.28 × 10−16
Table 11. Material parameters.
MaterialsElastic Modulus
/MPa
Poisson RatioS-N Curve
PCC38000.2lgN = 13.8781 − 3.2253σ
PUC25510.3lgS = 0.27866 − 0.12565 lgN
SFC30,8000.2lgσ = 0.5659 − 0.0504 lgN
Table 12. Fatigue-damage calculation results.
MaterialsMaximum Principal Tensile Stress
/Mpa
D
E12.431.21 × 10−2
E22.001.92 × 10−2
E31.834.27 × 10−2
C502.581.01 × 10−1
PCC2.313.25 × 10−2
PUC2.181.95 × 10−2
SFC2.537.54 × 10−2
Disclaimer/Publisher’s Note: The statements, opinions and data contained in all publications are solely those of the individual author(s) and contributor(s) and not of MDPI and/or the editor(s). MDPI and/or the editor(s) disclaim responsibility for any injury to people or property resulting from any ideas, methods, instructions or products referred to in the content.