Article

Research on the Indicator System and Evaluation Model for Seismic Resilience of Residential Buildings: A Case of Hebei Province

1
School of Civil Engineering, Hebei University of Science and Technology, Shijiazhuang 050018, China
2
Hebei Earthquake Agency, Shijiazhuang 050021, China
*
Author to whom correspondence should be addressed.
Buildings 2026, 16(15), 2976; https://doi.org/10.3390/buildings16152976
Submission received: 14 June 2026 / Revised: 20 July 2026 / Accepted: 22 July 2026 / Published: 27 July 2026
(This article belongs to the Section Building Structures)

Abstract

This study proposes a regional-scale evaluation framework for assessing the seismic resilience of residential buildings by integrating earthquake monitoring and early-warning capacity, seismic hazard background, and structural seismic capacity. An indicator system consisting of three primary indicators, six secondary indicators, and twelve tertiary indicators was established based on the literature, seismic design codes, disaster risk census data, expert consultation, and data availability. The analytic hierarchy process was used to determine indicator weights, and multi-source data were integrated to evaluate 11 prefecture-level cities in Hebei Province. The results show that structural seismic capacity is the dominant factor affecting the comprehensive ranking, followed by seismic hazard background and earthquake monitoring and early-warning capacity. Cities with a higher combined floor-area proportion of reinforced–concrete and brick–concrete residential buildings and stronger earthquake monitoring and early-warning capacity generally exhibit higher seismic resilience. The proposed framework provides a practical decision-support tool for identifying regional weaknesses, prioritizing retrofitting of existing buildings, and supporting future development of seismic resilience policies and technical guidelines.

1. Introduction

The seismic resilience of residential buildings is essential for protecting lives and property and maintaining social stability. Improving the seismic performance of residential buildings is an important component of earthquake disaster risk reduction and an effective means of mitigating earthquake-induced losses. With rapid socioeconomic development and continuing urbanization, population and building densities have increased substantially, creating higher requirements for seismic design, construction quality, risk assessment, and the retrofitting of existing buildings in earthquake-prone areas [1]. A systematic assessment of residential building seismic resilience can facilitate the identification of potential weaknesses and the implementation of targeted preventive measures, thereby improving the safety and reliability of the residential building stock.
Residential buildings are widely distributed and differ significantly in construction age, structural type, seismic fortification level, and exposure to regional seismic hazards. Therefore, building-level assessment alone is insufficient for supporting regional disaster prevention planning. A regional-scale evaluation can identify spatial differences in seismic resilience, clarify the dominant weaknesses of different cities, and provide a basis for allocating limited retrofitting resources and improving earthquake disaster risk governance [2].
Regional geological conditions, seismic safety assessment, and the retrofitting of existing buildings are important considerations in improving residential building seismic resilience. Geographic Information Systems (GIS) provide effective tools for integrating, analyzing, managing, and visualizing multi-source seismic risk data. By combining GIS-based spatial analysis with a comprehensive evaluation model, regional differences in residential building seismic resilience can be systematically identified. The resulting information can support the development of targeted improvement measures and provide a scientific basis for earthquake disaster risk reduction and decision-making.
In addition, a comprehensive indicator system and assessment model for the seismic resilience of residential buildings can also serve as a fundamental basis for identifying vulnerable building stocks and selecting appropriate seismic retrofitting strategies for existing buildings. Regional-scale resilience evaluation helps clarify whether the main weakness of a city originates from structural seismic capacity, seismic hazard background, monitoring and early-warning capacity, or ground motion zonation. Therefore, the evaluation results can support differentiated retrofit priorities and provide preliminary guidance for the adoption of effective strengthening, externally attached sub-structure retrofitting, isolation, or energy-dissipation strategies for existing residential buildings [3]. Previous studies have demonstrated the effectiveness of seismic upgrading strategies for non-ductile and irregular reinforced–concrete structures, as well as dissipative bracing systems for seismic protection of existing R/C structures [4,5].
Compared with building-level seismic assessment methods or single-factor regional risk evaluations, the proposed framework integrates monitoring-warning capacity, seismic hazard background, and residential building structural capacity into a unified multi-level indicator system. It therefore not only provides an overall ranking, but also identifies the dominant weaknesses of each city, making the results more directly applicable to differentiated retrofitting prioritization and regional disaster risk governance.

2. Determination of Evaluation Indicators and Their Weights

2.1. Evaluation Indicator System for Seismic Resilience of Residential Buildings

The indicator system was developed through four steps. First, potential indicators related to seismic resilience, disaster risk reduction, seismic monitoring, structural seismic capacity, and ground motion zonation were collected from previous studies, national standards, and technical documents [6]. Second, indicators were screened according to relevance, representativeness, data availability, independence, and applicability to regional-scale evaluation. Third, the indicator framework was reviewed by experts from earthquake monitoring, engineering seismic assessment, emergency response, and seismic station operation. Finally, indicators with available city-scale data were retained to form the final system.
Considering the characteristics of residential buildings, the principles for selecting evaluation indicators, methods for determining indicator components, and the structure of the evaluation indicator system, an evaluation indicator system for the seismic resilience of residential buildings has been established. It takes the seismic resilience of residential building engineering as the evaluation object, with primary indicators including earthquake monitoring and early-warning capacity, geological structure conditions, and residential building seismic capacity. The system includes six secondary indicators and 12 tertiary indicators. Specific data and information were obtained through scientific research institutions and survey work (Table 1):

2.2. Evaluation Indicator Matrix and Weight Determination

The analytic hierarchy process (AHP) has been widely used in multi-criteria decision-making problems related to building intervention and seismic retrofit prioritization. In this study, AHP was used to construct the evaluation indicator matrix and determine the weights of indicators at each level [7,8,9]. The importance judgment matrix was established as follows:
A = a 11 a 12 a 1 n a 21 a 22 a 2 n a i j a n 1 a n 2 a n n
In the matrix, a i j represents the importance of indicator A i relative to A j indicator. If indicator A i is more important in the matrix, then a i j > 1; if they are equally important, then a i j = 1.
Based on the established indicator system, an expert questionnaire was conducted to determine the relative importance of indicators at different levels. A total of 33 experts from the Hebei Earthquake Agency, the Earthquake Disaster Prevention Center (Engineering Institute), the Emergency Center, and the Hebei Seismic Station participated in the survey. Pairwise comparison matrices were constructed using the 1–9 scale of the analytic hierarchy process (AHP). To synthesize the group judgments, the individual expert judgments were aggregated using the geometric mean method, which can reduce the influence of extreme individual judgments and is commonly used in group decision-making with AHP.
The priority vector of each judgment matrix was calculated using the eigenvector method, and the consistency of each matrix was examined using the consistency ratio (CR). All judgment matrices satisfied the consistency requirement of CR < 0.10, indicating that the expert judgments were acceptable and internally consistent. The pairwise comparison matrix for the primary indicators is shown in Table 2.
The maximum eigenvalue λ max = 3.0092 of the judgment matrix was calculated, followed by a consistency check, yielding the following relevant data:
Consistency Index (CI): C I = λ max n n 1 = 3.0092 3 3 1 = 0.0046
Average Random Consistency Index (RI): R I = 0.58
Random Consistency Ratio (CR): C R = C I R I = 0.0046 0.58 = 0.0079 < 0.10
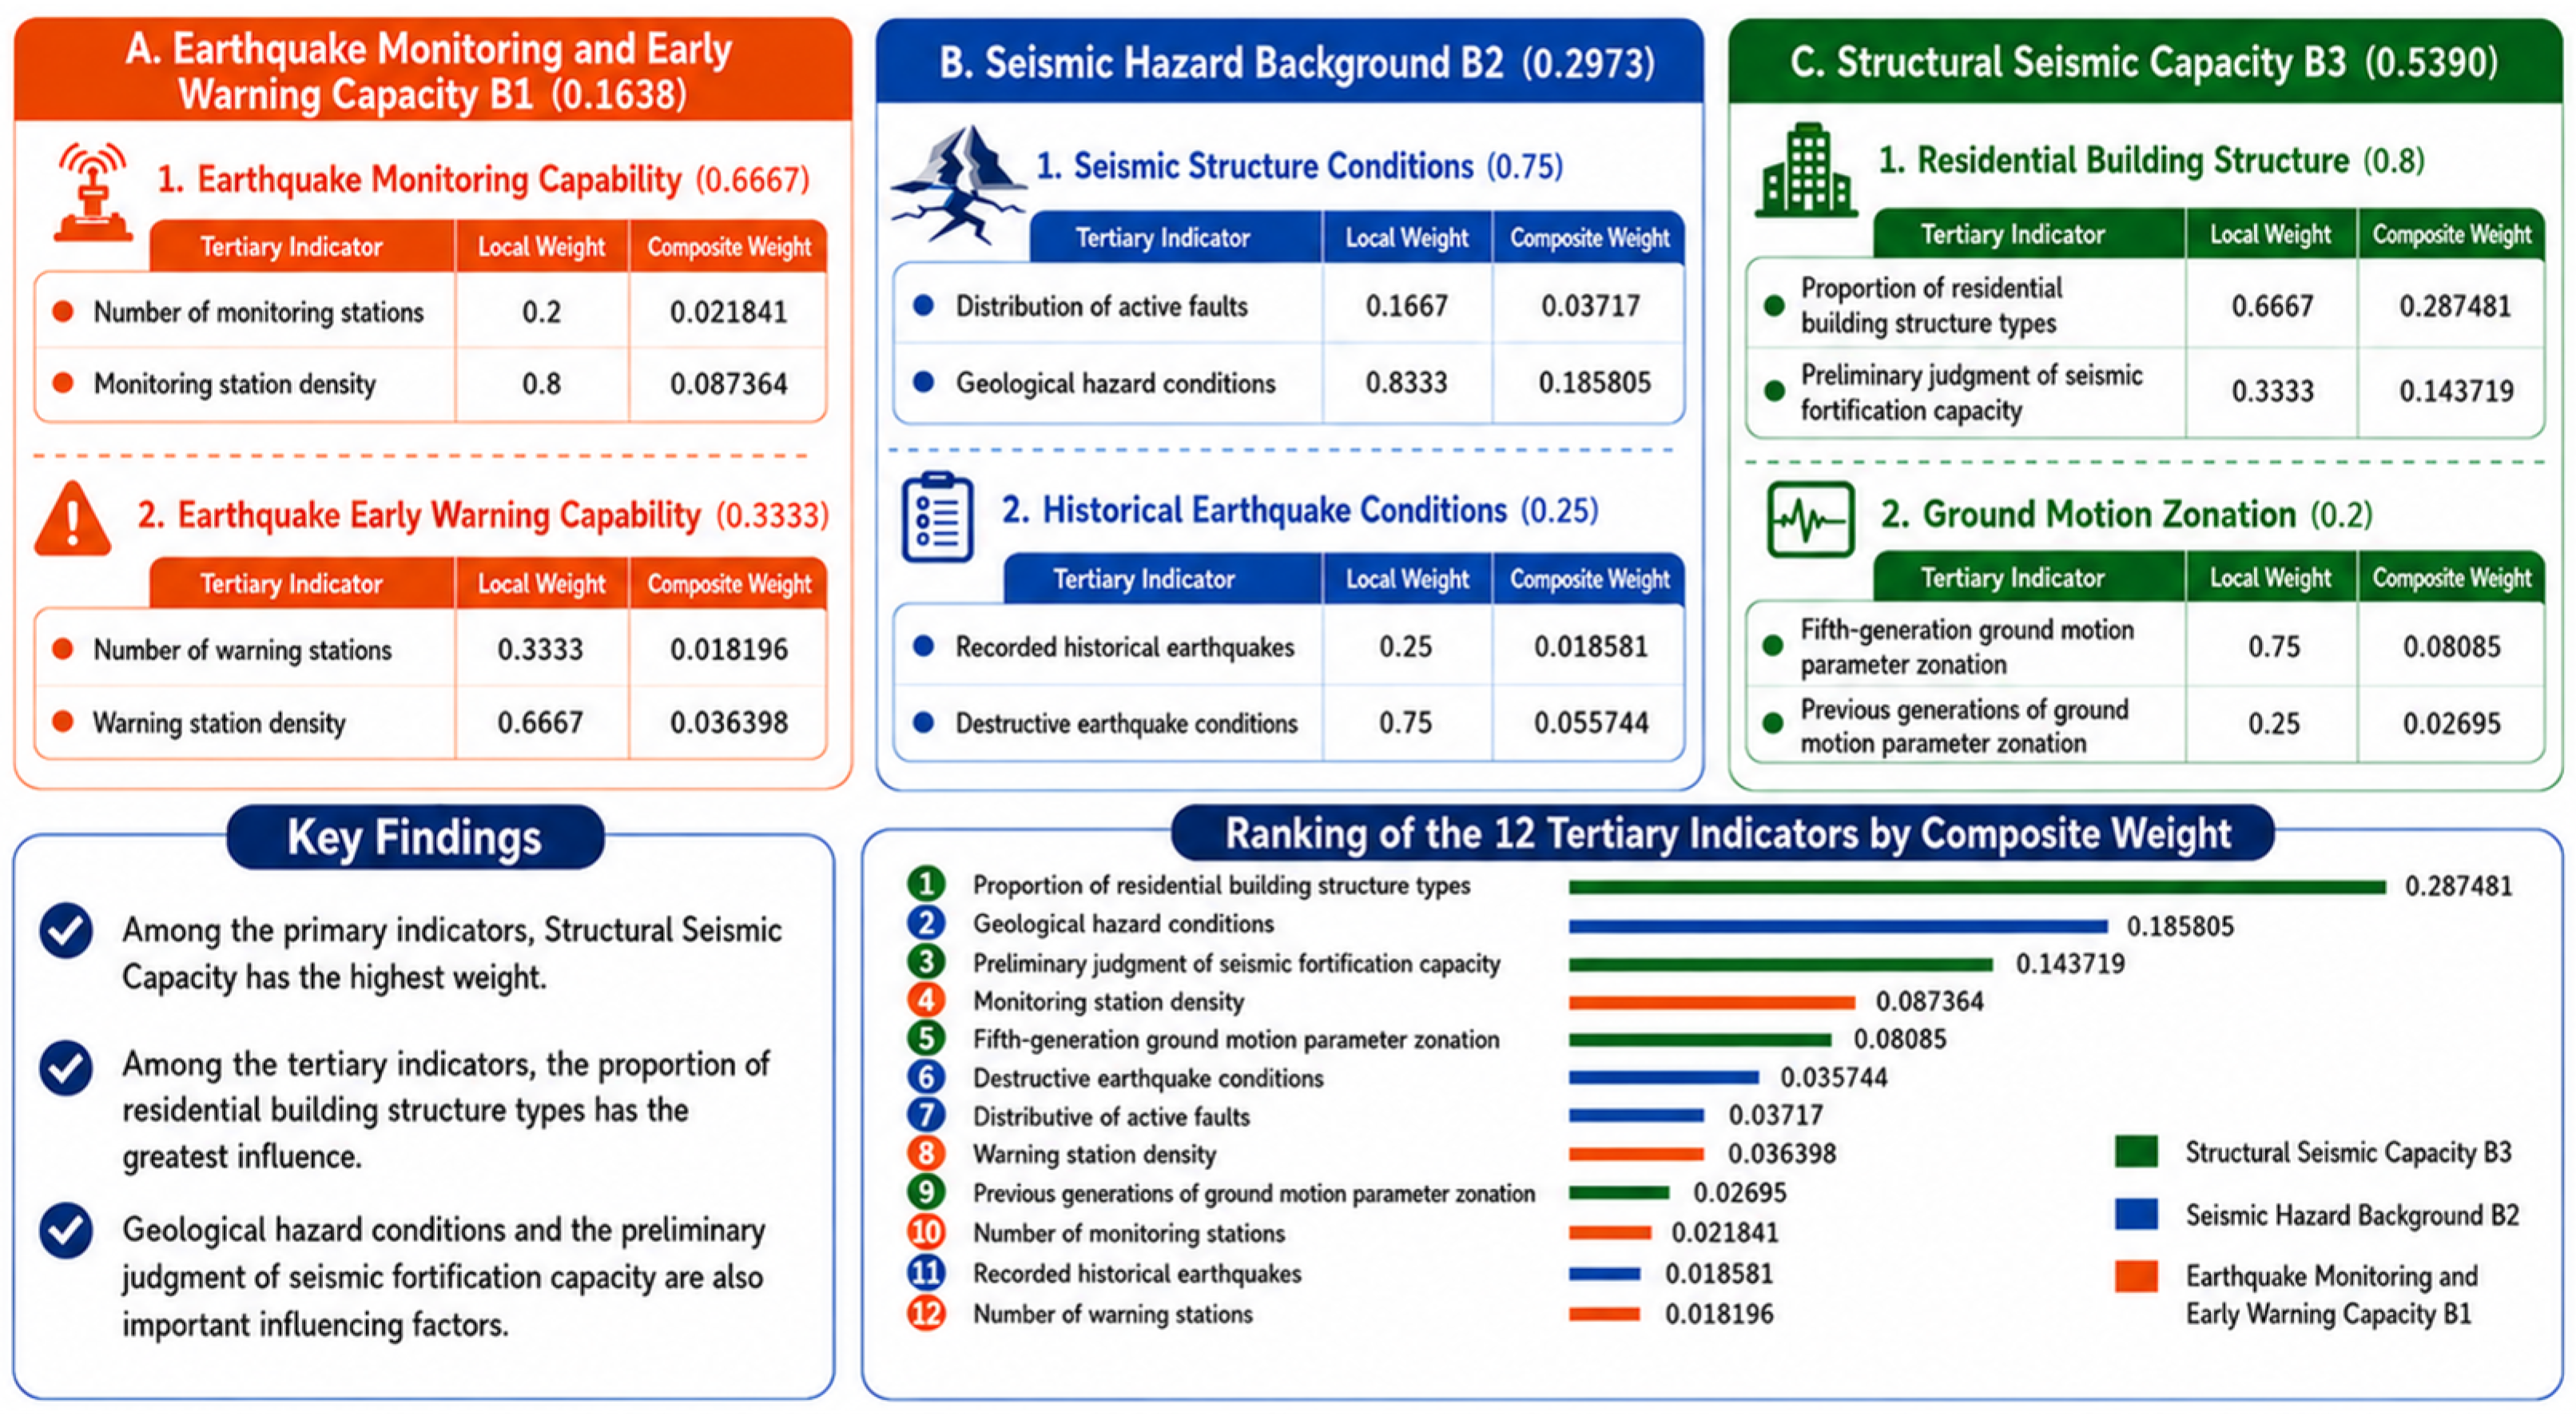
For the primary-indicator judgment matrix, the maximum eigenvalue was 3.0092, and the corresponding consistency index (CI) and consistency ratio (CR) were 0.0046 and 0.0079, respectively. Since the CR value was less than 0.10, the judgment matrix satisfied the consistency requirement. The weights of Earthquake Monitoring and Early-Warning Capacity (B1), Seismic Hazard Background (B2), and Structural Seismic Capacity of Residential Buildings (B3) were calculated as 0.1638, 0.2973, and 0.5390, respectively. The local weights and global weights of all secondary and tertiary indicators were calculated using the same eigenvector method, and only the final weights are reported in the main text for conciseness. The final weights of all indicators are shown in Figure 1.

3. Calculation of Seismic Resilience of Residential Buildings

3.1. Acquisition and Organization of Evaluation Indicator Data

Based on the six secondary indicators in Figure 1 (Earthquake Monitoring Capability, Earthquake Early-Warning Capability, Seismic Structure Conditions, Historical Earthquake Conditions, Residential Building Structure, Ground Motion Zonation), this section introduces the data sources, processing methods, and preliminary ranking results for each indicator across the prefecture-level cities.

3.1.1. Earthquake Monitoring Capability

Data on earthquake monitoring capability were obtained from the “Annual Operation Report of Hebei Province Seismic Network (2022)” and the station database provided by the Monitoring and Forecasting Division of the Hebei Earthquake Agency and the Hebei Seismic Station. The data include the locations of reference stations, basic stations, and general stations across the province, instrument types, data return rates, and station spacing.
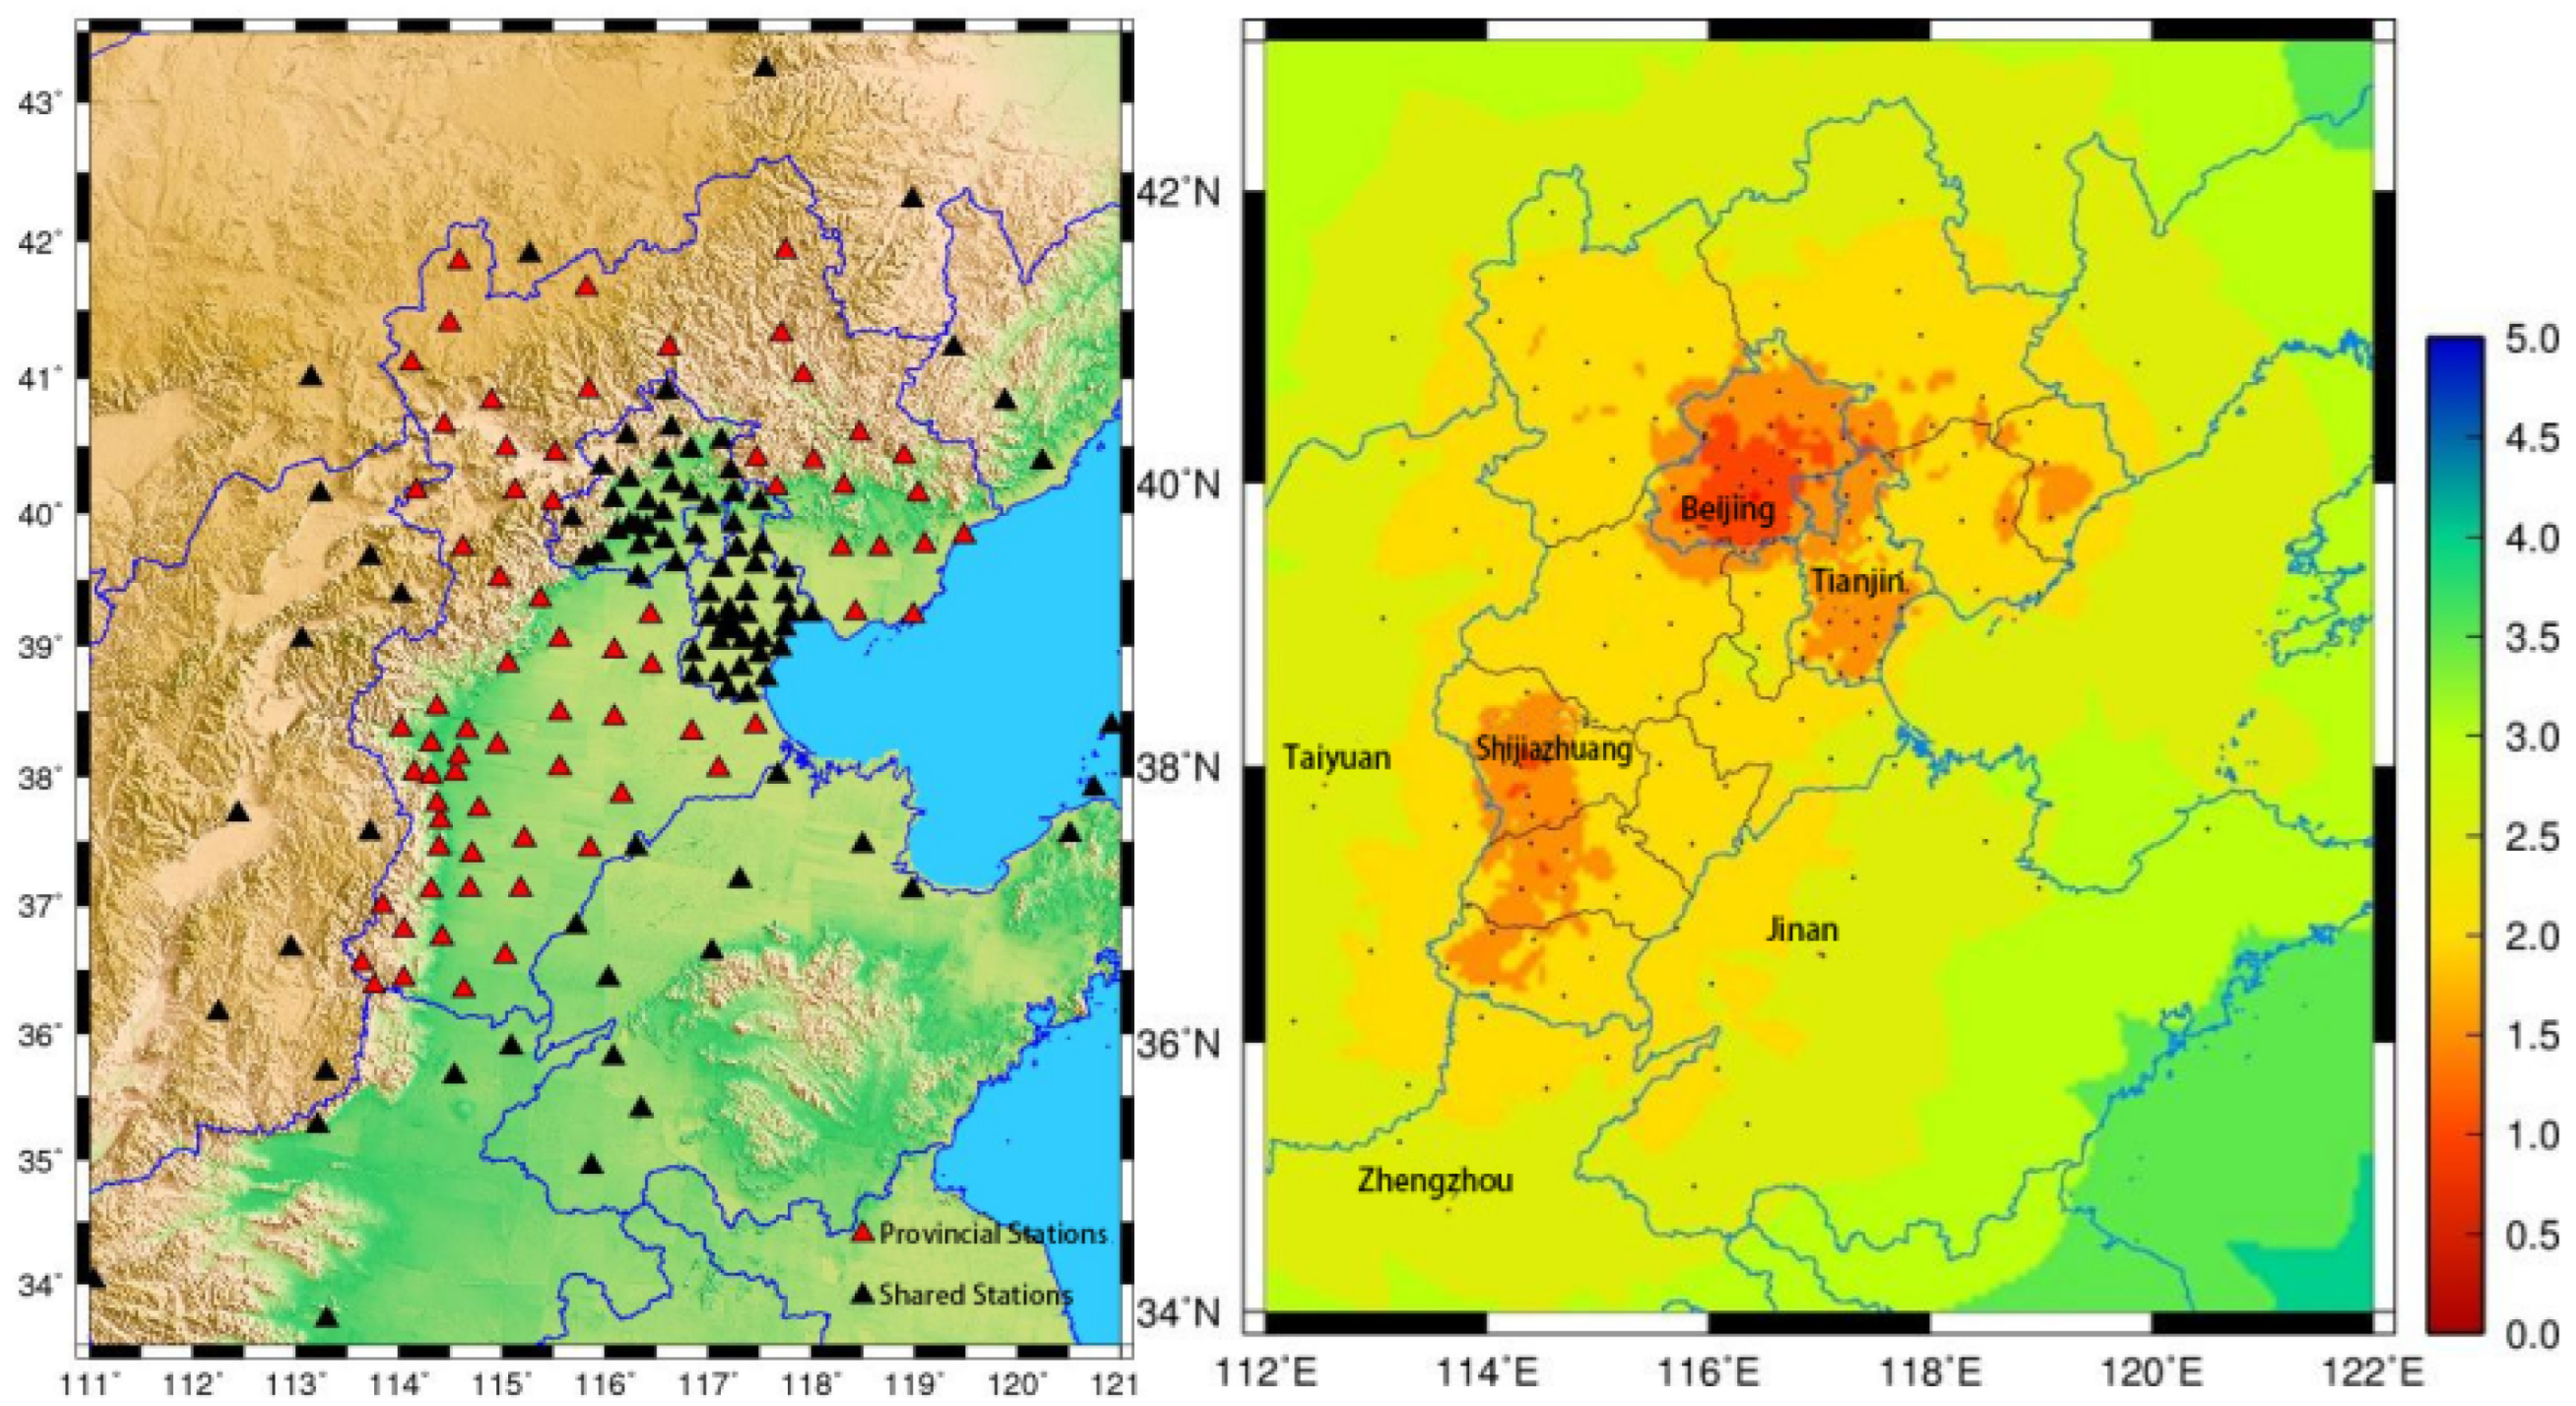
Hebei Province currently has 84 operational seismometric stations, 250 strong-motion stations, 975 intensity stations, and 49 geophysical stations. A digital earthquake monitoring network has been preliminarily established, encompassing disciplines such as seismological observation, geophysics, geochemistry, and geodesy, characterized by a reasonably rational spatial layout and standardized management [10]. By counting the total number of various stations within each city’s administrative area and calculating station density (stations per thousand square kilometers), and based on the spatial distribution of stations, a heat map of earthquake monitoring capability for the province was generated using the point density analysis tool in ArcGIS 10.8 (Figure 2). Referring to relevant standards, areas with station spacing less than 12 km are classified as “strong monitoring capability,” 12–20 km as “moderate,” and greater than 20 km as “weak.”
The results show that Shijiazhuang, Tangshan, and Qinhuangdao have the highest station densities, with average station spacings of 9.7, 9.1, and 8.8 km, respectively, and therefore rank among the top three cities in terms of earthquake monitoring capability. Hengshui, Langfang, and Cangzhou have relatively weak monitoring capability due to sparse station distribution (average station spacing in Hengshui: 12.9 km).
The results show that Shijiazhuang, Tangshan, and Qinhuangdao have the highest station densities (average station spacing: 9.7 km in Shijiazhuang, 9.1 km in Tangshan, 8.8 km in Qinhuangdao), ranking top three in monitoring capability. Hengshui, Langfang, and Cangzhou have relatively weak monitoring capability due to sparse station distribution (average station spacing in Hengshui: 12.9 km).

3.1.2. Earthquake Warning Capability

Data on earthquake early-warning capability were derived from the completion and acceptance report (2023) of the National Seismic Intensity Rapid Reporting and Early-Warning Project (Hebei sub-project) and the technical scheme accompanying the Hebei Earthquake Early-Warning Management Measures. The data include the locations of 1251 early-warning stations (83 reference stations, 193 basic stations, 975 general stations) across the province, communication latency, and first-report time.
Capability was assessed by calculating the density of early-warning stations in each city and the average theoretical first-report time (time from P-wave triggering to early-warning information release). A grid testing method (0.05° × 0.05°) was used to simulate the first-report time for an earthquake occurring in each grid, and the average for each city was calculated. Shorter first-report times and higher station density indicate stronger early-warning capability. Recent studies have also shown that earthquake early-warning and prediction models can improve the seismic resilience of regional buildings by supporting more targeted emergency response and risk-reduction actions [11]. Based on these results, Shijiazhuang, Tangshan, and Qinhuangdao ranked among the top three cities in terms of earthquake early-warning capacity because of their high station densities and relatively short first-report times of 5–6 s. Baoding and Xingtai occupied intermediate positions, whereas Hengshui, Langfang, and Cangzhou ranked relatively low, with first-report times exceeding 8 s.

3.1.3. Seismic Structure Conditions

Data sources include the “1:250,000 Active Fault Distribution Map of Hebei Province” (2020 Edition) from the Institute of Geology, China Earthquake Administration, and the “Geological Hazard Risk Survey and Assessment Report (2021)” from the Hebei Provincial Department of Natural Resources. The data cover the location, length, and latest active age of active faults (Holocene, Late Pleistocene, Early Middle Pleistocene), and the distribution of geological hazard points such as collapses, landslides, and debris flows [12].
Using ArcGIS spatial overlay analysis, the total length of active faults (km) within each city’s territory and the density of geological hazard points (points per thousand square kilometers) were calculated. Structural stability was classified into three categories: Class I (no active faults since the Late Pleistocene, few geological hazard points), Class II (a few Early-Middle Pleistocene faults, moderate geological hazard points), Class III (active faults since the Late Pleistocene, many geological hazard points). Cities were ranked based on their category and quantitative score (higher scores indicate worse structural conditions, reflected in a larger ranking number).
Hengshui City has only pre-Quaternary faults and very few geological hazard points, representing the best structural conditions, ranking first. Chengde City, despite having faults, mostly Early-Middle Pleistocene ones with low geological hazard point density, ranks second. Tangshan and Zhangjiakou have multiple Holocene active faults (Tangshan Fault, Zhangjiakou Fault) and dense geological hazard points, representing the worst structural conditions, ranking 10th and 11th respectively.

3.1.4. Historical Earthquake Conditions

Data for historical earthquake conditions were obtained from the “Catalog of Chinese Historical Earthquakes” (23rd century BC-2010 AD), the “Earthquake History of Hebei Province,” and the earthquake catalog of the China Earthquake Networks Center since 1970. The selection criteria were: destructive earthquakes with M ≥ 4.7, with epicenters located within each city’s administrative boundary or within 20 km outside the boundary [13].
The total number of historical destructive earthquakes (M ≥ 4.7) and the number of strong earthquakes (M ≥ 6.0) were counted for each city. Cities with fewer total destructive earthquakes and no recorded M ≥ 6.0 earthquakes have lower historical earthquake risk, ranking higher (a smaller rank number indicates lower risk). Chengde City has no recorded destructive earthquakes with M ≥ 4.7. Hengshui City ranks second, having only one M ≥ 6.0 earthquake (Shenxian M 6.0 in 1882). Tangshan City recorded 51 destructive earthquakes due to the 1976 M 7.8 earthquake sequence, and Xingtai City experienced high historical earthquake frequency due to the 1966 M 7.2 earthquake sequence, ranking 11th and 10th, respectively.

3.1.5. Residential Building Structure

Data for the type of residential building structure originated from the “First National Comprehensive Natural Disaster Risk Census (Hebei Province Building and Facility Survey Dataset, 2021).” This dataset covers structural type, floor area, construction year, and fortification status information for approximately 20.02 million buildings across 167 counties (districts) in the province.
Summarized by administrative region, the proportion of floor area for reinforced–concrete structures, brick–concrete structures, brick–timber structures, and earth–wood/other structures in each city was calculated. In this study, the “proportion of floor area” refers to the ratio of the total floor area of a specific residential building structural type to the total residential building floor area in the corresponding city, rather than the proportion of the number of buildings. It was calculated as follows:
P i , k = A i , k K = 1 4 A i , k × 100 %
where P i , k denotes the floor-area proportion of the k -th structural type in the i -th city, and A i , k denotes the total floor area of this structural type. The four structural types considered in this study include reinforced–concrete structures, brick–concrete structures, brick–timber structures, and earth–wood/other structures.
In this study, the combined floor-area proportion of reinforced–concrete and brick–concrete structures was used as a proxy indicator of relatively better seismic performance at the regional statistical level. This does not imply that all reinforced–concrete or brick–concrete buildings have adequate seismic capacity. Rather, compared with brick–timber, earth–wood, and other vulnerable structures, reinforced–concrete and brick–concrete structures generally exhibit better structural integrity and are more likely to satisfy basic seismic design requirements. Therefore, this indicator was used to reflect the relative structural seismic capacity of the residential building stock in each city.
S i = P i , R C + P i , B C
where S i denotes the proxy indicator of relatively better structural seismic performance in the i -th city, and P i , R C and P i , B C denote the floor-area proportions of reinforced–concrete and brick–concrete structures, respectively. The floor-area proportions of the four residential building structural types in each city are summarized in Table 3.
Based on Table 3, the combined floor-area proportion of reinforced–concrete and brick–concrete residential buildings was calculated as a proxy indicator of relatively better structural seismic performance at the regional statistical level. The results show that Shijiazhuang has the highest combined proportion of reinforced–concrete and brick–concrete structures, reaching 78.01%, followed by Baoding (64.70%), Qinhuangdao (62.00%), Handan (59.10%), and Tangshan (56.20%). These cities generally have a larger proportion of residential building floor area associated with structural types that are more likely to satisfy basic seismic design requirements.
In contrast, Hengshui (30.10%), Langfang (30.50%), and Cangzhou (33.90%) have relatively low combined proportions of reinforced–concrete and brick–concrete residential buildings, indicating that vulnerable structural types such as brick–timber, earth–wood, and other structures still account for a large proportion of the residential building stock. Therefore, these cities should be given priority in subsequent seismic capacity investigation, appraisal, and retrofitting planning.
To reduce the uncertainty associated with the structural-type proxy indicator, the preliminary seismic capacity judgment based on remote sensing interpretation, empirical estimation, and field sampling surveys was further used to correct and supplement the assessment of residential building seismic capacity. The remote sensing interpretation identified a total of 20,026,970 buildings, processed remote sensing images covering an area of 188,000 km2, and produced 14 preliminary seismic capacity assessment maps for cities (including Dingzhou and Xinji) and Xiong’an New Area, and 169 maps at the county level. Field sampling surveys were conducted on 661,852 buildings, with a sampling rate of 35.2‰, The corresponding workload statistics for the preliminary assessment of building seismic capacity are summarized in Table 4.

3.1.6. Ground Motion Parameter Zonation

Data for the zonation of ground motion parameters were obtained from the “Ground Motion Parameter Zonation Map of China” (GB18306-2015) [14] and its implementation documents for Hebei Province, as well as the design basic acceleration of ground motion and seismic design grouping for each county (city, district) published by the Hebei Earthquake Agency.
According to the correspondence between the design basic acceleration of ground motion and seismic precautionary intensity specified in the Chinese seismic design standards, the design basic acceleration values were converted into seismic precautionary intensities. The conversion relationship used in this study is shown in Table 5.
Based on the conversion relationship shown in Table 5, the design basic acceleration values of ground motion for counties and districts in each prefecture-level city were converted into the corresponding seismic precautionary intensities. The area proportions of Intensity VI, VII, and VIII zones within each city were then calculated. To quantify the relative ground motion hazard level, scores of 1, 2, and 3 were assigned to Intensity VI, VII, and VIII zones, respectively, and a ground motion risk index was obtained by multiplying the area proportion of each intensity zone by its corresponding score. A higher index indicates a higher seismic fortification requirement and a higher regional seismic hazard level. In the comprehensive evaluation, this indicator was transformed into the same positive direction as the other indicators, where a lower ground motion risk index corresponds to better seismic resilience performance [15].
A higher ground motion risk index indicates a higher seismic fortification requirement and a higher regional seismic hazard level. To ensure consistency with the other indicators in the comprehensive evaluation, the ground motion zonation indicator was transformed into a positive ranking direction, where one indicates the best resilience performance and 11 indicates the weakest performance. Therefore, cities with lower ground motion risk indices were assigned better ranks.
The analysis shows that most areas of Chengde City are located in the Intensity VI zone, corresponding to the lowest ground motion risk index; therefore, Chengde ranks first for this indicator. In contrast, Tangshan City contains extensive Intensity VIII zones, resulting in the highest ground motion risk index; therefore, Tangshan ranks 11th for this indicator.

3.2. Calculation Method and Results

Based on the data statistics and the literature surveys described above, the secondary indicators for each city have been ranked. According to the weights of the secondary indicators, the comprehensive weight of each secondary indicator was calculated, followed by the calculation of the comprehensive seismic resilience score for residential buildings in each city.
Let w m denote the comprehensive weight of the m -th secondary indicator, and let R j m denote the rank or normalized score of the j -th city under the m -th secondary indicator. Since six secondary indicators were used in this study, the comprehensive seismic resilience score of each city was calculated as follows:
P j = m = 1 6 w m R j m
where P j represents the comprehensive score of the j -th city. A smaller value of P j indicates better comprehensive seismic resilience, because all indicator ranks were transformed into the same positive direction before aggregation. The summarized calculation yields the comprehensive ranking for each city (Table 6).
Sorting the cities in ascending order of their comprehensive rank (smaller number indicates higher resilience capacity) yields the final ranking for seismic resilience of residential buildings: 1. Shijiazhuang, 2. Qinhuangdao, 3. Baoding, 4. Chengde, 5. Handan, 6. Xingtai, 7. Tangshan, 8. Cangzhou, 9. Hengshui, 10. Zhangjiakou, 11. Langfang.

3.3. Discussion of City-Level Differences

The differences in the comprehensive ranking of the 11 cities are mainly related to the combined effects of residential building structure, seismic structure conditions, monitoring and early-warning capacity, historical earthquake activity, and ground motion zonation. Among these indicators, residential building structure has the largest weight, indicating that the structural composition and seismic fortification capacity of existing residential buildings play a dominant role in the final evaluation results. Shijiazhuang ranks first mainly because of its relatively high proportion of reinforced–concrete and brick–concrete residential buildings, together with relatively balanced performance in monitoring, early-warning, and seismic hazard-related indicators. Qinhuangdao also shows strong seismic resilience due to its advantages in earthquake monitoring and early-warning capacity. Baoding ranks highly because of its relatively favorable seismic structure conditions and low historical earthquake impact, despite its weaker monitoring and early-warning performance. In contrast, Hengshui, Zhangjiakou, and Langfang rank relatively low, mainly due to weaker monitoring and early-warning capacity and a lower proportion of residential buildings with good seismic performance. These results indicate that regional differences in residential building seismic resilience are not controlled by a single factor, but by the interaction of building structural capacity, regional seismic hazard background, and disaster prevention infrastructure. Therefore, the ranking differences are not determined by a single factor, but by the combined effect of structural seismic capacity, hazard background, and monitoring-warning capacity.

3.4. Validation and Sensitivity Analysis

To further examine the reliability and robustness of the proposed evaluation framework, validation and sensitivity analyses were conducted after obtaining the comprehensive ranking results. The validation was performed by comparing the evaluation results with the regional seismic hazard background, historical earthquake records, residential building structure characteristics, and monitoring-warning conditions of the 11 cities. The sensitivity analysis was used to examine whether changes in indicator weights would significantly affect the final ranking results.
First, the comprehensive ranking results were generally consistent with the regional characteristics of Hebei Province. Shijiazhuang, Qinhuangdao and Baoding ranked relatively high, mainly because they performed well in one or more high-weight indicators, such as residential building structure, seismic hazard background, and earthquake monitoring-warning capacity. In contrast, Hengshui, Zhangjiakou and Langfang ranked relatively low because they showed weaknesses in residential building structural composition and monitoring-warning capacity. These results indicate that the proposed evaluation framework can reasonably reflect the regional differences in residential building seismic resilience rather than relying on a single indicator.
Second, a weight perturbation analysis was carried out to evaluate the robustness of the AHP-based weighting scheme. The weights of the three primary indicators, namely earthquake monitoring and early-warning capacity, seismic hazard background, and structural seismic capacity, were perturbed by ±10% and ±20%, respectively. As shown in Table 7, when the weight of one primary indicator was changed, the remaining weights were proportionally normalized to ensure that the total weight remained equal to one. The comprehensive scores and rankings were then recalculated under each scenario. Spearman’s rank correlation coefficient was used to measure the consistency between the original ranking and the perturbed rankings.
It should be noted that the validation in this study is a regional-scale consistency check rather than a building-level seismic performance verification. More detailed validation using post-earthquake damage data, field appraisal results, or nonlinear structural analysis can be further conducted when such data become available.

4. Countermeasures and Suggestions

Improving the seismic resilience of residential buildings requires coordinated actions involving seismic risk assessment, building appraisal and retrofitting, monitoring and early-warning systems, emergency preparedness, and long-term disaster risk governance. Based on the evaluation results, the following recommendations are proposed to address the major weaknesses identified across the 11 cities [16]. Based on this, the following suggestions and countermeasures are proposed for the entire process of residential building engineering:
To make the proposed countermeasures more closely linked to the revised evaluation results, the 11 cities were further analyzed according to their dominant weaknesses in the comprehensive assessment. The targeted measures were proposed by considering the main controlling indicators, including residential building structure, seismic hazard background, ground motion zonation, and earthquake monitoring and early-warning capacity. The city-specific weaknesses and corresponding improvement measures are summarized in Table 8.
These targeted measures indicate that seismic resilience improvement should not rely on a uniform strategy for all cities. Cities with weak structural seismic capacity should prioritize the appraisal and retrofitting of vulnerable buildings, while cities with unfavorable seismic hazard backgrounds should strengthen hazard surveys and emergency response capacity. For cities with relatively good comprehensive performance, continuous monitoring, data updating, and preventive retrofitting of aging residential communities remain necessary.

4.1. General Recommendations for Improving Residential Building Seismic Resilience

First, continue to innovate in building construction to enhance the seismic capacity of building engineering. Improve the seismic capacity of buildings through technological and material innovations. Strengthen inspections of seismic design and construction compliance in construction projects. Promote building isolation and energy-dissipation technologies, continuously improve the seismic performance of buildings [17,18], and steadily advance the progress and popularization of seismic isolation and energy-dissipation technologies [19,20].
Second, continue to carry out seismic hazard risk surveys and pre-assessment work. Pre-assessment is a crucial task in seismic hazard risk assessment [17]. Strengthen work on earthquake disaster loss pre-assessment, continuously conduct seismic hazard risk investigations and key hazard investigations, identify seismic sources and disaster risk sources, and improve the pre-assessment basic database. Optimize the earthquake emergency information service platform to achieve visualization of rapid earthquake disaster assessment, emergency response decision support, and emergency handling procedures, gradually forming a systematic, scientifically standardized, and operationally effective pre-assessment operational work system, providing strong support for local governments in earthquake disaster risk prevention and response.
Third, complete the preliminary judgment of regional building seismic capacity based on remote sensing imagery and empirical estimation, providing decision-making support for local governments. Thoroughly check and fill gaps in regional building information, striving for complete collection of necessary data with high accuracy. Continue assessment work to produce preliminary maps of building seismic capacity in seismically prone areas.
Fourth, actively promote building retrofitting projects in seismically prone areas. Fully utilize the replicable and scalable working mechanisms and experiences developed from retrofitting projects in seismic fortification Intensity VIII zones. Comprehensively promote the implementation of seismic retrofitting projects in seismic fortification Intensity VII zones within seismically prone areas to eliminate safety risks in building facilities.
Fifth, strengthen earthquake monitoring, prediction, and early-warning management. Improve the integrated observation system, form a modern comprehensive earthquake monitoring system, and enhance monitoring quality. Continuously optimize earthquake prediction services, strengthen earthquake situation monitoring, tracking, and joint consultations, further enhancing the scientific level of earthquake situation assessment.
Sixth, continuously improve the working mechanism for earthquake prevention and disaster reduction. In line with the principle of “hierarchical responsibility and territorial management,” encourage local governments to play their main role, integrate seismic resilience work into their economic and social development plans, and ensure the implementation of seismic resilience responsibilities. Coordinate ‘prevention’ and ‘response’, further improve the governance system for earthquake prevention and disaster reduction, integrate earthquake administrative law enforcement into comprehensive emergency management law enforcement, improve law enforcement efficiency, and improve supporting policies for the modernization of earthquake prevention and disaster reduction capabilities. Improve the development and investment mechanism, ensure funding support, utilize key projects such as the Catastrophe Prevention Project to stabilize the professional earthquake workforce, and enhance the level of basic earthquake research.

4.2. Limitations and Generalizability

The proposed framework is suitable for regional-scale preliminary assessment rather than detailed building-level seismic diagnosis. Several limitations should be acknowledged. First, city-level aggregation may mask intra-city differences among districts, communities, and building groups. Second, the structural seismic capacity indicator is partly based on structural-type proportions and preliminary remote sensing interpretation, which cannot replace detailed field appraisal or nonlinear structural analysis. Third, AHP weights inevitably contain expert judgment uncertainty, although consistency checks and sensitivity analysis were introduced to reduce this effect. Fourth, the framework depends on the availability and update frequency of monitoring, building inventory, seismic hazard, and ground motion data.
The methodology can be applied to other provinces or countries after recalibrating the indicator weights, data sources, and classification thresholds according to local seismicity, building stock characteristics, monitoring network conditions, and regulatory requirements.

5. Conclusions

Structural seismic capacity is the dominant factor affecting the seismic resilience of residential buildings, followed by seismic hazard background and earthquake monitoring and early-warning capacity. Shijiazhuang, Qinhuangdao, and Baoding exhibit relatively high resilience, whereas Hengshui, Zhangjiakou, and Langfang show comparatively weak performance. The proposed framework contributes a practical regional-scale approach that identifies both overall resilience differences and city-specific weaknesses, thereby supporting differentiated retrofitting priorities, monitoring and early-warning resource allocation, and regional seismic-risk management.
The study is limited by city-level data aggregation, the use of structural-type proxies, and uncertainty in expert-based weights. Future research should incorporate building-level seismic appraisal, post-earthquake damage data, nonlinear structural analysis, finer spatial units, and cross-regional validation.

Author Contributions

Conceptualization, Y.Z. and H.Y.; methodology, Y.Z. and B.F.; software, H.Z.; validation, H.Z.; formal analysis, Y.Z.; investigation, H.Z.; data curation, H.Z. and B.F.; writing—original draft preparation, Y.Z.; writing—review and editing, B.F. and H.Y.; visualization, Y.Z.; supervision, H.Y. All authors have read and agreed to the published version of the manuscript.

Funding

This research received no external funding.

Data Availability Statement

Due to privacy restrictions, the data cannot be made public. The data presented in this study are available on request from the corresponding author.

Conflicts of Interest

The authors declare no conflicts of interest.

References

  1. Zhai, L.; Lee, J. Analyzing the disaster preparedness capacity of local government using AHP: Zhengzhou 7.20 rainstorm disaster. Int. J. Environ. Res. Public Health 2023, 20, 952. [Google Scholar] [CrossRef] [Scilit] [PubMed]
  2. Du, A.; Wang, X.; Xie, Y.; Dong, Y. Regional seismic risk and resilience assessment: Methodological development, applicability, and future research needs—An earthquake engineering perspective. Reliab. Eng. Syst. Saf. 2023, 233, 109104. [Google Scholar] [CrossRef] [Scilit]
  3. Cao, X.Y.; Shen, D.; Feng, D.C.; Wang, C.-L.; Qu, Z.; Wu, G. Seismic retrofitting of existing frame buildings through externally attached sub-structures: State of the art review and future perspectives. J. Build. Eng. 2022, 57, 104904. [Google Scholar] [CrossRef] [Scilit]
  4. Valente, M. Seismic Protection of R/C Structures by a New Dissipative Bracing System. Procedia Eng. 2013, 54, 785–794. [Google Scholar] [CrossRef] [Scilit]
  5. Valente, M. Seismic Upgrading Strategies for Non-Ductile Plan-Wise Irregular R/C Structures. Procedia Eng. 2013, 54, 539–553. [Google Scholar] [CrossRef] [Scilit]
  6. Panahi, M.; Rezaie, F.; Meshkani, S. Seismic vulnerability assessment of school buildings in Tehran city based on AHP and GIS. Nat. Hazards Earth Syst. Sci. 2013, 1, 4511–4538. [Google Scholar]
  7. Fabbrocino, F.; Olivieri, C.; Luciano, R.; Vaiano, G.; Maddaloni, G.; Iannuzzo, A. Seismic performance of historic masonry buildings: A comparative analysis of equivalent frame and block-based methods. Alex. Eng. J. 2024, 109, 359–375. [Google Scholar] [CrossRef] [Scilit]
  8. Andreolli, F.; Bragolusi, P.; D’Alpaos, C.; Faleschini, F.; Zanini, M.A. An AHP model for multiple-criteria prioritization of seismic retrofit solutions in gravity-designed industrial buildings. J. Build. Eng. 2022, 45, 103493. [Google Scholar] [CrossRef] [Scilit]
  9. Fiore, P.; Donnarumma, G.; Falce, C.; D’andria, E.; Sicignano, C. An AHP-based methodology for decision support in integrated interventions in school buildings. Sustainability 2020, 12, 10181. [Google Scholar] [CrossRef] [Scilit]
  10. Mu, L.; Zheng, Y. Research on monitoring ability of the digital seismic networks in the capital area. Earthq. Res. China 2016, 32, 134–142. [Google Scholar]
  11. Wang, H.; Xu, L.; Xie, X.; Zhang, G. Improvement of the seismic resilience of regional buildings: A multi-objective prediction model for earthquake early warning. Soil Dyn. Earthq. Eng. 2024, 179, 108545. [Google Scholar] [CrossRef] [Scilit]
  12. Liu, J.; Liu, Z.; Liu, L.; Liu, X.; Ma, X. Classification of rural buildings in Zhangjiakou area based on remote sensing images. North China Earthq. Sci. 2019, 37, 65–72. [Google Scholar]
  13. Zoheb, N.M.; Mohan, S.C.; Kalyana Rama, J.S. Development of low-cost base isolation technique using multi-criteria optimization and its application to masonry building. Soil Dyn. Earthq. Eng. 2023, 172, 108024. [Google Scholar] [CrossRef] [Scilit]
  14. GB 18306-2015; Seismic Ground Motion Parameters Zonation Map of China. China National Standardization Administration Committee: Beijing, China, 2015.
  15. Zhang, M.; Li, Y.; Hou, C. Evaluation and classification of earthquake prevention and disaster reduction capacity in central urban area of megacities: A case study of Tianjin. South China J. Seismol. 2025, 45, 155–162. [Google Scholar]
  16. Shaikh, S.; Brown, A.; Enegbuma, W.I. The role of disaster knowledge management in improving housing reconstruction outcomes: With particular reference to postearthquake reconstruction in Pakistan. Int. J. Disaster Resil. Built Environ. 2023, 14, 314–331. [Google Scholar] [CrossRef] [Scilit]
  17. Sawaneh, I.A.; Fan, L. The mediating role of disaster policy implementation in disaster risk reduction and sustainable development in Sierra Leone. Sustainability 2021, 13, 2112. [Google Scholar] [CrossRef] [Scilit]
  18. Xu, G.; Guo, T.; Li, A.; Zhang, H.; Wang, K.; Xu, J.; Dang, L. Seismic resilience enhancement for building structures: A comprehensive review and outlook. Structures 2024, 59, 105738. [Google Scholar] [CrossRef] [Scilit]
  19. Hou, C.; Ma, G.; Hwang, H.J.; Li, S.; Kang, S.-M. Seismic retrofit of intact and damaged RC columns using prefabricated steel cage-reinforced UHPC jackets and NSM GFRP bars. Eng. Struct. 2024, 317, 118665. [Google Scholar] [CrossRef] [Scilit]
  20. Naeem, A.; Koichi, K.; Lee, J. Seismic Performance Evaluation of Reinforced Concrete Building Structure Retrofitted with Self-Centering Disc-Slit Damper and Conventional Steel Slit Damper. Buildings 2024, 14, 795. [Google Scholar] [CrossRef] [Scilit]
Figure 1. Weights of indicators for seismic resilience of residential buildings.
Buildings 16 02976 g001
Figure 2. Distribution of seismic stations and earthquake monitoring capability in Hebei Province.
Buildings 16 02976 g002
Table 1. Evaluation indicator system for seismic resilience of residential buildings.
Primary IndicatorSecondary IndicatorTertiary IndicatorIndicator Explanation
Earthquake Monitoring and Early-Warning Capacity B1Earthquake Monitoring CapabilityNumber of Monitoring StationsEarthquake monitoring capability refers to the comprehensive level of measuring and recording ground motion during earthquakes and the seismic response motion of important large-scale structures and equipment.
Monitoring Station Density
Earthquake Warning CapabilityNumber of Warning StationsEarthquake warning refers to using initial seismic wave information detected by densely deployed seismic observation stations near the source after an earthquake occurs to quickly estimate earthquake parameters and predict the impact of earthquake disasters on surrounding areas.
Warning Station Density
Seismic Hazard Background B2Seismic Structure ConditionsDistribution of Active FaultsGeological structure significantly influences the seismic resilience performance of buildings. Building structures in different geological structure areas exhibit significantly different seismic damage patterns when subjected to earthquakes.
Geological Hazard Conditions
Historical Earthquake ConditionsRecorded Historical EarthquakesHebei Province and its adjacent provinces and cities are located in the North China seismic zone, which has the highest intensity and frequency of earthquakes in eastern China. Since historical records began, 276 destructive earthquakes have occurred in this area.
Destructive Earthquake Conditions
Structural Seismic Capacity B3Residential Building StructureProportion of Residential Building Structure TypesThe seismic capacity of residential buildings is the foundation for seismic design, appraisal, reinforcement, and risk assessment. It represents the ability of residential buildings in each region to resist earthquakes. Historical earthquake disasters have shown that building collapse or damage is a major cause of direct economic losses; the seismic capacity of different structural types of residential buildings is completely different.
Preliminary Judgment of Seismic Fortification Capacity
Ground Motion ZonationFifth-generation Ground Motion Parameter ZonationGround motion parameters are physical parameters measuring ground motion caused by earthquakes, including peak values, response spectra, duration, etc. These parameters are important bases for engineering seismic design.
Previous Generations of Ground Motion Parameter Zonation
Table 2. Pairwise judgment matrix for primary indicators.
Primary IndicatorB1B2B3
Earthquake Monitoring and Early-Warning Capacity B111/21/3
Seismic Hazard Background B2211/2
Structural Seismic Capacity B3321
Table 3. Floor-area proportions of different residential building structural types in each city.
CityReinforced–Concrete StructureBrick–Concrete StructureBrick–Timber StructureOther StructureTotal Floor Area (m2)
Shijiazhuang0.2370.54310.2020.018400,383,929.2
Tangshan0.2860.2760.4310.008251,223,200.4
Qinhuangdao0.3330.2870.3690.010106,366,351.7
Handan0.1950.3960.40.009332,553,606.1
Xingtai0.1530.3910.4340.023263,297,169.6
Baoding0.2290.4180.3340.019430,445,015.5
Zhangjiakou0.2380.1190.4610.182120,641,751.7
Chengde0.2560.1970.4410.10698,369,392.75
Cangzhou0.1270.2120.6160.043244,673,302.5
Hengshui0.0820.2190.6890.009158,564,905
Langfang0.1910.1140.6910.003158,932,008.7
Table 4. Statistical summary of preliminary judgment workload for seismic fortification capacity of buildings by city.
CityNumber of Buildings IdentifiedImage Area (km2)Adequate Seismic Capacity Suspected Insufficient Seismic CapacitySuspected Severely Insufficient Seismic Capacity
Shijiazhuang3,060,41614,886.1243,36835,1882,981,860
Chengde1,077,52842,044.4623,59046,2101,007,728
Zhangjiakou1,428,96835,384.859,19380,5781,289,197
Qinhuangdao1,264,3147977.8236,18424,7961,203,334
Tangshan5,580,18613,472121,30422,4615,436,421
Langfang1,516,070648266,61465,9201,383,536
Baoding4,058,61621,31084,524114,1763,859,916
Cangzhou2,819,97513,41930,28058,6572,731,038
Hengshui2,009,636881541,98171,8881,895,767
Xingtai5,365,58212,40070,104691,7024,603,776
Handan2,982,95412,073.860,191212,4202,710,343
Table 5. Conversion relationship between design basic acceleration and seismic precautionary intensity.
Design Basic Acceleration of Ground MotionCorresponding Seismic Precautionary Intensity
0.05 gVI
0.10 g, 0.15 gVII
0.20 g, 0.30 gVIII
0.40 gIX
Table 6. Indicator-oriented ranks and weighted comprehensive scores for seismic resilience of residential buildings in 11 prefecture-level cities of Hebei Province.
Indicator WeightEarthquake Monitoring Capability
0.109
Earthquake Early-Warning Capability
0.055
Seismic Structure Conditions
0.223
Historical Earthquake Conditions
0.074
Residential Building Structure
0.431
Ground Motion Zonation
0.108
Comprehensive Score
Shijiazhuang1138172.612
Tangshan2210115116.715
Qinhuangdao3356323.56
Handan4675485.285
Xingtai55610666.132
Baoding64842104.896
Zhangjiakou77119898.687
Chengde8821714.957
Cangzhou9943957.009
Langfang1010971048.907
Hengshui1111121167.564
Note: All indicator ranks were transformed into the same positive direction before aggregation, where 1 indicates the best performance, and 11 indicates the weakest performance. The comprehensive score P j was calculated using Equation (2), and a smaller P j indicates higher comprehensive seismic resilience.
Table 7. Sensitivity analysis results under primary-indicator weight perturbation.
Perturbed IndicatorPerturbation RangeSpearman’s Rank Correlation CoefficientMaximum Rank ChangeMain Observation
Earthquake monitoring and early-warning capacity±10%, ±20%0.991–1.0000–1The ranking was highly stable, with only minor changes among middle-ranked cities.
Seismic hazard background±10%, ±20%0.973–1.0000–2The ranking was generally stable; changes mainly occurred among cities with close comprehensive scores.
Structural seismic capacity±10%, ±20%0.973–1.0000–2This indicator had a relatively stronger influence, but the top- and bottom-ranked cities remained generally stable.
Table 8. City-specific weaknesses and targeted improvement measures based on the evaluation results.
CityMain Weaknesses Identified from the EvaluationTargeted Improvement Measures
ShijiazhuangAlthough Shijiazhuang ranks first overall due to its strong earthquake monitoring and early-warning capacity and high proportion of reinforced–concrete and brick–concrete residential buildings, its historical earthquake condition and ground motion zonation are not the most favorable.Maintain the existing monitoring and early-warning advantages, strengthen regular seismic appraisal of old residential communities, and prioritize the retrofitting of older brick–concrete and masonry buildings in areas with relatively higher seismic fortification requirements.
QinhuangdaoQinhuangdao shows good comprehensive resilience, mainly due to its relatively high proportion of reinforced–concrete and brick–concrete residential buildings and balanced monitoring-warning capacity. However, some areas still have moderate seismic structure and historical earthquake risks. Continue to improve the building inventory database, conduct refined seismic appraisal of vulnerable residential buildings, and strengthen emergency response capacity in coastal and densely populated urban areas.
BaodingBaoding benefits from a relatively high proportion of reinforced–concrete and brick–concrete residential buildings, but its seismic structure conditions and ground motion zonation are relatively unfavorable. Strengthen geological hazard and active fault investigations, improve seismic appraisal of existing residential buildings in high-risk districts, and prioritize retrofitting in areas with higher ground motion parameters.
ChengdeChengde has favorable seismic structure conditions, low historical earthquake impact, and low ground motion risk, but its earthquake monitoring and early-warning capacity and residential building structure indicators are relatively weak. Increase the density of monitoring and early-warning stations, improve station coverage in mountainous areas, and carry out seismic appraisal and reinforcement of vulnerable residential buildings in counties with older building stocks.
HandanHandan shows a medium level of seismic resilience. Its indicators are generally moderate, but the residential building structure, seismic structure conditions, and ground motion zonation still limit its comprehensive performance.Promote systematic seismic appraisal of existing residential buildings, strengthen retrofitting of vulnerable brick–timber and old masonry buildings, and improve seismic risk management in areas with relatively high ground motion parameters.
XingtaiXingtai is affected by relatively unfavorable historical earthquake conditions and moderate residential building structural capacity. Its monitoring and early-warning capacity also needs further improvement. Strengthen seismic monitoring and early-warning infrastructure, conduct detailed investigation of old residential buildings, and prioritize retrofitting in areas affected by historical earthquake activity and vulnerable building stocks.
TangshanTangshan has strong monitoring and early-warning capacity and a relatively favorable residential building structure indicator, but its comprehensive ranking is reduced by unfavorable seismic structure conditions, high historical earthquake activity, and high ground motion risk. Focus on refined seismic risk zoning, strengthen the appraisal and retrofitting of existing buildings in high-intensity zones, improve resilience of old residential communities, and maintain high-standard monitoring and emergency response capacity.
CangzhouCangzhou has relatively favorable seismic structure and historical earthquake conditions, but its monitoring and early-warning capacity and residential building structure indicators are weak. Increase monitoring and early-warning station density, improve the seismic appraisal of residential buildings, and prioritize the retrofitting or replacement of brick–timber, earth–wood, and other vulnerable structures.
HengshuiHengshui performs well in seismic structure and historical earthquake conditions, but has weak monitoring and early-warning capacity and the lowest residential building structure indicator. Prioritize vulnerable building census and seismic appraisal, retrofit old and low-capacity residential buildings, and improve the spatial coverage of earthquake monitoring and early-warning stations.
ZhangjiakouZhangjiakou is mainly limited by unfavorable seismic structure conditions, relatively high ground motion risk, and insufficient residential building structural capacity in some areas. Strengthen active fault and geological hazard surveys, avoid new residential development in high-risk zones where possible, and prioritize seismic retrofitting of existing buildings near active faults and geological hazard-prone areas.
LangfangLangfang ranks lowest mainly because of weak monitoring and early-warning capacity, a low proportion of reinforced–concrete and brick–concrete residential buildings, and relatively unfavorable seismic structure conditions. Give priority to improving monitoring and early-warning infrastructure, conduct citywide seismic appraisal of vulnerable residential buildings, and implement targeted retrofitting programs for old masonry, brick–timber, and other low-capacity residential buildings.
Disclaimer/Publisher’s Note: The statements, opinions and data contained in all publications are solely those of the individual author(s) and contributor(s) and not of MDPI and/or the editor(s). MDPI and/or the editor(s) disclaim responsibility for any injury to people or property resulting from any ideas, methods, instructions or products referred to in the content.