Article

Experimental Calibration and Numerical Validation of Brick–Mortar Contact Stiffness for Detailed Micromodelling of Masonry: Evidence of Induced Normal Stresses Under Shear

by
David Cajamarca-Zuniga
1,* and
Oleg V. Kabantsev
2
1
Faculty of Engineering, Universidad Católica de Cuenca, Cuenca 010107, Ecuador
2
Directorate for Scientific and Technical Projects, Moscow State University of Civil Engineering (National Research University), Moscow 129337, Russia
*
Author to whom correspondence should be addressed.
Buildings 2026, 16(14), 2905; https://doi.org/10.3390/buildings16142905
Submission received: 1 June 2026 / Revised: 18 July 2026 / Accepted: 18 July 2026 / Published: 22 July 2026
(This article belongs to the Section Building Structures)

Abstract

The elastoplastic behaviour and failure of unreinforced masonry structures under biaxial loading are critically governed by the mechanical response of brick–mortar contact interfaces. Detailed finite element micromodelling explicitly resolves these elements, offering rigorous numerical representation; however, practical implementation requires the determination of contact stiffness parameters, for which no established experimentally calibrated expressions exist. This study presents an experimental-numerical calibration methodology integrating experimental characterisation of constituent materials and small-scale masonry specimens with numerical validation, using a concrete damaged plasticity model for quasi-brittle materials and traction-separation laws for interfaces, applied to a specific ceramic masonry system. The proposed methodology provides a practical and reproducible basis for experimental calibration of the contact stiffness parameters required in the detailed micromodelling of brick–mortar interfaces. Numerical simulations reproduce experimental behaviour, with peak load predictions within ±6% for normal and ±1% for shear loading. Detailed micromodelling reveals that normal stresses develop at interfaces even under nominally pure shear, evidencing coupled normal-tangential behaviour, the key role of normal adhesive contact strength, and the justification for the cohesive–frictional interface characterisation.

1. Introduction

Unreinforced masonry (URM) structures constitute a substantial proportion of the global building stock [1,2]. Studies on residential construction using masonry wall systems report that masonry accounts for 70% at the global level [3,4], 73% in Germany [5], 91% in Mexico [6], 95% in Ecuador [7,8], and 51% in India [9]. Their overall structural response is governed by the mechanical behaviour of their constituent elements (units, mortar joints, and their contact interfaces). Masonry is a composite building material with complex mechanical properties. Its constituent materials (brick and mortar) exhibit quasi-brittle, non-linear behaviour under both tensile and compressive stresses, where compressive behaviour is characterised by strength and fracture energy values that far exceed those observed under tension.
In seismically active regions, the inherent vulnerability of masonry structures to lateral loads poses significant structural design challenges [10,11,12]. The complex mechanical behaviour of masonry arises from the heterogeneous nature of its constituent materials and their contact interfaces, each exhibiting distinct mechanical properties and failure characteristics [13]. Under combined gravitational and lateral loading, masonry develops a biaxial stress state in which failure mechanisms are predominantly controlled by the strength and deformation characteristics of the interfaces [1,14]. Under these conditions, URM load-bearing capacity is primarily governed by the interface bond strength [15], characterised by the initial shear bond strength between the mortar and units [16] and the residual frictional resistance that develops after bond failure at the brick–mortar interface [17].
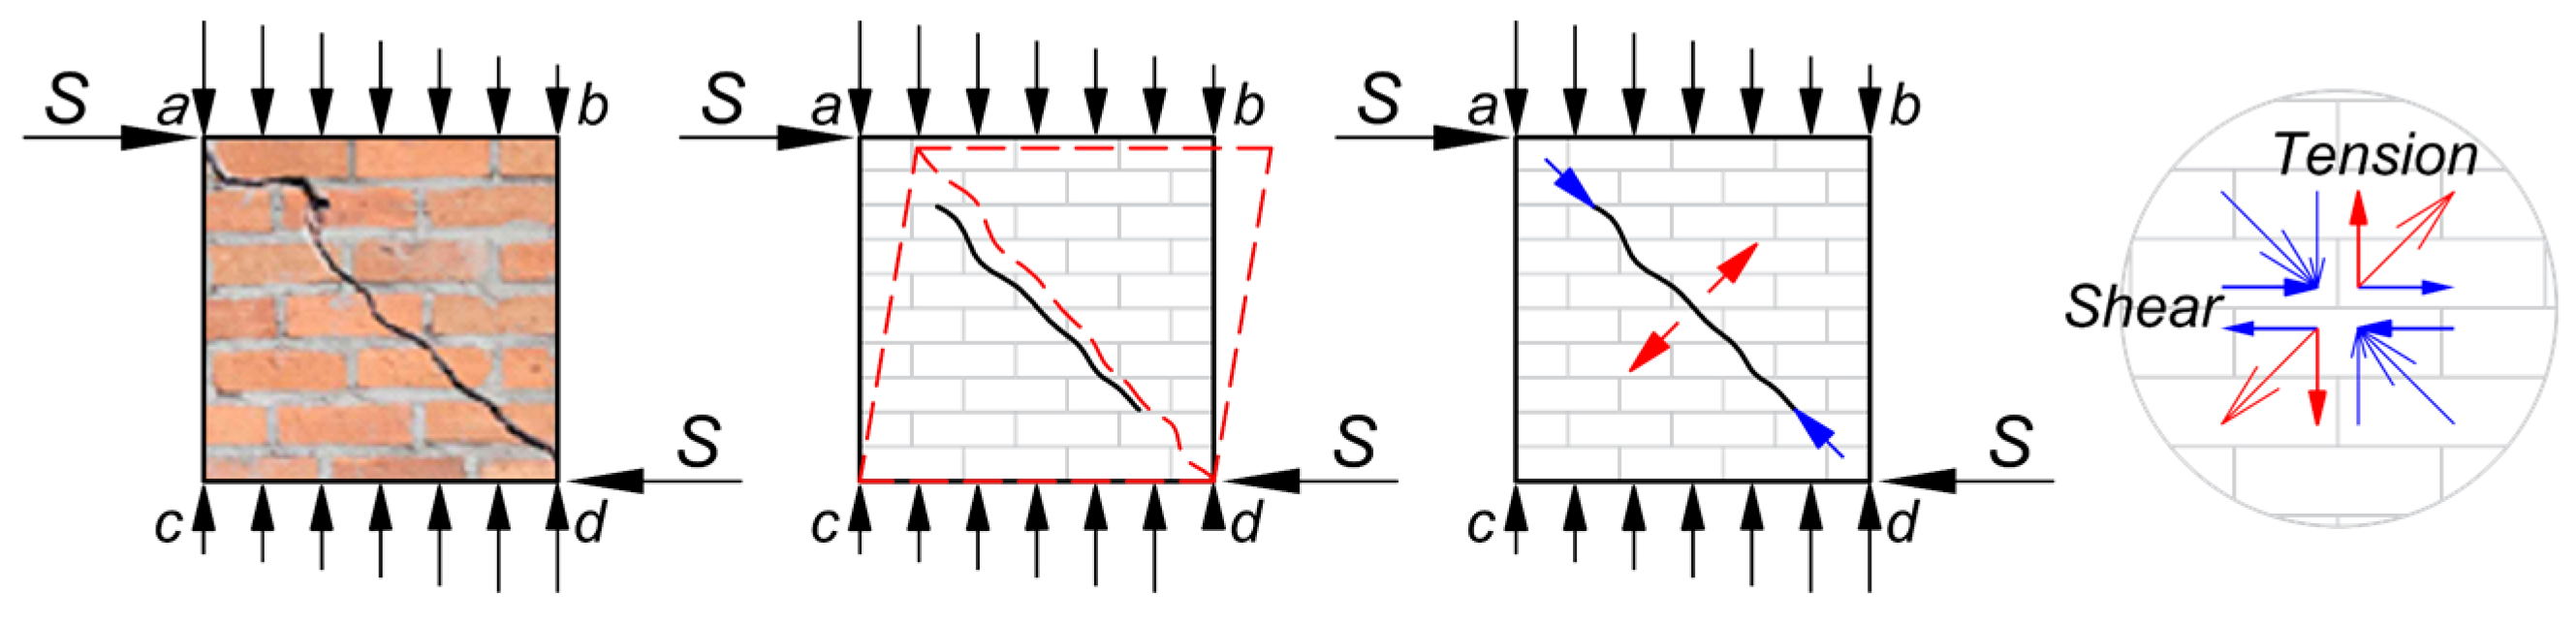
The brick–mortar interface contact strength is inherently weak. While negligible under gravity alone, this weakness becomes critical under biaxial loading, which generates significant normal and shear stresses at the interfaces (Figure 1). Under these conditions, URM load-bearing capacity is primarily governed by the interface bond strength (contact interface strength), characterised by normal adhesive behaviour under tension and cohesive-frictional behaviour under shear, with shear resistance dependent on normal stress.
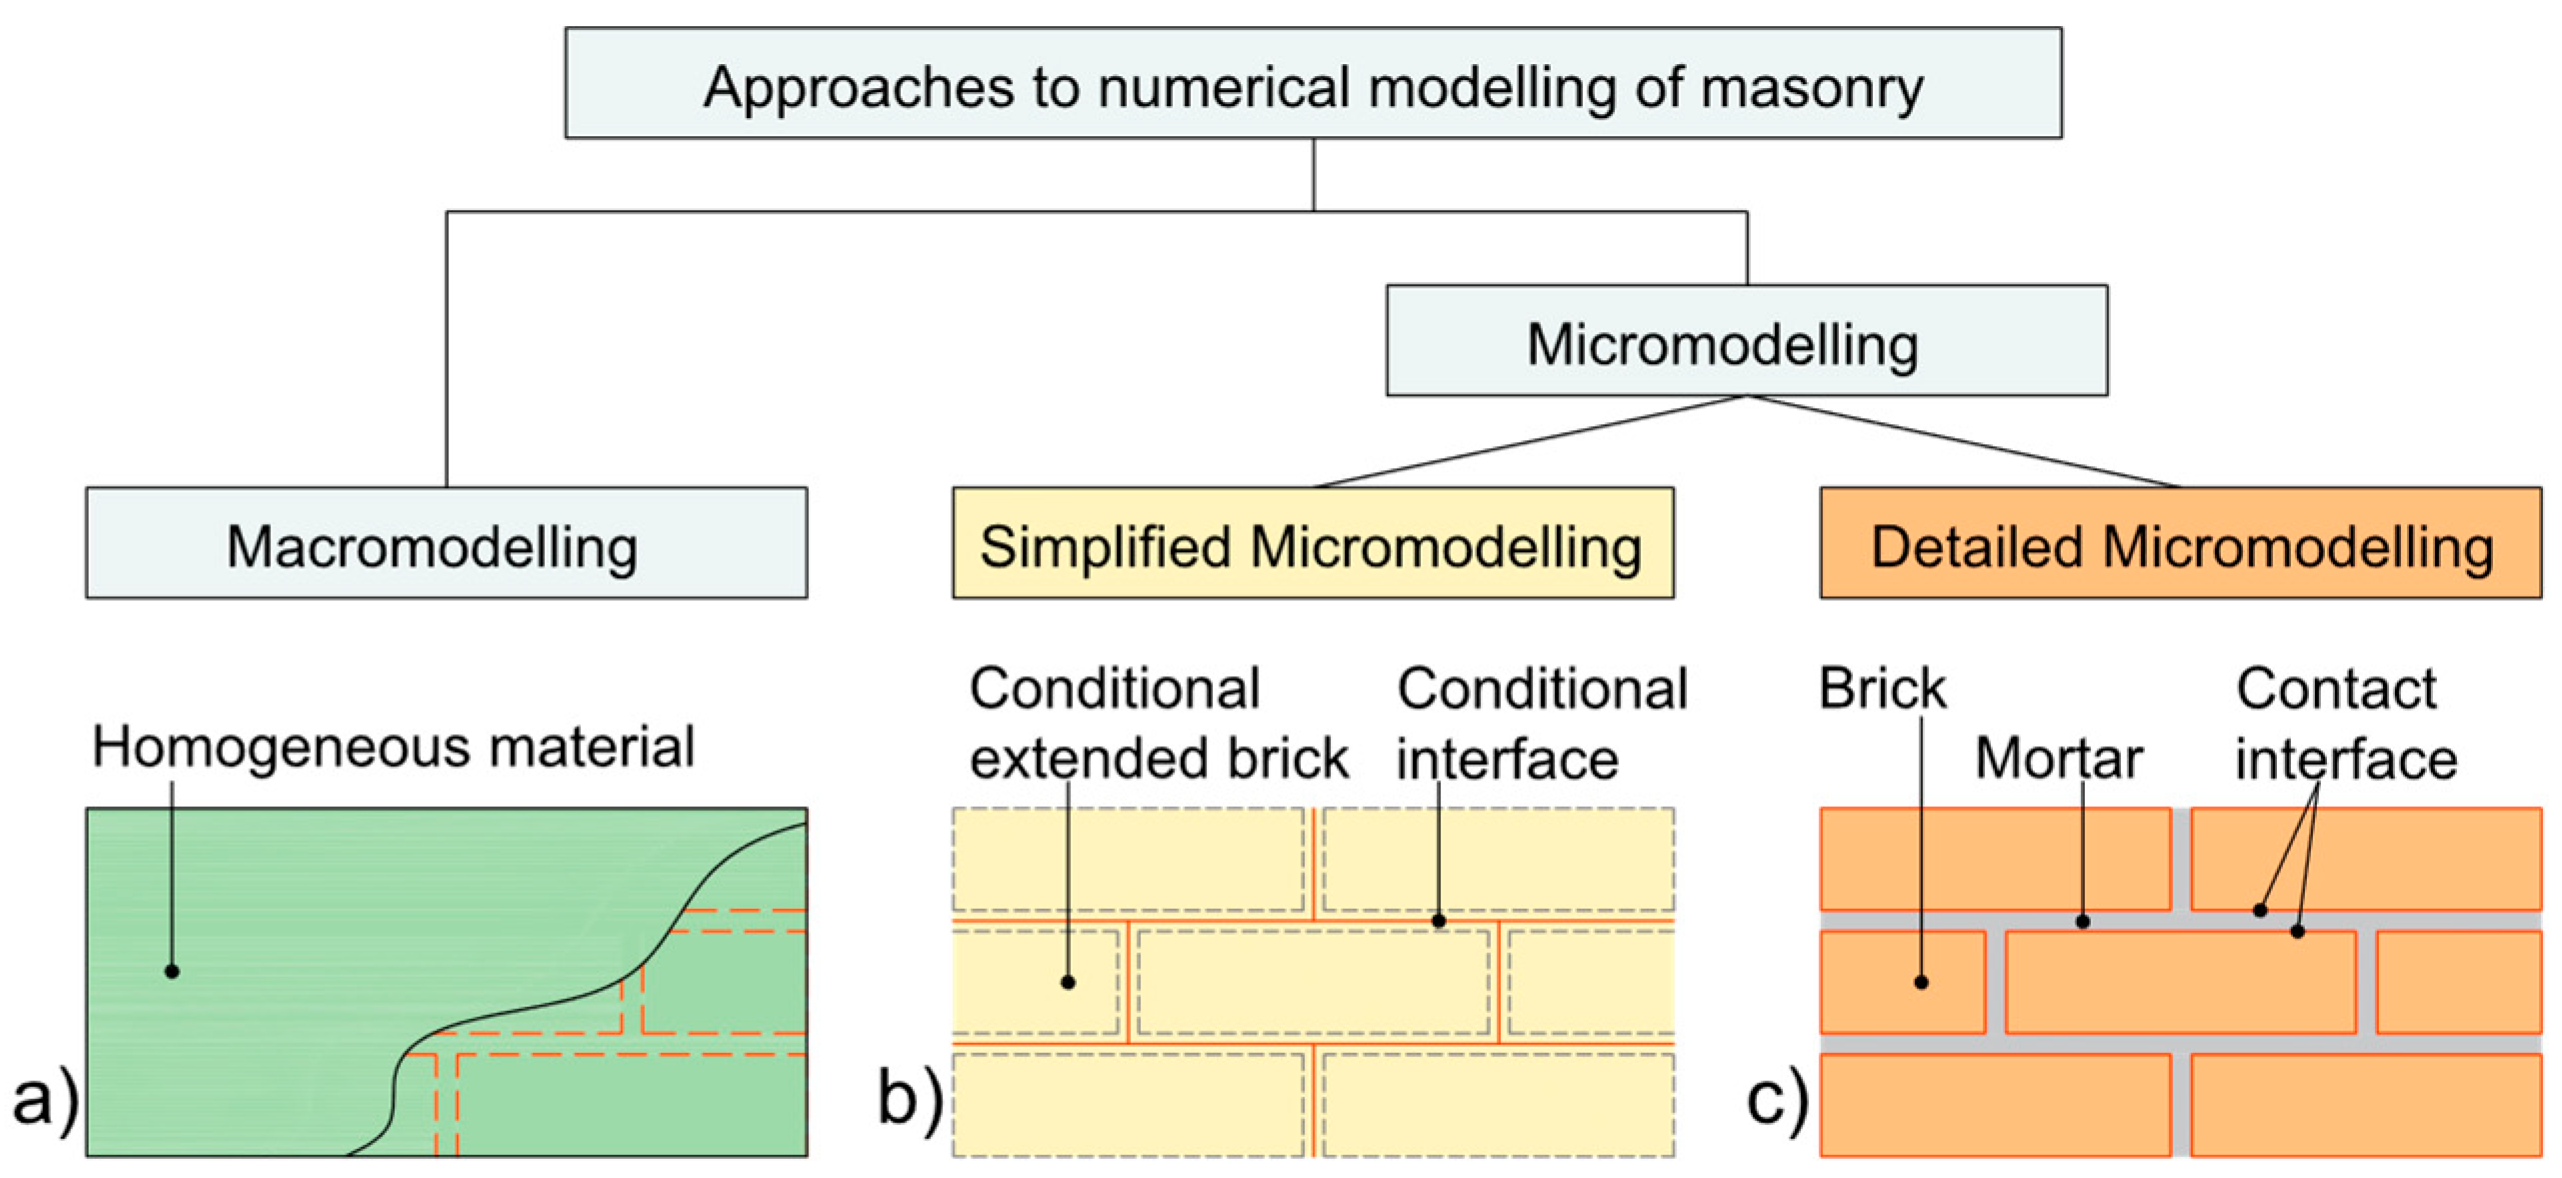
Accurate prediction of masonry behaviour under biaxial loading requires computational approaches capable of capturing the discrete nature of the system and the complex interaction mechanisms at the constituent level. Based on the principles of the mechanics of materials, flow plasticity theory, and fracture mechanics, two approaches represent the principal techniques used in the numerical modelling of masonry: Macromodelling and Micromodelling [18]. Micromodelling is further subdivided into Simplified and Detailed Micromodelling (Figure 2).
Macromodelling treats masonry as a continuous and homogeneous material. Simplified micromodelling assumes conditionally enlarged (expanded) brick units interacting through idealised interfaces, without explicit representation of mortar joints. Detailed micromodelling explicitly resolves all constituent elements (brick units, mortar joints, and contact interfaces) by incorporating the physico-mechanical properties of each, and represents the most rigorous approach for predicting masonry behaviour under complex loading. However, its successful implementation critically depends on accurate characterisation of interface properties, particularly the contact stiffness parameters governing the initial elastic response and subsequent nonlinear behaviour.

1.1. Literature Review and Current Limitations

The widely accepted approach to predicting structural material deformation relies on the concept of physical nonlinearity, which assumes a well-defined stress–strain relationship for the material under analysis. While this framework yields reliable predictions for typically isotropic structural materials, it does not provide a sufficiently rigorous description of the underlying plastic deformation mechanisms, a limitation that becomes particularly evident in non-isotropic materials such as masonry.
Masonry cannot be classified as an isotropic medium, given its composition of heterogeneous constituent materials and contact interfaces with markedly different mechanical properties. The deformation behaviour of masonry, modelled as a piecewise-homogeneous medium with a spatially varying elastic modulus, accounts for the significantly differing characteristics of its constituent materials (brick and mortar) as well as their contact interaction under loading. Consequently, the deformation processes and failure mechanisms of URM depend more critically on the interface strength than on the inherent mechanical strength of the constituent materials themselves.
Theoretical investigations of the elastoplastic deformation of masonry under biaxial stress states (characteristic of seismic loading) have been conducted mainly within a macromodelling framework [19,20,21,22,23,24,25], which cannot explicitly represent the distinct failure mechanisms of brick, mortar, and their contact interfaces. Capturing these mechanisms requires a modelling concept that reflects the piecewise-homogeneous structure of the composite and the bonding conditions between its constituents, requirements fulfilled by discrete micromodelling.
Most micromodelling studies under biaxial stress conditions adopt the simplified approach (e.g., [26,27,28,29,30,31], Figure 2b), which employs conventionally enlarged brick units interacting through idealised interfaces. This physically restricts the model to a single material (brick), with predefined plastic-fracture criteria and crack paths [26], inherently limiting its ability to reproduce the failure mechanisms of masonry systems composed of brick units, mortar joints, and contact interfaces.
The approach proposed by Rots and Lourenco in [26,32,33] and widely adopted in works such as [30,31,34,35,36,37,38,39,40,41,42,43] defines the elastic contact stiffness matrix components ( K n n , K s s and K t t ) using an “equivalent stiffness” concept for joint interfaces (Equation (1)).
K n n = E u E m h m E u E m     ,         K s s = G u G m h m G u G m
where E u and E m are the axial elastic moduli, G u and G m are the shear moduli for the unit and mortar, respectively, and h m is the actual thickness of the mortar joint.
These stiffness values are derived from the elastic and shear moduli of brick and mortar and the thickness of mortar joint, within the framework of simplified micromodelling (see Figure 2b). However, it is important to note that in Lourenco’s approach, the masonry assemblage is physically limited and idealised as a single material (enlarged units with generalised properties). Consequently, damage and failure mechanisms associated with the mortar joints and the mortar–brick interfaces cannot be explicitly represented, limiting the ability of the model to reproduce the detailed failure behaviour of masonry systems.
In contrast, detailed micromodelling explicitly accounts for the strength and deformation characteristics of bricks, mortar, and their contact interfaces, enabling a more realistic simulation of elastoplastic deformation and failure mechanisms. However, detailed micromodelling studies of masonry under biaxial stress conditions [1,32,44,45] have overlooked a critical parameter—the normal adhesive strength at the brick–mortar interface—which significantly governs load-bearing capacity under biaxial loading. By treating the mortar joint as a single continuum component, these models constitute a significant oversimplification of the actual interface mechanics.
The plastic deformation phase of masonry is governed by distinct micro-damage mechanisms: brick failure, mortar failure in horizontal and vertical joints, and degradation of the normal adhesive contact strength at bed joints. In vertical joints, mortar shrinkage during curing induces microcracking from early stages, degrading the effective adhesive contact; consequently, vertical interfaces transmit stress predominantly under compression, with negligible tensile capacity.
Kabantsev [46] provides a theoretical foundation for modelling stiffness degradation in masonry interfaces and assessment of limit states of earthquake-resistant buildings, introducing a finite element method based on a stiffness reduction approach applied when a strength criterion is exceeded, followed by stress redistribution to account for the modified system configuration. For the finite element representation of the brick–mortar interface, two superimposed finite elements are proposed in a 2D in-plane model, one transmitting normal stresses (E = Emortar, G = 0) and another transmitting shear stresses (E = 0, G = Gmortar), enabling independent degradation of each component while maintaining the structural continuity of the system.
While Kabantsev’s contribution focuses primarily on the theoretical and numerical framework for modelling stiffness degradation in masonry interfaces, other studies have sought to refine the mechanical characterisation of the interfaces by proposing “practical” formulations for stiffness contact parameters, which are essential for the automated modelling of brick–mortar interface failure through the auto-deletion of contact finite elements in 3D numerical simulations. D’Altri [47] highlights the lack of established analytical or experimentally calibrated expressions for contact stiffness parameters and, in the absence of rigorous formulations, suggests the use of a normal stiffness K n n significantly stiffer than the shear stiffness K s s (e.g., K n n = 10 K s s ) as a practical approximation. However, this approximation, whilst pragmatically useful in the absence of experimental data, was not derived from experimentally measured traction-separation responses for specific material systems, and Kabantsev’s original formulation, despite its strong theoretical foundation, remains difficult to implement in fully 3D finite element models, being both computationally demanding and time-consuming.
Thus, a critical limitation remains in the current literature regarding expressions for determining contact stiffness parameters for detailed micromodelling of the elastoplastic behaviour and failure of masonry, restricting the practical application of this approach.

1.2. Objective and Methodology

To overcome this limitation, the present study develops and validates experimentally calibrated formulations for normal (Knn) and tangential (Kss, Ktt) contact stiffness parameters, derived from the experimental characterisation of the brick–mortar contact interface behaviour. The experimental and numerical framework integrates three components: a plastic damage model for quasi-brittle constituent materials, an adhesive and cohesive-frictional interaction model for interface behaviour, and experimentally calibrated expressions for contact stiffness. Numerical simulations of small-scale masonry specimens under tensile and shear loading were conducted in Abaqus, with calibration against experimental results on the normal and tangential interface strength.
Unlike previous studies that adopted generic empirical approximations for contact stiffness or formulations developed exclusively within the simplified micromodelling framework, the present study derives contact stiffness parameters directly from experimentally measured traction-separation responses for a specific brick–mortar material system within the detailed micromodelling context.
The contact behaviour is characterised by normal adhesive strength under tension and cohesive-frictional shear strength that varies with normal stress. To capture these mechanisms experimentally, normal adhesive strength was evaluated in cross-type specimens, whilst initial shear strength τ0 was assessed in triplet-type specimens without normal pre-compression. The friction coefficient (µ) was not independently characterised for this study; a value adopted from the literature was used in the numerical implementation.
The outcomes of this research address the critical limitation regarding calibration expressions for determining the brick–mortar contact stiffness parameters for the detailed micromodelling of masonry under biaxial stress conditions. The specific coefficient values obtained are material-dependent and require recalibration for different unit-mortar combinations, while the methodology itself is transferable to other masonry systems.

2. Theoretical Framework

2.1. Interface Mechanics in Masonry Structures

The mechanical response of brick–mortar contact interfaces involves both normal and tangential stress transfer, characterised by a traction-separation relationship rather than a conventional stress–strain law. This relationship describes the evolution of contact stresses as a function of relative displacements between contacting surfaces and, in its general form, relates the cohesive traction vector t to the corresponding relative separation vector δ (Equation (2)).
t = K δ = t n t s t t = K n n K n s K n t K n s K s s K s t K n t K s t K t t δ n δ s δ t
where t is the traction vector, K is the contact stiffness matrix defining the adhesive and cohesive-frictional behaviour of the interface, and δ is the separation displacement vector.
In expanded form, t n is the normal traction stress governing the adhesive behaviour normal to the joint (R3 criterion [48]); t s ,     t t are the in-plane and out-of-plane shear tractions governing the cohesive-frictional behaviour (R6 criterion [48]); δ n ,   δ s ,   δ t are the corresponding separation displacements in the normal and two tangential directions; K n n ,   K s s ,   K t t are the diagonal stiffness components; and K n s ,   K n t ,   K s t are the coupling terms, which for masonry interfaces are typically neglected, yielding an uncoupled system in which normal and tangential behaviours are treated independently.

2.2. Adhesive and Cohesive-Frictional Behaviour

During construction, mortar is applied in a fresh state onto brick units, creating a chemical and mechanical bond upon hardening. The resulting assembly behaves as a composite material in which brick units and mortar joints act together under load. The contact zone between brick and mortar is likewise physically distinct from both constituent materials and represents the weakest link in the system. The brick–mortar interface is therefore not simply friction between independent dry surfaces, but an adhesive union whose rupture under tangential loading involves adhesive failure followed by frictional sliding of the separated surfaces, which physically justifies the cohesive-frictional characterisation adopted in this study.
Under normal loading, the interface response is governed by adhesive mechanisms that provide tensile strength until bond failure. This behaviour can be characterised by an initial elastic response with stiffness K n n ; a peak adhesive strength t n 0 ; progressive damage and strength degradation; and complete debonding at ultimate separation δ n f .
Under tangential loading, the interface follows a cohesive-frictional model that combines initial cohesive strength with frictional resistance dependent on normal stress, typically described by the Mohr–Coulomb failure criterion (Equation (3)).
τ f = τ 0 + μ σ      
where τ f is the shear strength of brick–mortar joint; τ 0 is the initial shear strength under zero normal stress; μ is the friction coefficient; and σ is the compressive stress normal to the joint (taken as positive in compression).
Damage initiation is defined by a maximum stress criterion: when the normalised traction or separation in any direction reaches unity, damage begins:
m a x t n t n 0 , t s t s 0 , t t t t 0 = 1 ,           m a x δ n δ n 0 , δ s δ s 0 , δ t δ t 0 = 1  
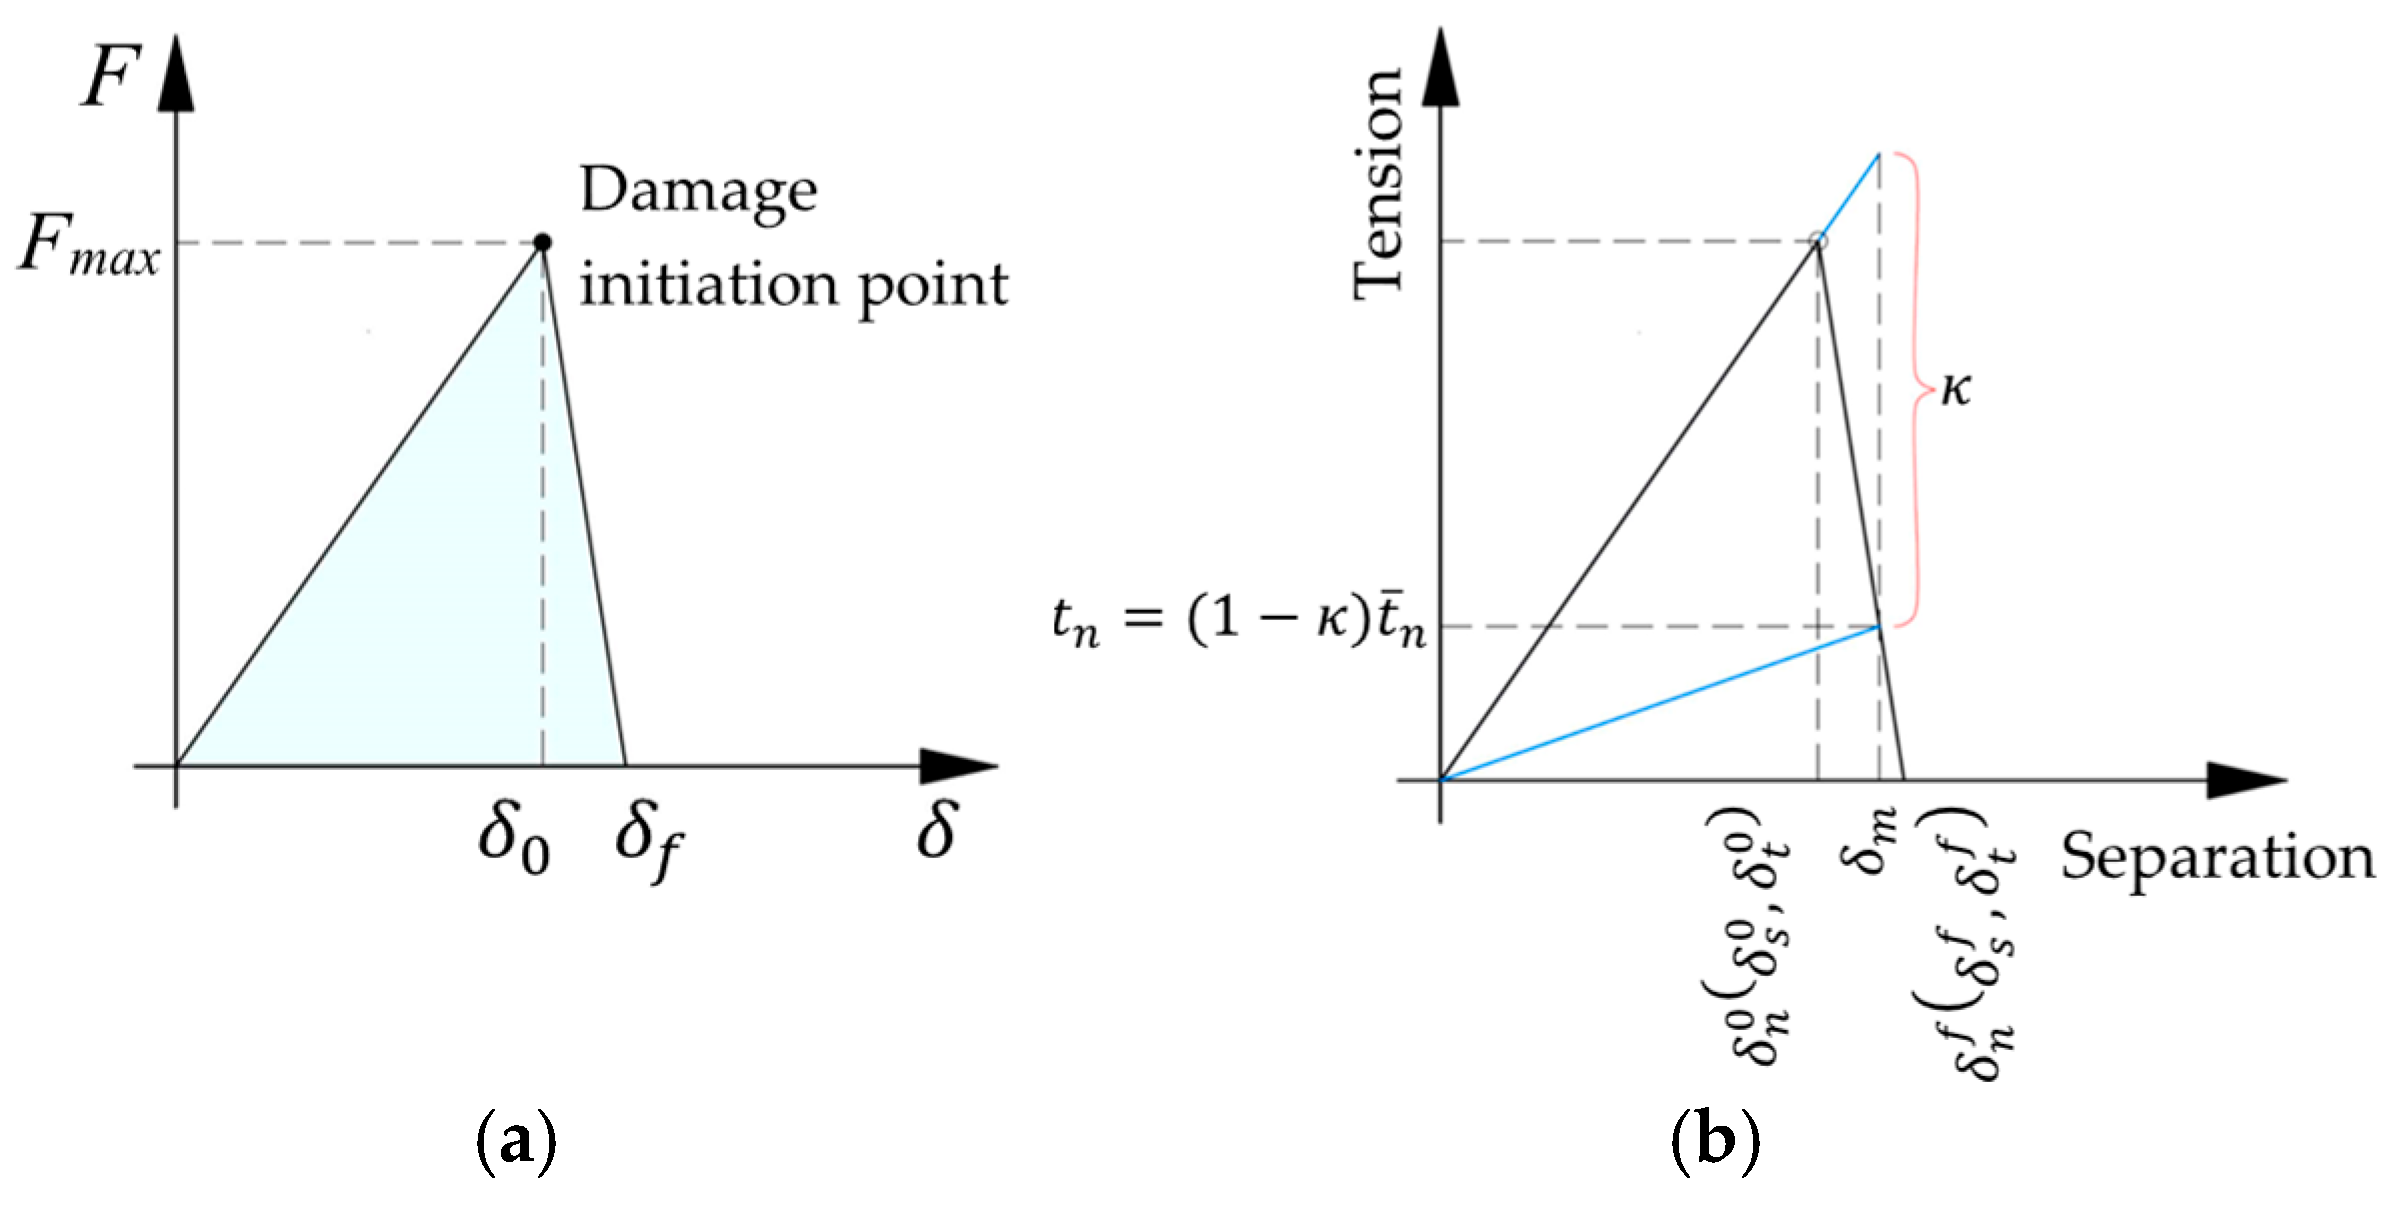
The Macaulay brackets exclude compressive normal stresses from the damage initiation criterion, as compression does not cause interface debonding. In this study, the traction-based form of Equation (4) is adopted, consistent with its implementation in Abaqus. The adhesive and cohesive damage behaviour is illustrated in Figure 3.
A bilinear traction-separation law is adopted (Figure 3). The interface responds elastically until the critical separation δ n 0 is reached, at which point cohesive tractions attain their peak value and damage initiates (κ = 0). Beyond δ n 0 , a softening branch governs progressive stiffness degradation through a scalar damage variable κ ∈ [0, 1], such that t n = 1 κ t ¯ n , where t ¯ n is the effective undamaged traction. In Figure 3b, δm represents a representative separation on the softening branch, illustrating the stiffness degradation for 0 < κ < 1 . Complete decohesion occurs at δ n f , where κ = 1 and tractions vanish. Note that δ n 0 in Figure 3b corresponds to δ 0 in Figure 3a, with both denoting the critical separation at damage initiation expressed in local and global terms, respectively.

2.3. Damage Evolution and Energy Dissipation

The failure of brick–mortar interfaces involves progressive damage accompanied by energy dissipation. The total fracture energy G T is composed of contributions from normal and tangential failure modes:
G T = G n + G S  
where G n is the normal adhesive fracture energy associated with tensile strength, and G S = G s s + G t t denotes the in-plane and out-of-plane tangential components. Given the material symmetry of the brick–mortar interface, G s s = G t t is assumed, consistent with the experimental programme described in Section 3.
The scalar damage variable κ governs stiffness degradation in all traction components:
t n = 1 κ t ¯ n ,         t s = 1 κ t ¯ s ,         t t = 1 κ t ¯ t
where κ = 0 is the elastic regime, with κ = 1 at complete decohesion, and t ¯ n , t ¯ s , and t ¯ t are the effective undamaged tractions in the normal and tangential directions.

2.4. Plastic Damage Model for Quasi-Brittle Materials

The constituent materials of masonry (brick and mortar) exhibit quasi-brittle behaviour characterised by relatively high compressive strength, limited tensile strength, and significant strain softening in the post-peak region [44,49,50,51]. This behaviour can be effectively modelled within the framework of continuum damage mechanics (CDM), which represents material degradation through a scalar damage variable κ, defined as the ratio of damaged to total cross-sectional area [52]:
κ = A D A ;         A D < A ,
Based on the effective stress concept [52,53], the relationship between nominal stress σ and effective stress σ ~ is
σ ~ = σ 1 κ ;     κ = 1   f a i l u r e .
Applying Hooke’s law and the strain equivalence principle [54], the elastic modulus of the damaged medium E relates to the initial modulus E 0 through
ε e q = σ E 0 ;     U n d a m a g e d   m a t e r i a l ,   κ = 0 ,
ε e q = σ 1 κ E 0 = σ E ;     D a m a g e d   m a t e r i a l ,   0 < κ < 1 ,
E = 1 κ E 0 ,
where ε e q is the equivalent strain and E is the elastic modulus of the damaged medium.
The Concrete Damaged Plasticity (CDP) model generalises this CDM framework to describe elastoplastic behaviour and damage evolution in quasi-brittle materials under both tension and compression [55,56,57,58]; it is implemented in Abaqus as described in [59].
The effective stress tensor and damage variable are expressed as
σ ~ = σ 1 κ = 1 κ E 0 ε e q 1 κ = E 0 ε e q = E 0 ( ε ε ~ p l ) ,
κ = κ σ ~ , ε ~ p l ,
ε ~ p l = ε ~ c p l ε ~ t p l ,
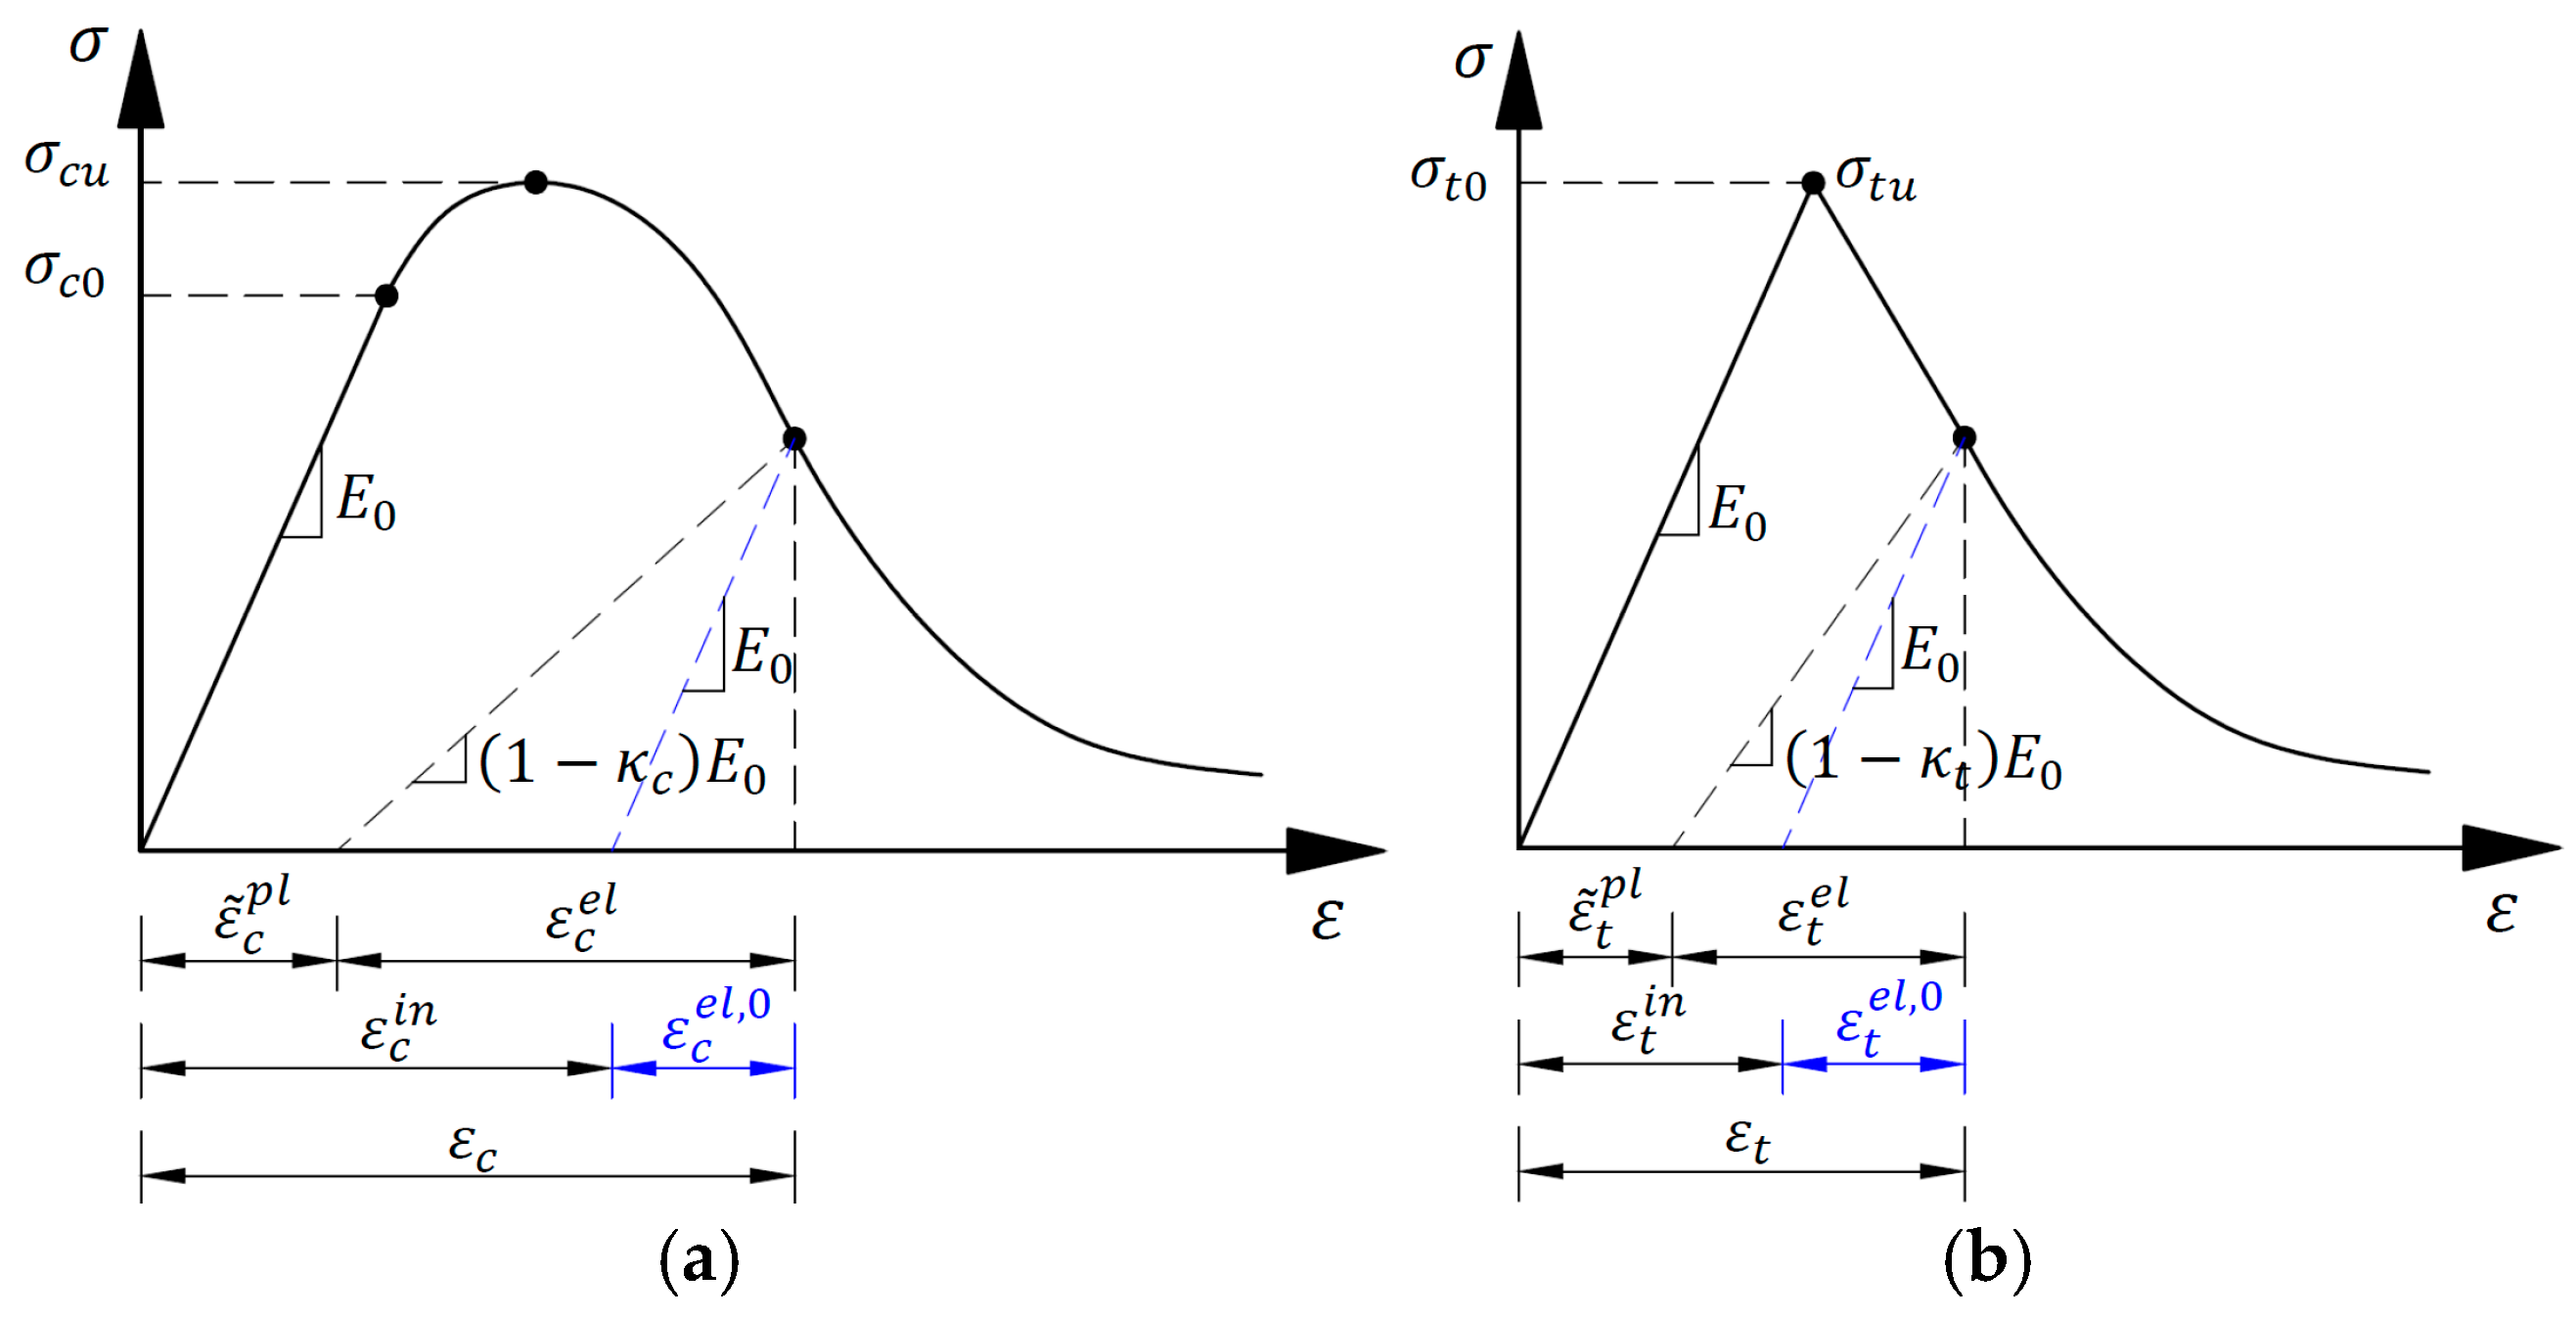
where ε ~ c p l and ε ~ t p l are the equivalent plastic strains under compression and tension, respectively (Figure 4). The effective stresses under each regime follow directly from Equation (12):
σ ~ c = σ c 1 κ c = 1 κ c E 0 ε e q 1 κ c = E 0 ε ε ~ c p l
σ ~ t = σ t 1 κ t = 1 κ t E 0 ε e q 1 κ t = E 0 ε ε ~ t p l
The total strain admits two equivalent decompositions: ε = ε ~ p l + ε e l using the degraded modulus, and ε = ε i n + ε e l , 0 using the initial modulus E 0 . The corresponding strain measures are
ε ~ p l = ε ε e l = ε σ 1 κ E 0
ε i n = ε ε e l , 0 = ε σ E 0 = ε p l + κ σ 1 κ E 0
The inelastic strain ε i n includes both the plastic strain ε p l due to yielding and an additional component arising from damage-induced stiffness degradation, that is, a distinction relevant to the Abaqus implementation, where inelastic strain is the required input for the CDP model.
In Figure 4, Equations (17) and (18), ε denotes the total strain; ε e l is the elastic strain computed with the degraded elastic modulus; ε e l , 0 is the elastic strain computed with E0; ε i n is the total inelastic strain, including damage effects; ε p l is the plastic strain (permanent deformation due to yielding); and κ is the scalar damage variable. These parameters are standard within the CDP framework [55,56,57,58] and are implemented in Abaqus as described in Section 23.6.3 of [59].
In the plastic region, the total strain increment is the sum of the elastic and plastic strains (Equation (19)). Stress increases linearly with the elastic strain increment alone (Equation (20)), reflecting that only the elastic component contributes to stress change since the plastic component produces irreversible deformation without additional stress:
d ε = d ε e l + d ε p l ,
d σ ~ = E d ε d ε p l = E · d ε e l ,
The boundary between the elastic and plastic regions is defined by scalar yield function F (Equation (21)), which depends on the stress σ and the damage parameter κ [60]; κ can be expressed as a measure of the plastic deformation (Equation (22)).
F σ ~ , κ = 0
κ = κ ε p l   and   d κ = d ε ~ p l
When cyclic test data are unavailable, the damage variable κ required by the CDP model can be approximated from monotonic experimental data. This approach is applied in the present work exclusively to the constituent materials (brick and mortar) and not to the brick–mortar interface, which is modelled using a traction–separation law. Assuming an initial linear-elastic response and taking the experimentally measured ultimate stress σ u as the reference value corresponding to the undamaged state of the material, the damage parameter κ is approximated as
κ = 1 σ i σ u   .
where σ u is the experimentally measured peak stress and σ i is the current stress on the descending branch. This first-order approximation is a recognised approach when cyclic experimental data are unavailable [55,56]. Its principal limitations are the absence of stiffness recovery modelling under load reversal and the assumption of linear normalisation of stiffness degradation. These limitations have negligible practical impact for the monotonic loading conditions considered in this study.
This expression yields κ = 0 at peak load and κ 1 as the material approaches complete degradation, providing the normalised stiffness reduction required as input for the CDP model in Abaqus. Note that in Figure 4a, the onset of plastic behaviour in compression occurs at σ c 0 < σ c u , with the ascending pre-peak branch treated as elastic ( κ = 0); Equation (23) is applied only beyond σ c u .
Considering that the theory of plasticity assumes that the plastic potential function is equivalent to the yield function (associated flow rule Q F ) , the von Mises plastic potential theory could be applied to determine the parameter d κ = d ε p l as a measure of the equivalent plastic strain. However, a non-associative flow rule based on a phenomenological approach provides a more accurate modelling of quasi-brittle materials [60]. Therefore, the softening parameter of the strain–stress curve in the plastic region can be defined by the flow rule:
d ε p l = d λ 𝜕 Q 𝜕 σ     ,
where d λ is a positive scalar factor of proportionality [61] and Q σ , κ = 0 is the plastic flow potential function. Following Bakeer [28], d λ is determined by
d λ = 𝜕 F 𝜕 σ T E d ε 𝜕 F 𝜕 σ T E 𝜕 Q 𝜕 σ 𝜕 F 𝜕 κ 𝜕 κ 𝜕 ε p l T 𝜕 Q 𝜕 σ

3. Experimental Program

Experimental tests were conducted using INSTRON 1000HDX, INSTRON 3382A, and SHIMADZU Concrete-2000X universal testing machines to determine the mechanical properties of brick units, mortar, and brick–mortar interfaces for use as input parameters in the numerical model. Tests followed GOST-R 58527-2019 [62], EN 772-1 [63], ASTM C67-08 [64], ASTM C270-10 [65], EN 1015-11 [66] and EN 998-2 [67] standards.

3.1. Constituent Material Characterisation

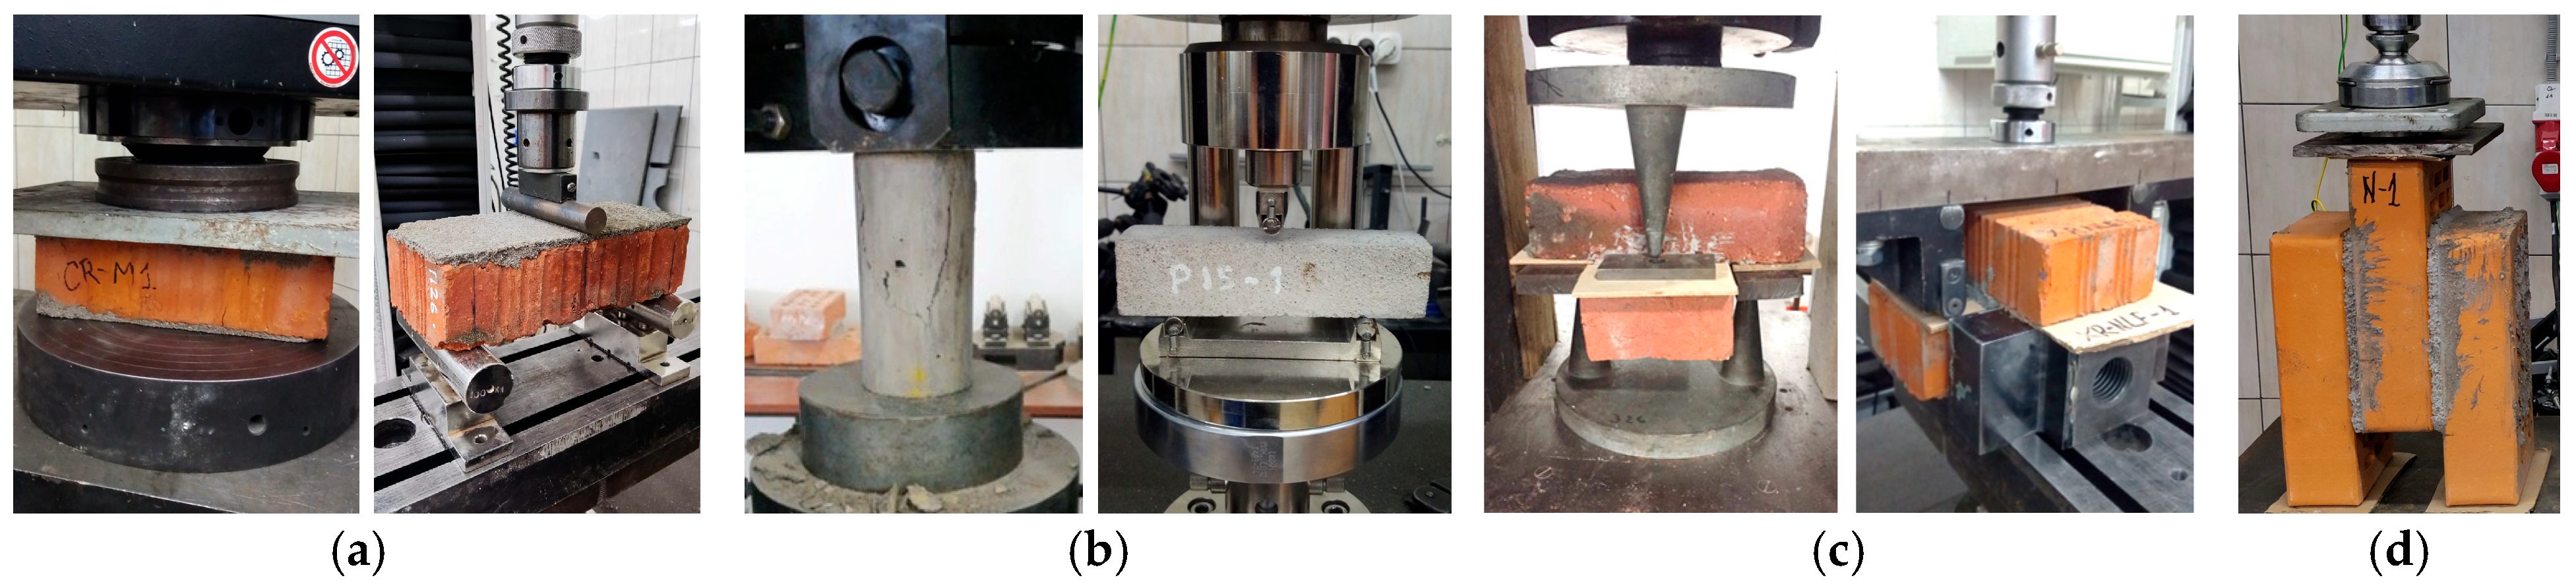
The experimental program utilised artisanal solid ceramic brick units (~250 × 130 × 75 mm) [8,68] and a pre-mixed dry-set cement mortar (INTACO Pegablok Tipo S), representative of typical construction practice in Ecuador. The mortar was prepared following the manufacturer’s specifications at a water dosage of 7.3 litres per 40 kg bag [69]. Mortar specimens (150 × 75 mm cylinders and 40 × 40 × 160 mm prisms) were cast in steel moulds, demoulded after 24 h, and cured under controlled laboratory conditions (20 ± 2 °C, 65 ± 5% relative humidity) for 28 days, consistent with the curing regime applied to the masonry interface specimens. Destructive tests on brick units, mortar specimens, and small-scale masonry specimens of cross-type and triplet-type configurations provided the mechanical parameters required for numerical model calibration (Figure 5).
The physico-mechanical properties of the constituent materials (n = 10) are summarised in Table 1; this sample size was considered sufficient given that the primary aim was model calibration rather than statistical characterisation. The corresponding stress–strain data are presented in Table 2.
The elastic modulus of tested artisanal brick units (E = 310 MPa) was determined from the slope of the experimental stress–strain curves. This value is notably lower than those typically reported for industrial fired clay bricks, which is attributed to the artisanal production process of the units tested: manual fabrication, uncontrolled firing temperatures, and local clay compositions result in higher internal porosity and microstructural heterogeneity, producing a more compliant elastic response.
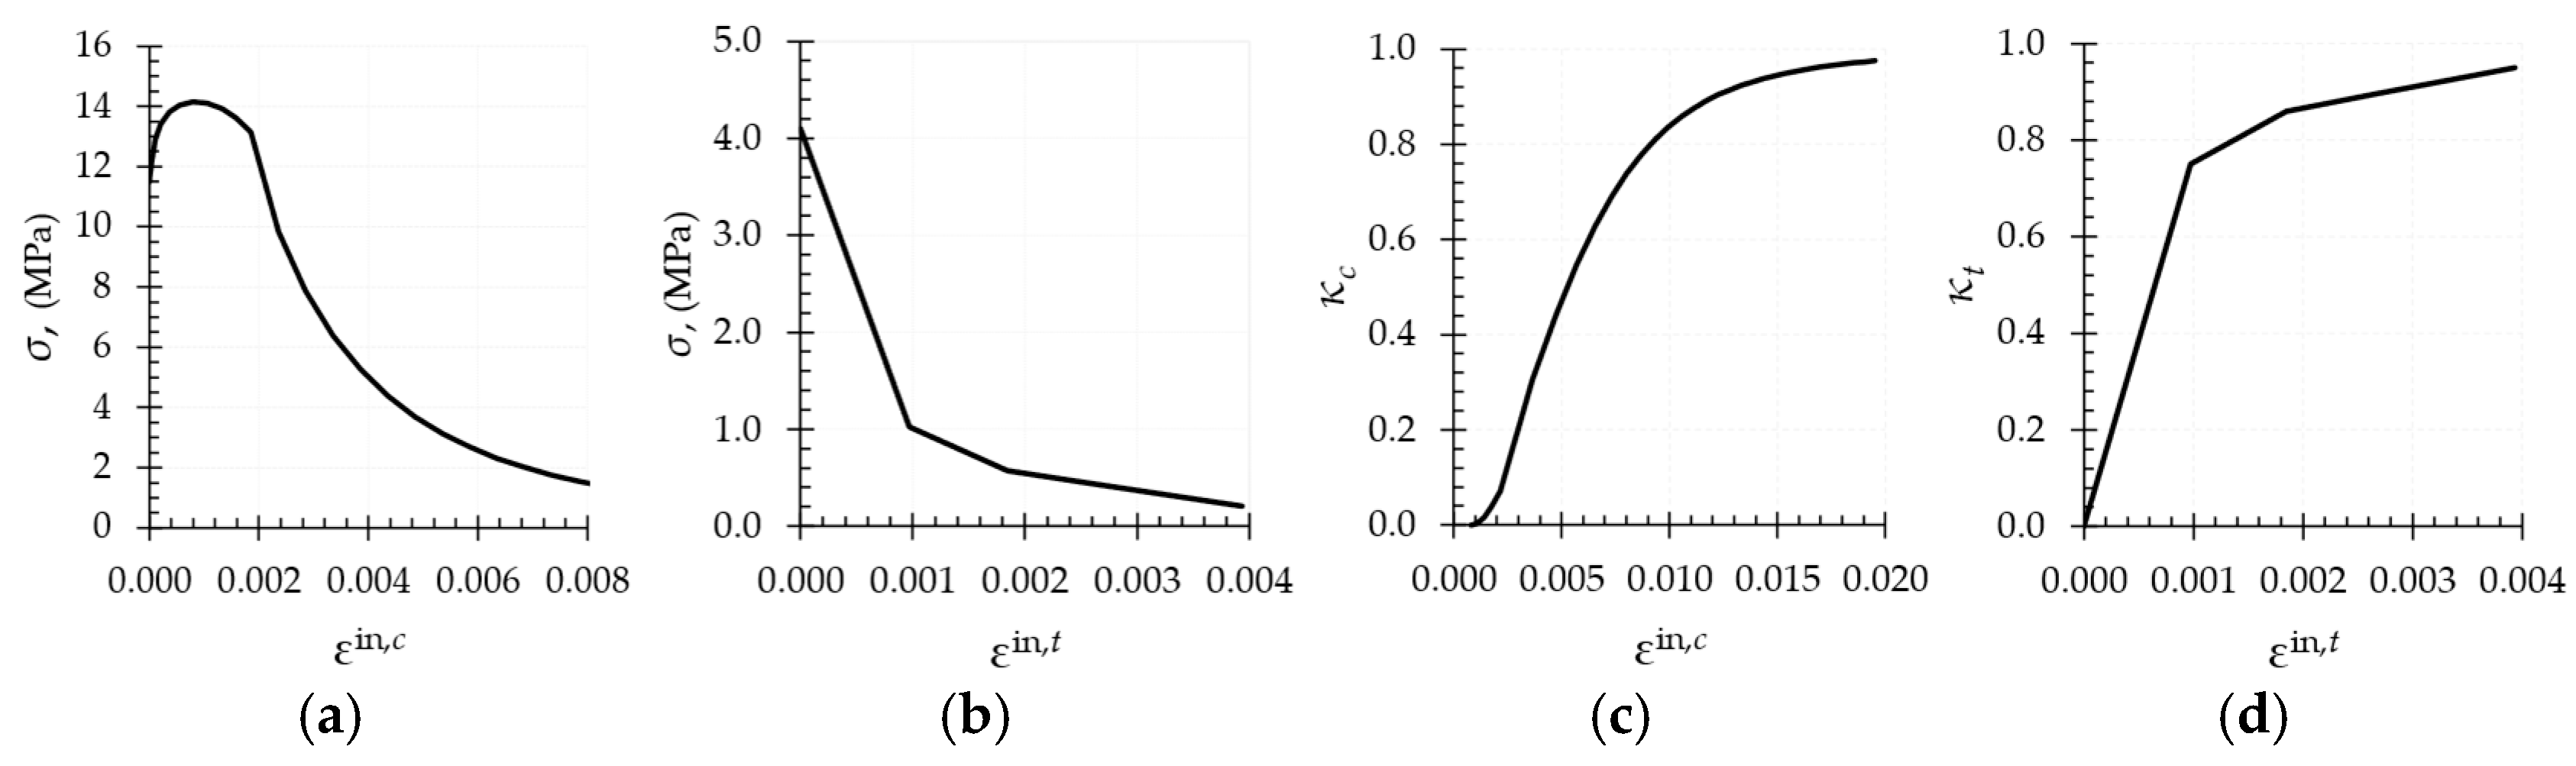
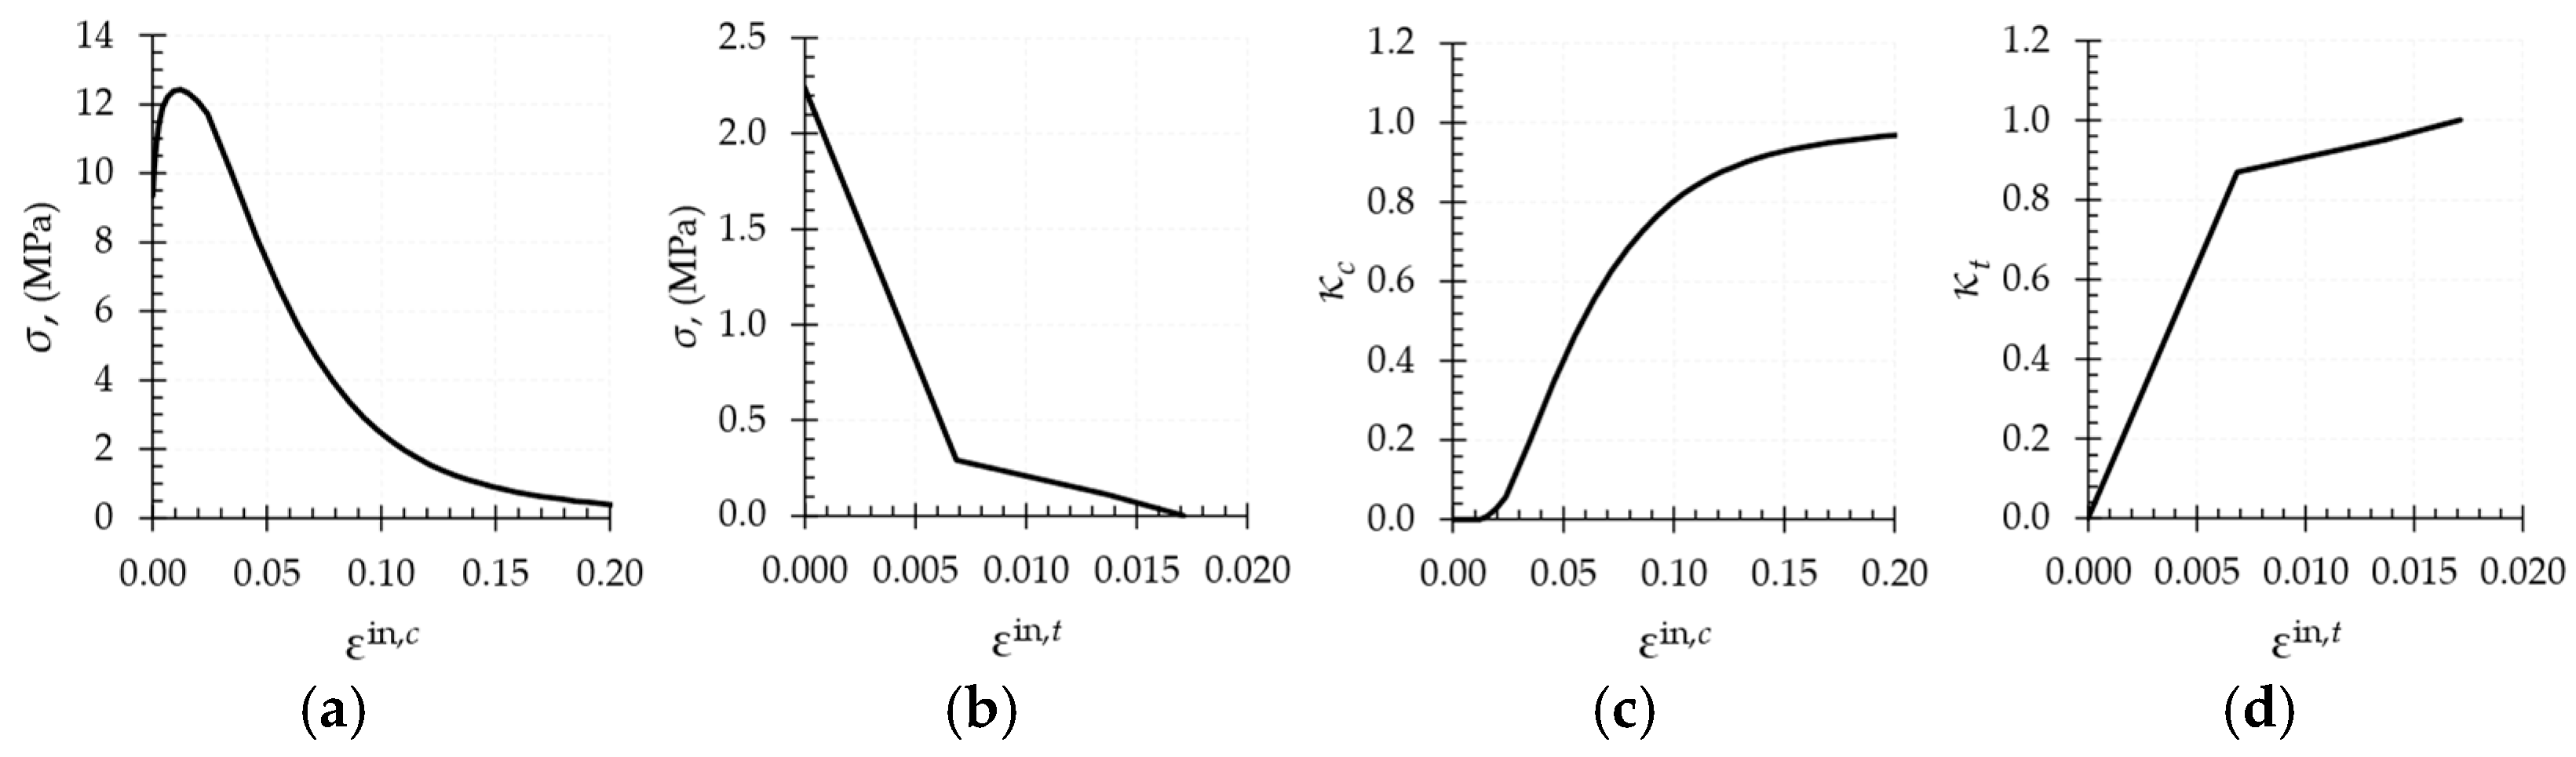
Based on experimental data and Equations (11), (17), (18) and (23), the elastoplastic behaviour, plastic failure and stiffness degradation of the constituent materials were analysed. The resulting CDP model parameters for mortar and brick are presented in Table 3 and Table 4, and the corresponding inelastic behaviour and damage evolution are shown in Figure 6 and Figure 7.
It is important to note, that in Table 3 and Table 4, ε denotes the total strain; ε e l is the elastic strain computed with the degraded elastic modulus; ε e l , 0 is the elastic strain computed with E0; ε i n is the total inelastic strain, including damage effects; ε p l is the plastic strain (permanent deformation due to yielding); and κ is the scalar damage variable. These parameters are standard within the CDP framework.

3.2. Interface Behaviour Tests

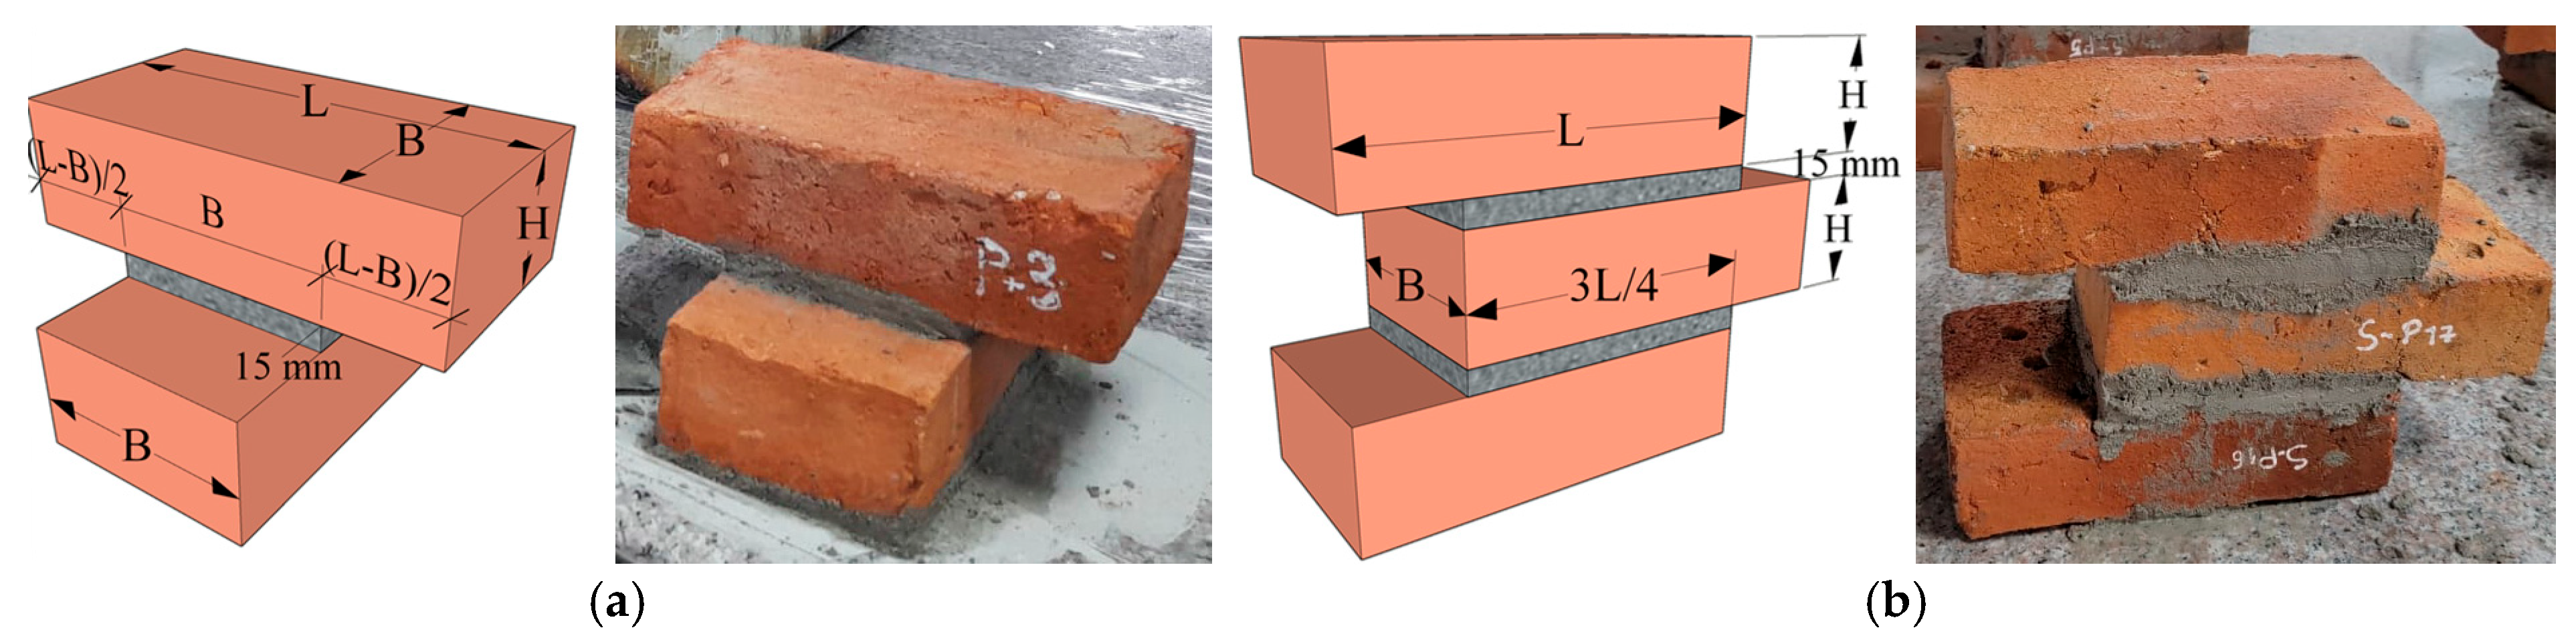
Two types of small-scale masonry specimens were constructed to characterise the normal and tangential behaviour of brick–mortar interfaces, both with a mortar joint thickness of 15 mm, representative of typical regional construction practice (Figure 8). Cross-type specimens were designed to determine the normal adhesive strength of brick–mortar interfaces under direct tension. These specimens consisted of two brick units connected by a single mortar joint (Figure 8a), creating two symmetric brick–mortar interfaces with a gross contact area of ~130 × 130 mm = 16,900 mm2. Triplet-type specimens consisted of three brick units arranged with a quarter-brick offset, forming two mortar joints and four symmetric interfaces (Figure 8b) with a gross contact area of ~130 × 180 mm = 23,400 mm2, and were used to evaluate initial shear strength without normal pre-compression.
Cross-type specimens were tested in direct tension following ASTM C321-00 [70], as applied in [71]. Triplet-type specimens were tested under shear without normal pre-compression following EN 1052-3:2002 procedure B [72] and NCh 167.Of2001 [73]. A displacement rate of 0.5 mm/min was applied for all tests, with continuous recording of load and displacement.
The interface strength results are summarised in Table 5. The scatter in normal adhesive strength reflects the inherent heterogeneity of brick–mortar interfaces and the brittle nature of tensile failure; mean values were adopted as input parameters for the numerical model.
The stress-displacement responses show distinct behaviour under each loading mode: normal adhesive behaviour is characterised by an initial linear elastic response followed by progressive softening and complete debonding; tangential behaviour exhibits an initial linear response up to peak cohesive strength, followed by frictional sliding.
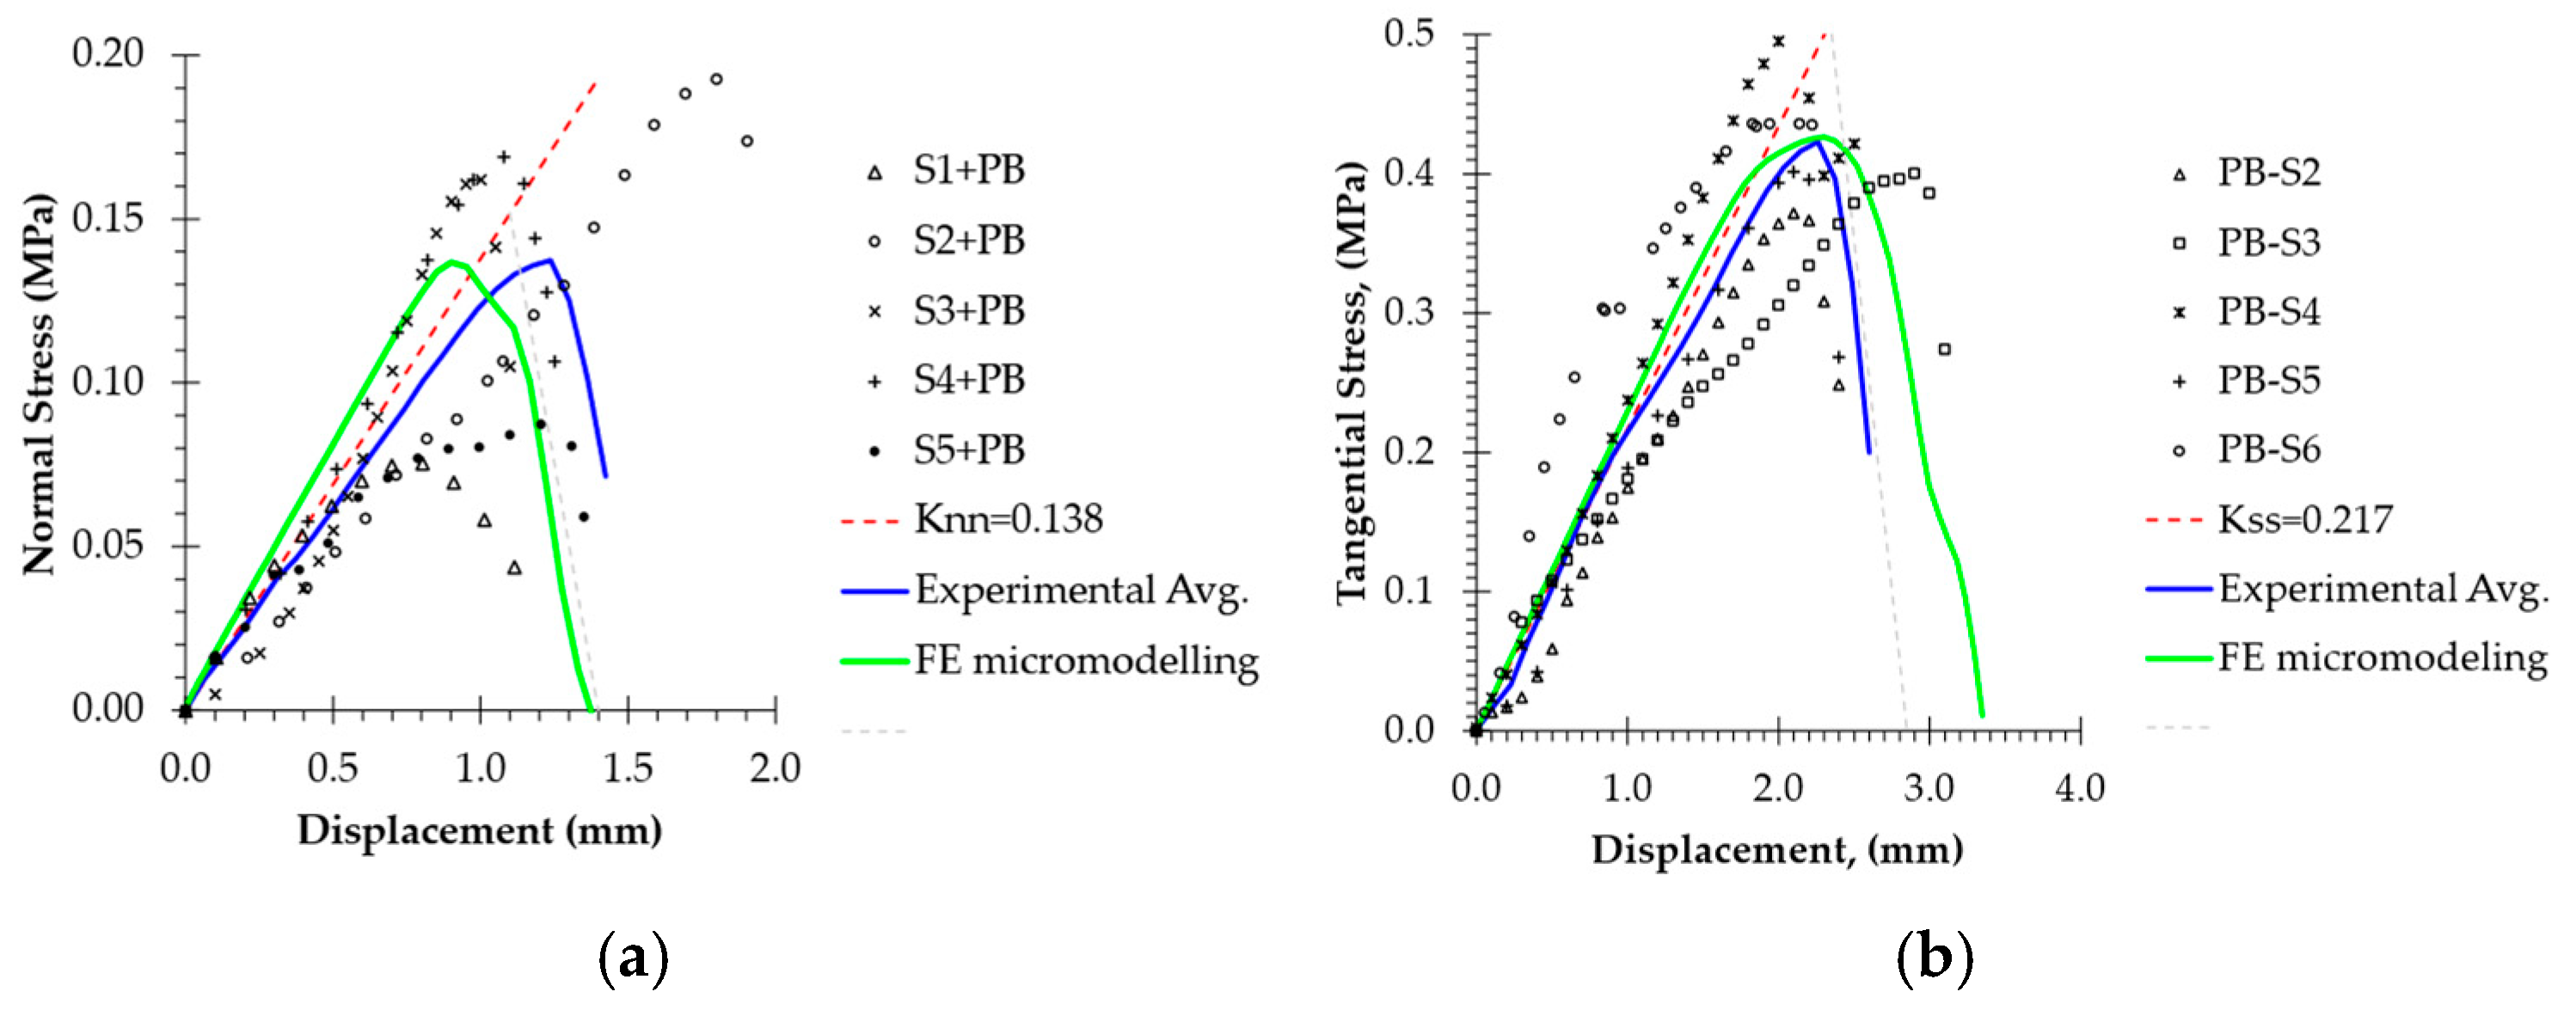
From the traction-separation curves, the normal adhesive fracture energy for the gross contact area is G n = 0.097 N/mm, with the plastic region G n p = 0.015 N/mm. The shear fracture energy is G s = G t = 0.727 N/mm, with G s p = G t p = 0.127 N/mm (as detailed later in the stress-displacement curves of Section 5.2). The corresponding experimental contact stiffnesses are K n n = 0.138 N/mm3 and K s s = K t t = 0.217 N/mm3.
It should be noted that cross-type and triplet-type specimens measure an effective contact stiffness that combines the contributions from both the mortar layer and the brick–mortar interface. In detailed micromodelling, the zero-thickness interface ideally represents only the contact behaviour, with mortar deformation captured separately by the mortar continuum elements. However, for the tested material combination, this distinction has negligible practical impact: the interface failure stress (0.138 MPa in tension) is approximately 29.7 times smaller than the mortar tensile strength (4.1 MPa). At interface failure loads, the elastic deformation of the 15 mm mortar layer is ε ≈ 4.2 × 10⁻⁵, corresponding to a displacement of ~0.00063 mm, which is approximately three orders of magnitude smaller than the interface displacements at failure. The reported stiffness values are therefore representative of the interface behaviour and are used directly as input for the traction-separation law in Abaqus, understood as effective parameters for the tested 15 mm joint configuration.
Macroscopic examination of the failed specimens revealed that the effective contact area was approximately 72% of the gross geometric area, attributed to mortar shrinkage during curing, similar to that reported in [74]. Adjusted parameters based on the net contact area are G n = 0.129 N/mm, G n p = 0.023 N/mm, G s = G t = 1.021 N/mm, G s p = G t p = 0.179 N/mm, K n n = 0.189 N/mm3, and K s s = K t t = 0.305 N/mm3.
The fracture energy G i is defined per unit interface area and computed as the area under the traction–separation curve, consistent with the cohesive zone formulation in Abaqus.

4. Numerical Modelling Framework

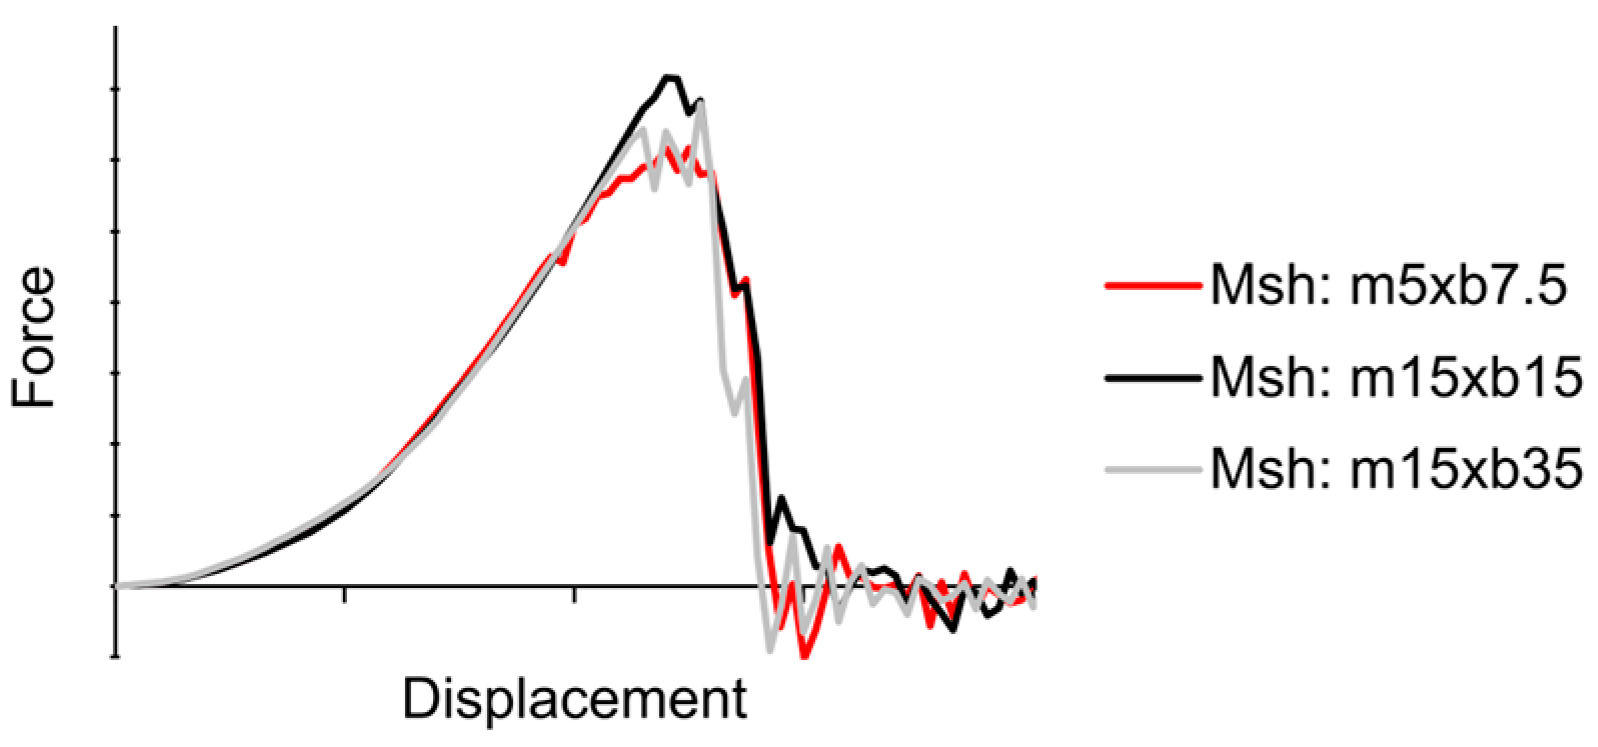
Numerical simulations were performed in Abaqus/CAE (version 2022) using the explicit time integration scheme, selected for its robustness in handling highly nonlinear contact interactions and potential instabilities associated with progressive damage evolution. Model geometries replicated the dimensions and configurations of the physical test specimens. Brick units and mortar joints were discretised using eight-node linear hexahedral elements with reduced integration (C3D8R), selected for their proven robustness in modelling quasi-brittle materials within the CDP framework and their ability to handle large deformation without excessive distortion. A structured mesh was adopted; sensitivity analysis evaluating coarse (brick: 35 mm; mortar: 15 mm), medium (brick: 15 mm; mortar: 15 mm), and fine (brick: 7.5 mm; mortar: 5 mm) discretisation levels led to adoption of the fine configuration, balancing accuracy and computational efficiency (Figure 9).

4.1. Material Models for Constituent Materials

The behaviour of ceramic bricks and mortar was modelled using the CDP model in Abaqus, calibrated against the experimental tests described in Section 3.1. For both materials, a dilatancy angle of ψ ≈ 18.8° (tan ψ = 0.34, following [26,30,36,75]) and Poisson’s ratio of ν = 0.15 were adopted.
To enable automatic deletion of finite elements upon exceeding the specified failure criteria (a key feature for simulating progressive damage [48]), the stress–strain behaviour of each constituent material was defined through the “Edit Keywords” section of Abaqus. The plastic failure function was specified for each material as
* Concrete   Failure ,   TYPE   =   Strain ε t , m a x i n ,   ε c , m a x i n ,   κ t , m a x ,   κ c , m a x
where ε t , m a x i n and ε c , m a x i n are the maximum inelastic strains in tension and compression, and κ t , m a x and κ c , m a x are the corresponding maximum damage parameters, beyond which elements are deleted.

4.2. Experimentally Calibrated Contact Stiffness Formulation

The numerical model was calibrated using experimental results, revealing that the contact stiffness parameter in Abaqus depends on the number of brick–mortar contact interfaces in the specimen. The cross-type specimen (two brick units, one mortar joint) contains two brick–mortar contact interfaces, whilst the triplet-type specimen (three bricks, two mortar joints) contains four contact interfaces. Notably, as illustrated in Figure 10, the brick–mortar contact failure does not occur simultaneously across all contact interfaces.
The following empirical scaling relationships are proposed for determining contact stiffness parameters in detailed micromodelling:
K n n = ξ n 2 n 1 t L ,
K s s = K t t = ξ τ 2 n 1 t L   ,
where n is the number of brick rows in the model; t is the out-of-plane thickness of the contact interface (mm); L is the in-plane length of the contact interface (mm); and ξ n , ξ τ are the normal and tangential calibration coefficients governing adhesive and cohesive-frictional interface behaviour, respectively. All symbols, units, and physical meanings are summarised in Table 6.
These equations introduce the first experimentally calibrated scaling expressions for normal and tangential contact stiffness parameters in detailed masonry micromodelling. Unlike prior studies relying on empirical approximations or on formulations developed for simplified micromodelling contexts, this formulation is directly derived from experimental traction-separation measurements of specific material systems.
The dimensional consistency of Equations (27) and (28) can be verified through
K i i = ξ i 2 n 1 t L
K i i = ξ i L L = N · m m 5 m m m m = N · m m 3
confirming that ξ i must carry units of N/mm5 and that K n n , K s s , K t t are expressed in N/mm3, consistent with their definition as stiffness per unit area in the traction-separation formulation.
The calibration coefficients ξ n and ξ τ were determined by normalising the experimental contact stiffness values (obtained from the stress-displacement curves of Section 5.2) by the gross contact area of each specimen type (130 × 130 mm for cross-type specimens and 130 × 180 mm for triplet-type specimens).
ξ n = 0.138 130 · 130 = 8.2 × 10 6     N / m m 5
ξ τ = 0.217 130 · 180 = 9.3 × 10 6       N / m m 5
It is important to distinguish between two aspects of the proposed approach: (1) the methodology—comprising the experimental characterisation procedure, the scaling formulation (Equations (27) and (28)), and the calibration protocol—which is general and transferable to other masonry systems upon appropriate experimental characterisation; and (2) the calibration coefficients ξ n and ξ τ —which are specific to the tested combination of artisanal ceramic brick units from the region of Cuenca and INTACO Pegablok Tipo S mortar. The values presented in (Equations (31) and (32)) are specific to the tested material combination and 15 mm joint thickness. Application to different masonry units, mortar formulations, or different joint thicknesses requires experimental recalibration. The functional form of Equations (27) and (28) may nonetheless serve as a scaling framework for other systems. For the condition of net contact area (considering mortar shrinkage), these coefficients are ξ n = 1.13 × 10 5 N / m m 5 and ξ τ = 1.3 × 10 5   N / m m 5 .

4.3. Interface Modelling Approach

The adhesive and cohesive behaviour of the brick–mortar contact interfaces were modelled using the traction-separation approach in Abaqus, with normal ( K n n ) and tangential ( K s s , K t t ) contact stiffness coefficients calculated from Equations (27) and (28). The explicit solver with general contact conditions was employed. Surface-to-surface contact was defined between all brick and mortar surfaces, with brick surfaces assigned as master surfaces. Cohesive behaviour was assigned only to secondary nodes initially in contact.
Interface behaviour was defined using a bilinear traction-separation law, with peak strengths and fracture energies assigned from experimental measurements (Section 3.2). The friction coefficient was not independently characterised for this specific material combination but assigned a value of μ = 0.74, consistent with values reported in the literature for cement-mortar interfaces: Capozucca [16] (μ = 0.74), Yokel and Fattal [76] (μ = 0.74), Chaimoon and Attard [42] (μ = 0.75), and Lourenço [26] (μ = 0.75) were adopted for the numerical implementation. Since all validation specimens were tested without normal pre-compression (σ = 0), the frictional term in the Mohr–Coulomb criterion reduces to μσ = 0, and the interface behaviour is dominated by the determined cohesive component τ0.
Damage initiation was governed by a maximum stress criterion in both normal and tangential directions. The evolution of damage was controlled by the fracture energy approach in the normal ( G n ) and two tangential ( G s ,   G t ) directions, ensuring that the energy dissipated during failure matched experimental values.
The experimentally derived contact stiffness ratio K n n ≈ 0.64 K s s , obtained from this study ( K n n = 0.138 N/mm3 and K s s = K t t = 0.217 N/mm3), differs substantially from the empirical approximation K n n = 10 K s s proposed by D’Altri [47]. A referential analytical comparison with existing approaches was performed. The D’Altri approximation yields K n n = 2.17 N/mm3 for the tested system, overestimating the experimentally calibrated value by a factor of approximately 16. The Lourenço–Rots equivalent stiffness formulation (Equation (1)), applied with the measured material properties (Eu = 310 MPa, Em = 3289 MPa, hm = 15 mm), yields a negative K n n value, as the formulation is undefined when Eu < Em, a condition that arises in the studied artisanal masonry system and cannot be anticipated without experimental characterisation. This discrepancy underscores the risk of adopting empirical assumptions in the absence of experimentally validated formulations and reinforces the necessity of the calibration methodology proposed in the present study.

4.4. Calibration and Validation Procedure

The numerical models were calibrated and validated against experimental results through a sequential process: (1) CDP model parameters for brick and mortar were adjusted to match the experimental stress–strain curves obtained from compression and flexural tests; (2) contact stiffness parameters were calculated using the proposed experimentally calibrated expressions ((27)–(28)) and interface strength parameters assigned from experimental data; (3) calibrated models were used to simulate cross-type and triplet-type specimen tests, with predictions compared against experimental results; and (4) a sensitivity analysis was conducted to evaluate the influence of key parameters on numerical predictions and the robustness of the modelling approach.

5. Results and Discussion

5.1. Normal Adhesive Behaviour and Failure

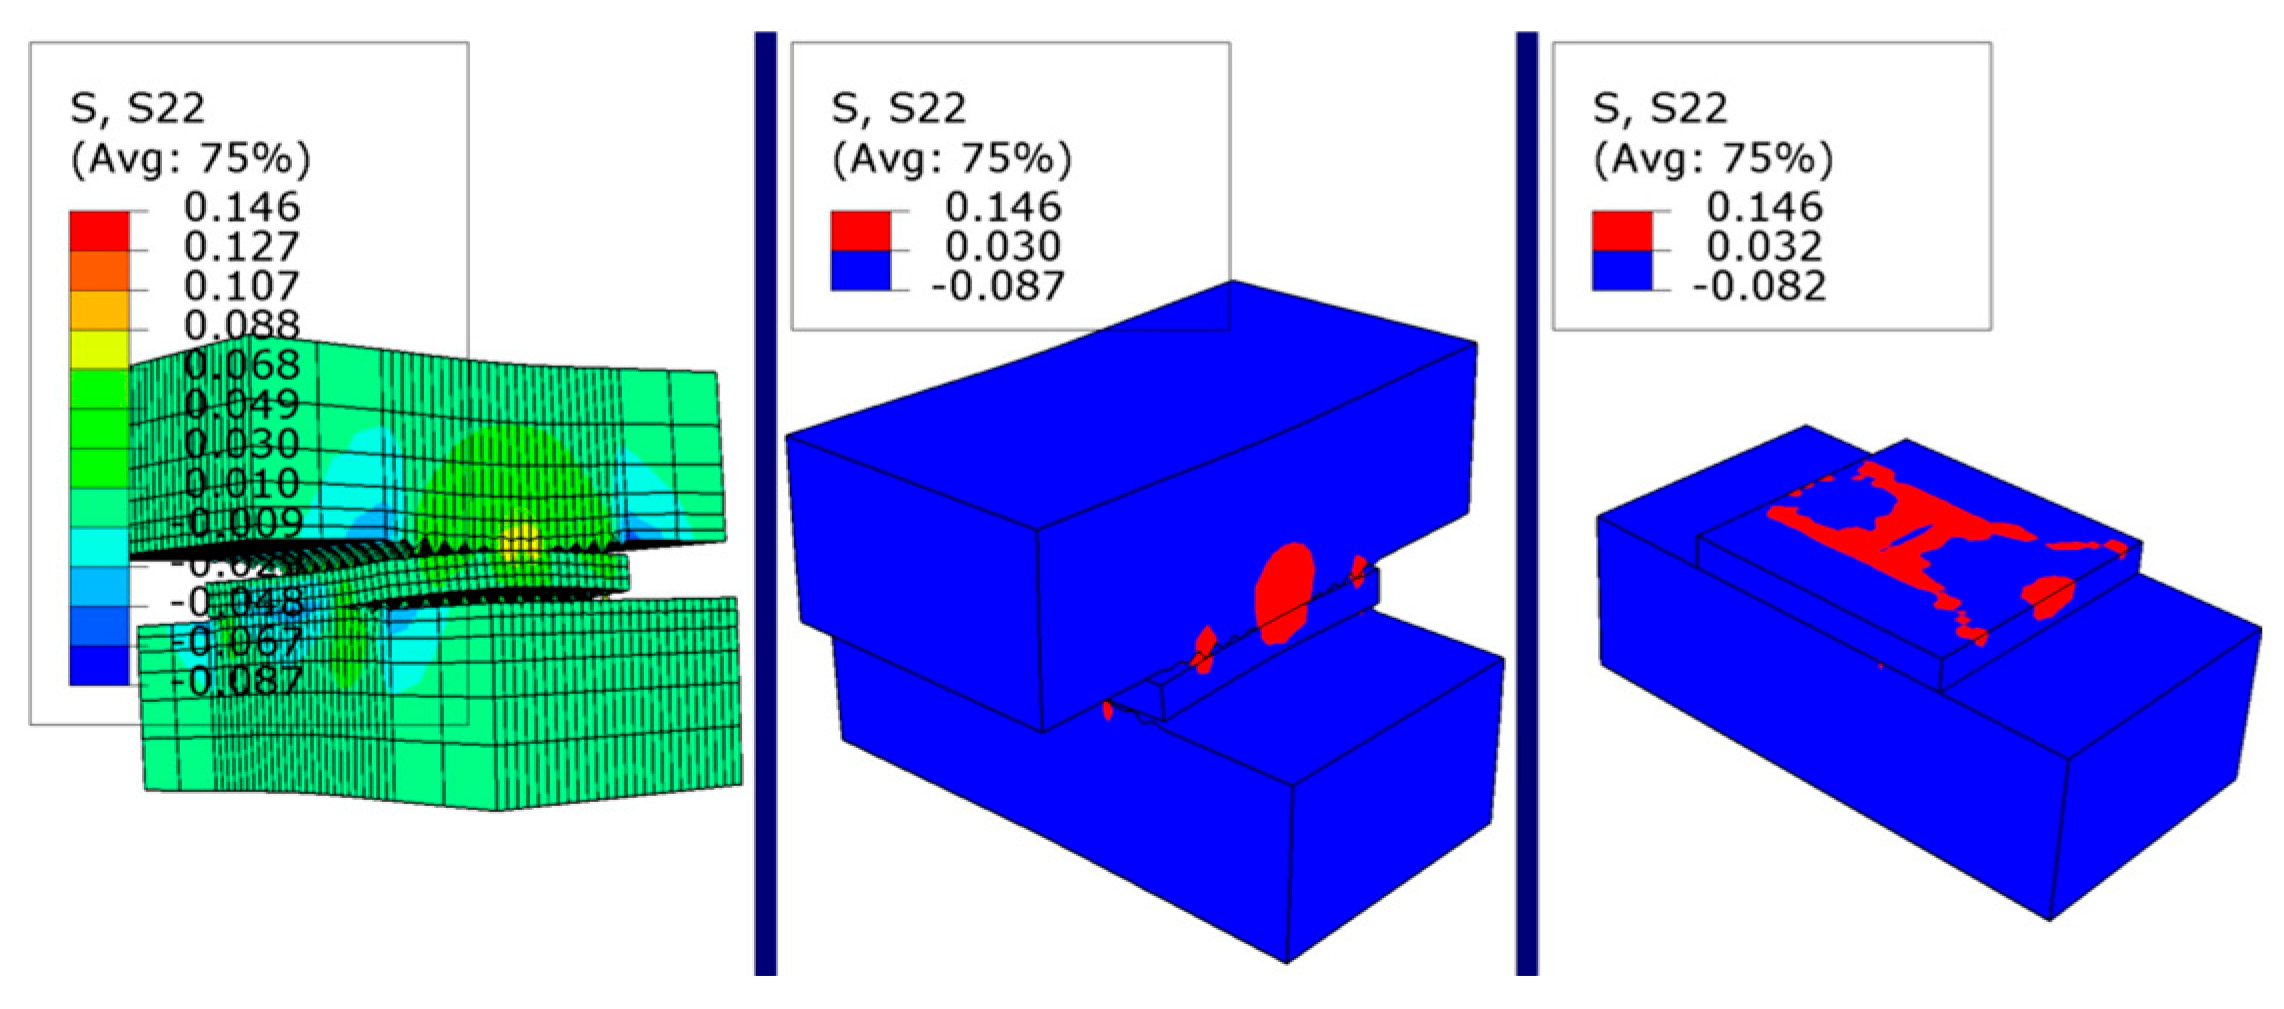
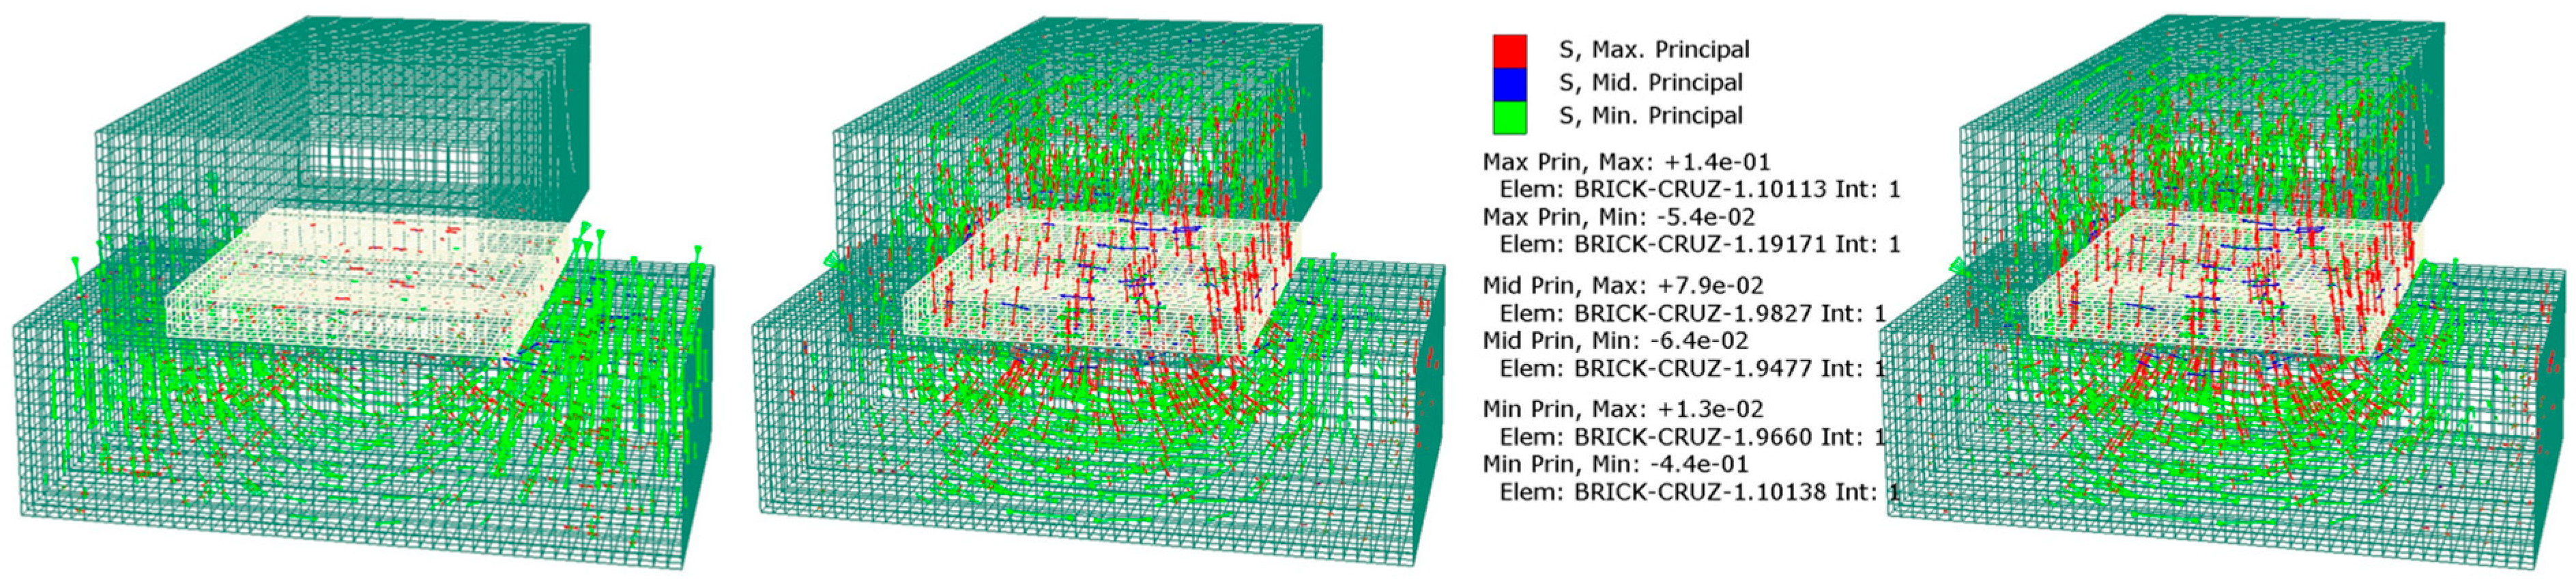
Numerical simulations of cross-type specimens were performed to assess the applicability of the proposed experimentally calibrated methodology. The models incorporated the CDP parameters for constituent materials (Section 4.1) and the traction–separation interface parameters derived from experimental characterisation (Section 4.3). Figure 11 shows the evolution of the normal stress field (S22) and damage distribution at progressive loading stages, and Figure 12 shows the corresponding principal stress vectors at the interface.
The numerical implementation demonstrates good agreement with experimental data. Validation metrics include peak load prediction within ±6% of experimental values, initial stiffness agreement within ±19%, and failure displacement prediction within ±5%.

5.2. Tangential Cohesive-Frictional (Shear) Behaviour and Failure

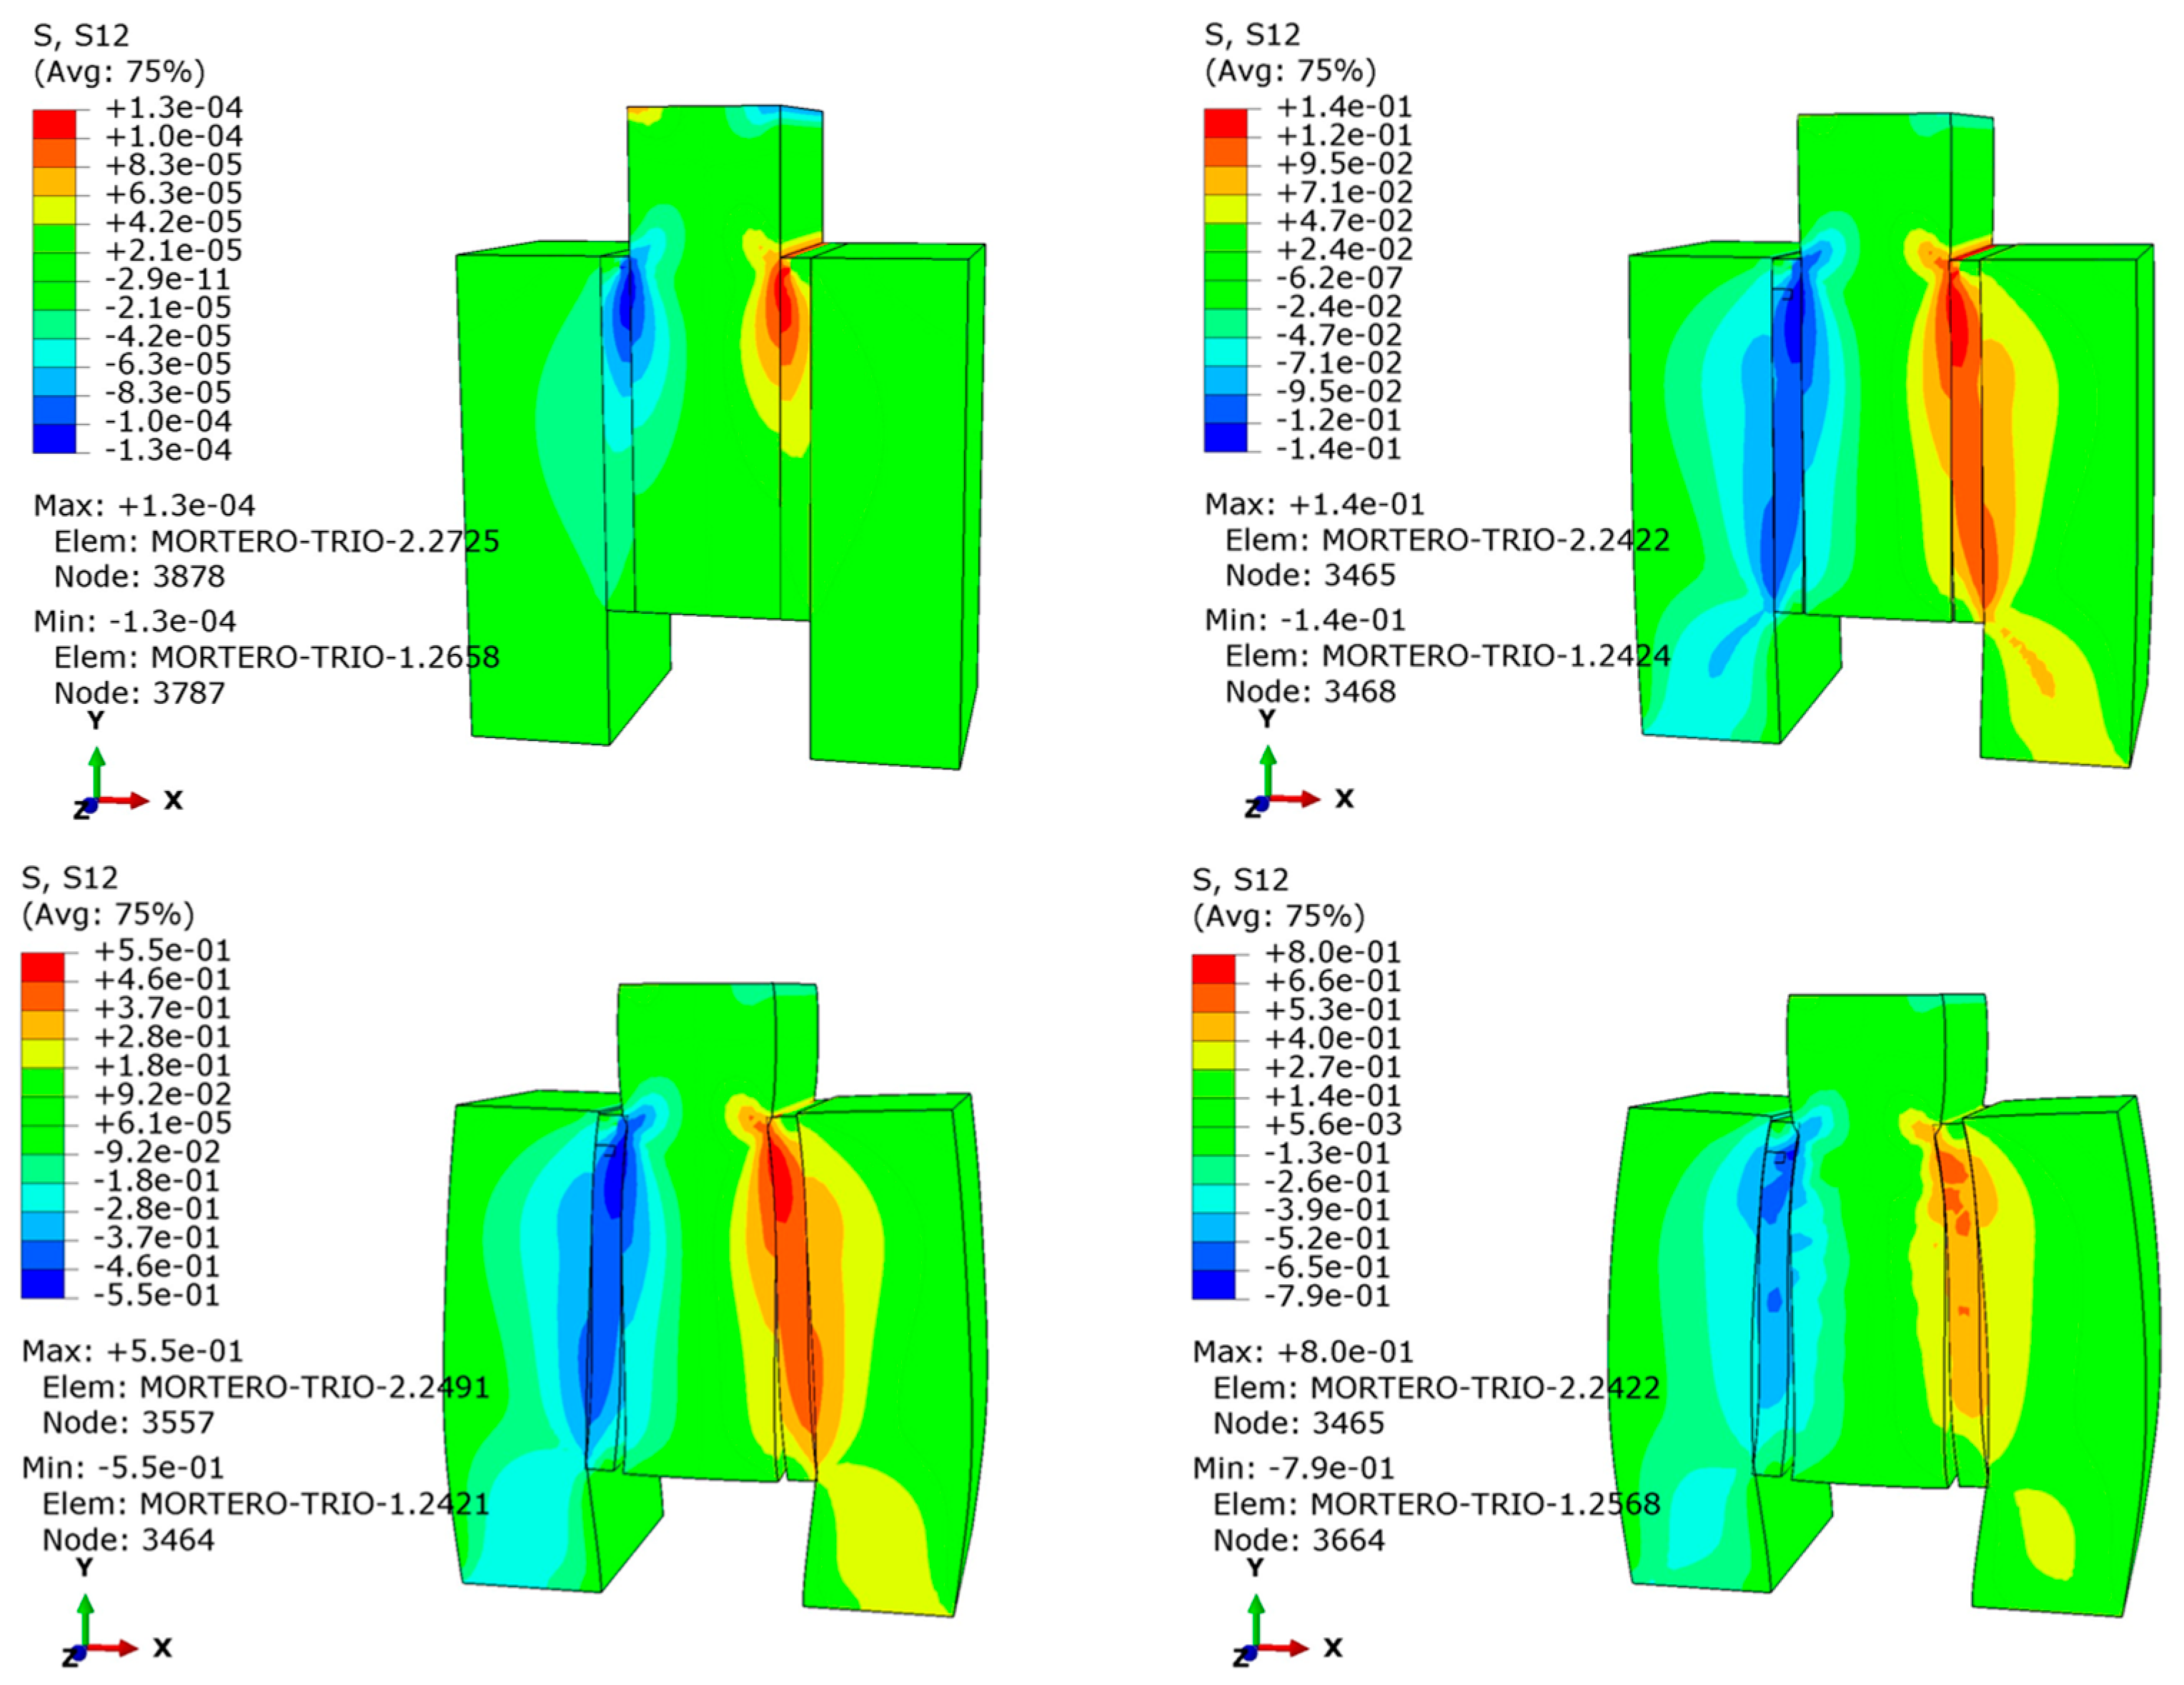
Numerical simulations of triplet-type specimens were performed to validate the proposed methodology under shear loading. It is noted that specimens were oriented vertically in the laboratory so that the tested joints corresponded to bed joints in a masonry wall; testing without normal pre-compression isolates the initial shear strength τ0. Figure 13 shows the evolution of shear stress fields at early and near-failure loading stages, and Figure 14 shows the corresponding resultant stress vectors.
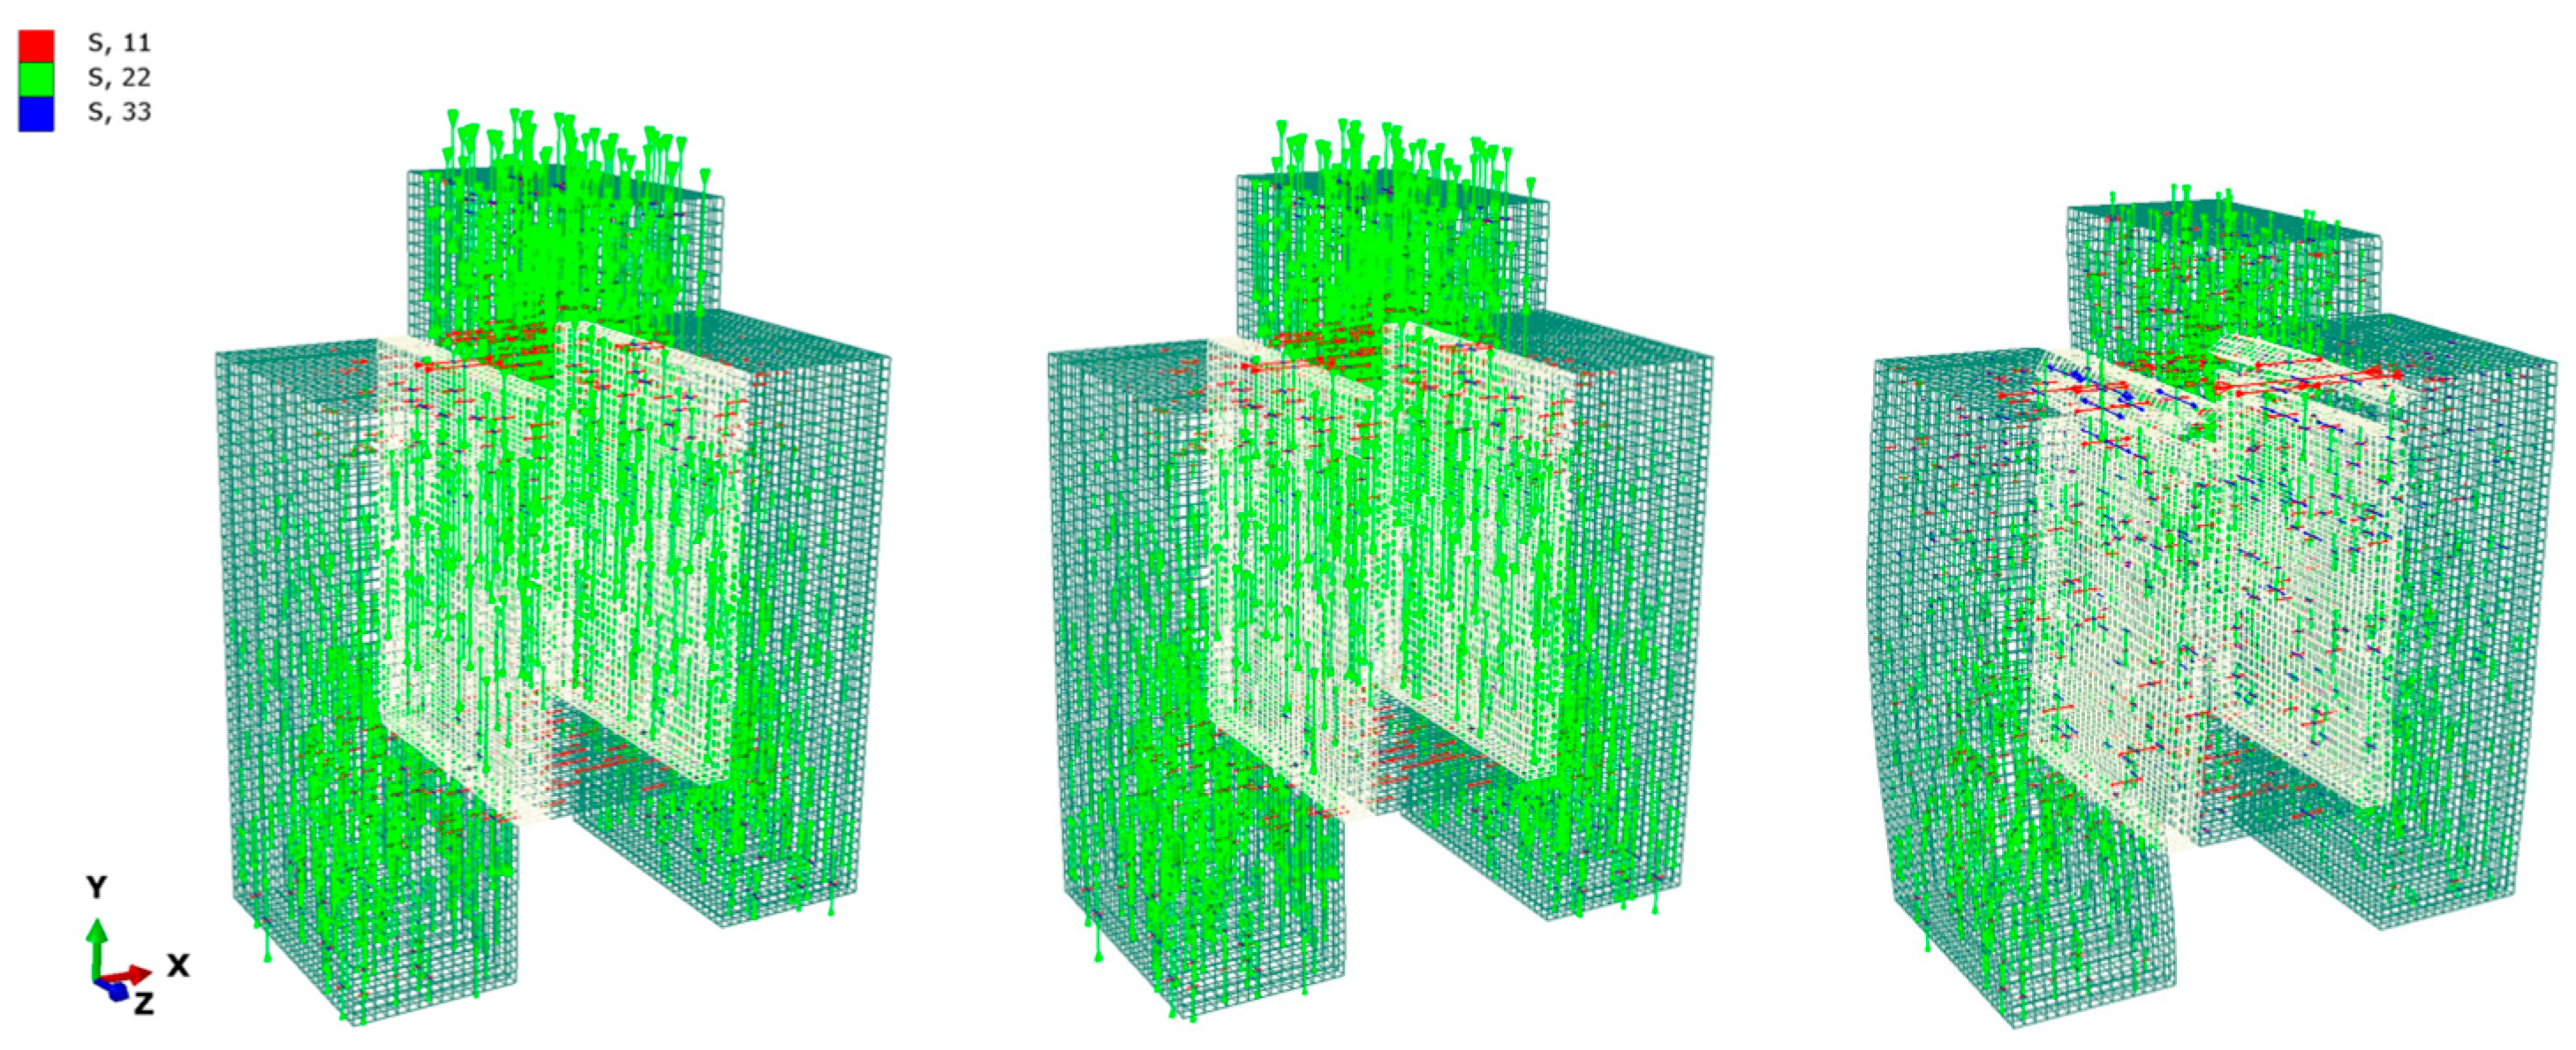
A significant finding revealed by detailed micromodelling is that under nominally pure shear loading, bending deformations develop in both brick units and mortar joints, inducing normal stresses at the brick–mortar interface prior to shear failure (Figure 13 and Figure 14). Consequently, interface failure under nominally pure shear involves the simultaneous activation of both normal adhesive strength and initial shear strength, demonstrating that the interface response is inherently coupled in the normal-tangential sense. This finding provides direct numerical evidence supporting the cohesive-frictional characterisation adopted in this study for the brick–mortar interface: shear resistance cannot be fully described by the tangential component alone, as the normal adhesive bond contributes non-negligibly even in the absence of applied normal compression. Simplified micromodelling approaches, which do not explicitly resolve the contact interface, are inherently unable to capture this coupling, underscoring the physical consistency and necessity of the detailed micromodelling framework proposed here.
Comparison of numerical predictions with the experimental data is shown in Figure 15b. Validation metrics include peak shear strength within ±1% of experimental values, initial stiffness agreement within ±4%, and qualitatively consistent post-peak softening behaviour.

5.3. Failure Mechanism Analysis

For cross-type specimens, failure initiated at stress concentrations near brick corners and propagated progressively across the interface, governed by normal adhesive strength with minimal tangential contribution. For triplet-type specimens, the coupled normal-tangential mechanism described in Section 5.2 governed failure: despite nominally pure shear loading, significant normal stresses developed at the interfaces due to specimen bending. Simplified micromodelling approaches are unable, by construction, to capture this failure mechanism, as they do not explicitly resolve the brick–mortar contact interface.

5.4. Discussion

The results of Section 5.1 and Section 5.2 confirm that the proposed experimentally calibrated formulations for contact stiffness parameters ( K n n , K s s , K t t ) provide a physically consistent basis for the detailed micromodelling of masonry interfaces. The close agreement between numerical predictions and experimental data confirms the applicability of the experimental calibration procedure for the tested material system. However, it should be noted that this validation was performed against the same experimental data used for calibration; the agreement therefore confirms the internal consistency of the methodology rather than constituting an independent predictive capability. Validation against data from different specimen geometries or material combinations is identified as a priority for future work.
The higher discrepancy in initial stiffness prediction for normal behaviour relative to peak load is consistent with the known sensitivity of stiffness measurements to local contact conditions and mortar shrinkage heterogeneity, effects reflected in the relatively high coefficient of variation for normal adhesive strength. Peak load, as an integral response quantity, is inherently less sensitive to local variability than initial stiffness.
The experimentally derived ratio K n n / K s s differs substantially from the approximation proposed by D’Altri [47], confirming that interface stiffness ratios could be sensitive to the specific material combination and cannot be reliably estimated without experimental data. The Lourenço–Rots equivalent stiffness formulation [26,32,33], whilst well-established, was derived within a simplified micromodelling framework and is not directly applicable to detailed micromodelling contexts where mortar joints and interfaces are explicitly resolved. The present methodology addresses both limitations by grounding contact stiffness parameters in experimentally measured traction-separation responses, providing a reproducible and material-specific calibration procedure.
The development of normal stresses at interfaces under nominally pure shear constitutes the key physical finding of this study. It demonstrates that the cohesive-frictional characterisation of the brick–mortar interface reflects the actual coupled nature of the failure mechanism rather than being a modelling convention, a coupling that is invisible to simplified micromodelling approaches and that has direct implications for the prediction of masonry shear capacity.
Under nominally pure shear conditions (Figure 13 and Figure 14), the normal stresses generated at the brick–mortar contact interface increase from approximately 0.014 MPa at 10% of the maximum tangential load to 0.076 MPa at 54% of the tangential load, reaching a maximum value of 0.137 MPa (corresponding to the normal adhesive strength of the interface) at 99.7% of the maximum tangential load. These results corroborate the fundamental role of the interface’s normal adhesive strength in the complex behaviour of masonry.

6. Limitations and Future Research Directions

The findings presented in this study should be interpreted within the context of the following limitations that define the validity domain of the proposed methodology and identify the areas that require further investigation.
Regarding material specificity, the calibration coefficients ξ n and ξ τ were derived for a specific combination of artisanal ceramic brick units and pre-mixed dry-set cement mortar with 15 mm joint thickness, representative of construction practice in Ecuador. Application to different masonry systems, including bricks of different manufacture or composition, lime or historic mortars, stone masonry, autoclaved aerated concrete blocks, or different joint thicknesses, requires independent experimental recalibration.
The study considered standard construction practices without special interface treatments; the effects of interface roughness enhancement, bonding agents, or surface preparations on contact stiffness parameters were not investigated.
The experimental programme included a limited number of specimens for interface characterisation (n = 5 per test type). Whilst sufficient for mean-behaviour calibration and proof-of-concept demonstration, this sample size is insufficient for comprehensive statistical characterisation of material variability.
The experimental configurations measure an effective contact stiffness, combining contributions from both the mortar layer and the brick–mortar interface. Complete separation would require either independent testing of mortar specimens alone or inverse identification procedures. As demonstrated in Section 3.2, this limitation has negligible practical impact for the tested material combination, since the failure stress at the interface is approximately 29.7 times smaller than the mortar tensile strength, making the mortar elastic deformation contribution at interface failure loads negligibly small. The reported stiffness values should nonetheless be interpreted as effective interface parameters for the tested joint configuration.
Regarding friction coefficient characterisation, only the cohesive shear strength component τ0 was determined experimentally. The brick–mortar friction coefficient (μ) governing post-failure frictional sliding was not independently characterised experimentally for this specific material combination; a value of μ = 0.74 adopted from the literature was used in the numerical model.
Concerning validation scope, as discussed in Section 5.4, the numerical validation confirms internal consistency of the calibration methodology rather than independent predictive capability. Validation against independent datasets from different specimen geometries, loading configurations, or material combinations is identified as a priority for future research.
Finally, the study was limited to small-scale specimens under monotonic loading. Scale effects on interface behaviour and the influence of dynamic and cyclic loading on the predictive capability of the proposed approach require further investigation.

7. Conclusions

This study developed and validated an experimental-numerical methodology for calibrating contact stiffness parameters ( K n n , K s s , K t t ) for the detailed finite element micromodelling of brick–mortar interfaces in masonry structures. The methodology was applied to a masonry system comprising artisanal ceramic brick units and pre-mixed dry-set cement mortar with 15 mm joint thickness, representative of construction practice in Ecuador.
Experimentally calibrated formulations (Equations (27) and (28)) were proposed, yielding calibration coefficients ξ n = 8.2 × 10 6   N / m m 5 and ξ τ = 9.3 × 10 6   N / m m 5 for the gross contact area. These values are specific to the tested material combination and require recalibration for other masonry systems.
The numerical implementation in Abaqus, incorporating a concrete damaged plasticity model for quasi-brittle constituent materials and traction-separation laws for interface behaviour, demonstrated close agreement with experimental load-displacement data. Peak load predictions were within ±6% for normal adhesive behaviour and ±1% for initial shear behaviour, confirming the applicability of the calibration procedure.
A key physical finding is that normal stresses develop at brick–mortar interfaces even under nominally pure shear loading, as a consequence of bending deformations in both brick units and mortar joints. This demonstrates that normal adhesive strength plays a significant role in shear resistance even in the absence of applied normal compression, highlighting the coupled nature of normal-tangential interface behaviour, and provides physical justification for the cohesive-frictional characterisation adopted in this study. This coupling is not captured by simplified micromodelling approaches, demonstrating the value of detailed micromodelling for representing complex interface mechanics under biaxial (combined normal-tangential) stress conditions.
The main contribution of this work is a systematic experimental-numerical framework for contact stiffness calibration in the detailed micromodelling of masonry. While the specific coefficient values are material-dependent and non-transferable without recalibration, the methodology itself, comprising small-scale cross-type and triplet-type experimental characterisation, CDP model calibration for constituent materials, and traction-separation interface implementation in Abaqus, is applicable to other brick–mortar combinations upon appropriate experimental characterisation. In addition, the proposed framework provides a physically consistent and experimentally grounded numerical basis for characterisation of the elastoplastic behaviour of masonry and the subsequent determination of its ductility coefficient, which is a parameter of fundamental importance in the seismic assessment of masonry structures.
Future research will extend the proposed methodology to diverse types of units and mortar compositions, investigate dynamic and cyclic loading effects, and validate the predictive capability of the proposed approach through independent testing at reduced and full structural scale.

Author Contributions

Conceptualization, D.C.-Z.; methodology, D.C.-Z. and O.V.K.; software, D.C.-Z.; validation, O.V.K.; formal analysis, D.C.-Z.; investigation, D.C.-Z. and O.V.K.; resources, D.C.-Z.; data curation, D.C.-Z. and O.V.K.; writing—original draft preparation, D.C.-Z.; writing—review and editing, D.C.-Z. and O.V.K.; visualization, D.C.-Z.; supervision, O.V.K.; final review, O.V.K.; funding acquisition, O.V.K. and D.C.-Z. All authors have read and agreed to the published version of the manuscript.

Funding

The Article Processing Charge (APC) was funded by the Moscow State University of Civil Engineering (grant number not applicable). This research was funded by the Head Regional Shared Research Facilities of the Moscow State University of Civil Engineering and the Department of Research and Innovation of the Catholic University of Cuenca (grant PICVII19-87 Universidad Católica de Cuenca).

Data Availability Statement

The original contributions presented in the study are included in the article, further inquiries can be directed to the corresponding author.

Conflicts of Interest

The authors declare no conflicts of interest. The funders had no role in the design of the study; in the collection, analyses, or interpretation of data; in the writing of the manuscript; or in the decision to publish the results.

References

  1. Gabor, A.; Ferrier, E.; Jacquelin, E.; Hamelin, P. Analysis and Modelling of the In-Plane Shear Behaviour of Hollow Brick Masonry Panels. Constr. Build. Mater. 2006, 20, 308–321. [Google Scholar] [CrossRef]
  2. Al-Sibahy, A.; Edwards, R. Effect of Chases with Renovation Techniques on the Load Carrying Capacity of Masonry Walls. Infrastructures 2021, 6, 160. [Google Scholar] [CrossRef]
  3. Ullah Khan, S.; Naseer, A.; Fahim, M.; Ashraf, M.; Badshah, E. Experimental Seismic Performance Evaluation of Brick Masonry Cavity-Wall Buildings. Structures 2022, 41, 1781–1791. [Google Scholar] [CrossRef]
  4. Babatunde, S.A. Review of Strengthening Techniques for Masonry Using Fiber Reinforced Polymers. Compos. Struct. 2017, 161, 246–255. [Google Scholar] [CrossRef]
  5. Rast, R. Masonry and Residential Building in Germany: Status 2019 and Forecast for 2021. Mauerwerk 2019, 23, 123–127. [Google Scholar] [CrossRef]
  6. Instituto Nacional de Estadística y Geografía. Encuesta Nacional de Ingresos y Gastos de Los Hogares (ENIGH) 2020; Instituto Nacional de Estadística y Geografía: Aguascalientes, Mexico, 2020.
  7. Instituto Nacional de Estadística y Censos. Encuesta de Edificaciones 2017; INEC: Quito, Ecuador, 2018.
  8. Cajamarca-Zuniga, D.; Campos, D. Definition of the Most Commonly Used Ceramic Brick for Construction in Ecuador: Type and Dimensions. Mater. Today Proc. 2023, in press. [Google Scholar] [CrossRef]
  9. Office of the Registrar General & Census Commissioner. H-03 B: Census Houses by Predominant Material of the Walls (Excluding Locked/Vacant Houses), India—2011; Office of the Registrar General & Census Commissioner: New Delhi, India, 2011.
  10. Cattari, S.; Calderoni, B.; Caliò, I.; Camata, G.; de Miranda, S.; Magenes, G.; Milani, G.; Saetta, A. Nonlinear Modeling of the Seismic Response of Masonry Structures: Critical Review and Open Issues towards Engineering Practice. Bull. Earthq. Eng. 2022, 20, 1939–1997. [Google Scholar] [CrossRef]
  11. Lagomarsino, S.; Giovinazzi, S. Macroseismic and Mechanical Models for the Vulnerability and Damage Assessment of Current Buildings. Bull. Earthq. Eng. 2006, 4, 415–443. [Google Scholar] [CrossRef]
  12. D’Ayala, D.F.; Paganoni, S. Assessment and Analysis of Damage in L’Aquila Historic City Centre after 6th April 2009. Bull. Earthq. Eng. 2011, 9, 81–104. [Google Scholar] [CrossRef]
  13. Roca, P.; Cervera, M.; Gariup, G.; Pela’, L. Structural Analysis of Masonry Historical Constructions. Classical and Advanced Approaches. Arch. Comput. Methods Eng. 2010, 17, 299–325. [Google Scholar] [CrossRef]
  14. Anthoine, A. Derivation of the In-Plane Elastic Characteristics of Masonry through Homogenization Theory. Int. J. Solids Struct. 1995, 32, 137–163. [Google Scholar] [CrossRef]
  15. Savalle, N.; Lourenço, P.B.; Milani, G. Joint Stiffness Influence on the First-Order Seismic Capacity of Dry-Joint Masonry Structures: Numerical DEM Investigations. Appl. Sci. 2022, 12, 2108. [Google Scholar] [CrossRef]
  16. Capozucca, R. Shear Behaviour of Historic Masonry Made of Clay Bricks. Open Constr. Build. Technol. J. 2011, 5, 89–96. [Google Scholar] [CrossRef]
  17. Doğan, O.; Odacıoğlu, O.G. An Experimental Study To Determine Sliding Shear Strength And Internal Frictional Coefficient Of Clay Brick Wall In A Masonry Building. Int. J. Eng. Res. Dev. 2019, 11, 670–676. [Google Scholar] [CrossRef]
  18. Milani, G.; Lourenço, P.B.; Tralli, A. Homogenised Limit Analysis of Masonry Walls, Part I: Failure Surfaces. Comput. Struct. 2006, 84, 166–180. [Google Scholar] [CrossRef]
  19. Lagomarsino, S.; Penna, A.; Galasco, A.; Cattari, S. TREMURI Program: An Equivalent Frame Model for the Nonlinear Seismic Analysis of Masonry Buildings. Eng. Struct. 2013, 56, 1787–1799. [Google Scholar] [CrossRef]
  20. Quagliarini, E.; Maracchini, G.; Clementi, F. Uses and Limits of the Equivalent Frame Model on Existing Unreinforced Masonry Buildings for Assessing Their Seismic Risk: A Review. J. Build. Eng. 2017, 10, 166–182. [Google Scholar] [CrossRef]
  21. Roca, P.; Molins, C.; Marí, A.R. Strength Capacity of Masonry Wall Structures by the Equivalent Frame Method. J. Struct. Eng. 2005, 131, 1601–1610. [Google Scholar] [CrossRef]
  22. Rinaldi, G.; Amadio, C.; Macorini, L. A Macro-Model with Nonlinear Springs for Seismic Analysis of URM Buildings. Earthq. Eng. Struct. Dyn. 2016, 45, 2261–2281. [Google Scholar] [CrossRef]
  23. Berto, L.; Saetta, A.; Scotta, R.; Vitaliani, R. An Orthotropic Damage Model for Masonry Structures. Int. J. Numer. Methods Eng. 2002, 55, 127–157. [Google Scholar] [CrossRef]
  24. Milani, G.; Beyer, K.; Dazio, A. Upper Bound Limit Analysis of Meso-Mechanical Spandrel Models for the Pushover Analysis of 2D Masonry Frames. Eng. Struct. 2009, 31, 2696–2710. [Google Scholar] [CrossRef]
  25. Valente, M.; Milani, G. Seismic Assessment of Historical Masonry Structures through Advanced Nonlinear Dynamic Simulations: Applications to Castles, Churches, and Palaces. In Numerical Modeling of Masonry and Historical Structures; Woodhead Publishing: Cambridge, UK, 2019; pp. 163–200. [Google Scholar] [CrossRef]
  26. Lourenço, P.B. Computational Strategies for Mansory Structures. Doctoral Dissertation, Delft University, Delft, The Netherlands, 1996. [Google Scholar]
  27. Jäger, W.; Bakeer, T.; Schöps, P. Simulation of Masonry in ANSYS and LS-DYNA. The Features and Challenges. In Proceedings of the ANSYS Conference & 27th CADFEM Users’ Meeting, Leipzig, Germany, 18–20 November 2009; pp. 1–15. [Google Scholar]
  28. Bakeer, T. Collapse Analysis of Masonry Structures under Earhquake Actions. Ph. D. Thesis, Technische Universität Dresden, Dresden, Germany, 2009. [Google Scholar]
  29. Zucchini, A.; Lourenço, P.B. A Micro-Mechanical Homogenisation Model for Masonry: Application to Shear Walls. Int. J. Solids Struct. 2009, 46, 871–886. [Google Scholar] [CrossRef]
  30. Abdulla, K.F.; Cunningham, L.S.; Gillie, M. Simulating Masonry Wall Behaviour Using a Simplified Micro-Model Approach. Eng. Struct. 2017, 151, 349–365. [Google Scholar] [CrossRef]
  31. Pulatsu, B.; Erdogmus, E.; Lourenço, P.B.; Lemos, J.V.; Tuncay, K. Simulation of the In-Plane Structural Behavior of Unreinforced Masonry Walls and Buildings Using DEM. Structures 2020, 27, 2274–2287. [Google Scholar] [CrossRef]
  32. Lourenço, P.B.; Rots, J.G.; Blaauwendraad, J. Two Approaches for the Analysis of Masonry Structures. Heron 1995, 40, 313–340. [Google Scholar]
  33. Lourenço, P.B.; Rots, J.G. Multisurface Interface Model for Analysis of Masonry Structures. J. Eng. Mech. 1997, 123, 660–668. [Google Scholar] [CrossRef]
  34. Greco, F.; Leonetti, L.; Luciano, R.; Pascuzzo, A.; Ronchei, C. A Detailed Micro-Model for Brick Masonry Structures Based on a Diffuse Cohesive-Frictional Interface Fracture Approach. Procedia Struct. Integr. 2020, 25, 334–347. [Google Scholar] [CrossRef]
  35. Ghiga, D.A.; Aranu, N.; Ungureanu, D.; Isopescu, D.N.; Oprian, G.; Huditeanu, I. A Detailed Micro-Modelling Approach for the Diagonal Compression Test of Strengthened Stone Masonry Walls. IOP Conf. Ser. Mater. Sci. Eng. 2020, 916, 012041. [Google Scholar] [CrossRef]
  36. D’Altri, A.M.; Cannizzaro, F.; Petracca, M.; Talledo, D.A. Nonlinear Modelling of the Seismic Response of Masonry Structures: Calibration Strategies. Bull. Earthq. Eng. 2021, 19, 11–55. [Google Scholar] [CrossRef]
  37. Lourenço, P.B.; Oliveira, D.V.; Roca, P.; Orduña, A. Dry Joint Stone Masonry Walls Subjected to In-Plane Combined Loading. J. Struct. Eng. 2005, 131, 1665–1673. [Google Scholar] [CrossRef]
  38. Pulatsu, B.; Gonen, S.; Erdogmus, E.; Lourenço, P.B.; Lemos, J.V.; Prakash, R. In-Plane Structural Performance of Dry-Joint Stone Masonry Walls: A Spatial and Non-Spatial Stochastic Discontinuum Analysis. Eng. Struct. 2021, 242, 16. [Google Scholar] [CrossRef]
  39. Endo, Y.; Miyoshi, K. Meso-Scale Numerical Simulation of the Mechanical Behaviour of Brick Masonry in Earth Mortar. J. Build. Eng. 2023, 74, 4–17. [Google Scholar] [CrossRef]
  40. Silva, L.C.; Lourenço, P.B.; Milani, G. Derivation of the Out-of-Plane Behaviour of Masonry through Homogenization Strategies: Micro-Scale Level. Comput. Struct. 2018, 209, 30–43. [Google Scholar] [CrossRef]
  41. Aref, A.J.; Dolatshahi, K.M. A Three-Dimensional Cyclic Meso-Scale Numerical Procedure for Simulation of Unreinforced Masonry Structures. Comput. Struct. 2013, 120, 9–23. [Google Scholar] [CrossRef]
  42. Chaimoon, K.; Attard, M.M. Modeling of Unreinforced Masonry Walls under Shear and Compression. Eng. Struct. 2007, 29, 2056–2068. [Google Scholar] [CrossRef]
  43. Halabian, A.M.; Mirshahzadeh, L.; Hashemol-Hosseini, H. Non-Linear Behavior of Unreinforced Masonry Walls with Different Iranian Traditional Brick-Work Settings. Eng. Fail. Anal. 2014, 44, 46–65. [Google Scholar] [CrossRef]
  44. Page, A.W. The Biaxial Compressive Strength of Brick Masonry. Proc. Inst. Civ. Eng. 1981, 71, 893–906. [Google Scholar] [CrossRef]
  45. Lemos, J.V. Discrete Element Modeling of Masonry Structures. Int. J. Archit. Herit. 2007, 1, 190–213. [Google Scholar] [CrossRef]
  46. Kabantsev, O.V. Scientific Basis of the Structural Theory of Masonry for the Assessment of Limit States of Masonry Structures in Earthquake Resistant Buildings. Doctoral Dissertation, Moscow State University of Civil Engineering, Moscow, Russia, 2016. (In Russian) [Google Scholar]
  47. D’Altri, A.M.; Messali, F.; Rots, J.G.; Castellazzi, G.; de Miranda, S. A Damaging Block-Based Model for the Analysis of the Cyclic Behaviour of Full-Scale Masonry Structures. Eng. Fract. Mech. 2019, 209, 423–448. [Google Scholar] [CrossRef]
  48. Cajamarca-Zuniga, D.; Kabantsev, O.V. Particular Strength Criteria for Microstructural Analysis of Masonry. Key Eng. Mater. 2023, 959, 185–195. [Google Scholar] [CrossRef]
  49. Kabantsev, O.V. Modeling Nonlinear Deformation and Destruction Masonry under Biaxial Stresses Part 2—Strength Criteria and Numerical Experiment. Appl. Mech. Mater. 2015, 725–726, 808–819. [Google Scholar] [CrossRef]
  50. Vilppo, J.; Kouhia, R.; Hartikainen, J.; Kolari, K.; Fedoroff, A.; Calonius, K. Anisotropic Damage Model for Concrete and Other Quasi-Brittle Materials. Int. J. Solids Struct. 2021, 225, 111048. [Google Scholar] [CrossRef]
  51. Kupfer, H.; Hilsdorf, H.K.; Rusch, H. Behavior of Concrete Under Biaxial Stresses. ACI J. Proc. 1969, 66, 656–666. [Google Scholar] [CrossRef]
  52. Kachanov, L. Time of the Rupture Process under Creep Contitions. Bull. Acad. Sci. USSR 1958, 26–31. [Google Scholar]
  53. Rabotnov, Y. Fracture Due to Creep. J. Appl. Mech. Tech. Phys. 1963, 113–123. [Google Scholar]
  54. Lemaitre, J. Evalution of Dissipation and Damage in Metals Submitted to Dynamic Loading. In Proceedings of the International Conference of Mechanical Behavior of Materials, Kyoto, Japan, 15–20 August 1971. [Google Scholar]
  55. Hafezolghorani, M.; Hejazi, F.; Vaghei, R.; Jaafar, M.S.B.; Karimzade, K. Simplified Damage Plasticity Model for Concrete. Struct. Eng. Int. 2017, 27, 68–78. [Google Scholar] [CrossRef]
  56. Jeeho, L.; Gregory L., F. Plastic-Damage Model for Cyclic Loading of Concrete Structures. J. Eng. Mech. 1998, 124, 892–900. [Google Scholar] [CrossRef]
  57. Kmiecik, P.; Kaminski, M. Modelling of Reinforced Concrete Structures and Composite Structures with Concrete Strength Degradation Taken into Consideration. Arch. Civ. Mech. Eng. 2011, 11, 623–636. [Google Scholar] [CrossRef]
  58. Alfarah, B.; López-Almansa, F.; Oller, S. New Methodology for Calculating Damage Variables Evolution in Plastic Damage Model for RC Structures. Eng. Struct. 2017, 132, 70–86. [Google Scholar] [CrossRef]
  59. Dassault Systemes Abaqus Analysis User’s Guide; Dassault Systèmes Simulia Corp.: Providence, RI, USA, 2016.
  60. Schlegel, R. Numerische Berechnung von Mauerwerkstrukturen in Homogenen Und Diskreten Modellierungsstrategien. Doctoral Dissertation, Bauhaus-Universität Weimar, Weimar, Germany, 2004. [Google Scholar]
  61. Hill, R. A Theory of the Yielding and Plastic Flow of Anisotropic Metals. Proc. R. Soc. London. Ser. A. Math. Phys. Sci. 1948, 193, 281–297. [Google Scholar] [CrossRef]
  62. GOST R 58527-2019; Wall Materials. Methods for Determination of Ultimate Compressive and Bending Strength. Russian Standards Agency: Moscow, Russia, 2021.
  63. EN 772-1; Methods of Test for Masonry Units—Part 1: Determination of Compressive Strength. European Committee for Standardization: Brussels, Belgium, 2000.
  64. ASTM C-67; Standard Test Methods for Sampling and Testing Brick and Structural Clay Tile. ASTM International: West Conshohocken, PA, USA, 2019.
  65. ASTM C270-10; Standard Specification for Mortar for Unit Masonry. ASTM International: West Conshohocken, PA, USA, 2010.
  66. EN 1015-11; Methods of Test for Mortar for Masonry—Part 11 Determination of Flexural and Compressive Strength of Hardened Mortar. European Committee for Standardization: Brussels, Belgium, 2019.
  67. EN 998-2; BSI Standards Publication Specification for Mortar for Masonry Part 2: Masonry Mortar. BSI Standards Publication: London, UK, 2016.
  68. Cajamarca-Zuniga, D.; Kabantsev, O.V.; Campos, D. Geometric Characterization of Solid Ceramic Bricks for Construction in Ecuador. Struct. Mech. Eng. Constr. Build. 2023, 19, 329–336. [Google Scholar] [CrossRef]
  69. INTACO. Mortero Para Pegar Bloques Pegablok Tipo S; INTACO: Guayaquil, Ecuador, 2022; Available online: https://www.intaco.com/costa-rica/wp-content/uploads/sites/2/2020/10/ft_pegablok_tipo_s_corp.pdf (accessed on 17 July 2026).
  70. ASTM C321-00; Standard Test Method for Bond Strength of Mortar to Masonry Units. ASTM International: West Conshohocken, PA, USA, 2012.
  71. Maheri, M.R.; Motielahi, F.; Najafgholipour, M.A. The Effects of Pre and Post Construction Moisture Condition on the In-Plane and out-of-Plane Strengths of Brick Walls. Mater. Struct. Constr. 2011, 44, 541–559. [Google Scholar] [CrossRef]
  72. EN 1052-3-2002; Methods of Test for Masonry—Part 3—Shear Strength. European Committee for Standarization: European Union: Brussels, Belgium, 2007.
  73. INN NCh 167. Of2001; Building Construction—Ceramic Bricks—Tests Methods. Instituto Nacional de Normalización: Santiago, Chile, 2001.
  74. Pluijm, R.v.d. Out-of-Plane Bending of Masonry: Behaviour and Strength. Doctoral Dissertation, Technische Universiteit Eindhoven, Eindhoven, The Netherlands, 1999. [Google Scholar]
  75. Nowak, R.; Kania, T.; Derkach, V.; Orłowicz, R.; Halaliuk, A.; Ekiert, E.; Jaworski, R. Strength Parameters of Clay Brick Walls with Various Directions of Force. Materials 2021, 14, 6461. [Google Scholar] [CrossRef] [PubMed]
  76. Yokel, F.Y.; Fattal, G.S. Failure Hypothesis for Masonry Shearwalls; National Bureau of Standards: Washington, DC, USA, 1975. [Google Scholar]
Figure 1. Biaxial stress state in masonry and development of shear and normal stresses at bed joints, where S is the horizontal shear force; a, b, c, d denote the corners of the masonry element. The vertical arrows indicate compressive loads, whose non-uniform distribution is induced by the overturning effect of S. In the internal mechanisms, the blue arrows denote principal compressive stresses and the red arrows denote principal tensile stresses. In the right detailed inset, bold blue arrows represent shear stress parallel to the horizontal joint, and bold red arrows represent normal tensile stress perpendicular to the horizontal joint.
Buildings 16 02905 g001
Figure 2. Numerical modelling approaches for masonry: (a) macromodelling; (b) simplified micromodelling; (c) detailed micromodelling.
Buildings 16 02905 g002
Figure 3. Adhesive and cohesive damage behaviour of the contact interface: (a) idealised bilinear force–separation relationship showing elastic response, damage initiation at δ0, and complete decohesion at δf; (b) corresponding traction–separation law, with stiffness degradation governed by the scalar damage variable κ, illustrating the evolution of cohesive tractions during damage.
Buildings 16 02905 g003
Figure 4. Uniaxial stress–strain response of quasi-brittle materials based on the damaged plasticity model: (a) compressive response; (b) tensile response. The inelastic strain ε i n represents the total permanent deformation, comprising the plastic strain ε p l (due to yielding) and the additional component attributed to damage-induced stiffness degradation, as defined by Equation (18).
Buildings 16 02905 g004
Figure 5. Experimental tests on constituent materials and small-scale masonry specimens: (a) compression and flexure tests on brick units; (b) compression and flexure tests on mortar specimens; (c) direct tension test on cross-type specimen for normal adhesive strength; (d) shear test on triplet-type specimen for initial shear strength.
Buildings 16 02905 g005
Figure 6. CDP model parameters for mortar: (a) compressive stress–inelastic strain response; (b) tensile stress–inelastic strain response; (c) compressive damage parameter evolution; (d) tensile damage parameter evolution.
Buildings 16 02905 g006
Figure 7. CDP model parameters for brick: (a) compressive stress–inelastic strain response; (b) tensile stress–inelastic strain response; (c) compressive damage parameter evolution; (d) tensile damage parameter evolution.
Buildings 16 02905 g007
Figure 8. Small-scale masonry specimens, where B = 130 mm, L = 250 mm, and H = 75 mm for the brick units used in this study: (a) cross-type specimen for normal adhesive strength testing (two brick units, single 15 mm mortar joint, contact area ~130 × 130 mm); (b) triplet-type specimen for initial shear strength testing (three brick units, two 15 mm mortar joints, contact area ~130 × 180 mm).
Buildings 16 02905 g008
Figure 9. Mesh sensitivity analysis: force–displacement response for three discretisation levels (coarse: brick 35 mm, mortar 15 mm; medium: brick 15 mm, mortar 15 mm; and fine: brick 7.5 mm, mortar 5 mm). All three meshes yield consistent peak load predictions; post-peak oscillations are a known artefact of the Abaqus/Explicit solver under quasi-static loading and do not affect the peak load or pre-peak response.
Buildings 16 02905 g009
Figure 10. Failure surfaces of brick–mortar contact interfaces in small-scale specimens, showing a peripheral zone of incomplete bond attributed to mortar shrinkage during curing: (a) tensile failure in cross-type specimens; (b) shear failure in triplet-type specimens.
Buildings 16 02905 g010
Figure 11. Normal stress field distribution and damage evolution in the cross-type masonry model under normal adhesive loading at the brick–mortar interface.
Buildings 16 02905 g011
Figure 12. Principal stress vectors illustrating damage evolution in the cross-type masonry model under normal adhesive loading.
Buildings 16 02905 g012
Figure 13. Evolution of shear stress fields in the triplet-type masonry model under shear loading (parallel to bed joints) at different loading stages, evidencing the development of normal stresses under nominally pure shear (deformations scaled 40 times on x-axis and 5 times on y-axis).
Buildings 16 02905 g013
Figure 14. Resultant stress vectors illustrating damage evolution in the triplet-type masonry model under shear loading (parallel to bed joints) at three progressive loading stages (deformations scaled 40 times on x-axis and 5 times on y-axis).
Buildings 16 02905 g014
Figure 15. Experimental and numerical stress-displacement curves for brick–mortar interface behaviour: (a) normal adhesive behaviour of cross-type specimens; (b) tangential cohesive-frictional behaviour of triplet-type specimens.
Buildings 16 02905 g015
Table 1. Experimental physical and mechanical properties of brick units and mortar.
MaterialPropertyUnitnMeanSDCV %95% CI for the Mean
Brick unitDensitykg/m3101795108.26.03[1717.6; 1872.3]
Compressive strengthMPa1012.591.4911.8[11.52; 13.65]
Flexural strength (modulus of rupture)MPa102.240.3314.7[2.00; 2.48]
Elastic modulusMPa-310---
MortarDensitykg/m3102311149.36.5[2204.5; 2418.2]
Compressive strengthMPa814.281.6911.8[12.87; 15.68]
Flexural strength (modulus of rupture)MPa84.100.389.3[3.52; 4.11]
Elastic modulusMPa-3289---
Table 2. Experimental tension and compression stress–strain values for brick and mortar.
Clay BrickMortar
StrainStress
(MPa)
StrainStress
(MPa)
Tension0.00000.000.00000.00
0.00722.240.00124.10
0.00780.300.00131.03
0.01400.100.00200.57
0.00280.43
0.00400.20
Compression 0.00000.000.00000.00
0.02999.260.003511.50
0.034910.500.004513.52
0.040111.370.005514.28
0.046812.130.006512.95
0.053512.590.00806.56
0.060012.160.01003.53
0.065010.990.01252.02
0.07268.000.02250.21
0.08006.00
Table 3. Stress, damage, and strain parameters of the CDP model for mortar in Abaqus.
Stress (MPa)Damage
Parameter
Degraded Elastic ModulusElastic StrainTotal Inelastic StrainPlastic Strain
σ κ E = 1 κ E 0 ε e l , 0 ε i n ε p l
Tension0.0000.00032890.000000.000000.00000
4.1000.00032890.001250.000000.00000
0.6150.8504930.000190.001100.00004
0.4100.9003290.000120.001890.00077
0.2460.9401970.000070.002710.00154
Compression0.0000.00032890.00000.00000.0000
11.4940.00032890.00350.00000.0000
12.8990.00032890.00390.00010.0001
13.8030.00032890.00420.00040.0004
14.1450.00032890.00430.00080.0008
13.9240.01632380.00420.00140.0013
13.1400.07130550.00400.00220.0019
9.8340.30522870.00300.00370.0024
7.8710.44418300.00240.00480.0029
5.2650.62812240.00160.00660.0039
3.1330.7797280.00100.00870.0054
2.0100.8584670.00060.01050.0069
1.3640.9043170.00040.01220.0084
0.9660.9322250.00030.01390.0099
0.7090.9501650.00020.01540.0114
Table 4. Stress, damage, and strain parameters of the CDP model for brick in Abaqus.
Stress (MPa)Damage
Parameter
Degraded Elastic ModulusElastic StrainTotal Inelastic StrainPlastic Strain
σ κ E = 1 κ E 0 ε e l , 0 ε i n ε p l
Tension0.0000.000310.00.00000.00000.0000
2.2400.0003100.00720.00000.0000
0.2910.86640.30.00090.00690.0006
0.1120.95015.50.00040.01370.0068
Compression0.0000.000310.00.00000.00000.0000
9.3430.000310.00.03010.00000.0000
10.8460.000310.00.03500.00150.0015
11.8930.000310.00.03840.00440.0044
12.4280.000310.00.04010.01210.0121
12.0930.027301.70.03900.01950.0185
11.7190.057292.30.03780.02390.0216
10.0280.193250.10.03230.03440.0266
8.1200.347202.60.02620.04550.0316
6.6700.463166.40.02150.05520.0366
4.6640.625116.30.01500.07170.0466
3.3910.72784.60.01090.08580.0566
2.5440.79563.50.00820.09850.0666
1.7330.86143.20.00560.11610.0816
1.2340.90130.80.00400.13270.0966
0.9110.92722.70.00290.14880.1116
0.5830.95314.60.00190.17480.1366
Table 5. Experimental brick–mortar contact interface strength properties.
PropertyUnitnMeanSDCV %95% CI (Mean)
Normal (tensile) adhesive strength (tn)MPa50.1380.05137[0.075; 0.201]
Initial shear adhesive strength (ts)MPa50.4130.06415[0.334; 0.492]
Table 6. Symbols, physical meaning, and units of parameters for the contact stiffness formulations.
SymbolDescriptionUnit
K n n Normal contact stiffness of the interface per unit areaN/mm3
K s s Tangential contact stiffness of the interface in the sliding in-plane direction N/mm3
K t t Tangential contact stiffness of the interface in the out-of-plane direction N/mm3
ξ n Normal stiffness coefficient governing the brick–mortar interface responseN/mm5
ξ τ Tangential stiffness coefficient governing the brick–mortar interface responseN/mm5
t Thickness of the masonry element, corresponding to the effective width of the contact interfacemm
L Effective length of the brick–mortar contact interfacemm
n Number of masonry units in the loading direction---
Disclaimer/Publisher’s Note: The statements, opinions and data contained in all publications are solely those of the individual author(s) and contributor(s) and not of MDPI and/or the editor(s). MDPI and/or the editor(s) disclaim responsibility for any injury to people or property resulting from any ideas, methods, instructions or products referred to in the content.