Article

Study on Multi-Scale Strength Formation Mechanism of Fly Ash-Based Geopolymer Concrete Based on Statistical Damage Theory

1
School of Water Conservancy, North China University of Water Resources and Electric Power, Zhengzhou 450046, China
2
School of Human Settlements, North China University of Water Resources and Electric Power, Zhengzhou 450046, China
3
Yellow River Engineering Consulting Co., Ltd., Zhengzhou 450003, China
*
Authors to whom correspondence should be addressed.
Buildings 2026, 16(14), 2834; https://doi.org/10.3390/buildings16142834
Submission received: 1 June 2026 / Revised: 14 July 2026 / Accepted: 14 July 2026 / Published: 16 July 2026
(This article belongs to the Section Building Structures)

Abstract

Uniaxial compression tests were conducted on fly ash-based geopolymer concrete (FAG) with varying alkali-binder ratios (0.25, 0.35, 0.45, 0.55, 0.65) and curing ages (7 d, 28 d) to ascertain its mechanical performance parameters and stress–strain relationship curves. The formation mechanism of FAG multiscale strength is revealed through a systematic process that integrates statistical damage theory with microscopic testing techniques. This process involves the progression of microstructural state and the evolution of mesoscopic damage, providing a comprehensive understanding of the multiscale strength formation process. The results indicate that as the alkali-binder ratio increased, there was an initial rise and subsequent decline in microstructure density. At an alkali-binder ratio of 0.45, the alkaline activator can fully stimulate the fly ash to undergo depolymerization and polycondensation reactions. The result of this process is the formation of a continuous and dense cementitious matrix, thereby achieving the optimal improvement in macroscopic initial mechanical properties. Concurrent microstructural alterations further modify the morphology and path of microcrack initiation and propagation during uniaxial compression, as well as the effective force skeleton adjustment process. The characteristic parameters that are indicative of the evolution of microfracture and yield damage demonstrate regular changes in accordance with the alkali-binder ratio. The joint effect of these two factors determines the evolution characteristics of the macroscopic nonlinear stress–strain behavior of FAG, ultimately resulting in an increasing and then decreasing trend of FAG strength with the increase of alkali-binder ratio, while ductility shows a trend of decreasing first and then increasing. At an equivalent alkali-binder ratio, the porosity of the 7 d sample exhibited a decrease of 1.13% to 17.13%. Conversely, the strength of the 7 d sample increased by 39% to 312%. However, the deformation capacity of the 7 d sample decreased, with a peak strain reduction of 21% to 52% at 28 d. This research achievement has the potential to provide significant theoretical support for the practical engineering promotion and application of FAG.

1. Introduction

In the context of accelerating urbanization, Ordinary Portland cement (OPC) has emerged as a predominant building material. The production of this cement involves the substantial consumption of natural resources and the emission of significant quantities of carbon dioxide. As demonstrated in studies [1,2,3], it is evident that the global cement industry is responsible for 8% of carbon dioxide emissions on a global scale. It has been determined that cement is responsible for the highest contribution to the carbon footprint of concrete production [4]. In order to coordinate the development of buildings with carbon-reducing measures, it is necessary to substitute OPC with eco-efficient cementitious materials [5]. Geopolymer binders are a typical example of this type of material [6], offering mechanical properties comparable to cement while exhibiting significantly lower carbon emissions. It can thus be concluded that they possess significant potential to serve as an ideal substitute for OPC [5,7]. Geopolymer binders are defined as inorganic polymers formed through a three-dimensional network structure, achieved by catalyzing the polymerization reaction of silica-alumina tetrahedral structural units in raw materials that are rich in silica and aluminum using alkaline activators [8,9]. Fly ash (FA), slag, and kaolin are the predominant industrial solid waste materials that constitute aluminosilicate raw materials [10,11,12]. At present, the global annual production of FA is estimated to be approximately 2.8 billion metric tons. China is the leading producer, with an annual output of 1.569 billion metric tons. Despite the substantial production of FA, its global average utilization rate remains at only 53% [13]. Furthermore, according to Diaz-Loya et al. [6], fly ash-based geopolymer concrete (FAG) and traditional OPC concrete can exhibit equivalent mechanical properties. It is evident that FAG has the capacity to utilize industrial solid waste as a substitute for traditional cement in the production of low-carbon building materials. This approach facilitates the effective utilization of resources [14,15].
The formation of N-A-S-H gel has been demonstrated to result in superior performance characteristics in FAG, including corrosion resistance, high temperature resistance, and environmental protection [16,17,18,19]. The calcium aluminosilicate gel formed in alkali-activated high-calcium systems (e.g., certain blast furnace slag systems) exhibits a relatively compact structure, while the sodium aluminosilicate gel generated from the reaction of FAG possesses a unique microstructure with low porosity. The reaction process is primarily concentrated in two stages: depolymerization and polycondensation [20,21,22]. The mechanical properties and durability of FAG are contingent on the alkali-binder ratio (AL/B), which directly affects the phase density and microstructural integrity of gel by affecting the depolymerization–polycondensation reaction of the precursor [23,24]. Rao and Kumar et al. [25] investigated the compressive strength of geopolymer concrete (GPC) at AL/B of 0.30, 0.35, and 0.40, and the results showed that the compressive strength reached its peak at AL/B of 0.40. This indicates that a moderate AL/B can fully activate the cementitious materials and promote gel phase formation. In their study on replacing fine aggregates with iron ore tailings, Sharath et al. [26] found that the compressive strength was optimal at AL/B of 0.6. Thakur and Bawa et al. [27] have indicated that the addition of slag has the potential to enhance the compressive strength of FAG. However, it is crucial to note that this enhancement is only attainable when combined with AL/B optimization, thereby ensuring a balanced workability. As posited by Ali-Abdo et al. [28], an increase in the ratio of alkaline solution to FA has been demonstrated to enhance the mechanical properties of FAG. Evidently, the AL/B exerts a substantial influence on the mechanical properties of FAG. However, the optimal AL/B remains a subject of debate in extant research, as evidenced by the absence of a consensus on this matter. Consequently, it is imperative to conduct FAG-related tests to ascertain the optimal AL/B, with a view to enhancing the mechanical properties of materials.
Curing age is a pivotal factor affecting the mechanical properties of FAG, which is primarily attributed to the continuous evolution of alkali-activated polymerization reaction inside the matrix with curing age. In the initial curing stage, the dissolution of FA particles is facilitated by the action of alkaline activators, resulting in the release of active silicon and aluminum components. This process initiates the formation of low-polymerization-degree N-A-S-H gels. At this stage, the internal pore structure is well-developed, and the matrix is relatively compact. As the curing age increases, the FA particles that have not yet undergone complete reaction continue to participate in the alkali-activated polycondensation reaction. This results in the steady generation of N-A-S-H gel products. The products under consideration are capable of filling the capillary pores and microcracks present within the matrix. This process leads to the progressive optimization of the interfacial transition zone, thereby rendering the overall structure denser and more stable. Consequently, the mechanical properties of the material, such as compressive strength, tensile strength, and elastic modulus, are continuously enhanced. As Rangan [29] noted in his report, the strength development of geopolymer concrete deviates from that of conventional cement concrete. The initial strength of the substance is primarily contingent upon the curing temperature and duration, as opposed to extended ageing processes. Nath and Sarker [30] conducted a study on the mechanical properties of FAG under conditions of room-temperature curing. The findings indicate that the elastic modulus of 28-day cured FAG is lower than that of ordinary Portland concrete with equivalent compressive strength grade under identical curing conditions. In their study, Memon et al. [31] investigated the impact of curing age and silica fume content (0 wt%, 5 wt%, 10 wt%, 15 wt%) on the mechanical properties of fly ash-based self-compacting geopolymer concrete. It has been established that, under equivalent silica fume replacement ratios, the 28 d compressive strength, splitting tensile strength, and flexural strength of the concrete are evidently higher than those at 7 d. In their study, Hashmi et al. [32] examined the impact of Class F FA on the age-dependent performance of concrete. Their findings revealed that fly ash concrete demonstrated a more substantial increase in strength from 28 d to 180 d in comparison to conventional concrete.
The mechanical properties of FAG depend not only on curing age, but also exhibit an obvious coupling effect with alkali-binder ratio. The majority of current research has been conducted through single-variable experiments, primarily concerned with the macroscopic strength evolution and qualitative microscopic morphological characterization under individual factors. Nevertheless, there is still a notable lack of systematic studies on the mechanical behavior, full stress–strain response, and mesoscopic damage evolution of FAG under the coupled influence of AL/B and curing age. Concrete is a typical quasi-brittle material. The deformation and failure of concrete is essentially a continuous damage evolution process. Initial internal defects, such as micro-pores and microcracks, undergo a series of processes. These processes include nucleation, initiation, propagation and final coalescence. Its failure behavior involves cross-scale interactions among disordered and inhomogeneous structures at macroscopic, mesoscopic, and microscopic scales [33]. The macroscopic non-linear stress–strain behavior of materials is determined by the inhomogeneity of micro-structure and nonlinear damage evolution at the micro level. It is therefore vital to explore the mechanical properties and mesoscopic damage mechanism of FAG under the combined influence of AL/B and curing age, in order to reveal the intrinsic physical mechanism of its damage and failure.
Derived from continuum damage mechanics, statistical damage mechanics has emerged as a popular research direction, offering an effective way to explore the mesoscopic damage mechanism of quasi-brittle materials like concrete. Since Krajcinovic et al. [34] proposed the parallel bar system (PBS) model for the uniaxial tensile process of concrete, statistical damage theory is extensively adopted in damage mechanics studies on concrete, rock, and other materials. This type of model abstracts concrete as a complex system composed of mesoscopic elements. By assuming that the characteristic parameters of the mesoscopic units follow a probability distribution such as the Weibull distribution, the heterogeneity of the material is captured while the complex physical details of the damage process are neglected. In this way, an organic connection is established between the damage mechanism and the macroscopic constitutive behavior. Bai et al. [35,36,37,38,39] assumed that there exist two mesoscopic damage modes, namely fracture and yield damage, established uniaxial and multiaxial statistical damage models for concrete, and put forward the theory of intrinsic mechanical property exertion mechanism. They also discussed the nonlinear stress–strain behavior and mesoscopic damage mechanism of concrete under complex service environments.
The objective of this study is to elucidate the coupling mechanism of AL/B and curing age on the macroscopic mechanical performance, pore structure, and microscopic morphology of FAG. In addition, the study seeks to clarify the multi-scale strength formation and failure mechanism of FAG. In this study, five groups of FAG with AL/B of 0.25, 0.35, 0.45, 0.55, and 0.65 are prepared. After standard curing for 7 d and 28 d, uniaxial compression tests are carried out using a microcomputer-controlled electro-hydraulic servo pressure testing machine. The full stress–strain curves are obtained to analyze the coupling effects of AL/B and curing age on the mechanical properties as well as deformation and failure characteristics of FAG. Microscopic testing methods including nuclear magnetic resonance (NMR), scanning electron microscopy (SEM), and X-ray diffraction (XRD) are adopted to analyze the internal pore structure variation and microscopic morphology characteristics of FAG. On this basis, combined with the mesoscopic statistical damage model, the influence laws of AL/B and curing age on the mesoscopic damage mechanism of FAG during uniaxial compression are investigated, and the internal correlation between mesoscopic damage mechanism and macroscopic nonlinear constitutive behavior under such coupling conditions are further discussed.

2. Materials and Methods

2.1. Experimental Materials

2.1.1. FA

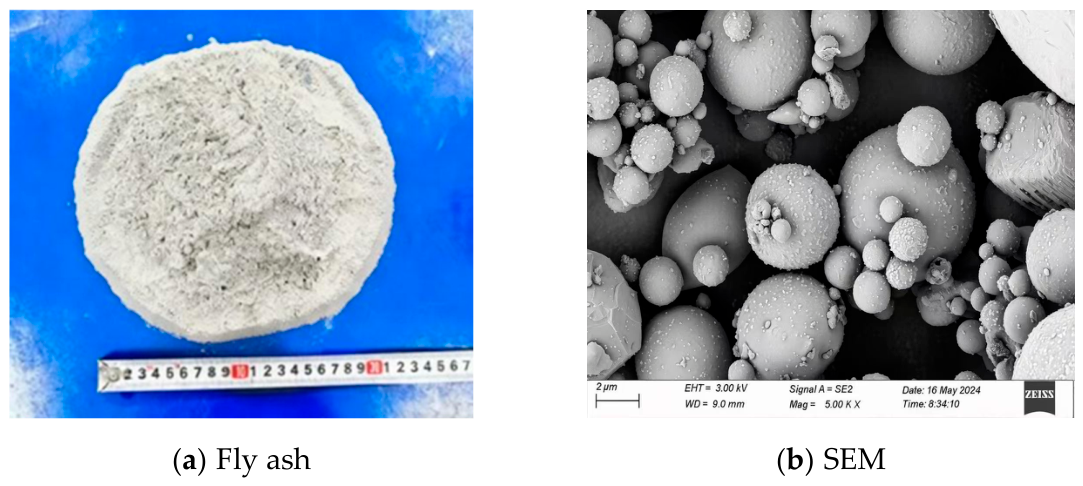
This experiment selects Grade 1 FA produced by Henan Bairun Casting Materials Co., Ltd., Zhengzhou, China. Figure 1a illustrated that FA is a fine powder presenting a light gray appearance. Its bulk density is 1.12 g/cm3, and its density is 2.55 g/cm3. Figure 1b clearly displays numerous spherical FA particles with sleek exterior morphology.

2.1.2. Alkali Activator

An alkaline solution made up of sodium hydroxide (NaOH) solution and water glass (Na2SiO3) solution is the alkali activator that is utilized. Industrial-grade solid NaOH is dissolved in tap water to create the NaOH solution. The NaOH solid appears as pure white flakes supplied by Inner Mongolia Junzheng Chemical Co., Ltd., Wuhai, China (net content ≥ 98%). The water glass solution is colorless and transparent, purchased from Henan Bairun Casting Materials Co., Ltd., Zhengzhou, China with physicochemical properties as shown in Table 1. Experiments are conducted with city tap water.
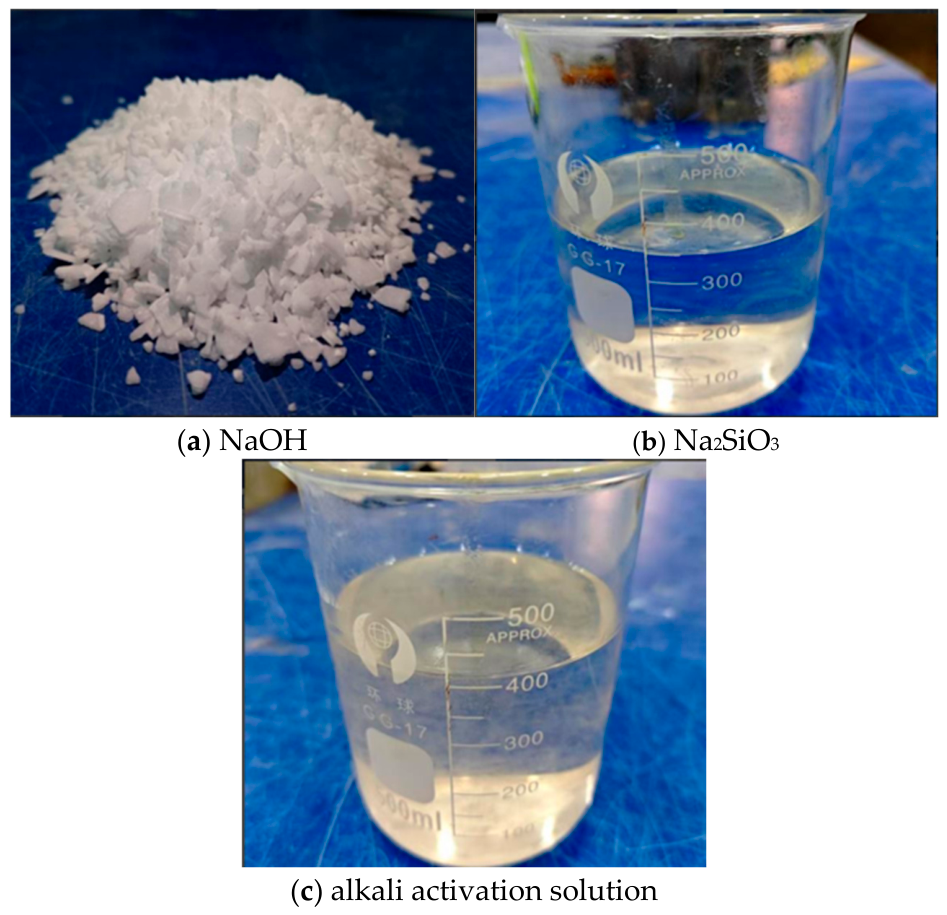
Considerable heat is liberated during NaOH dissolution; the alkali activator solution is normally prepared 24 h before the manufacture of GPC [40]. The alkali activator preparation process in this study is as follows: first, solid NaOH is dissolved in water to form a 14 mol/L NaOH solution (density: 1.3275 g/cm3); subsequently, the NaOH solution is added to water glass and stirred thoroughly to modify the modulus of water glass (SiO2/Na2O molar ratio, MS), ultimately achieving a modulus of 1.3 [41]. At this point, the alkali activator preparation is sufficient. The solid NaOH, water glass, and prepared alkali activator solution are shown in Figure 2.

2.1.3. Aggregates

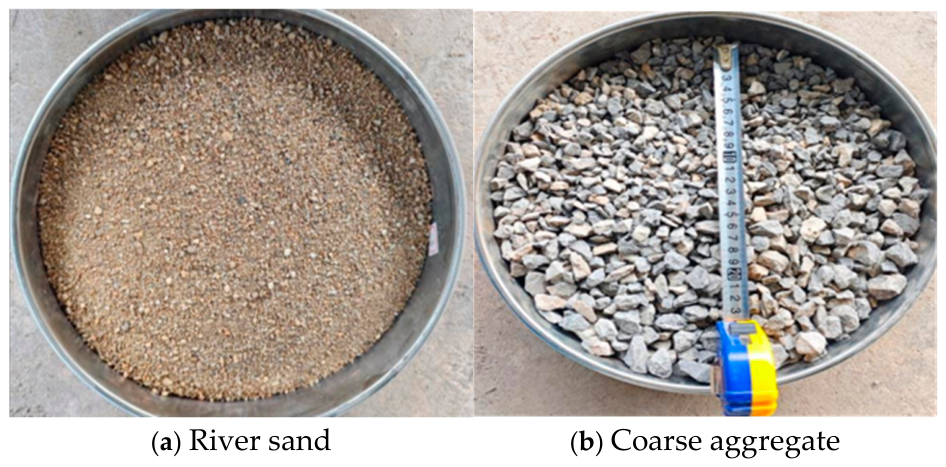
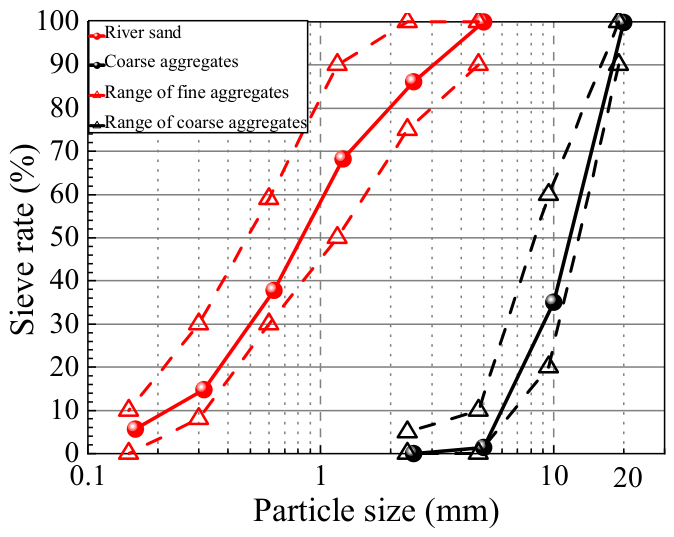
This experiment took natural river sand as fine aggregate, possessing a fineness modulus of 2.73. The coarse aggregate is selected from 5–20 mm natural crushed stone with good grading. The specific morphology of the aggregates is shown in Figure 3. Relevant properties of the aggregates are tested according to the “Test Procedures for Hydraulic Concrete” (SL352-2020) [42], with results presented in Table 2. The particle gradation curve is shown in Figure 4, which complies with the requirements of the “Building Aggregates—Crushed Stone and Gravel” (GB/T14685-2022) standard [43].

2.1.4. Water-Reducing Agent

According to Reference [44], the preferred water-reducing agent for FAG is polycarboxylic acid superplasticizer. However, a dosage exceeding 2% may lead to strength deterioration. Therefore, the water-reducing agent used in this study for preparing FAG is polycarboxylate acid superplasticizer, which is a white powder with a dosage of 2% (by mass) of FA. Its primary performance indicators are shown in Table 3.
Table 4 lists the precise mix proportions utilized in the trials. The content of FA is 400 kg/m3 [28], and the sand ratio is set at 35% [45]. Previous studies have demonstrated that the compressive strength of geopolymer concrete declines with the increase in the water-to-geopolymer solid ratio within the range of 0.24–0.32 [45]. A preliminary experimental investigation further indicated that a water-to-geopolymer solid ratio of 0.25 can deliver favorable mechanical performance for geopolymer concrete. Considering the trade-off between mechanical strength and fresh-state workability comprehensively, the water-to-solid ratio is fixed at 0.25 for all test groups in this work. An appropriate amount of polycarboxylic acid superplasticizer is added simultaneously. Five FAGs with AL/B of 0.25, 0.35, 0.45, 0.55, and 0.65 are prepared using the absolute volume method [14]. It should be noted that the alkali activator must be prepared one day prior to the experiment and then left to stand at room temperature for 24 h. Let, SNaOH and S N a 2 s i o 3 be the percentage of solids in NaOH and Na2SiO3, respectively, then the water content is determined as follows:
Mass of water in NaOH = MNaOH − (SNaOH × MNaOH)
Mass   of   water   in   Na 2 SiO 3 = M N a 2 s i o 3 ( S N a 2 s i o 3 × M N a 2 s i o 3 )

2.1.5. Sample Preparation and Test Procedure

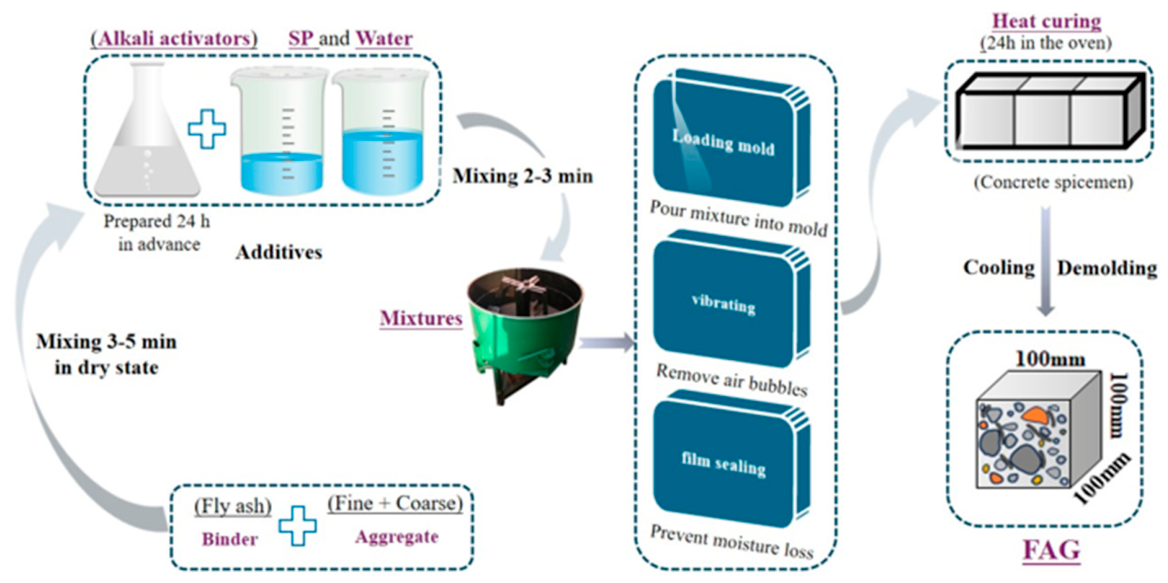
Based on the amounts shown in Table 4, each part of the blend is weighed. Sample preparation is carried out as follows: first, prepare a dry mixture of FA and river sand; then, the coarse aggregate is placed inside the concrete mixer and stirred for 2 min. Once materials are thoroughly dry-mixed, add formulated alkali activator and stir for another 2 min. Subsequently, incorporate the water-reducing agent and water, and mix thoroughly for 3 min. Slump tests are then performed, revealing that slump rises progressively as AL/B increases within the range of 45–75 mm, which complies with GB/T 50080-2016 [46]. Pour fresh FAG into 100 mm × 100 mm × 100 mm mold cavities in three separate pours, compacting the fresh FAG with a tamper during each pour. Each mold cavity is filled with fresh FAG, and the molds are vibrated. After 24 h, all test blocks are removed from the molds and cured under standard conditions (20 ± 2 °C, relative humidity ≥ 95%). Figure 5 presents the procedure for preparing the samples.

2.2. Experimental Methods

2.2.1. Uniaxial Compression Test

FAG samples serve to carry out uniaxial compression tests using the YAW-5000 microcomputer-controlled electro-hydraulic servo compression testing machine. The testing procedure strictly adheres to the “Standard Test Methods for Physical and Mechanical Properties of Concrete” (GB/T 50081-2019) [47]. During testing, the loading is applied at a quasi-static strain rate. During specific implementation, the actual loading rate is controlled at 0.18 mm/min. A high-precision displacement sensor placed between the pressure plates of the testing equipment records the deformation data of the sample in real time. To reduce the impact of end friction and related shear stresses on test results, paraffin wax is uniformly applied to the contact surfaces between the samples and the pressure plates before testing. Preloading and calibration are carried out at the initial loading stage until all gaps at the contact surfaces are fully eliminated and the load reaches the threshold of 5 kN. Afterwards, formal loading is performed at the standard rate until the completion of the test, so as to obtain the true stress–strain curve of each specimen. Tension is defined as positive and compression as negative in this paper.

2.2.2. NMR Test

NMR technology is widely applied in non-destructive testing of concrete [48], using water or hydrogen atoms as probes to perform heterogeneous evaluations of microscopic pores in saturated samples, including pore size distribution and pore proportion. This study applies the MacroMR12-150H-I geotechnical pore structure imaging analyzer manufactured by Suzhou Nuomai Analytical Instruments Co., Ltd. The specimens are fully saturated via vacuum soaking for 1 d, then taken out, wiped to a saturated surface-dry state, and immediately placed inside the magnetic coil for testing. The CPMG (Carr–Purcell–Meiboom–Gill) pulse sequence is adopted for measurement, with key test parameters set as follows: recycle delay of 3000 ms, echo number of 5000, and scanning accumulations of 16. After all samples are loaded, the test is initiated. Upon completion, the specimens are removed, the raw data exported, and the porosity calculated accordingly. All samples tested were standard-cured FAG samples.

2.2.3. SEM Test

SEM is employed to observe the microstructure of FAG fragment sections in order to analyze the morphological characteristics of geopolymerization reaction products and perform detailed observation of crack and pore distribution. Test samples for SEM analysis consist of FAG fragments approximately 1 cm in size. Before the test, vacuum and spray gold on the sample to ensure better observation. The sample is placed into the SEM instrument, a vacuum is applied to the sample to reach a vacuum level of 2.79 × 10⁻⁵ mbar, then a photograph is taken. Gold is sprayed for 45 s using an Oxford Quorum SC7620 sputter coater with a current of 10 mA. Subsequently, the sample morphology is observed under a Zeiss sigma 300 field emission environment, the typical parts are selected according to the apparent morphology, and the accelerating voltage is 3 kV when shooting. The characteristic micro-zone morphology is photographed, and SEM images are obtained with corresponding magnification according to the demand.

2.2.4. XRD Test

To clarify the phase composition of FAG, this study employs XRD testing and analysis. First, sample fragments are finely ground into powder and dehydrated for 24 h in a 105 °C constant-temperature drying oven to eliminate moisture interference with diffraction signals. Subsequently, testing is conducted using a Japanese Rigaku SmartLab SE high-resolution X-ray diffractometer. Cu-Kα radiation is adopted as the X-ray source. Full-spectrum scanning is conducted at a tube voltage of 40 kV and tube current of 40 mA, with a scanning rate of 2° per minute and a step size of 0.02°. To balance the accuracy of feature peak recognition and testing efficiency, the scan range is set from 5° to 90° (2θ).

3. Test Results Analysis

3.1. Uniaxial Compression Test Analysis

3.1.1. Elastic Modulus

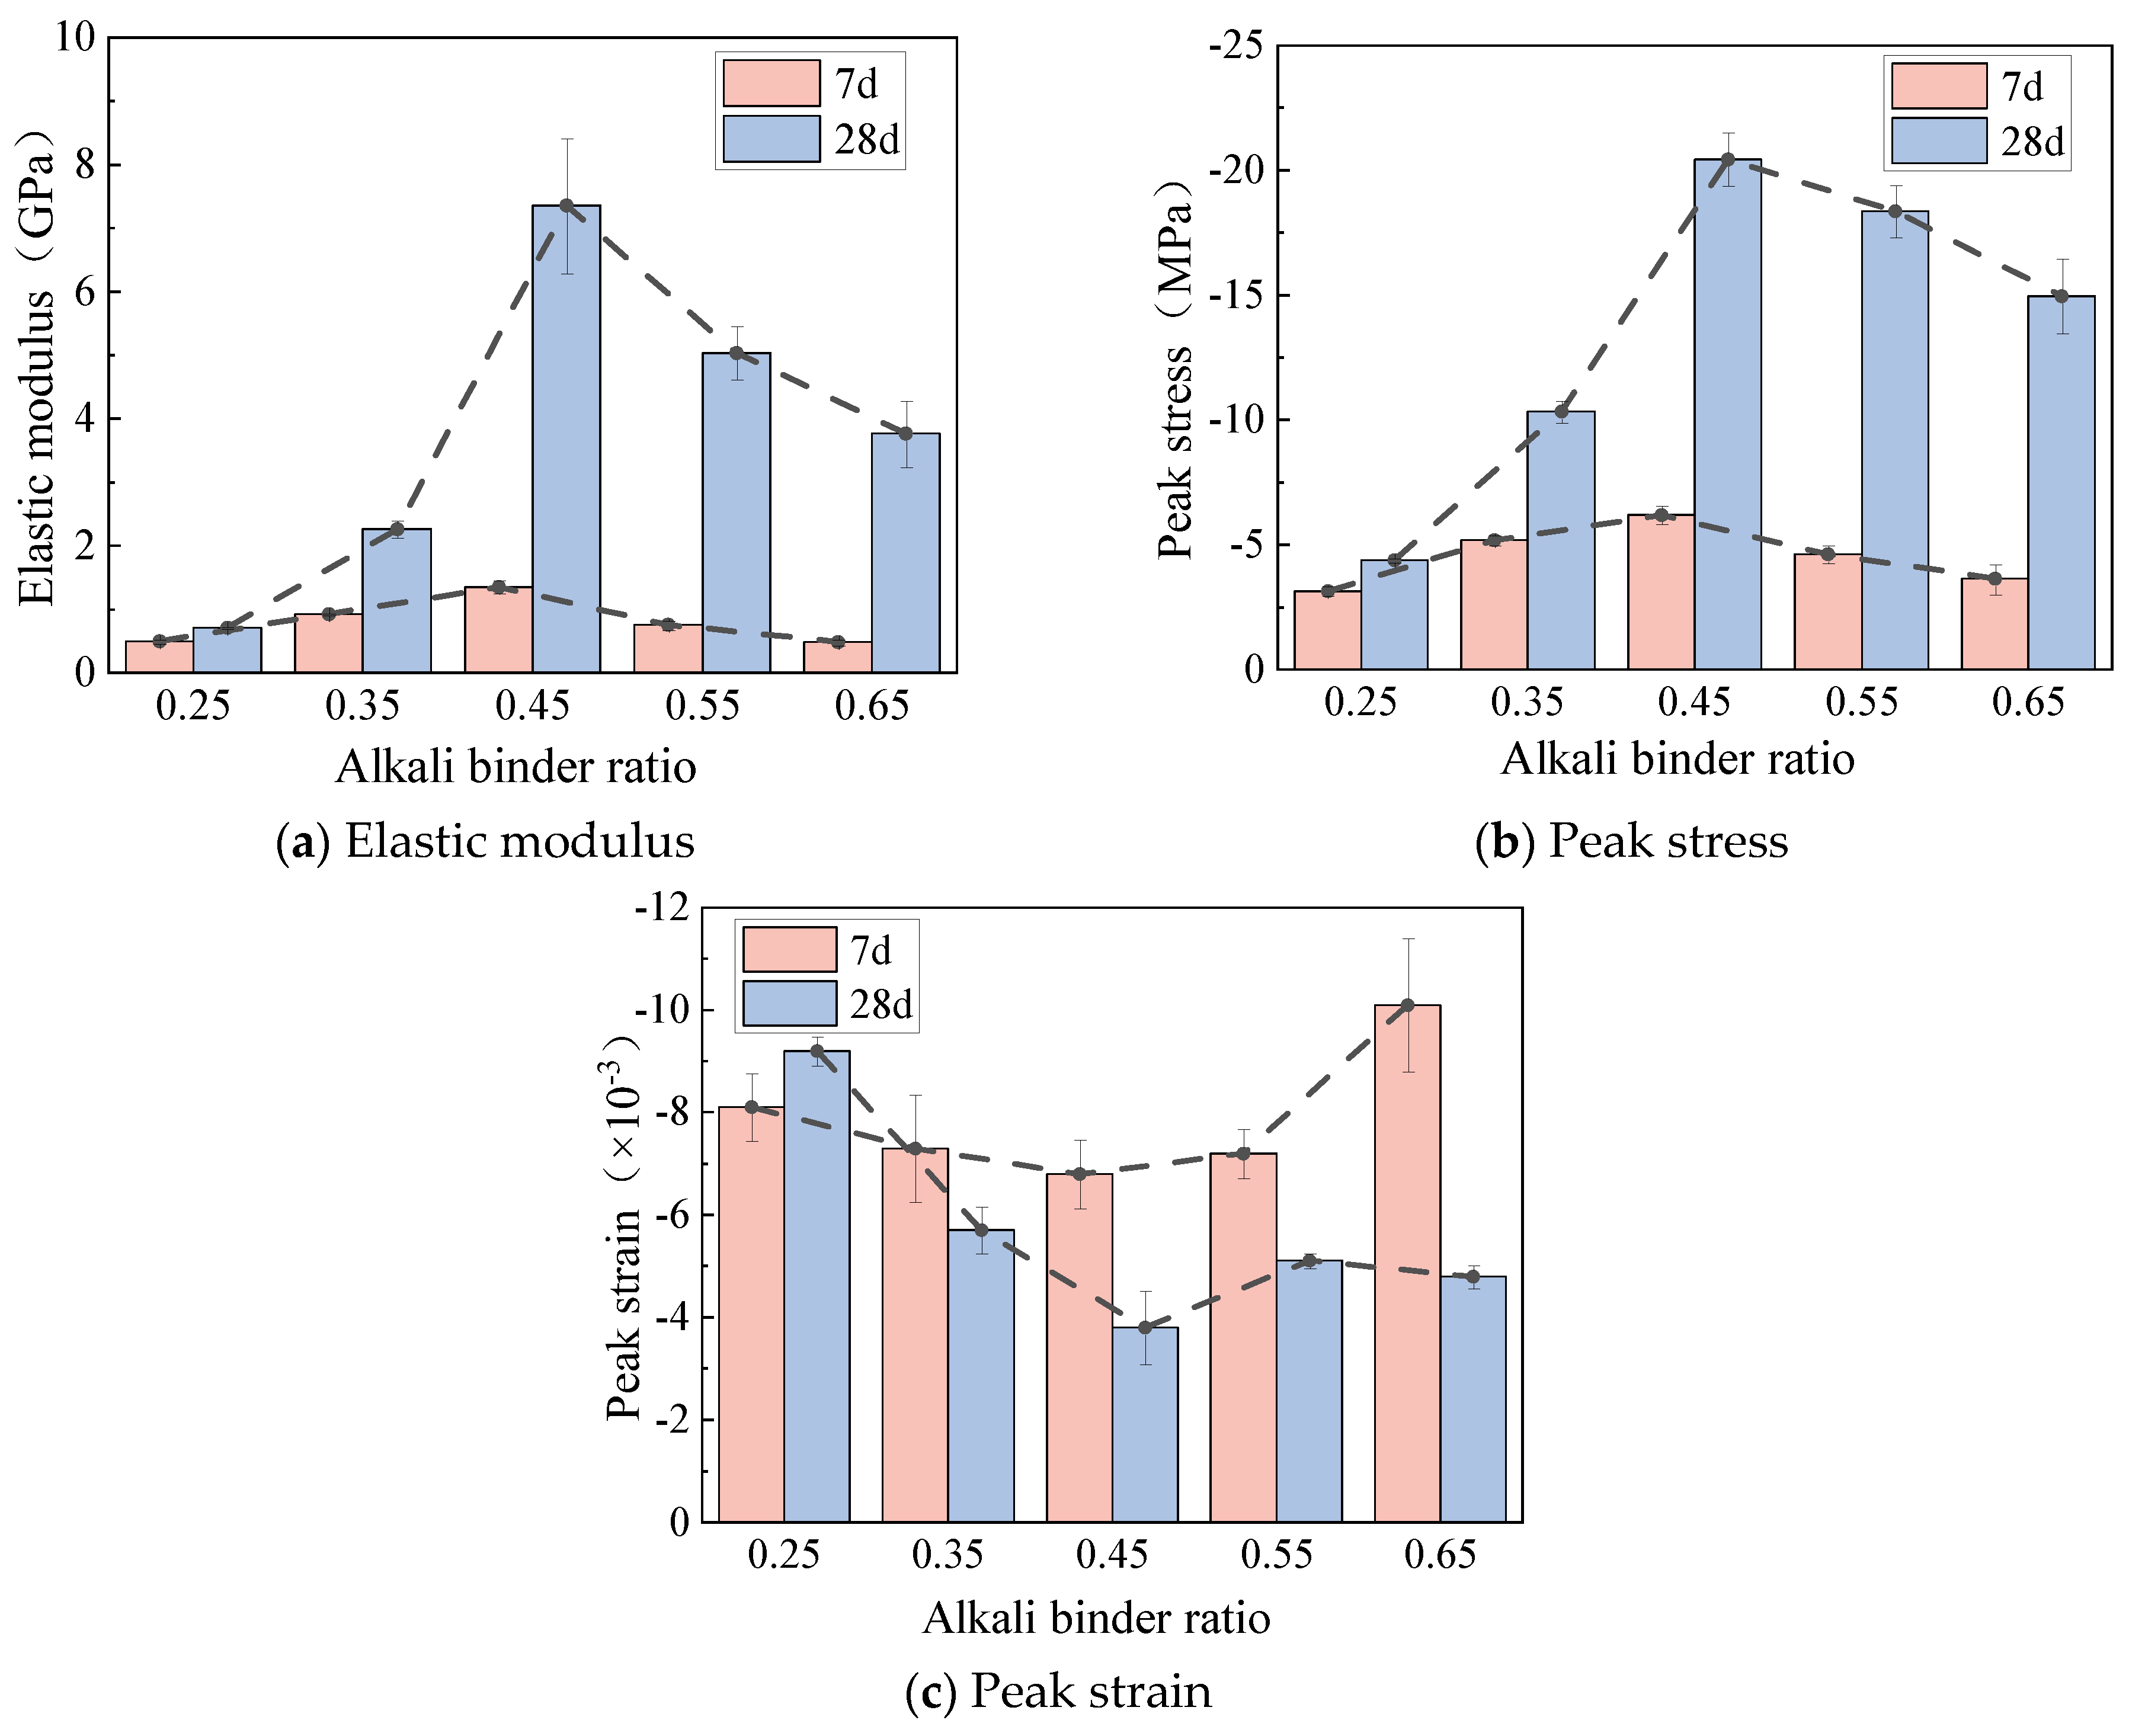
The E is a pivotal factor in evaluating the deformation capacity of concrete under stress and is of considerable importance in the field of concrete mechanical property research [30,38]. As illustrated in Figure 6a, there is a corresponding relationship between E and the AL/B, where E denotes the mean value of three samples. In a manner analogous to the trend of σp, E of FAG attains its maximum at the AL/B of 0.45. The data presented here indicates that, based on the E at AL/B of 0.25, when AL/B increased to 0.35, 0.45, 0.55, and 0.65, the growth rates of E at 7 d were 84%, 170%, 50%, and −4%, respectively; at 28 d, the E growth rates were 219.72%, 935.21%, 609.87%, and 430.96%, respectively. The E growth rate at 28 d is significantly higher than that at 7 d, with an initial increase followed by a subsequent decrease as AL/B rises. This indicates that the development of mechanical properties in geopolymer concrete is highly dependent on the synergistic effect of curing age and AL/B [49]. At 7 d, due to the shorter curing age, the depolymerization–polycondensation reaction of FA has not yet been fully completed, and the gel network is in its initial formation stage. At this stage, there is a possibility that unreacted active particles or pores may still be present within the material, resulting in limited enhancement of E. However, it has been demonstrated that long-term curing at 28 d leads to a more thorough interaction between the alkali activator and the FA particles, forming a denser N-A-S-H gel network that enhances the E value of FAG [50]. The E of FAG reaches its maximum value at an AL/B ratio of 0.45, and gradually decreases when the ratio exceeds this value. This is due to the fact that the presence of excessive alkali solution has the potential to disrupt the continuity of the gel phase, thereby resulting in the accumulation of unreacted alkaline substances at the interface. Furthermore, an increase in the moisture content of the alkali solution has been shown to impede the polymerization process by lowering the alkali concentration. Concurrently, porosity has been observed to increase due to water evaporation from the pores, thereby decreasing compressive strength [25,27]. For 7 d and 28 d, the standard deviation of E ranges from 2.17% to13.33% and from 2.81% to 17.82%, respectively.

3.1.2. Peak Stress

Figure 6b shows the variation trends of peak stress (σp) at 7 d and 28 d at various AL/B, where σp denotes the mean value of three samples. It is evident that various AL/B notably influence the σp of FAG. Within the AL/B of 0.25–0.65, the σp of FAG at 7 d and 28 d exhibited a pattern of rising at first and then declining, with the maximum value obtained at AL/B = 0.45. This variation law fully conforms to the optimal depolymerization–polycondensation mechanism clarified in Section 3.1.1. As AL/B increased within the range of 0.25–0.45, the σp of sample at 28 d significantly increased from −4.39 MPa to −20.44 MPa, with an increase of 365.60%. However, as the AL/B continued to increase to 0.55 and 0.65, the σp of sample at 28 d decreased to −18.36 MPa and −14.97 MPa, respectively, showing reductions of 10.18% and 26.76% compared to FAG45. For 7 d and 28 d, the standard deviation of peak stress ranges from 5.00% to 20.11% and from 2.50% to 12.15%, respectively.

3.1.3. Peak Strain

Peak strain (εp) refers to the strain value corresponding to the σp on the stress–strain curve. The specific trend of εp variation is shown in Figure 6c, where εp denotes the mean value of three samples. As AL/B varies, εp exhibits a negative correlation with σp and E, displaying a tendency to decrease initially and then rise, reaching the minimum at AL/B = 0.45. This phenomenon can be reasonably explained by the dense gel skeleton formed under the optimal matching ratio elaborated in Section 3.1.1. Based on the εp at AL/B of 0.25, when AL/B increased to 0.35, 0.45, 0.55, and 0.65, the εp growth rates at 7 d were −9.91%, −15.37%, −11.40%, and 25.77%, respectively; at 28 d, the εp growth rates were −38.64%, −59.20%, −44.37%, and −48.05%, respectively. For 7 d and 28 d, and the standard deviation of peak strain ranges from 8.25% to 17.60% and from 3.50% to 23.28%, respectively.

3.1.4. Stress–Strain Curves

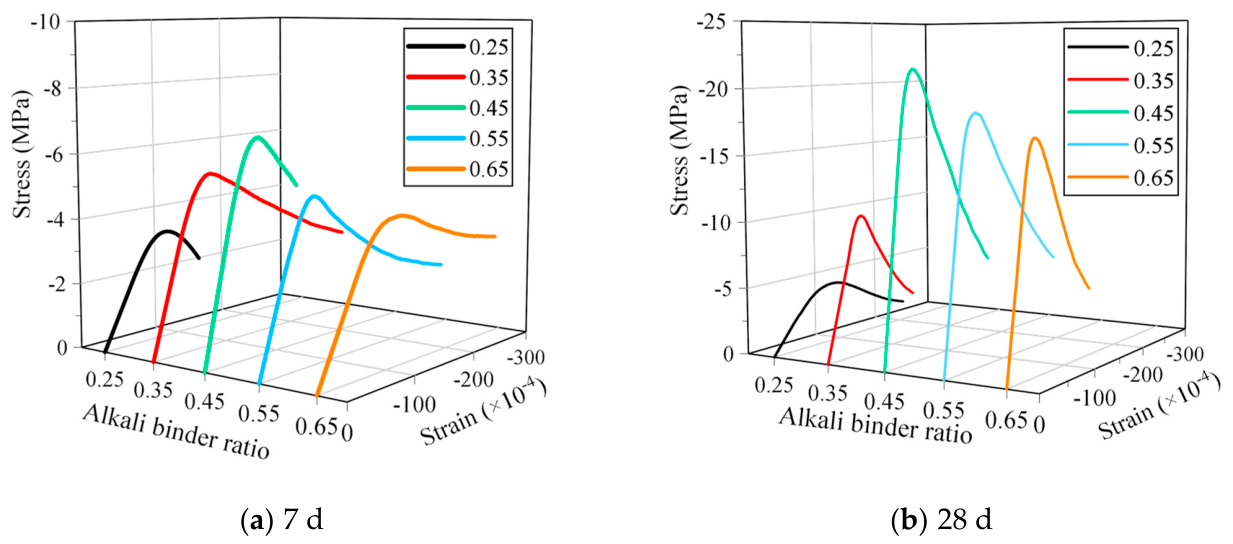
The stress–strain curves of FAG demonstrate a parabolic characteristic, akin to that of traditional concrete [39]. It is noteworthy that the stress–strain curves obtained at varying curing ages (7 d and 28 d) demonstrate a similar evolutionary trend, thereby signifying the age stability of the mechanical properties of FAG as shown in Figure 7. In particular, samples with an AL/B ratio of 0.45 demonstrated optimal mechanical properties under identical ageing conditions. These samples exhibited the steepest ascent slope and the highest σp value. It has been hypothesized that this is attributable to more thorough depolymerization–polycondensation reactions at this AL/B, forming a denser silicoaluminate network structure. As the AL/B ratio increases from 0.25 to 0.65, there is a marked shift in the transition characteristics from the elastic stage to the failure stage. When the AL/B ratio is less than 0.45, the turning point of the curve becomes steeper, indicating an increase in brittleness. Conversely, when the AL/B ratio is more than 0.45, the turning point of the curve tends to flatten, and the FAG exhibits ductile failure characteristics. The presence of nonlinear behavior suggests the existence of an optimal AL/B ratio of 0.45, beyond which alkaline solutions have been shown to reduce the mechanical strength of FAG.

3.1.5. Damage Characteristics

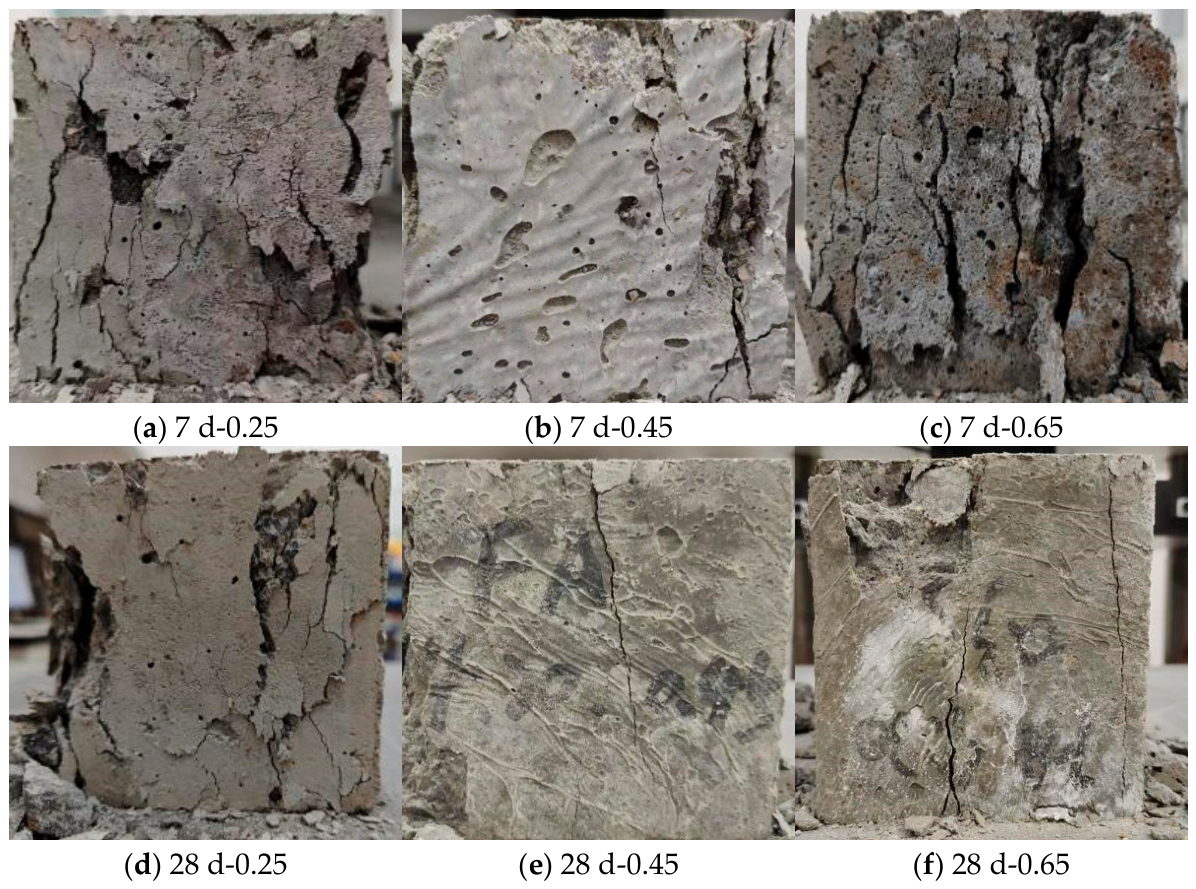
As illustrated in Figure 8, the failure characteristics of samples with various AL/B at 7 d and 28 d are demonstrated. As the failure laws of samples manifest equivalent failure mechanisms at both 7 d and 28 d, samples that were cured for 28 d were selected for analysis in this study. As demonstrated in Figure 8, the sample of 28 d-0.45 (Figure 8e) exhibited a reduced surface crack density, fewer irregular cracks, and a significantly diminished exposed area of internal aggregates on the sample surface when compared to the 28 d-0.25 (Figure 8d) sample. As the AL/B increases, the sample of 28 d-0.65 (Figure 8f) exhibits an increase in both the number and width of surface fissures, as well as an increase in the presence of uneven mortar pieces in the spalling debris.
The analysis of failure characteristics indicates that in instances where AL/B is less than 0.45, there is inadequate supply of alkali activator. This, in turn, results in insufficient depolymerization–polycondensation reaction of silicon aluminum oxide in FA, leading to a gel with a loose structure and weak strength. This gel is unable to effectively inhibit the expansion of cracks, resulting in a significant number of cracks when the sample is damaged. It has been demonstrated that when the AL/B is 0.45, the reaction matching between the alkali activator and FA is optimal. This has been shown to be able to fully stimulate FA activity, promote the formation of a dense gel structure, significantly enhance the load-bearing capacity and crack resistance of FAG, and result in fewer cracks at failure. In instances where the AL/B ratio exceeds 0.45, the presence of excessive alkali activator has been shown to impede the depolymerization–polycondensation reaction of the sample. This inhibition can lead to the formation of microcracks, which, under further stress, may progress to larger fissures during the failure process.

3.2. NMR Testing Analysis

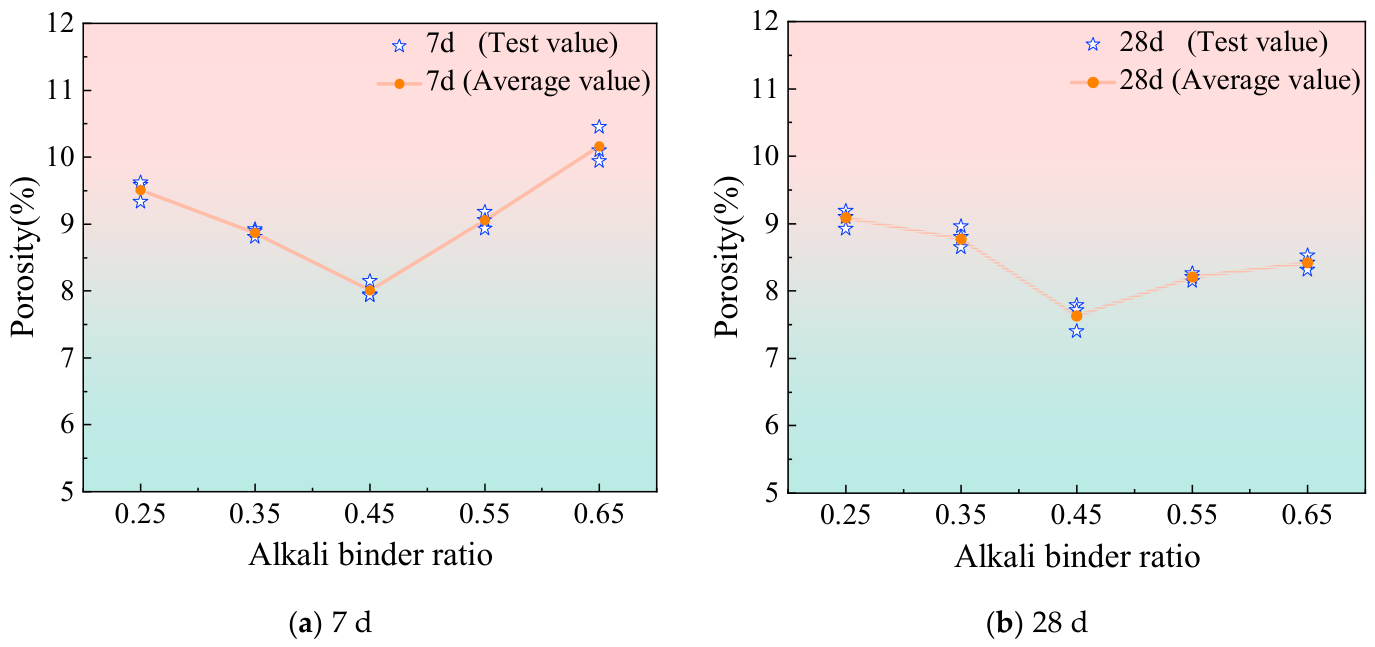
Figure 9 shows the variation laws of porosity at 7 d and 28 d under various AL/B, with the porosity values representing the mean of three samples. The figure reveals consistent variation laws between 7 d and 28 d: as the AL/B increases, porosity declines initially and subsequently rises, attaining lowest values of 8.01% and 7.63% at AL/B = 0.45. The minimum porosity at AL/B = 0.45 is a direct microscopic reflection of the sufficient geopolymerization reaction described in Section 3.1.1. This result corroborates the research outcomes of Garcia [51]. Furthermore, porosity presents a trend of decreasing first and then increasing as AL/B increases, which reveals a negative correlation between peak stress and porosity. During the AL/B of 0.25 to 0.45, porosity exhibited a decreasing trend. This is because the increase in the amount of alkali will lead to an increase in the degree of alkali activation, therefore increasing the density of the pore structure and the number of N-A-S-H gel formed. This finding fits with what other researchers have found [52,53]. When the AL/B is between 0.45–0.65, excess alkali impedes depolymerization–polycondensation, deteriorating the microstructure and lifting porosity.
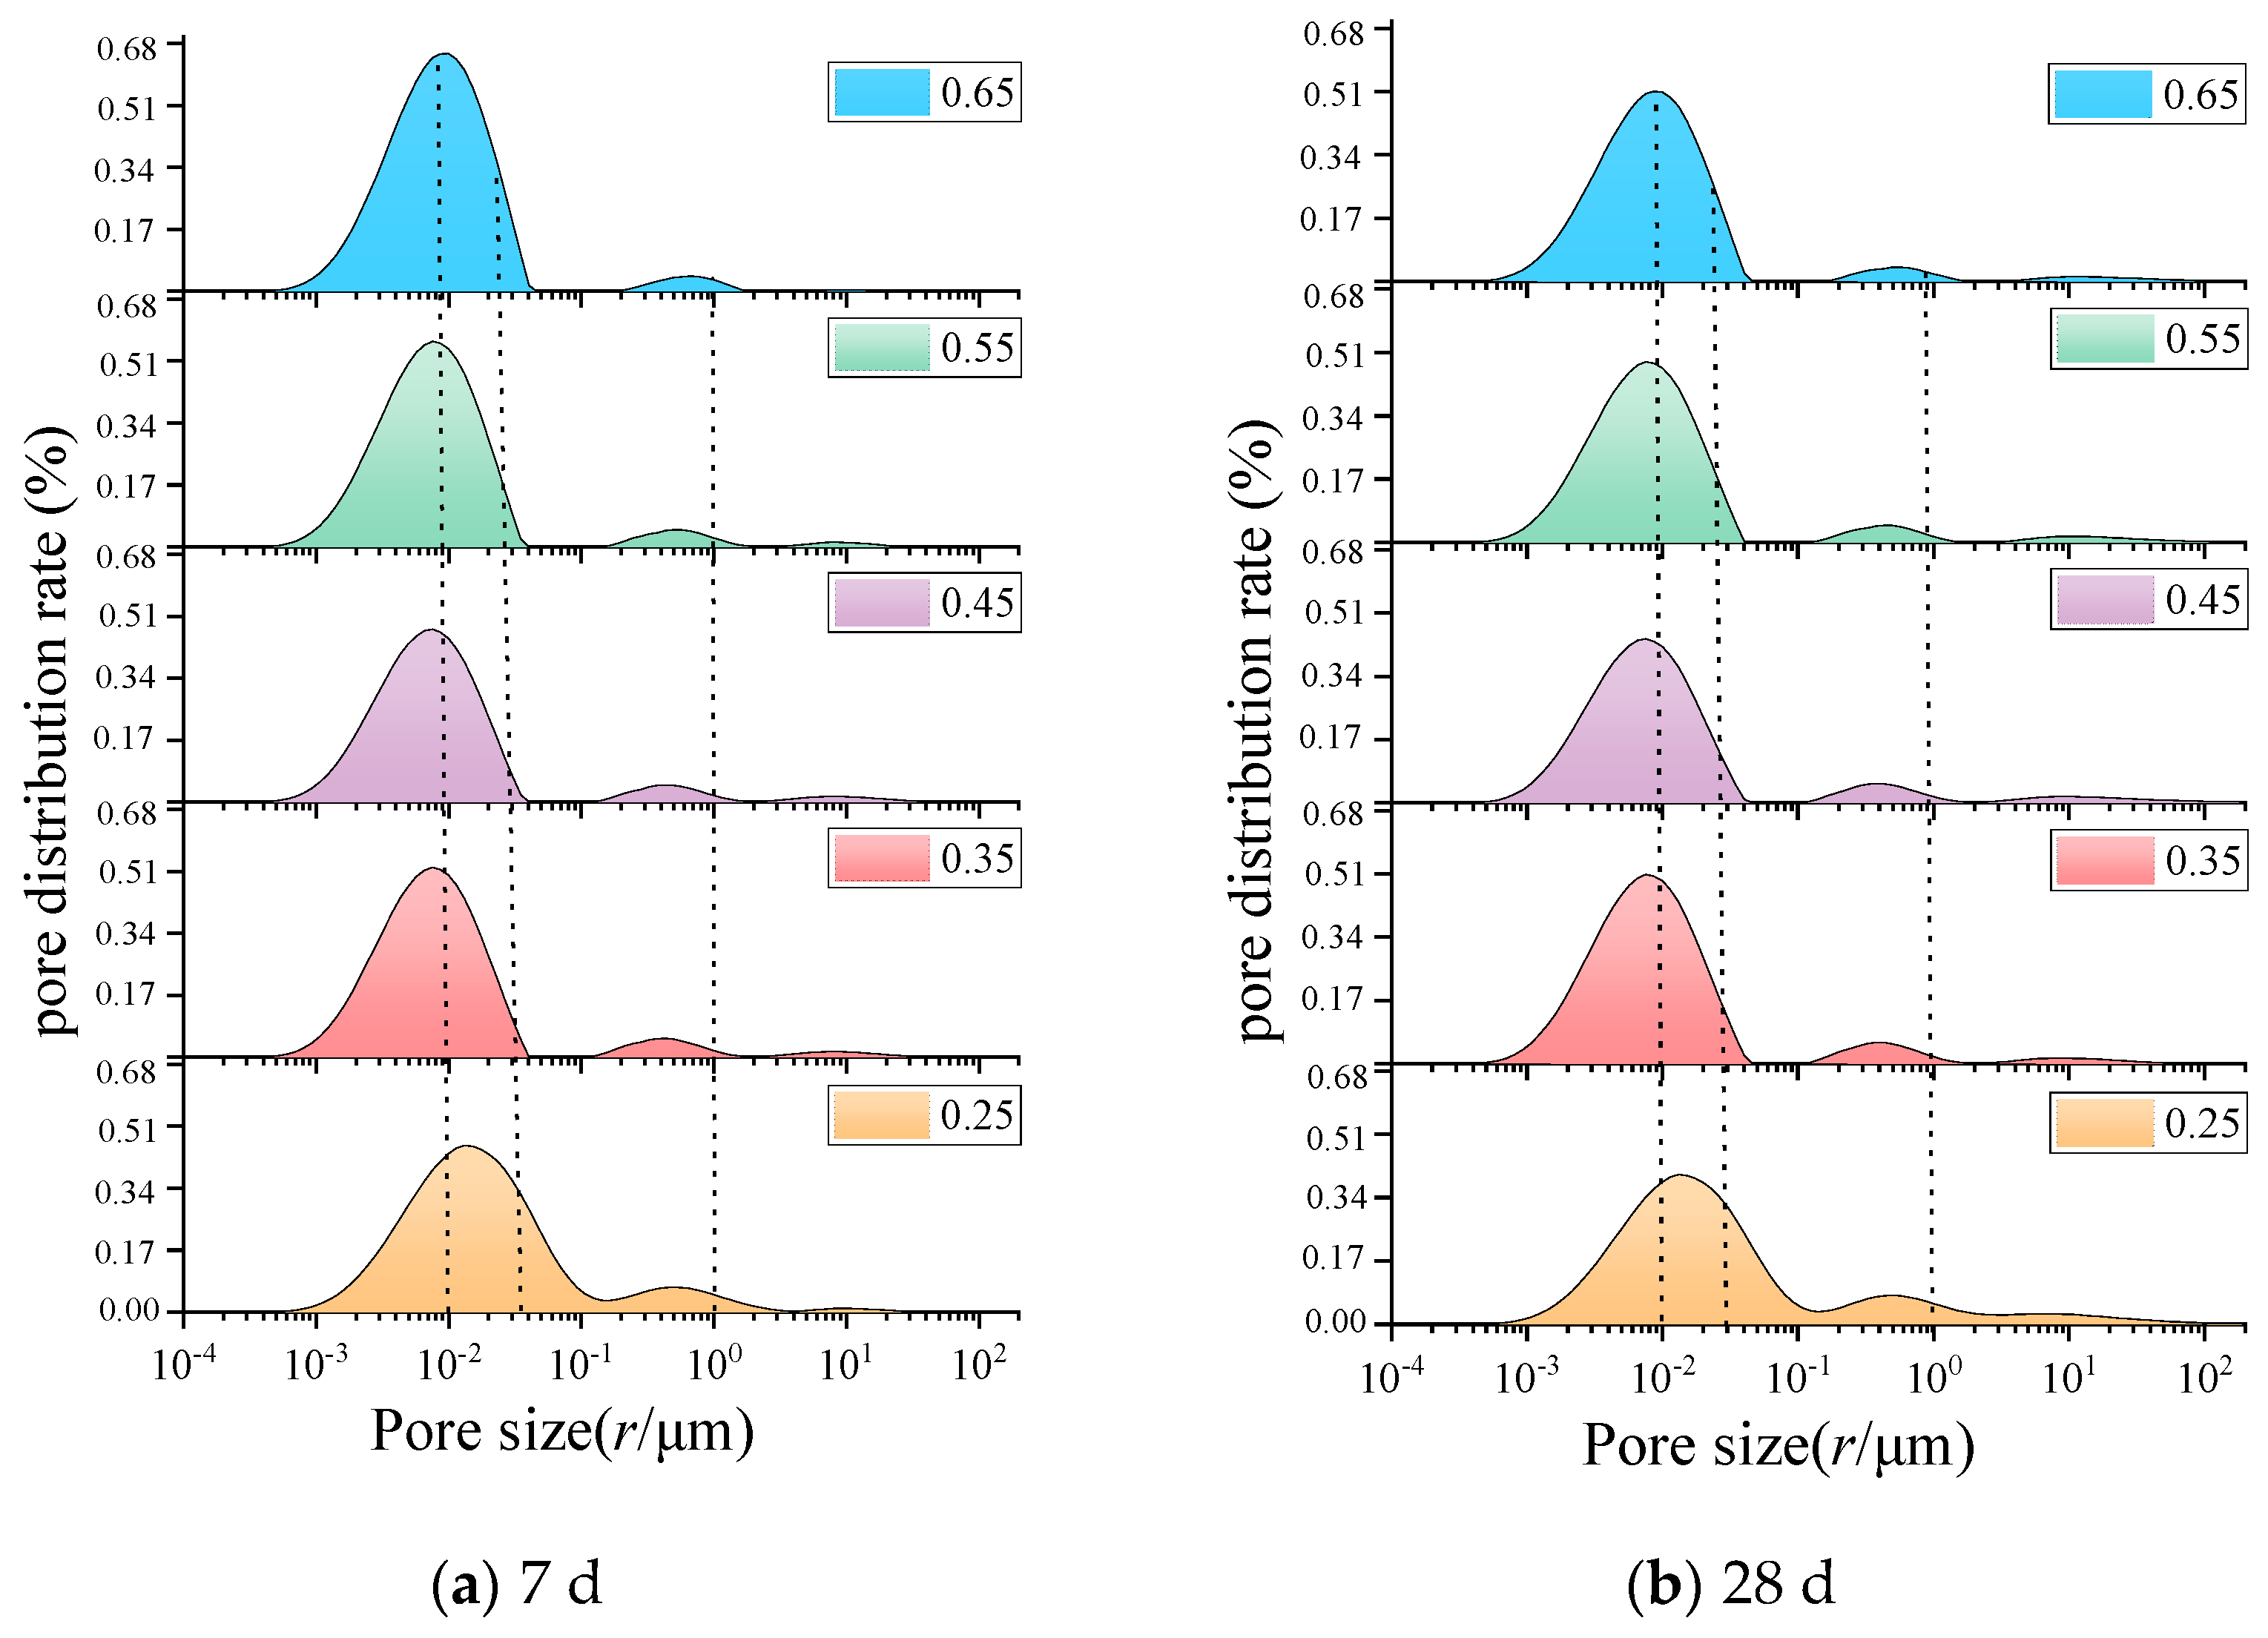
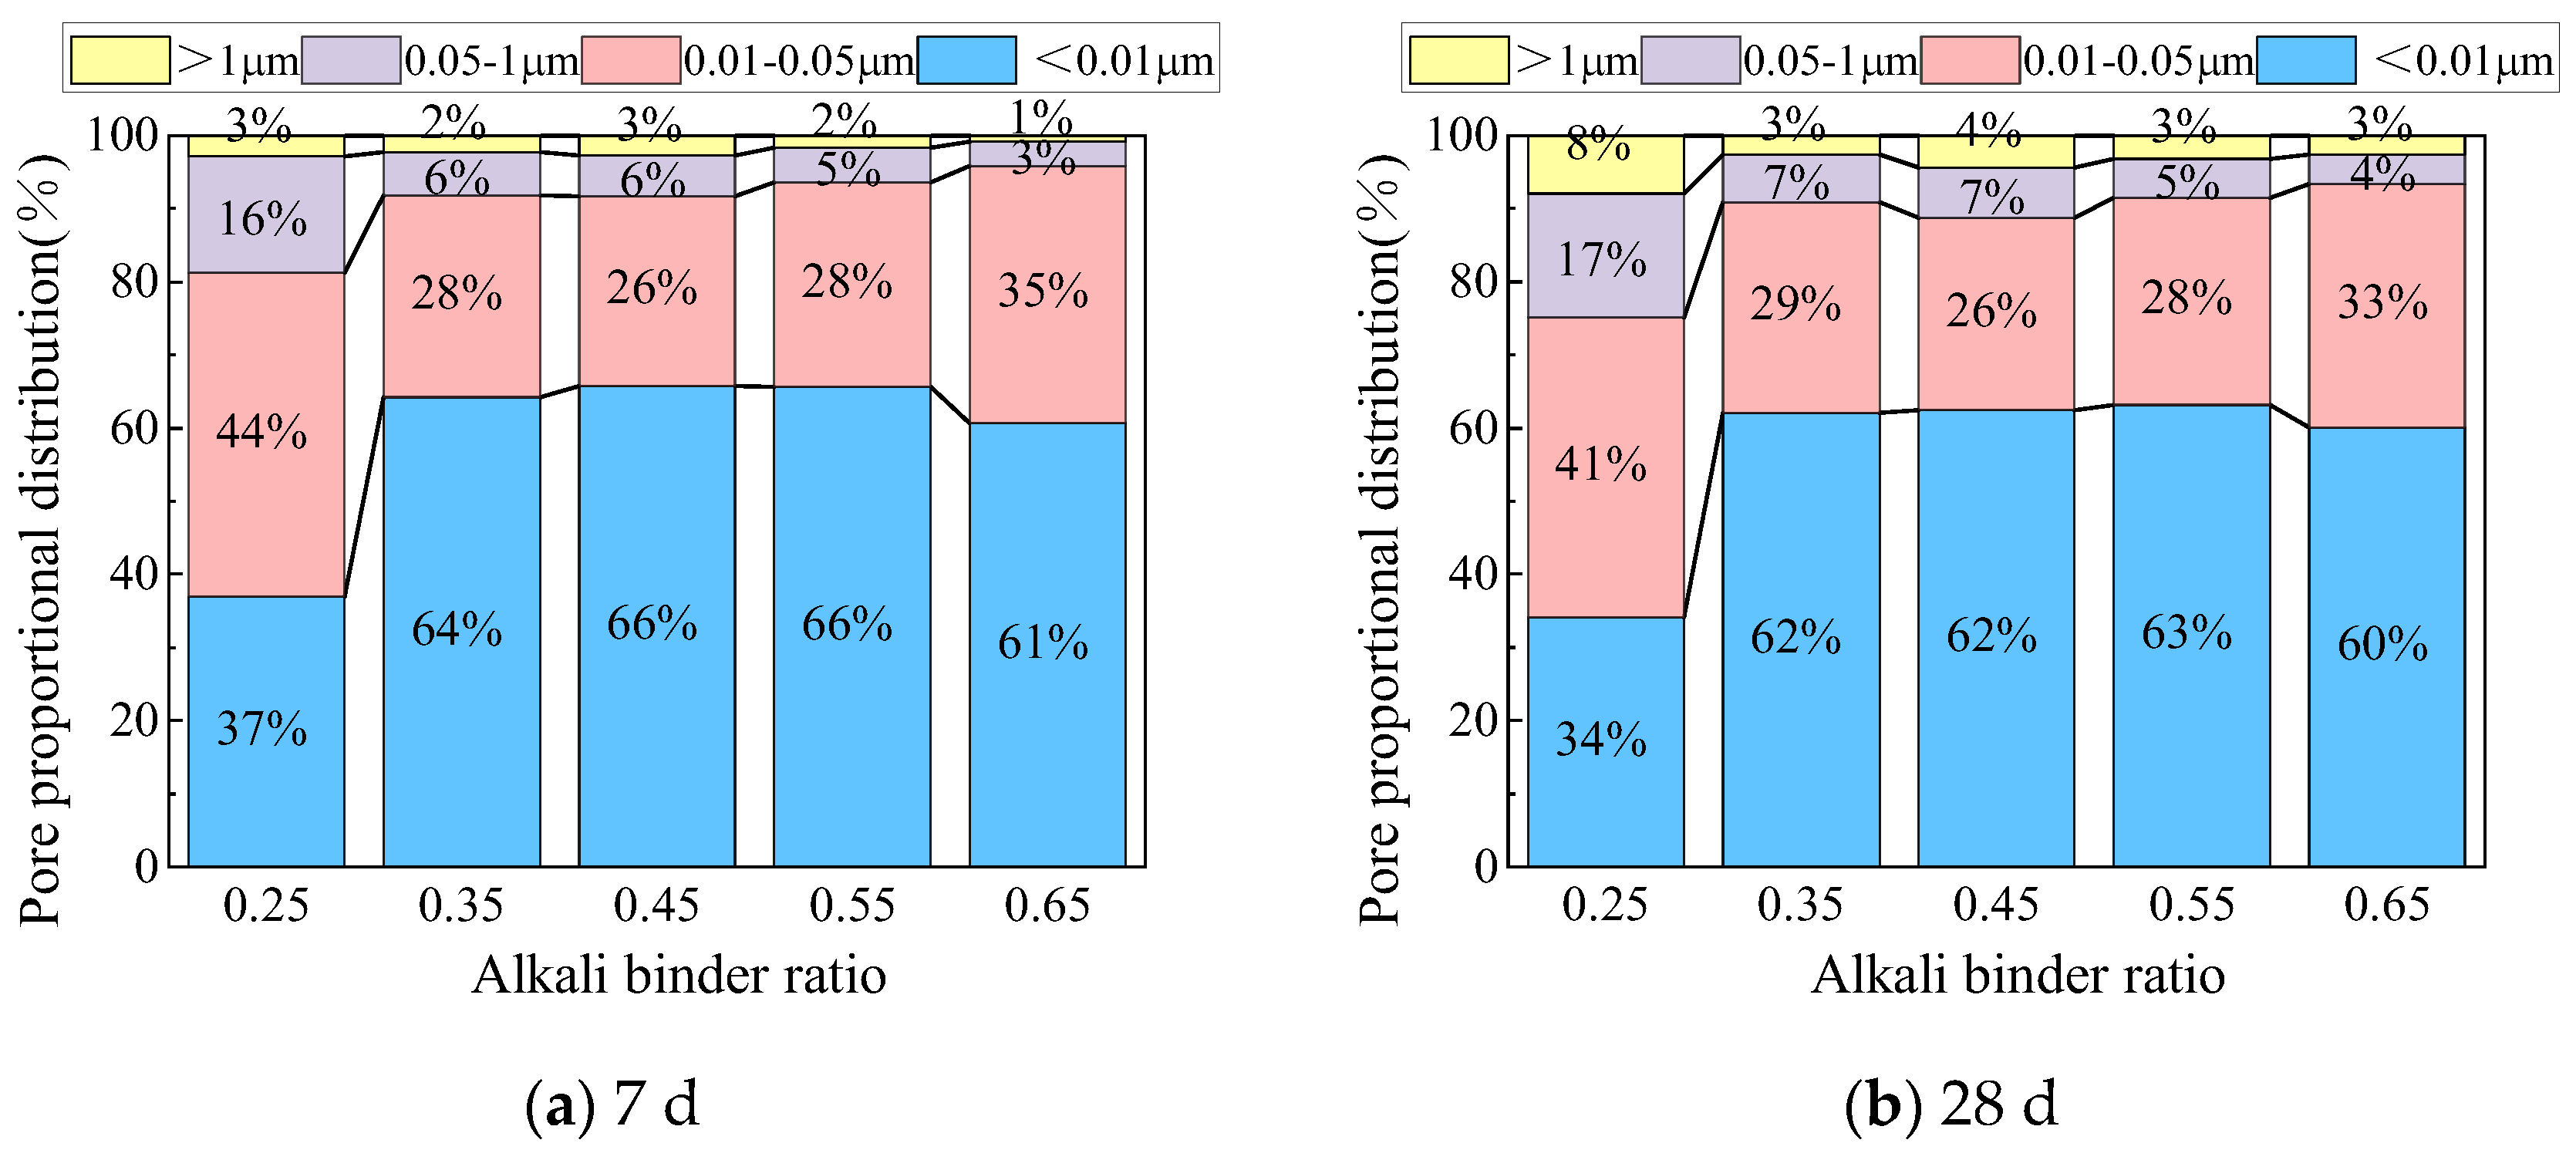
Figure 10 illustrates the pore size distribution at 7 d and 28 d under varying AL/B. A similar mountain-shaped distribution is observed in the pore size distribution of all samples. As the AL/B rises, the distribution first shifts to the left (pore size decreases) and then to the right (pore size increases). The specific pore proportion distribution of FAG is shown in Figure 11. Based on pore size range, pores are classified into micropores (d < 0.01 μm), mesopores (0.01–0.05 μm), capillary pores (0.05–1 μm), and macropores (d > 1 μm) [54]. Following 7 d of curing, pores in samples with varying AL/B were primarily composed of micropores, mesopores, and capillary pores, with macropores accounting for a smaller proportion. As the AL/B increases, the proportion of mesopores initially goes down and subsequently goes up, while the proportions of capillaries and macropores decrease. This is because, as the AL/B increases, the proportions of H2O, OH, and Na+ in the alkaline solution correspondingly rise, promoting the generation of more N-A-S-H gel [55], which ultimately reduces the proportion of pore size. Excessive alkaline solution may disrupt the continuity of the gel phase and make the mesopore proportion larger. A similar phenomenon was also observed at 28 d.

3.3. SEM Testing Analysis

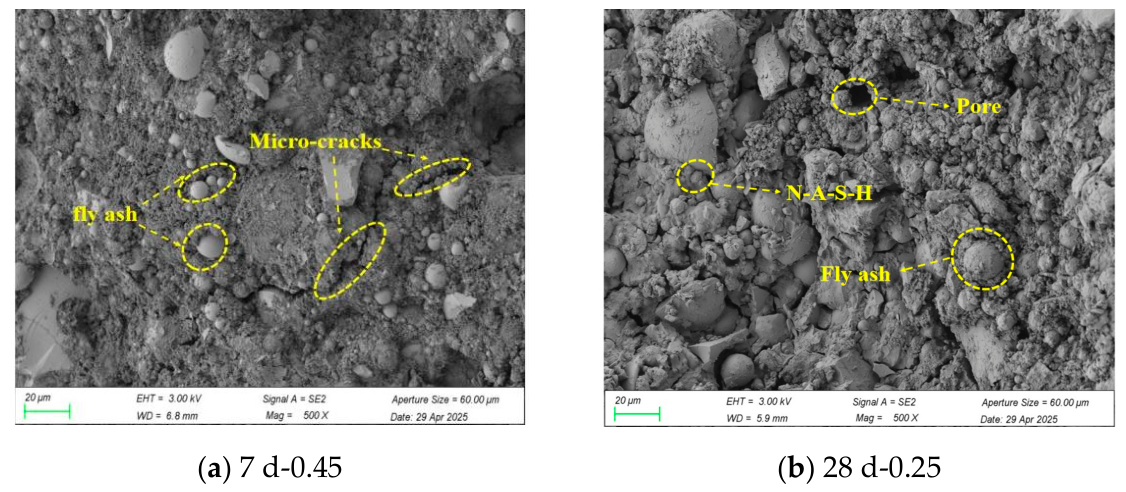
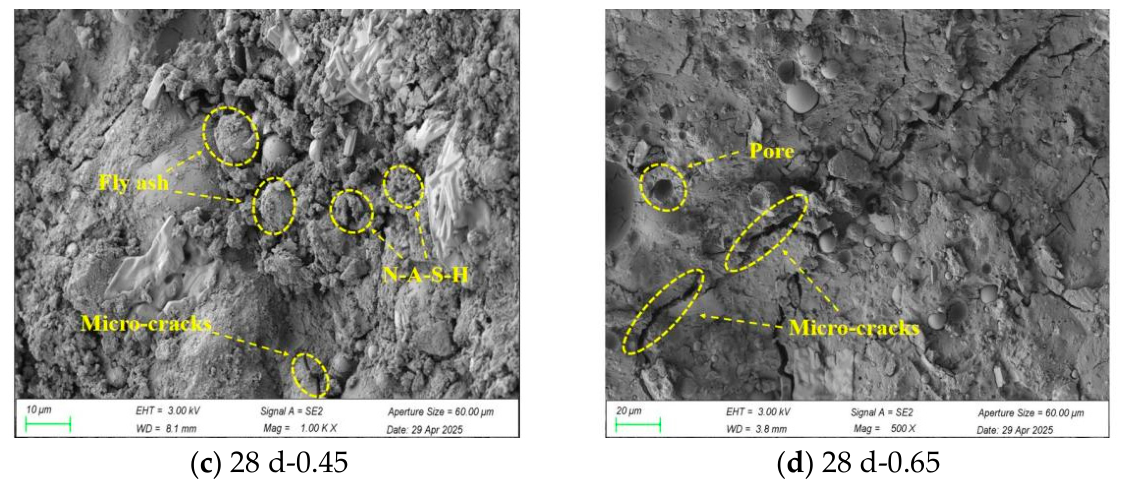
In this study, the microstructural characteristics under different curing ages (7 d and 28 d) and AL/B (0.25, 0.45, 0.65) were analyzed. Figure 12 illustrates the corresponding results. Compared with FAG45-7d (Figure 12a), the sample of FAG45-28d (Figure 12c) contains more N-A-S-H gel, more sufficient solubility of FA particles, and fewer microcracks, which indicates when the curing age goes up, polymerization reaction continues, amorphous aluminosilicate gel is significantly generated and filled with pores, and the microstructure tends to densify, gradually realizing the transformation of FAG from porous loose to dense strengthened [56]. FAG25-28d (Figure 12b) shows loose microstructure and abundant unreacted FA due to insufficient alkali supply, while FAG65-28d (Figure 12d) presents numerous micropores and broken gel phases caused by excessive alkaline residues, which further verifies the optimal matching condition at AL/B = 0.45 summarized in Section 3.1.1.

3.4. XRD Testing Analysis

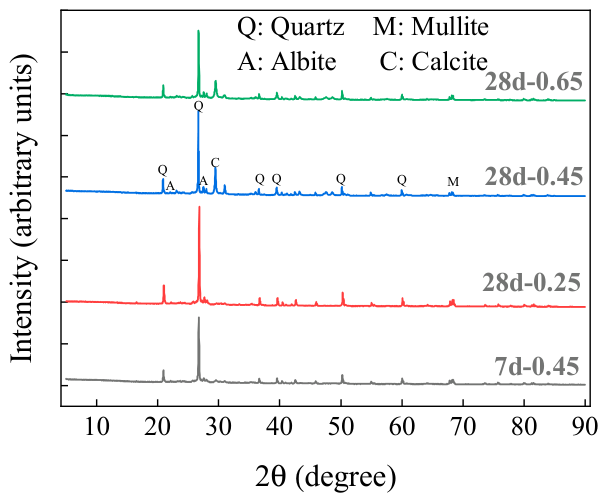
The XRD results for FAG are shown in Figure 13. FAG exhibits quartz, mullite, sodium feldspar, and calcite as its primary crystalline phases, and the wide dispersion peak in the range of 20°~40° 2 θ is characterized by amorphous N-A-S-H gel [57]. The XRD diffuse peak intensity at 7 d was relatively low, indicating limited gel formation at early curing age. As the curing age increased to 28 d, the peak shape gradually became more pronounced, corresponding to an increase in N-A-S-H gel content and suggesting that when curing ages increase, the alkali activation of FAG becomes more sufficient. Furthermore, the intensity of the characteristic N-A-S-H gel peak first increased and then decreased as AL/B rose, reaching a peak at AL/B = 0.45, which matches the variation rule of gel formation efficiency explained in Section 3.1.1. However, excessive alkaline solution further inhibits the depolymerization–polycondensation reaction. A dense amorphous gel phase can generate on the surface of FAG when AL/B = 0.45, at which point gel formation reaches its optimal state.

4. Mesoscopic Damage Mechanism Discussion

4.1. Statistical Damage Model

Bai et al. [38] proposed the “intrinsic mechanical property exertion mechanism” theory, interpreting the deformation and failure of concrete as a self-organizing behavior where the stress skeleton of the microstructure of the material undergoes optimal adjustment to adapt to changes in external load conditions. There are two types of effects within the microstructure during the deformation and failure process of concrete: degradation effect and strengthening effect, which correspond to the initiation and propagation of microcracks and the optimization and adjustment of the stress skeleton, respectively.
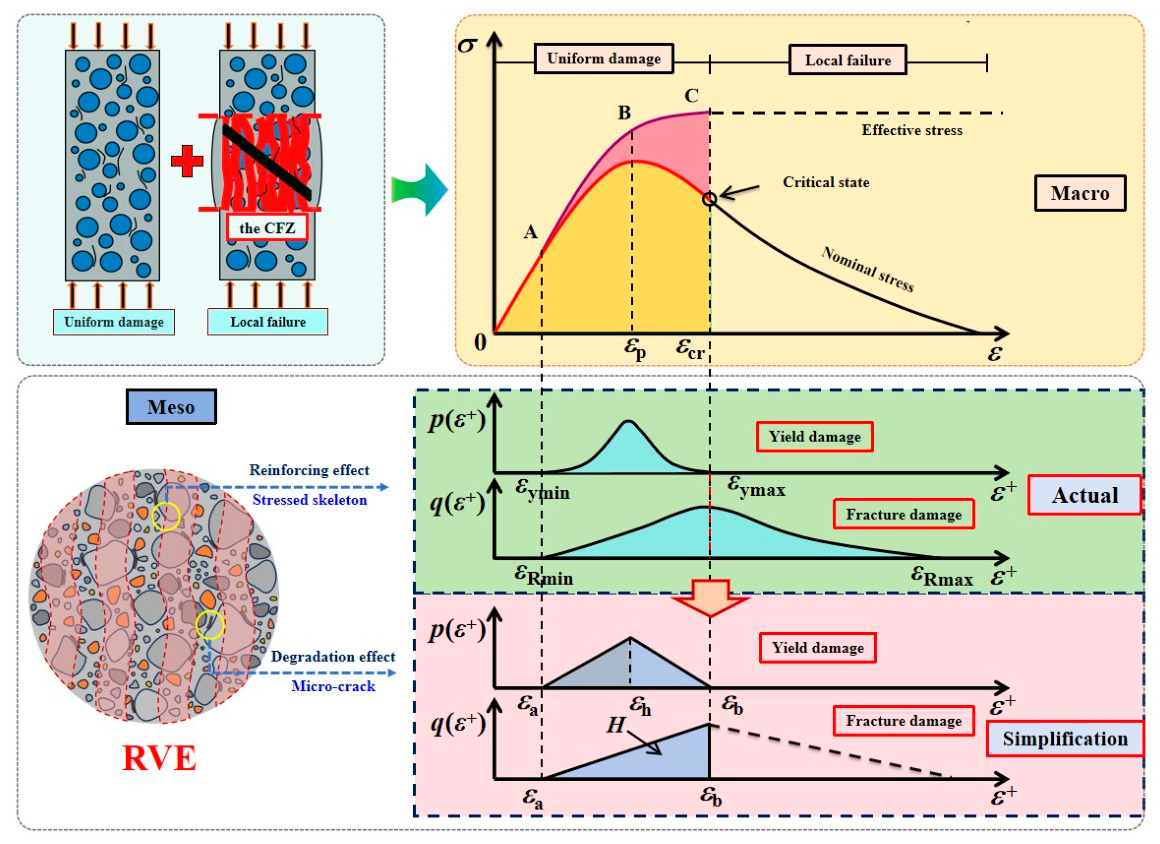
On this basis, a corresponding statistical damage model for concrete under uniaxial compression was further established [39,58,59,60] (Figure 14). Uniaxial compression failure is essentially caused by lateral tensile damage caused by Poisson effect. The introduction of equivalent tensile damage strain ε + is introduced to satisfy ε + = v ε ( ν is Poisson’s ratio). This model divides the uniaxial compression of concrete into two stages: uniform damage and local failure, in which the critical state plays a key role. The entire deformation and failure process is interpreted from the perspective of effective stress, and two mesoscopic-scale damage modes, namely fracture damage and yield damage, are considered in this process, corresponding to degradation effects and strengthening effects, respectively. In Figure 14, A, B, and C represent the proportional limit state, peak nominal stress, and critical state, respectively. q(ε+) and p(ε+) are the probability density functions reflecting fracture damage and yield damage, respectively. For analytical simplicity, q(ε+) and p(ε+) can be assumed to follow a triangular probability distribution. The constitutive expression for the uniform damage stage is as follows:
σ = E ( 1 D y ) ( 1 D R ) ε
σ E = E ( 1 D y ) ε
D y = 0 ε + p ( ε + ) d ε + 0 ε + p ( ε + ) ε + d ε + ε +
D R = 0 ε + q ( ε + ) d ε +
E v = 0 ε + p ( ε + ) d ε +
q ε + = 0 ε + ε a 2 H ε + ε a ε b ε a 2 ε a < ε + ε b
p ε + = 0 ε + ε a 2 ε + ε a ε h ε a ε b ε a ε a < ε + ε h 2 ε b ε + ε b ε h ε b ε a ε h < ε + ε b
H = D R ( ε b )
where: σ and σ E are the nominal and effective stresses, respectively; E 0 is the elastic modulus; D R and D y represent the damage variables for fracture and yield, respectively; and E v represents the evolution factor, ranging from 0 to 1. ε a , ε b , and ε h are the initial damage strain, the critical state strain, and the peak strain of p ε + , respectively, and H represents the fracture damage value at the critical state.
The advantages of this model lies in the fact that it can characterize the two-stage features of distributed damage accumulation and local catastrophic failure; it can reflect the cumulative process of damage from “quantitative change” to “qualitative change” in the uniform damage stage; more importantly, the model can reasonably explain the lag phenomenon of the critical state of local catastrophic failure revealed by deformation localization [61], acoustic emission [62], and electrical resistivity [63]. That is, the critical state corresponds to the maximum effective stress state and occurs later than the peak nominal stress state. When the critical state is reached, the stress skeleton of the microstructure is optimally adjusted, the potential mechanical properties are fully exerted to the limit, and then the local catastrophic failure stage is entered.

4.2. Mesoscopic Damage Mechanisms

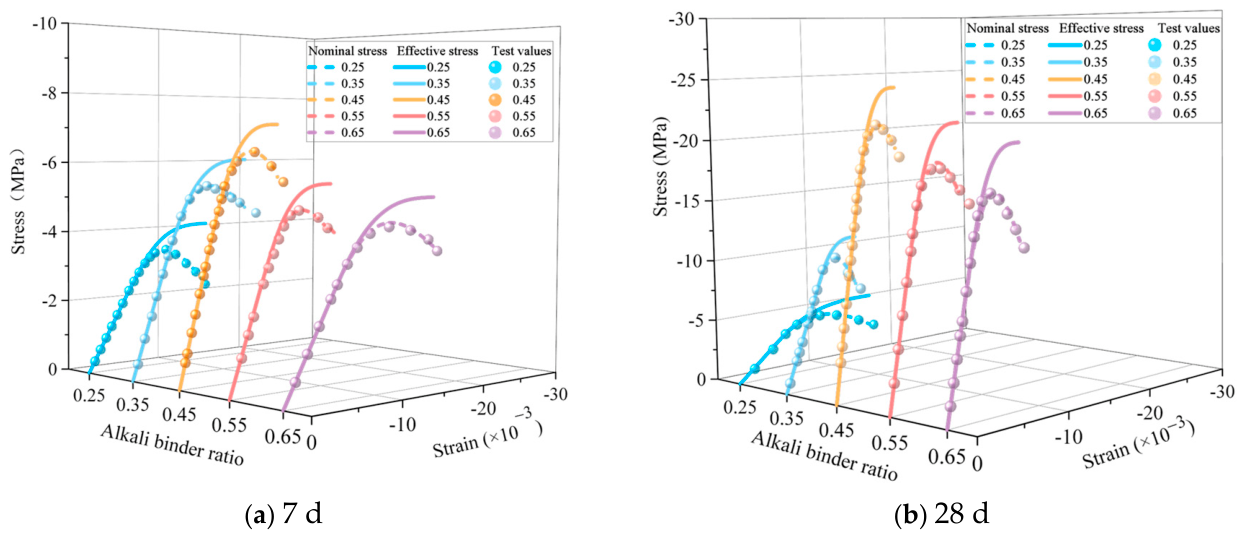
Genetic algorithm parameter inversion and multiple regression predictive analysis is conducted on the stress–strain curve in Figure 15, with specific values shown in Table 5. Here, R E = E A , i E A , 0 , where R E , A is the elastic modulus influence factor of FAG specimens under different alkali-binder ratios; E A , i is the elastic modulus of FAG specimens under different alkali-binder ratios; and E A , 0 is the elastic modulus of the control group (alkali-binder ratio of 0.45).
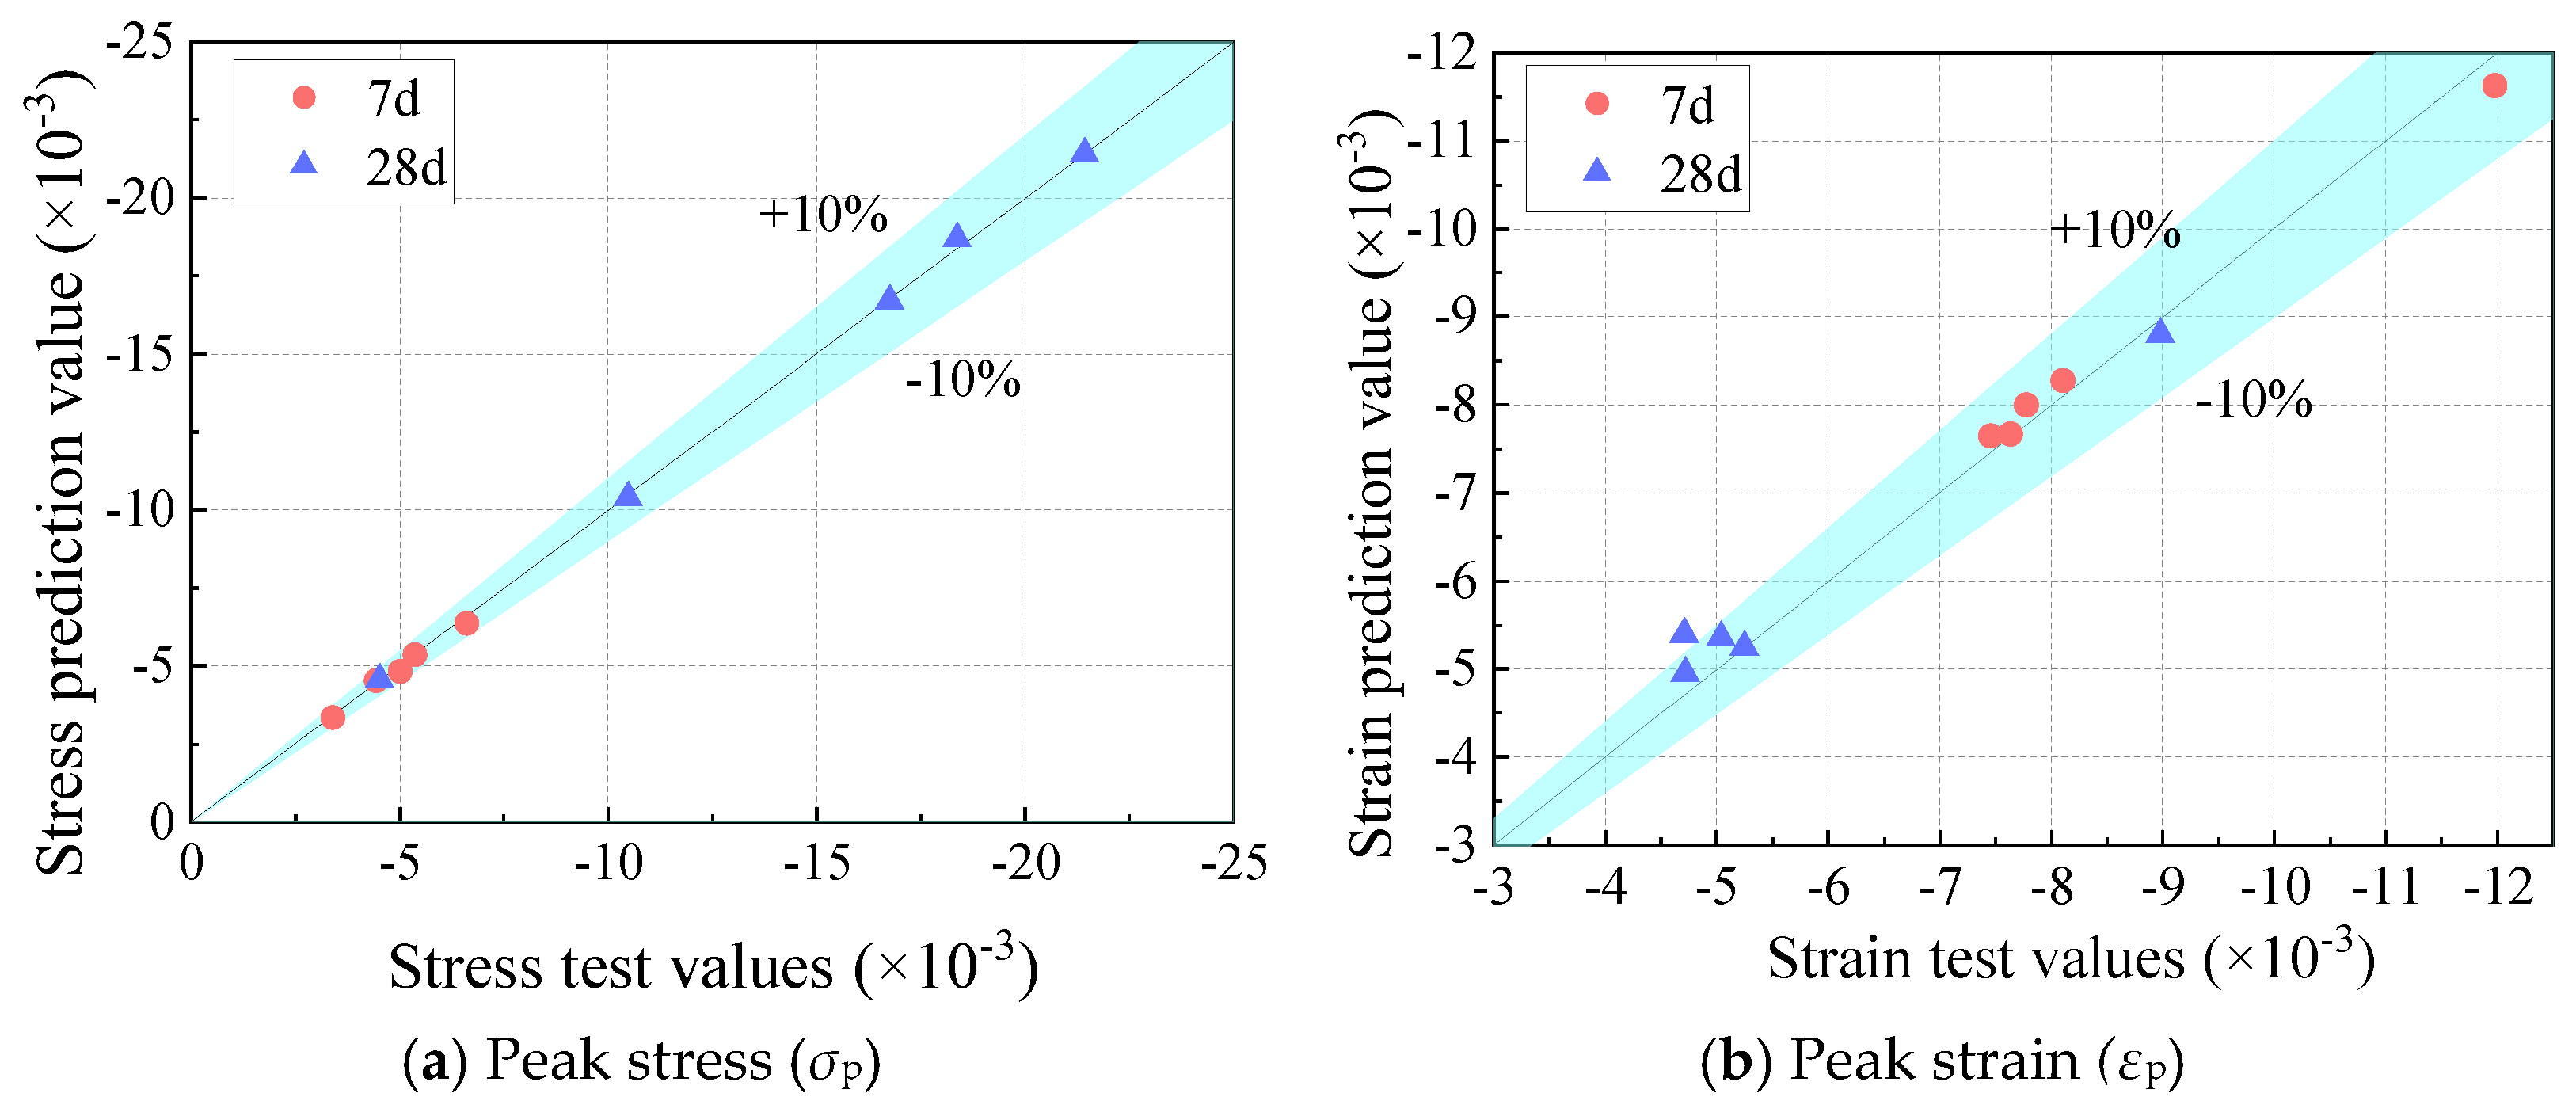
As illustrated in Figure 15, the nominal stress–strain and effective stress–strain curves that are anticipated by the statistical damage constitutive model are shown. The uniform damage stage is a useful tool for the analysis of the distinctive curves in both. The experimental result is in good agreement with the nominal stress–strain curve, encompassing both ascending and descending segments. Effective stress is defined as the outcome of optimizing and adjusting the predicted concrete stress skeleton. It has been demonstrated that effective stress exhibits a monotonically increasing trend until reaching its greatest value during the critical state [60]. Moreover, a comparison of the experimental results with the model predictions (Figure 16) reveals that the peak stress and peak strain of the curve predicted differ from the experimental curve by approximately ±10%. Consequently, the accuracy of the model in predicting the stress–strain relationship during the damage process of FAG is further verified. A detailed analysis of Figure 15 reveals that FAG exhibits identical trends at both 7 d and 28 d. As the AL/B increases, both the effective stress and nominal stress aligned with the critical state of the two sample groups initially increase and then decrease, reaching their maximum values at AL/B = 0.45. Consequently, FAG under AL/B = 0.45 exhibits optimal experimental mechanical properties and potential mechanical load-bearing capacity during uniaxial compression.
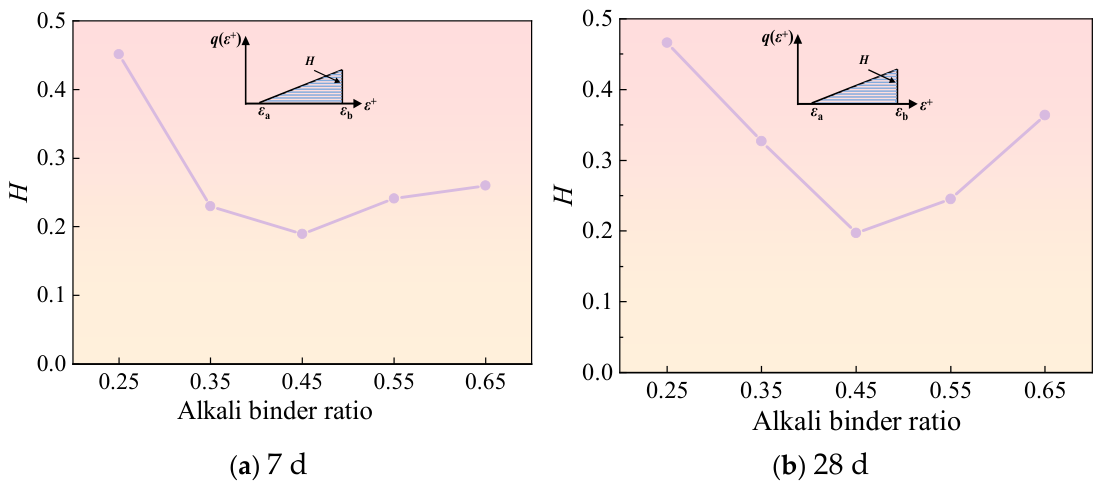
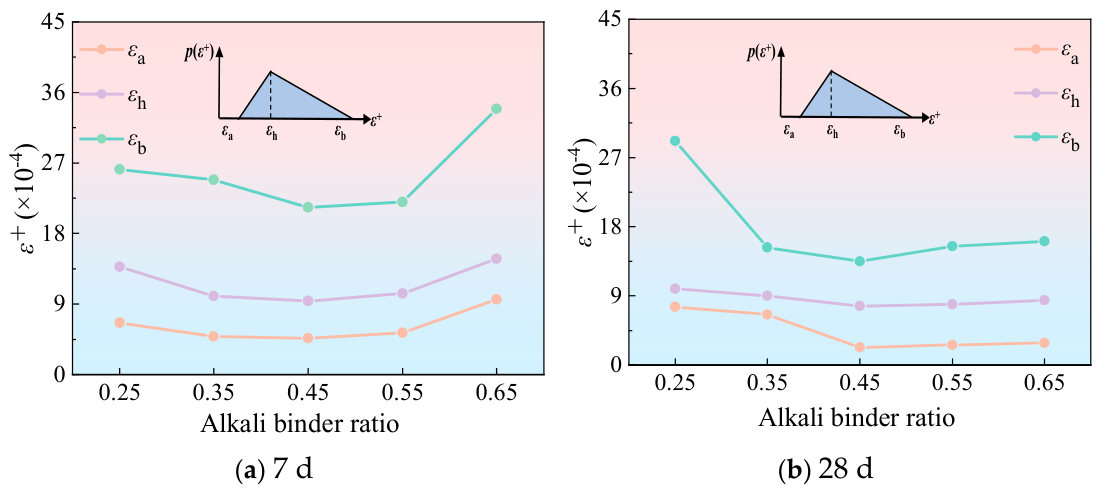
The mesoscopic characteristic factors listed in Table 5 are categorized into yield damage-related characteristic factors and fracture damage-related characteristic factors. The characteristic factors ε a , ε h , and ε b related to yield damage show variation trends as illustrated in Figure 17, while the characteristic factor H related to fracture damage shows its variation trend in Figure 18. As shown in the figures, regardless of the 7 d or 28 d, the values of ε a , ε h , ε b , and H all exhibit a pattern of initially declining and then rising near AL/B = 0.45. This indicates that the damage mechanism of FAG exhibits a distinct threshold effect, revealing the nonlinear characteristics of the uniform damage process in FAG. With a rise from 0.25 to 0.45 in AL/B, εa, εh, and εb gradually decrease, indicating that optimizing AL/B triggers internal damage in FAG earlier and rapidly reaches a critical state. Specifically, the decrease in εa indicates that as AL/B approaches 0.45, the stress skeleton of the FAG enters the strain threshold for structural optimization earlier; that is, the accelerated alkali-activated reaction enables the matrix structure of the geopolymer to complete adaptive adjustments at smaller strains. The decrease in εb reflects a reduction in the critical damage strain, indicating that the bonding strength between gel phase and aggregate interface increases when AL/B = 0.45, making localized failure more readily activated at lower strain levels. The evolution law of εh further corroborates the aforementioned mechanism: the sample with AL/B = 0.45, corresponding to the minimum value, exhibits the shortest duration of the damage homogenization stage, enabling FAG to enter the strengthening stage more rapidly.
The shape of the function q ε + is determined by the H value, which is an important indication of fracture damage that is directly associated with the initiation and propagation of microcracks. As shown in Figure 18, the minimum value of the fracture factor H occurs at AL/B = 0.45, indicating that the microstructure exhibits densification characteristics and the minimum number of microcracks. Combining the synergistic changes of εa and εb, the fracture damage probability density function q ε + demonstrates distinct regularities in its triangular distribution law. When AL/B is less than 0.45, the triangle vertex gradually shifts leftward with increasing AL/B (decreasing εh), and the distribution range narrows (decreasing εbεa difference), indicating more localized damage progression. Conversely, when AL/B exceeds 0.45, the vertex shifts rightward and the distribution range expands, which originates from the change of matrix compactness controlled by the depolymerization–polycondensation degree elaborated in Section 3.1.1.
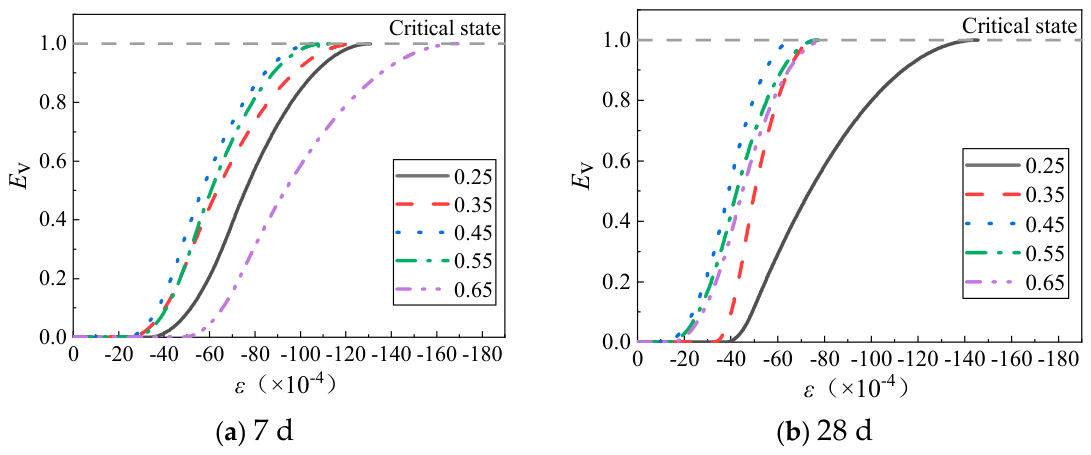
Figure 19 illustrates the evolution curve of the factor Ev. As a key factor characterizing the material damage process, Ev reflects the evolution of the microstructure and the changes in potential mechanical properties under external loading. Its value fluctuates between 0 and 1. When it reaches 1, it indicates that the limit of the potential mechanical properties of the material has been reached, the stressed skeleton has stabilized to its ideal state, and the maximum value of the effective stress has been attained; subsequently, it will go into the stage of local failure. Figure 19 shows that as AL/B increases, the Ev curves of FAG cured for 7 d and 28 d both exhibit a tendency of first fast followed by slow development near AL/B = 0.45, indicating a threshold effect on the triggering rate of the critical point of material damage. The Ev curve attains the critical state more rapidly with a rise from 0.25 to 0.45 in AL/B; whereas when AL/B exceeds 0.45, the Ev curve progresses more slowly. This indicates that excessively high AL/B weakens the gel phase interface, thereby slowing the rate of damage accumulation. Additionally, the morphological changes in the Ev curve reveal the influence mechanism of AL/B on FAG ductility: under low AL/B (0.25, 0.35) and excessively high AL/B (0.55, 0.65) conditions, the Ev curves of both 7 d and 28 d exhibit slow development characteristics, indicating the material possesses high deformation capacity. When AL/B is 0.45, the localized failure stage occurs earlier in the sample, the ductility significantly decreases, and the critical strain for damage also decreases accordingly.
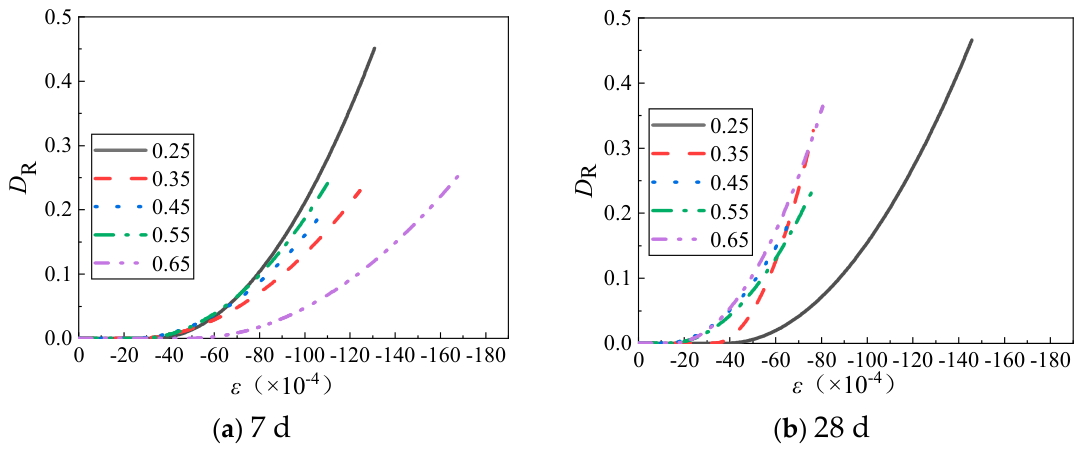
The initiation and propagation of microcracks during the uniform damage stage are closely correlated with the DR curve [58]. The DR evolution curves for FAG samples are displayed in Figure 20. As AL/B increases, the growth rates of the DR curves for both 7 d and 28 d demonstrate no apparent law. However, it has been observed that the curve terminus is first reached at AL/B = 0.45, indicating that the microcrack propagation rate exhibits a nonlinear dependence on AL/B. A substantial forward shift in the terminus of the DR curve is evident as AL/B rises from 0.25 to 0.45. It has been demonstrated that this is attributable to the effective acceleration of the geopolymerization reaction process by AL/B, which in turn promotes microstructural densification. This, in turn, results in a synchronous acceleration of microcrack initiation and damage rate. Consequently, samples enter a state of local disaster earlier. When AL/B exceeds 0.45, the terminus of the curve lags behind, indicating that FAG damage and optimization adjustments progress slowly, manifesting as reaching the critical state at a later point.
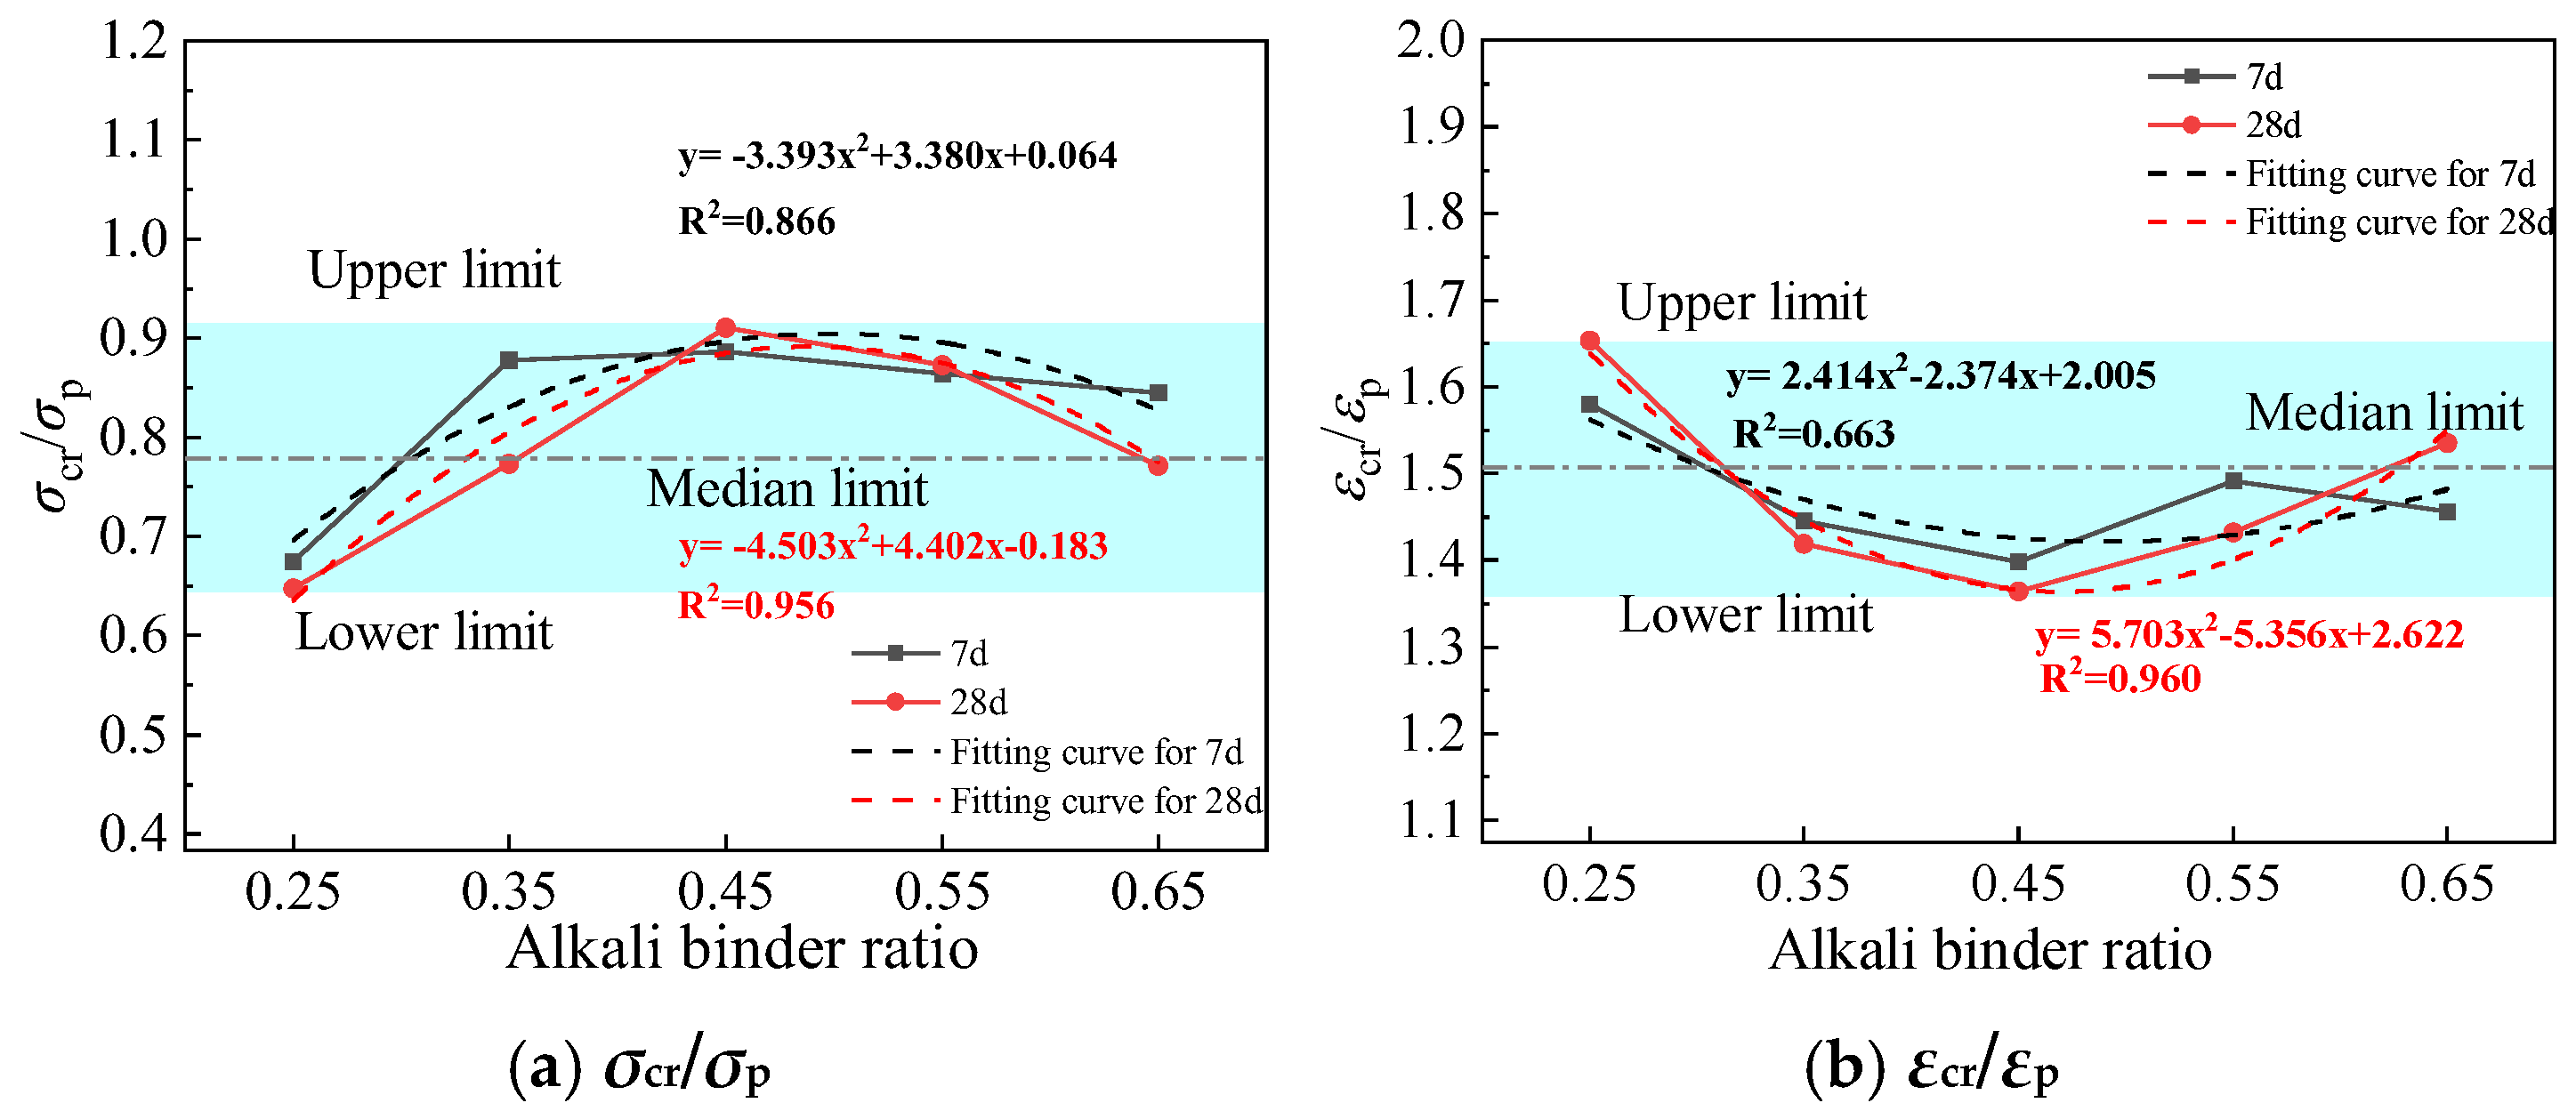
Figure 21 shows the stress ratio (σcr/σp) and strain ratio (εcr/εp) of the FAG sample at peak and critical states. The ratios σcr/σp and εcr/εp both follow a quadratic parabolic evolution trend with the increase of AL/B, with the optimal AL/B value of 0.45. Meanwhile, the fitting curves corresponding to 28 d exhibit higher fitting accuracy. The data in Figure 21a suggest that the median value of σcr/σp between the critical state and peak state on the nominal stress–strain curve is 0.78, with a range of 0.65 to 0.91. The connection between εcr/εp as a function of AL/B is depicted in Figure 21b, with a median value of 1.51 and fluctuations between 1.36 and 1.65. The results show that the lowering stage of the stress–strain curve is when the critical state occurs, meaning that during uniaxial compression, the initiation of macroscopic cracks in the FAG sample occurs later than the peak stress. Further analysis reveals that under the influence of AL/B, σcr/σp exhibits a pattern of initially rising and subsequently falling, while εcr/εp shows the opposite behavior. This indicates that AL/B significantly affects the triggering position of the critical state. The stronger the mechanical properties exhibited, the closer the critical state approaches the peak value. In the constitutive model of recycled aggregate concrete proposed by Xiao et al. [64], a limit state corresponding to 85% of the peak stress on the descending branch of the stress–strain curve is defined to fully characterize the deformation capacity. The critical state adopted in this study shares a similar physical implication with the aforementioned limit state and possesses a more in-depth physical mechanism. We recommend taking the critical state as the final failure point of the constitutive model. This treatment can not only fully account for the ductility during the uniform damage stage, but also avoid overestimating the size effect induced by localized failure.
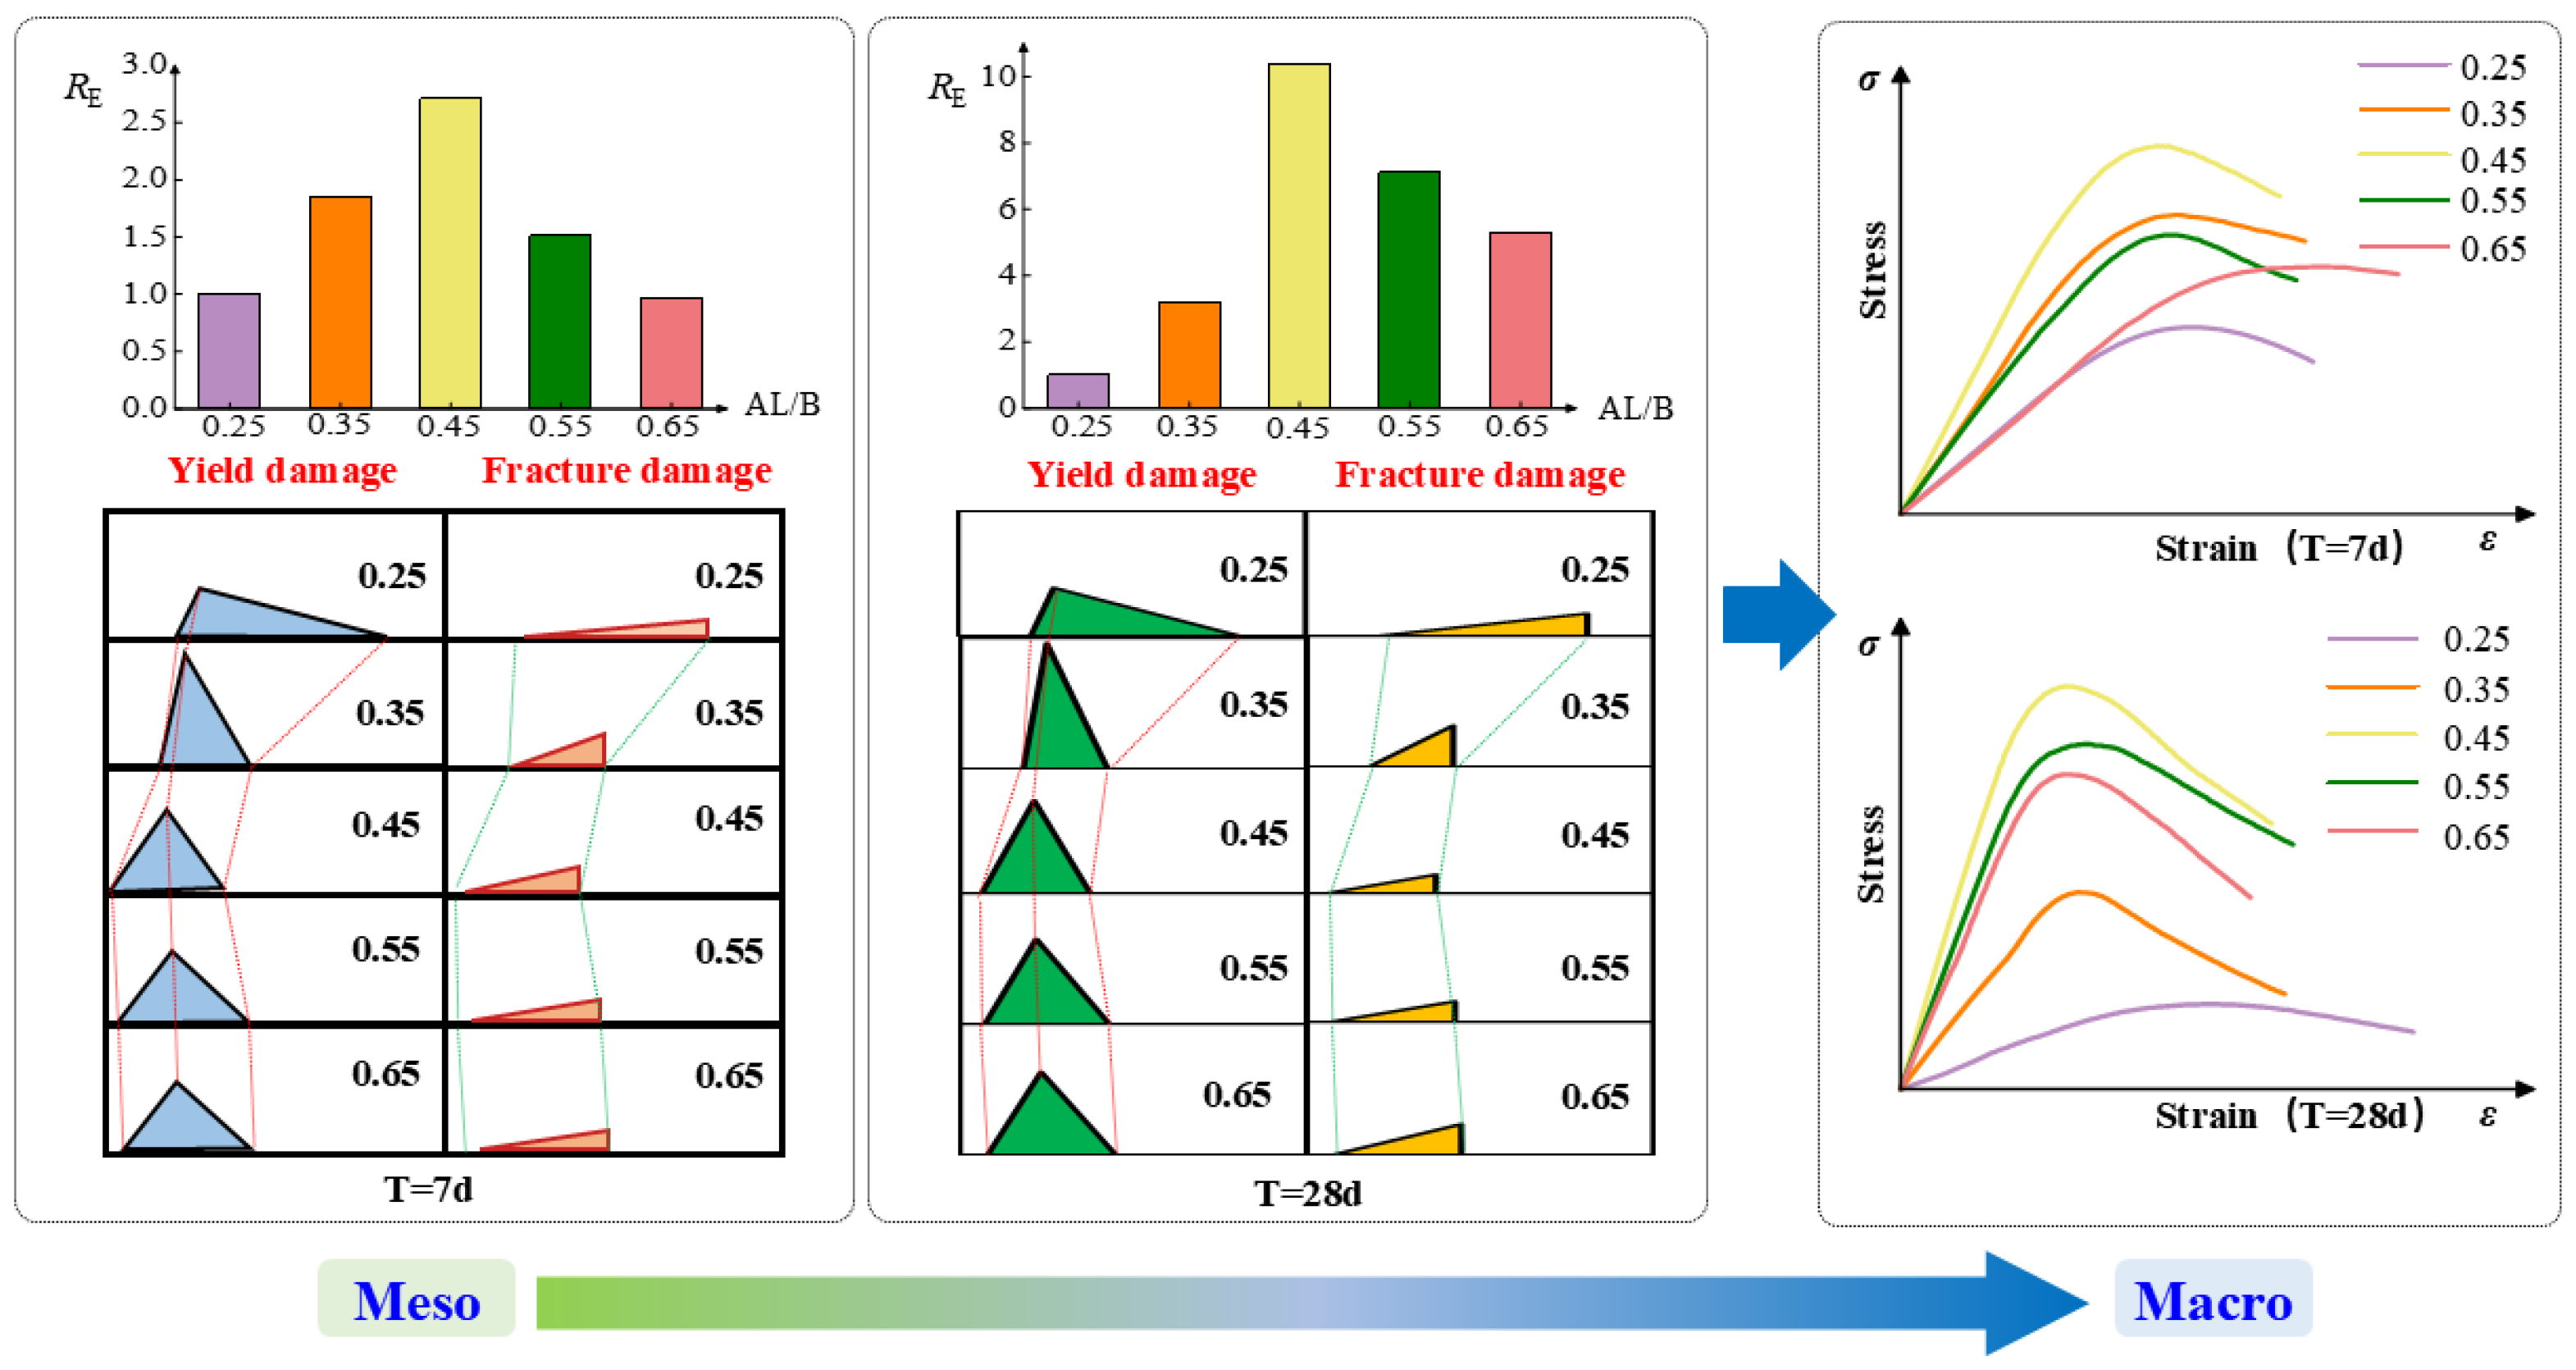
In fact, peak stress is a characteristic state on the stress–strain curve of concrete, and its formation mechanism is a complex issue involving the entire process of concrete from microstructure setting and hardening, stress deformation, to instability and failure; it is jointly determined by two aspects: microstructural mechanical characteristics (affected by components, micro morphology, porosity, etc.) and mesoscopic damage evolution (including microcrack initiation, propagation and optimal adjustment of the microstructure stress skeleton). For the FAG at 28 d, the connection ranging from the mesoscopic damage mechanism to the macroscopic stress–strain behavior is depicted in Figure 22. As the AL/B ratio increases, the figure indicates an initial rise in E, followed by a subsequent decline. Significant law is exhibited by the triangular distribution laws of fracture damage q(ε+) and yield damage p(ε+). When AL/B less than 0.45, the vertices of the triangle gradually shift to the left with increasing AL/B (εh decreases), and the distribution range narrows (the difference between εb and εa diminishes), indicating that damage development becomes more localized. When AL/B exceeds 0.45, the peak shifts to the right and the distribution range expands, reflecting the loosening of gel structure caused by an excessively alkaline environment. These results elucidate the rationale for the initial steepening and subsequent flattening of the macroscopic stress–strain curve with the growth of AL/B. The laws of E, yield damage, fracture damage, and the change in the stress–strain curve with AL/B are more fully demonstrated in this, as well as the close relationship between the mesoscopic damage evolution mechanism and the macroscopic stress–strain behavior of FAG.

5. Conclusions

This article designed and conducted mechanical performance tests on FAG with different AL/B. Uniaxial compression tests and microstructural analyses (NMR, SEM, XRD) were performed on FAG samples for 7 d and 28 d. By integrating experimental results with a statistical damage constitutive model, the mesoscopic evolution and strength development mechanism of FAG were examined in relation to AL/B and curing age. The following are the primary conclusions:
(1)
The macroscopic mechanical properties of FAG are closely related to the AL/B, exhibiting consistent variation laws at 7 d and 28 d alike: the σp and E of FAG first increase and then decrease with the increase of AL/B, reaching their maximum values at AL/B = 0.45; conversely, the εp reaches its minimum value at AL/B = 0.45. At the curing age of 28 d, the σp and E of specimens with AL/B = 0.45 are 11.33–365.60% and 45.98–936.28% higher than those of other AL/B groups, respectively, while their deformability decreases by approximately 20.83–58.70%. Under the experimental conditions adopted in this study, the optimal AL/B of FAG is 0.45. Both excessively low and high AL/B hinder the full development of polymerization reactions within FAG, leading to degradation of mechanical properties.
(2)
The aluminosilicate phase is a reaction product of FAG, as evidenced by experimental results from NMR, SEM, and XRD, significantly influencing the microstructural evolution of FAG. With increased AL/B, the porosity initially falls and subsequently rises, attaining its lowest value at AL/B = 0.45, which closely aligns with the strength variation law. When AL/B = 0.45, FA particles exhibit higher dissolution, and the alkali activation reaction is sufficient. This condition results in the highest density microstructure and the maximum quantity of N-A-S-H gel formation. With increasing curing age, the XRD diffuse peak intensity increases. As the AL/B increases, the intensity of the characteristic N-A-S-H gel peak first increases and then decreases, reaching its peak at AL/B = 0.45.
(3)
The strength of concrete is determined by both microstructural mechanical characteristics and mesoscopic damage evolution. This study demonstrates the impact of AL/B and curing age on the evolution laws of mesoscopic damage in FAG, as derived from statistical damage theory. For curing ages of 7 d and 28 d, the values of εa, εh, εb and H show a trend of decreasing first and then increasing around AL/B = 0.45. With the rise of the AL/B, the triangular distribution curves of yield damage and fracture damage first shift leftward and then rightward gradually. This verifies that the damage mechanism of FAG has an obvious threshold effect and reveals the nonlinear characteristics of the uniform damage evolution of FAG. Moreover, σcr/σp increases first and then decreases with the growth of AL/B, while εcr/εp decreases first and then increases, which further clarifies that the critical strain lags behind the peak strain. All these results demonstrate that the macroscopic nonlinear stress–strain behavior of FAG is closely correlated with its mesoscopic damage evolution.
(4)
This study systematically elucidates the influence of AL/B and curing age on the multi-scale strength formation mechanism of FAG, which contributes to promoting the efficient resource utilization of fly ash-based solid waste in multiple fields such as green building materials, road engineering, and mine backfilling. It should be noted that, due to the limitations of the research scope, this paper has not yet examined the durability, semi-quantitative XRD analysis, or tensile and flexural properties of FAG. Subsequent studies will focus on the aforementioned aspects to provide more comprehensive data support for the engineering application of FAG.

Author Contributions

C.Y.: Writing—review & editing, Software, Methodology, Conceptualization. W.Z.: Writing—original draft, Validation, Data curation. W.B.: Writing—review & editing, Supervision, Data curation. Y.X.: Methodology, Formal analysis. J.G.: Writing—review & editing, Supervision. Y.C.: Validation, Funding acquisition. C.X.: Writing—review & editing, Supervision. All authors have read and agreed to the published version of the manuscript.

Funding

The study is supported by Key R&D Program of Henan Province (No. 261111232400); National Natural Science Foundation of China (No. 51679092; No. 52179132; No. 52309155; No. 52479124); Natural Science Foundation of Henan (No. 252300421337; No. 252300421923); Henan Natural Science Fund for Distinguished Young Scholars (No. 232300421016); The Program for Innovative Research Team (in Science and Technology) in University of Henan Province of China (24IRTSTHN010). Independent Research Project of Yellow River Engineering Consulting Co., Ltd. (No. 2025KY025(2)).

Data Availability Statement

The data presented in this study are available on request from the corresponding author.

Conflicts of Interest

Author Ying Cui was employed by the company Yellow River Engineering Consulting Co., Ltd. The remaining authors declare that the research was conducted in the absence of any commercial or financial relationships that could be construed as potential conflicts of interest. The authors declare that this study received funding from Yellow River Engineering Consulting Co., Ltd. The funder had the following involvement with the study: Validation and Conceptualization.

References

  1. He, Z.; Shen, A.; Lyu, Z.; Li, Y.; Wu, H.; Wang, W. Effect of Wollastonite Microfibers as Cement Replacement on the Properties of Cementitious Composites: A Review. Constr. Build. Mater. 2020, 261, 119920. [Google Scholar] [CrossRef]
  2. Sahoo, N.; Kumar, A. Samsher Design of Solar Cement Plant for Supplying Thermal Energy in Cement Production. J. Clean. Prod. 2023, 426, 139151. [Google Scholar] [CrossRef]
  3. Andrew, R.M. Global CO2 Emissions from Cement Production, 1928–2018. Earth Syst. Sci. Data 2019, 11, 1675–1710. [Google Scholar] [CrossRef]
  4. Hardjasaputra, H.; Cornelia, M.; Gunawan, Y.; Surjaputra, I.V.; Lie, H.A.; Rachmansyah; Pranata Ng, G. Study of Mechanical Properties of Fly Ash-Based Geopolymer Concrete. IOP Conf. Ser. Mater. Sci. Eng. 2019, 615, 012009. [Google Scholar] [CrossRef]
  5. Zhang, Z.; Su, T.; Zhang, L.; Zheng, R.; Ma, K.; Zhang, L.; Amaechi, C.V.; Wang, C. The Influence of Fly Ash and Slag on the Mechanical Properties of Geopolymer Concrete. Buildings 2024, 14, 2720. [Google Scholar] [CrossRef]
  6. Diaz-Loya, E.I.; Allouche, E.N.; Vaidya, S. Mechanical Properties of Fly-Ash-Based Geopolymer Concrete. ACI Mater. J. 2011, 108, 300. [Google Scholar]
  7. Zhang, P.; Gao, Z.; Wang, J.; Guo, J.; Hu, S.; Ling, Y. Properties of Fresh and Hardened Fly Ash/Slag Based Geopolymer Concrete: A Review. J. Clean. Prod. 2020, 270, 122389. [Google Scholar] [CrossRef]
  8. Huang, D.; Liu, Z.; Lin, C.; Lu, Y.; Li, S. Effects and Mechanisms of Component Ratio and Cross-Scale Fibers on Drying Shrinkage of Geopolymer Mortar. Constr. Build. Mater. 2024, 411, 134299. [Google Scholar] [CrossRef]
  9. Shamsol, A.’liaS.; Apandi, N.M.; Zailani, W.W.A.; Izwan, K.N.K.; Zakaria, M.; Zulkarnain, N.N. Graphene Oxide as Carbon-Based Materials: A Review of Geopolymer with Addition of Graphene Oxide towards Sustainable Construction Materials. Constr. Build. Mater. 2024, 411, 134410. [Google Scholar] [CrossRef]
  10. Xu, W.; Niu, X.; Zhu, Y. Deformation Behavior and Damage Evaluation of Fly Ash-Slag Based Geopolymer Concrete under Cyclic Tension. J. Build. Eng. 2024, 86, 108664. [Google Scholar] [CrossRef]
  11. Deb, P.S.; Nath, P.; Sarker, P.K. Drying Shrinkage of Slag Blended Fly Ash Geopolymer Concrete Cured at Room Temperature. Procedia Eng. 2015, 125, 594–600. [Google Scholar] [CrossRef]
  12. Afzali, S.A.E.; Shayanfar, M.A.; Ghanooni-Bagha, M.; Golafshani, E.; Ngo, T. The Use of Machine Learning Techniques to Investigate the Properties of Metakaolin-Based Geopolymer Concrete. J. Clean. Prod. 2024, 446, 141305. [Google Scholar] [CrossRef]
  13. Assi, L.N.; Carter, K.; Deaver, E.; Ziehl, P. Review of Availability of Source Materials for Geopolymer/Sustainable Concrete. J. Clean. Prod. 2020, 263, 121477. [Google Scholar] [CrossRef]
  14. Pavithra, P.; Srinivasula Reddy, M.; Dinakar, P.; Hanumantha Rao, B.; Satpathy, B.K.; Mohanty, A.N. A Mix Design Procedure for Geopolymer Concrete with Fly Ash. J. Clean. Prod. 2016, 133, 117–125. [Google Scholar] [CrossRef]
  15. Pazouki, G. Fly ash-based geopolymer concrete’s compressive strength estimation by applying artificial intelligence methods. J. Clean. Prod. 2022, 203, 111916. [Google Scholar] [CrossRef]
  16. Morla, P.; Gupta, R.; Azarsa, P.; Sharma, A. Corrosion Evaluation of Geopolymer Concrete Made with Fly Ash and Bottom Ash. Sustainability 2021, 13, 398. [Google Scholar] [CrossRef]
  17. Hager, I.; Sitarz, M.; Mróz, K. Fly-ash based geopolymer mortar for high-temperature application-Effect of slag addition. J. Clean. Prod. 2021, 316, 128168. [Google Scholar] [CrossRef]
  18. Yang, W.; Zhu, P.; Liu, H.; Wang, X.; Ge, W.; Hua, M. Resistance to Sulfuric Acid Corrosion of Geopolymer Concrete Based on Different Binding Materials and Alkali Concentrations. Materials 2021, 14, 7109. [Google Scholar] [CrossRef]
  19. Hou, D.; Sun, M.; Wang, M.; Wan, X.; Chen, Z.; Wang, X.; Zhang, Y.; Wang, P. Molecular Insight into the Formation and Fracture Process of Sodium Aluminosilicate Hydrate Gels. J. Phys. Chem. C 2023, 127, 15542–15555. [Google Scholar] [CrossRef]
  20. Kumar, S.G.K.M.; Kinuthia, J.M.; Oti, J.; Adeleke, B.O. Geopolymer Chemistry and Composition: A Comprehensive Review of Synthesis, Reaction Mechanisms, and Material Properties—Oriented with Sustainable Construction. Materials 2025, 18, 3823. [Google Scholar] [CrossRef] [PubMed]
  21. Wang, J.; Zhu, L.; Wan, D.; Xue, Y. Research Progress and Trend Analysis of Solid Waste Resource Utilization in Geopolymer Concrete. Buildings 2025, 15, 3370. [Google Scholar] [CrossRef]
  22. Assi, L.N.; Deaver, E.; El Batanouny, M.K.; Ziehl, P. Investigation of Early Compressive Strength of Fly Ash-Based Geopolymer Concrete. Constr. Build. Mater. 2016, 112, 807–815. [Google Scholar] [CrossRef]
  23. Wang, W.; Fan, C.; Wang, B.; Zhang, X.; Liu, Z. Workability, Rheology, and Geopolymerization of Fly Ash Geopolymer: Role of Alkali Content, Modulus, and Water–Binder Ratio. Constr. Build. Mater. 2023, 367, 130357. [Google Scholar] [CrossRef]
  24. Chen, K.; Lin, W.; Liu, W. Effect of NaOH Concentration on Properties and Microstructure of a Novel Reactive Ultra-Fine Fly Ash Geopolymer. Adv. Powder Technol. 2021, 32, 2929–2939. [Google Scholar] [CrossRef]
  25. Rao, A.K.; Kumar, D.R. Effect of Various Alkaline Binder Ratio on Geopolymer Concrete under Ambient Curing Condition. Mater. Today Proc. 2020, 27, 1768–1773. [Google Scholar] [CrossRef]
  26. Sharath, B.P.; Shivaprasad, K.N.; Athikkal, M.M.; Das, B.B. Some Studies on Sustainable Utilization of Iron Ore Tailing (IOT) as Fine Aggregates in Fly Ash Based Geopolymer Mortar. IOP Conf. Ser. Mater. Sci. Eng. 2018, 431, 092010. [Google Scholar] [CrossRef]
  27. Thakur, M.; Bawa, S. Evaluation of Strength and Durability Properties of Fly Ash-Based Geopolymer Concrete Containing GGBS and Dolomite. Energy Ecol. Environ. 2023, 9, 256–271. [Google Scholar] [CrossRef]
  28. Aliabdo, A.A.; Elmoaty, A.E.M.A.; Salem, H.A. Effect of Water Addition, Plasticizer and Alkaline Solution Constitution on Fly Ash Based Geopolymer Concrete Performance. Constr. Build. Mater. 2016, 121, 694–703. [Google Scholar] [CrossRef]
  29. Rangan, B.V. Fly Ash-Based Geopolymer Concrete. Curtin Univ. Technol. 2008, 7, 1–77. [Google Scholar] [CrossRef]
  30. Nath, P.; Sarker, P.K. Flexural Strength and Elastic Modulus of Ambient-Cured Blended Low-Calcium Fly Ash Geopolymer Concrete. Constr. Build. Mater. 2017, 130, 22–31. [Google Scholar] [CrossRef]
  31. Memon, F.A.; Nuruddin, M.F.; Shafiq, N. Effect of Silica Fume on the Fresh and Hardened Properties of Fly Ash-Based Self-Compacting Geopolymer Concrete. Int. J. Miner. Metall. Mater. 2013, 20, 205–213. [Google Scholar] [CrossRef]
  32. Hashmi, A.F.; Shariq, M.; Baqi, A. An Investigation into Age-Dependent Strength, Elastic Modulus and Deflection of Low Calcium Fly Ash Concrete for Sustainable Construction. Constr. Build. Mater. 2021, 283, 122772. [Google Scholar] [CrossRef]
  33. Zhang, C.; Jin, F.; Hou, Y.; Zhou, Y. Discrete-Contact-Fracture Analysis of Rock and Concrete. Chin. J. Rock. Mech. Eng. 2008, 27, 217–235. [Google Scholar]
  34. Krajcinovic, D.; Silva, M.A.G. Statistical Aspects of the Continuous Damage Theory. Int. J. Solids Struct. 1982, 18, 551–562. [Google Scholar] [CrossRef]
  35. Bai, W.; Shen, J.; Guan, J.; Wang, J.; Yuan, C. Study on Compressive Mechanical Properties of Recycled Aggregate Concrete with Silica Fume at Different Strain Rates. Mater. Today Commun. 2022, 31, 103444. [Google Scholar] [CrossRef]
  36. Bai, W.; Li, W.; Guan, J.; Wang, J.; Yuan, C. Research on the Mechanical Properties of Recycled Aggregate Concrete under Uniaxial Compression Based on the Statistical Damage Model. Materials 2020, 13, 3765. [Google Scholar] [CrossRef] [PubMed]
  37. Bai, W.-F.; Wang, W.-L.; Guan, J.-F.; Wang, J.; Yuan, C. Compressive Stress-Strain Relationships of Concrete Exposed to Elevated Temperatures Based on Mesoscopic Damage Method. Int. J. Damage Mech. 2022, 31, 1420–1447. [Google Scholar] [CrossRef]
  38. Bai, W.; Ye, D.; Ye, S.; Yuan, C.; Guan, J.; Yang, G.; Xie, C. Study on Mechanical Properties and Damage Mechanism of Alkali-Activated Slag Concrete. J. Build. Eng. 2024, 96, 110357. [Google Scholar] [CrossRef]
  39. Bai, W.; Lu, X.; Guan, J.; Yuan, C. Experimental Study on Uniaxial Compression Mechanical Properties of Recycled Concrete with Silica Fume Considering the Effect of Curing Age. Constr. Build. Mater. 2022, 350, 128758. [Google Scholar] [CrossRef]
  40. Li, Z.; Liu, S. Influence of Slag as Additive on Compressive Strength of Fly Ash-Based Geopolymer. J. Mater. Civ. Eng. 2007, 19, 470–474. [Google Scholar] [CrossRef]
  41. Gao, Z.; Zhang, P.; Wang, J.; Wang, K.; Zhang, T. Interfacial Properties of Geopolymer Mortar and Concrete Substrate: Effect of Polyvinyl Alcohol Fiber and Nano-SiO2 Contents. Constr. Build. Mater. 2022, 315, 125735. [Google Scholar] [CrossRef]
  42. SL/T 352-2020; Specifications for Hydraulic Concrete Testing. China Water Resources and Electric Power Press: Beijing, China, 2020. (In Chinese)
  43. GB/T 14685-2022; Construction Aggregates (Gravel and Crushed Stone). China Standards Press: Beijing, China, 2022. (In Chinese)
  44. Ojha, A.; Aggarwal, P. Fly Ash Based Geopolymer Concrete: A Comprehensive Review. Silicon 2021, 14, 2453–2472. [Google Scholar] [CrossRef]
  45. Joseph, B.; Mathew, G. Influence of Aggregate Content on the Behavior of Fly Ash Based Geopolymer Concrete. Sci. Iran. 2012, 19, 1188–1194. [Google Scholar] [CrossRef]
  46. GB/T 50080-2016; Standard for Test Method of Performance on Ordinary Fresh Concrete. China Architecture & Building Press: Beijing, China, 2019. (In Chinese)
  47. GB/T 50081-2019; Standard Test Method for Physical and Mechanical Properties of Concrete. China Architecture&Building Press: Beijing, China, 2019. (In Chinese)
  48. Yu, H.; Zhang, X.; Zhang, Y.; Liu, Y.; Sun, Y.; An, Q. Experimental Study on Cavitation Effects on Concrete Pore Structure and Mechanical Properties. Constr. Build. Mater. 2025, 458, 139644. [Google Scholar] [CrossRef]
  49. Xie, J.; Wang, J.; Rao, R.; Wang, C.; Fang, C. Effects of Combined Usage of GGBS and Fly Ash on Workability and Mechanical Properties of Alkali Activated Geopolymer Concrete with Recycled Aggregate. Compos. Part B Eng. 2019, 164, 179–190. [Google Scholar] [CrossRef]
  50. Jallu, M.; Saride, S.; Arulrajah, A.; Challapalli, S.; Evans, R. Effect of Curing Time on the Performance of Fly Ash Geopolymer-Stabilized RAP Bases. J. Mater. Civ. Eng. 2021, 33, 04021001. [Google Scholar] [CrossRef]
  51. Escalante-Garcia, J.I.; Espinoza-Perez, L.J.; Gorokhovsky, A.; Gomez-Zamorano, L.Y. Coarse Blast Furnace Slag as a Cementitious Material, Comparative Study as a Partial Replacement of Portland Cement and as an Alkali Activated Cement. Constr. Build. Mater. 2009, 23, 2511–2517. [Google Scholar] [CrossRef]
  52. Xia, D.; Chen, R.; Cheng, J.; Tang, Y.; Xiao, C.; Li, Z. Desert Sand-High Calcium Fly Ash-Based Alkali-Activated Mortar: Flowability, Mechanical Properties, and Microscopic Analysis. Constr. Build. Mater. 2023, 398, 131729. [Google Scholar] [CrossRef]
  53. Hu, X.; Shi, C.; Shi, Z.; Zhang, L. Compressive Strength, Pore Structure and Chloride Transport Properties of Alkali-Activated Slag/Fly Ash Mortars. Cem. Concr. Compos. 2019, 104, 103392. [Google Scholar] [CrossRef]
  54. Li, W.; Long, C.; Tam, V.W.Y.; Poon, C.-S.; Duan, W.H. Effects of Nano-Particles on Failure Process and Microstructural Properties of Recycled Aggregate Concrete. Constr. Build. Mater. 2017, 142, 42–50. [Google Scholar] [CrossRef]
  55. Castillo, H.; Collado, H.; Droguett, T.; Vesely, M.; Garrido, P.; Palma, S. State of the Art of Geopolymers: A Review. E-Polymers 2022, 22, 108–124. [Google Scholar] [CrossRef]
  56. Adam, A.A.; Akifa, S.N.; Siregar, A.P.N.; Mustofa. Effect of Method and Duration of Curing on the Compressive Strength of the Lime-Fly Ash Geopolymer Concrete. J. Phys. Conf. Ser. 2020, 1594, 012030. [Google Scholar] [CrossRef]
  57. Yaseri, S.; Hajiaghaei, G.; Mohammadi, F.; Mahdikhani, M.; Farokhzad, R. The Role of Synthesis Parameters on the Workability, Setting and Strength Properties of Binary Binder Based Geopolymer Paste. Constr. Build. Mater. 2017, 157, 534–545. [Google Scholar] [CrossRef]
  58. Bai, W.; Suo, G.; Yuan, C.; Guan, J.; Xie, C.; Li, L. Study on Multi-Scale Dynamic Mechanical Properties of Metakaolin Modified Recycled Aggregate Concrete under Coupling Conditions of Sulfate Attack and Dry-Wet Cycles. J. Build. Eng. 2024, 94, 109921. [Google Scholar] [CrossRef]
  59. Bai, W.; Hu, H.; Yuan, C.; Guan, J.; Xie, C.; Lv, Y. The Influence of Blast Furnace Slag on the Mechanical Properties and Mesoscopic Damage Mechanisms of Recycled Aggregate Concrete Compared to Natural Aggregate Concrete at Different Ages. J. Build. Eng. 2024, 94, 109926. [Google Scholar] [CrossRef]
  60. Bai, W.; Geng, Y.; Yuan, C.; Guan, J.; Lv, Y.; Xie, C.; Lei, J. Study on Mechanical Properties and Mesoscopic Damage Mechanism of Metakaolin Modified Recycled Aggregate Concrete. Dev. Built Environ. 2024, 17, 100332. [Google Scholar] [CrossRef]
  61. Van Geel, H.M.G. Concrete Behaviour in Multiaxial Compression: Experimental Research. Ph.D. Thesis, Technische Universiteit Eindhoven, Eindhoven, The Netherlands, 1998. [Google Scholar] [CrossRef]
  62. Bai, W.; Song, Z.; Yuan, C.; Guan, J.; Xie, C.; Huang, H.; Ma, Y. Study on Mechanical Properties and Damage Mechanism of Recycled Concrete Containing Silica Fume in Freeze–Thaw Environment. Constr. Build. Mater. 2023, 375, 130872. [Google Scholar] [CrossRef]
  63. Le, H.V.; Kim, M.K.; Kim, D.J.; Park, J. Electrical Properties of Smart Ultra-High Performance Concrete under Various Temperatures, Humidities, and Age of Concrete. Cem. Concr. Compos. 2021, 118, 103979. [Google Scholar] [CrossRef]
  64. Xiao, J.; Li, J.; Zhang, C. Mechanical Properties of Recycled Aggregate Concrete under Uniaxial Loading. Cem. Concr. Res. 2005, 35, 1187–1194. [Google Scholar] [CrossRef]
Figure 1. Micro morphology of fly ash.
Buildings 16 02834 g001
Figure 2. Alkali-activated raw materials and finished solutions.
Buildings 16 02834 g002
Figure 3. Aggregate.
Buildings 16 02834 g003
Figure 4. Aggregates gradation.
Buildings 16 02834 g004
Figure 5. Preparation process of FAG.
Buildings 16 02834 g005
Figure 6. Relationship between macro mechanical properties of FAG and AL/B.
Buildings 16 02834 g006
Figure 7. Typical stress–strain curves for FAG under different AL/B and curing ages.
Buildings 16 02834 g007
Figure 8. Failure characteristic of FAG.
Buildings 16 02834 g008
Figure 9. Relationship between porosity and AL/B.
Buildings 16 02834 g009
Figure 10. Pore size distribution of FAG under different AL/B.
Buildings 16 02834 g010
Figure 11. Pore proportion distribution of FAG under different AL/B.
Buildings 16 02834 g011
Figure 12. SEM images of FAG at different AL/B and curing ages.
Buildings 16 02834 g012aBuildings 16 02834 g012b
Figure 13. XRD patterns of samples at different AL/B and curing ages.
Buildings 16 02834 g013
Figure 14. Uniaxial compression statistical damage model.
Buildings 16 02834 g014
Figure 15. Nominal stress–strain curve and effective stress–strain curve of FAG.
Buildings 16 02834 g015
Figure 16. Comparison of test values and model predicted values.
Buildings 16 02834 g016
Figure 17. Relationship between εa, εh, εb, and AL/B.
Buildings 16 02834 g017
Figure 18. Relationship between H and AL/B.
Buildings 16 02834 g018
Figure 19. Relationship between EV and AL/B.
Buildings 16 02834 g019
Figure 20. Relationship between DR and AL/B.
Buildings 16 02834 g020
Figure 21. The ratio of stress and strain of FAG in peak state to critical state.
Buildings 16 02834 g021
Figure 22. Macroscopic stress–strain behavior and mesoscopic damage mechanism.
Buildings 16 02834 g022
Table 1. Physical and chemical properties of water glass.
SiO2/%Na2O/%ModulusDensity/(g/cm3)Baume/°BéTransparence/%
29.58.883.431.414288
Table 2. Related properties of aggregates.
AggregateApparent Density/(kg/m3)Tap Density/(kg/m3)Bulk Density/(kg/m3)Water Content/%Water Absorption/%Crushing Index
/%
River sand2580175015000.30.3-
Coarse aggregate2810172015001.00.110.6
Table 3. Main performance indexes of polycarboxylate superplasticizer.
Test ItemChloride Ion Content/%Total Alkali Content/%Solid
Content/%
Water Reduction Rate/%Bleeding Rate/%Air Content/%
Result0.0440.359830584.0
Table 4. Mixing proportions of FAG under the influence of AL/B (kg/m3).
Mix
Proportion Number
Alkali-
Binder
Ratio
Fly AshRiver SandCoarse
Aggregate
Alkali ActivatorEffective Water Content of the Alkaline
Solution
Wate
Reducing Agent
Additional Water
NaOHNa2SiO3
FAG250.25400.00668.971242.3730.7869.2260.458.0049.44
FAG350.35400.00660.681226.9843.0996.9184.628.0029.22
FAG450.45400.00652.391211.5955.40124.60108.808.009.00
FAG550.55400.00633.401176.3267.71152.29124.008.000.00
FAG650.65400.00605.831125.1180.02179.98132.008.000.00
Negative calculated values of additional water mass are set to zero uniformly.
Table 5. Characteristic parameters.
AgeAL/Bεa/×10−4εh/×10−4εb/×10−4HRER2
7 d0.256.61613.76826.1660.4511.0000.9997
0.354.86010.00024.8700.2301.8480.9988
0.454.6539.36021.3100.1892.7080.9997
0.555.31410.32722.0010.2411.5100.9984
0.659.62114.75233.8940.2600.9710.9992
28 d0.257.5639.92429.1480.4661.0000.9994
0.356.5778.98515.2860.3273.1960.9977
0.452.2937.69413.5050.19710.3630.9985
0.552.6127.90915.4640.2457.0990.9976
0.652.9048.40716.1190.3645.3110.9998
Disclaimer/Publisher’s Note: The statements, opinions and data contained in all publications are solely those of the individual author(s) and contributor(s) and not of MDPI and/or the editor(s). MDPI and/or the editor(s) disclaim responsibility for any injury to people or property resulting from any ideas, methods, instructions or products referred to in the content.