3.2.1. Wear-Retained Skid Performance
According to the
Field Test Methods of Subgrade and Pavement for Highway Engineering (JTG E60-2008) [
32], the measured pendulum values were temperature-corrected and uniformly converted to the standard value at 20 °C. The correction equation is expressed as follows:
where BPN20 is the standard pendulum value at 20 °C, BPNt is the measured pendulum value at temperature t, and ΔBPN is the temperature correction value, as listed in Table 11.
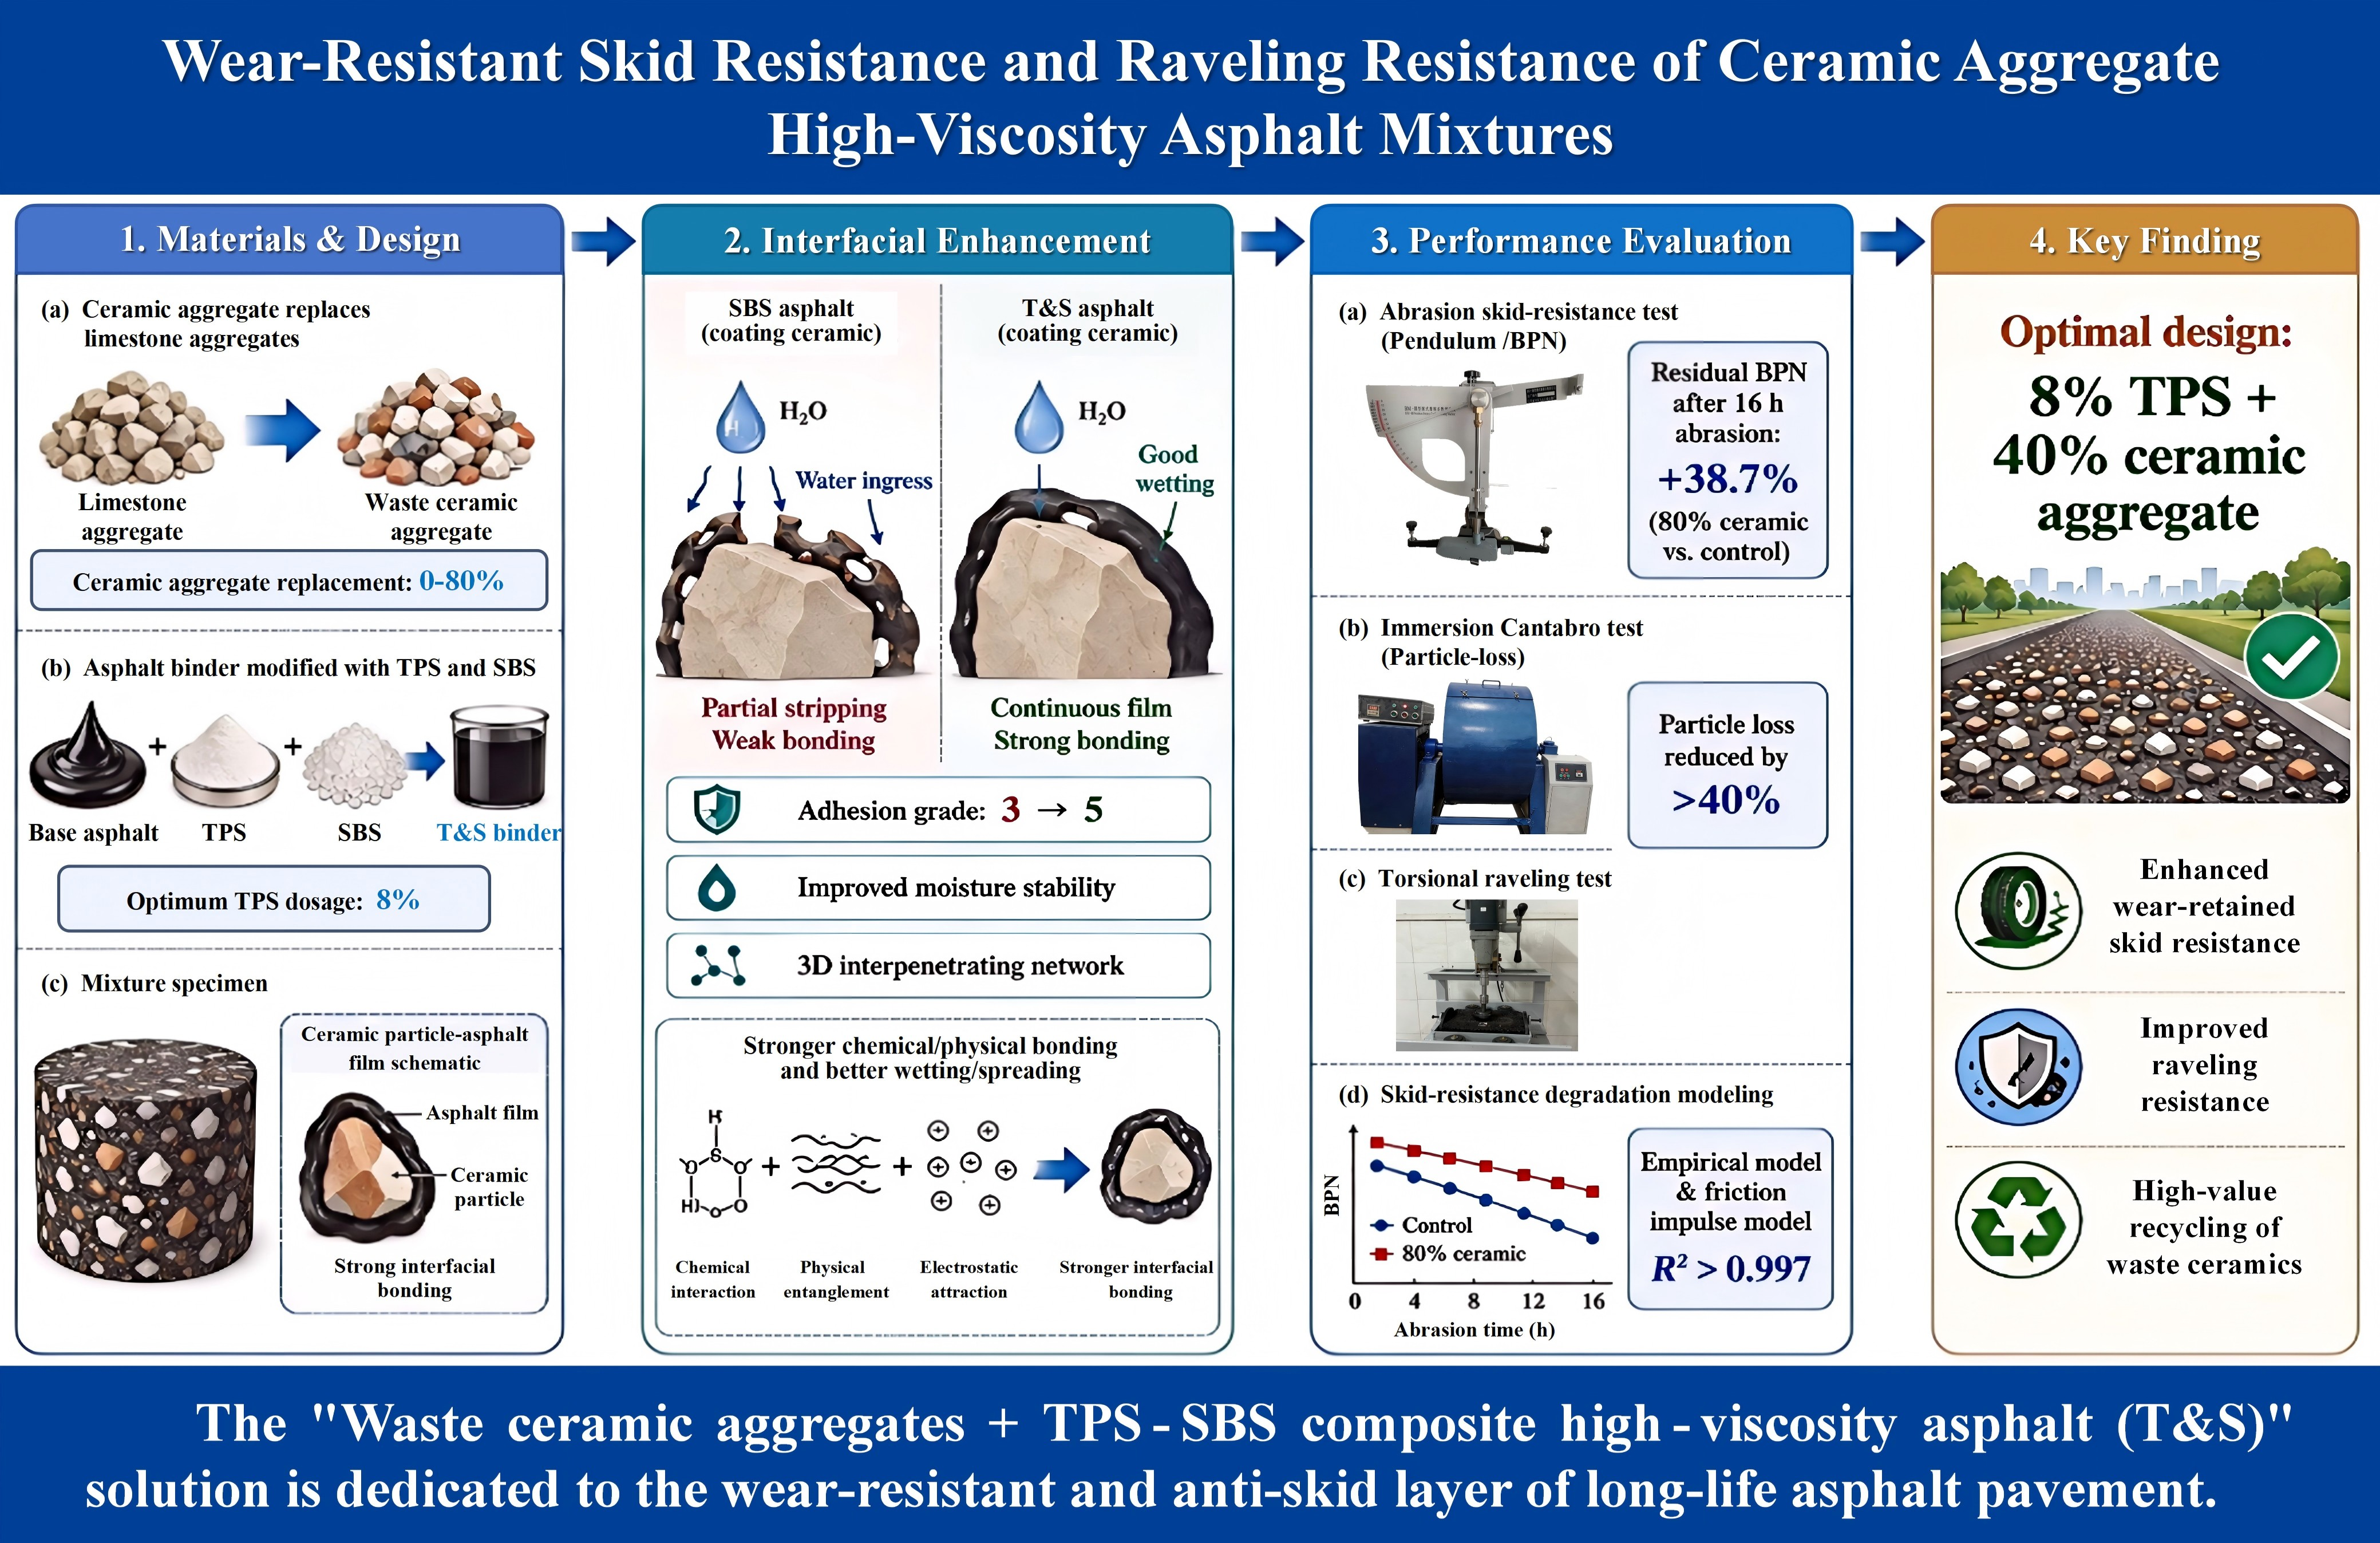
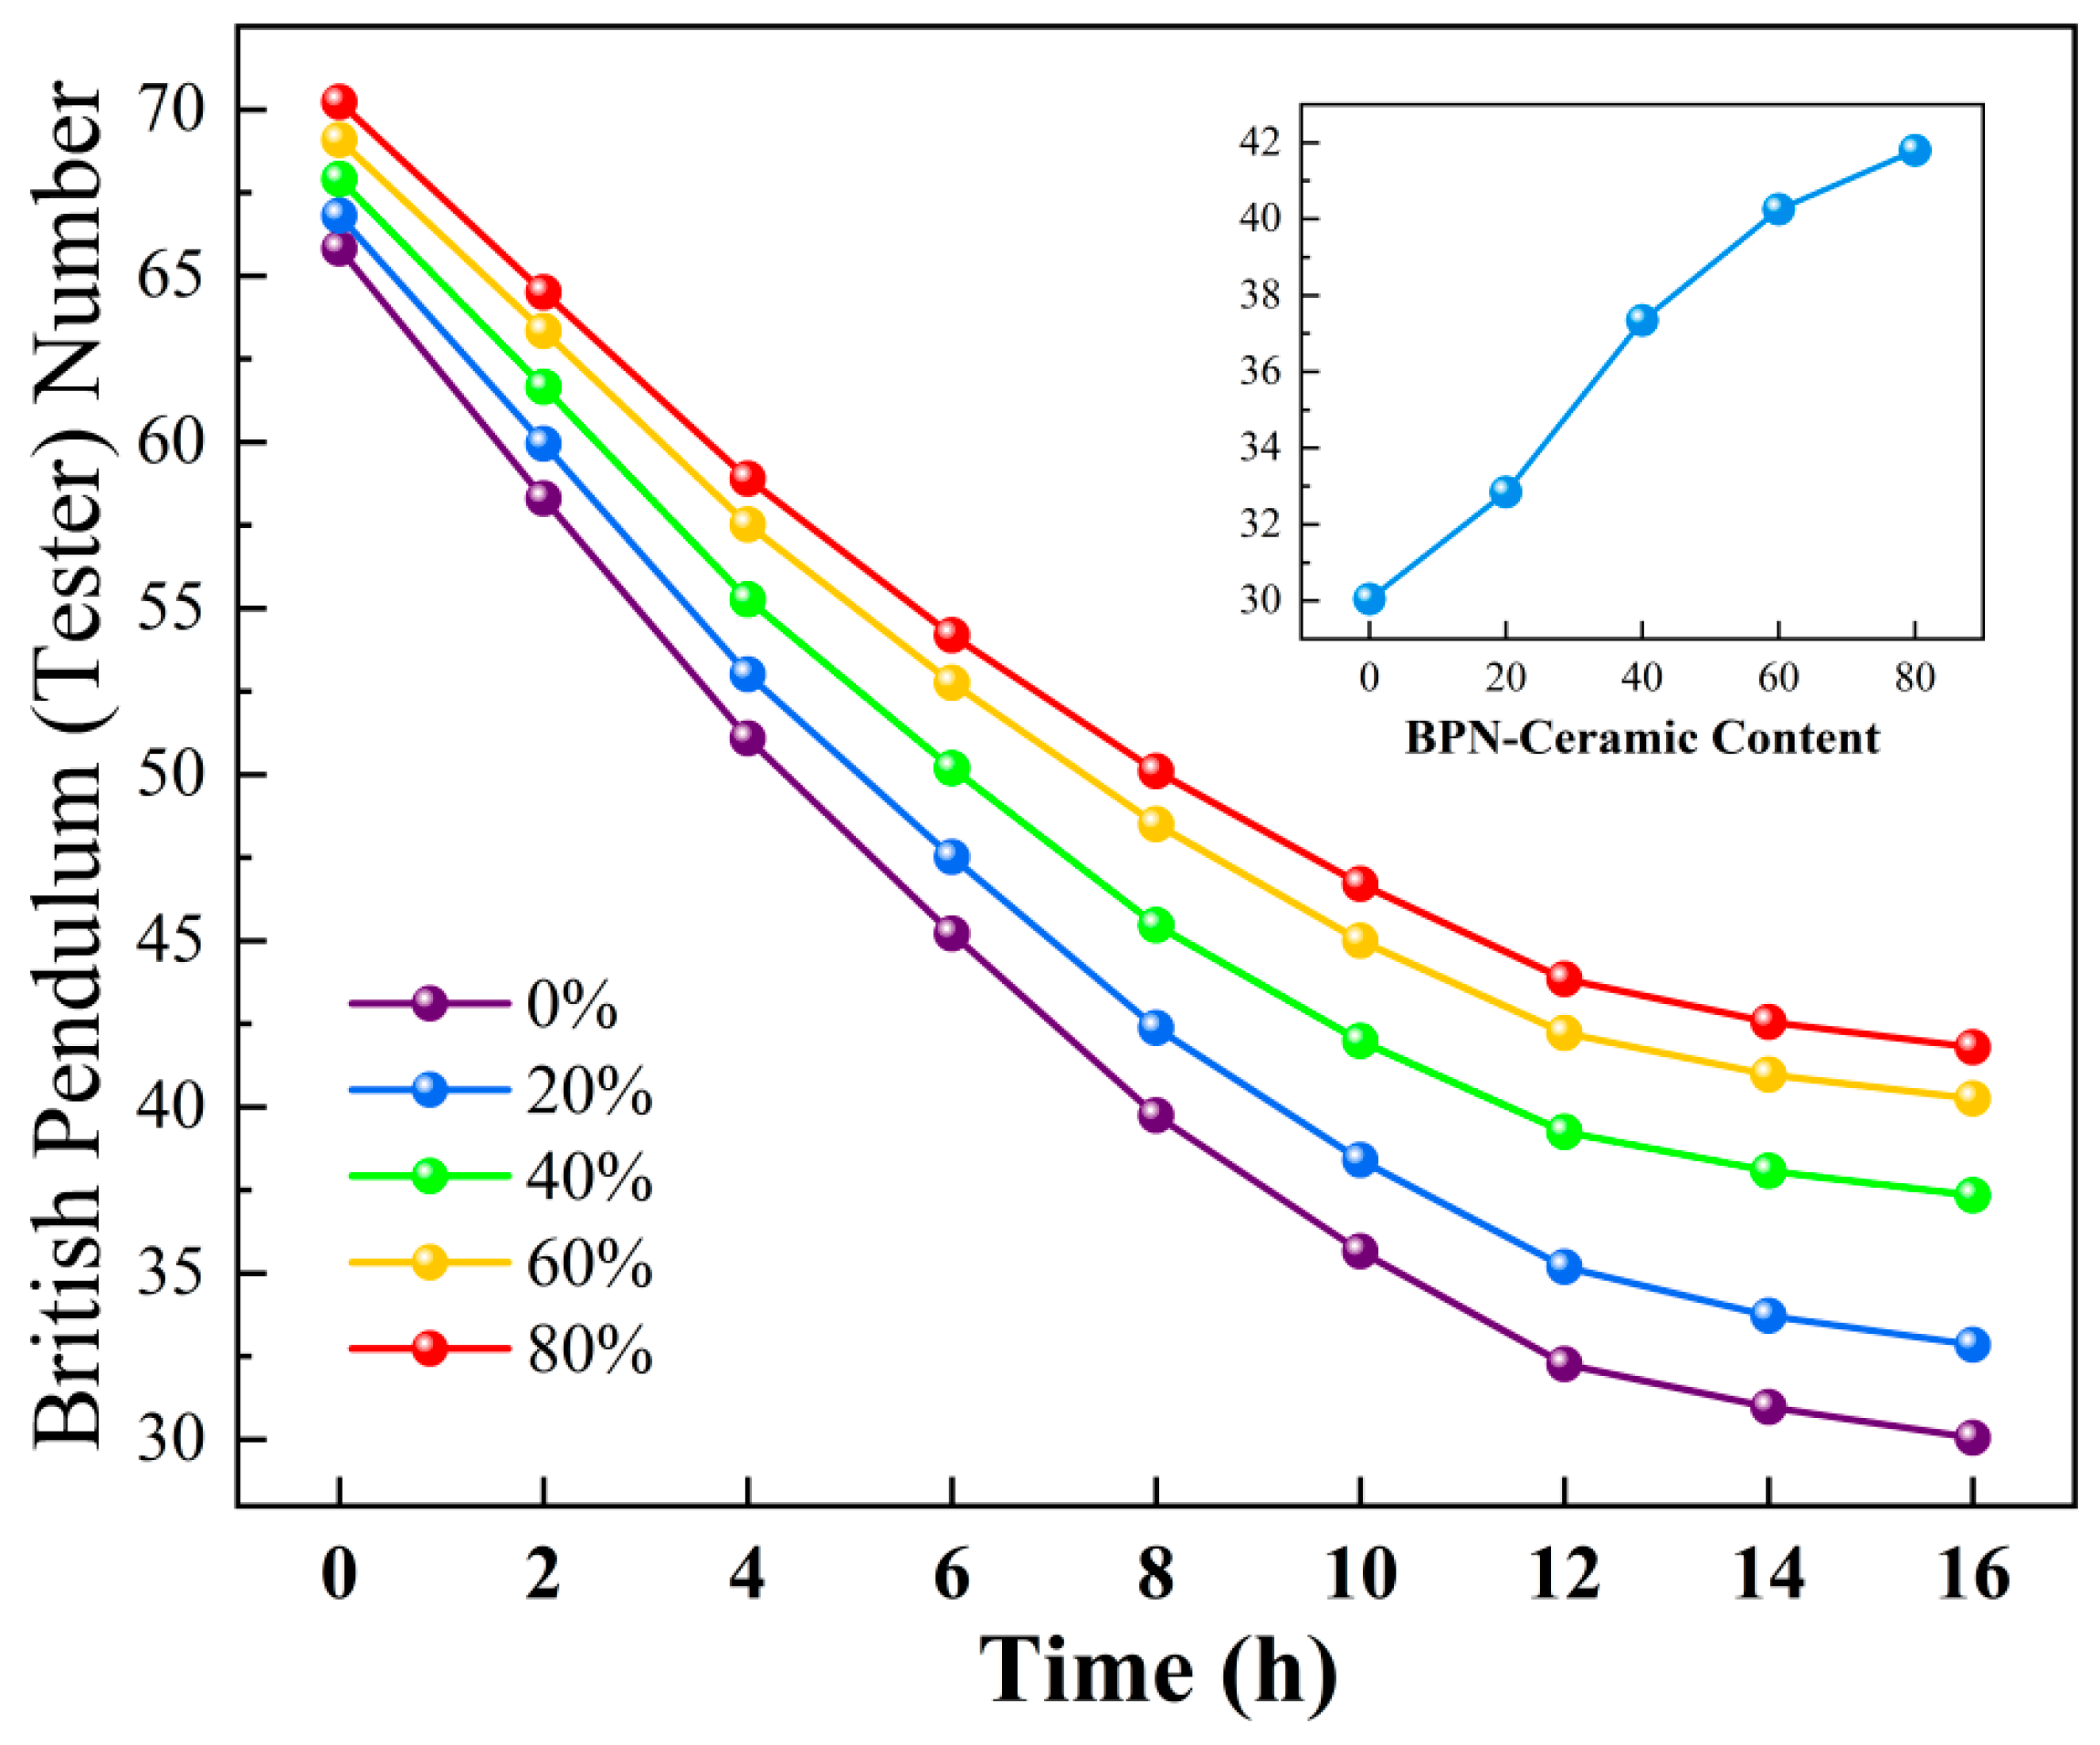
In terms of initial skid resistance, the BPN at 0 h increased steadily with increasing ceramic aggregate content. The control group with 0% ceramic aggregate exhibited a BPN of 65.6, whereas the BPN values of the 20–80% groups ranged from 66.8 to 70.2; the 80% group showed an increase of approximately 7.0% compared with the control group. This improvement can be attributed to the high hardness of ceramic aggregates and the abundant microtexture on their fractured surfaces. Compared with limestone aggregates, ceramic particles provide greater interfacial frictional resistance, thereby directly enhancing the skid-resistant texture of the pavement surface.
During 16 h of continuous abrasion, the BPN values of all groups exhibited nonlinear degradation, characterized by rapid attenuation in the early stage followed by a slower decline in the later stage. The 0–8 h interval corresponded to the rapid abrasion stage of protruding aggregate surface textures, during which BPN decreased rapidly. During 8–16 h, the aggregate surface gradually became smoother, and the attenuation rate correspondingly decreased. Although all groups followed a similar overall trend, substantial differences were observed in attenuation magnitude and final retention rate. After 16 h of abrasion, the BPN of the control group decreased to 30.0, corresponding to a total attenuation of 54.3% and a performance retention rate of only 45.7%, indicating the weakest long-term skid resistance. The final BPN of the 20% group was 32.7, with an attenuation of 51.0%, suggesting that the reinforcing effect at low ceramic aggregate content remained limited. The final BPN of the 40% group increased markedly to 37.1, with the attenuation decreasing to 45.4% and the performance retention rate increasing to 54.6%, indicating a pronounced improvement in skid resistance. The final BPN values of the 60% and 80% groups reached 40.2 and 41.6, respectively, and the attenuation further decreased to 41.5% and 40.7%, indicating the best long-term skid-retention capacity. However, the improvement became noticeably less pronounced beyond the 40% ceramic aggregate content.
The relationship between ceramic aggregate content and BPN after 16 h of abrasion in
Figure 12 shows a clear two-stage growth pattern, from which 40% ceramic aggregate content can be identified as a critical inflection point for improving long-term skid resistance. Within the 0–40% range, the curve exhibited a relatively steep slope, and the final BPN increased by an average of approximately 3.55 units for every 20% increase in ceramic aggregate content, indicating that the skid resistance reinforcement effect of ceramic aggregates was fully mobilized. In the 40–80% range, the slope decreased markedly, and the average increment dropped to 2.25 units, reflecting diminishing marginal benefits. This inflection point can be explained as follows: when the ceramic aggregate content is below 40%, highly wear-resistant ceramic aggregates progressively replace limestone, rapidly improving the overall abrasion resistance of the aggregate system. Once the content exceeds 40%, the mixture has essentially formed a ceramic-dominated skid-resistant skeleton, and the abrasion resistance of the aggregate system approaches the intrinsic upper limit of ceramic aggregates, leaving limited room for further improvement.
The improvement in wear-retained skid resistance provided by ceramic aggregates results from the combined effect of their intrinsic abrasion resistance and the aggregate-coating capacity of T&S high-viscosity asphalt. Ceramic aggregates delay surface texture polishing, whereas the high-viscosity binder helps suppress particle loosening and early detachment, thereby maintaining skid-resistant texture under the present laboratory abrasion conditions. From an engineering applicability perspective, the 20% group provided limited reinforcement, whereas the 60% and 80% groups showed better skid-retention capacity but also clear diminishing marginal benefits and higher material cost. The 40% group achieved a reasonable balance among skid-resistance improvement efficiency, service stability, and economy under the present test conditions. It should be noted, however, that the skid-resistance evaluation was based on a laboratory accelerated abrasion test. The abrasion conditions used in this study, namely a constant load of 0.25 MPa, a rubber abrasion head, dry contact, and a constant temperature of 20 ± 2 °C, differ from actual pavement environments. In field service, tire type and inflation pressure, pavement temperature fluctuations (−30 to 60 °C), rainwater lubrication, deicing salts, and braking or turning actions may all affect the skid-resistance degradation rate. Therefore, the BPN degradation curves in
Figure 12 reflect relative trends under the present laboratory conditions rather than absolute predictions of field performance. The ranking of mixtures with different ceramic aggregate contents (80% > 60% > 40% > 20% > 0%) is informative, but the extrapolation of specific degradation rates to the field should be treated cautiously.
3.2.2. Empirical Model for Skid-Resistance Degradation
The service-stage evolution of asphalt pavement skid resistance generally exhibits nonlinear characteristics, including rapid degradation in the early stage, slower degradation in the middle stage, and stabilization in the later stage. To quantitatively describe the degradation of BPN with abrasion time for ceramic aggregate high-viscosity asphalt mixtures, a three-parameter negative exponential model commonly used in road engineering was fitted to the time-series data obtained from the laboratory accelerated abrasion test [
33]. The model is expressed as follows:
where t is the accelerated abrasion duration, h; BPN(t) is the pendulum value at the corresponding time; At is the long-term stable limit value, corresponding to the residual BPN after the mixture reaches a stable abrasion state; Bt is the total attenuation amplitude, defined as the difference between the initial BPN and At; and ct is the degradation rate constant, h−1, with a larger value indicating faster degradation.Parameter optimization was performed using the Levenberg–Marquardt nonlinear least-squares algorithm [
34], with the constraints A
t > 0, B
t > 0, and c
t > 0. The fitting results are listed in
Table 12. The coefficients of determination, R
2, of the five mixture groups were all no lower than 0.9978, indicating an excellent agreement between the model and the experimental data.
The evolution of the model parameters with ceramic aggregate content quantitatively reveals the mechanism by which ceramic aggregates improve skid-resistance durability from three perspectives. First, the stable limit value At increased monotonically with ceramic aggregate content, from 27.84 at 0% to 39.42 at 80%, directly quantifying the residual skid resistance after long-term service and indicating that ceramic aggregates can effectively raise the safety lower limit of pavement skid resistance. Second, the total attenuation amplitude Bt decreased monotonically with increasing ceramic aggregate content, from 38.10 to 30.96, indicating that higher ceramic aggregate contents reduce the total skid-resistance loss over the full service cycle and improve performance stability. Third, the degradation rate constant ct decreased monotonically from 0.132 h−1 to 0.102 h−1, reflecting the continuous inhibitory effect of ceramic aggregates on the abrasion-induced degradation rate.
Notably, the magnitude of parameter variation also supports the identification of 40% ceramic aggregate content as the threshold for a performance leap. In the 0–40% range, c
t decreased by 12.9%, and A
t increased by 25.2%; whereas in the 40–80% range, the corresponding decrease and increase narrowed to 11.3% and 13.1%, respectively. This diminishing marginal improvement is highly consistent with the experimental analysis in
Section 3.2.1.
3.2.3. Frictional Impulse-Based Characterization Model for Skid-Resistance Degradation
Although the time-based empirical model established in the previous section provides high fitting accuracy for the laboratory data, its parameters depend on the specific abrasion condition, namely constant load, dry contact, constant temperature, and fixed abrasion media. Therefore, the model cannot be directly generalized to different loading and contact conditions. Drawing on the validation logic commonly used in combined experimental and numerical studies of structural reinforcement, this section attempts to construct a skid-resistance degradation characterization model using cumulative frictional impulse I as the basic variable and, more importantly, to define its applicability and predictive boundaries [
35]. The model is intended to describe the present laboratory data and to compare the relative polishing resistance of different mixtures, rather than to provide direct field-life prediction [
36].
According to JTG E60-2008, the standard BPN at 20 °C can be converted to the pavement sliding friction coefficient μ as follows:
In this test, a constant contact pressure of 0.25 MPa was applied, and the effective contact area between the abrasion wheel and the specimen remained fixed; therefore, the normal load F
N was constant. The sliding friction force is determined by the friction coefficient and the normal load:
The friction impulse
I is defined as the time integral of the sliding friction force:
Substituting the empirical skid-resistance degradation model established in
Section 3.2.2 into the integral and solving it yields the analytical relationship between cumulative friction impulse and abrasion duration:
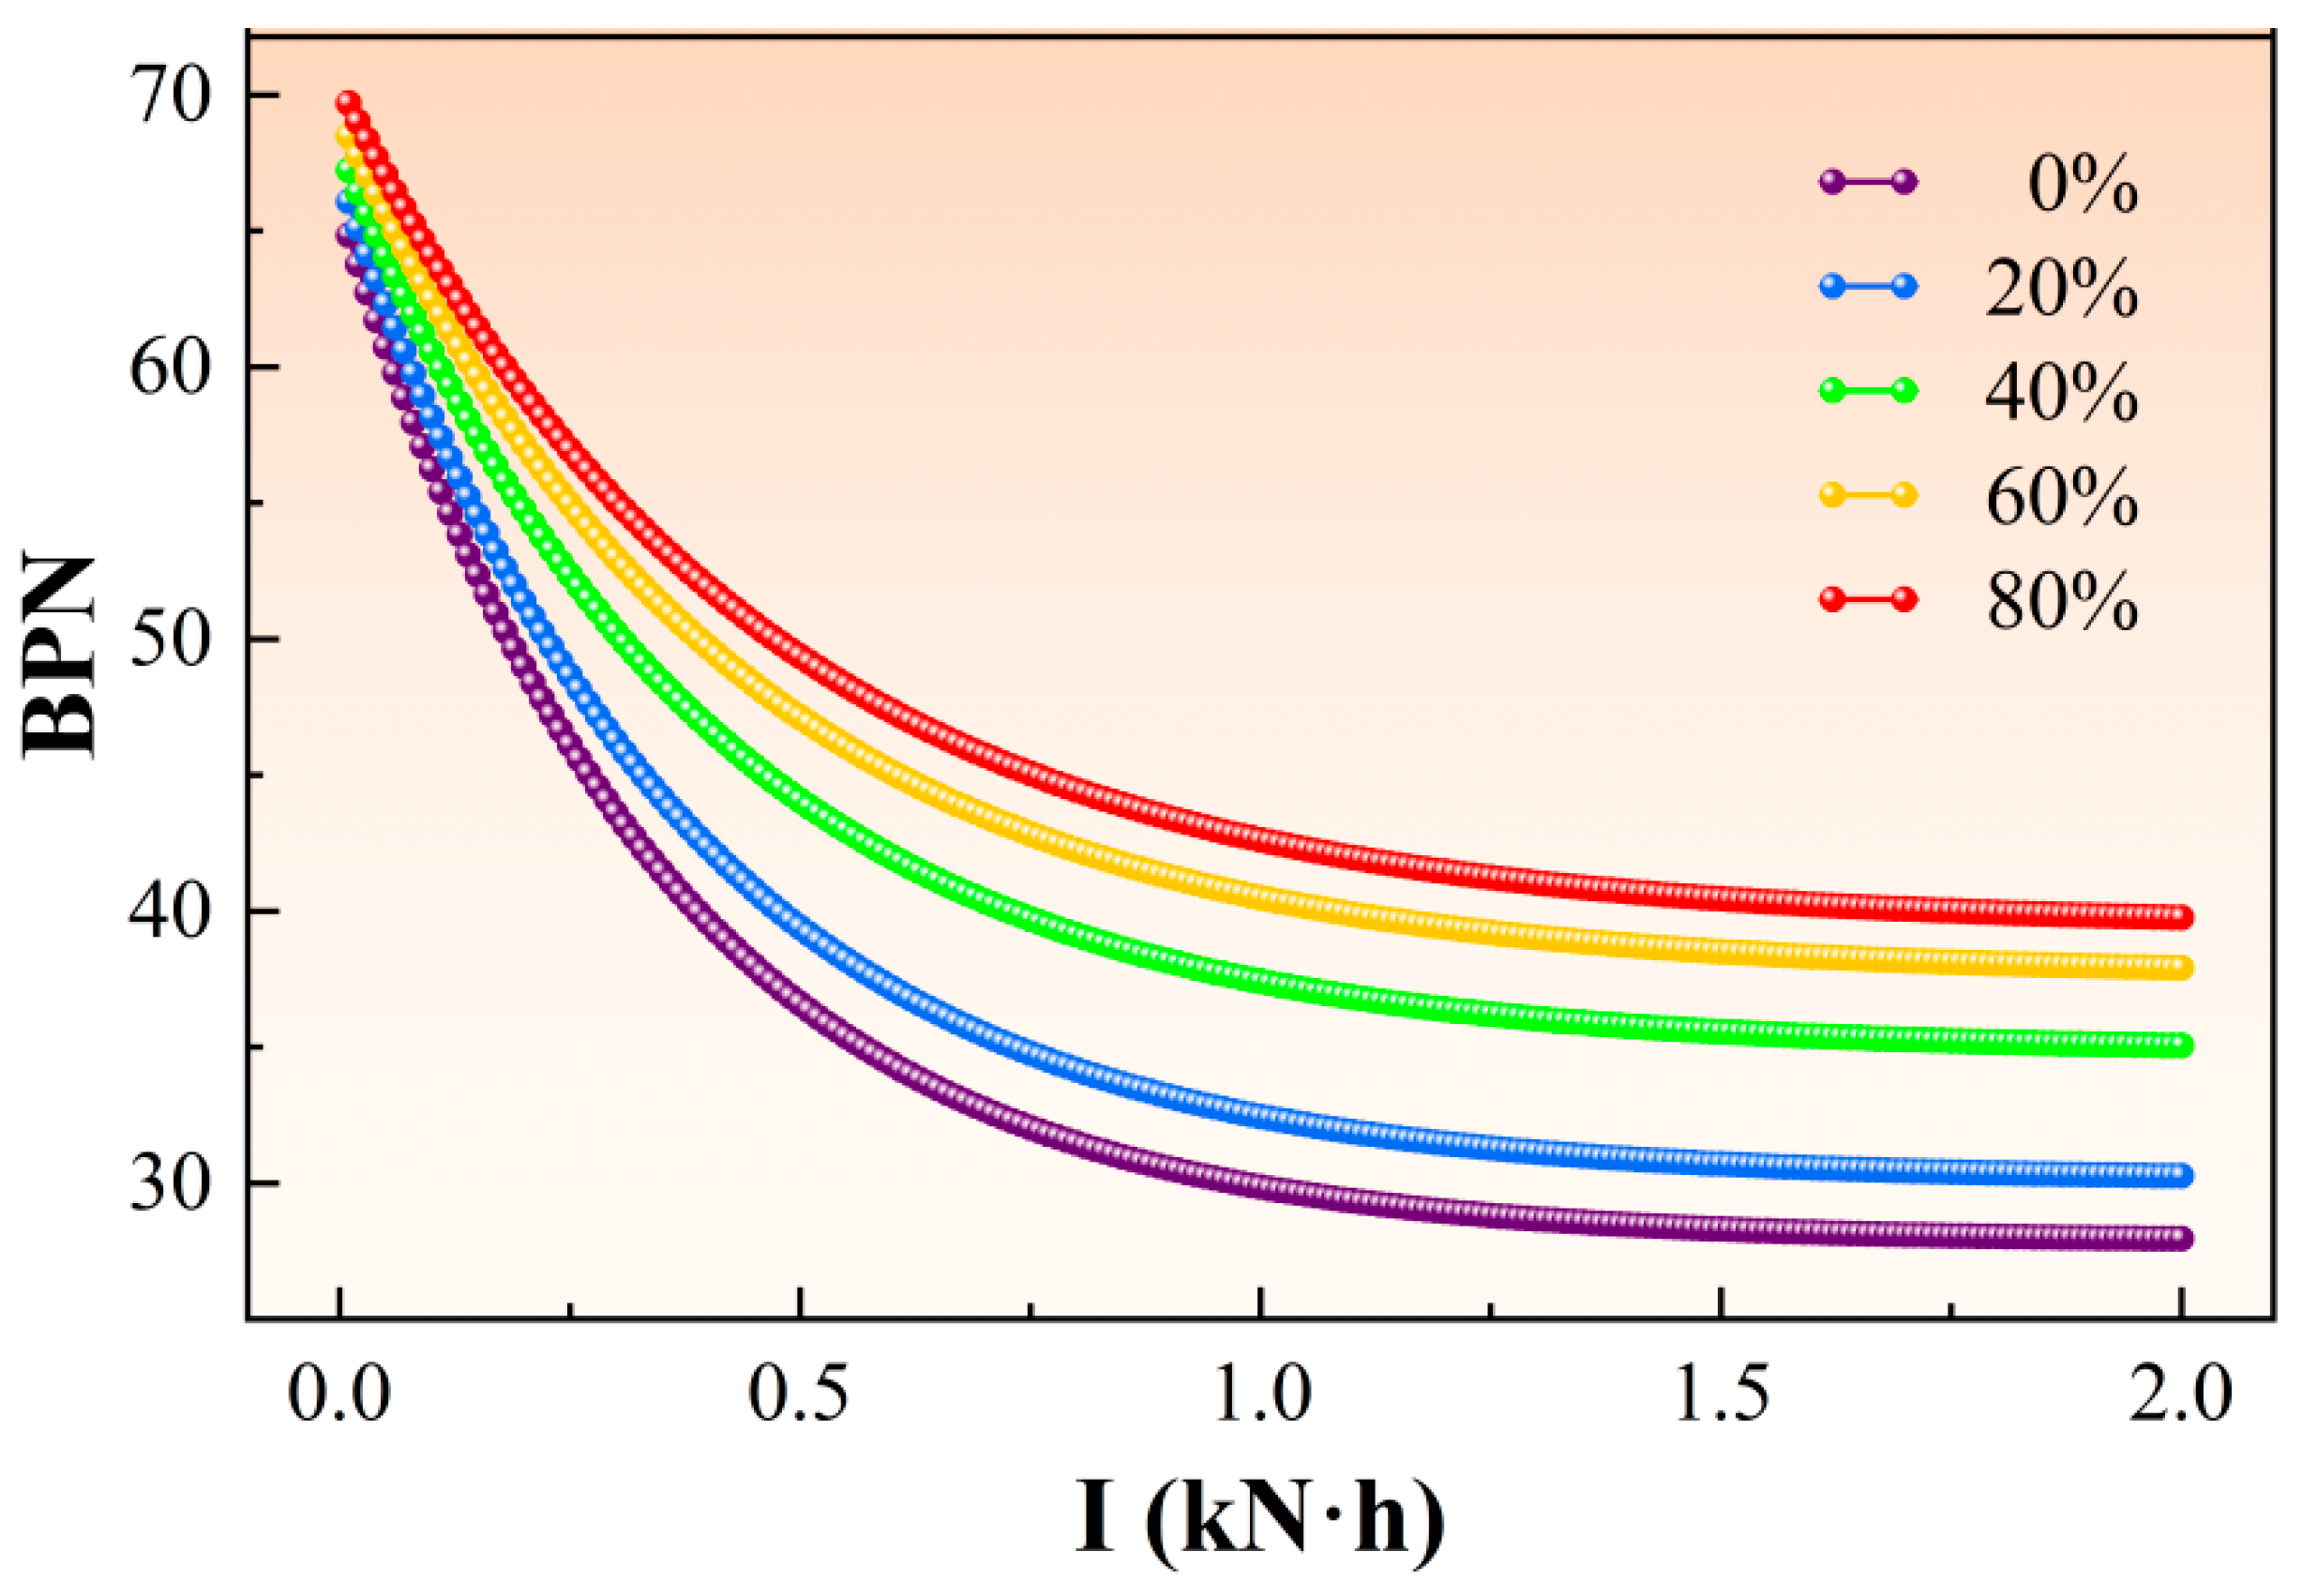
This establishes a quantitative relationship among abrasion time, friction impulse, and skid resistance. Based on this relationship, the cumulative friction impulse and corresponding BPN values of mixtures with different ceramic aggregate contents at different abrasion times were calculated. The results showed that the degradation of BPN with I also followed a three-parameter negative exponential form. Accordingly, a mechanical model with friction impulse as the independent variable was constructed as follows:
where I is the cumulative friction impulse, kN·h; A is the long-term stable limit value; B is the total attenuation amplitude; and C is the characteristic degradation constant, kN·h. A larger C value indicates slower skid-resistance degradation with cumulative friction impulse and stronger polishing resistance of the material.The same algorithm as that used in
Section 3.2.2 was adopted for fitting, with the constraints A > 0, B > 0, and C > 0. The fitting results are shown in
Table 13 and
Figure 13.
The R2 values were all higher than 0.997, indicating high fitting accuracy for the present laboratory data set. The model parameters have clear descriptive meanings under the tested abrasion condition. The stable limit value A increased monotonically with ceramic aggregate content, indicating that ceramic aggregates increased the residual skid-resistance level after laboratory abrasion. The total attenuation amplitude B decreased monotonically, suggesting that skid-resistance loss under the present test condition was suppressed. The characteristic degradation constant C increased from 0.340 kN·h to 0.440 kN·h, providing a quantitative index for comparing the relative polishing resistance of the mixtures.
Furthermore, according to the characteristic constant C, the abrasion process of the mixture can be divided into three characteristic stages, which are fully consistent with the curve shapes in
Figure 13. When I < 3C, the mixture is in the rapid abrasion stage, during which protruding surface textures are quickly worn down and BPN decreases sharply and approximately linearly; this is the core stage of pavement skid-resistance loss. When 3C < I< 6C, the mixture enters the stable abrasion stage, during which the surface gradually becomes smoother, the degradation rate decreases substantially, and the curve tends to flatten. When I > 6C, the ultimate stable stage is reached, BPN approaches A, and skid resistance no longer decreases significantly. From the parameter comparison, the C values of the groups with ceramic aggregate contents of 40% and above were significantly higher than those of the low-content groups. These mixtures could enter the stable abrasion stage earlier and exhibited higher stable limit values A, which is reflected in
Figure 13 by fitted curves that consistently lie above those of the low-content groups, indicating superior residual skid resistance under laboratory constant-load abrasion conditions.
Considering both model parameters and engineering applicability, the 0% and 20% low-content groups degraded rapidly and had low stable limits, making them inadequate for long-life pavements. Although the 80% group exhibited the best polishing resistance, its marginal benefits diminished, material costs increased, and construction workability was also affected. Compared with the 20% group, the 40% group showed an increase of approximately 7.7% in C and 15.7% in A, demonstrating the most prominent efficiency in improving skid resistance. It achieved a rational balance among durability, economy, and construction performance, corroborating the conclusions drawn above. The 60% group is more suitable for pavement sections with special skid-resistance requirements and lower cost sensitivity, such as heavy-duty traffic sections and long, steep grades.
It should be noted that the high goodness of fit of the above model partly results from the inherent self-consistency of the data association, because it was converted from BPN. To preliminarily examine the applicability of the model under variable loading conditions, additional accelerated abrasion tests were conducted on the T&S mixture with 40% ceramic aggregate content, which exhibited favorable overall performance in this study, under two additional normal loads of 0.15 MPa and 0.35 MPa. Together with the reference load of 0.25 MPa, three loading conditions were considered. Continuous abrasion was performed for 16 h under each loading condition, BPN was recorded every 2 h, and two parallel specimens were tested for each condition.
Two approaches were adopted for model validation. The first was parameter stability verification: if model parameter C has physical significance in reflecting the intrinsic polishing resistance of the material, it should remain relatively stable under different load levels. Increasing the load accelerates BPN degradation, but the intrinsic resistance of the material to polishing should not change fundamentally with load. The second approach was cross-prediction validation: the fitting parameters (A0, B0, C0) obtained under the 0.25 MPa reference load were used to predict the BPN degradation curves under the 0.15 MPa and 0.35 MPa loads, and the coefficient of determination R2 between predicted and measured values was calculated to quantitatively evaluate cross-load prediction accuracy.
As shown in
Table 14, the coefficient of variation of parameter C under the three load levels was 3.5%, indicating good parameter stability within this load range. Under the 0.15 MPa and 0.35 MPa loads, the cross-prediction R
2 values reached 0.985 and 0.978, respectively, showing good agreement between predicted and measured values. These results suggest that the frictional impulse-based skid-resistance degradation characterization model has a certain degree of cross-load applicability within the normal-load range of 0.15–0.35 MPa, and that parameter C can be used as a relative index of polishing resistance within this range. However, this verification was conducted using the same apparatus under adjacent load levels and should not be interpreted as independent field validation.
It should be emphasized that the above model has clear boundaries. First, the model can describe the BPN decay with cumulative frictional impulse under the specified laboratory conditions: 0.25 MPa, dry contact, 20 ± 2 °C, and a rubber abrasion head. Parameter C can be used to quantify relative polishing resistance, with a larger C corresponding to a slower decay rate; in this study, C increased from 0.340 to 0.440 kN·h as ceramic aggregate content increased from 0% to 80%. Second, the model cannot directly predict the field skid-resistance degradation rate or pavement service life, because it does not account for temperature fluctuations, moisture, tire type, braking, turning, acceleration, freeze–thaw cycling, or wet abrasion. It also cannot replace full-scale accelerated loading tests or long-term field monitoring. Third, the load dependence of parameter C was only preliminarily examined under 0.15, 0.25, and 0.35 MPa. Although the coefficient of variation of C was 3.5% and the cross-prediction R2 values were not lower than 0.978, this validation was limited to different load conditions within the same device and was not calibrated against field data. Therefore, uncertainty will increase substantially when the model is applied beyond this load range or to wet, freeze–thaw, or temperature-varying conditions.
The main value of the frictional impulse-based skid-resistance degradation characterization model is therefore threefold: (i) it provides a unified quantitative framework for describing skid-resistance decay of mixtures with different ceramic aggregate contents under laboratory constant-load abrasion; (ii) it enables relative ranking of material polishing resistance through parameter C; and (iii) it provides a quantitative basis for mix-design optimization under the present test conditions. Its broader cross-condition applicability should be further verified through full-scale accelerated loading tests and long-term field data.