Article

Drone-Based Quantitative Infrared Thermography (UAV-QIRT) for In Situ U-Value Estimation: A Critical Comparison of Numerical Models for Building Façades


1
Department of Architecture and Urban Studies (DAStU), Politecnico di Milano, 20133 Milan, Italy
2
Department of Civil Engineering and Architecture (DICAr), University of Pavia, 27100 Pavia, Italy
*
Author to whom correspondence should be addressed.
Buildings 2026, 16(13), 2567; https://doi.org/10.3390/buildings16132567
Submission received: 22 May 2026 / Revised: 16 June 2026 / Accepted: 24 June 2026 / Published: 27 June 2026
(This article belongs to the Topic Revitalizing Buildings and Our Urban Heritage)

Abstract

Buildings account for a substantial share of global energy consumption and greenhouse gas emissions, while a large proportion of the existing building stock remains energy inefficient. Thermal transmittance is a fundamental indicator for assessing the thermal performance of historic building envelopes. This study investigates the application of UAV-based quantitative infrared thermography (UAV-QIRT) for in situ U-value measurement as an alternative to conventional methods. This study proposes a structured workflow for UAV-QIRT-based U-value measurement, developed in accordance with BS EN ISO 6781-1:2023. The study evaluates four U-value calculation formulas using thermographic data acquired during an in situ case study and compares the resulting estimates with a reference U-value obtained using the heat flow meter (HFM) method. The results demonstrate that the reliability of UAV-QIRT-based U-value estimation strongly depends on outdoor thermal boundary conditions and the physical assumptions embedded within the heat balance model. In this case, the measured exterior wall surface temperature was lower than the outdoor air temperature, causing simplified formulas to produce physically unrealistic negative U-values. In contrast, the complete heat balance model, which accounts for radiative exchanges with the sky, surroundings, and ground, as well as convective heat transfer, generated more plausible estimates. Nevertheless, significant discrepancies were observed between the UAV-QIRT and HFM estimates. Sensitivity analysis revealed a high dependence of UAV-QIRT-derived U-values on environmental boundary conditions, including wind speed, outdoor air temperature, and exterior surface temperature.

1. Introduction

Buildings account for approximately 36% of global greenhouse gas emissions and consume more than 40% of total energy [1]. A substantial share of the existing building stock is aging, with approximately 35% of buildings over 50 years old and nearly 75% remaining energy inefficient [2]. Such buildings often exhibit poor thermal performance due to inadequate insulation and outdated technical systems [3,4]. However, these structures also offer significant potential for energy improvement through carefully designed and targeted retrofitting strategies [5]. The thermophysical properties of building components are key parameters for evaluating building performance, as they directly affect thermal behavior and energy efficiency. Among these properties, thermal transmittance (U-value, W/m2K) is a fundamental indicator for assessing the thermal performance of historic building envelopes [6]. Standardized approaches are commonly used to determine U-values. The design U-value can be calculated in accordance with ISO 6946 [7], while in situ measurements can be conducted using a heat flux meter (HFM) following ISO 9869 [8]. However, the HFM method is often costly and time-consuming, particularly in historic buildings where thermal bridges, surface shielding, and spatial variations in boundary conditions introduce additional complexity [9,10]. Furthermore, the HFM method provides measurements over a limited surface area, which restricts its ability to capture the thermal heterogeneity of large or architecturally complex building envelopes [11,12].
Non-destructive testing (NDT) techniques play a critical role in historic building diagnosis because they enable rapid, comprehensive, and non-invasive assessments of building performance [13]. Among these techniques, infrared thermography (IRT) is widely applied in building energy audits [14]. Conventional IRT is primarily used as a qualitative method (qIRT) to visually identify building defects, such as thermal bridges, insufficient insulation, and air leakage. In contrast, quantitative IRT (QIRT) employs calibrated temperature measurements to assess thermal anomalies and estimate U-value [15,16]. Over the past two decades, QIRT has received increasing attention as an alternative to the HFM method for U-value assessment [17]. Recent advancements in QIRT have been driven by the integration of unmanned aerial vehicles (UAVs) [18,19]. UAV-assisted infrared thermography (UAV-IRT) has become an effective tool for the inspection and analysis of existing building stock [20]. Unlike conventional ground-based thermography, UAV-IRT can access hard-to-reach areas and high-rise structures without physical constraints [21]. This capability improves inspection coverage, enhances data quality, and reduces operational costs and safety risks [22]. UAV-IRT can be categorized into qualitative (UAV-qIRT) and quantitative (UAV-QIRT) approaches [23]. While UAV-qIRT supports the rapid detection of thermal anomalies [24,25], UAV-QIRT enables U-value estimation, overcoming the accessibility and spatial limitations [26].
In recent years, UAV-QIRT has gained increasing attention for the in-situ measurement of U-values in building envelopes. Bayomi et al. used aerial thermography to estimate envelope U-values and to calibrate building energy models (BEM) [27]. Their results showed deviations of 21–97% from design U-values depending on façade orientation; however, the estimated U-values were not validated against HFM measurements. Benz et al. reported UAV-QIRT-derived U-values ranging from 1.0 to 1.6 W/(m2K), whereas the reference HFM measurement yielded a U-value of 2.0 W/(m2K), corresponding to an underestimation of approximately 20–50% [21]. However, the authors did not provide a detailed explanation for these discrepancies. Zhang et al. performed in situ measurements of external walls using UAV-QIRT and compared the results with HFM calculations, reporting errors ranging from 5.8% to 23.3% [28]. The results revealed substantial variations in deviation between the two buildings despite the application of an identical measurement protocol, highlighting the influence of building-specific conditions. The authors attributed these discrepancies to environmental interference from surrounding surfaces, temporal mismatches between thermographic and HFM measurements, and systematic errors associated with UAV operation and temperature measurements. Similarly, Videras-Rodríguez et al. assessed the accuracy of UAV-QIRT under summer and winter conditions and found that measurements conducted during winter nights were more reliable [29]. QIRT-derived U-values showed close agreement with those obtained using the thermometric method during winter nights and early mornings, with deviations as low as 4.3%. However, daytime measurements exhibited substantially larger errors (25.0–29.1%), primarily due to rapid temperature fluctuations. Collectively, these studies highlight the considerable uncertainty associated with UAV-QIRT-derived U-values, which are strongly influenced by environmental conditions, measurement timing, and building-specific characteristics. Substantial deviations from reference measurements may occur even under apparently favorable conditions. Although previous studies have proposed several U-value calculation formulas, their applicability under real outdoor boundary conditions has not been systematically validated. This limitation is particularly evident in situations where the exterior wall surface temperature ( T s , out ) is lower than the outdoor air temperature ( T o u t ). Under these conditions, the physical validity of simplified heat-balance formulations remains uncertain.
To address these research gaps, this study proposes a UAV-QIRT workflow for the external in situ measurement of the U-value of existing building envelopes based on the BS EN ISO 6781-1:2023 standard. The study evaluates four different U-value calculations using thermographic data acquired from in situ measurements. The analysis specifically investigates the influence of outdoor radiative–convective boundary conditions on U-value estimation, particularly when T s , out is lower than T o u t , where simplified heat-balance formulations may become unreliable. The most physically consistent formulation is subsequently compared with HFM reference value to assess the deviation between UAV-QIRT-based estimation and standardized in situ measurement The study further performs a sensitivity analysis to investigate the influence of wind speed ( v ), T o u t , and T s , out on the calculated U-values.

2. Materials and Methods

2.1. U-Value Calculation

The U-value represents the heat transfer coefficient through a building envelope per unit area due to the indoor-outdoor (ΔT). Under one-dimensional (1D) steady-state conditions, assuming negligible heat storage within the wall and constant thermo-physical properties, the U-value is calculated as the ratio between the heat flux ( q ) and the difference between the indoor air temperature ( T in ) and T out :
U - value   = q   T i n T o u t  
Equation (1) implicitly assumes stationary thermal conditions, negligible lateral heat transfer, and equivalence between the conductive heat flux through the wall and the heat exchanged at the surface. Under this formulation, the system is treated as 1D steady-state heat transfer problem, where the external boundary condition is fully determined by instantaneous energy balance. According to that, the formulations developed in the literature aimed at quantifying the U-value of building façades using QIRT, generally, are based on a simplified representation of the external heat transfer process, assuming steady-state conditions, 1D heat conduction through the envelope, and a direct equivalence between conductive heat flux and surface heat exchange. However, in real buildings, especially historic constructions, these assumptions are rarely fully satisfied. Thermal inertia, material heterogeneity, moisture content, thermal bridges, and transient environmental forcing introduce significant deviations from ideal steady-state behavior. The first formulation aimed at quantifying the U-value of building façades using QIRT was proposed by Madding through a surface heat balance formulation for indoor measurement [17]. This method estimates conductive heat transfer through the wall by balancing radiative and convective heat exchange occurring at the internal surface under steady-state conditions. The underlying assumption is that, in the absence of heat storage within the wall, the conductive heat flux crossing the envelope is equal to the sum of the radiative and convective heat fluxes exchanged between the internal wall surface and the surrounding indoor environment. On this basis, the U-value is expressed as:
U = 4 ε σ   T m 3   T s , i n T refl   +   h c   T s , i n T i n T i n T o u t
Equation (2) considers T in and T out , the internal wall surface temperature ( T s , i n ), the apparent reflected temperature ( T r e f l ), the mean radiative temperature ( T m ), the wall surface emissivity ( ε ), the convection coefficient ( h c ), and the Stefan–Boltzmann constant ( σ = 5.67 × 10⁻⁸ W/m2K4). Tm is defined as:
T m = T s , i n + T refl   2
Equation (2) derives from the surface heat balance at the internal side of the wall. More specifically, the conductive heat flux through the wall is assumed to be equal to the sum of the radiative heat flux ( q r ) and the convective heat flux ( q c o n v ) exchanged at the internal surface. The numerator represents the total surface heat exchange, composed of radiative and convective contributions:
q = q r + q c o n v
The radiative term derives from the linearized Stefan–Boltzmann law:
q r = 4 ε σ T m 3   ( T s , i n T r e f l )
while the convective term follows Newton’s law of cooling:
q c o n v = h c   ( T s , i n T i n )
The denominator corresponds to the temperature difference between T in and T out . The model assumes steady-state heat transfer and 1D conduction through the wall, negligible heat storage, and a constant h c . Also, it assumes an indoor view factor equal to unity, meaning that surrounding indoor surfaces have similar temperatures. These assumptions are valid for indoor measurements but become inappropriate for transient outdoor measurements, where convection strongly depends on air velocity, and the effective radiative temperature of the sky ( T s k y ) can be substantially lower than surrounding objects, producing strong radiative cooling effects that cannot be neglected:
q s k y = ε σ ( T s , i n 4 T s k y 4 )
Under clear-sky conditions, the effective T s k y may be substantially lower than the T o u t , making radiative losses toward the sky non-negligible.
To address the limitations associated with external measurements, Dall’O’ et al. estimated the U-value of a wall in outdoor measurement using QIRT with a different heat balance approach [30]. Based on Newton’s law of cooling, they expressed q c o n v as a function of the h c and the temperature difference between the outdoor wall surface ( T s , out ) and T out :
q c o n v = h c   T s , out   T out  
By combining this relationship with Equation (1), they derived:
U = h o u t T s , o u t T o u t T i n T o u t
The outdoor convective coefficient ( h o u t ) is calculated as a function of v . Jurges’ equation for the expression of the convective coefficient is used demonstrating its best manageability with a v :
h out   = 5.8 + 3.8054   v
The model assumes that h o u t is entirely balanced by convection. Consequently, radiative exchanges with the sky and the surrounding environment are neglected. This assumption may introduce errors during clear-sky conditions, nighttime measurements, or low-wind scenarios, where long-wave radiative cooling becomes dominant. Moreover, the use of empirical correlations is valid within specific v ranges.
Albatici et al. further improved the equation by incorporating long-wave radiative exchange into the external heat balance [31]:
U = ε ν   σ   T s , o u t 4 T out   4   +   3.8054 ν   T s , o u t T out   T i n T o u t
where the wall spectral emissivity ( ε v ) refers to the spectral range of the IR camera. In the numerator, the first term accounts for radiative heat exchange with the outdoor environment, while the second term represents convective heat transfer based on the simplified Jürges correlation. The formulation is established under the following assumptions. The outdoor environment is represented by a single equivalent T o u t , the wall surface is assumed to behave as a diffuse-gray body with uniform emissivity, and the thermal exchange process is considered under steady-state conditions. In addition, the model assumes 1D heat transfer through the wall, as well as negligible atmospheric attenuation, reflected short-wave solar radiation, and transient heat storage within the envelope.
Bayomi et al. proposed Equation (12), which incorporates UAV-QIRT for calculating outdoor U-values [27]:
U = ε σ   T r e f l T s ,   in   +   h c   T i n T s ,   in   T s ,   in   T s ,   out  
which also considers the T s , in , T s , out , and a h c set at 8.7 W/m2K. This formulation differs from previous approaches because it relates the internal surface heat balance to the temperature difference between the internal and external wall surfaces, rather than to the indoor-outdoor air temperature difference. The model is based on the assumptions of 1D steady-state conductive heat transfer through the wall, negligible thermal resistance between air and surface layers, constant thermo-physical properties, and a uniform convective heat transfer coefficient.
Zhang et al. also incorporated UAV-QIRT for assessing the U-value [28]. They decomposed the radiative heat transfer ( q r ) from the wall surface to the outdoor environment into three parts: outdoor air ( q a i r ), ground ( q g r o u n d ), and sky ( q s k y ) [32]. They then integrated the radiative heat transfer coefficient of each medium together with the convective heat transfer ( q c o n v ) as follows:
U = h c   T s , o u t T o u t + h r , s k y T s , o u t T s k y + h r , a i r T s , o u t T o u t + h r , g r o u n d T s , o u t T ground   T i n T o u t
q r = q sky   + q air   + q ground  
q r = h r , s k y T s , o u t T s k y + h r , a i r T s , o u t T o u t + h r , g r o u n d T s , o u t T ground  
where h r , s k y , h r , a i r , and h r , g r o u n d represent the radiative heat transfer coefficients for the sky, outdoor air, and ground, respectively [33]. T s k y is calculated as a function of the T out and the sky emissivity ( ε s k y ). T dewp is the dew point temperature (K).
h r , i = σ ε F i   T s , o u t 4 T i 4 T s , o u t T i
T s k y = T o u t ε s k y 0.25 K
ε s k y = 0.787 + 0.0028 T d e w p
F sky , F ground , F air , and F air are the radiative angle factors for the building exterior surface with respect to the ground, sky, and outdoor air, respectively. θ is the angle between the building envelope and the horizontal plane, expressed in degrees (°).
F s k y = 0.5 ( 1 + c o s θ ) c o s θ 2
F a i r = 0.5 ( 1 + c o s θ ) 1 c o s θ 2
F g r o u n d = 0.5 ( 1 c o s θ )
h c is calculated using the Jürges’ equation. This formulation separates the different radiative sinks affecting the façade and incorporates geometric view factors. The model considers the assumptions of steady-state thermal conditions, accurate estimation of ε and T r e f l , negligible atmospheric attenuation effects, and reliable surface temperature acquisition independent of UAV viewing geometry. Furthermore, the radiative angle factors are assumed to adequately represent façade geometry and surrounding environmental obstructions, while the h c is assumed to be correctly described through empirical wind-based correlations.

2.2. Workflow of UAV-QIRT

The proposed UAV-QIRT workflow is structured into five phases:
The schematic workflow is reported below (Figure 1).

2.2.1. Preparation

During the preparation phase, a series of preliminary steps is conducted to ensure the validity and reliability of UAV-based thermal measurements. First, a detailed documentation process is conducted for the investigated buildings. This process includes the identification of building typologies, construction materials, and geographical locations. The orientation of wall surfaces (north, south, east, and west) is systematically recorded, as it directly influences thermal behavior and solar exposure. Second, controlled environmental conditions are established to ensure the reliability and accuracy of UAV-based thermal measurements. The indoor–outdoor temperature difference (ΔT) must exceed 10 °C and preferably 15 °C, with winter conditions generally providing more stable thermal gradients. T i n fluctuations must remain below 2 °C to maintain steady boundary conditions. Measurements are conducted under cloudy weather conditions, while direct solar radiation and precipitation are avoided. v at both ground level and façade height must remain below 5 m/s, with near-zero wind conditions preferred to reduce convective heat transfer effects. In addition, wall surfaces must be dry, with no rainfall occurring within 72 h prior to measurement. The surroundings must be free of obstruction, and sufficient space must be ensured to allow safe UAV operation. Potential signal interference near the target building is also evaluated to guarantee stable data transmission. Third, the key parameters of the measurement design are defined prior to data acquisition. These parameters include T out , relative humidity ( R H ), ε , sensor-to-target distance ( d ), T r e f l , and reference contact surface temperature ( T s , cont ). Fourth, appropriate instrumentation is selected to support the measurement process. A UAV equipped with an infrared thermal camera is employed, together with instruments including a temperature and humidity data logger, a laser rangefinder, and thermocouples. A preliminary survey using ground-based IRT is conducted to identify thermally homogeneous areas on the wall surface for reliable measurement. Fifth, the UAV flight path is designed according to the distribution of measurement targets within or across buildings. A structured acquisition strategy, such as a strip-based pattern, is adopted to ensure systematic coverage and sufficient image overlap. The UAV flight speed remains below 2 m/s, and image acquisition is performed under stable hovering conditions. The distance between the UAV and the target is maintained within 15 m to ensure adequate spatial resolution and measurement accuracy. Overall, standardized environmental control, parameter definition, and acquisition planning collectively ensure the accuracy and reliability of the surface temperature data obtained through UAV-based IRT.

2.2.2. Instrument Installation and Calibration

After the completion of the preparation phase, instrument setup and calibration are carried out to ensure measurement accuracy and compatibility with the environmental conditions. First, the target measurement area is defined on the external vertical surface of the masonry wall. Thermocouples are installed on the building envelope to record the T s , cont , which serves as a reference for validating UAV-based thermal measurements. Environmental sensors are mounted on a photographic tripod to reduce the influence of ground surfaces, vegetation, and nearby structures on the measurements of T out and R H . Subsequently, dataloggers are allowed to stabilize for at least 15 min to adapt to the ambient environment. Data acquisition proceeds only after T out , R H , and T s , cont reach stable conditions. The UAV is then positioned within the measurement area, and the onboard thermal camera is activated and allowed to stabilize for an additional 15 min prior to data collection. Finally, the stability and consistency of all sensors are verified. The measurement process proceeds only if the readings from both environmental and contact sensors remain stable over a continuous period of at least 5 min. Otherwise, the measurement procedure is suspended to avoid unreliable data acquisition. This calibration process ensures the consistency and reliability of the thermal data collected in subsequent stages.

2.2.3. Data Acquisition

The proposed acquisition process is based on the BS EN ISO 6781-1:2023 standard [34], which outlines procedures for recording thermal data using terrestrial and traditional infrared instruments and is adapted for UAV infrared sensors. This standard specifies the environmental parameters to monitor and provides two methodologies for calculating T r e f l of the analyzed surfaces, which is useful for processing individual thermograms.
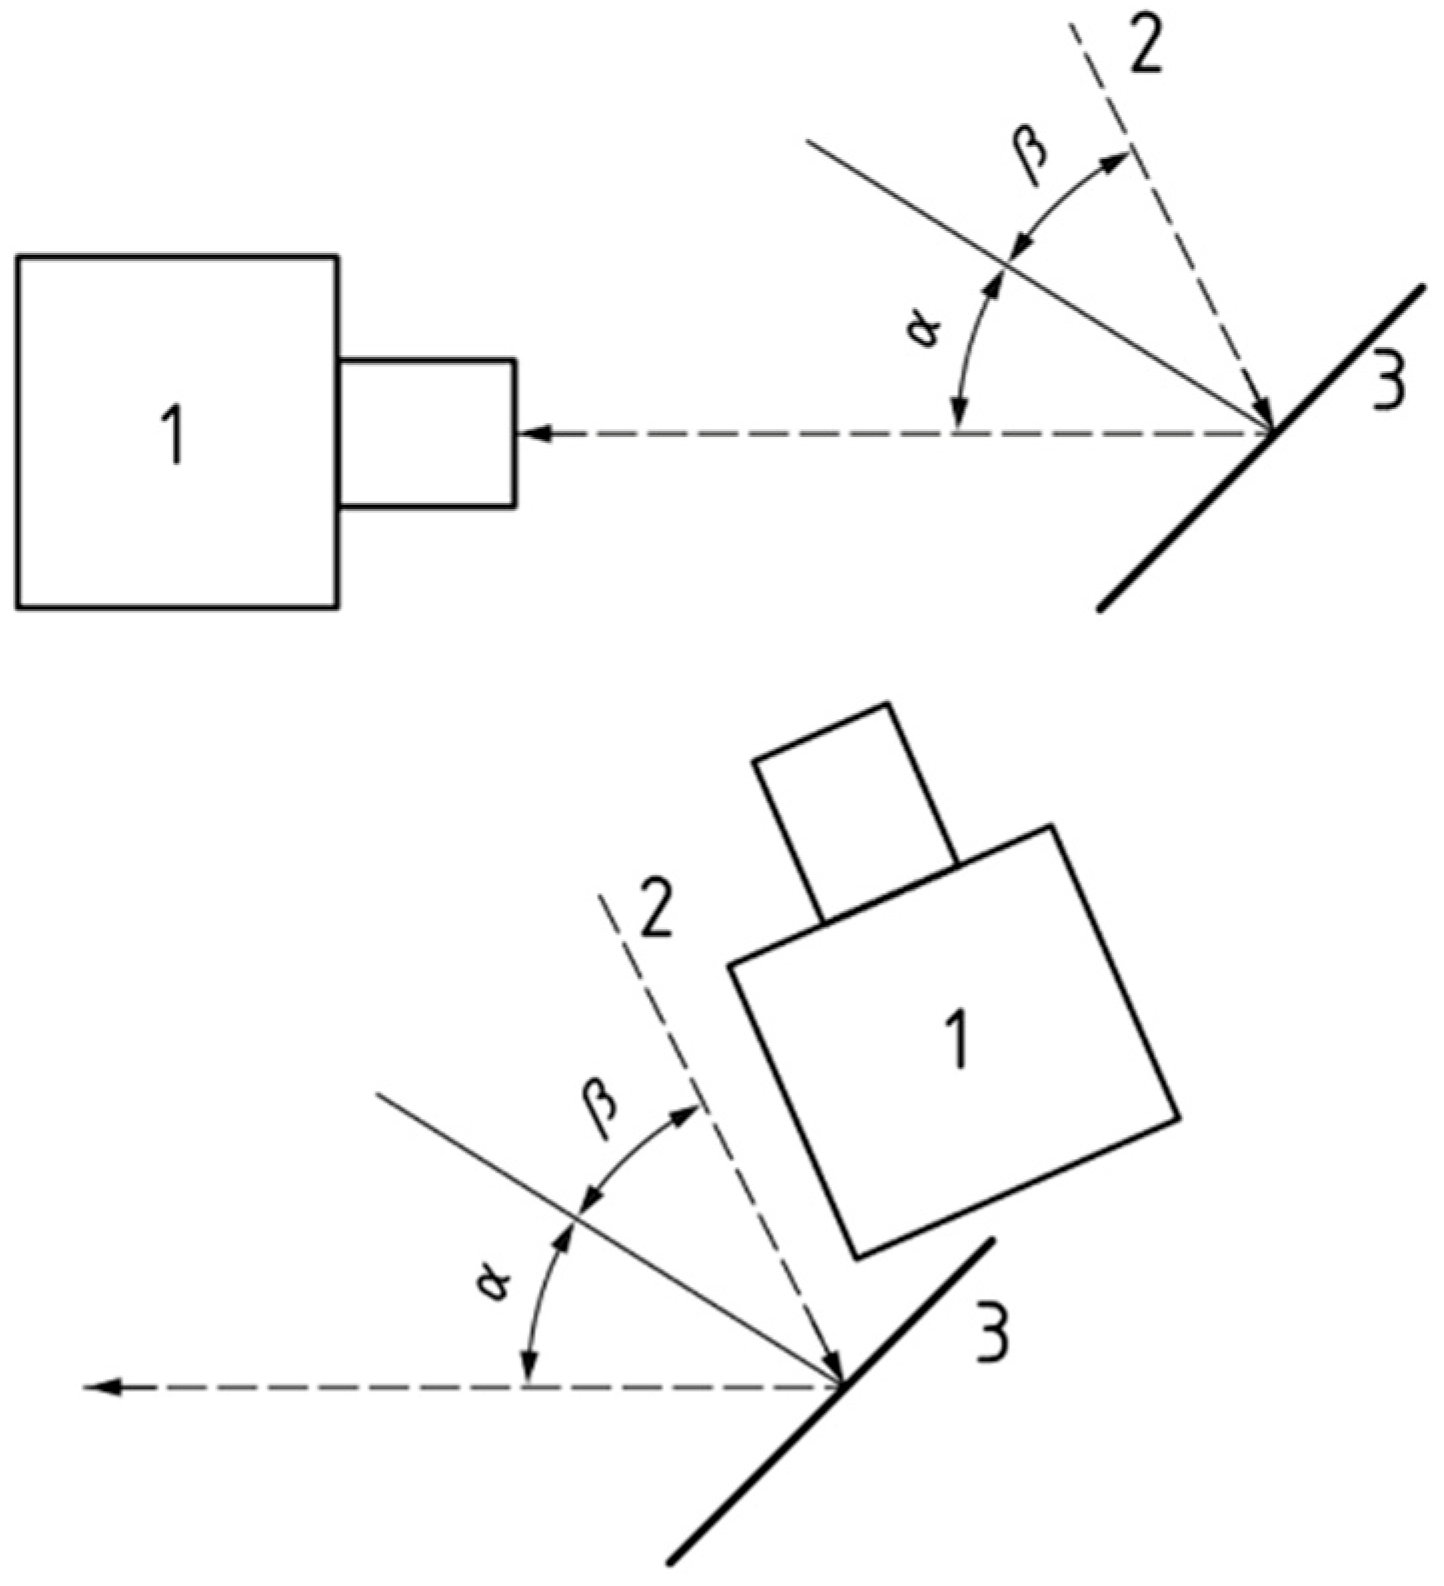
During the data acquisition, the UAV thermal sensor is configured by selecting an appropriate temperature range (−40 to 150 °C) to ensure that all relevant thermal variations are captured. The UAV is positioned as close as possible to the building surface, typically within 1 m, to minimize atmospheric interference. A set of thermal images is then acquired to support the estimation of T r e f l in accordance with BS EN ISO 6781-1:2023. Three thermal images are captured from different viewing angles: one from the selected direction, one at 15° to the left, and one at 15° to the right (Figure 2). The acquisition time and the sensor-to-surface distance are recorded to ensure accurate and consistent data processing. Similarly, for the calculation of T s , out , three thermal images are acquired following the same angular configuration, namely, the selected direction and ±15°. The thermal images must not be captured perpendicularly to the analyzed surface, as such a configuration may introduce distortions in the recorded temperature values.

2.2.4. Data Processing

The processing of the acquired data consists of three main processes, including the processing of thermograms for the estimation of T r e f l , the processing of thermograms for the derivation of T s , out , and the export of point-based T s , out data from each thermogram.
In accordance with BS EN ISO 6781-1:2023 and established practices in the literature on building thermal measurements, the thermograms used for the estimation of T r e f l are processed by assigning specific parameters. The analysis uses a sensor-to-target distance of 15 m, R H values recorded by outdoor environmental sensors at the time of acquisition, an ε value of 1, and an initial T r e f l equal to the T out measured simultaneously. The T r e f l is then calculated as the average temperature over the entire thermogram, after excluding transient heat sources such as people or moving vehicles that may introduce measurement errors. The final value of T r e f l is obtained as the arithmetic mean of the values derived from the three thermograms acquired from different viewing directions (center, left, and right).

2.3. Case Study

2.3.1. Study Area

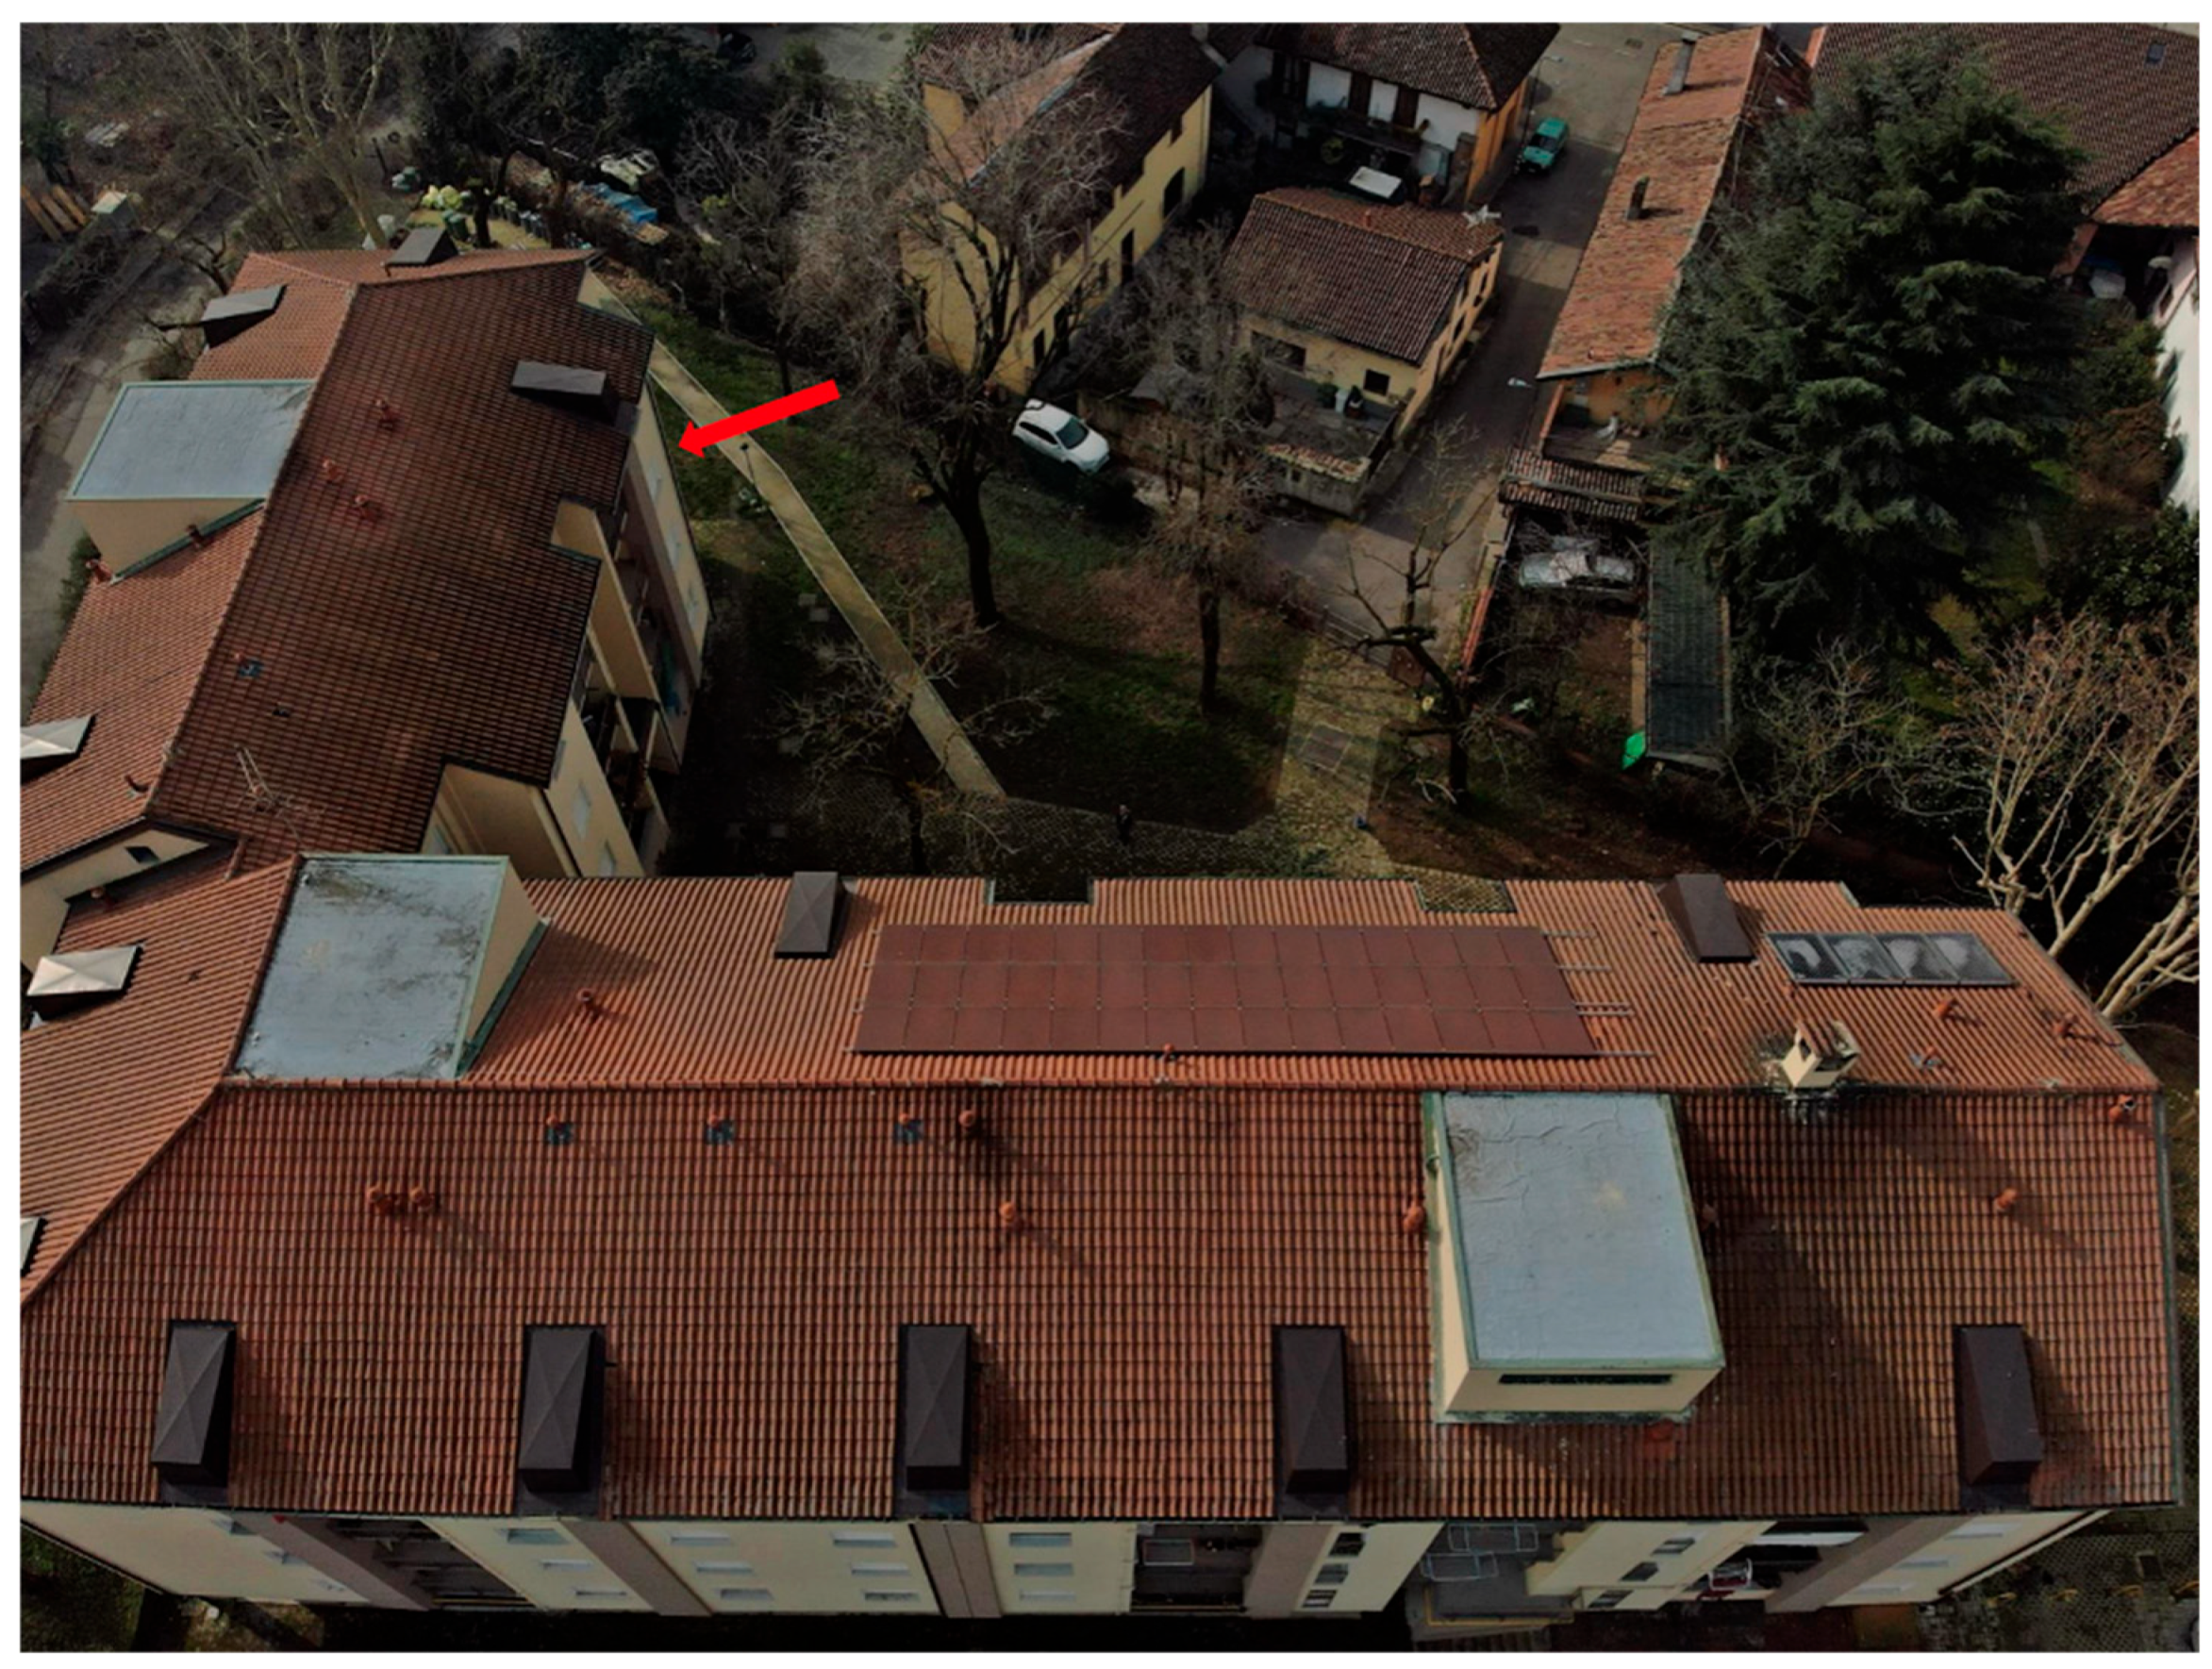
The case study was conducted on a residential building located in Chiaravalle, Milan (45°24′59.78″ N, 9°14′29.22″ E) (Figure 3). The building was constructed in the 1960s and represents the wall construction characteristics and thermal performance typical of buildings from that period. According to the Köppen–Geiger climate classification, the area belongs to the Cfa climate zone, which is classified as a humid subtropical climate [35]. During winter, the regional climate is generally cold and humid and is frequently associated with fog formation due to the influence of the Po Valley basin and continental air masses.
Starting in 2020, the building underwent an energy retrofit intervention. The retrofit included the installation of additional thermal insulation on the building envelope, the correction of thermal bridges, the implementation of a heat pump system for space heating and domestic hot water production, and the installation of photovoltaic panels on the roof. These interventions contributed to improved energy performance and reduced overall energy consumption.
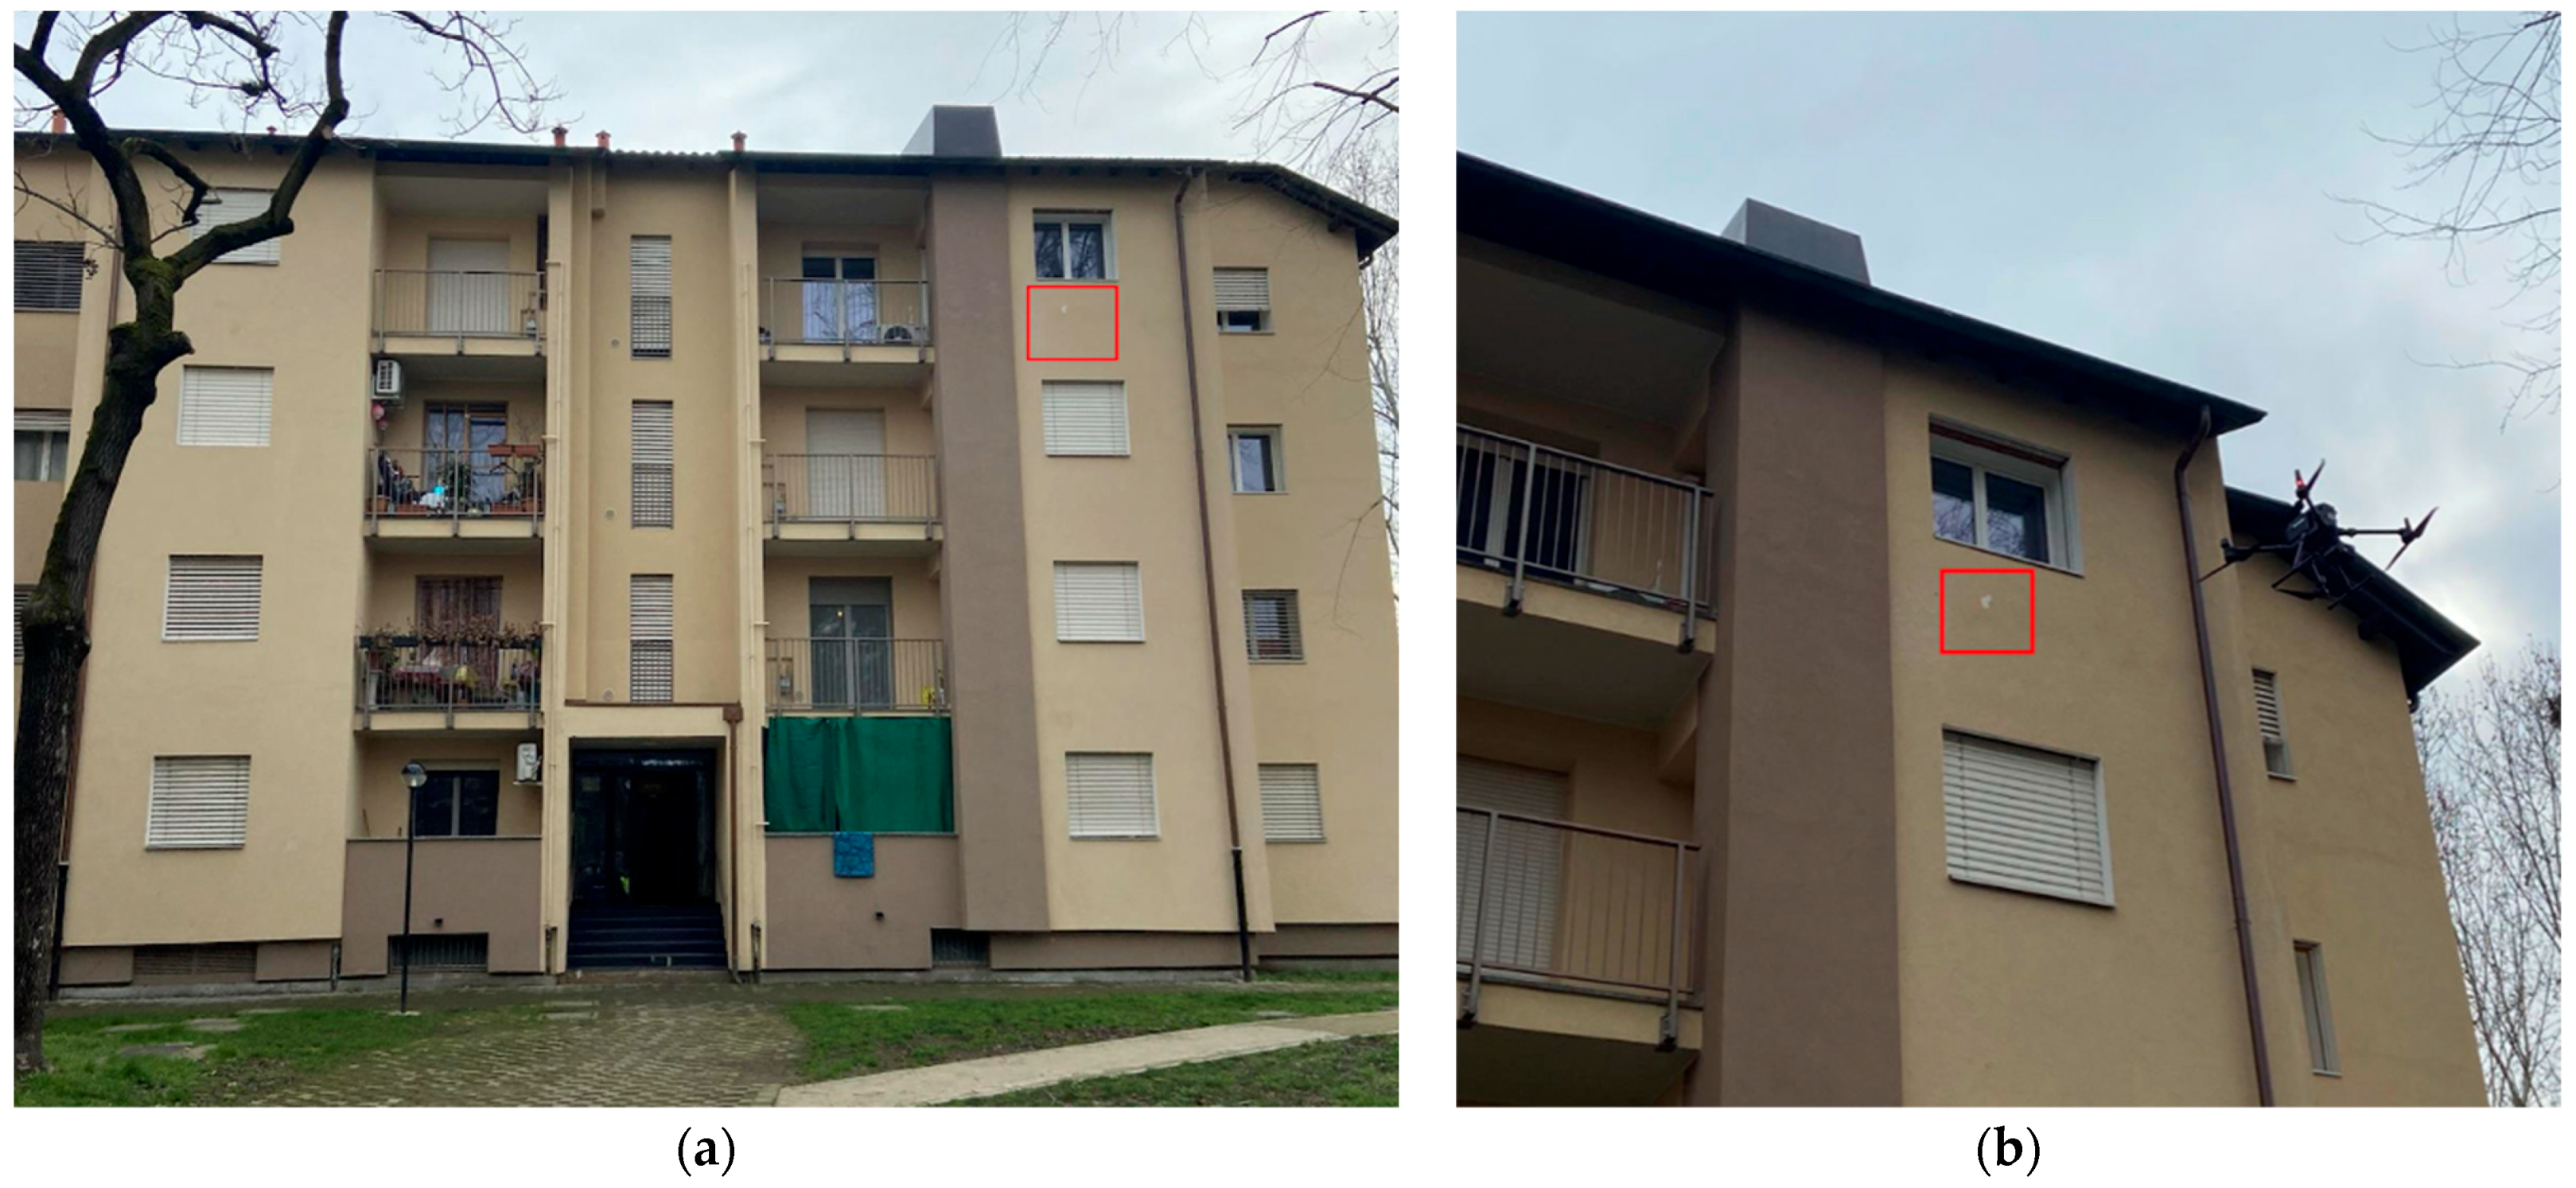
The experiment was conducted on the northwest-facing external wall located on the top floor of the building in order to minimize the influence of direct solar radiation on the thermal measurements. Figure 4a illustrates the location of the investigated area, where the red-highlighted region represents the area selected for thermal analysis. Figure 4b presents the UAV-based measurement campaign conducted during the data acquisition process.

2.3.2. Measuring Instrument

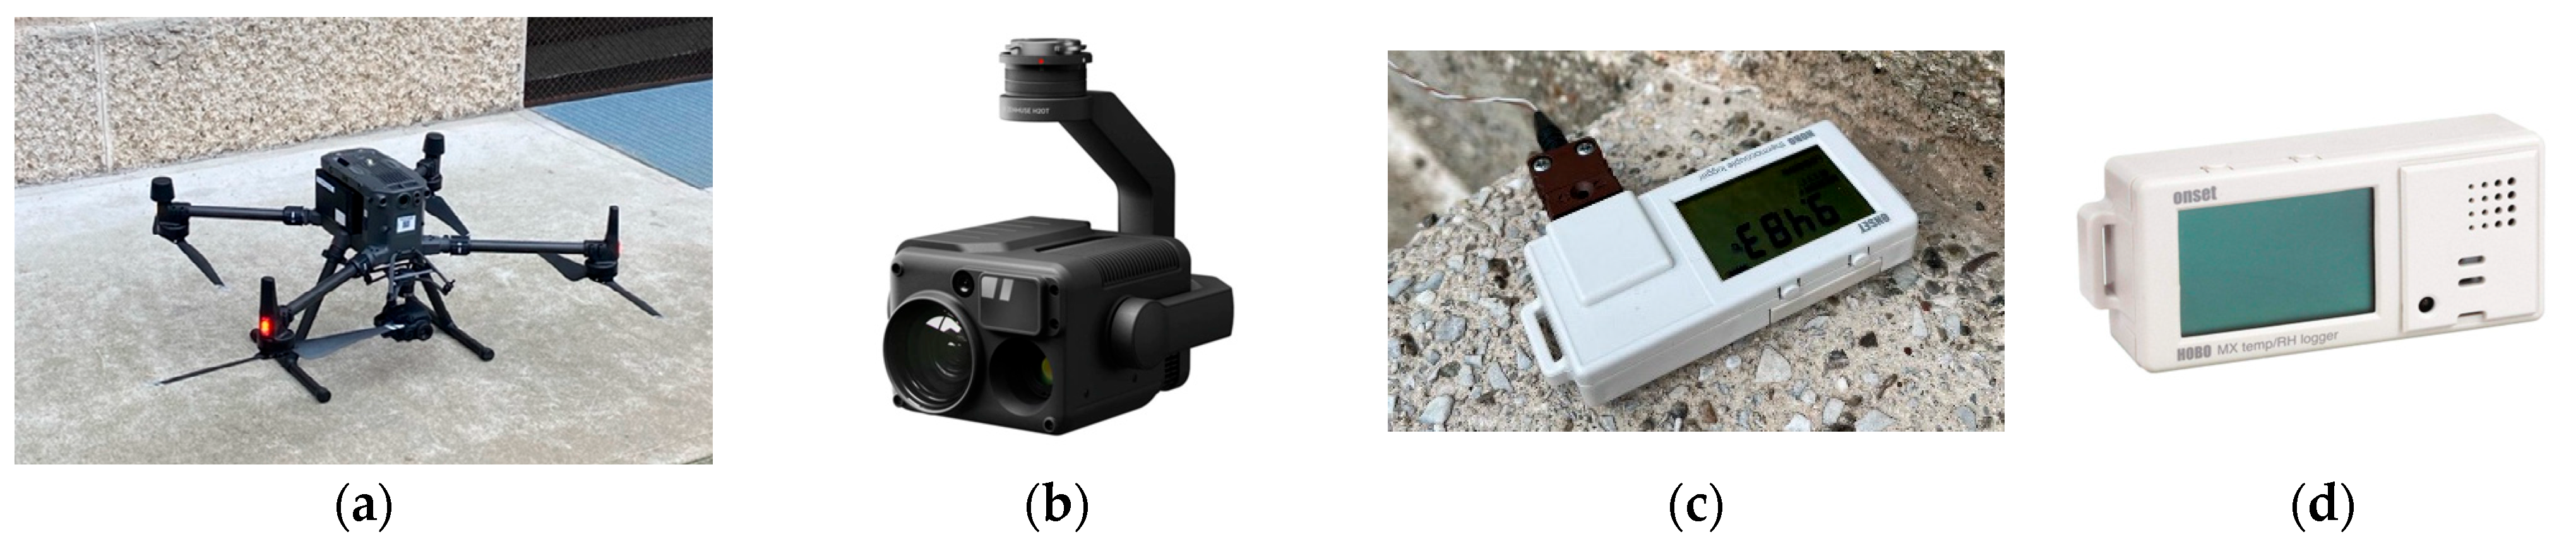
The experiment employed a DJI Matrice 300 RTK (Manufacturer: DJI, China) equipped with a DJI Zenmuse H20T thermal infrared camera to acquire T s , out and the T r e f l of the surrounding environment. Two HOBO MX1101 data logger devices (Manufacturer: LI-COR HOBO Data Loggers, USA, MA) were used to measure T i n and T o u t and relative humidity, respectively. The data loggers were positioned away from heat sources and mounted on photographic tripods to minimize the influence of surrounding vegetation and external disturbances on the measurements.
A thermocouple was directly attached to the external wall surface to record the T s , c o n t , which served as reference data for surface temperature validation. Both the data loggers and the thermocouple were configured to record measurements at 5 min intervals throughout the experiment. Figure 5 and Table 1 present the specifications and performance parameters of the measurement instruments in detail.

2.3.3. Data Acquisition and Processing

The UAV-based thermal measurement campaign was conducted on 15 February 2024 during the winter season, with data acquisition performed at approximately 12:00 p.m. The selected conditions were considered compatible with the quasi-steady thermal assumptions. The thermal camera was required to capture vertical wall surfaces using a horizontal viewing angle, and delaying the survey reduced the risk of direct sunlight entering the sensor path due to the low solar angle near the horizon during the early morning period. The investigated northwest-facing façade remained completely shaded throughout the acquisition process and was not directly exposed to solar radiation, avoiding the rapid surface temperature fluctuations typically associated with solar exposure. The prolonged operation of the heating system before the measurement increased the indoor–outdoor temperature gradient (10–15 °C) while promoting a more stable heat-flow regime through the building envelope. Compared with early-morning conditions, which are often characterized by rapidly changing ambient temperatures and moisture-related effects such as fog formation, the selected acquisition window provided more stable boundary conditions for evaluating conductive heat transfer across the wall. Therefore, the selected environmental and measurement conditions were considered representative of a quasi-steady thermal state and suitable for the application of the proposed analysis framework.
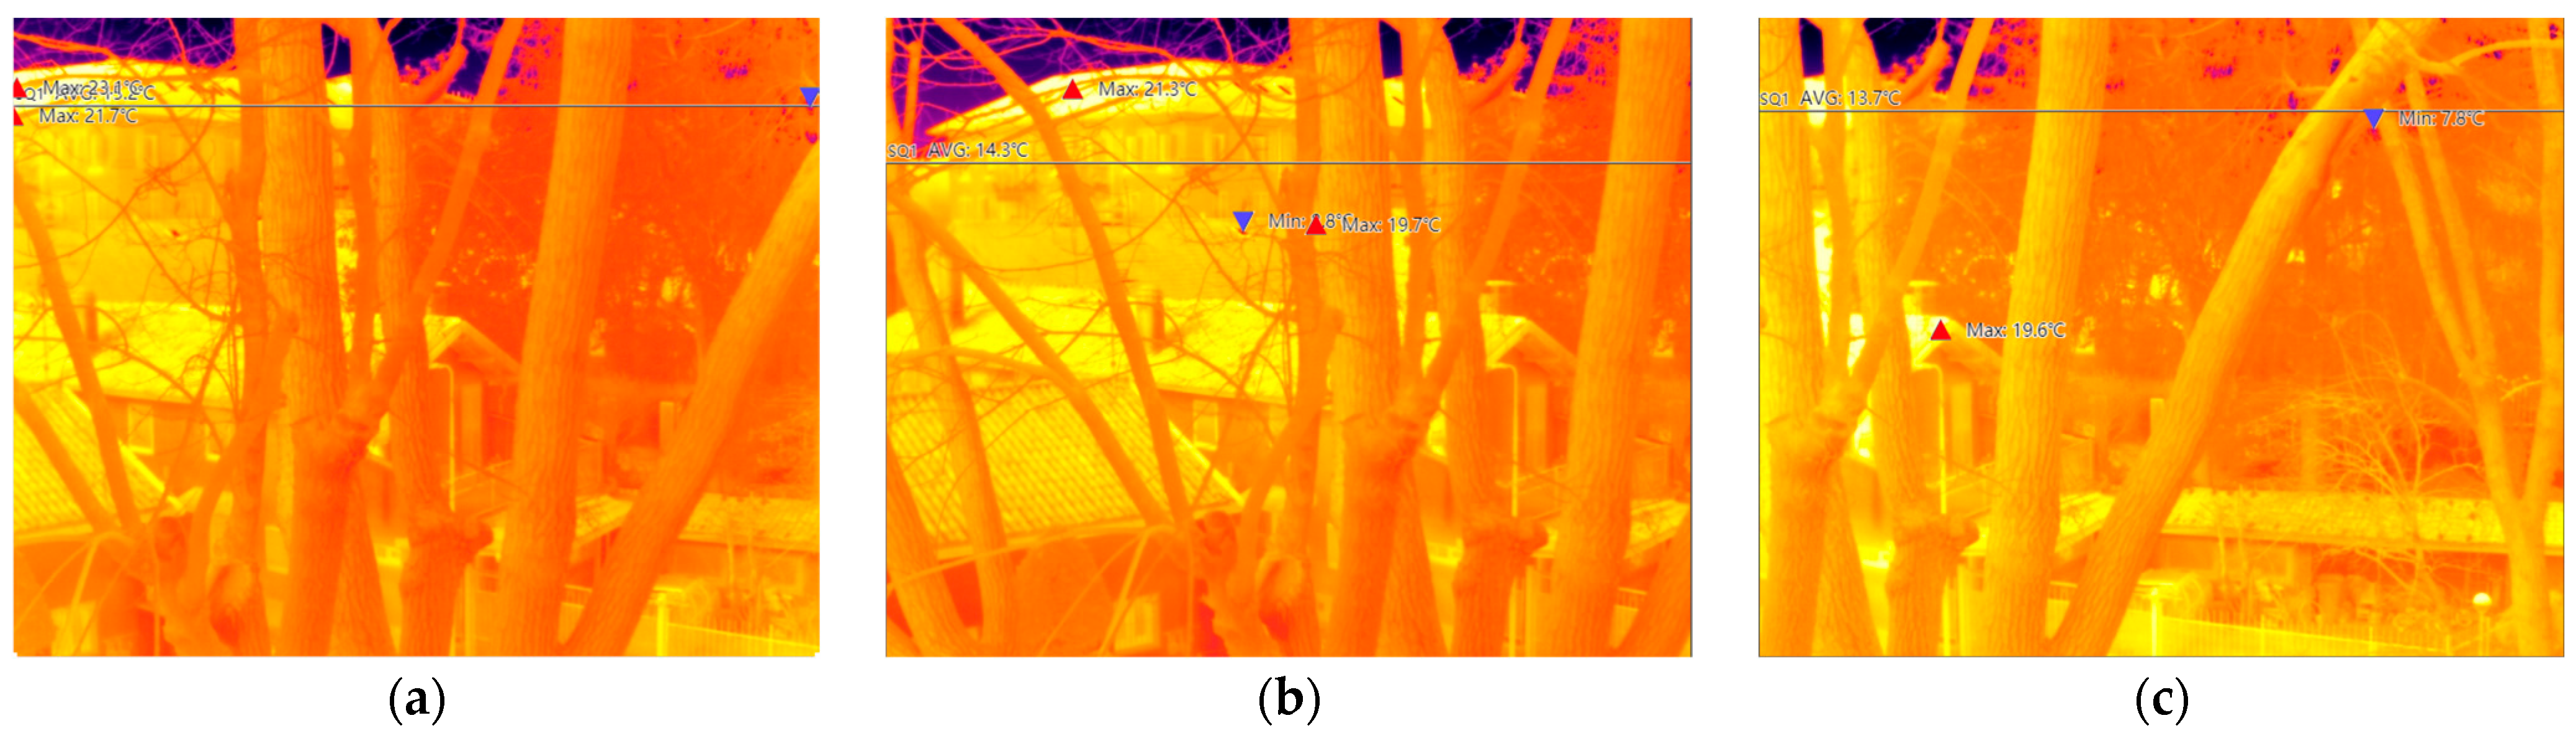
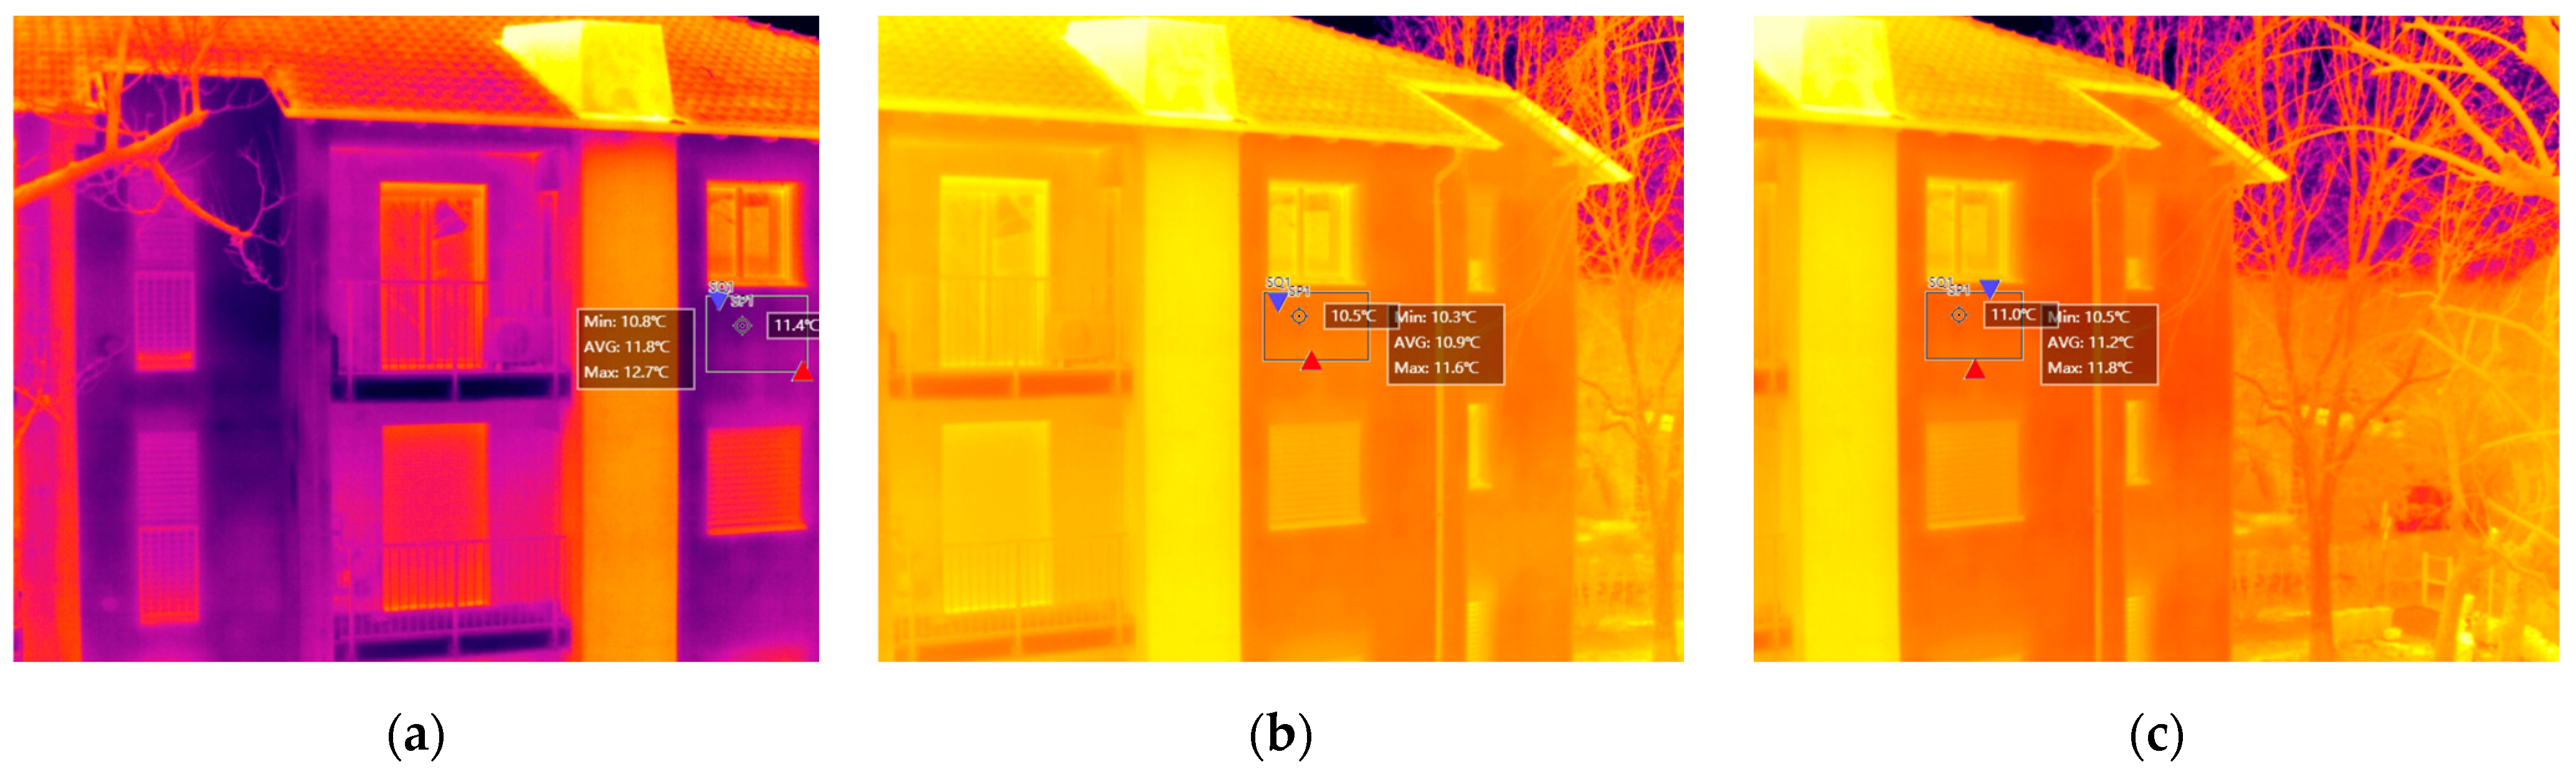
During data acquisition, the UAV maintained an approximate distance of 17 m from the investigated façade. This distance was selected to minimize operational constraints caused by surrounding trees near the building while ensuring stable image acquisition conditions. According to the proposed workflow, three thermal images were acquired from different viewing angles to measure the T r e f l and T s , out (Figure 6 and Figure 7). One image was captured from the selected viewing direction, while the other two images were acquired at viewing angles of 15° to the left and 15° to the right, respectively. Before each image acquisition, the UAV was positioned and stabilized in a hovering state to minimize motion blur and reduce measurement errors associated with UAV movement and flight speed. In practice, a total of 12 thermograms were captured from different viewing angles, ranging from −15° to +15°, during the UAV survey. These repeated measurements provided a more robust thermal dataset than a single-image acquisition. All 12 thermograms were acquired from the same distance of 17 m within a short time window under stable environmental conditions. The temperature differences among the thermograms were minimal, with a maximum variation of 0.6 °C. This value was interpreted as a within-acquisition image-to-image variability indicator under the same boundary conditions. However, because all thermograms were acquired during the same short acquisition window, this variability does not represent temporal repeatability or confidence intervals across different environmental regimes. Therefore, the extracted infrared temperature values can be considered reasonably consistent within the specific acquisition window investigated in this study.

3. Results

3.1. U-Value Calculation

This study quantitatively evaluated four different approaches for estimating envelope U-values using Formulas (9) and (11)–(13) to identify physically reliable in situ methods for UAV-QIRT applications under real outdoor boundary conditions. Formula (2) was intentionally excluded because it was originally developed for indoor IRT and does not account for the external boundary conditions encountered in outdoor surveys. The selection of Formulas (9) and (11)–(13) was based on a comprehensive review of the existing literature on both ground-based and UAV-assisted quantitative IRT for building-envelope thermal characterization. These formulations encompass the major approaches currently adopted in practice for in situ U-value estimation from external thermographic measurements. More specifically, they represent successive levels of physical complexity in the treatment of the external surface energy balance, ranging from simplified conductive models to more comprehensive heat-balance formulations that progressively incorporate convective and radiative heat-transfer processes. Although alternative formulations and empirical adaptations have occasionally been proposed, they generally represent modifications or simplifications of these same underlying physical frameworks. Consequently, the selected equations provide a representative coverage of the current methodological design space for external thermography-based U-value assessment and enable a systematic comparison of the principal modeling assumptions reported in the literature.
Formulas (9) and (11) were derived from ground-based QIRT approaches, whereas Formulas (12) and (13) were implemented within a UAV-based measurement framework. Together, these formulations provide a representative framework for evaluating the transferability of ground-based approaches to UAV-QIRT and assessing the reliability of existing UAV-based methods under real operating conditions.
Table 2 summarizes the environmental and thermal parameters recorded during the UAV survey and used as inputs for the U-value calculations (Table 2).
Table 3 presents the U-values calculated using the formulations for U-value estimation derived from ground-based QIRT approaches or implemented within a UAV-based measurement framework (Table 3).
Formula (9) assumes that the external surface heat balance is governed predominantly by convection (Section 2.1). Accordingly, the conductive heat flux through the wall is estimated from the temperature difference between T s , out and T out . Thus, the sign of the U-value depends directly on the sign of the external surface-to-air temperature difference T s , o u t T o u t . Under ideal steady-state conditions, the model implicitly assumes that the external wall surface remains slightly warmer than the outdoor air due to conductive heat transfer through the envelope. Under these conditions, q c o n v is directed from the wall surface toward the ambient air:
q c o n v = h o u t ( T s , o u t T o u t ) > 0
In UAV-IRT outdoor surveys, especially under clear-sky or winter nighttime conditions, the measured thermal regime was dominated by long-wave radiative exchange with the sky rather than by convection alone. The sky has a radiant temperature ( T s k y ) lower than T o u t . Consequently, the façade surface experiences net radiative heat loss toward the sky:
q r = ε σ ( T s , o u t 4 T s k y 4 )
Because T s k y can be substantially lower than T o u t (~−40 to –50 °C), the radiative heat loss can become greater than the conductive heat supplied from the interior of the wall. When this occurs, the external surface cools down until T s , o u t < T o u t . Under this condition, the direction of convective heat transfer reverses:
q c o n v = h o u t ( T s , o u t T o u t ) < 0
The observed regime indicates that long-wave radiative cooling can become the governing mechanism of the façade thermal state, thereby violating the underlying assumptions of convection-dominated QIRT models. Therefore, convection-based U-value estimations may become thermodynamically inconsistent when radiative cooling exerts a dominant influence on the external wall thermal balance.
Formula (11) incorporates both convective and radiative heat transfer mechanisms at the external façade surface. The radiative component is simplified by adopting T out as the radiative boundary condition. The radiative term is therefore linearized around this reference temperature, while convective exchange is parameterized through an empirical wind-dependent correlation (Section 2.1). Although this approach improves the convection-based models, it does not explicitly account for the effective T s k y or differentiate among radiative exchanges with the sky, ambient air, and ground surfaces. Consequently, the model remains unable to accurately characterize the actual outdoor thermal environment when long-wave radiative cooling dominates the external wall heat balance. The persistence of a negative U-value therefore demonstrates that the inclusion of a simplified radiative term alone is insufficient to capture the complexity of real outdoor radiative interactions.
Formula (12) applies an indoor surface heat-balance approach based on quasi-steady-state assumptions. This formulation primarily relies on indoor radiative and convective exchange combined with the temperature difference between internal and external surfaces (Section 2.1). However, in real building conditions, surface temperatures depend on conductive, convective, and radiative exchanges. In UAV-IRT applications, the T s ,   out is affected by long-wave radiative exchange with the sky and surrounding environment, which can deviate from an air-coupled condition. As a result, the U-value remained negative, indicating that the method is highly sensitive to uncertainties in surface temperature measurements and to transient thermal conditions. Minor inaccuracies in the measurement of T s , in or T s , out imperfect correspondence between indoor and outdoor measurement locations, or non-steady-state thermal behavior may substantially affect the calculated result.
Formula (13) incorporates a more comprehensive outdoor radiative–convective heat-balance formulation. It explicitly distinguishes radiative exchange with the sky, ambient air, and ground surfaces while simultaneously accounting for convective heat transfer (Section 2.1). Consequently, the formulation remains physically consistent even when T s , o u t is lower than T o u t . The positive result, therefore, indicates that long-wave radiative exchange with the sky exerted a substantial influence on the external wall thermal balance during the UAV-based measurement campaign. Overall, the comparison demonstrates that simplified QIRT formulations may become unreliable under complex outdoor environmental conditions, whereas complete radiative–convective formulations provide a more realistic representation of external wall heat transfer.

3.2. U-Value Sensitivity Analysis

The in-situ U-value measured through the HFM method was adopted as the reference value throughout this study, as derived from direct measurements performed in accordance with the requirements of ISO 9869-1 [8]. The monitoring campaign was carried out over a continuous five-day period (28 January–1 February 2024), during which heat flux density through the wall, T i n , and T o u t were recorded at regular intervals. The U value was calculated using the average method prescribed by the standard, yielding a U-value of 0.20 W/m2K. The measurement campaign satisfied the convergence criteria specified in ISO 9869-1, including the 24 h stability criterion and the consistency criterion between the first and last two-thirds of the monitoring period. The deviations obtained from both tests were below the 5% threshold required by the standard, confirming the stability and reliability of the measured U-value.
The application of Equation (13) yielded a U-value of 0.57 W/m2K, whereas the HFM averaging method provided an average value of 0.20 W/m2K. The absolute discrepancy between the two approaches was 0.37 W/m2K, corresponding to a relative deviation of approximately 185%. This result indicates that, under the investigated boundary conditions, the formulation considerably overestimated the U-value in comparison with the HFM measurement [29]. The observed deviation indicates that physical consistency alone should not be interpreted as quantitative validation. Several potential sources of discrepancy were examined. Measurement instability can be reasonably excluded, as the HFM-derived U-value satisfied all ISO 9869-1 convergence and stability requirements over the standard monitoring period. Likewise, uncertainties associated with thermal-camera calibration, ε assignment, and image acquisition geometry are unlikely to account for deviations of this magnitude, as such factors typically produce substantially smaller variations in surface temperature measurements. Spatial and temporal mismatches between the UAV survey and the HFM monitoring period may have contributed to the observed difference. However, these effects alone are not expected to explain the full discrepancy. A plausible explanation lies in the structure of the external heat-balance model itself. The U-value estimation in UAV-QIRT approaches depends on the accurate representation of convective and radiative exchanges occurring at the external surface. Small uncertainties in boundary conditions can propagate nonlinearly through the model and become significantly amplified in the resulting U-value estimate.
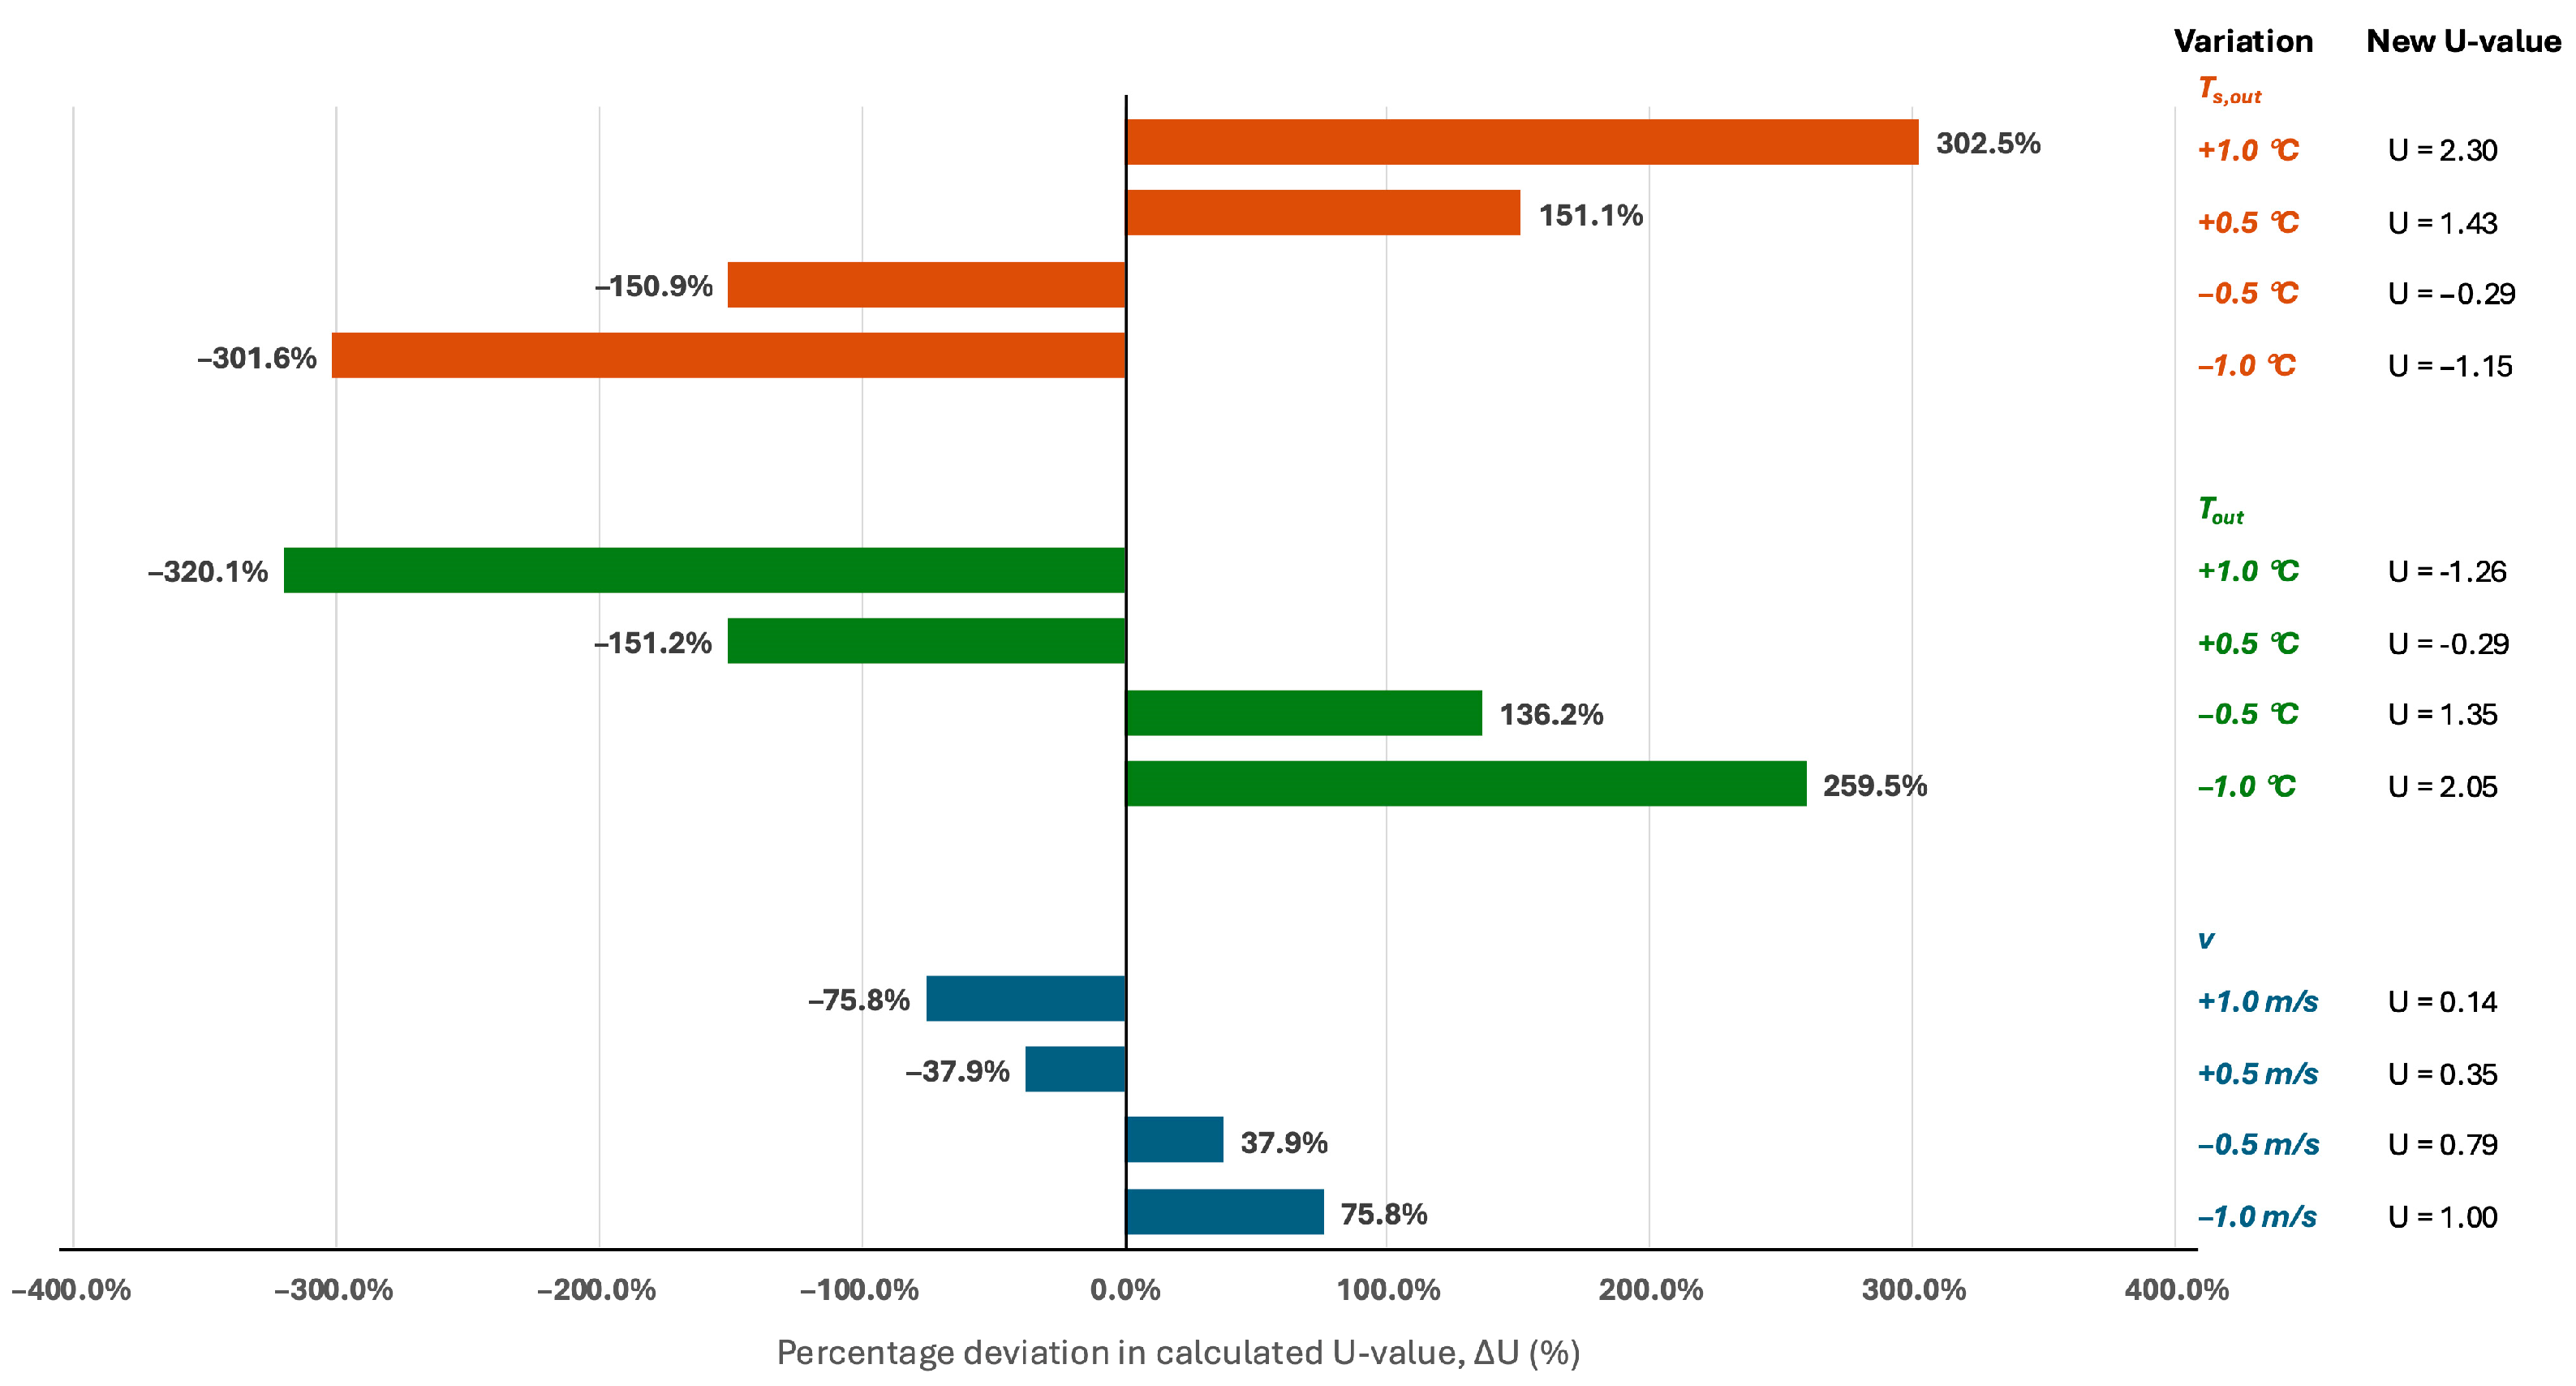
To further investigate the influence of different parameters and the robustness of the formulation, a sensitivity analysis was conducted by introducing controlled perturbations in the principal environmental variables governing the external surface energy balance under controlled variations in v , T s , out , and T out (Figure 8).
The analysis demonstrates that the calculated U-values are extremely sensitive to thermal variations. A variation of only ±0.5 °C in T s , o u t produced substantial changes in the calculated U-values, which ranged from −0.29 W/m2K to 1.43 W/m2K, corresponding to relative deviations of approximately −151% and +151%, respectively. Increasing the perturbation to ±1 °C further amplified the divergence, reaching −1.15 W/m2K and 2.30 W/m2K. A comparable behavior was observed for T o u t , where variation of ±0.5 °C resulted in U-values ranging from −0.29 W/m2K to 1.35 W/m2K, while ±1 °C perturbations produced values between −1.26 W/m2K and 2.05 W/m2K. These findings demonstrate that the UAV-QIRT method is highly sensitive to minor variations in thermal boundary conditions, particularly when the temperature difference between the external wall surface and the outdoor air remains limited. This pronounced sensitivity can be attributed to the structure of the radiative–convective heat balance equation. Both the convective and radiative heat transfer components are directly dependent on the temperature difference between the external surface and the outdoor air ( T s , o u t T o u t ), while the denominator of the U-value equation is governed by the indoor–outdoor temperature gradient. Consequently, even small uncertainties in the measured T s , out or T out can substantially modify the net heat flux balance. In this case study, the measured T s , out was lower than T out , making the calculated U-value particularly sensitive to perturbations affecting either the magnitude or the sign of ( T s , o u t T o u t ). This characteristic also explains why the simplified QIRT formulations generated physically unrealistic negative U-values.
The influence of v on the calculated U-value was comparatively less pronounced, although still significant. Reducing v by 0.5 m/s and 1.0 m/s increased the calculated U-values to 0.79 W/m2K and 1.00 W/m2K, respectively, whereas increasing v by the same magnitudes reduced the calculated U-values to 0.35 W/m2K and 0.14 W/m2K. These variations correspond to changes of approximately ±38% and ±76% relative to the baseline value. This behavior is associated with the Jürges equation used to estimate the convective heat transfer coefficient, according to which higher v enhance convective heat exchange and consequently alter the external thermal balance conditions. However, v did not produce abrupt sign inversions or divergence in the calculated U-values. This indicates that the dominant source of instability is the radiative-thermal coupling between the façade surface and the outdoor environment.
The sensitivity analysis demonstrates that UAV-based U-value estimation becomes physically reliable only when the external boundary condition is described through a complete surface energy balance. T s , o u t retrieved from UAV-IRT results from the simultaneous interaction between conductive heat transfer through the building envelope and convective-radiative exchanges with the surrounding environment. Consequently, simplified approaches that neglect one or more of these mechanisms may lead to substantial errors in the inferred U-value. Assuming steady-state conditions and adopting the convention that positive heat fluxes are directed toward the external surface, the external surface energy balance can be expressed as:
q c o n v + q c + q r a d , s k y + q r a d , e n v = 0
where q c o n v represents the conductive heat flux through the building envelope, q c is the convective heat flux exchanged with outdoor air, q r a d , s k y is the net long-wave radiative exchange with the sky, and q r a d , e n v is the net long-wave radiative exchange with the surrounding surfaces (e.g., ground, vegetation, and adjacent surfaces). Depending on the prevailing environmental conditions, the convective and radiative terms may assume either positive or negative values, representing heat gains or losses at the external surface. By explicitly describing each contribution, Equation (24) becomes:
U ( T i n T s , o u t ) + h c ( T o u t T s , o u t ) + ε σ T s k y 4 T s , o u t 4 + ε σ T e n v 4 T s , o u t 4 = 0
where T s , o u t is measured by UAV thermography, T e n v is the effective radiative temperature of the surrounding environment, h c is the external convective heat transfer coefficient, σ   is the Stefan–Boltzmann constant, F s k y and F e n v are the radiative view factors. This formulation highlights that surface temperature alone is insufficient for accurate U-value determination. Equation (25) identifies the complete set of variables governing UAV-based IRT U-value estimation and provides a physically consistent framework for interpreting thermal measurements acquired under real outdoor conditions.
The present analysis further shows that the main source of instability in simplified formulations is the incomplete closure of the external surface energy balance. Neglecting radiative boundary conditions, inaccuracies in surface ε characterization, or inadequate representation of convective exchanges may introduce significant uncertainty in the calculated U-value.
The key variables for UAV-based U-value estimation and measurement requirements are reported below (Table 4).

4. Discussion and Limitations

Based on the in situ thermal dataset, this study systematically evaluated four different U-value calculation formulas. The results showed that simplified U-value formulations are not suitable under real outdoor measurement conditions in which T s , out is lower than T out . In contrast, the complete heat-balance formulation, which simultaneously considers radiative exchange with the sky, ambient air, and ground together with convective heat transfer, provides a more realistic representation of the heat-transfer process occurring at the external wall surface. However, even when this physically more consistent formulation was applied, the calculated U-value still showed a considerable discrepancy compared with the reference HFM measurements. The discrepancy between the UAV-QIRT and HFM results should be interpreted in light of the different physical and temporal characteristics of the two methods. The HFM approach provides a time-averaged estimate based on direct heat flux measurements, whereas UAV-QIRT relies on an instantaneous or short-duration surface temperature acquisition combined with an external radiative–convective heat-balance model. Therefore, differences may arise from non-coincident temporal averaging windows, local spatial mismatch between the HFM sensor area and the thermographic region of interest, thermal inertia of the wall, uncertainty in environmental boundary conditions, and the simplified representation of radiative exchange. This comparison suggests that Formula (13), rather than the simplified formulations, provides a physically more consistent representation of the external surface energy balance under the investigated boundary conditions. However, physical consistency should not be interpreted as evidence of quantitative accuracy. The observed 185% deviation between the UAV-QIRT estimate and the HFM reference value is too large for direct design, certification, or compliance-oriented use. Within the evidence provided by this single case study, UAV-QIRT should therefore be regarded as a physically informed screening and comparative diagnostic approach, rather than as a quantitatively validated replacement for standardized HFM measurements. Further calibration and repeated validation are therefore required before the method can be considered quantitatively reliable.
To assess whether surface-temperature retrieval contributed to this discrepancy, this study additionally employed thermocouple-based contact measurements of T s , out as a reference dataset. The thermocouple-measured external T s , cont was 10.20 °C, whereas the UAV-IRT-measured T s , out was 10.97 °C. The absolute difference between the two measurements was 0.77 °C. Although this difference is relatively limited in absolute thermographic terms, it is not negligible for U-value calculation, as the sensitivity analysis showed that variations of only ±0.5 °C in surface temperature can substantially alter the estimated U-value. This sensitivity is particularly pronounced for highly insulated envelopes characterized by low conductive heat fluxes. Under such conditions, the conductive heat-transfer component represents only a relatively small fraction of the overall surface energy balance [36,37]. These findings confirm that the accuracy of surface temperature extraction is a critical factor in UAV-QIRT applications, particularly when T s , out and T out are close, and the sign of their difference strongly affects the external heat-balance calculation. Nevertheless, in the present case study, this small temperature difference did not change the thermal boundary condition characterized by T s , o u t T o u t < 0. Even when the thermocouple-based contact measurements were used, the condition T s , c o n t T o u t < 0 remained valid. The simplified QIRT formulations remained physically unsuitable under these environmental conditions. The findings therefore demonstrate that U-value calculations by UAV-QIRT are highly sensitive to outdoor environmental boundary conditions and that even minor variations in environmental parameters can significantly affect the final calculated results.
This study also has several limitations. First, flight authorization constraints limited the UAV thermal survey to a single measurement day, reducing the possibility of assessing the repeatability of the proposed workflow under different environmental conditions. In this campaign, the acquisition time was adjusted after an on-site evaluation of radiative and meteorological boundary conditions. Early-morning fog was present, and, because vertical wall surfaces had to be acquired with an approximately horizontal sensor orientation, the low solar position could have placed the sun close to the camera line of sight. The survey was therefore postponed until visibility and solar geometry were more suitable, while verifying that the investigated northwest-facing façade remained shaded and that T o u t conditions were sufficiently stable. This site-specific decision also allowed a larger indoor–outdoor (ΔT) to develop, as the heating system had operated for a longer period, improving the detectability of heat losses. Nevertheless, early-morning or nighttime acquisitions generally remain preferable for UAV-QIRT, provided that solar exposure, surface moisture, fog, wind conditions, and thermal boundary stability are carefully verified.
Although 12 thermograms were acquired during the UAV survey, these images were collected within the same short acquisition window and under the same environmental boundary conditions. Therefore, they provide information on short-term image-to-image variability, but they do not allow the computation of confidence intervals across different times of day, environmental regimes, or façade locations. The present study is consequently limited to a single-regime assessment, and the repeatability of UAV-QIRT-derived U-values under varying radiative–convective boundary conditions remains to be quantified. Future experimental campaigns should include repeated UAV-QIRT acquisitions and simultaneous reference measurements over multiple temporal windows, façade orientations, and climatic conditions, in order to assess temporal repeatability, spatial variability, and uncertainty propagation more rigorously.
Future studies should focus on validating the proposed workflow across multiple measurement days, climatic conditions, temporal windows, and façade locations to further evaluate the stability and applicability of UAV-QIRT-derived U-values. Particular attention should be given to early-morning and nighttime measurements, as radiative–convective boundary conditions vary throughout the day and may significantly influence the external surface energy balance. Comparative tests should also investigate the influence of different UAV-mounted thermal infrared sensors, UAV-to-target distances, wind conditions, and temperature ranges, in order to better quantify the contributions of sensor performance, flight configuration, atmospheric path length, and environmental boundary conditions to U-value uncertainty. Such investigations will be essential for improving model calibration, reducing uncertainty, and enhancing the robustness and applicability of UAV-QIRT workflows under real outdoor conditions.

5. Conclusions

This study developed and applied a structured UAV-QIRT workflow for in situ U-value estimation of building envelopes in accordance with BS EN ISO 6781-1:2023. By employing a UAV-mounted thermal infrared sensor, the workflow extends thermographic investigations to façade areas that are difficult to access using conventional ground-based surveys. The methodology integrates environmental preparation, sensor installation and calibration, T refl correction, and standardized data acquisition procedures, thereby providing a systematic framework for U-value measurement.
The study evaluated four QIRT-based U-value calculation formulas using thermal data acquired from an existing residential building. The results demonstrated that the applicability of QIRT-based U-value estimation strongly depends on outdoor thermal boundary conditions and on the physical assumptions embedded in the heat-balance formulations. In this case study, the UAV-QIRT-measured T s , out is lower than the T out . Under this condition, the simplified formulas produced physically unrealistic negative U-values. In contrast, the complete heat-balance formulation, which incorporates radiative exchange with the sky, ambient air, and ground together with convective heat transfer, produced a physically plausible U-value. These findings demonstrate that a realistic representation of the external surface energy balance is essential for obtaining physically meaningful U-value estimates under outdoor conditions.
The comparison with the reference HFM measurement revealed a clear distinction between physical consistency and quantitative accuracy. Although the complete heat-balance formulation produced physically plausible U-value estimates, the calculated value remained substantially different from the HFM reference measurement. This result indicates that a physically consistent representation of external heat-transfer processes is a prerequisite for meaningful UAV-QIRT-based U-value estimation; however, physical consistency alone does not guarantee quantitative agreement with standardized in situ measurements. From a practical perspective, the results suggest that the proposed UAV-QIRT methodology is currently more suitable as a screening and comparative diagnostic tool than as a direct substitute for standardized in situ U-value measurements. The method helped identify the dominant physical mechanisms affecting U-value estimation and enabled rapid building-scale assessments. However, further refinement of the external heat-balance model and improved characterization of boundary conditions are required before quantitative agreement with HFM measurements can be consistently achieved. The findings are limited to a single façade, one acquisition window, and the specific environmental conditions investigated in this study. Future research should therefore include repeated UAV-QIRT and simultaneous HFM measurements across different façade orientations, envelope typologies, seasons, sky conditions, and acquisition times. Such validation is necessary to quantify uncertainty propagation, define application-specific reliability thresholds, and determine whether UAV-QIRT can move from screening-level diagnosis toward quantitatively robust in situ U-value assessment.

Author Contributions

Conceptualization, E.L., A.G. and X.Z.; methodology, E.L., A.G. and X.Z.; software, X.Z.; validation, E.L., A.G. and X.Z.; investigation, E.L., A.G. and X.Z.; resources, A.G.; data curation, A.G. and X.Z.; writing—original draft preparation, X.Z.; writing—review and editing, X.Z., A.G. and E.L.; visualization, X.Z.; supervision, E.L. and A.G. All authors have read and agreed to the published version of the manuscript.

Funding

E.L. was funded by Politecnico di Milano, Department of Architecture and Urban Studies (DAStU) with the grant “Technical-scientific assistance activities to the Experimental Laboratories System/Laboratory of ‘Analysis and Diagnostics of the Built Environment’ of DAStU Department for instrumental acquisition and data management related to the energy performance and retrofit of twentieth-century architecture”.

Data Availability Statement

The data presented in this study are available from the corresponding author upon reasonable request.

Acknowledgments

The authors thank the LADC Laboratory at Politecnico di Milano for providing the HFM measurement results, and the SiMaMuSe research group for supporting the UAV-based thermal data acquisition and field measurement activities conducted in this study. Xiaojia Zhang would like to thank the financial support from the China Scholarship Council (CSC) under the grant CSC No. 202309210009.

Conflicts of Interest

The authors declare no conflicts of interest.

Abbreviations

1DOne-Dimensional
BEMBuilding Energy Model
HFMHeat Flux Meter
IRTInfrared Thermography
NDTNon-Destructive Testing
qIRTQualitative Infrared Thermography
QIRTQuantitative Infrared Thermography
RHRelative Humidity
UAVUnmanned Aerial Vehicle
UAV-IRTUnmanned Aerial Vehicle Based Infrared Thermography
UAV-qIRTUnmanned Aerial Vehicle Based Qualitative Infrared Thermography
UAV-QIRTUnmanned Aerial Vehicle Based Quantitative Infrared Thermography
U-valueThermal Transmittance
Symbols
d sensor-to-target distance
F air outdoor air radiative angle factor
F e n v environment radiative angle factor
F ground ground radiative angle factor
F sky sky radiative angle factor
h c convective heat transfer coefficient
h o u t outdoor convective coefficient
h r , a i r outdoor air radiative heat transfer coefficients
h r , g r o u n d ground radiative heat transfer coefficients
h r , s k y sky radiative heat transfer coefficients
q heat flux
q a i r air radiative heat transfer
q c convective heat flux
q c o n v conductive heat flux through the building envelope
q g r o u n d ground radiative heat transfer
q o u t outdoor radiative heat transfer
q r radiative heat transfer
q r a d , s k y net long-wave radiative exchange with the sky
q r a d , e n v net long-wave radiative exchange with the surrounding surfaces
q s k y sky radiative heat transfer
T dewp dew point temperature
T e v n environmental temperature
T in indoor air temperature
T m the mean radiative temperature
T s , in indoor wall surface temperature
T out outdoor air temperature
T s , out outdoor wall surface temperature
T r e f l reflected apparent temperature
T s k y sky temperature
T s , cont contact surface temperature
U U-value
v wind speed
ΔTtemperature difference
ε emissivity
ε s k y sky emissivity
ε v wall spectral emissivity
σ Stefan-Boltzmann constant
θ the angle between the building envelope and horizontal plane

References

  1. IEA. Tracking Buildings Report; IEA: Paris, France, 2022. [Google Scholar]
  2. Directive (EU) 2024/1275 of the European Parliament and of the Council of 24 April 2024 on the Energy Performance of Buildings (Recast). 2024. Available online: https://eur-lex.europa.eu/eli/dir/2024/1275/oj (accessed on 1 April 2026).
  3. Biseniece, E.; Žogla, G.; Kamenders, A.; Purviņš, R.; Kašs, K.; Vanaga, R.; Blumberga, A. Thermal Performance of Internally Insulated Historic Brick Building in Cold Climate: A Long Term Case Study. Energy Build. 2017, 152, 577–586. [Google Scholar] [CrossRef]
  4. Cirami, S.; Evola, G.; Gagliano, A.; Margani, G. Thermal and Economic Analysis of Renovation Strategies for a Historic Building in Mediterranean Area. Buildings 2017, 7, 60. [Google Scholar] [CrossRef]
  5. Lucchi, E. Energy Efficiency of Historic Buildings. Buildings 2022, 12, 200. [Google Scholar] [CrossRef]
  6. Nardi, I.; Sfarra, S.; Ambrosini, D. Quantitative Thermography for the Estimation of the U-Value: State of the Art and a Case Study. J. Phys. Conf. Ser. 2014, 547, 012016. [Google Scholar] [CrossRef]
  7. BS EN ISO 6946; Building Components and Building Elements—Thermal Resistance and Thermal Transmittance—Calculation Methods. British Standards Institution: London, UK, 2017.
  8. BS EN ISO 9869-1:2014; Thermal Insulation—Building Elements—In-Situ Measurement of Thermal Resistance and Thermal Transmittance. British Standards Institution: London, UK, 2014.
  9. Nardi, I.; Paoletti, D.; Ambrosini, D.; De Rubeis, T.; Sfarra, S. U-Value Assessment by Infrared Thermography: A Comparison of Different Calculation Methods in a Guarded Hot Box. Energy Build. 2016, 122, 211–221. [Google Scholar] [CrossRef]
  10. Mahmoodzadeh, M.; Gretka, V.; Hay, K.; Steele, C.; Mukhopadhyaya, P. Determining Overall Heat Transfer Coefficient (U-Value) of Wood-Framed Wall Assemblies in Canada Using External Infrared Thermography. Build. Environ. 2021, 199, 107897. [Google Scholar] [CrossRef]
  11. Danielski, I.; Fröling, M. Diagnosis of Buildings’ Thermal Performance-a Quantitative Method Using Thermography under Non-Steady State Heat Flow. Energy Procedia 2015, 83, 320–329. [Google Scholar] [CrossRef]
  12. Marshall, A.; Francou, J.; Fitton, R.; Swan, W.; Owen, J.; Benjaber, M. Variations in the U-Value Measurement of a Whole Dwelling Using Infrared Thermography under Controlled Conditions. Buildings 2018, 8, 46. [Google Scholar] [CrossRef]
  13. El Masri, Y.; Rakha, T. A Scoping Review of Non-Destructive Testing (NDT) Techniques in Building Performance Diagnostic Inspections. Constr. Build. Mater. 2020, 265, 120542. [Google Scholar] [CrossRef]
  14. Lucchi, E. Applications of the Infrared Thermography in the Energy Audit of Buildings: A Review. Renew. Sustain. Energy Rev. 2018, 82, 3077–3090. [Google Scholar] [CrossRef]
  15. Tejedor, B.; Casals, M.; Gangolells, M.; Roca, X. Quantitative Internal Infrared Thermography for Determining In-Situ Thermal Behaviour of Façades. Energy Build. 2017, 151, 187–197. [Google Scholar] [CrossRef]
  16. Baldinelli, G.; Bianchi, F.; Rotili, A.; Costarelli, D.; Seracini, M.; Vinti, G.; Asdrubali, F.; Evangelisti, L. A Model for the Improvement of Thermal Bridges Quantitative Assessment by Infrared Thermography. Appl. Energy 2018, 211, 854–864. [Google Scholar] [CrossRef]
  17. Madding, R. Finding R-Values of Stud-Frame Constructed Houses with IR Thermography. Inframation 2008, 9, 261–277. [Google Scholar]
  18. Tejedor, B.; Lucchi, E.; Nardi, I. Application of Qualitative and Quantitative Infrared Thermography at Urban Level: Potential and Limitations. In New Technologies in Building and Construction: Towards Sustainable Development; Springer: Berlin/Heidelberg, Germany, 2022; pp. 3–19. [Google Scholar]
  19. Shariq, M.H.; Hughes, B.R. Revolutionising Building Inspection Techniques to Meet Large-Scale Energy Demands: A Review of the State-of-the-Art. Renew. Sustain. Energy Rev. 2020, 130, 109979. [Google Scholar] [CrossRef]
  20. Zhang, D.; Zhan, C.; Chen, L.; Wang, Y.; Li, G. Review of Unmanned Aerial Vehicle Infrared Thermography (UAV-IRT) Applications in Building Thermal Performance: Towards the Thermal Performance Evaluation of Building Envelope. Quant. InfraRed Thermogr. J. 2025, 22, 266–296. [Google Scholar] [CrossRef]
  21. Benz, A.; Taraben, J.; Debus, P.; Habte, B.; Oppermann, L.; Hallermann, N.; Voelker, C.; Rodehorst, V.; Morgenthal, G. Framework for a UAS-Based Assessment of Energy Performance of Buildings. Energy Build. 2021, 250, 111266. [Google Scholar] [CrossRef]
  22. Rakha, T.; Gorodetsky, A. Review of Unmanned Aerial System (UAS) Applications in the Built Environment: Towards Automated Building Inspection Procedures Using Drones. Autom. Constr. 2018, 93, 252–264. [Google Scholar] [CrossRef]
  23. Zhang, X.; Garzulino, A.; Lucchi, E. Optimized Workflow for Drone-Assisted Quantitative Thermography in Urban Scale Energy Management. Proc. J. Phys. Conf. Ser. 2025, 3140, 062015. [Google Scholar] [CrossRef]
  24. Ficapal, A.; Mutis, I. Framework for the Detection, Diagnosis, and Evaluation of Thermal Bridges Using Infrared Thermography and Unmanned Aerial Vehicles. Buildings 2019, 9, 179. [Google Scholar] [CrossRef]
  25. Mayer, Z.; Epperlein, A.; Vollmer, E.; Volk, R.; Schultmann, F. Investigating the Quality of UAV-Based Images for the Thermographic Analysis of Buildings. Remote Sens. 2023, 15, 301. [Google Scholar] [CrossRef]
  26. Marand, S.A.S.; Mahmoodzadeh, M.; Mukhopadhyaya, P. UAV-Based Infrared Thermography for Qualitative and Quantitative Building Energy Assessment: A Review. Energies 2026, 19, 1776. [Google Scholar] [CrossRef]
  27. Bayomi, N.; Nagpal, S.; Rakha, T.; Fernandez, J.E. Building Envelope Modeling Calibration Using Aerial Thermography. Energy Build. 2021, 233, 110648. [Google Scholar] [CrossRef]
  28. Zhang, D.; Zhan, C.; Chen, L.; Wang, Y.; Li, G. An In-Situ Detection Method for Assessing the Thermal Transmittance of Building Exterior Walls Using Unmanned Aerial Vehicle–Infrared Thermography (UAV-IRT). J. Build. Eng. 2024, 91, 109724. [Google Scholar] [CrossRef]
  29. Videras-Rodríguez, M.; López-Cabeza, V.P.; Gómez-Melgar, S.; Andújar-Márquez, J.M. Comparative Assessment of Quantitative Infrared Thermography Approaches for Experimental Thermal Transmittance Determination Using UAVs. Build. Environ. 2026, 294, 114359. [Google Scholar] [CrossRef]
  30. Dall’O’, G.; Sarto, L.; Panza, A. Infrared Screening of Residential Buildings for Energy Audit Purposes: Results of a Field Test. Energies 2013, 6, 3859–3878. [Google Scholar] [CrossRef]
  31. Albatici, R.; Tonelli, A.M.; Chiogna, M. A Comprehensive Experimental Approach for the Validation of Quantitative Infrared Thermography in the Evaluation of Building Thermal Transmittance. Appl. Energy 2015, 141, 218–228. [Google Scholar] [CrossRef]
  32. Lu, X.; Memari, A. Application of Infrared Thermography for In-Situ Determination of Building Envelope Thermal Properties. J. Build. Eng. 2019, 26, 100885. [Google Scholar] [CrossRef]
  33. McClellan, T.M.; Pedersen, C.O. Investigation of Outside Heat Balance Models for Use in a Heat Balance Cooling Load Calculation Procedure; American Society of Heating, Refrigerating and Air-Conditioning Engineers: Peachtree Corners, GA, USA, 1997. [Google Scholar]
  34. BS EN ISO 6781-1:2023; Performance of Buildings—Detection of Heat, Air and Moisture Irregularities in Buildings by Infrared Methods. 2023.
  35. Peel, M.C.; Finlayson, B.L.; McMahon, T.A. Updated World Map of the Köppen-Geiger Climate Classification. Hydrol. Earth Syst. Sci. 2007, 11, 1633–1644. [Google Scholar] [CrossRef]
  36. Nardi, I.; Lucchi, E. In Situ Thermal Transmittance Assessment of the Building Envelope: Practical Advice and Outlooks for Standard and Innovative Procedures. Energies 2023, 16, 3319. [Google Scholar] [CrossRef]
  37. Nardi, I.; Lucchi, E.; de Rubeis, T.; Ambrosini, D. Quantification of Heat Energy Losses through the Building Envelope: A State-of-the-Art Analysis with Critical and Comprehensive Review on Infrared Thermography. Build. Environ. 2018, 146, 190–205. [Google Scholar] [CrossRef]
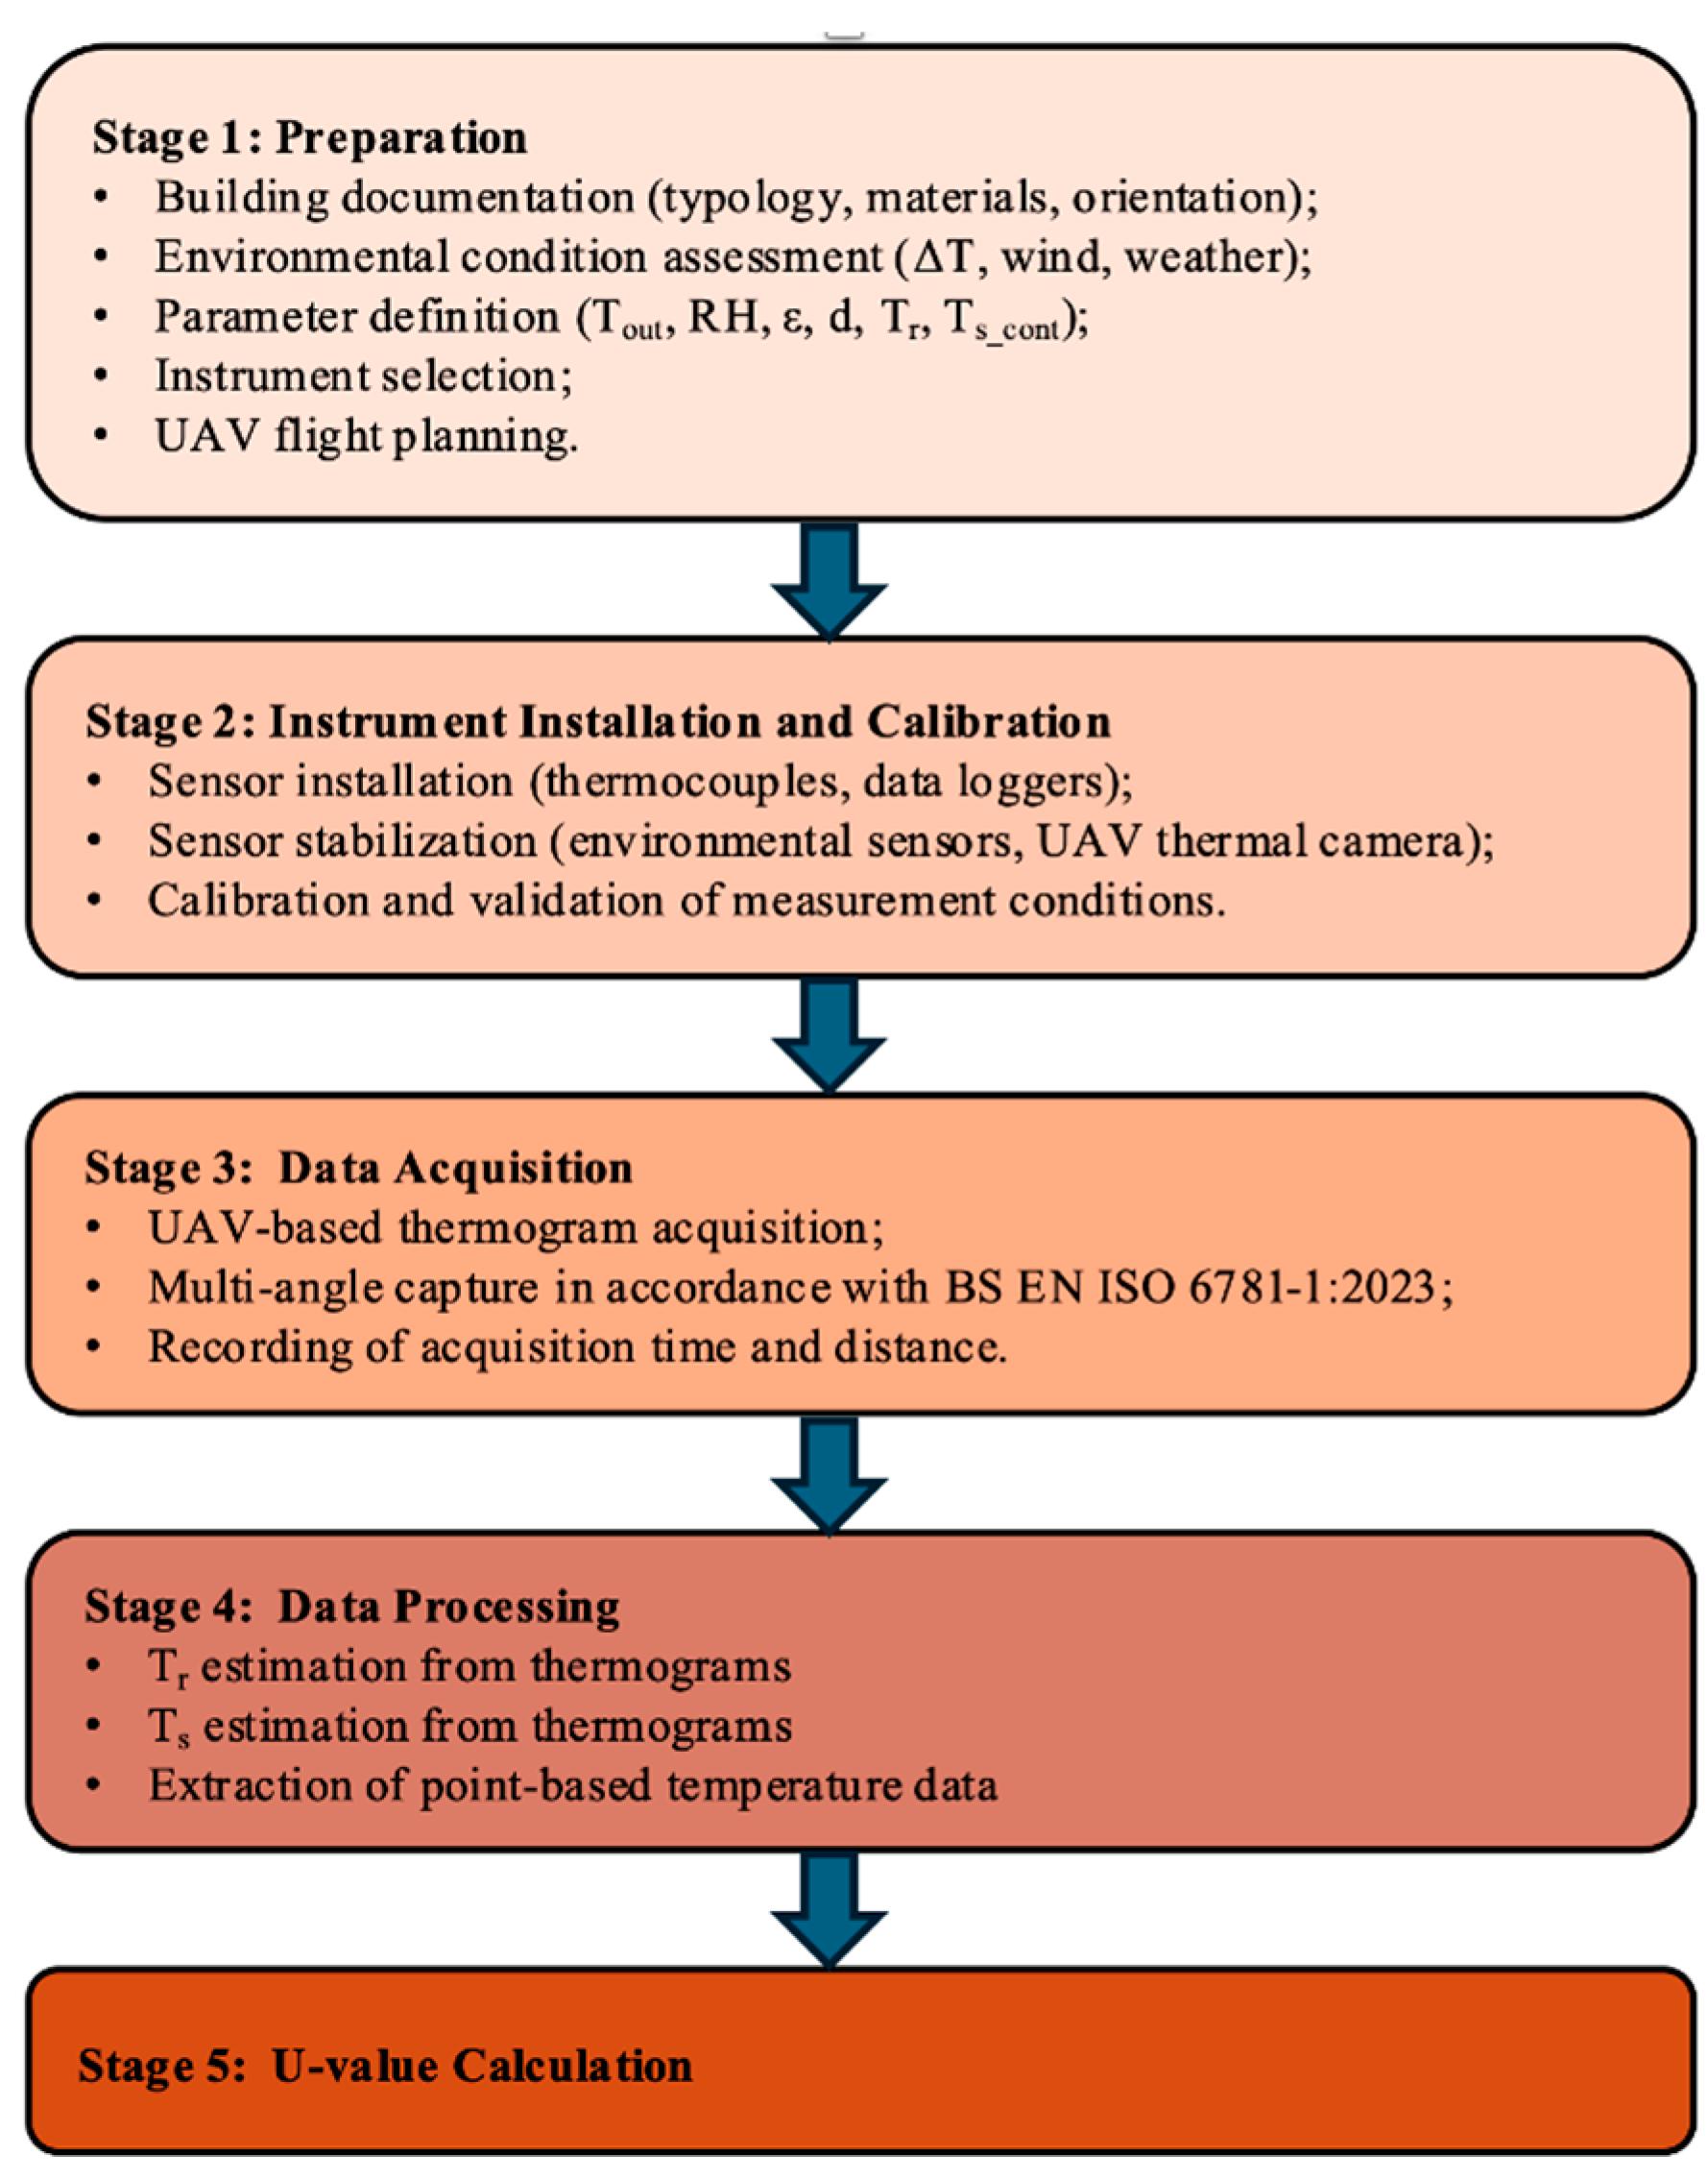
Figure 1. UAV-QIRT Workflow (source: Authors’ elaboration).
Buildings 16 02567 g001
Figure 2. T r e f l acquisition scheme according to BS EN ISO 6781-1:2023 standard (1 IRT camera, 2 reflected heat source, 3 target, α angle of reflection, β angle of incidence).
Buildings 16 02567 g002
Figure 3. Building surveyed, located in Chiaravalle, Milan (Italy). The red arrow indicates the detected section (source: Authors’ elaboration).
Buildings 16 02567 g003
Figure 4. Case study building. (a) Measurement area (red); (b) UAV-based measurement of the study area (source: Authors’ elaboration).
Buildings 16 02567 g004
Figure 5. Instruments: (a) DJI Matrice 300 RTK; (b) DJI Zenmuse H20T; (c) HOBO UX100-014M (Thermocouple); (d) HOBO MX1101 (source: Authors’ elaboration).
Buildings 16 02567 g005
Figure 6. The three thermograms were recorded for the calculation of T r e f l : (a) one at 15° to the left; (b) one in the chosen direction; (c) one at 15° to the right (source: Authors’ elaboration).
Buildings 16 02567 g006
Figure 7. The three thermograms were recorded for the calculation of T s , out : (a) one at 15° to the left; (b) one in the chosen direction; (c) one at 15° to the right (source: Authors’ elaboration).
Buildings 16 02567 g007
Figure 8. Sensitivity analysis of the U-value calculated using Formula (13) under controlled variations in v , T s , out , and T out (source: Authors’ elaboration).
Buildings 16 02567 g008
Table 1. Parameters and Technical Specifications of the Instruments (source: Authors’ elaboration).
InstrumentRangeResolutionAccuracy
HOBO Onset MX1101
(Manufacturer: LI-COR HOBO Data Loggers, MA, USA)
−20° to 70 °C0.024 °C±0.21 °C
HOBO Onset UX100-014M (Thermocouple)
(Manufacturer: LI-COR HOBO Data Loggers, MA, USA)
−260° to 1370 °C0.04 °C±0.7 °C
DJI Zenmuse H20T
(Manufacturer: DJI, China)
−40° to 550 °C640 × 512 pixels±2° or ±2%
Laser Rangefinder of DJI Zenmuse H20T
(Manufacturer: DJI, China)
3 to 1200 m905 nm±0.2 m + (d × 0.15%)
Table 2. Input parameters for the UAV-QIRT U-value calculation (source: Authors’ elaboration).
ParameterSymbolMeasured ValueUnitAccuracy
Indoor air temperature T in 21.77°C±0.21 °C
Outdoor air temperature T out 12.07°C±0.21 °C
Exterior wall surface temperature T s , out 10.97°C±2° or ±2%
Reflected apparent temperature T refl 10.67°C±2° or ±2%
Reference contact surface temperature T s , cont 10.20°C±0.7 °C
Outdoor dew point T dewp 6.53°C±0.21 °C
Outdoor relative humidity R H 68.78%±2%
Wind speed v 1.6m/snot specified
Table 3. U-values calculated per formula (source: Authors’ elaboration).
AuthorsFormulaPhysical AssumptionRadiation TreatmentObserved Thermal RegimeU-Value (W/m2K)Interpretation
Dall’O’ et al.(9)Convection-dominated heat transferRadiation neglected Radiatively   dominated   fa ç ade   cooling   ( T s , o u t < T o u t )−1.35Physically inconsistent under radiative cooling conditions
Albatici et al.(11)Simplified radiative–convective balance Radiation   approximated   using   T o u t Radiatively   influenced   surface   cooling   with   sky   effect   ( T s , o u t < T o u t )−1.25Incomplete representation of outdoor radiative field under clear-sky conditions
Bayomi et al.(12)Indoor surface heat balanceSimplified indoor radiative exchangeRadiatively biased surface temperature field with weak air–surface coupling−1.38Sensitive to surface temperature uncertainty and non-steady-state effects
Zhang et al.(13)Complete radiative–convective balanceSky, air, and ground radiation explicitly includedMixed radiative–convective regime with dominant sky radiation effects0.57Thermodynamically consistent under non-uniform outdoor radiative boundary conditions
Table 4. Key variables for UAV-based U-value estimation and measurement requirements (source: Authors’ elaboration).
ParameterPhysical Role in External Energy BalanceMeasurement Strategy in UAV-U-Value WorkflowCriticality
T i n Driving potential for conductive heat transfer through the envelopeIn situ indoor air temperature sensors (shielded, steady-state logging during UAV acquisition window)High
T o u t Outdoor air temperature defining the air-side convective boundary condition and contributing to the estimation of sky and atmospheric radiative terms UAV   IRT   imaging   with   calibrated   radiometric   correction   ( ε ,   T r e f l , atmospheric compensation, multi-angle filtering)
Data must be synchronized with meteorological data
High
T s , o u t Radiometrically derived external surface temperature; primary state variable controlling external boundary energy balance UAV   infrared   thermography   with   full   radiometric   correction   ( ε ,   T r e f l , atmospheric transmission). Requires careful control of viewing angle, flight geometry, and sky/ground background contaminationVery high
T s k y Effective   radiative   temperature   of   the   sky   vault   controlling   long - wave   radiative   cooling .   Governs   long - wave   radiative   cooling   toward   the   atmosphere ;   cannot   be   represented   by   T o u t Estimated from pyrgeometer measurements, empirical sky models (clear-sky emissivity models), or radiative transfer approximations based on humidity and cloud coverVery high
T e v n Effective radiative temperature of surrounding environment (ground, vegetation, urban fabric)Radiative environment estimation via hemispherical temperature weighting or simplified ambient radiative assumption calibrated on site conditionsHigh
v Controls convective heat transfer coefficient and modifies surface–air coupling strengthOn-site anemometer measurements collocated with UAV flight campaign; temporal averaging consistent with image acquisition windowMedium
h c Convective heat transfer coefficient; non-directly measurable parameter closing air–surface coupling Derived   from   empirical   correlations   h c = f ( v ) (e.g., flat-plate or urban façade correlations); sensitivity-tested within uncertainty boundsVery high
ε Surface emissivity controlling long-wave radiative exchange accuracyIn situ material characterization or literature-based assignment with uncertainty range; sensitivity propagation requiredVery high
T r e f l Apparent reflected temperature affecting radiometric surface retrievalCrumpled foil method or sky-dome approximation; included in UAV radiometric calibration workflowVery high
Atmospheric parameters (RH, air temperature profile, path length)Control radiative transfer between surface and UAV sensorMeteorological measurements + radiative transfer model (e.g., MODTRAN-based or simplified attenuation model)Very high
Sky   View   Factor   ( SVF ) / F s k y Geometric control of radiative exchange with sky vs. surrounding environmentDerived from UAV imagery-based hemispherical analysis or urban morphology models (3D reconstruction/DSM-based estimation)High
F e n v   = 1 F s k y Geometric partition of surrounding radiative exchangeDerived parameter from SVF estimationHigh
Disclaimer/Publisher’s Note: The statements, opinions and data contained in all publications are solely those of the individual author(s) and contributor(s) and not of MDPI and/or the editor(s). MDPI and/or the editor(s) disclaim responsibility for any injury to people or property resulting from any ideas, methods, instructions or products referred to in the content.