Article

Quantifying the CO2 Reduction Potential of CO2 Curing over Autoclave Curing for Calcium Silicate Boards: A Carbon Footprint Quantification

1
China Building Materials Academy Co., Ltd., Beijing 100024, China
2
Sinoma Energy Conservation (Wuhan) Co., Ltd., Wuhan 430200, China
*
Author to whom correspondence should be addressed.
Buildings 2026, 16(13), 2566; https://doi.org/10.3390/buildings16132566
Submission received: 13 May 2026 / Revised: 10 June 2026 / Accepted: 11 June 2026 / Published: 27 June 2026
(This article belongs to the Section Building Materials, and Repair & Renovation)

Abstract

Calcium silicate boards, as a type of prefabricated building component, are widely used in the construction industry. To address the severe challenges posed by global climate change and support the low-carbon transition of the building materials sector, this study quantifies and compares the differences in carbon emissions between traditional autoclave curing and carbon dioxide mineralization curing during the production of calcium silicate boards, and conducts an uncertainty analysis. Using a project-based accounting methodology and incorporating actual CO2 sequestration measurement data obtained via the weighing method, this study calculated carbon emissions during the calcium silicate board production process and performed scenario analysis to account for uncertainties in emission factors. The study found that, compared to autoclave curing production lines, CO2 mineralization curing production lines can reduce carbon emissions by approximately 1007 t CO2; when CO2 sequestration is factored in, the reduction is approximately 3097 t CO2. Even under the most pessimistic scenario, CO2 mineralization curing production lines can reduce carbon emissions by at least 977 t CO2, demonstrating significant emission reduction benefits. This study provides regionally representative quantitative data that supports the low-carbon transition of calcium silicate boards and holds significant practical implications for promoting the reduction in embodied carbon emissions in the building materials industry and achieving the “dual carbon” goals.

1. Introduction

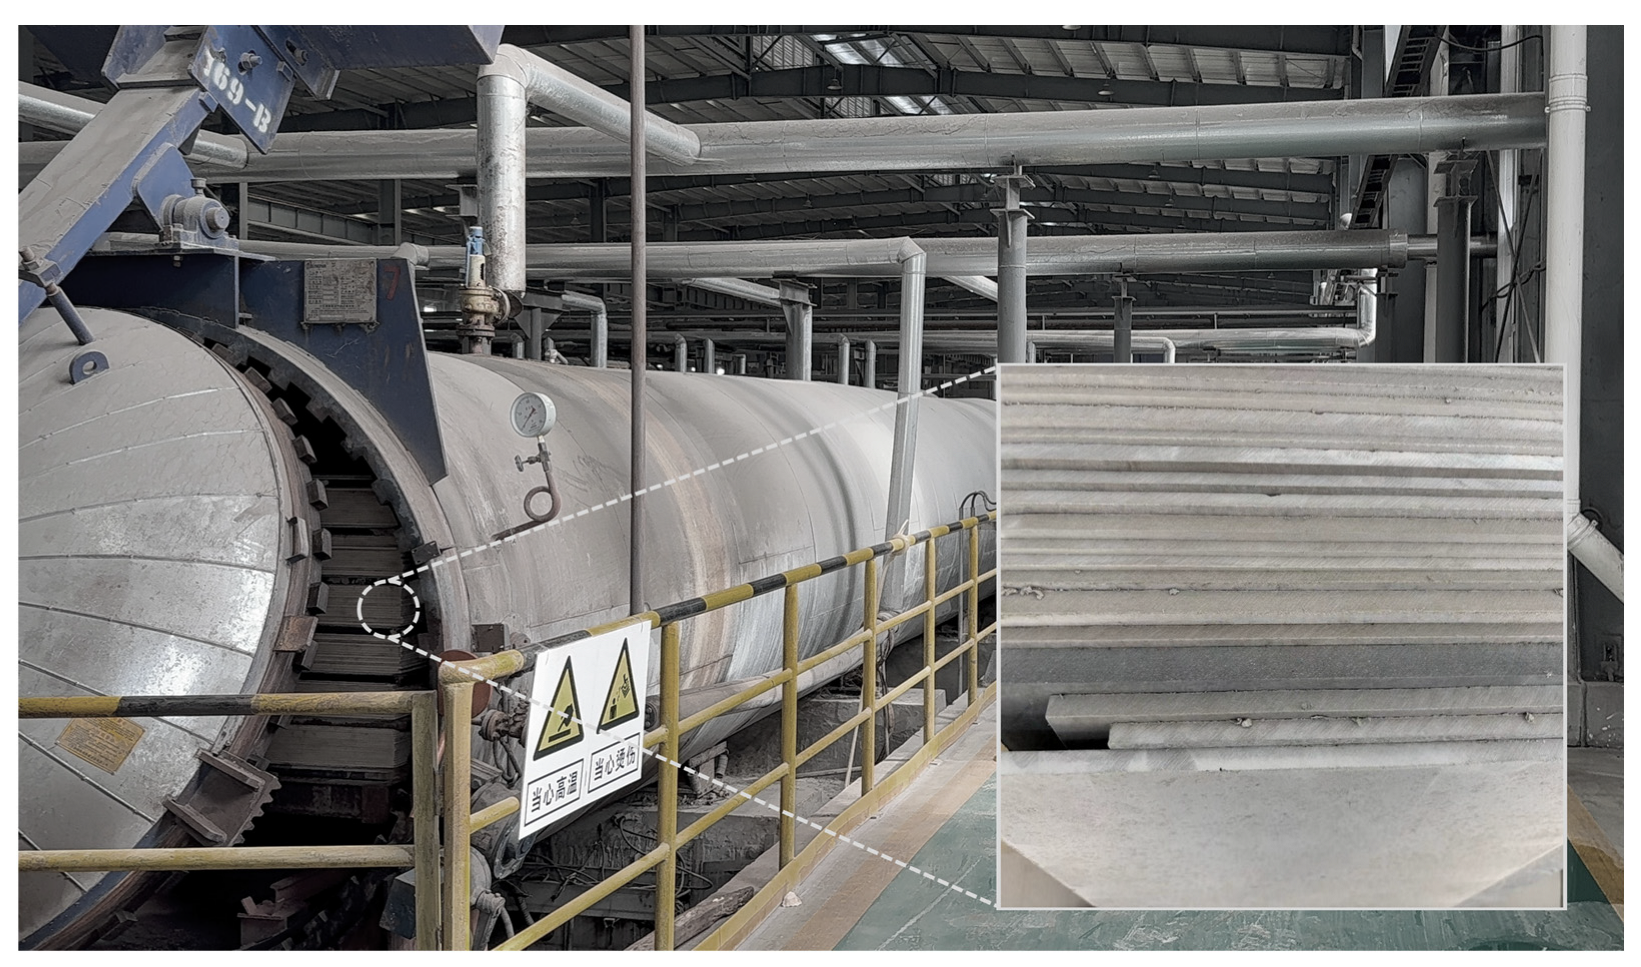
Calcium silicate board, a key non-structural building envelope material, is primarily composed of siliceous and calcareous cementitious materials, reinforced with inorganic minerals or cellulose fibers, and is traditionally manufactured using an energy-intensive autoclave curing process [1,2]. Due to their advantages of being lightweight yet high-strength, fire-resistant, environmentally friendly (formaldehyde-free), and highly durable, they are widely used in interior and exterior walls of buildings as well as in key projects such as aerospace applications [1,3]. In China alone, there are over 120 calcium silicate board manufacturers with more than 240 production lines, and total production capacity has exceeded 1.2 billion m2 [4]. Currently, the mainstream production process for calcium silicate boards is the Hatschek process, which was patented by Hatschek in 1900 [5]. It is a semi-continuous process comprising three steps: the formation of a thin slurry, the shaping of the green body, and the curing of the green body. Among these, autoclave curing is the critical stage for developing the board’s mechanical properties (Figure 1). Under high-temperature, high-pressure conditions and in a saturated steam environment, the siliceous and calcareous raw materials in the green body undergo hydration reactions to form tobermorite, which, together with the fibers, provides the foundation for strength [3,6]. Furthermore, gas–liquid expansion within the green body can easily lead to bubbling or structural porosity, while issues such as grain coarsening, fiber degradation, and surface carbonization also exist [7]. Shrinkage stresses during the pressure-release phase can easily cause edge cracking, and soluble salts in the raw materials may migrate to the surface, resulting in salt efflorescence [8]. At the same time, the curing of the green body typically employs an autoclave curing process. This is the primary stage in the entire production process that consumes fossil fuels, requiring approximately 6–15 h of steam supplied by fossil fuels [3,9]. This is one of the primary reasons for the persistently high carbon emissions associated with conventional curing processes [10]. These limitations result in a significant carbon footprint for building materials that could otherwise be environmentally friendly. Therefore, integrating carbon dioxide (CO2) mineralization and solidification technology into the production cycle—as an alternative to traditional autoclave processes—offers a transformative solution to the inherent conflict between large-scale production in the construction industry and stringent carbon neutrality goals. This technological shift not only enhances the physicochemical properties of calcium silicate boards but also transforms them into effective carbon sinks within the built environment [11].
In recent years, the pace of global industrialization has accelerated further, leading to a significant increase in greenhouse gas emissions and an increasingly severe climate crisis [12]. As a key technology for the transition to a green, low-carbon economy, the CO2 mineralization and sequestration process has attracted widespread attention [13]. By leveraging the ability of CO2 to rapidly undergo mineralization reactions with cementitious materials, this technology achieves both CO2 sequestration and resource utilization while enhancing the mechanical properties and durability of the final products. It is gradually progressing from laboratory research to industrial application [14,15]. Existing research has confirmed that the relationship between mineralization curing and the optimization of carbon sequestration and mechanical properties is not a simple linear one. Meng et al. [16] argue that appropriate mineralization curing can effectively enhance the mechanical properties of cement-based materials and improve their microstructure. However, excessive mineralization curing reduces the alkalinity of cement-based materials, leading to corrosion of embedded reinforcing bars. Extending this mechanism to sheet products, research by Cabral et al. [17] has shown that mineralization curing can increase the fracture modulus and elastic modulus of cement-bonded panels, significantly improving their physical, mechanical, and durability properties. This is especially true for fiber-reinforced panels; research by Filomeno et al. [18] shows that mineralization curing can increase the density of fiber-reinforced cement panels, significantly improving their mechanical properties. Compared to conventional steam curing in autoclaves, CO2 mineralization curing offers significant synergistic technical, environmental, and economic advantages in the production of calcium silicate boards: (i) It is compatible with existing autoclaves, requiring only the addition of gas injection and concentration-pressure monitoring modules, resulting in low production line retrofitting costs. Furthermore, the electrical energy consumed to maintain normal operation of this equipment is negligible, and no external water or natural gas is required. (ii) The mineralization reaction is exothermic, providing thermal energy for the curing of green bodies without the need for an external heat source [19,20]. (iii) The humidity required for the mineralization reaction can be supplied by the residual moisture remaining after the green body’s pre-curing, eliminating the need for external steam and significantly reducing the system’s thermal and humidity loads. (iv) The rate of mineralization is significantly higher than that of synthetic tobermorite produced via autoclave curing; shortening the curing cycle also yields calcium silicate boards with good performance, and single-machine production capacity has increased significantly [21]. (v) The calcium carbonate (CaCO3) crystals generated by the mineralization reaction can fill the pores in the calcium silicate board matrix, significantly improving the product’s flexural and compressive strengths and substantially enhancing its durability [22,23]. (vi) Mineralization curing reduces energy consumption and sequesters CO2, simultaneously achieving carbon emission reduction and the resource utilization of carbon [23]. Replacing traditional autoclave curing with CO2 mineralization curing not only significantly reduces energy consumption and enhances panel strength but also stabilizes and solidifies CO2 within the product [23]. This approach achieves “treating waste with waste” and low-carbon emissions, providing a new technical option for emission reduction in calcium silicate board production [24,25].
Given this context, this research takes a calcium silicate board production line in southwest China with an annual output of 5 million m2 (based on 6 mm boards) as its research subject. The study systematically quantifies carbon emissions across the entire production process of calcium silicate boards, establishing the traditional autoclave curing method as the baseline scenario and the CO2 mineralization curing method as the project scenario. The study focuses on comparing and analyzing the differences between the baseline scenario and the project scenario in terms of carbon emission intensity and carbon reduction capacity, and establishes a refined carbon emission accounting model for the mineralization curing process of calcium silicate boards. This study aims to provide a reliable scientific basis for advancing technological upgrades in the calcium silicate board industry, thereby directly accelerating the decarbonization of the construction industry’s supply chain. By transforming traditional building components into active carbon sinks, this study offers actionable data and strategic insights to relevant construction companies, helping them develop low-carbon development roadmaps aligned with global net-zero emissions targets for the building sector.

2. Materials and Methods

2.1. Goal and Scope Definition

This study aims to quantify and compare the differences in net carbon emissions between traditional autoclave curing and CO2 mineralization curing in the production of calcium silicate boards. A production line in Southwest China with an annual output of 5 million m2 (based on 6 mm boards) serves as the case study. A functional unit is defined as a calcium silicate board measuring 1 m3, 6 mm thick, and with a bulk density of 1.35 t/m3.
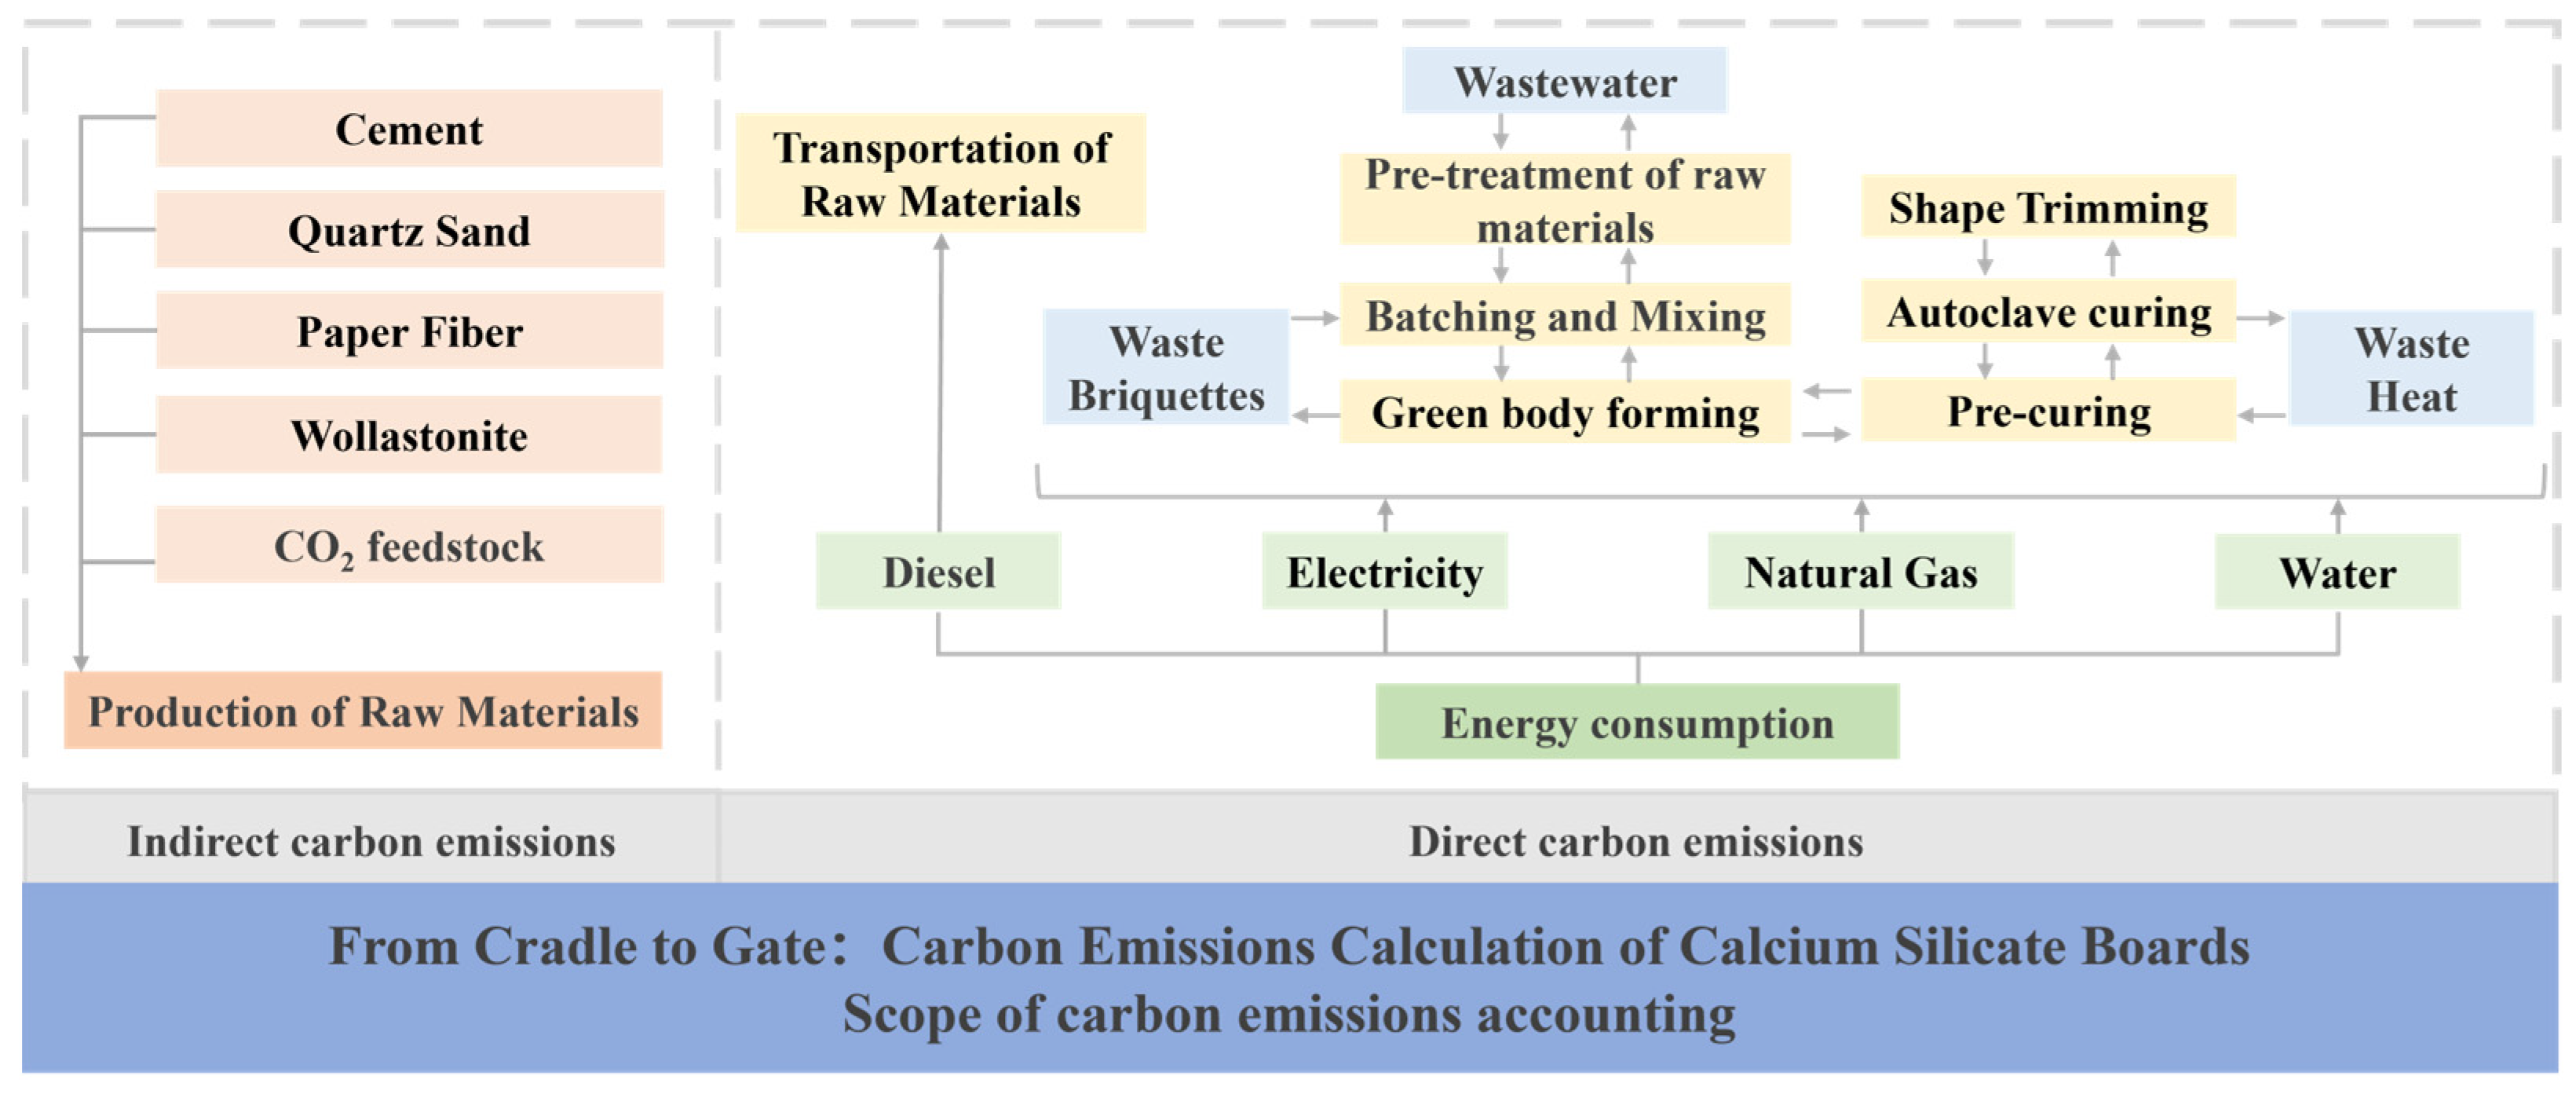
The primary objective of this study is to assess the emission reduction potential of alternative production processes. The accounting methodology for carbon capture and utilization projects, CO2 Utilization in Concrete Production [26], defines the accounting boundary as the carbon footprint (embodied carbon, A1–A3) of the production stage of building materials [27]. Therefore, this study establishes the project boundary centered on the calcium silicate board production facility, encompassing raw material extraction, raw material transportation, and on-site energy consumption (Figure 2). The baseline scenario employs the conventional autoclave curing process, while the project scenario utilizes the CO2 mineralization curing process. For the CO2 required for mineralization curing, this study treats it as an externally input raw material and includes the carbon emissions generated from its upstream capture, compression, and transportation processes in the project’s emissions, without tracing them back to their upstream sources (such as power plants or cement plants). Wastewater generated during the production process can be recycled after sedimentation, and 100% of the waste raw material is recycled (blend ratio ≤ 10 ωt%). As both are internal to the system, their carbon emissions are not calculated separately.

2.2. Production Process Description

2.2.1. Raw Materials and Energy Consumption

The raw materials used in this production line are cement, quartz sand, paper fibers, wollastonite, and water. In addition, various pieces of equipment consume electrical and thermal energy to maintain the normal operation of the production line. The annual consumption of raw materials and energy during the production process is derived from an actual calcium silicate board production line; specific data are shown in Table 1.

2.2.2. Conventional Autoclave Curing Process

The traditional autoclave curing process involves forming the panels using the Hatschek method, followed by autoclave curing for 6–15 h at 180–220 °C and 0.8–1.2 MPa [6]. In industrial-scale production, the autoclave curing process relies on the injection of saturated steam to simultaneously regulate the temperature, pressure and internal humidity of the reactor. Based on actual factory measurements, this process accounts for approximately 20% of the production line’s total water consumption, all of the natural gas used, and a small amount of electricity consumed by the monitoring and control systems.

2.2.3. CO2 Mineralization Curing Process

The carbon dioxide mineralization and solidification process takes place in a modified autoclave. Compared to autoclave solidification, this process requires no external heat source (since the mineralization reaction is exothermic) and no external steam (as the residual moisture in the green body provides the necessary steam) [28]. Its energy consumption consists solely of the electricity required for gas injection, pressure control, circulation, safety systems, and monitoring, as well as the energy used to compress the carbon dioxide.

2.3. Carbon Emission Factors

This study employs the emission factor method, which is currently the most widely applicable and commonly used method for calculating carbon emissions [29]. The carbon emission factors used in this paper are derived from authoritative sources such as Appendix D of GB/T 51366-2019, Standard for Calculation of Carbon Emissions in Buildings [30], and the National Greenhouse Gas Emission Factor Database [31]. The production stage of raw materials covers not only the carbon emissions from primary raw materials such as cement, quartz sand, and wollastonite, but also the carbon emissions from paper fibers derived from waste paper through secondary processing, as well as the carbon emissions from carbon sources consumed during CO2 mineralization curing. Among these, the production processes for cement, quartz sand, and wollastonite are well-defined, and standard carbon emission factors are available in authoritative databases; specific values are shown in Table 2. The paper fibers used in the actual production of calcium silicate boards are typically pulpboard made from waste paper. Since waste paper is used as a raw material, its inherent carbon emissions—which are generally treated as those of virgin paper—are not included in the carbon emissions of pulpboard. Since paper mills use various types of pulp, and different pulps have different production processes, this results in varying energy consumption. According to GB 31825-2024 Energy Consumption Limits for Pulp and Paper Production per Unit of Product [32], the energy consumption of waste paper pulp is approximately 70 kg CO2/Adt (here, Adt refers to air-dried pulp weighing 1 ton after drying, with 10% moisture content, the same applies below). The energy consumption for drying is approximately 120 kg CO2/Adt. Therefore, the energy consumption for pulpboard is 190 kg CO2/Adt, and the carbon emission factor for pulpboard can be expressed as 190 kg CO2/t. The carbon source consumed in CO2 mineralization and curing must undergo capture, compression, and transportation. Capturing and storing 1 kg of CO2 requires 0.802 MJ of energy, which means that capturing and storing 1 t of CO2 consumes approximately 223 kWh of electricity [33]. Both the transportation of liquid CO2 and the transportation of raw materials are carried out using heavy-duty diesel trucks; the specific carbon emission factors are shown in Table 2.
Raw material procurement follows the principle of “sourcing locally,” relying on a regional supply chain layout to prioritize suppliers located nearby with long-term supply capabilities. Transportation is uniformly carried out using large diesel trucks, with an average transport distance of approximately 200 km [15].

2.4. Carbon Emission Accounting Methodology

The total carbon emissions from a production line with an annual output of 5 million m2 of calcium silicate board are equal to the sum of emissions from raw material extraction and transportation, fossil fuel combustion, purchased electricity, purchased water, and the entire supply chain of purchased carbon sources for all production systems, calculated in accordance with Announcement (1).
E = E m + E f + E h + E w + E C O 2
In the formula, E represents the total carbon emissions from the production line, in units of t CO2. E m represents the total emissions from raw material extraction and transportation, in units of t CO2. E f represents the total emissions from fossil fuel combustion in the production line, in units of t CO2. E h represents the emissions from purchased electricity, in units of t CO2. E w represents the emissions from purchased water, in units of t CO2. And E C O 2 represents the total emissions from the entire supply chain of purchased carbon sources, in units of t CO2.
Calculate the carbon emissions for each of the above stages using the following formulas.
  • Emissions from raw material extraction and transportation
E m = M i e i + e t × ( M i × d i )
In the equation, E m represents the total emissions from raw material extraction and transportation, in units of t CO2. M i represents the annual consumption of raw material i, in units of t. e i represents the carbon emission factor for raw material i, in units of t CO2/t. e t represents the transportation carbon emission factor, in units of t CO2/(t·km); and d i represents the transportation distance of raw material i, in units of km.
2.
Emissions from fossil fuel combustion
E f = F × n × e f
In the formula, E f represents the total emissions from the combustion of fossil fuels on the production line, in units of t CO2. F represents the annual consumption of fossil fuels, in units of Nm3. n represents the average lower heating value of fossil fuels; the lower heating value of natural gas in China is 3561.1 TJ/(108 Nm3) [31]. And e f represents the carbon emission factor for fossil fuels, in units of t CO2/TJ.
3.
Emissions from purchased electricity and water
E h = H × e h
E w = W × e w
In the equation, E h and E w represent the total emissions from purchased electricity and water, respectively, in units of t CO2. H represents annual electricity consumption in kWh, W represents annual water consumption in t. e h represents the carbon emission factor for electricity in units of t CO2/kWh. And e w represents the carbon emission factor for water in units of t CO2/t.
4.
Emissions across the entire supply chain of purchased carbon sources
E C O 2 = E C O 2 , c & c + E C O 2 , t
E C O 2 · c & c = Q C O 2 , c o n s u m p t i o n × 223   k W h / t × e h
E C O 2 , t = e t × Q C O 2 , c o n s u m p t i o n × d C O 2
In the equation, E C O 2 , c & c represents the total emissions from carbon capture and compression, in units of t CO2. E C O 2 , t represents the total emissions from carbon transportation, in units of t CO2. Q C O 2 , c o n s u m p t i o n represents the annual CO2 consumption of the production line, in units of t. And d C O 2 represents the distance of CO2 transportation, in units of km.
The net carbon emissions of the project scenario are calculated using Equation (9). Here, P E n e t represents the net carbon emissions of the project scenario, in tons. And P E C O 2 represents the total carbon emissions of the project scenario, in tons.
P E n e t = P E C O 2 Q C O 2 , s e q u e s t r a t e d

2.5. Measurement of CO2 Sequestration Rate

2.5.1. CO2 Mineralization Curing of Calcium Silicate Boards

To clarify the CO2 sequestration rate of calcium silicate boards and estimate the CO2 consumption during mineralization curing, this study conducted mineralization curing experiments under laboratory conditions. Due to confidentiality agreements regarding the production line, destructive microscopic characterization of the mineralization products was not possible; therefore, the mass change in the test specimens before and after mineralization was directly measured using the weighing method to calculate the CO2 sequestration amount. This method has been widely applied in published literature. In this study, three wet green bodies measuring 100 mm × 100 mm × 6 mm, provided by the production line and cut from material that had not undergone a pre-curing process after molding, were used for testing. First, the green bodies were dried at 105 °C for 10 min to simulate the production line’s pre-curing process, then the dried green bodies were weighed, and the data were recorded as m 0 i . The dried green bodies were placed in a mineralization reactor and cured for 24 h under conditions of 99.9% CO2 concentration and atmospheric pressure, then the CO2-sequestered green bodies were weighed after curing, and the data were recorded as m i . Additionally, the moisture evaporated due to the exothermic nature of the mineralization reaction was collected using absorbent paper and weighed; this data is denoted as m w . The CO2 sequestration rate of the calcium silicate board was calculated using Equation (10) [34,35].
The CO2 consumption of a calcium silicate board production line with an annual output of 5 million m2 is calculated using Equations (11) and (12). Q C O 2 , s e q u e s t r a t e d represents the annual CO2 sequestration capacity of the production line, measured in tons. ρ is the bulk density of calcium silicate board, in tons per cubic meter. Q C O 2 , c o n s u m p t i o n represents the annual CO2 consumption of the production line, in tons. φ represents the mineralization efficiency, and in this study, a default value of 60% is used to calculate the annual CO2 consumption [26].
ω = m i + m w m 0 i m 0 i × 100 %
Q C O 2 , s e q u e s t r a t e d = ρ × 500 × 10 4   m 2 × 6 × 10 3   m × ω
Q C O 2 , c o n s u m p t i o n = Q C O 2 , s e q u e s t r a t e d / φ

2.5.2. CO2 Mineralization Curing of Cement Paste

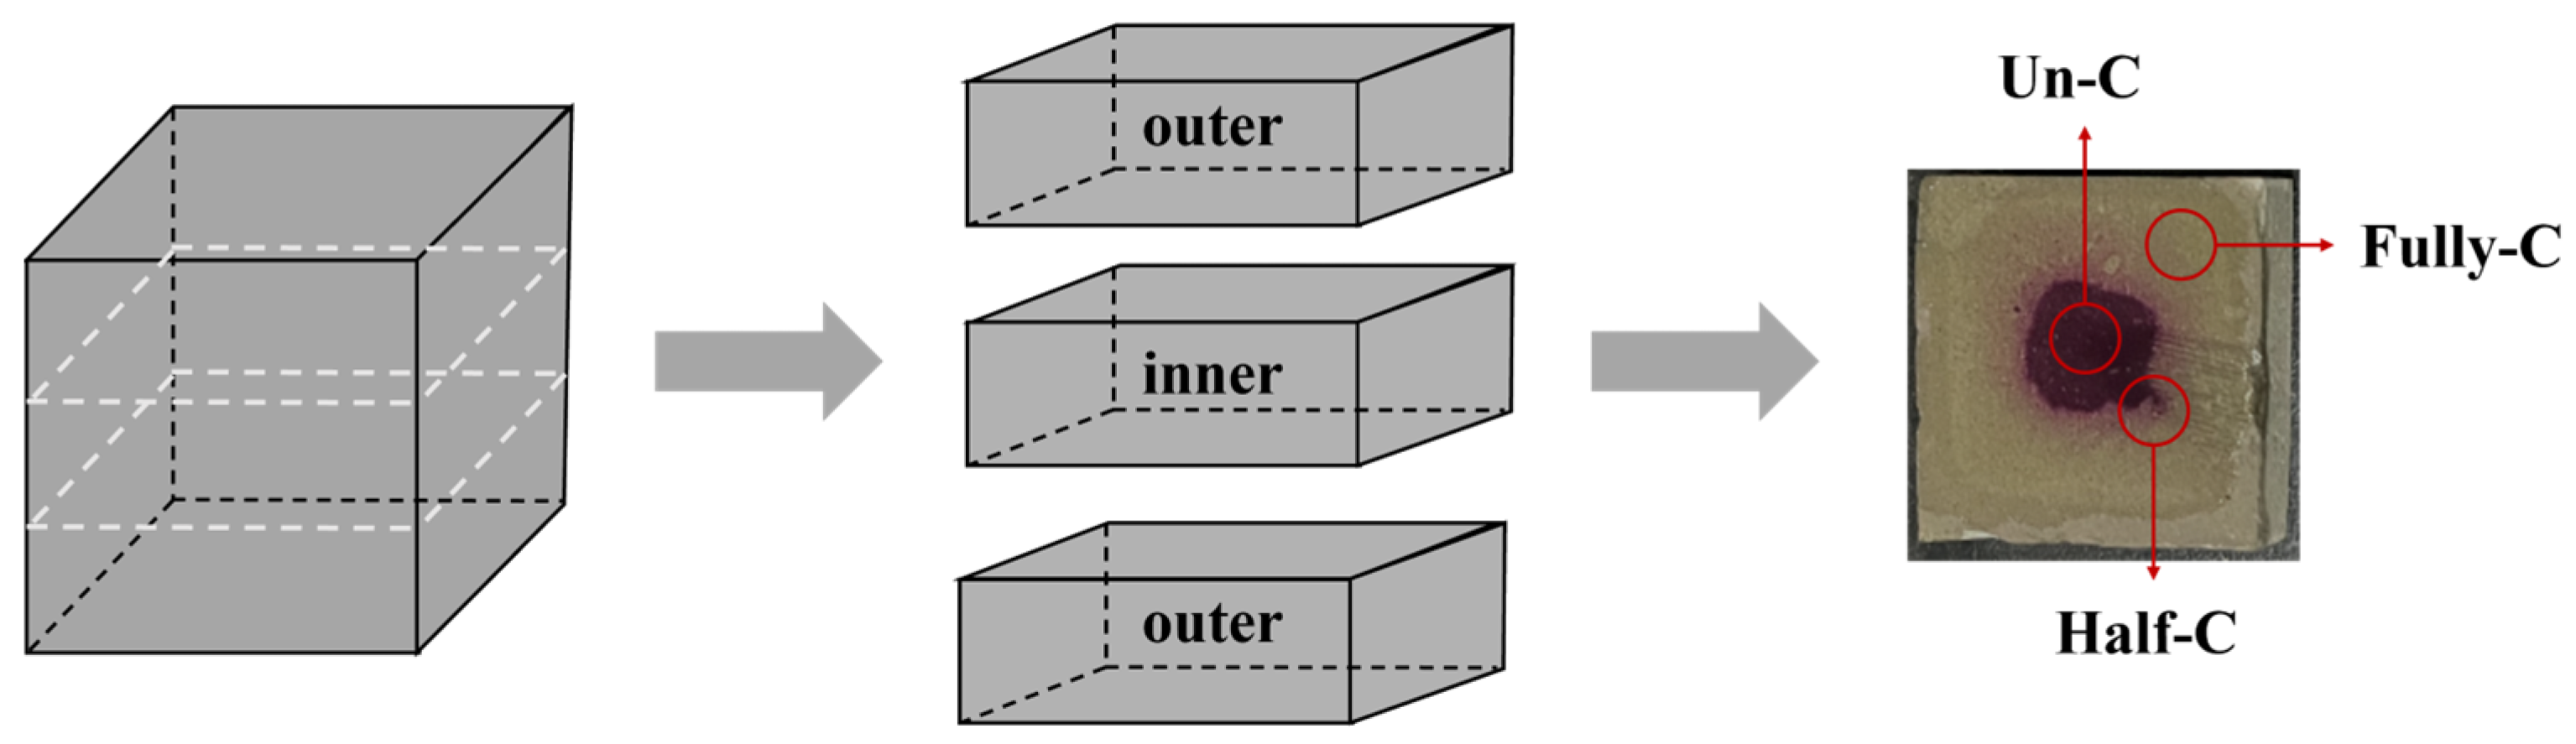
Subject to the confidentiality agreement, this study conducted mineralization and solidification tests on cement paste specimens to verify the feasibility of the carbon mineralization and solidification process. Cement paste specimens measuring 30 mm × 30 mm × 30 mm were prepared with a water–cement ratio of 0.45. After standard curing for 24 h, the specimens were dried at 60 °C for 8 h as a pretreatment (at this point, the residual water–cement ratio was approximately 0.214, simulating the precuring process). Subsequently, the pretreated specimens were placed in an environment with a CO2 concentration of 99.9% and subjected to CO2 mineralization curing at CO2 pressures of 0.1, 0.2, 0.3, and 0.4 MPa. The CO2 mineralization curing times were set at 1, 2, 4, 6, 8, and 16 h. The specimens were named according to the “C–pressure–time format”. The CO2 sequestration rate was calculated using Equation (10). Specimens that had undergone pretreatment but were not carbonized served as the control group (R). For specimen C-0.3-8, microscopic examinations were conducted on the different regions. All samples were taken from the interior of the test blocks to ensure the representativeness of the test results. (As shown in Figure 3, the image on the right shows a test specimen after the inner layer was sprayed with a 1% phenolphthalein-ethanol solution. The colorless outer region is defined as the fully carbonated zone, the red inner region as the uncarbonated zone, and the transitional region just inside the outer layer as the half-carbonated zone.)
XRD analysis was performed using a Bruker D8 Advance (Bruker, Karlsruhe, Germany) with a scan range of 5–70° and a scan rate of 10 °/min. Thermal analysis of the samples was conducted using a TA Q600 thermal gravimetric analyzer (TA Instruments, New Castle, DE, USA) with a temperature range of 20–1000 °C and a heating rate of 10 °C/min. Functional group analysis was performed using a Thermo Fisher Nicolet IS5 Fourier transform infrared (FTIR) spectrometer (manufactured by Thermo Fisher Scientific, Waltham, MA, USA), employing the potassium bromide (KBr) pellet method, with a measurement range of 400–4000 cm−1 and a resolution of 4 cm−1.

2.6. Scenario and Uncertainty Analysis

To address uncertainties in key parameters such as power generation emission factors, transportation distances for raw materials and carbon sources, mineralization efficiency [36], and CO2 sequestration rate, this study employs a scenario analysis approach, establishing three scenarios—Backward, Conservative, and Progressive production levels—to systematically assess the potential impact of these parameters on net carbon emissions [37]. Table 3 shows the values of each factor under different production levels.

3. Results and Discussion

3.1. CO2 Sequestration Experiment

3.1.1. CO2 Sequestration of Calcium Silicate Boards

The results of the CO2 mineralization curing test on calcium silicate boards are shown in Table 4.
The calculation yielded a CO2 sequestration rate ω of 5.16% for this board blank. This result is significantly lower than the range reported in the literature [35]. Possible reasons include: (i) The dimensions of the test board blank did not match the scaled-down version of the production line product, resulting in a significant reduction in the reactive calcium content per unit area [23]. (ii) The experimental mineralization conditions could not achieve the pressure required for industrial-scale curing, leading to a significant reduction in CO2 penetration into the board blank [38]. (iii) The test slabs did not utilize mineralization activators containing high calcium and magnesium components, resulting in a significant reduction in the components participating in the mineralization reaction within the slabs [39]. Due to production line confidentiality agreements and the limitations of single-test conditions, this study could only obtain valid data from a single group and was unable to perform statistical error analysis. Therefore, these results should be interpreted with caution, and their reliability should be verified.

3.1.2. CO2 Sequestration of Cement Paste

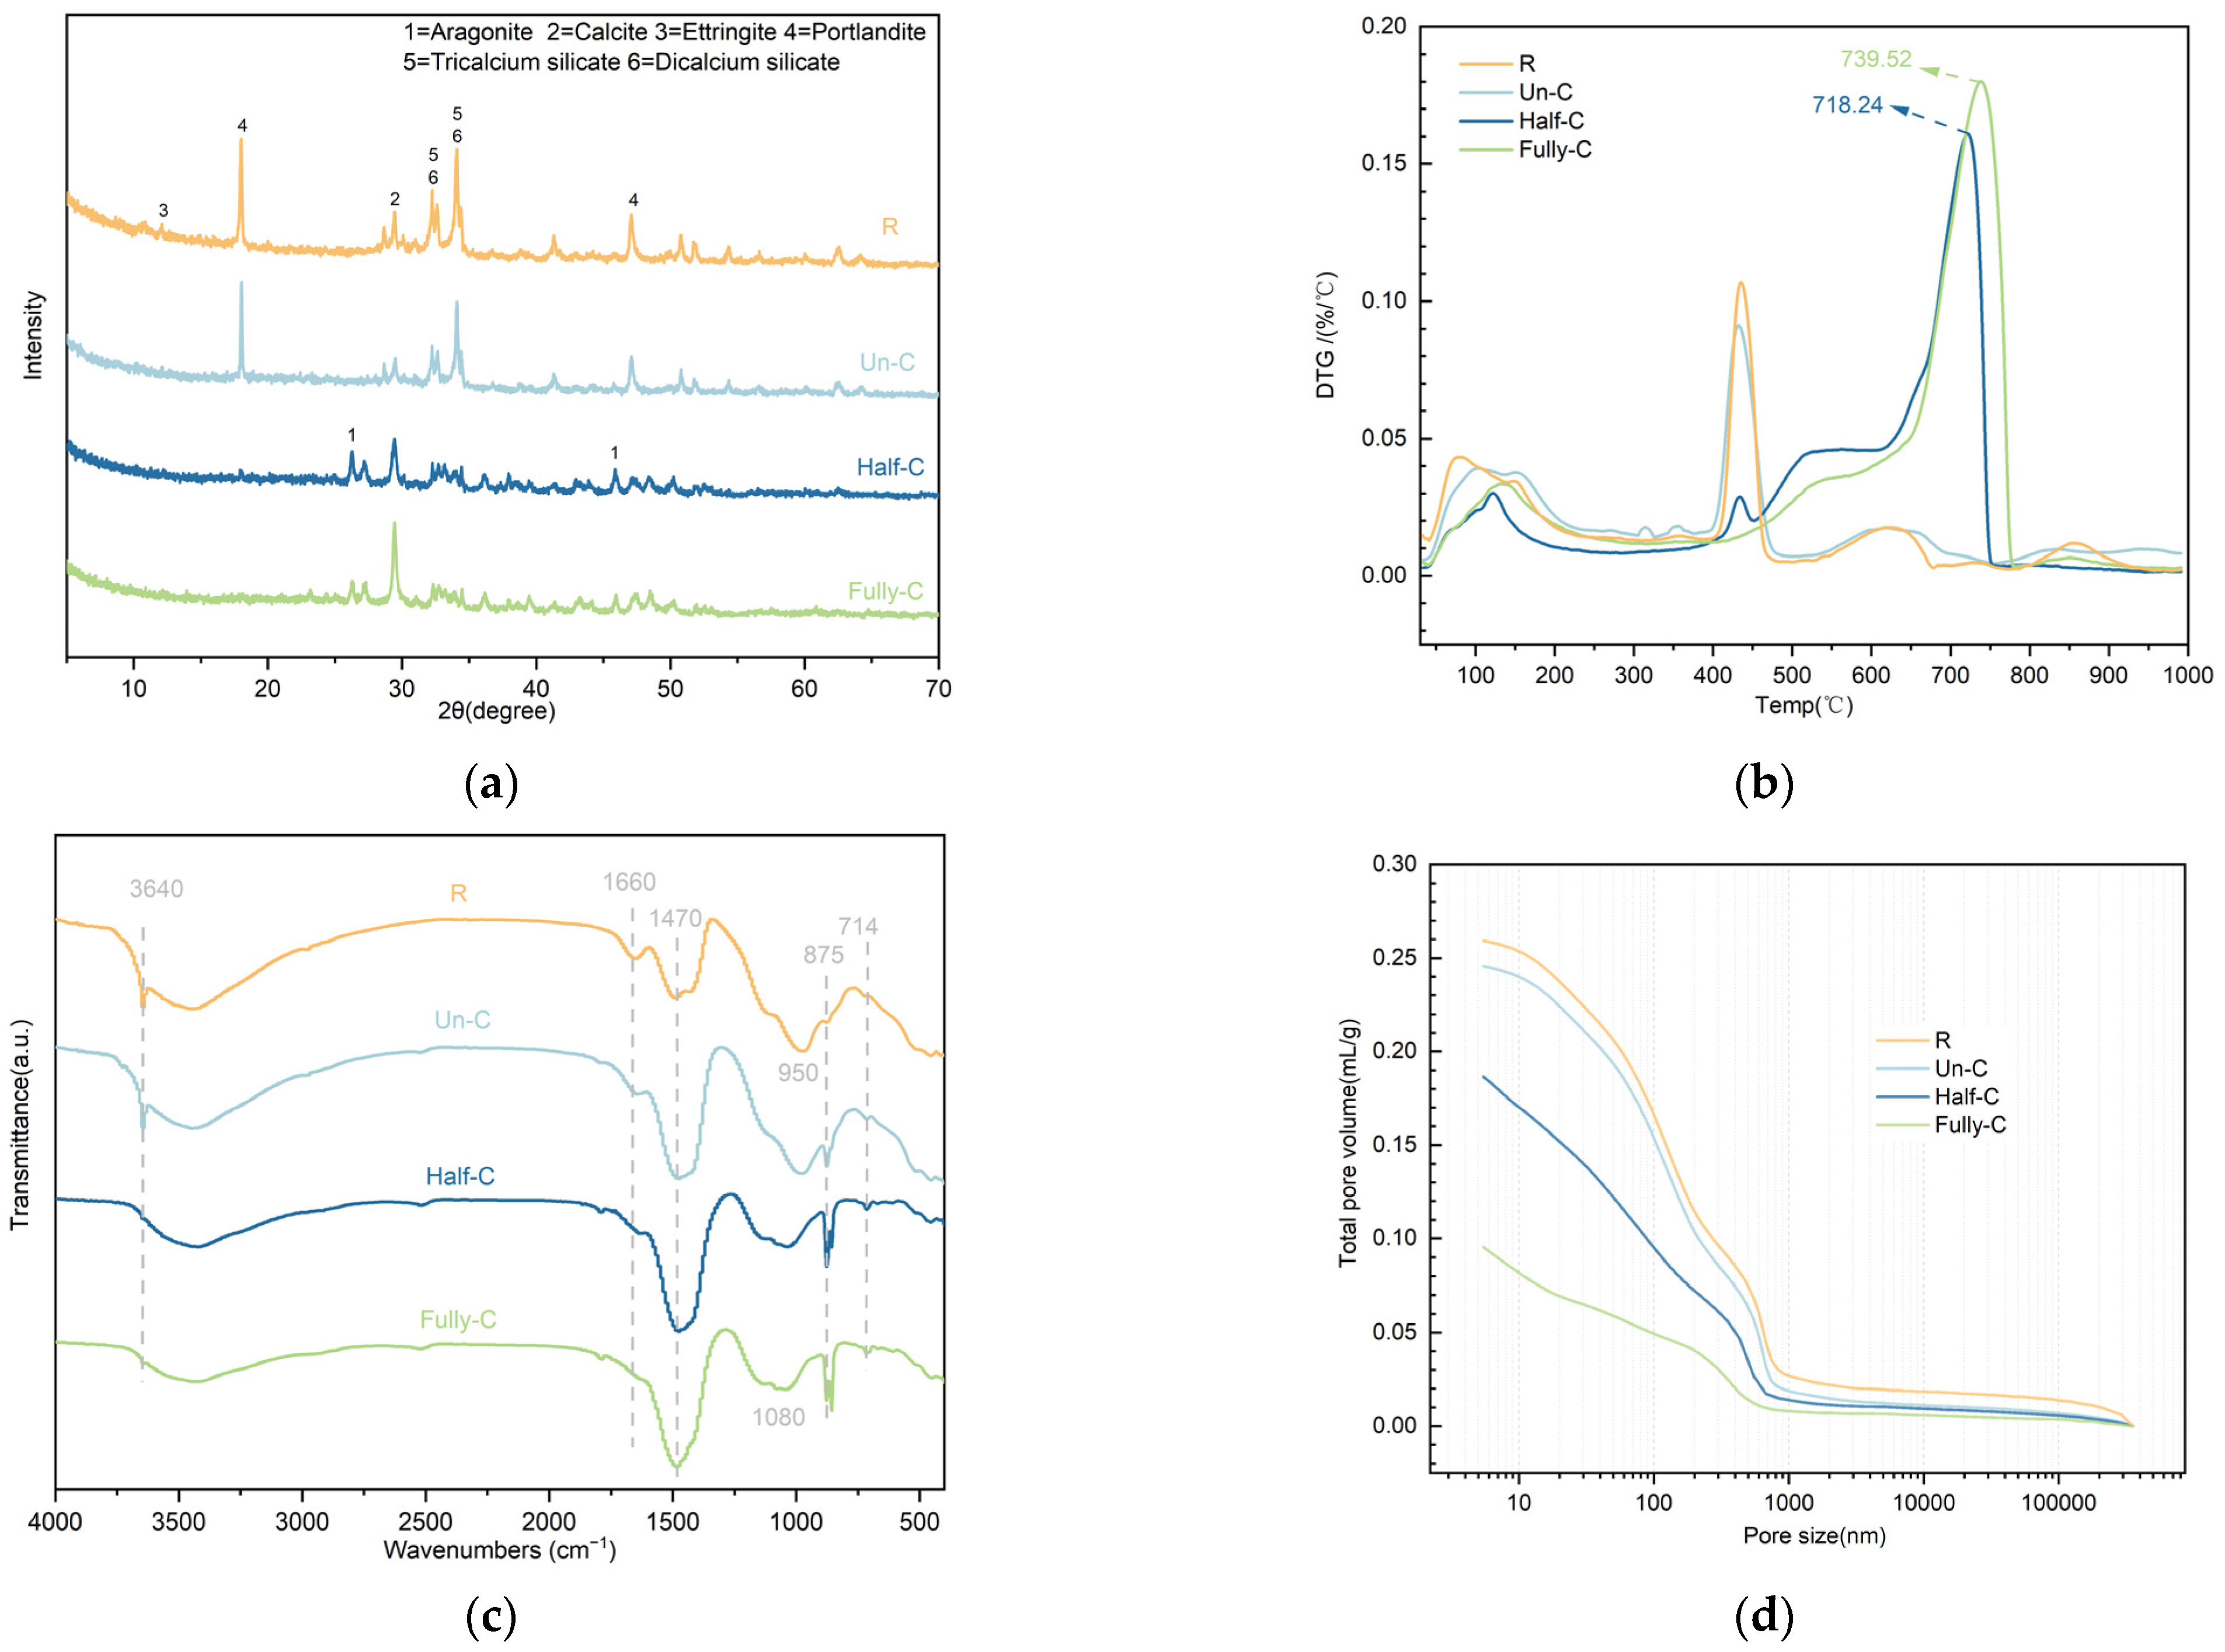
The primary material responsible for sequestering CO2 in calcium silicate boards is the cementitious material [40], which accounts for approximately 35.9% of the total weight of all raw materials. To quantify the CO2 sequestration capacity of the mineralization and curing process, this study conducted CO2 curing tests on cement paste specimens. And characterized different internal regions of sample C-0.3-8 using X-ray diffraction, thermogravimetric analysis, and Fourier-transform infrared spectroscopy. Figure 4a shows the XRD patterns of samples from different regions of C-0.3-8 and the reference sample R. The main phases in control sample R are portlandite (CH), dicalcium silicate (C2S), tricalcium silicate (C3S), calcium carbonate (CaCO3), and ettringite (AFt). Since cement hydration produces CH, and the CH content is positively correlated with the degree of hydration, the distinct CH diffraction peak in the pattern confirms that sample R has undergone partial hydration. Meanwhile, the trace CaCO3 peak in the pattern indicates that the sample has undergone natural carbonation with CO2 in the air. The main phases in sample C-0.3-8 are CaCO3, CH, C2S, and C3S. The intensities of the diffraction peaks for CH, C2S, and C3S in different regions of sample C-0.3-8 decrease with increasing mineralization (from the interior to the outermost layer), whereas the trend for the CaCO3 diffraction peaks is the opposite. This indicates that as the degree of mineralization increases, CH, C2S, and C3S gradually transform into CaCO3. The diffraction peaks in the interior of sample C-0.3-8 (Un-C) are similar to those of R, suggesting the presence of unmineralized regions within C-0.3-8.
Figure 4b shows the thermal analysis curves of samples from different regions of C-0.3-8 and the reference sample R. The mass loss observed below 200 °C is attributed to the evaporation of free water or the loss of bound water from C-S-H and AFt. The mass loss between 425 and 550 °C results from the decomposition of CH; as the degree of mineralization increases, the CH weight loss peak gradually shifts to lower temperatures, which is consistent with the conclusions of the XRD analysis. The onset temperature of CaCO3 decomposition in the sample was approximately 400 °C. The decomposition peak temperatures for the outermost layer (Fully-C) and the next-outer layer (Half-C) were 741.18 °C and 718.16 °C, respectively. Since the thermal stability of CaCO3 is influenced by its crystalline form and grain size, differences in the proportion of crystal forms within the mineralization products in different regions are likely the primary cause of this temperature shift. Figure 4c shows the FTIR spectra of samples from different regions of C-0.3-8 and the reference sample R. The vibrational peak at 3640 cm−1 is attributed to the O-H bond in CH, the peak at 1660 cm−1 is attributed to the H-O-H bond in bound water, the peak at 1470 cm−1 is attributed to the symmetric stretching vibration of C-O, and the peaks at 875 cm−1 and 714 cm−1 are attributed to the stretching vibrations of CO32−. As the degree of mineralization increases, the intensity of the vibrational peak associated with the mineralization product CaCO3 gradually increases, indicating that the mineralization reaction consumes CH and that CaCO3 is the primary product of the mineralization reaction. The vibrational peak at 950 cm−1 is attributed to the stretching vibration of the Si-O bond in Q2 C-S-H, while the vibrational peak near 1080 cm−1 is attributed to the stretching vibration of the Si-O bond in the Q3 C-S-H group. As the degree of mineralization increases, the vibrational peak near 950 cm−1 gradually shifts toward 1080 cm−1, indicating that C-S-H groups are continuously decalcified during the mineralization reaction, resulting in the formation of silica gel with a higher degree of polymerization. The XRD patterns, thermogravimetric curves, and FTIR spectra show a high degree of consistency, confirming the reliability of the phase identification. Figure 4d shows the cumulative pore volume curves for different regions of sample C-0.3-8 and reference sample R. Clearly, the cumulative pore volume decreases as the degree of mineralization increases, indicating that the mineralization products have filled the pores in the cementitious matrix.
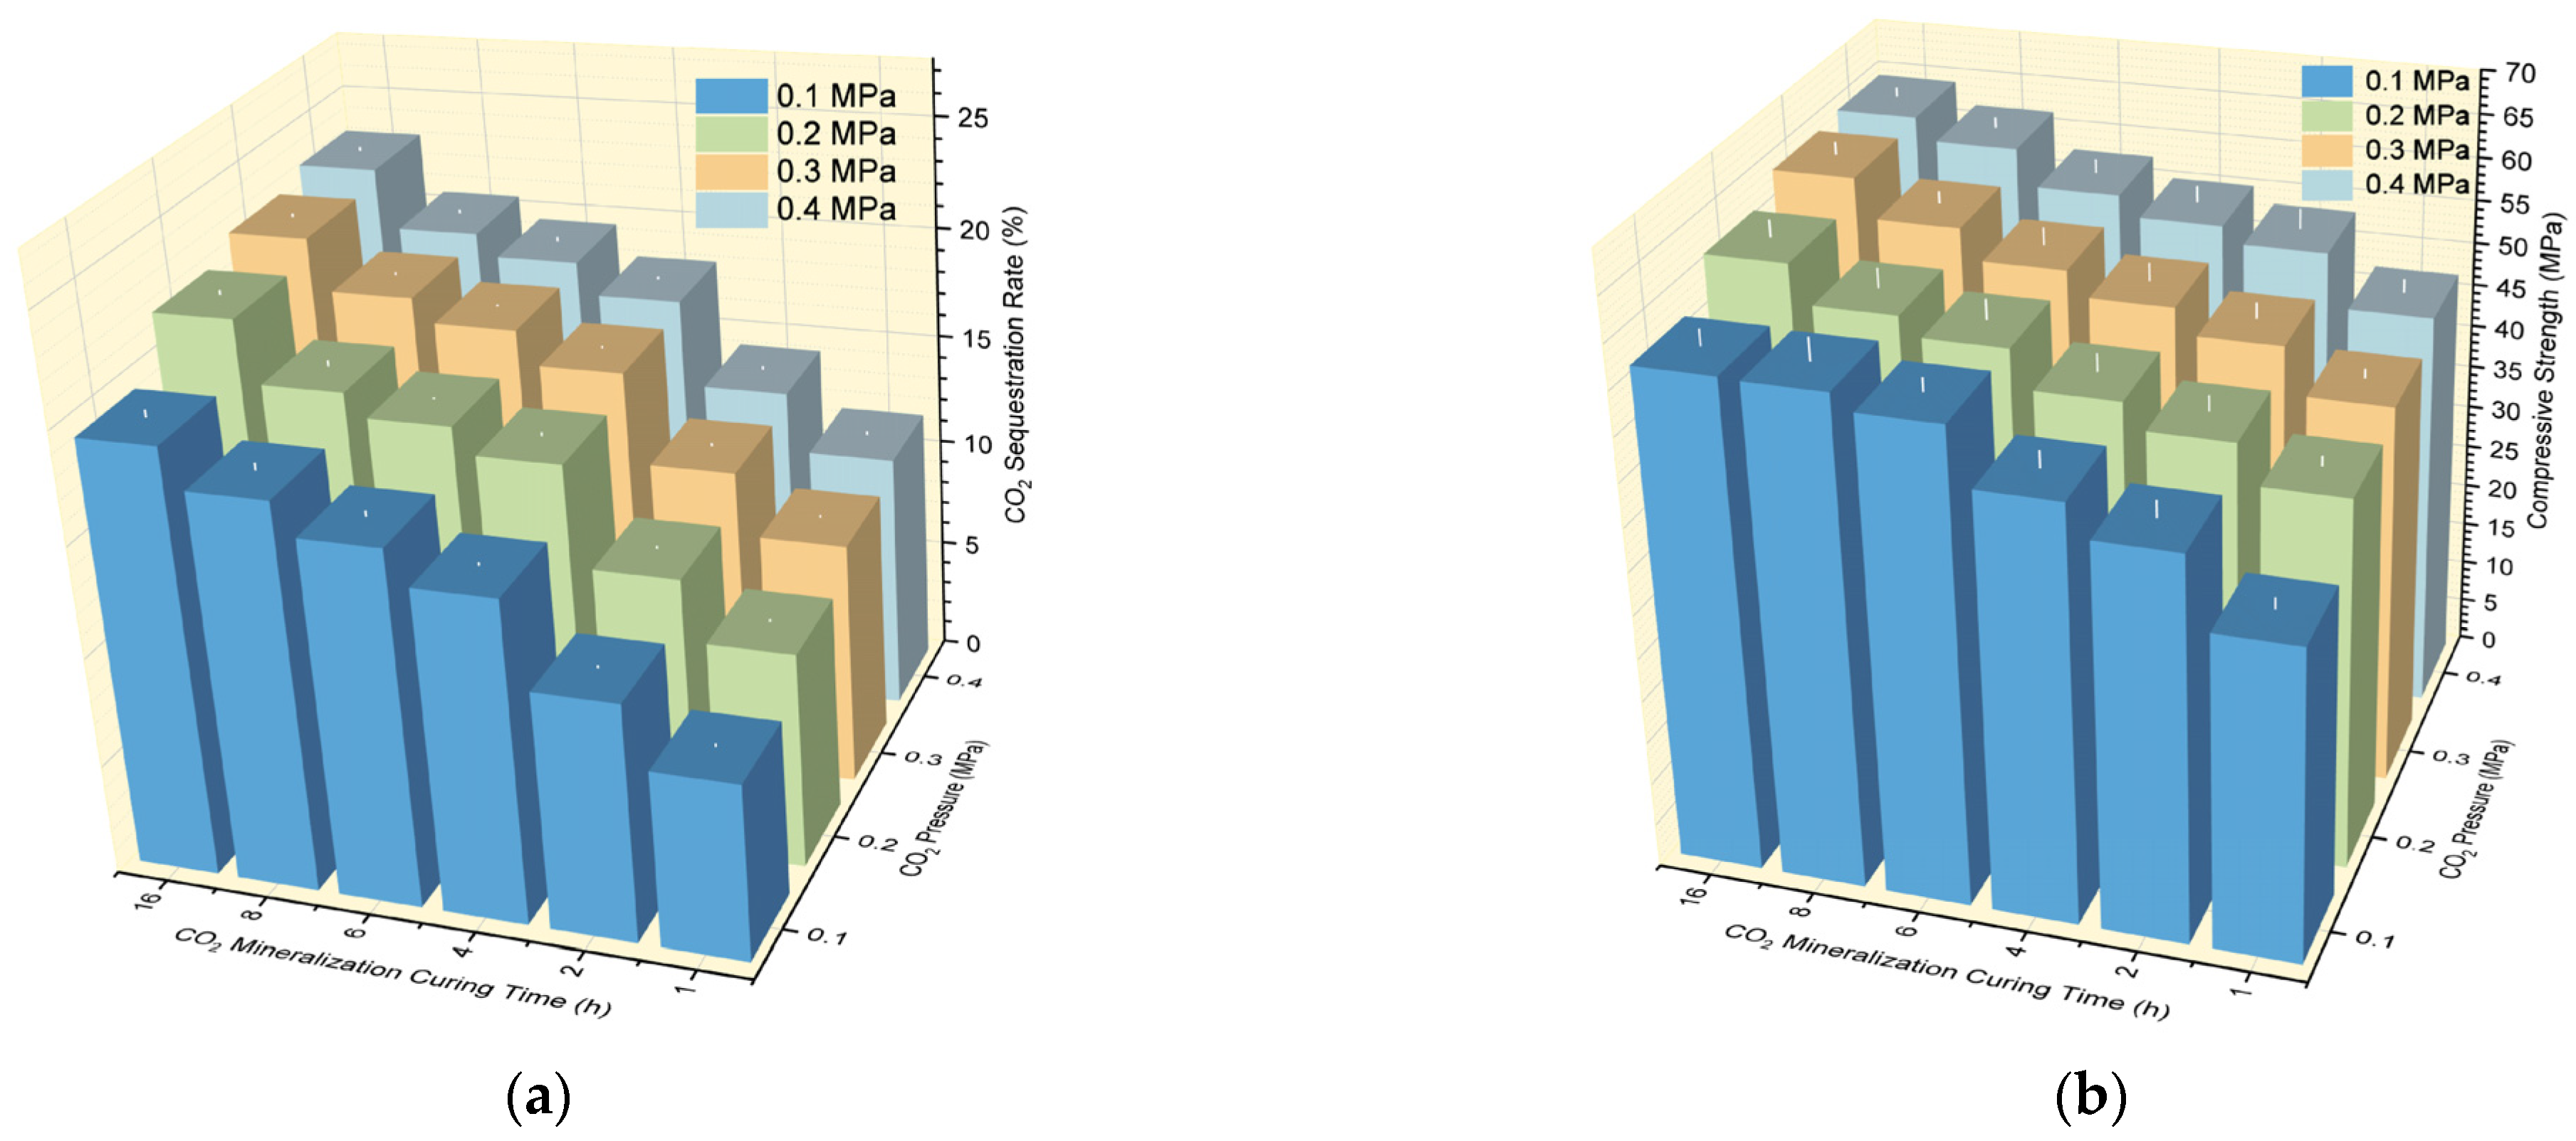
The results for the CO2 sequestration rate of cement test specimens under different CO2 pressures and curing times are shown in Figure 5a. The CO2 sequestration rate exhibits an upward trend as pressure increases and curing time extends. In conjunction with the aforementioned analysis of microstructural properties, it is inferred that increased pressure and extended curing time facilitate the transport and diffusion of CO2 within the cement paste. The results of the compressive strength of cement specimens under different CO2 pressures and curing times are shown in Figure 5b. Compressive strength also exhibits an upward trend with increasing pressure and extended curing time. This improvement in macroscopic performance is attributed to the filling of pores by mineralisation products, resulting in a denser cement paste matrix. Furthermore, under different pressure conditions, the increment in CO2 sequestration during the latter 8 h was very limited compared to the first 8 h. This trend indicates that the CO2 absorption capacity of the cement paste has approached an asymptotic limit and that the reaction kinetics have significantly declined after 8 h of curing.
Table 5 shows the CO2 sequestration rates of cement paste under different conditions. The CO2 absorption capacity of pure cement paste ranges from 7.84 to 23.24%. Normalising this value according to the composition of calcium silicate boards (containing 35.9% cement), the calculated theoretical sequestration rate range for these boards is 2.81–8.34%. The actual CO2 sequestration capacity of calcium silicate boards exceeds the lower limit of the aforementioned theoretical range, primarily due to the following reasons: (i) the time compensation effect, whereby extending the curing time alleviates the constraints imposed by gas pressure [28]; (ii) the gaps and pores in the interface transition zone between the fibres and the paste, which enhance gas permeability and thereby promote the transport and diffusion of CO2 [25]; (iii) the geometric dimension effect: the board’s large surface area and small thickness significantly reduce mass transfer resistance and accelerate the inward diffusion of CO2 [41]. However, the actual CO2 sequestration capacity of the calcium silicate board is lower than the upper limit of the aforementioned theoretical range, primarily due to the following reasons: (i) the ‘dilution effect’ caused by the dispersed distribution of the cementitious material within the inert aggregate matrix [42], which reduces the content of active calcium sources per unit volume of the board; (ii) the pore structure of pressure-moulded calcium silicate boards is predominantly closed-cell, which limits the accessibility of CO2 to the interior of the boards under ambient pressure [43]; (iii) mineralisation products preferentially precipitate in the open pores of the surface layer, forming a dense surface crust that acts as a barrier hindering the further diffusion of CO2 into the interior of the boards [44].
The CO2 sequestration rate of calcium silicate boards in the small-dataset experiment was 5.16%, which falls within the theoretical range of 2.81–8.34% derived from cement paste substitution experiments, confirming the internal consistency and reliability of the data. The measured value for the boards exceeded the lower limit of the theoretical range due to time compensation, interfacial porosity, and favorable geometric structure; however, it remained below the upper limit primarily due to dilution effects, closed pores, and the formation of surface crusts. It is worth noting that the primary factors limiting the board’s CO2 sequestration rate can be overcome in actual production through the use of a pressurized mineralization curing process, thereby increasing the CO2 sequestration rate. In accordance with the principle of conservatism in carbon accounting, this study adopts the measured value as the CO2 sequestration rate parameter for subsequent plant-wide carbon emissions calculations, rather than the upper limit reported in the literature.

3.2. Carbon Emissions of Baseline and Project Scenarios

3.2.1. Carbon Emissions Calculation

Based on the CO2 sequestration rate and mineralisation efficiency of the calcium silicate boards described above, and using Equations (10)–(12), the production line’s annual CO2 sequestration capacity is approximately 2090 t, and its annual CO2 consumption is approximately 3483 t.
Based on the formula presented earlier and the consumption rates of energy and raw materials mentioned, the total carbon emissions for the baseline scenario (autoclave curing) and the project scenario (CO2 mineralization curing) were calculated separately. The results are shown in Table 6.
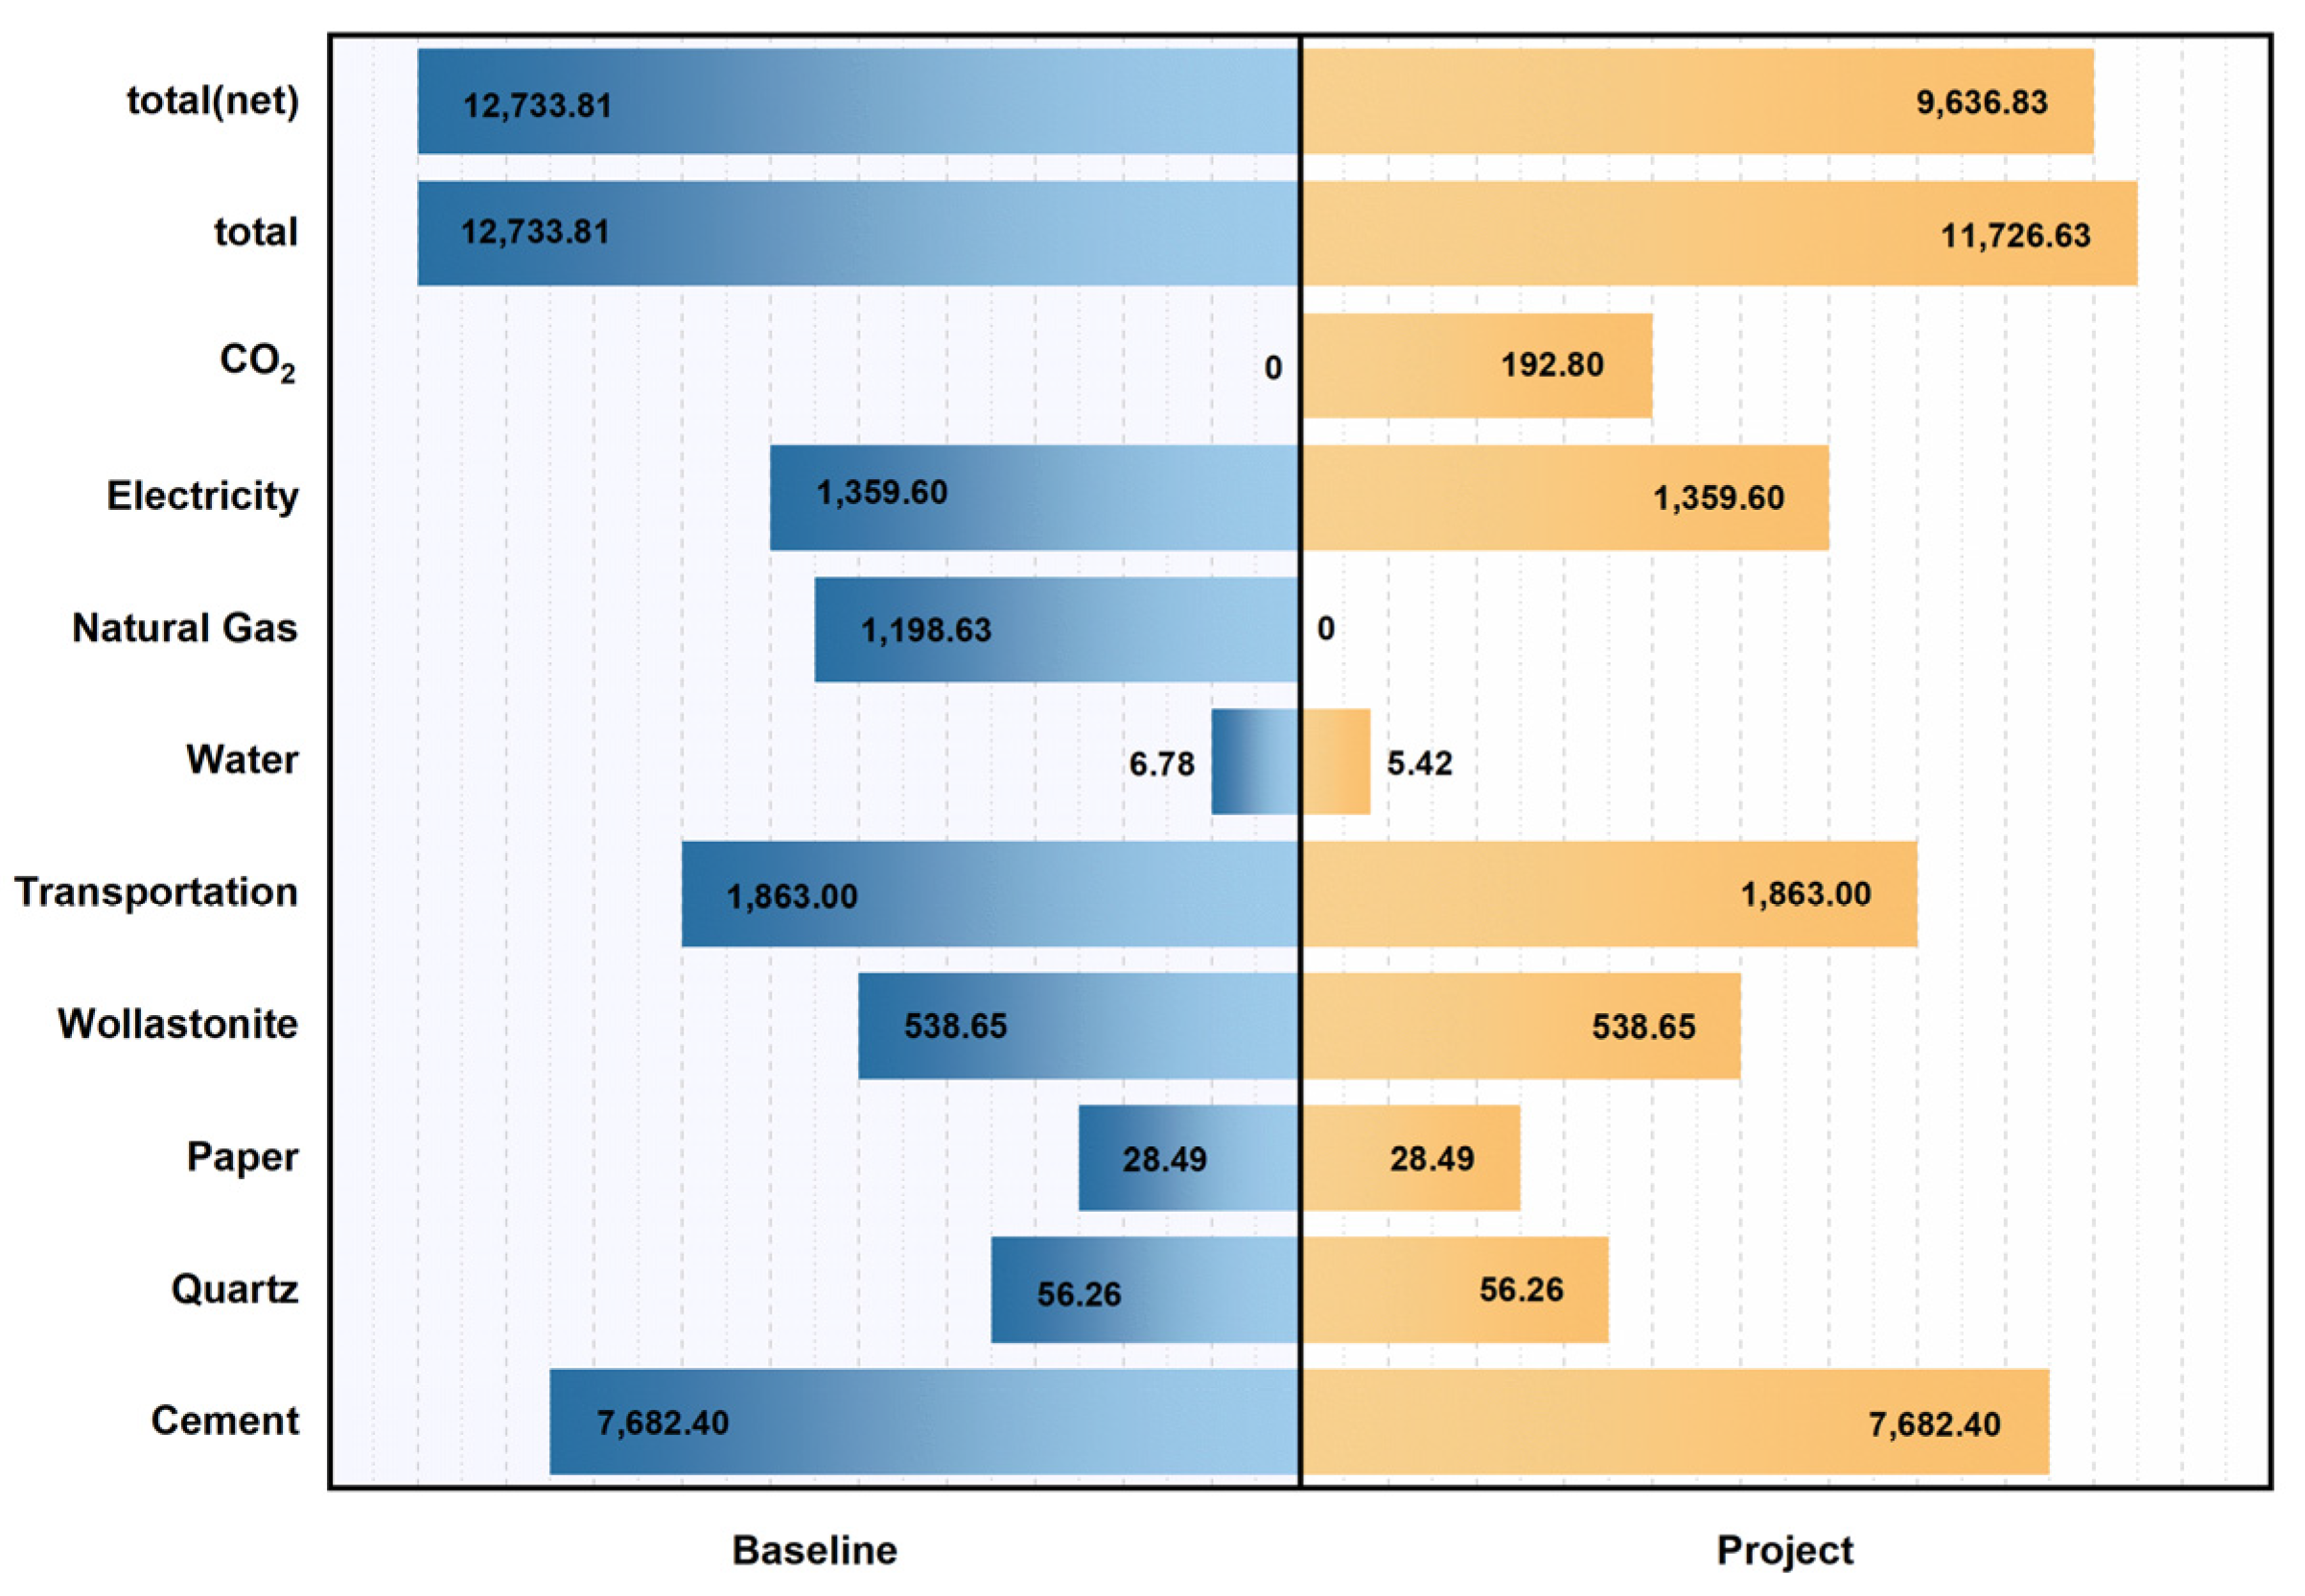
As shown in Table 6, the total carbon emissions in the baseline scenario are 12,734 t CO2; therefore, the carbon emissions per square meter of calcium silicate board produced in the baseline scenario are approximately 2.54 kg CO2. The total carbon emissions under the project scenario are 11,723 t CO2, so the carbon emissions per square meter of calcium silicate board produced under the project scenario are approximately 2.34 kg CO2. Compared to the baseline scenario, the total carbon emissions in the project scenario decrease by 1007 t CO2, and the carbon emissions per square meter of product decrease by approximately 0.20 kg CO2, accounting for about 7.91% of the baseline scenario. Furthermore, CO2 mineralization curing not only reduces energy consumption and achieves carbon emissions reductions in the production process but also enables CO2 sequestration through the product itself. The net carbon emissions of the project scenario are calculated using Equation (9). Based on the previous analysis, the net carbon emissions for the project scenario are approximately 9637 t CO2. Therefore, the net carbon emissions per square meter of calcium silicate board produced in the project scenario are 1.93 kg CO2. Compared to the baseline scenario, this represents a reduction of approximately 3097 t CO2 in annual net carbon emissions, with a 24.32% decrease in carbon emissions per unit area of product. Figure 6 illustrates the difference in carbon emissions between the baseline scenario and the project scenario.
Compared to traditional autoclave curing, CO2 mineralization curing not only offers significant advantages in terms of carbon reduction and emissions cuts but also enhances environmental benefits through the synergistic utilization of CO2 resources and mineralized sequestration. Furthermore, it effectively optimizes the mechanical properties and durability of products, while shortening the curing cycle to further increase production capacity and significantly reduce energy consumption and overall economic costs, demonstrating excellent technical and economic viability as well as potential for large-scale application [45].

3.2.2. Uncertainty Analysis

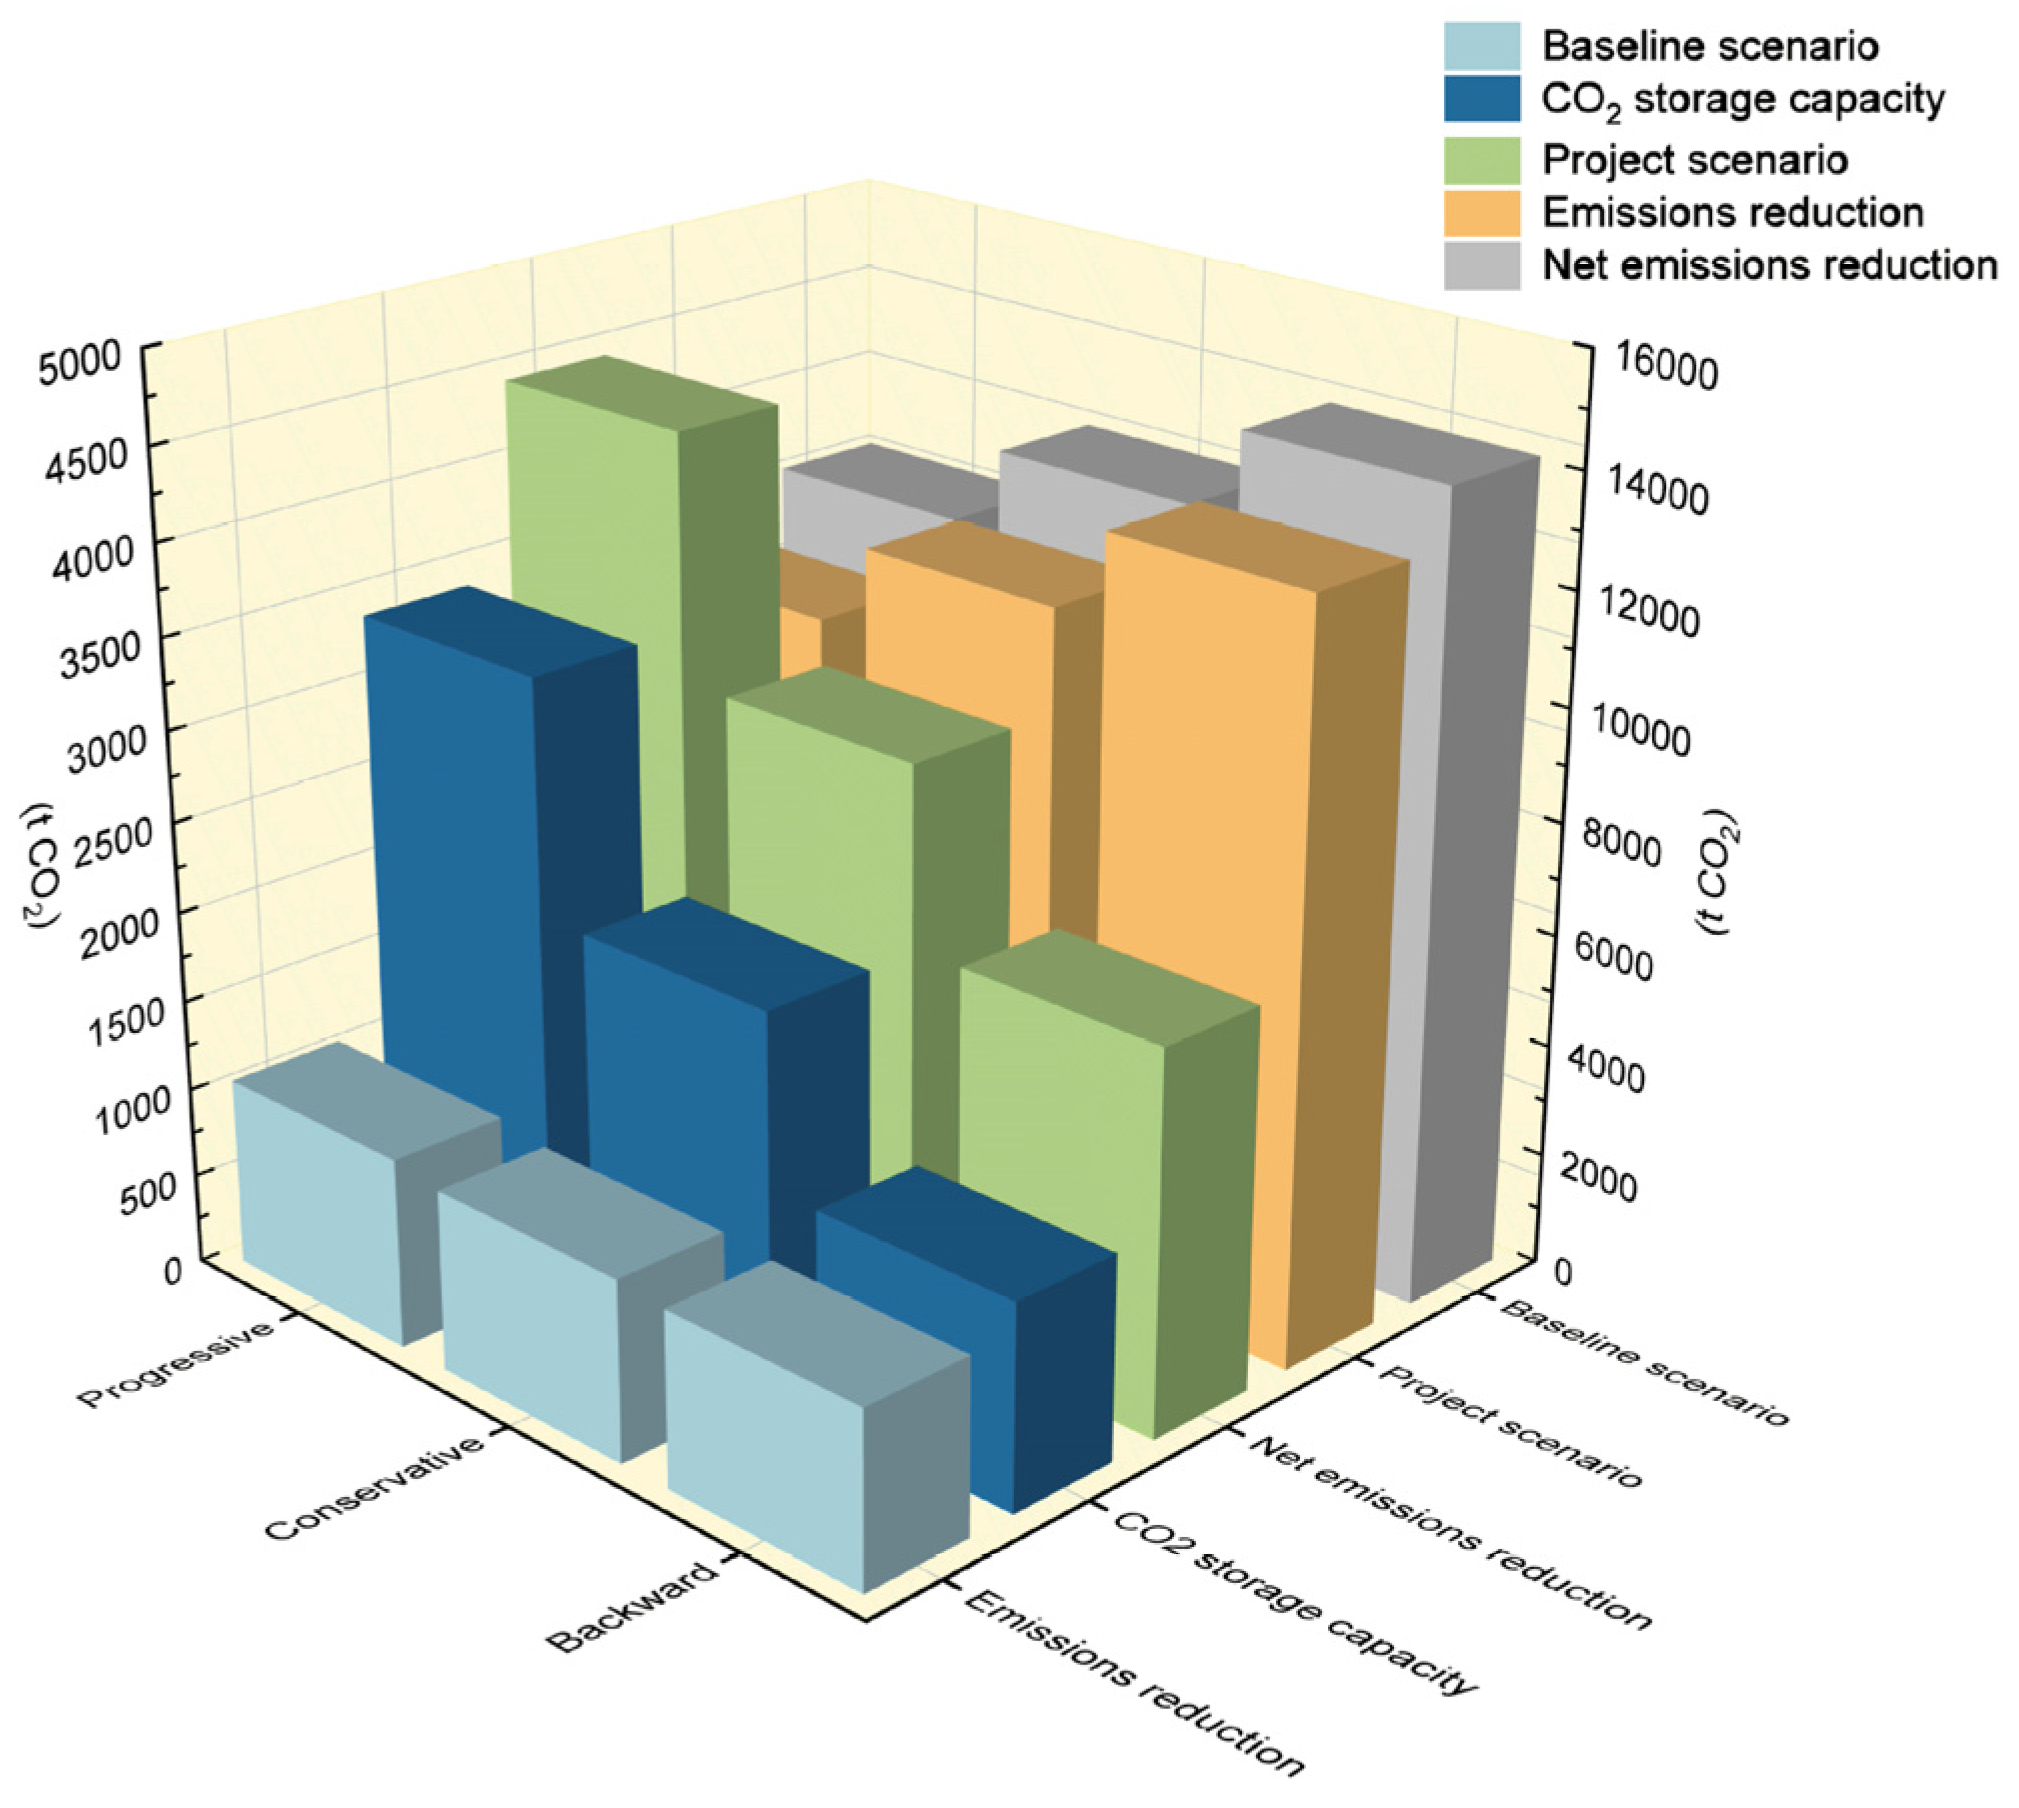
Figure 7 and Table 7 present the calculated carbon emissions under different production levels. Clearly, the total carbon emissions under the baseline scenario and the project scenario will vary with fluctuations in key influencing factors; the more advanced the production level, the lower the total carbon emissions. Therefore, the carbon reduction at different production levels is quite robust, amounting to approximately 1000 (±5%) t CO2. However, net carbon reductions are relatively sensitive to production levels. This variability is primarily attributed to significant differences in CO2 sequestration volumes across different production efficiencies, which directly impact the net climate benefits. Under the three production level scenarios—Backward, Conservative, and Progressive—the net carbon emission reduction benefits are 2115, 3097, and 4435 t CO2, respectively. Even under the most pessimistic conditions, the project scenario still achieves significant net emission reduction benefits; therefore, the project scenario is considered to be highly robust.
The results of the uncertainty analysis further confirm that CO2 mineralization and storage technology offer robust emission reduction benefits. However, translating this potential into tangible results depends on a variety of operational variables. These variables include production scrap rates, energy consumption per unit of curing equipment, carbon source characteristics (purity and origin), fugitive CO2 emissions, logistics methods, the allocation of captured carbon, and baseline cement emission factors. Future research should prioritize the quantification of these parameters. Once full-scale industrial production lines for calcium silicate boards are operational, field data should be collected to optimize the carbon accounting model and verify the expected emission reduction effects.

3.2.3. Carbon Reduction Benefits of Replacing Cement with Industrial Solid Waste Combined with CO2 Mineralization Curing

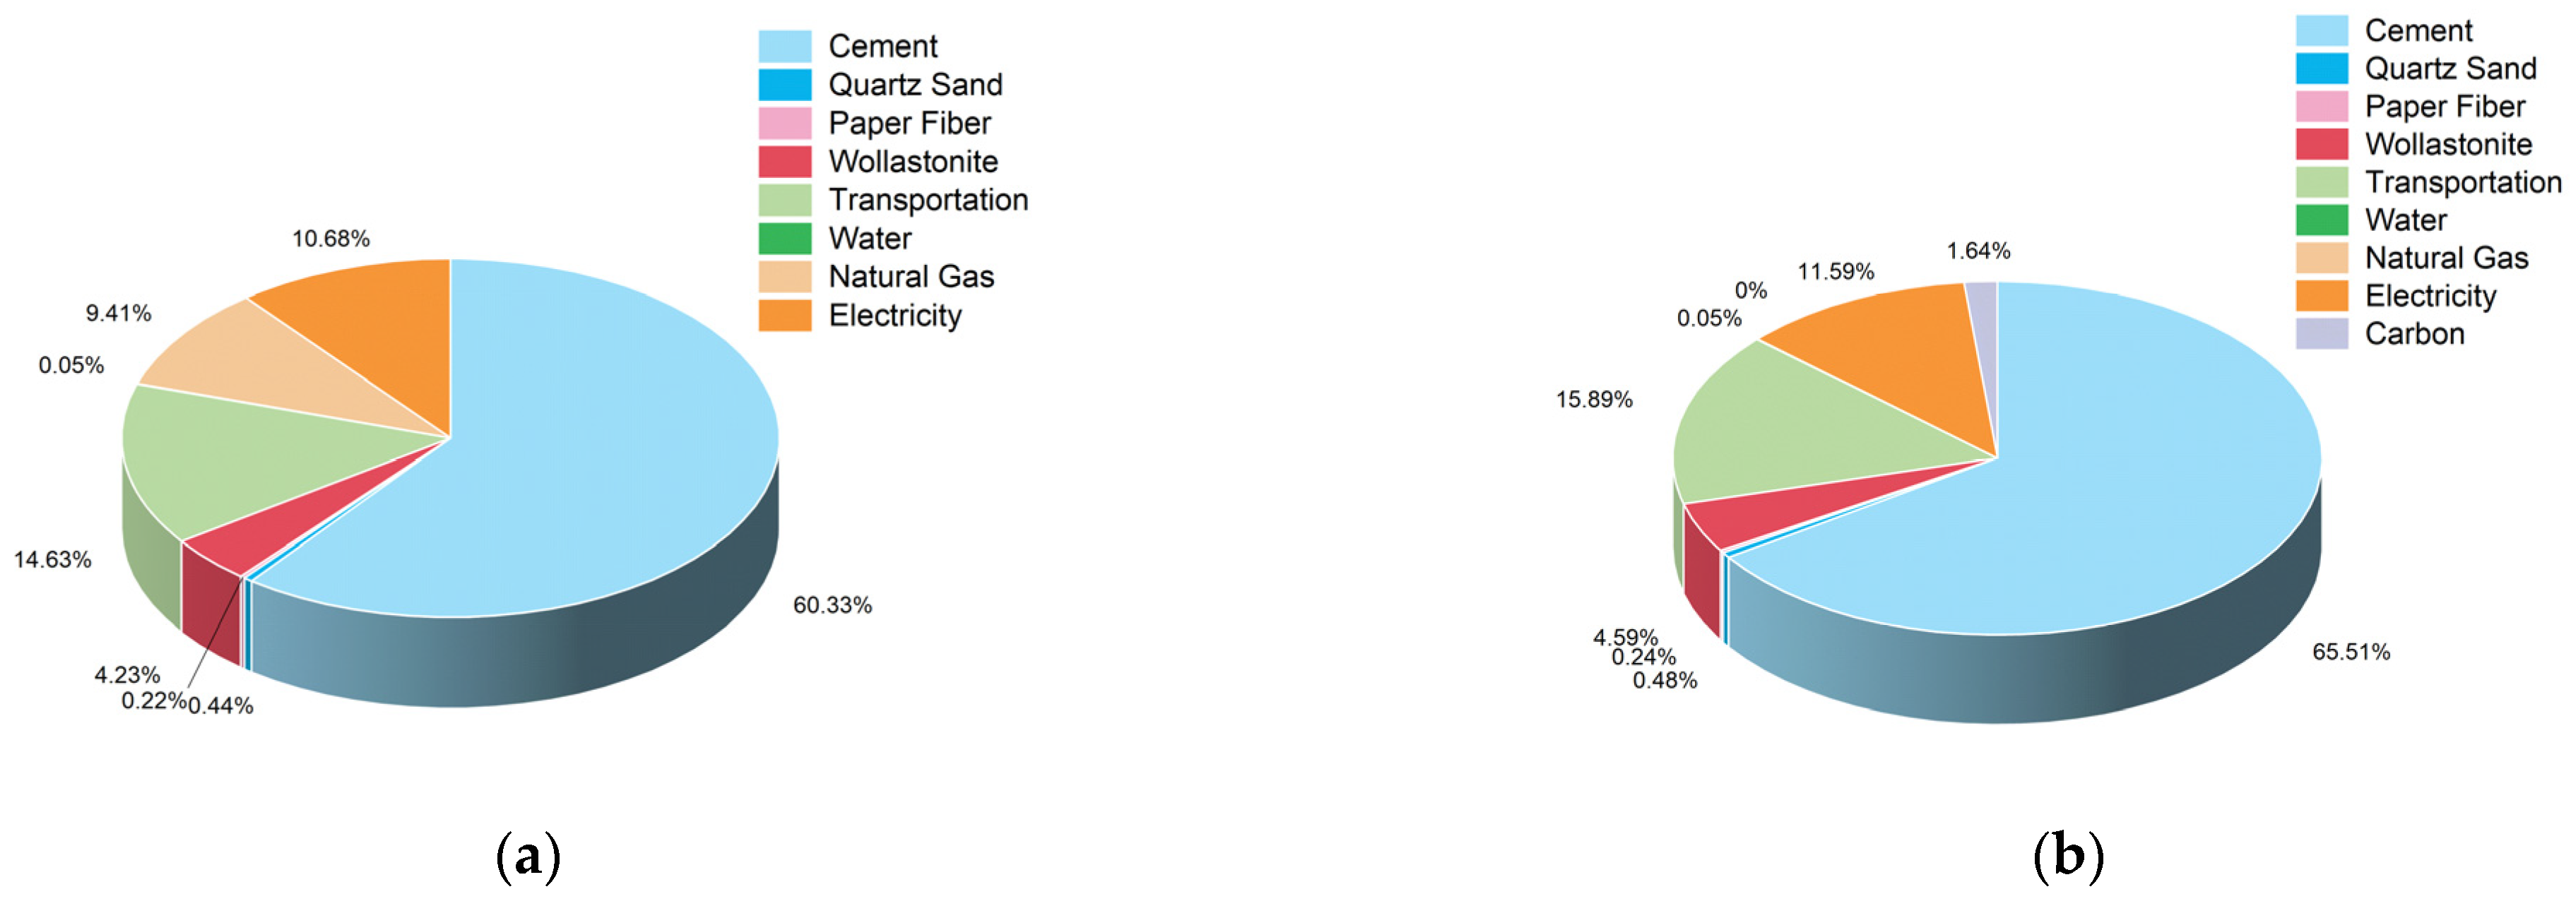
In the full-cycle carbon emissions inventory for calcium silicate board production, cement, the core cementitious material, accounts for approximately 60.33–65.51% of carbon emissions (Figure 8). Its carbon emission intensity directly determines the carbon emission levels of calcium silicate boards; therefore, reducing cement consumption has become a key target for achieving low-carbon improvements in the production process.
Current research indicates that industrial solid waste can be used to produce high-quality calcium silicate boards [46,47,48]. Xie et al. [49] used magnesium slag as a binder and carbonated it with paper fibers to produce a novel CO2-cured calcium silicate board. This product achieves a strength of over 10 MPa even after a short curing time (2–6 h) and exhibits significantly enhanced durability. Building on this, further integration with CO2 mineralization curing not only simultaneously achieves carbon reduction and the co-disposal of bulk solid waste but also significantly increases the CO2 sequestration capacity of calcium silicate boards, thereby establishing a closed-loop system of “carbon reduction–waste utilization–CO2 sequestration.”
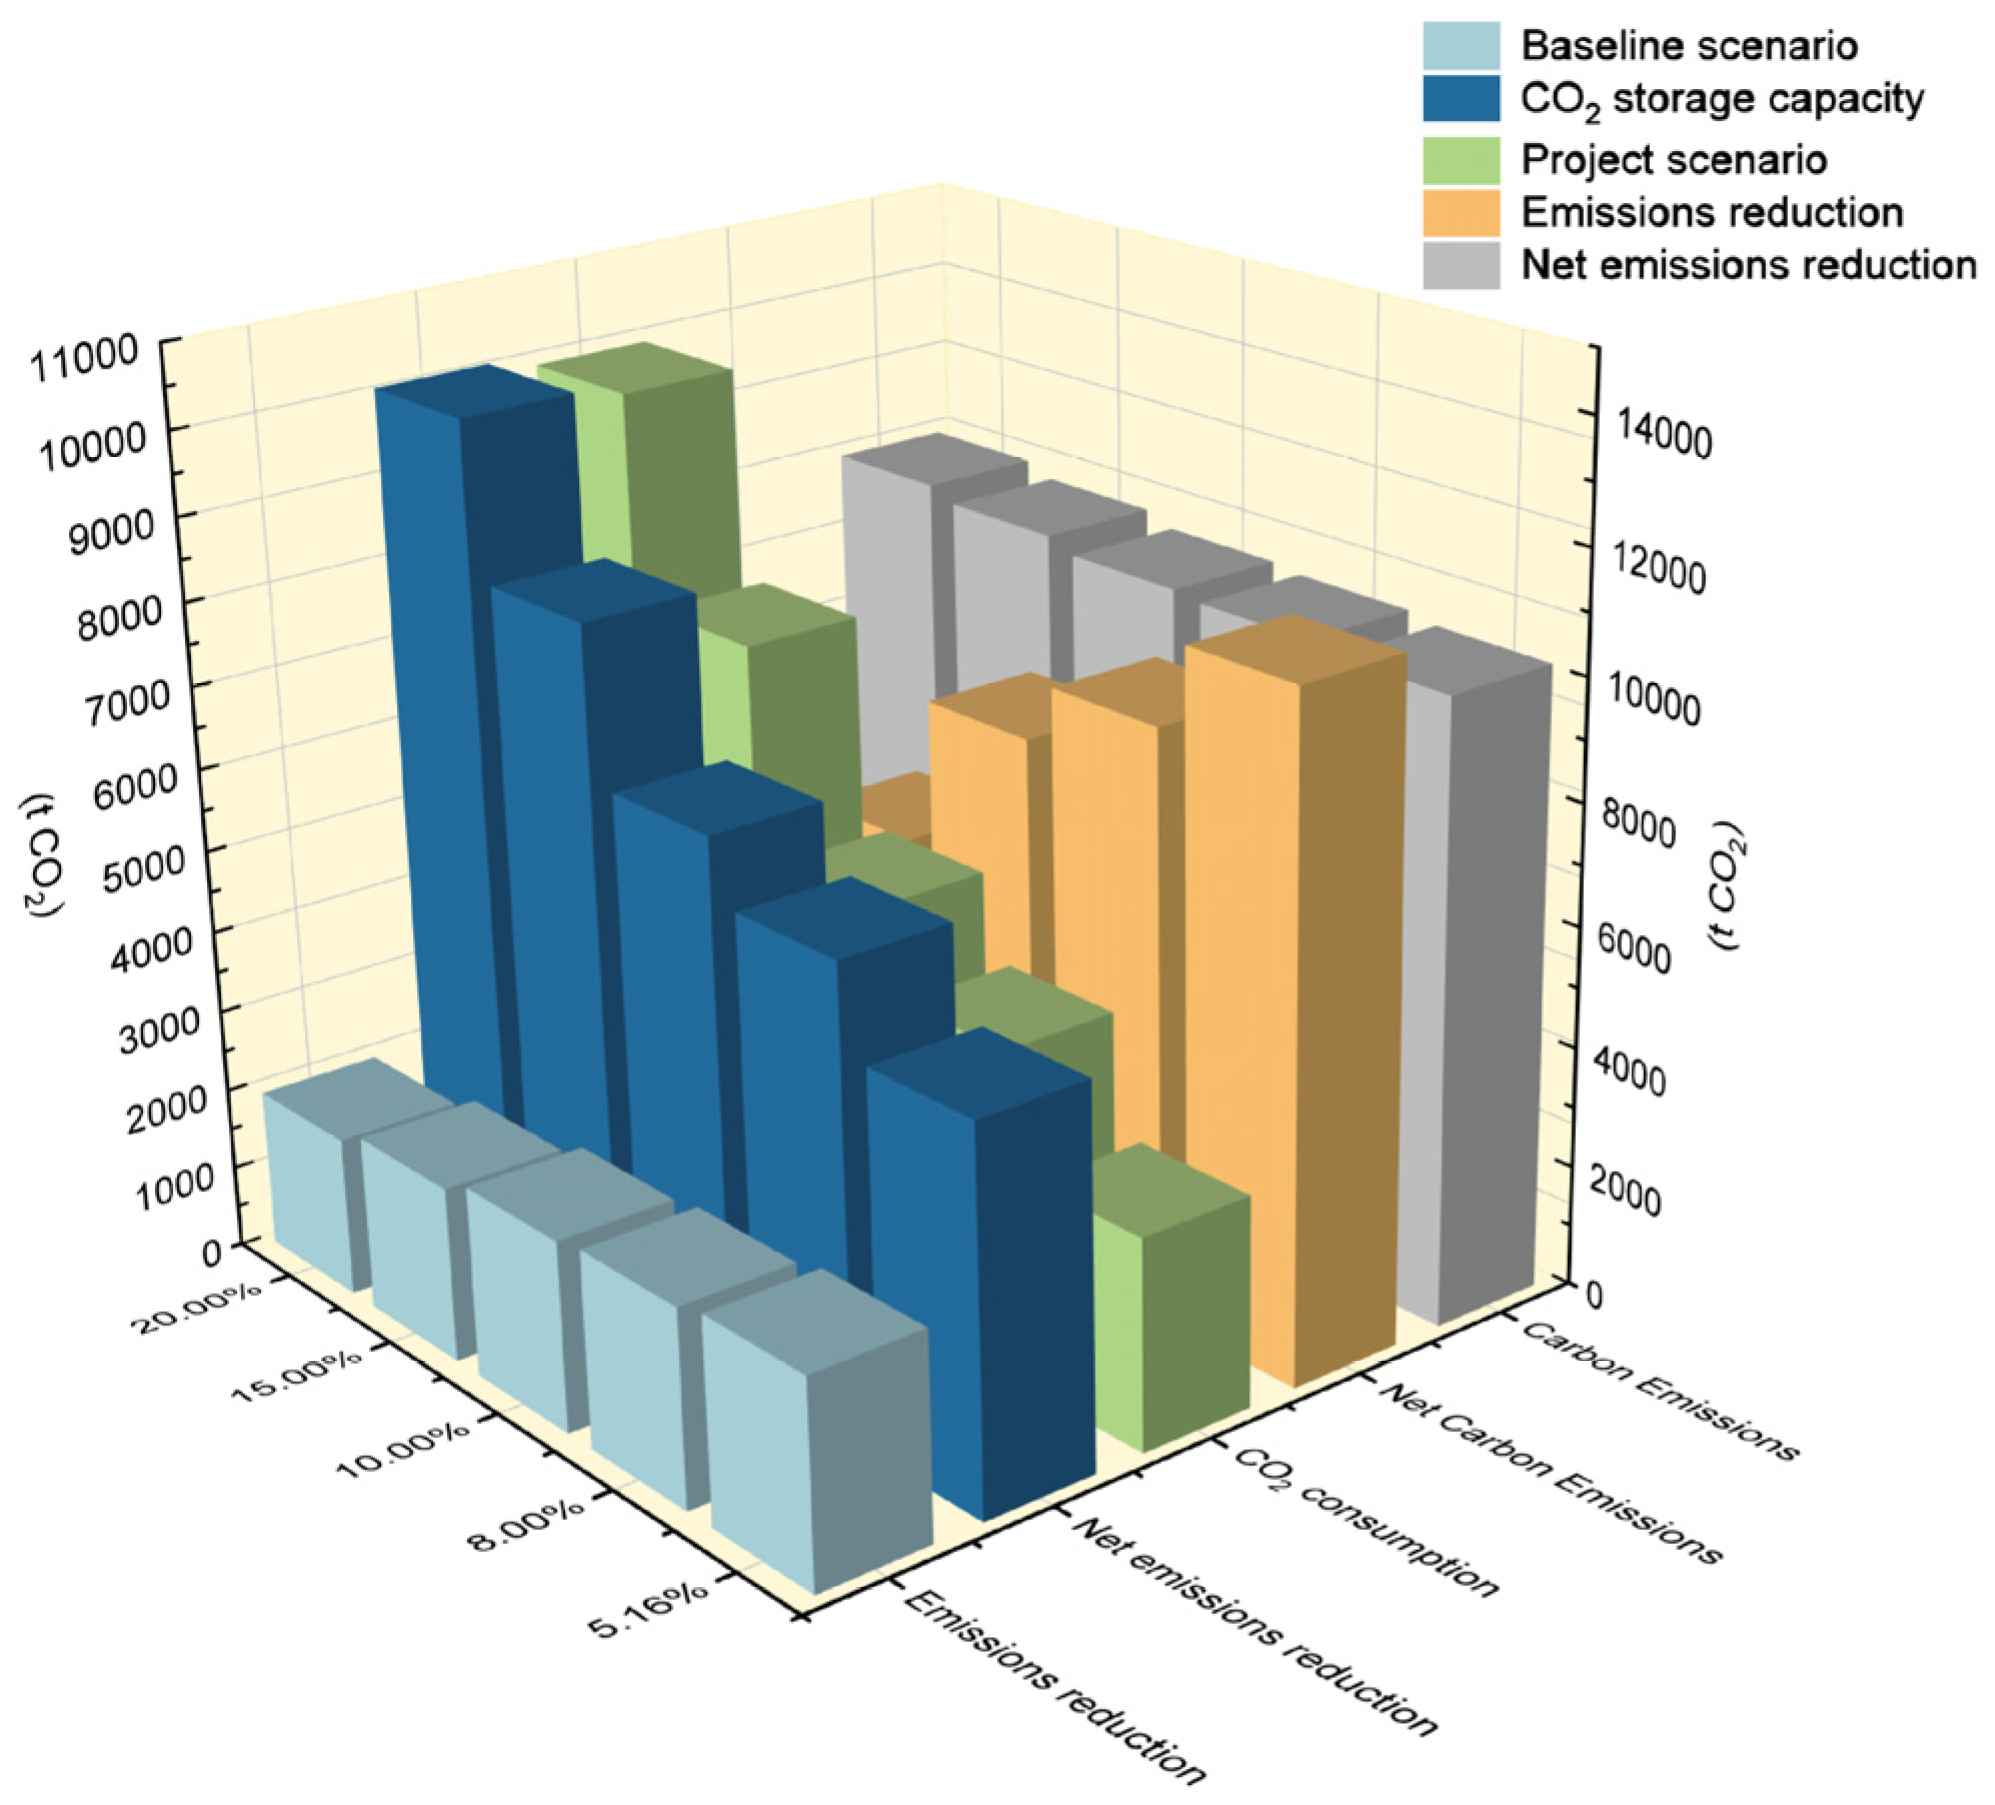
Assuming that industrial solid waste can replace 20% of the cement (ωt) and is used in conjunction with a carbon dioxide mineralization and solidification process, the energy consumption for solid waste treatment is 63.34 kWh/t [50]. Excluding carbon dioxide sequestration and carbon emissions, the total carbon emissions generated by the combined use of industrial solid waste and the carbon dioxide mineralization and solidification process amount to 10,236 t CO2. This represents a reduction of 2497 t CO2 compared to the baseline scenario and a reduction of 1490 t CO2 compared to the project scenario. The results of carbon emission calculations for the production of calcium silicate boards using industrial solid waste in conjunction with CO2 mineralization curing to achieve different levels of carbon sequestration are shown in Table 8.
As shown in Figure 9, the total carbon emissions from using industrial solid waste to replace cement exhibit a slight upward trend as the sequestration rate increases; this is attributed to the dominant influence of the sequestration volume on CO2 consumption. However, the amount of CO2 sequestered plays a decisive role in net carbon reduction, offsetting the negative effects of total emissions. Therefore, increasing the CO2 sequestration rate is of significant importance for the emission reduction benefits of the synergistic mineralization and curing of industrial solid waste to produce calcium silicate boards. It is worth noting that whether calcium silicate boards produced using solid waste at a 20 ωt% content can sequester 20% of their own weight in CO2 remains to be seen [51]. Therefore, given the limited CO2 sequestration capacity, excessive use of CO2 gas sources also constitutes a waste of energy. To further improve the sequestration efficiency of CO2 mineralization and curing using industrial solid waste, there is an urgent need to address the issue of insufficient carbonation through various physical, chemical, or microbial methods.
In summary, partially substituting cement with industrial solid waste and utilizing CO2 mineralization curing technology to produce calcium silicate boards offers significant environmental and economic benefits, providing the calcium silicate board industry with a low-carbon technical pathway that combines deep emission reductions with resource recycling value. From an environmental perspective, substituting cement with industrial solid waste reduces the high energy consumption and carbon emissions associated with clinker production at the source [50]. Simultaneously, the abundant mineralization-active components in the solid waste enhance the reactivity of the mineralization reaction and the CO2 absorption capacity [47], thereby synergistically improving CO2 sequestration efficiency. From an economic perspective, using industrial solid waste as a low-cost raw material can significantly reduce raw material costs and optimize cost structures, achieving synergies between the resource utilization of solid waste and carbon emission reductions. Future research could further investigate the differences in mineralization activity among various types of solid waste, optimize the blending ratios of solid waste and mineralization process parameters, and maximize the carbon reduction potential of this synergistic approach.

4. Conclusions

This study quantifies the emissions reduction benefits of CO2 mineralization curing over the entire life cycle and establishes a viable decarbonization pathway for calcium silicate boards—a widely used precast building component. The results indicate that this novel curing process significantly reduces embodied carbon compared to the traditional autoclave method. These findings provide manufacturers and practitioners with critical empirical data and actionable insights, offering a practical strategy for advancing decarbonization efforts in the construction industry. The main conclusions of this paper are as follows.
(1)
The results of the mineralization curing tests on pure cement mortar test specimens validated the reliability of the small dataset on CO2 sequestration rates for calcium silicate boards. Nevertheless, the CO2 sequestration rates measured in experiments with calcium silicate boards still need to be further validated through large-scale or repeated experimental testing.
(2)
Replacing autoclave curing with mineralization curing can reduce carbon emissions by 1007 t CO2. When CO2 sequestration is factored in, carbon emissions can be reduced by approximately 3097 t CO2.
(3)
The results of the uncertainty analysis indicate that mineralization and curing offer robust emission reduction benefits of at least 977 t CO2, which could reach approximately 2115 t CO2 when CO2 sequestration is factored in.
(4)
If 20 ωt% of cement is replaced with industrial solid waste to produce calcium silicate boards that meet physical and mechanical performance standards under mineralization and curing conditions, carbon emission reductions could reach 2497 t CO2.
Although CO2 mineralization and storage have demonstrated exceptional sustainability and performance, their net climate benefits require more rigorous validation before industrial deployment. Current estimates are highly sensitive to process-specific variables, and there is an urgent need to transition to precise carbon accounting. Furthermore, a major limitation of this study is that functional equivalence between autoclave-cured calcium silicate boards and mineral-cured calcium silicate boards has not been established; comparative data regarding strength, durability, and service life are based solely on literature reviews rather than experimental results. Therefore, future research should mitigate the risks associated with the industrialization of this technology by addressing the following key areas.
(1)
Empirical Calibration: More accurate data on CO2 sequestration rates and consumption should be obtained through large-scale production line operations. Actual measurement data regarding energy consumption for gas injection, pressure control, circulation systems, safety systems, humidity control, and monitoring systems used in mineralization treatment should be obtained from the production line.
(2)
Boundary refinement: Key factors that may affect emissions—such as product scrap rates, equipment energy consumption, gas sources and purity, gas leaks, transportation methods and distances, energy consumption for carbon dioxide capture, and cement emission factors—should be dynamically adjusted within the calculation model.
(3)
Unlocking Potential: Conduct in-depth research into the mechanisms of synergistic mineralization of industrial solid waste to maximize the emission reduction benefits of calcium silicate boards, with the aim of achieving the construction industry’s “net-zero emissions” goal.
(4)
Engineering Validation: The primary focus should be on verifying that the mineralized panels are equivalent to traditional autoclave-cured panels in terms of mechanical properties and durability. Through industrial trials, strict control must be exercised over product pass rates and long-term service life to establish the safety and reliability of their engineering applications, thereby providing a key technological framework and empirical support for the low-carbon transformation and upgrading of the building materials industry.

Author Contributions

Conceptualization, J.F. and Z.M.; methodology, J.F.; validation, J.Y., X.S. and F.B.; formal analysis, Z.M.; investigation, F.B.; resources, G.C.; data curation, X.S.; writing—original draft preparation, Z.M.; writing—review and editing, J.F.; visualization, J.Y.; supervision, J.F.; project administration, G.C.; funding acquisition, F.B. All authors have read and agreed to the published version of the manuscript.

Funding

This research was funded by the Key Technologies R&D Program of CNBM (2023YYSF08), the Self-supporting Project of State Key Laboratory of Green Building Materials (ZA-131), and the National Key Research and Development Program of China (2024YFE0210400).

Data Availability Statement

The data presented in this study are openly available in [National Greenhouse Gas Emission Factor Database] at [https://data.ncsc.org.cn/factories/index (accessed on 10 January 2026)], reference number [31].

Conflicts of Interest

Authors Zhiqin Ma, Jingrui Fang, Ge Chen, Junhao Ye and Xinchao Shi were employed by the company China Building Materials Academy Co., Ltd. Author Feng Bai was employed by the company Sinoma Energy Conservation (Wuhan) Co., Ltd.

References

  1. Chen, M.; Zheng, Y.; Zhou, X.; Li, L.; Wang, S.; Zhao, P.; Lu, L.; Cheng, X. Recycling of paper sludge powder for achieving sustainable and energy-saving building materials. Constr. Build. Mater. 2019, 229, 116874. [Google Scholar] [CrossRef]
  2. Qi, F.; Sun, J.; Zhu, G.; Li, H.; Wu, Y.; Li, S.; Yang, C.; Zheng, J.; Zhang, Y. Recycling of blast furnace slag to prepare calcium silicate hydrate by mechanical-chemical co-activation and its application to calcium silicate fireproof board. Process Saf. Environ. Prot. 2022, 165, 1–12. [Google Scholar] [CrossRef]
  3. Cao, P.; Xing, L.; Luo, J.; Jiang, H.; Zhang, X.; Li, G. Preparation of calcium silicate board from tobermorite-rich residue for energy conservation in buildings. Constr. Build. Mater. 2023, 407, 133547. [Google Scholar] [CrossRef]
  4. Wuhan Building Materials Research Institute; WuHan Energy Conservation Association; China Building Materials News. 2025 National Technical Exchange and High-Quality Development Conference for the Calcium Silicate Cement Board Industry and China International Concrete Expo. Available online: http://www.sinoma-ec.cn/contents/10/2887.html (accessed on 12 March 2026).
  5. Ardanuy, M.; Claramunt, J.; Toledo Filho, R.D. Cellulosic fiber reinforced cement-based composites: A review of recent research. Constr. Build. Mater. 2015, 79, 115–128. [Google Scholar] [CrossRef]
  6. Chen, M.; Lu, L.; Wang, S.; Zhao, P.; Zhang, W.; Zhang, S. Investigation on the formation of tobermorite in calcium silicate board and its influence factors under autoclaved curing. Constr. Build. Mater. 2017, 143, 280–288. [Google Scholar] [CrossRef]
  7. Vaněk, V.; Nespěšný, O.; Vystrčil, J.; Bečkovský, D.; Vajkay, F.; Pěnčík, J. Experimental determination of fracture mechanical properties of cement-fibre boards reinforced with cellulose and PVA fibres for FE analysis. Constr. Build. Mater. 2024, 411, 134622. [Google Scholar] [CrossRef]
  8. Sakiyama, M.; Asami, T.; Iwanaga, T.; Oshio, Y.; Oda, M. Calcium Silicate Board and Method of Manufacture Therefor. U.S. Patent 5,952,087, 14 September 1999. [Google Scholar]
  9. Shao, X.; Li, L.; Ling, T.-C. Comparative Life-Cycle Assessment of Fast-Curing Methods for Dry-Mix and Wet-Mix Cement Pastes. J. Mater. Civ. Eng. 2023, 35, 04023231. [Google Scholar] [CrossRef]
  10. Donhauser, T.; Ehrhardt, J.; Rackow, T.; Franke, J.; Schuderer, P. Simulation-Based Optimization of the Energy Consumption in the Hardening Process for Calcium Silicate Masonry Units. Appl. Mech. Mater. 2015, 805, 249–256. [Google Scholar]
  11. Driver, J.G.; Bernard, E.; Patrizio, P.; Fennell, P.S.; Scrivener, K.; Myers, R.J. Global decarbonization potential of CO2 mineralization in concrete materials. Proc. Natl. Acad. Sci. USA 2024, 121, e2313475121. [Google Scholar] [CrossRef] [PubMed]
  12. Liu, Z.; Deng, Z.; Davis, S.J.; Ciais, P. Global carbon emissions in 2023. Nat. Rev. Earth Environ. 2024, 5, 253–254. [Google Scholar] [CrossRef]
  13. Jiang, L.; Wu, Q.; Huo, Z.; Zhu, Z.; Wu, F.; Lu, B. An approach to improve compressive strength of cement paste at low temperature by carbonation curing. Constr. Build. Mater. 2023, 365, 130128. [Google Scholar] [CrossRef]
  14. He, Z.; Jia, Y.; Wang, S.; Mahoutian, M.; Shao, Y. Maximizing CO2 sequestration in cement-bonded fiberboards through carbonation curing. Constr. Build. Mater. 2019, 213, 51–60. [Google Scholar] [CrossRef]
  15. Pizzol, V.D.; Mendes, L.M.; Frezzatti, L.; Savastano, H., Jr.; Tonoli, G.H.D. Effect of accelerated carbonation on the microstructure and physical properties of hybrid fiber-cement composites. Miner. Eng. 2014, 59, 101–106. [Google Scholar] [CrossRef]
  16. Meng, D.; Unluer, C.; Yang, E.-H.; Qian, S. Carbon sequestration and utilization in cement-based materials and potential impacts on durability of structural concrete. Constr. Build. Mater. 2022, 361, 129610. [Google Scholar] [CrossRef]
  17. Cabral, M.R.; Nakanishi, E.Y.; Santos, S.F.; Fiorelli, J. Effect of CO2 curing on the long-term performance of oriented cement-bonded boards after wet-dry cycles. Environ. Sci. Pollut. Res. 2025, 32, 9271–9279. [Google Scholar] [CrossRef] [PubMed]
  18. Filomeno, R.H.; Fioroni, C.A.; Azevedo, A.G.S.; Savastano, H., Jr. Influence of different curing regimes and accelerated carbonation on the physical, mechanical, and aging performances of fiber cement. J. Build. Eng. 2023, 78, 107791. [Google Scholar] [CrossRef]
  19. Walker, I.; Bell, R.; Rippy, K. Mineralization of alkaline waste for CCUS. npj Mater. Sustain. 2024, 2, 28. [Google Scholar] [CrossRef]
  20. Ye, J.; Fang, J.; Sun, Y.; Shi, X.; Chen, G.; Ma, T.; Zhi, X. CO2 mineralization of cement-based materials by accelerated CO2 mineralization and its mineralization degree: A review. Constr. Build. Mater. 2024, 444, 137712. [Google Scholar] [CrossRef]
  21. Ashraf, W.; Olek, J. Carbonation behavior of hydraulic and non-hydraulic calcium silicates: Potential of utilizing low-lime calcium silicates in cement-based materials. J. Mater. Sci. 2016, 51, 6173–6191. [Google Scholar] [CrossRef]
  22. Lamaa, G.; Duarte, A.P.C.; Silva, R.V.; de Brito, J. Carbonation of Alkali-Activated Materials: A Review. Materials 2023, 16, 3086. [Google Scholar] [CrossRef] [PubMed]
  23. Li, Y.; Tian, J.; Wang, Y.; Wang, J.; Wang, X.; Yu, S. CO2-Cured Fiber-Reinforced Board from Low-Calcium Clinker: Key Synthesizing Factors, Carbonation Products, and Comparison to Autoclaved Calcium Silicate Board. J. Mater. Civ. Eng. 2024, 36, 04024168. [Google Scholar] [CrossRef]
  24. Pizzol, V.D.; Mendes, L.M.; Savastano, H.; Frías, M.; Davila, F.J.; Cincotto, M.A.; John, V.M.; Tonoli, G.H.D. Mineralogical and microstructural changes promoted by accelerated carbonation and ageing cycles of hybrid fiber–cement composites. Constr. Build. Mater. 2014, 68, 750–756. [Google Scholar] [CrossRef]
  25. Soroushian, P.; Won, J.-P.; Hassan, M. Durability characteristics of CO2-cured cellulose fiber reinforced cement composites. Constr. Build. Mater. 2012, 34, 44–53. [Google Scholar] [CrossRef]
  26. Verra. Methodology for CO2 Utilization in Concrete Production; VM0043; Verra: Washington, DC, USA, 2024; pp. 13–15, 18–20. [Google Scholar]
  27. Huang, Z.; Zhou, H.; Miao, Z.; Tang, H.; Lin, B.; Zhuang, W. Life-Cycle Carbon Emissions (LCCE) of Buildings: Implications, Calculations, and Reductions. Engineering 2024, 35, 115–139. [Google Scholar] [CrossRef]
  28. Xian, X.; Mahoutian, M.; Shao, Y. Production of concrete pipes by carbonation curing in an inflatable enclosure. Constr. Build. Mater. 2023, 363, 129861. [Google Scholar] [CrossRef]
  29. Bertolini, M.; Duttilo, P.; Lisi, F. Accounting carbon emissions from electricity generation: A review and comparison of emission factor-based methods. Appl. Energy 2025, 392, 125992. [Google Scholar] [CrossRef]
  30. GB/T 51366-2019; Standard for Calculation of Carbon Emissions in Buildings. Ministry of Housing and Urban-Rural Development of the People’s Republic of China: Beijing, China, 2019; pp. 21–36.
  31. Ministry of Ecology and Environment of the People’s Republic of China. National Greenhouse Gas Emission Factor Database; Ministry of Ecology and Environment of the People’s Republic of China: Beijing, China, 2025.
  32. GB 31825-2024; Energy Consumption Limits for Pulp and Paper Production per Unit of Product. State Administration for Market Regulation: Beijing, China; National Standardization Administration: Beijing, China, 2024.
  33. Michaelides, E.E. Power and Energy Requirements for Carbon Capture and Sequestration. Thermo 2025, 5, 8. [Google Scholar] [CrossRef]
  34. Shao, Y.; Rostami, V.; He, Z.; Boyd Andrew, J. Accelerated Carbonation of Portland Limestone Cement. J. Mater. Civ. Eng. 2014, 26, 117–124. [Google Scholar] [CrossRef]
  35. Yang, H.; He, Z.; Shao, Y. Early carbonation behavior of high-volume dolomite powder-cement based materials. J. Wuhan Univ. Technol. Mater. Sci. Ed. 2015, 30, 541–549. [Google Scholar] [CrossRef]
  36. Ghosh, T.; Ingwersen, W.W.; Jamieson, M.; Hawkins, T.R.; Cashman, S.; Hottle, T.; Carpenter, A.; Richa, K. Derivation and assessment of regional electricity generation emission factors in the USA. Int. J. Life Cycle Assess. 2022, 28, 156–171. [Google Scholar] [CrossRef] [PubMed]
  37. Ahmadi, F.; Keppo, I. Role of the cement industry in climate neutrality considering uncertainties in deployment of carbon capture technologies: A site-specific modeling approach. Energy Convers. Manag. 2026, 348, 120792. [Google Scholar] [CrossRef]
  38. Su, R.K.L.; Li, H.; Chen, L.; Chen, H. Novel accelerated carbonation methods based on deep breathing analogous and prediction model for pressurized carbonation of concrete. Sci. Rep. 2024, 14, 24268. [Google Scholar] [CrossRef] [PubMed]
  39. Zhang, Q.; Feng, P.; Shen, X.; Zhang, Y.; Bian, S.; Ling, T. Assessment method of carbonation degree and activity of a wide range of calcium/magnesium containing solids. J. Clean. Prod. 2024, 467, 143009. [Google Scholar] [CrossRef]
  40. Li, S.; Chen, X.; Hu, M.; Geng, Y.; Sui, S.; Meng, S.; Jin, L.; Cui, W. Carbon sequestration effects in cementitious composite binder materials under accelerated carbonation: A review. Mater. Today Sustain. 2024, 25, 100663. [Google Scholar] [CrossRef]
  41. Chen, K.-y.; Xia, J.; Wu, R.-j.; Shen, X.-y.; Chen, J.-j.; Zhao, Y.-x.; Jin, W.-l. An overview on the influence of various parameters on the fabrication and engineering properties of CO2-cured cement-based composites. J. Clean. Prod. 2022, 366, 132968. [Google Scholar] [CrossRef]
  42. Sanjuán, M.Á.; Menéndez, E.; Recino, H. Mechanical Performance of Portland Cement, Coarse Silica Fume, and Limestone (PC-SF-LS) Ternary Portland Cements. Materials 2022, 15, 2933. [Google Scholar] [CrossRef] [PubMed]
  43. Sheng, J.; Zhang, M.; Yang, R.; Xie, W.; Wang, Y. High-Performance Calcium Silicate Board Reinforced by Microfibrillated Cellulose/Microsilica. ACS Sustain. Chem. Eng. 2023, 11, 7053–7061. [Google Scholar] [CrossRef]
  44. Wang, X.; Zheng, M.; Ji, R.; Li, Y.; Lu, C.; Zhao, H.; Liang, J. Multiscale and multidimensional analysis of coarse aggregate morphological characteristics for road-used steel slag. Constr. Build. Mater. 2026, 506, 145025. [Google Scholar] [CrossRef]
  45. Wang, T.; Yi, Z.; Song, J.; Zhao, C.; Guo, R.; Gao, X. An industrial demonstration study on CO2 mineralization curing for concrete. iScience 2022, 25, 104261. [Google Scholar] [CrossRef] [PubMed]
  46. Wei, D.; Du, C.; Zhang, L.; Li, Y.; Ba, L. Preparation of a Composite Calcium Silicate Board with Carbide Slag and Coal-Based Solid Waste Activated by Different Alkali Activators. ACS Omega 2020, 5, 8934–8942. [Google Scholar] [CrossRef] [PubMed]
  47. Lv, C.; Liu, Z.; Wang, F.; Hu, S. Industrial solid wastes as carbonatable binders for abating CO2 emission. Renew. Sustain. Energy Rev. 2025, 214, 115557. [Google Scholar] [CrossRef]
  48. Li, L.; Jiang, T.; Chen, B.; Wen, J. Recycling of Ti-extraction blast furnace slag: Preparation of calcium silicate board with high slag content by steam pressure curing. Process Saf. Environ. Prot. 2022, 158, 432–444. [Google Scholar] [CrossRef]
  49. Xie, D.; Zhang, Z.; Liu, Z.; Wang, F.; Hu, S.; Fu, J. Utilization of magnesium slag to prepare CO2 solidified fiber cement board. Constr. Build. Mater. 2024, 411, 134345. [Google Scholar] [CrossRef]
  50. Calderón-Morales, B.R.S.; Costal, G.Z.; García-Martínez, A.; Pineda, P.; García-Tenório, R. Reducing Global Warming Potential in Cement Production: A Comparative Study of Slate and Marble Waste as Sustainable. IOP Conf. Ser. Earth Environ. Sci. 2025, 1536, 012028. [Google Scholar] [CrossRef]
  51. Zhang, Q.; Feng, P.; Shen, X.; Lu, J.; Ye, S.; Wang, H.; Ling, T.; Ran, Q. Utilization of solid wastes to sequestrate carbon dioxide in cement-based materials and methods to improve carbonation degree: A review. J. CO2 Util. 2023, 72, 102502. [Google Scholar] [CrossRef]
Figure 1. Calcium Silicate Board Production Process and Appearance.
Buildings 16 02566 g001
Figure 2. Carbon Emission Accounting Boundaries for the Entire Production Process of Calcium Silicate Board.
Buildings 16 02566 g002
Figure 3. Schematic Diagram of Different Areas of a Cement Test Specimen.
Buildings 16 02566 g003
Figure 4. Microscopic analysis of cement paste specimens: (a) XRD; (b) TG; (c) FTIR; (d) Pore volume.
Buildings 16 02566 g004
Figure 5. Carbon Sequestration Performance and Mechanical Properties of Cement Paste Specimens: (a) CO2 Sequestration Rate; (b) Compressive Strength.
Buildings 16 02566 g005
Figure 6. Comparison of Carbon Emissions Between Baseline Scenario and Project Scenario.
Buildings 16 02566 g006
Figure 7. Carbon Emission Reduction Benefit of CO2 Mineralization Curing Under Various Production Levels.
Buildings 16 02566 g007
Figure 8. Carbon Emission Share of Raw Materials and Energy: (a) Baseline Scenario; (b) Project Scenario.
Buildings 16 02566 g008
Figure 9. Carbon Emissions and Mitigation Benefits at Various CO2 Sequestration Rates.
Buildings 16 02566 g009
Table 1. Annual Consumption of Various Raw Materials and Energy in the Production Line.
Raw Material/EnergyAnnual ConsumptionUnit
Cement14,550tons
Quartz Sand22,415tons
Paper Fiber2835tons
Wollastonite700tons
Water/Steam1.5 × 104tons
Natural Gas6 × 105Nm3
Electricity5.5 × 106kWh
Table 2. Carbon Emission Factors of Various Raw Materials and Energy Sources.
No.Raw Material/EnergyCarbon Emission Factors
1Cement527.4 kg CO2/t [31]
2Quartz Sand2.51 kg CO2/t [30]
3Wollastonite40.7 kg CO2/t [30]
4Paper Fiber190 kg CO2/t
5Transportation of Raw Materials0.23 kg CO2/(t·km) [26]
6Water0.452 kg CO2/t [30]
7Natural Gas5.61 × 104 kg CO2/TJ [31]
8Electricity0.2472 kg CO2/kWh [31]
Table 3. Values of Various Factors under Different Production Levels.
Production LevelElectricity Factor
(kg CO2/kWh)
Transport Distance (km)Mineralization Efficiency (%)CO2 Sequestration Rate (%)
Conservative0.247220060 ω a c t u a l
Backward0.350030040 ω t h e o r e t i c a l   m i n i
Progressive0.150010080 ω t h e o r e t i c a l   m a x
Table 4. Mass Variation in the Sample Throughout the Testing Process (Unit: g).
Sample NumberMass Before Placing in the OvenAfter Drying (m0i)After Carbonation (mi)Mass of Moisture (mw)
1101.694.496.19.1
2113.7109.0111.3
393.689.291.2
Table 5. CO2 Sequestration Efficiency of Cement Paste Specimens Under Different Conditions.
Time (Hours)1246816
Pressure (MPa)
0.17.8410.6114.4516.0117.5019.31
0.29.6312.3416.8017.9819.0021.77
0.310.9413.7417.7419.2520.3222.63
0.411.6414.2918.1419.5920.5923.24
Table 6. Total Carbon Emission Accounting.
No.Sources of Carbon EmissionsBaseline ScenarioProject Scenario
Annual ConsumptionCarbon EmissionsAnnual ConsumptionCarbon Emissions
1Cement14,550 t7682.4014,550 t7682.40
2Quartz Sand22,415 t56.2622,415 t56.26
3Wollastonite700 t28.49700 t28.49
4Paper Fiber2835 t538.652835 t538.65
5Transportation40,500 t × 200 km1863.0040,500 t × 200 km1863.00
6Water1.5 × 104 t6.781.2 × 104 t5.424
7Natural Gas6 × 105 Nm31198.6300
8Electricity5.5 × 106 kWh1359.605.5 × 106 kWh1359.60
9CO2003483192.80
TOTAL12,733.81 t CO211,726.63 t CO2
Table 7. Net Carbon Emission Calculation Results Under Different Scenarios (Unit: t CO2).
Production LevelBaseline ScenarioCO2 Storage CapacityProject ScenarioEmission ReductionNet Emission Reduction
Backward14,230.711138.0513,253.44977.272115.32
Conservative12,733.812089.8011,726.631007.283097.08
Progressive11,267.713377.7010,209.931057.794435.49
Table 8. Carbon Emission Accounting under Different CO2 Sequestration Levels (Unit: t CO2).
CO2 Sequestration RateCO2 ConsumptionCarbon EmissionsNet Carbon EmissionsEmission ReductionNet Emission Reduction
5.16%3483.0010,236.498146.692497.334587.13
8.00%5400.0010,343.037103.032390.795630.79
10.00%6750.0010,418.066368.062315.766365.76
15.00%10,125.0010,605.634530.632128.188203.18
20.00%13,500.0010,793.212693.211940.6110,040.61
Disclaimer/Publisher’s Note: The statements, opinions and data contained in all publications are solely those of the individual author(s) and contributor(s) and not of MDPI and/or the editor(s). MDPI and/or the editor(s) disclaim responsibility for any injury to people or property resulting from any ideas, methods, instructions or products referred to in the content.