Article

A Numerical Study on the Influence of Debonding in Concrete-Filled Steel Tube Columns on Structural Dynamic Characteristics

1
School of Civil and Environmental Engineering, Harbin Institute of Technology (Shenzhen), Shenzhen 518055, China
2
Guangdong Provincial Key Laboratory of Intelligent and Resilient Structures for Civil Engineering, Shenzhen 518055, China
3
Department of Architecture, Built Environment and Construction Engineering (ABC), Politecnico di Milano, Piazza Leonardo da Vinci, 32, 20133 Milan, Italy
*
Author to whom correspondence should be addressed.
Buildings 2026, 16(12), 2450; https://doi.org/10.3390/buildings16122450
Submission received: 16 May 2026 / Revised: 9 June 2026 / Accepted: 16 June 2026 / Published: 20 June 2026

Abstract

The influence of debonding in concrete-filled steel tube (CFST) columns on the dynamic characteristics of super high-rise buildings is a common concern that remains insufficiently understood. The abnormal vibration incident of the SEG Plaza on 18 May 2021, also known as the 5·18 incident, serves as a typical case highlighting this issue. After two decades of service, the first-order bending frequency of the building decreased by approximately 6.1%, and extensive CFST column debonding was observed, with the maximum debonding rate reaching up to 97% on certain middle floors. To investigate the influence of CFST column debonding on structural dynamic characteristics, this study first derives a theoretical relationship between debonding parameters, namely angle and distance, and the equivalent bending stiffness of CFST columns. This analytical formulation is then implemented and validated through finite element simulations at multiple scales, including planar frame analysis in ABAQUS, a thin-interlayer simulation method in ANSYS, and full-building modeling in ETABS. Results show that for a planar frame, when a CFST column debonds at 270°, the structural natural frequency decreases by 0.984%; when the debonding angle is 180° with a 2 mm gap, the first-order frequency decreases by 0.141%. Numerical simulation of the SEG Plaza structural model predicts a reduction in the first-order frequency of 0.987% under the observed debonding conditions, confirming that debonding impairs force transmission, reduces structural stiffness, and alters natural frequencies. This study provides a mechanistic basis for evaluating stiffness degradation in long-service super high-rise buildings.

1. Introduction

Concrete-filled steel tube (CFST) columns with high load-bearing capacity, fire resistance, and excellent seismic performance have been widely used in high-rise buildings [1,2,3,4,5,6]. CFST columns are critical components in the design of high-rise building structures [7], with the corresponding analysis theories and design methods being increasingly mature. However, CFST columns can deteriorate over the long-term operation. In practical structures, debonding defects can occur in CFST columns, leading to degraded stiffness and dynamic performance of structures [8].
The abnormal vibration incident of the SEG Plaza in Shenzhen on 18 May 2021, i.e., the 5·18 incident, brought this issue to the forefront. In this 72-story superhigh-rise building, investigations revealed that the direct external cause was vortex-induced resonance of the mast, whose dominant frequency of 2.12 Hz coincided with a modal frequency of the main structure. More importantly, after 20 years of service, the structural dynamic characteristics had significantly changed compared to its completion in 2000: the first-order bending frequency decreased by approximately 6.1%, and the damping ratio dropped by more than half. On-site inspections further found extensive CFST column debonding, with debonding rates reaching as high as 99% on some middle floors. These findings strongly suggest that debonding-induced stiffness degradation contributes to the alteration of structural dynamic properties, thereby affecting the occurrence of resonance. Motivated by this incident, it is essential to investigate how CFST column debonding influences the dynamic characteristics of structural systems.
Extensive research has been conducted on the effect of debonding on the load-bearing capacity of CFST columns. Han et al. [9] studied the mechanical performance of debonded CFST columns under eccentric loads and suggested setting the gap ratio in actual structures to 0.05%. Xue et al. [10] investigated the effects of debonding defects on short CFST columns and found that local buckling was more severe in debonded specimens. Schnabl et al. [11] proposed a mathematical model to derive the changes in buckling load due to annular and partial debonding in slender CFST columns. Liao et al. [12,13,14] conducted axial compression, pure bending, and torsion tests on debonded CFST columns. Ahmad et al. [15] studied the effect of debonding distance on column performance. Manigandan [16], Yu [17], and Wang et al. [18] examined the mechanical performance of short CFST columns with different initial defects. Xue et al. [19] derived new formulas for predicting ultimate load-bearing capacity, reduction coefficients, ductility, and stiffness using evolutionary polynomial regression. Zhang [20] and Liao et al. [21] studied the effect of debonding on CFST members under combined compression–bending–torsion. Han [22] and Zhang et al. [23] examined the hysteretic performance of debonded CFST columns.
In recent years, special-shaped CFST columns (e.g., L-shaped, T-shaped, and cruciform sections) have attracted increasing attention. Hassam et al. [24] developed a finite element model for cross-shaped CFST stub columns and proposed a design-oriented formula for predicting their compressive strength. Li et al. [25] experimentally and numerically investigated the axial compression behavior of cruciform CFST columns stiffened by steel angles. These studies demonstrate that special-shaped CFST columns exhibit mechanical properties comparable to conventional sections. However, the influence of debonding on the global dynamic characteristics of complete building systems that employ either conventional or special-shaped CFST columns remains largely unexplored.
Regarding dynamic characteristics, Chen [26] found that debonding reduces the fundamental frequency of a CFST column. Hu [27] conducted excitation tests on CFST cantilever columns and observed that debonding weakens their vibration characteristics. Guo et al. [28,29] analyzed the causes of debonding and studied the effect of composite defects on bridge supports. In the field of bridge engineering, Lu et al. [30] reported that the natural frequency of arch bridges gradually decreases with increasing annular debonding rate and distance. Lu et al. [31] used finite element software to analyze the effect of debonding in CFST arch ribs on dynamic performance, also noting a reduction in frequency.
In summary, existing research has mainly focused on the static load-bearing capacity of debonded CFST columns or on the dynamic characteristics of debonded CFST arch bridges. Studies on the dynamic performance degradation of building structures due to CFST column debonding are still insufficient. For the safe operation of high-rise buildings, the adverse effect of CFST column debonding on structural dynamic characteristics must be further investigated.
Therefore, this study proposes a mechanism revealing the adverse effect of the CFST column debonding on structural dynamic characteristics. The mapping relationship between the debonding angle and the distance of the CFST columns and structural frequency is established. The structural performance degradation can be evaluated for the operation and maintenance phases of superhigh-rise buildings.
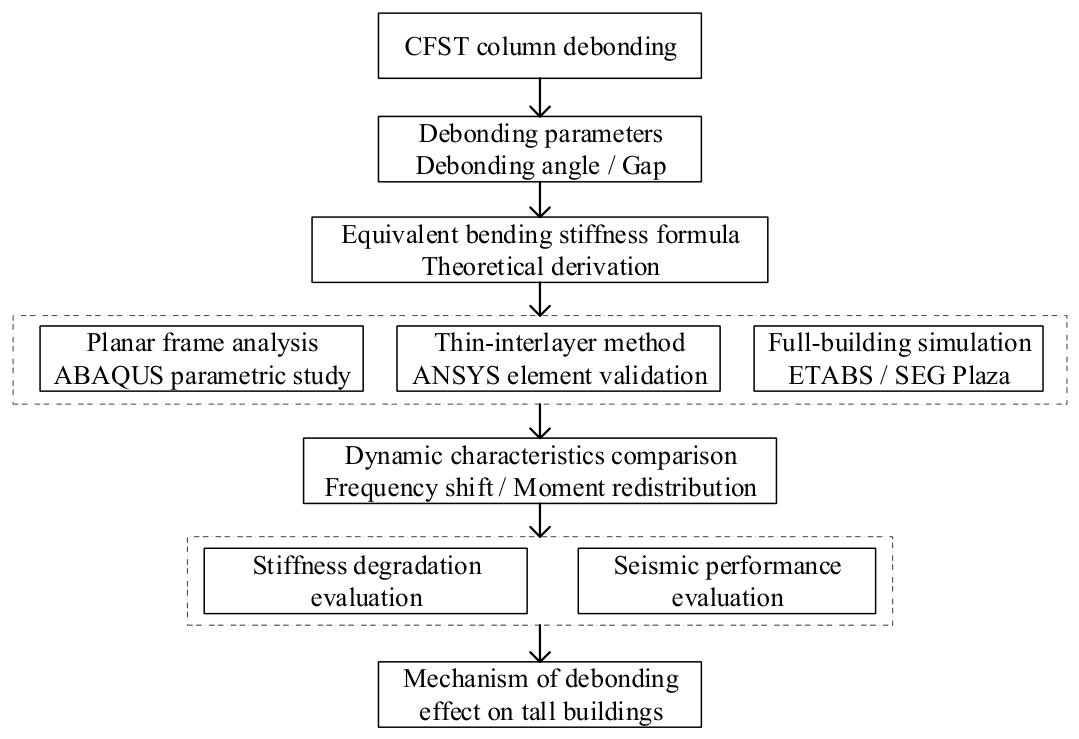
Figure 1 illustrates the methodological framework of the present study. The paper is organized as follows. Section 2 introduces the mechanism by which CFST column debonding affects structural stiffness and frequency. Section 3 uses finite element software to simulate the effects of debonding parameters on structural frequency and proposes a “thin interlayer” simulation method for CFST column debonding. Section 4 studies the effect of CFST column debonding on an actual superhigh-rise structure.

2. Mechanism of the Effect of Debonding in CFST Columns on Structural Dynamic Characteristics

2.1. Effect of Debonding in CFST Columns on the Force Transmission of a Structural System

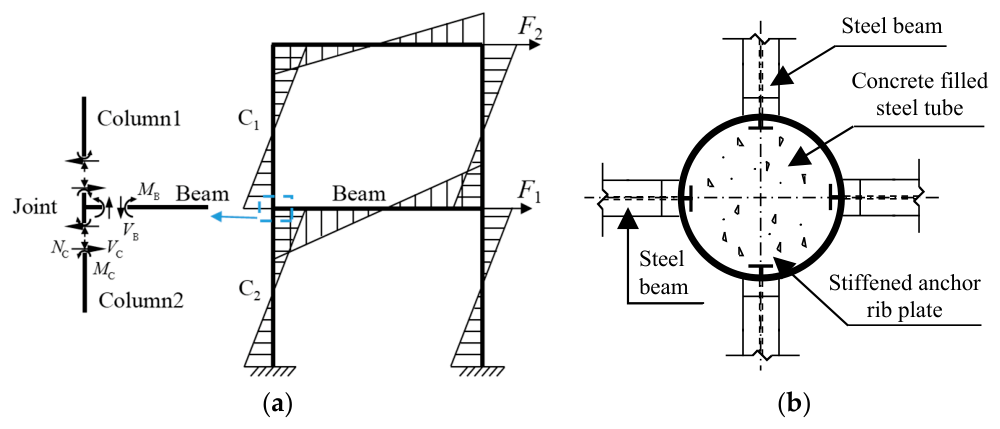
From the perspective of structural systems, the steel beams and steel–concrete columns are rigidly connected in a healthy state. Under horizontal loads, the shear force at the beam end is transmitted to the column in the form of axial force, while the bending moment at the beam end is transmitted to the column in the form of column bending moment and shear force, creating a structural lateral force resistance system (Figure 2a). In accordance with the joint between the beam and the steel–concrete column (Figure 2b), the shear force and the bending moment at the end of the beam are transmitted to the steel–concrete column through the outer steel pipe of the column. If the steel pipe and column are not debonded, the steel pipe and concrete core column in the CFST column can work together to bear the axial force, shear force, and bending moment transmitted by the beam. However, if debonding occurs, the transmission path of the axial force, shear force, and bending moment borne by the steel pipe to the concrete core column is weakened.
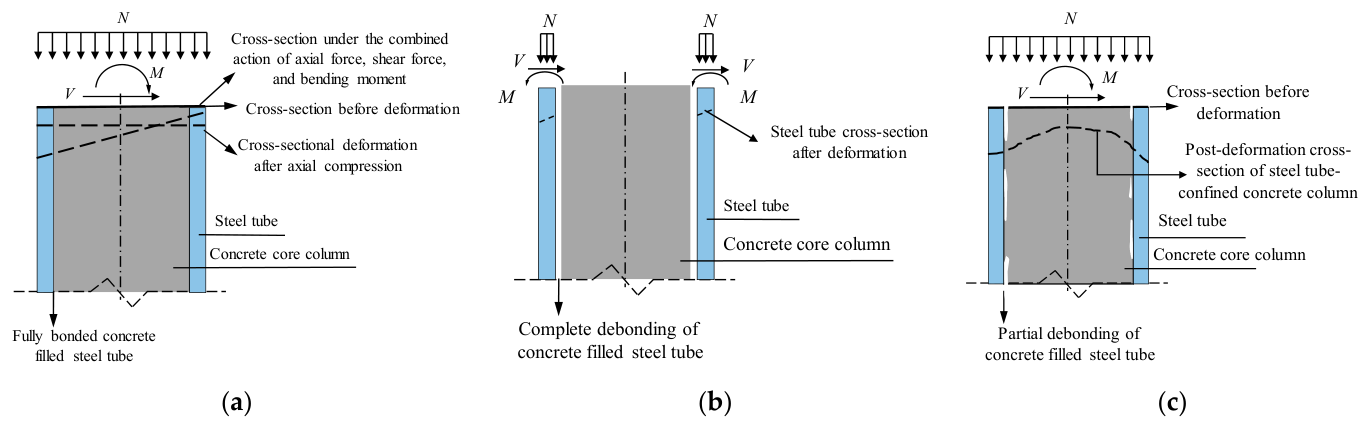
The deformation of the section of the CFST column satisfies the assumption of a flat section when the CFST column is not debonded. The steel tube and concrete core column in the CFST column can synergistically deform to jointly bear the axial force, shear force, and bending moment transmitted at the beam end (Figure 3a). In this case, the structure is a composite structure, and its lateral stiffness is consistent with the design documents.
The debonding of the steel-reinforced concrete column makes the steel tube and the concrete core work independently. The deformation of the cross-section of the CFST column does not meet the assumption of a flat section. The axial force, shear force, and bending moment transmitted from the beam end to the column are borne by the steel tube (Figure 3b). The bearing capacity of the CFST column mainly depends on the steel tube. Accordingly, the structure performance degrades as a steel structure whose lateral stiffness and damping ratio are smaller than those of the composite structure.
Partial debonding of the steel tube and concrete core column exists in the CFST column of most long-term-service structures. However, owing to the presence of stiffeners and other structural measures in the CFST column, the steel tube and concrete column can still work together, but cannot meet the assumption of collaborative work in the planar section (Figure 3c). The structural performance is in the middle state between the above two extreme situations. In this case, the efficiency of the concrete core column in the CFST column is discounted, reducing the bearing capacity of the CFST column and the lateral stiffness of the structure.

2.2. Influence of Debonding in CFST Columns on the Stiffness of the Column Section

The stress on CFST columns after debonding is relatively complex. The following assumptions are made for the derivation process. (1) The stress on the concrete core column and the steel tube linearly changes as the CFST column hollow develops. (2) Given the small steel pipe wall thickness, the influence of steel pipe thickness is ignored in the equilibrium equation section. (3) The debonding distance is significantly smaller than the diameter of the steel pipe, that is, r δ r and d δ d , where δ is the clearance distance, and r and d are the radius and diameter of the CFST column, respectively. (4) The CFST column does not experience significant buckling. (5) The radial stress distribution at the interface between steel pipes and concrete is uniform.
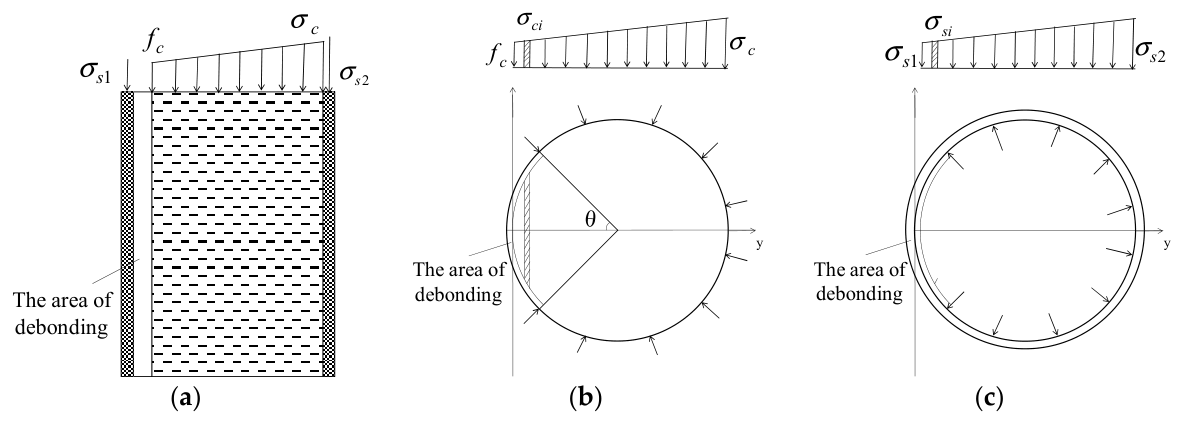
When the CFST column experiences debonding, the force-transmission mechanism changes. The longitudinal stress diagram of the CFST column [32] is shown in Figure 4a. In the derivation process, the CFST column with debonding defects is divided into a concrete core column and a steel tube. The equilibrium equation is established on the basis of the stress diagram (Figure 4b,c).
Combining the internal force balance equation, deformation coordination equation, and stress distribution assumption of the debonding part of the steel–concrete column, the theoretical expression of the equivalent section stiffness of the steel–concrete column B considering the debonding angle θ and debonding spacing δ can be established as shown in Equation (1). The detailed theoretical derivation can be found in Appendix A.
B = η e 0 d c E s { f c r [ π r δ ( θ 1 2 sin 2 θ ) ] + σ c r [ π r + δ ( θ 1 2 sin 2 θ ) ] + 2 t r π σ s 1 ( 1   +   k ) } 4 π [ ( 4 t r σ s 1 ( 1   +   k ) D 2     d 2 + 64 t r 2 σ s 1 ( 1   +   k ) π ( D 3     d 3 ) ] 2 [ ( 4 t r σ s 1 ( 1   +   k ) D 2     d 2 64 t r 2 σ s 1 ( 1   +   k ) π ( D 3     d 3 ) ]
where δ is the debonding distance, θ is the debonding angle, r   is the radius of the steel-reinforced concrete column, d is the inner diameter of the steel-reinforced concrete column, D is the outer diameter of the steel-reinforced concrete column, t is the thickness of the steel pipe, μ c is the Poisson’s ratio of the concrete material, μ s   is the Poisson’s ratio of the steel pipe material, E c   is the elastic modulus of the concrete, and E s is the elastic modulus of the steel pipe, f c   is the design value of compressive strength of concrete, η is the structural importance coefficient, e 0 is the eccentricity of the section axial force, k is the relationship between the steel pipes σ s 1 and σ s 2 , σ c is the longitudinal stress of concrete, and σ s 1 is the longitudinal stress on the debonding side of the steel pipe concrete.
The CSD10 CFST column in the SEG Building in Shenzhen is selected as an example for section stiffness calculation. The relevant parameter values of CSD10 steel-reinforced concrete columns are shown in Table 1. Table 2 shows the results of debonding testing on steel-reinforced concrete columns. The debonding situation in the middle floor of the building is relatively serious, with a debonding rate of over 95% from the 19th floor to the 63rd floor. However, the debonding distance of the CFST columns is relatively small, ranging from 0.05 mm to 0.2 mm.
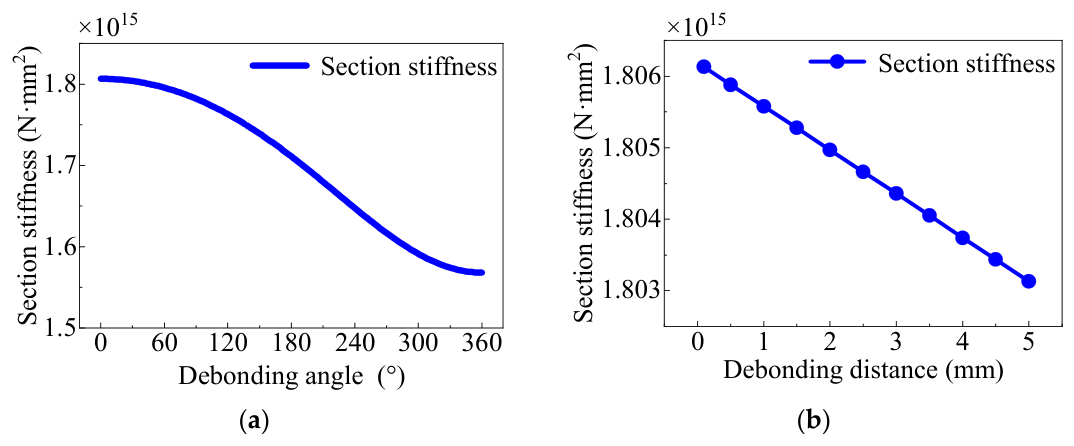
When the debonding distance δ remains constant at 2 mm, the parameters of the CSD10 column in Table 1 are substituted into Formula (1), and the equivalent stiffness B of the cross-section varies with the debonding angle θ as shown in Figure 5a. As shown in Figure 5a, when the debonding angle θ changes from 0 to 360°, the equivalent stiffness B of the cross-section decreases from 1.806 × 10¹⁵  N · m m 2 to around 1.6 × 10¹⁵  N · m m 2 , with a decrease of about 11%. The result indicates that as the debonding angle increases, the equivalent stiffness of the cross-section gradually decreases.
Figure 5b shows the relationship between the calculated section stiffness B of the steel–concrete column and the debonding distance δ when the debonding angle θ is 180°. As shown in the figure, when the debonding angle θ is constant, the debonding distance δ changes from 0.1 mm to 5 mm, and the section stiffness B decreases from 1.806 × 10¹⁵  N · m m 2 to 1.8035 × 10¹⁵  N · m m 2 , with a variation amplitude of 0.138%. This indicates that when the debonding angle is constant, the effect of debonding distance on section stiffness is relatively small.
The value of stiffness for CFST columns, as composite structures, has always been somewhat uncertain. Significant differences in the calculation methods for structural stiffness for CFST are observed in various countries. For example, in China’s Technical Code for CFST Structures (GB 50936-2014) [33], the axial compression stiffness E A , bending stiffness E I , and shear stiffness G A of CFST are calculated by adding the stiffness of steel tubes and core concrete, as shown as follows:
E A = E s A s + E c A c
E I = E s I s + E c I c
G A = G s A s + G c A c
where Gs and Gc are the shear moduli of steel pipes and concrete, respectively; As and Ac are the cross-sectional areas of steel pipes and concrete, respectively.
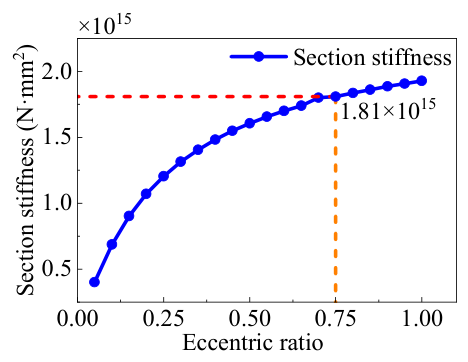
After debonding occurs in the CFST column, the stress situation of the column changes. In the previous calculation, the ratio of the bending moment axial force borne by the column component is used to treat the section bending moment. When the bending moment M increases, the eccentricity e will also increase. However, given the different cross-sectional dimensions of the CFST column, the eccentricity (denoted as φ) is proposed to be used for comparative calculation between the section stiffness and bending stiffness, as shown in Figure 6, where the eccentricity is the ratio of the eccentricity to the section radius.
When debonding occurs in CFST, the bending stiffness can be calculated using the standard formula, namely, Equation (3), and the stiffness of the section without debonding defects can be used for verification and correction. According to Equation (1), when the eccentricity is 0.75, the calculation results of equivalent bending stiffness B and the calculation results EI according to the specifications are shown in Table 3. When the debonding angle and distance are both zero, other CFST columns are substituted into the trial calculation. The calculated section stiffness B is in good agreement with the bending stiffness EI calculated using the standard, and the error of both is less than 2% for all columns.

2.3. Effect of Debonding on Moment Transfer in Steel Pipe–Concrete Columns

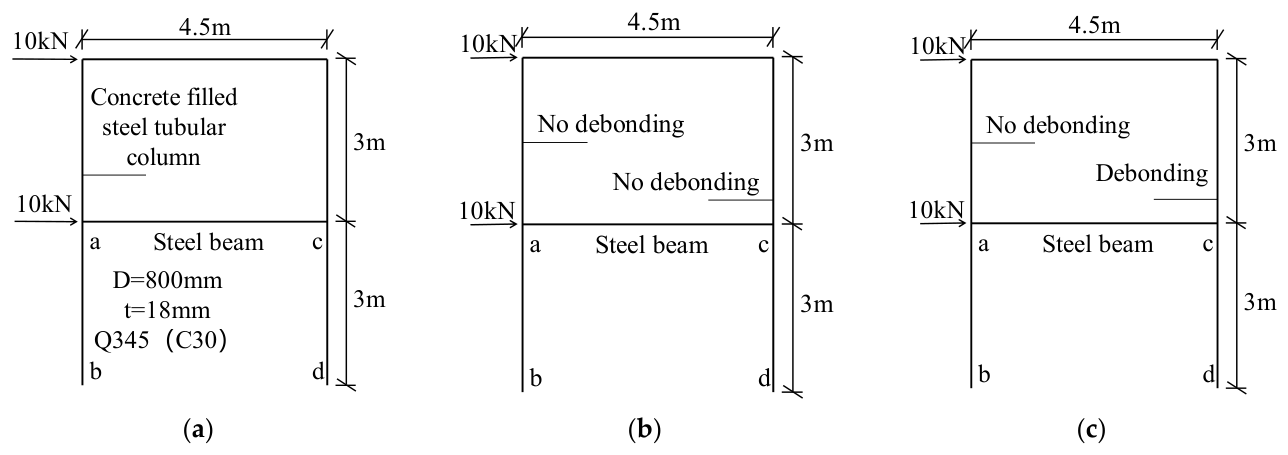
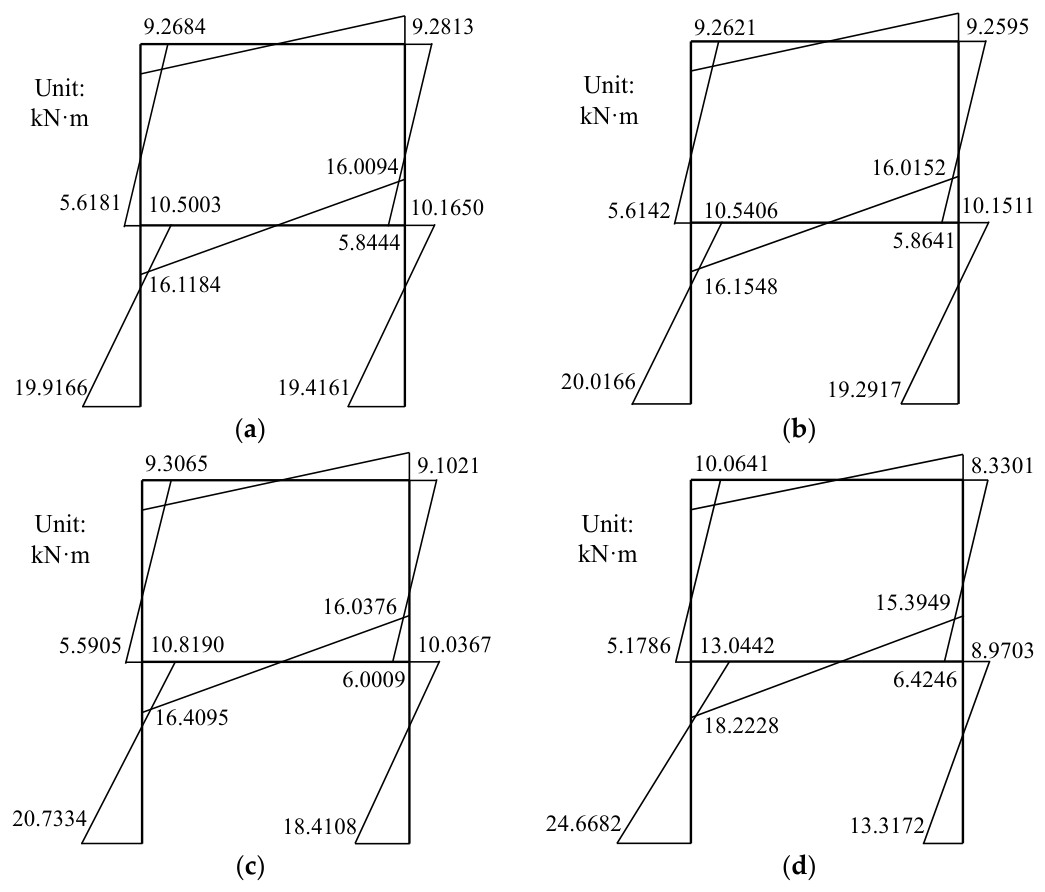
For determining the effect of CFST column debonding on the force transmission of a structural system, a frame is taken as an example to study the bending moment changes in a planar frame under lateral force in different working conditions (Figure 7). Four working conditions are set here: In working condition 1, the CFST columns on both sides of the structure are not debonded, simulating the healthy working state of the structure. Working conditions 2 and 3 have no debonding on one side but have a debonding distance of 2 mm on the other side, with debonding angles of 90° and 270°, respectively. Equation (1) is used to calculate the stiffness reduction in the corresponding steel–concrete columns to simulate the deterioration of the components in the structure, that is, partial debonding in the steel–concrete columns. The debonding side of working condition 4 is an empty steel pipe to simulate extreme debonding situations.
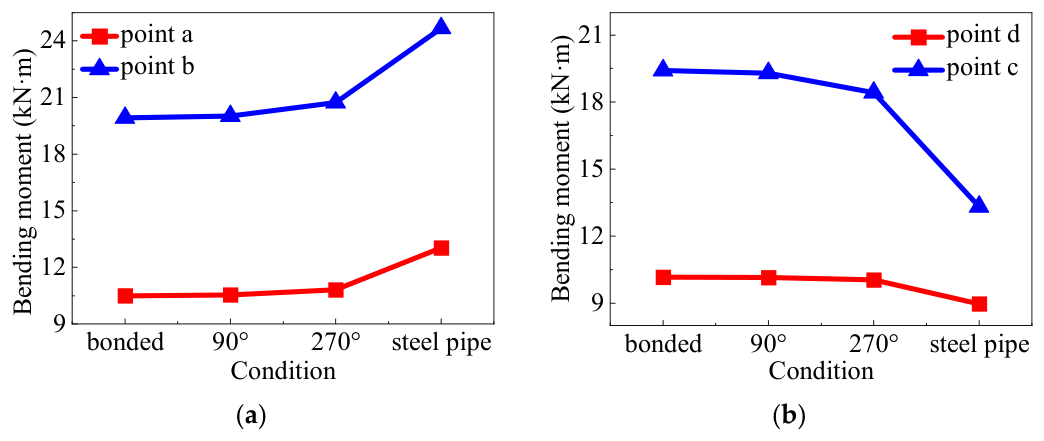
The same lateral force is applied to study the effect of debonding on structural moment transfer. Point a is the top of the left side non-debonded CFST lower column, point b is the bottom of the left side non-debonded CFST lower column, point c is the top of the right CFST lower column, and point d is the bottom of the right CFST lower column. The calculation results of the planar frame bending moment diagram are shown in Figure 8, and the bending moment changes at each point are listed in Figure 9. The calculation results demonstrate that after CFST debonding on one side of the planar frame, the bending moment borne by the CFST column on the non-debonding side gradually increases with an increase in debonding angle. When the debonding side is an empty steel tube, the bending moments borne by the top (point a) and bottom (point b) of the CFST column on the non-debonding side increase by 24.23% and 23.86%, respectively. As the debonding angle increases, the bending moment borne by the CFST column on the debonding side gradually decreases. When the debonding side is an empty steel tube, the bending moments at the top (point c) and bottom (point d) of the steel tube column decrease by 11.75% and 31.41%, respectively. Debonding changes the force transmission of the structure. As the debonding deterioration of the CFST column intensifies, the force on the debonding column gradually decreases, whereas the force on the non-debonding side gradually increases.

3. Finite Element Simulation of the Effect of CFST Column Debonding on Structural Dynamic Characteristics

3.1. Finite Element Simulation Method Using ABAQUS

ABAQUS is used to simulate the effect of debonding in CFST columns on structural dynamic characteristics, and solid elements (C3D8R) are employed for steel tubes, concrete core columns, steel beams, and floor slabs. On the basis of existing research, a secondary plastic flow model for steel, Han Linhai’s constitutive model for concrete [34], and Tie (binding connection) for beam–column connections are used to determine the constitutive relationship of materials.
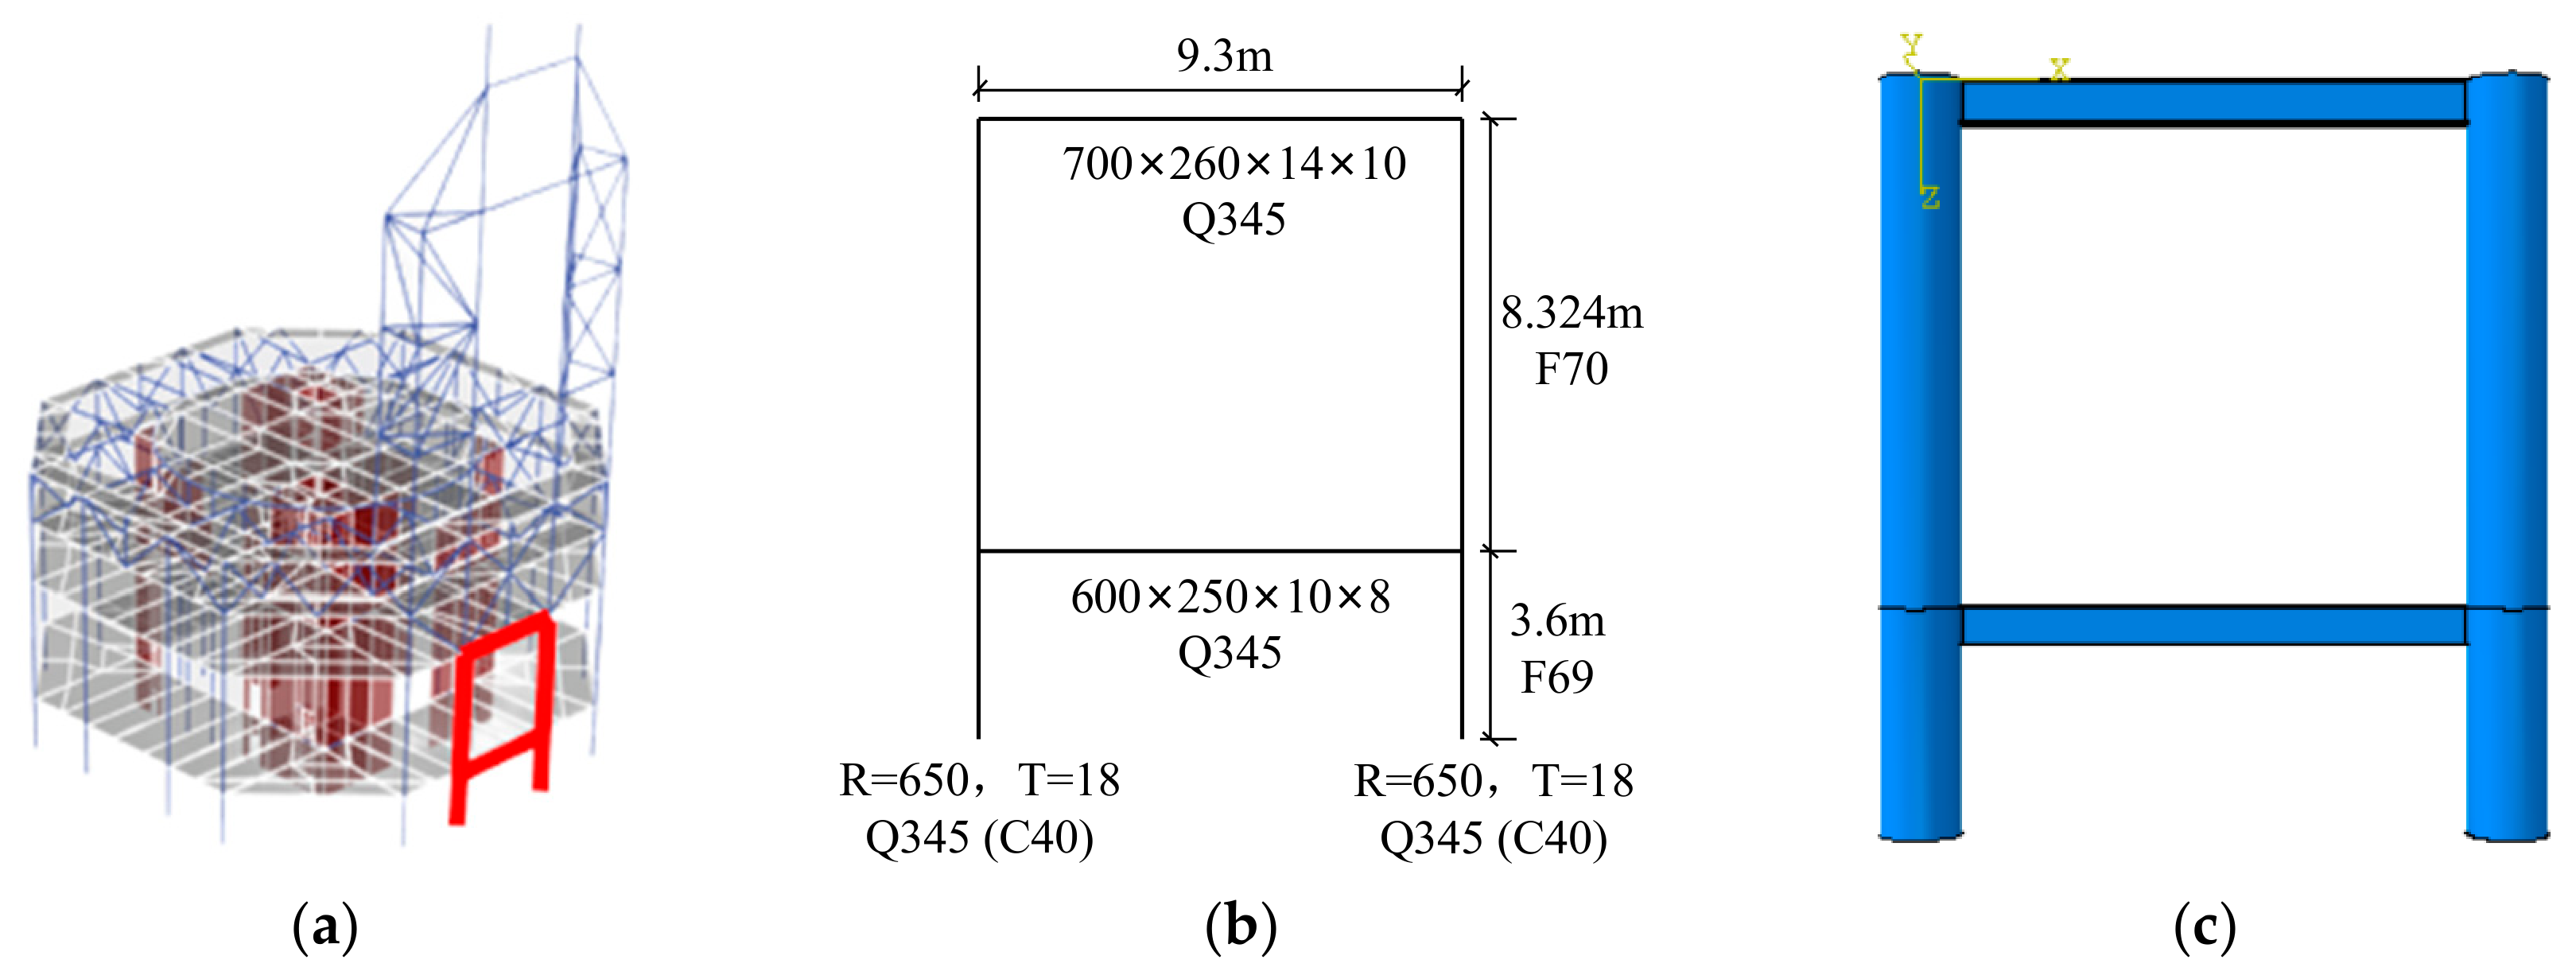
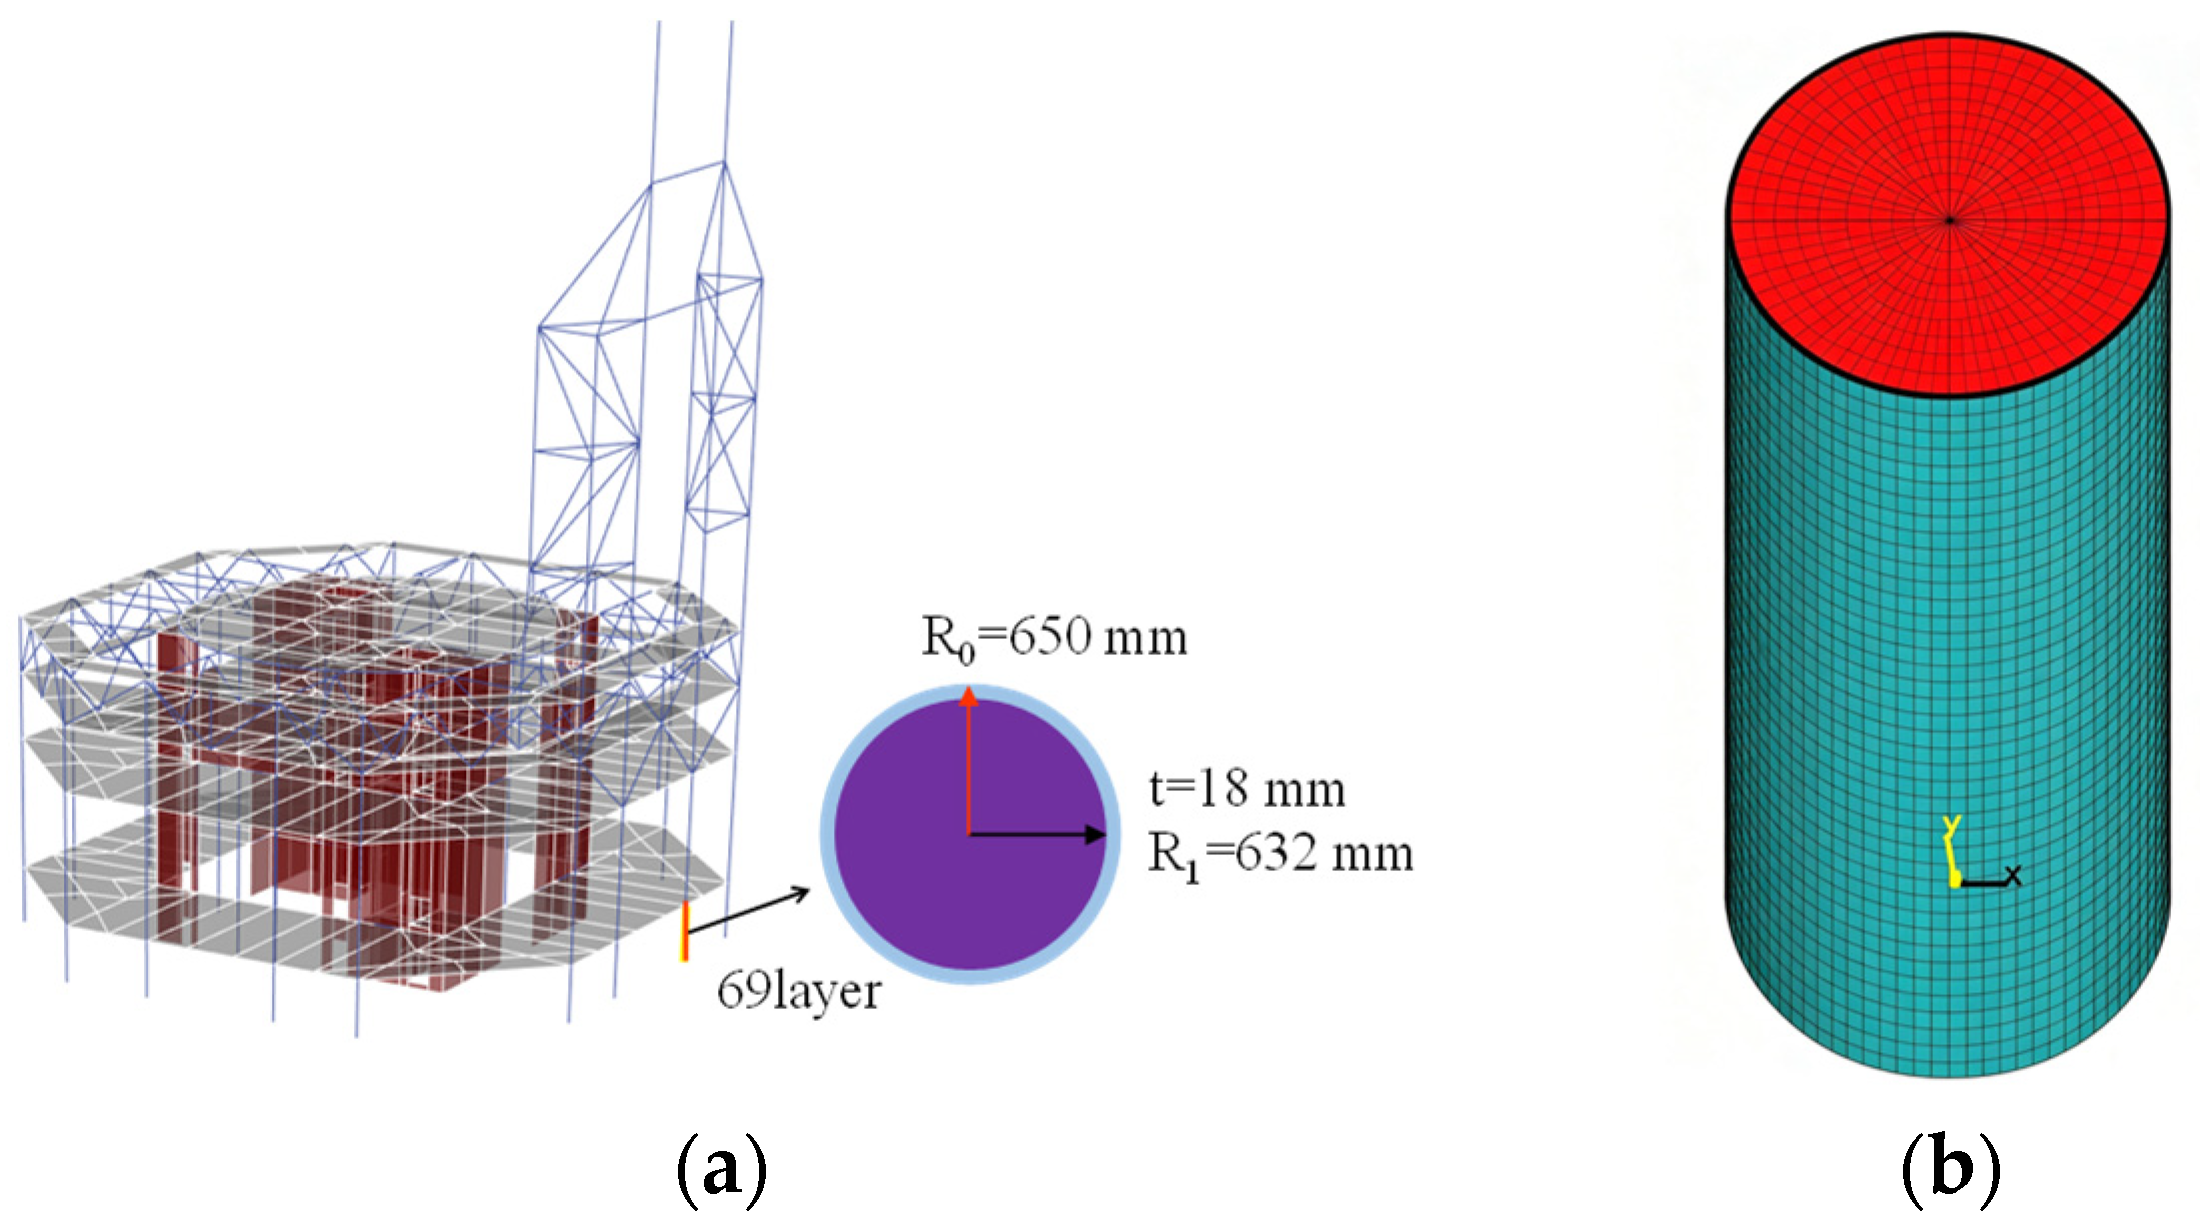
The 69th and 70th floors of the building in Shenzhen are taken as examples. The frame is composed of CFST columns and steel beams. The outer radius of the steel tube in CFST is 650 mm, the wall thickness of the steel tube is 18 mm, the steel tube has a yield strength of 345 MPa, and the elastic modulus is 2.06 × 10⁵  M P a . The Poisson’s ratio is 0.3. The radius of the concrete core column is 632 mm, with a concrete cubic compressive strength of 40 MPa, and the elastic modulus is 3.25 × 10⁴  M P a . The Poisson’s ratio is 0.2, the heights of the 69th and 70th floors are 8324 and 3600 mm, respectively, and the sizes of the steel beams are 700 mm × 260 mm × 14 mm × 10 mm and 600 mm × 250 mm × 10 mm × 5 mm. The finite element model for the frame position and parameters is shown in Figure 10.

3.2. Finite Element Simulation of the Influences of Debonding Parameters on Structural Dynamic Characteristics

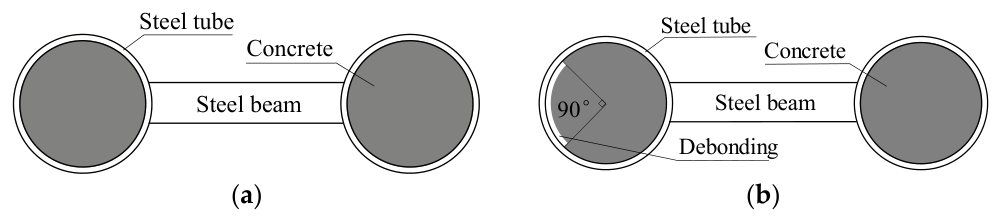
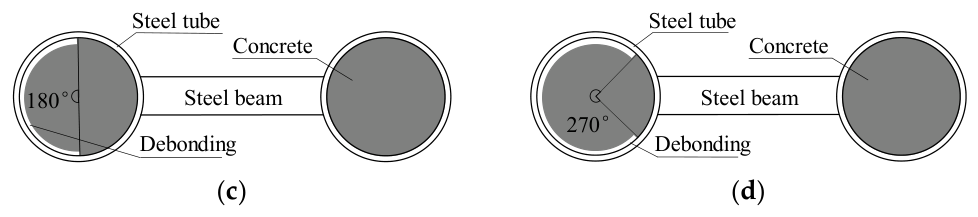
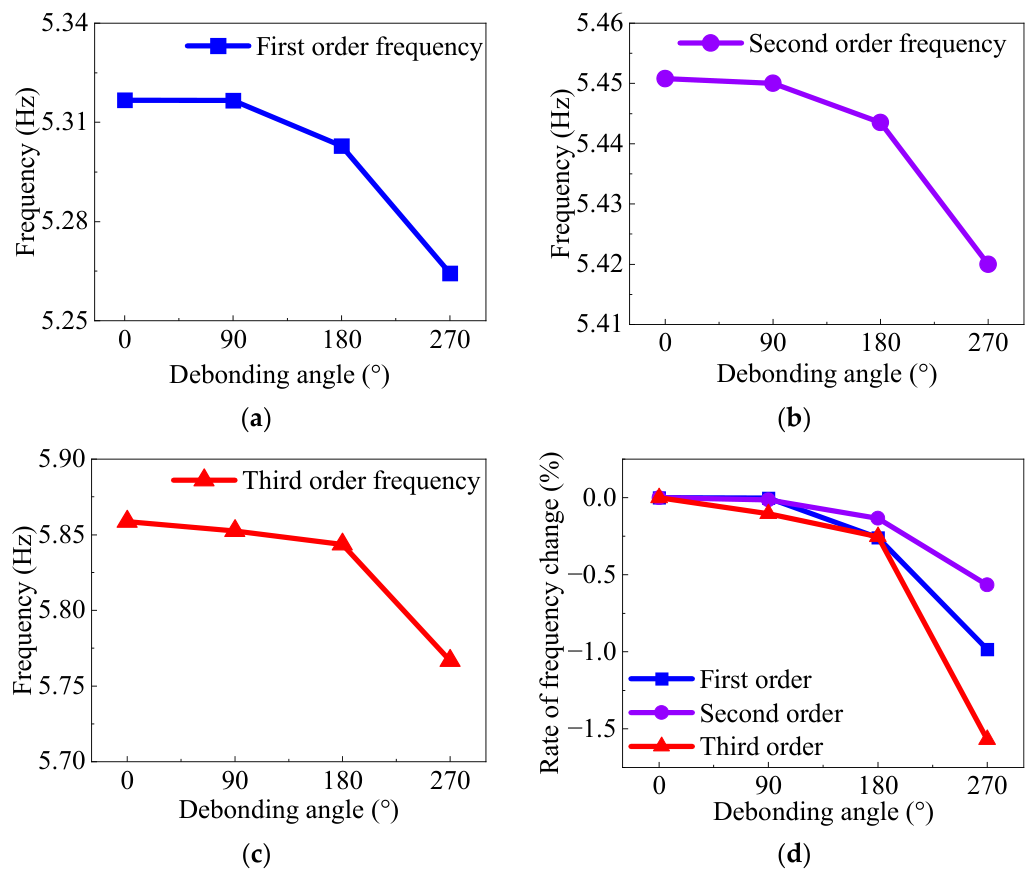
Keeping the debonding distance of 2 mm constant for steel-reinforced concrete columns, the effects of debonding angles of 0°, 90°, 180°, and 270° on the first three frequencies of structural dynamic characteristics were studied. The schematic diagram is shown in Figure 11, and the simulation results are shown in Figure 12. As shown in Figure 12a–c, the frequencies of the first three orders decrease with the increase in debonding angle, with the first order frequency decreasing from 5.3167 Hz to 5.2644 Hz, the second order frequency decreasing from 5.4508 Hz to 5.4200 Hz, and the third order frequency decreasing from 5.8586 Hz to 5.7667 Hz. As shown in Figure 12d, when the debonding angle is 270°, the change rates of the first three orders are 0.984%, 0.565%, and 1.569%, respectively.
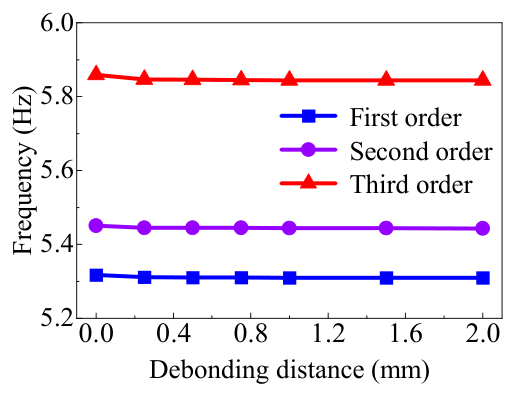
Keeping the debonding angle constant at 180°, as shown in Figure 11c, the effect of varying debonding distance from 0.2 mm to 2 mm on the first three frequencies of the structure was studied. The simulation results are shown in Figure 13. From Figure 13, as the debonding distance of the steel–concrete column increases, the structural frequency gradually decreases. However, the influence of the debonding distance on the structural frequency is relatively small. Compared with the values when the debonding distance is 2 mm, the first-order frequency of the planar frame decreases by 0.141%, the second-order frequency decreases by 0.134%, and the third-order frequency decreases by 0.225%.
It is noted that the parametric study in Section 3 aims to investigate the general sensitivity of structural dynamic characteristics to debonding parameters (angle and distance) using a planar frame model, rather than to replicate the exact debonding conditions of the SEG Building. For this purpose, a conservative debonding distance of 2 mm is adopted to ensure that even small effects are captured. In contrast, the full-building simulation in Section 4 uses the actual debonding distances measured in the SEG Building, which range from 0.05 mm to 0.2 mm (Table 2). Using the analytical formula derived in Section 2.2 (Equation (1)) with a representative actual gap of 0.1 mm and a debonding angle of 180°, the predicted reduction in the equivalent section stiffness is approximately 0.007%, leading to a first-order frequency decrease of less than 0.01% at the frame level. This indicates that the direct effect of the debonding distance alone is negligible for the actual measured gaps. However, the debonding angle effect (e.g., 270° debonding over a significant angular extent) remains the dominant factor, and its influence is adequately captured by the simulations with the conservative 2 mm gap. Thus, the parametric results in Section 3 provide a clear understanding of the relative importance of debonding parameters, while the realistic assessment of the SEG Building is reserved for Section 4.

3.3. Simulation Method for Debonding “Thin Interlayers” in CFST Columns

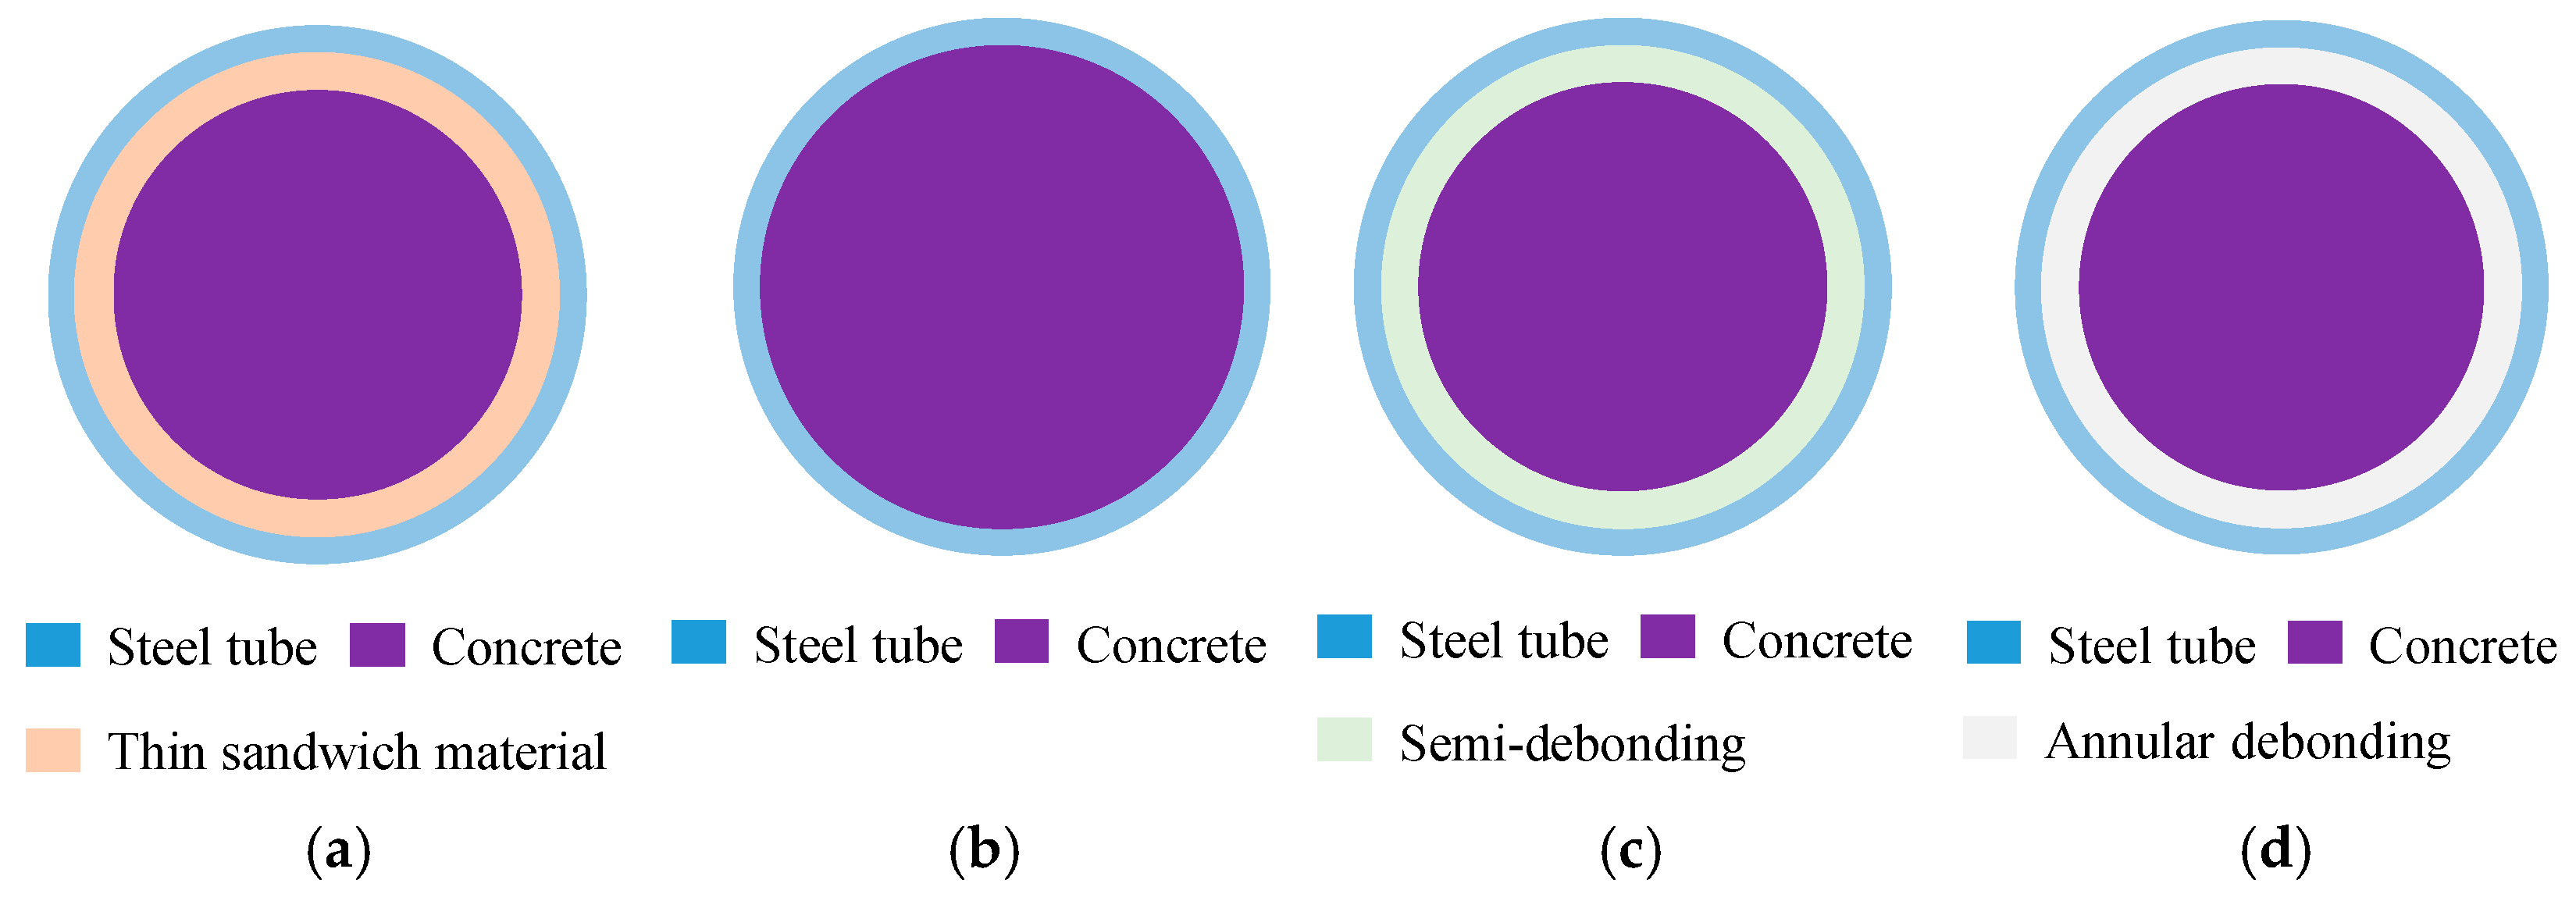
A superhigh-rise structural system is relatively complex, with a large number of types of components. If solid or refined elements are used for finite element modeling, the time cost for modeling and calculation is relatively high. For saving computational time and cost, on the basis of the custom composite section function of Ansys finite element software, as shown in Figure 14a, Beam 188 or 189 elements are used to simulate the debonding distance through the thickness of the thin interlayer, and the debonding state of CFST is simulated through the properties of the thin interlayer material. When the material properties of the thin interlayer are completely consistent with the concrete, it is considered to be in a fully bonded state, as shown in Figure 14b. When the material properties of the thin interlayer are very small and close to 0, it can be equivalent to a completely annular debonding state, as depicted in Figure 14d. When the material properties of the thin interlayer fall between the above two situations, it can be equivalent to a semi-debonding state, as shown in Figure 14c.
A single column on the mast side of a tower on the 69th floor of the building in Shenzhen (Figure 15a) is extracted for analysis to verify the effectiveness of the above simulation methods and compare the changes in structural dynamic characteristics under different debonding states. The height of the column is 3600 mm, the outer radius of the steel pipe is 650 mm, the inner radius is 632 mm, the steel pipe has a yield strength of 345 MPa, the elastic modulus is 2.06 × 10⁵    M P a , the density is 7850 k g / m 3 , and the Poisson’s ratio is 0.3. The core concrete has a cubic compressive strength of 40 MPa, the elastic modulus is 3.25 × 10⁴  M P a , the density is 2500 k g / m 3 , and the Poisson’s ratio is 0.2. We plan to analyze three working conditions. Working condition 1 refers to the fully bonded working state of CFST columns. The thickness of the thin interlayer in working condition 2 is 2 mm, and the material properties are consistent with those of the concrete core column. The thickness of the thin interlayer in working condition 3 is 2 mm, and the material properties of the thin interlayer are assigned to simulate the debonding situation of the CFST columns. The parameter settings and thin interlayer materials for each working condition are shown in Table 4. Given that the complete debonding of the ring affects the structural force transmission, the strength of the core concrete is reduced by 5% for the simulation. The feasibility of the simulation method is verified through different working conditions. The finite element model is shown in Figure 15b.
The frequencies of the first six orders of the CFST column components are shown in Table 5. The comparison of the analysis results shows that the calculated results of condition 2 are similar to those of condition 1, with a maximum error of 0.64% due to the small-element-size error in the section grid division. This similarity demonstrates the feasibility of dividing thin interlayers. Compared with condition 1, condition 3 shows a decrease in the frequency of the components after complete detachment, and the amplitude of frequency changes in the bending and torsion modes increases with an increase in order.
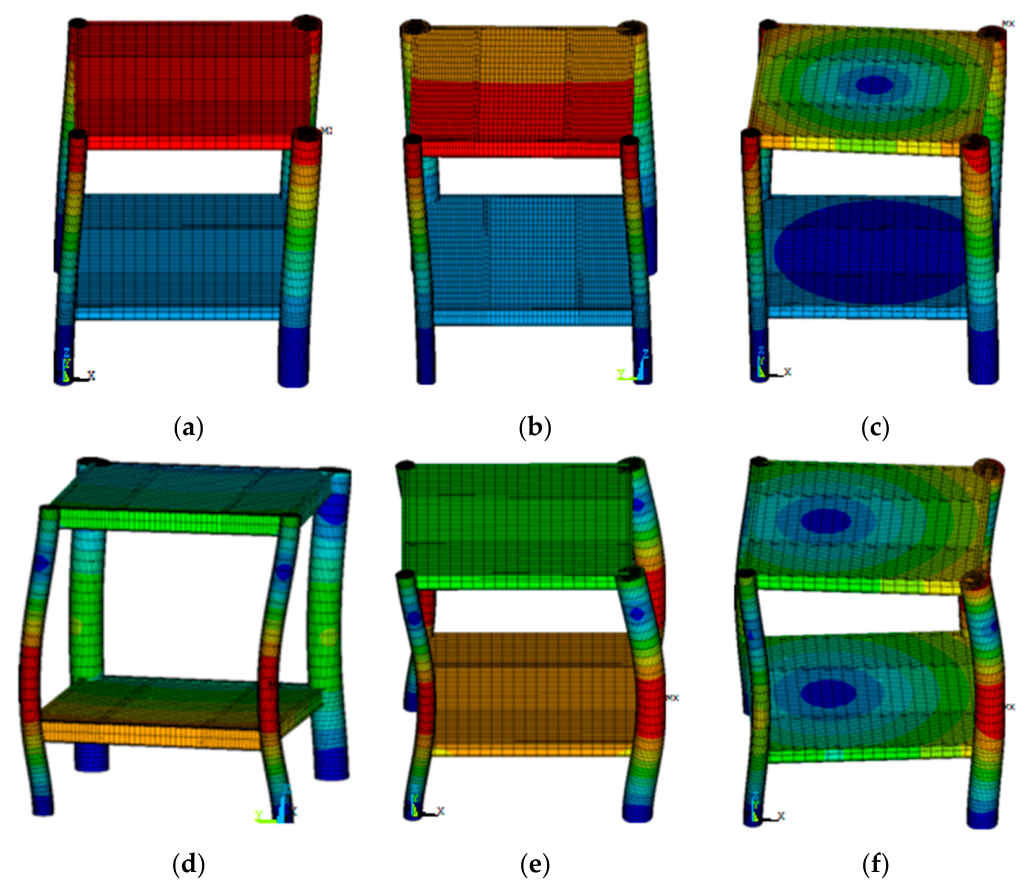
To verify the influence of debonding on the dynamic characteristics of a structural system, this study extracts a frame on the mast side of the 69th and 70th floors of the tower in the SEG Building for analysis. Two working conditions are proposed, with case 1 being a fully bonded frame and case 2 being a frame presenting circular debonding with thin interlayers. A 5% reduction in the stiffness of the core concrete is considered for simulation. The frequency calculation results of the first six orders of the framework are shown in Table 6, and the vibration mode results are illustrated in Figure 16. The comparison of the analysis results shows that after the CFST column is debonded, the dynamic characteristics of the structural system change, and the frequency decreases. As the frequency order increases, the amplitude decreases gradually. After the CFST column is fully debonded, the core concrete and the outer steel tube do not work together, and the three-dimensional confining pressure state disappears, resulting in decreases in stiffness and structural frequency.

4. Effect of CFST Column Debonding on Real Superhigh-Rise Structures

4.1. Effect of Debonding Formation in CFST Columns on Structural Dynamic Characteristics

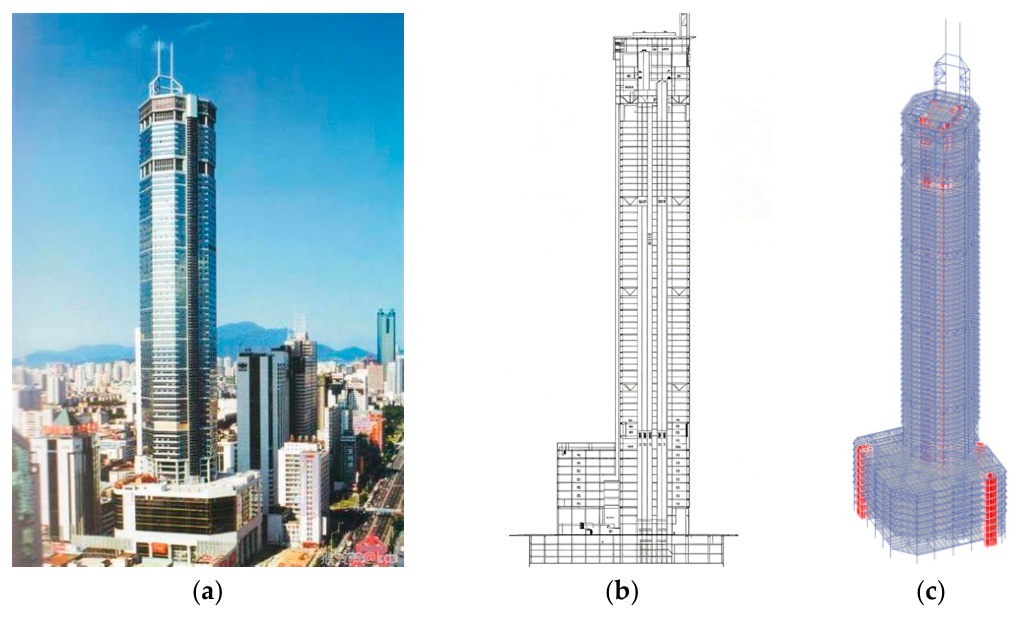
A certain building in Shenzhen, the SEG Building, located at the intersection of Shennan East Road and Huaqiang North Road, as shown in Figure 17a,b, is considered for example. It has 72 floors above ground level with a height of 291.6 m, and four floors below ground level with a depth of 21.15 m. The tower of the building adopts a 43.2 m × 43.2 m square octagonal plan, which is a landmark building in Shenzhen that spans a century. The ETABS model of the building is shown in Figure 17c. The structure of the building adopts a CFST column steel beam frame–core tube structure system, and the concrete shear wall of the core tube is a frame tube composed of steel beams and CFST columns [35].
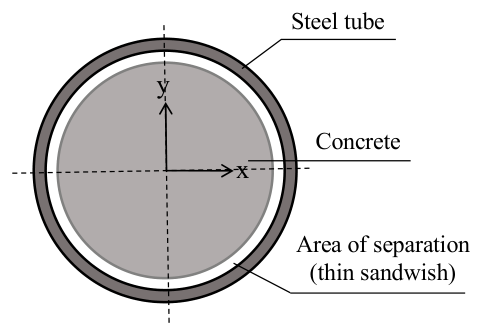
Based on the ETABS software, two methods were used to study the effects of simulated debonding of steel–concrete columns on building dynamic characteristics and engineering parameters. Method 1 is based on the theory derived in Section 2.2 to reduce the equivalent stiffness of steel–concrete columns. On the basis of the detection data in Table 1, theoretical calculations are conducted on the CFST columns of the building. Given that the debonding area of the CFST columns on the middle floor is about 95%, a debonding rate of 95% is considered for theoretical calculation. The calculation results show that the bending stiffness of the CFST columns decreases by about 13.2%. In this part of the simulation, 15% is taken as the reduction value of the bending stiffness of the CFST columns, which tends to be safe. Method 2 uses the thin interlayer theory in Section 3.3 to model and assign material parameters to the debonding layer. Because of the weakening of the collaborative work ability between the steel pipe and the concrete core due to debonding, the stiffness of the core column is reduced by 5% [19]. The thin interlayer is shown in Figure 18.
The effect of CFST column debonding on the first 11 frequencies of the SEG Building is shown in Table 7. According to Table 7, after the CFST column is debonded, the effect on the structural frequency is relatively small, and the first-order frequency is reduced by less than 1%. The fourth-order bending-torsion coupling in the Y-direction is reduced by less than 0.5%, and the results of the two simulation methods are relatively close, which verifies the validity of the simulation methods.
It should be noted that the measured first-order frequency reduction in the SEG Plaza after 20 years of service is approximately 6.1%, whereas the numerical simulation considering only CFST column debonding predicts a reduction of about 0.987% (Table 7). This discrepancy indicates that debonding alone does not fully account for the observed frequency degradation. Other factors accumulated during long-term service may also contribute, including in-plane stiffness degradation of composite floor slabs, joint connection damage, concrete creep and shrinkage, and variations in live load.

4.2. Effect of Debonding Formation in CFST Columns Under Response Spectrum on Structural Engineering Design Parameters

The changes in the design parameters of the real superhigh-rise structure before and after the debonding of CFST columns are compared by conducting a response spectrum analysis on the structure. The debonding of CFST columns leads to a decrease in the stiffness of the structure, and the changes in the stiffness–weight ratio before and after detachment are shown in Table 8. According to Table 8, after the CFST column is debonded, the structural stiffness–weight ratio decreases. The decreases in X-direction and Y-direction are about 2%, both exceeding the specification limit of 1.4, but both are less than 2.7. Thus, second-order effects need to be considered. According to Clause 5.4.4 of the Technical Code for Concrete Structures of Tall Buildings (JGJ 3-2010) [36], a stiffness–weight ratio greater than 1.4 ensures structural stability against gravity second-order effects; Clause 5.4.1 of the same code specifies that when the ratio is less than 2.7, second-order effects should be considered in structural analysis.
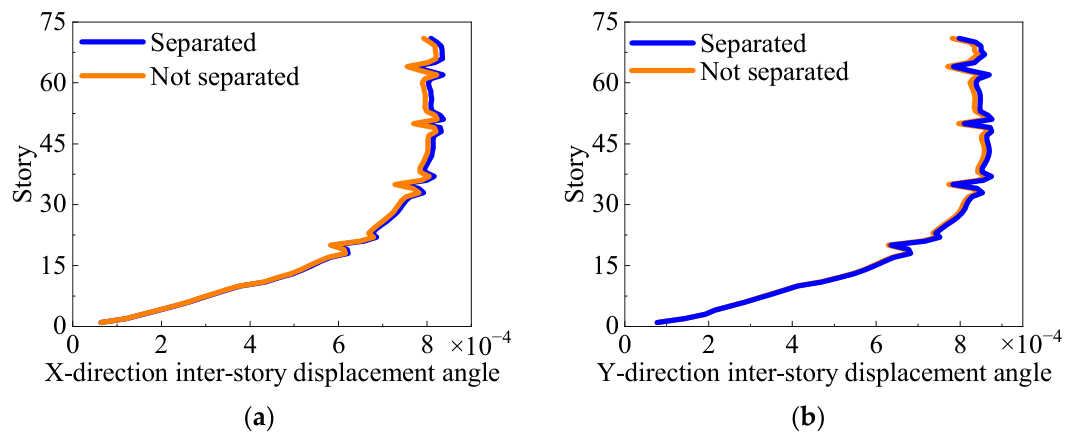
Interstory displacement angle is mainly used to limit the horizontal displacement of a structure under normal use to meet the requirements of the structural bearing capacity and stability. The comparison of interstory displacement angles before and after the debonding of CFST is shown in Table 9 and Figure 19. According to Table 9, after debonding of CFST, the interstory displacement angle of the structure increases; the higher the floor, the greater the change in interstory displacement angle. Specifically, the displacement-angle-change rate at the 71st floor in the Y-direction is highest, reaching 2.18%. However, after debonding, the interstory displacement angle between the X- and Y-direction floors is considerably less than the limit value of 0.002, which meets the requirements of structural safety and use.
The torsional displacement ratio of structures in engineering design is the main basis for determining whether torsional irregularities exist in the structure and for taking targeted measures. The torsional displacement of the building in Shenzhen before and after the detachment of the CFST is shown in Table 10. Table 10 demonstrates that the torsional displacement ratio of the structure decreases after the CFST column is detached. Nonetheless, the decrease is insignificant, and the change rate is within 0.15%, which meets the specification requirements.
The SEG Building in Shenzhen has a dual-bias situation of tower and mast. The reason for the decrease in the torsional displacement ratio of the structure is that the stiffness of the structure decreases after the debonding of CFST, resulting in a slight change in the central position of the structure’s stiffness. The relative distance between the center of mass and the center of stiffness decreases, and the torsional effect of the overall structure weakens, leading to a decrease in the torsional displacement ratio of the structure. The changes in the center of mass and stiffness position of the structure before and after the CFST column is debonded are shown in Table 11.
Taking the X-direction as an example, this study investigates the effect of CFST column debonding on the shear–weight ratio of real superhigh-rise structures. The calculation results are shown in Table 12. According to Table 12, after the CFST is debonded, the shear–weight ratio of the structure slightly decreases, but the change is insignificant. The change rate of each floor is within 0.7%, which is greater than the limit value of 0.012 required by the specification, meeting the requirements.

4.3. Effect of CFST Column Debonding on Seismic Design Parameters Under Frequent Earthquakes

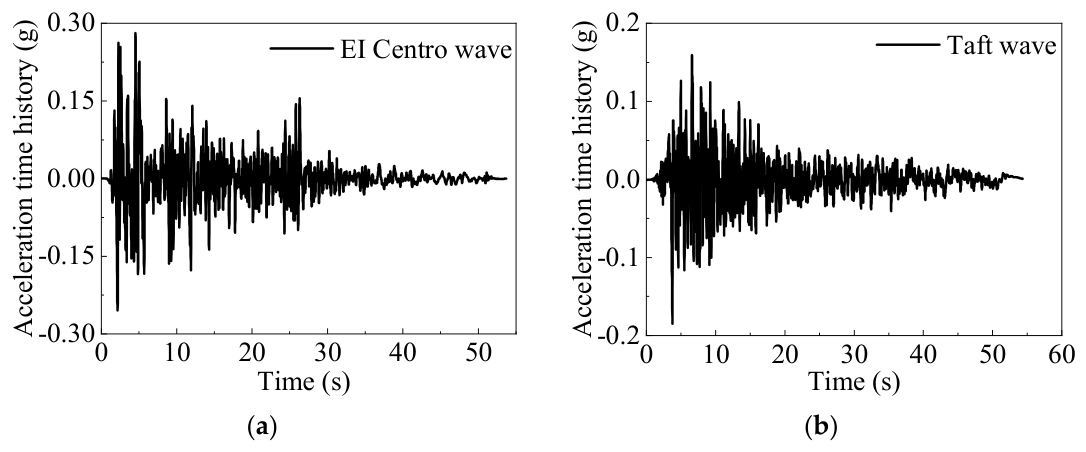
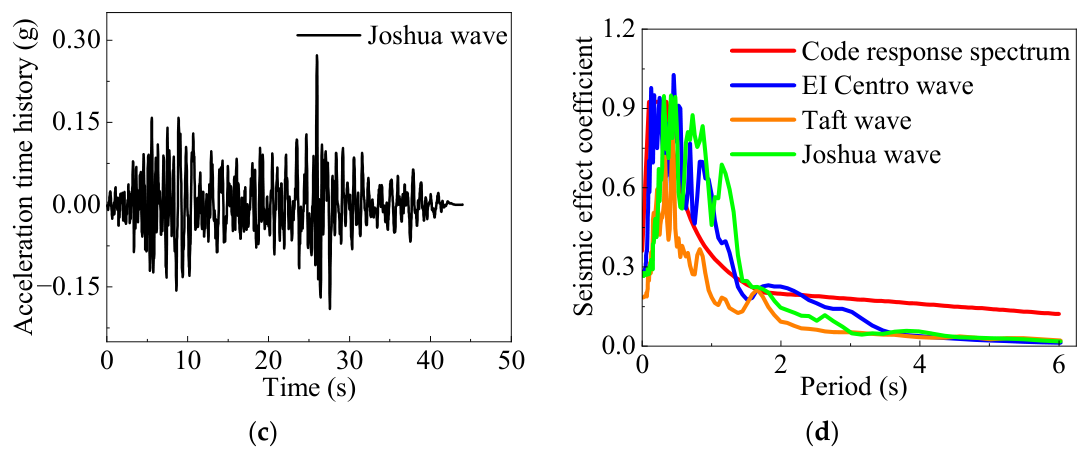
For superhigh-rise building structures, in addition to response spectrum analysis, the mechanical properties and engineering design parameters under seismic action should also be verified. In this section, with the X-direction as an example, EI Centro waves are selected, Taft waves and Joshua waves are subjected to time-history analysis, and the seismic waves are shown in Figure 20. In accordance with Article 5.1.2 of China’s “Code for Seismic Design of Buildings” (GB50011-2010) [37], the maximum value of seismic acceleration time history is selected for time-history analysis, as shown in Table 13. A degree 7 frequent earthquake (35 cm/s2) is used for value analysis, and the seismic waves are amplitude-modulated in accordance with the requirements of the code.
The simulation method for stiffness reduction in Section 4.1 is used to simulate the detachment of CFST in ETABS for time-history analysis. The changes in displacement, base shear force, and overturning moment of the real superhigh-rise structure before and after debonding of CFST columns are obtained and compared.
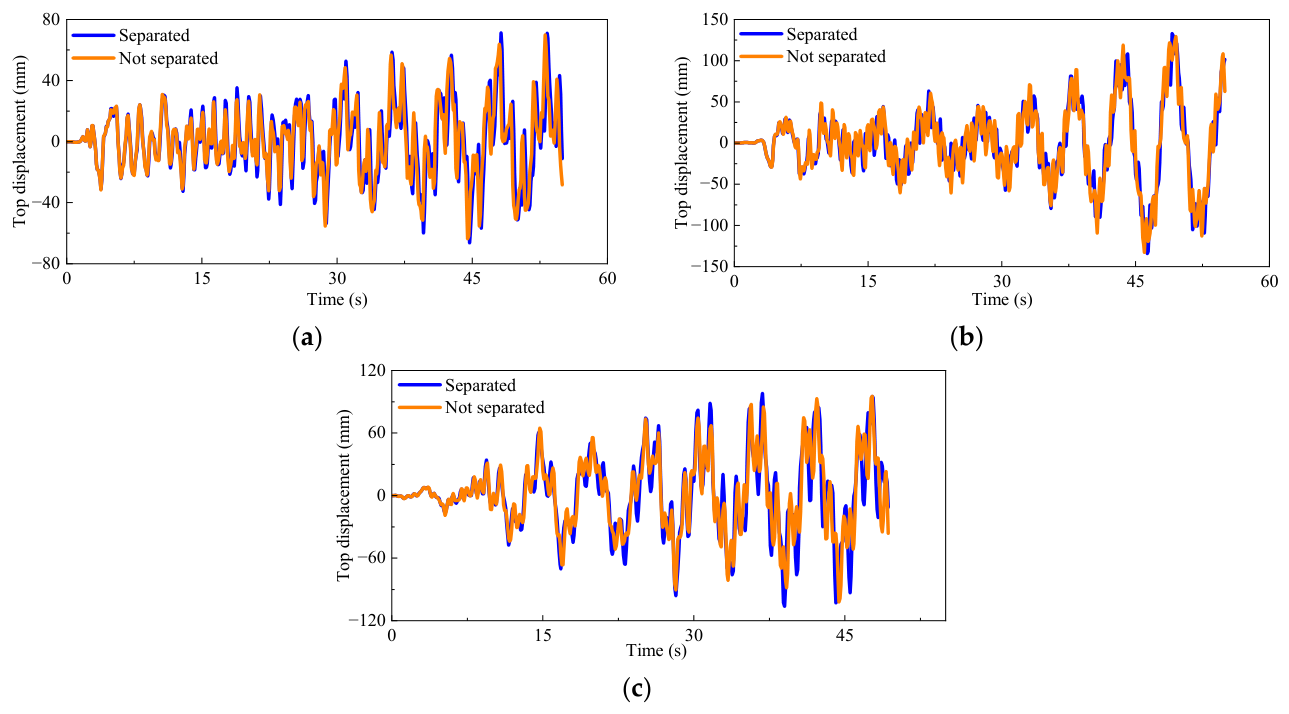
The vertex displacement time history is an important indicator for controlling the overall displacement of building structures, reflecting the horizontal displacement of the structures under earthquake action. In the process of analyzing the vertex displacement time history, the maximum displacement of floors under different seismic waves is first analyzed, and then the vertex displacement time history of the building in the SEG Building is studied. The original model is compared with the debonding model, and the analysis results are shown in Figure 21 and Table 14.
According to Table 14, the maximum displacement of the structural vertices of the building under seismic waves increases after the CFST column is debonded. Under the action of Taft waves, the moment of maximum displacement of the structural vertex before and after the debonding of the steel–concrete column is relatively close, and the amplitude of the maximum displacement of the vertex increases by 0.93%. Under the action of Joshua waves, the time of maximum displacement of the vertex changes, and the amplitude increases by 3.99%. Under the action of EI Centro waves, the maximum displacement of the unidirectional vertex increases by 4.23%, and the amplitude increases by 1.95%. Under the action of seismic waves, the debonding of steel–concrete columns leads to an increase in vertex displacement of the structure, with increments all within 5%.
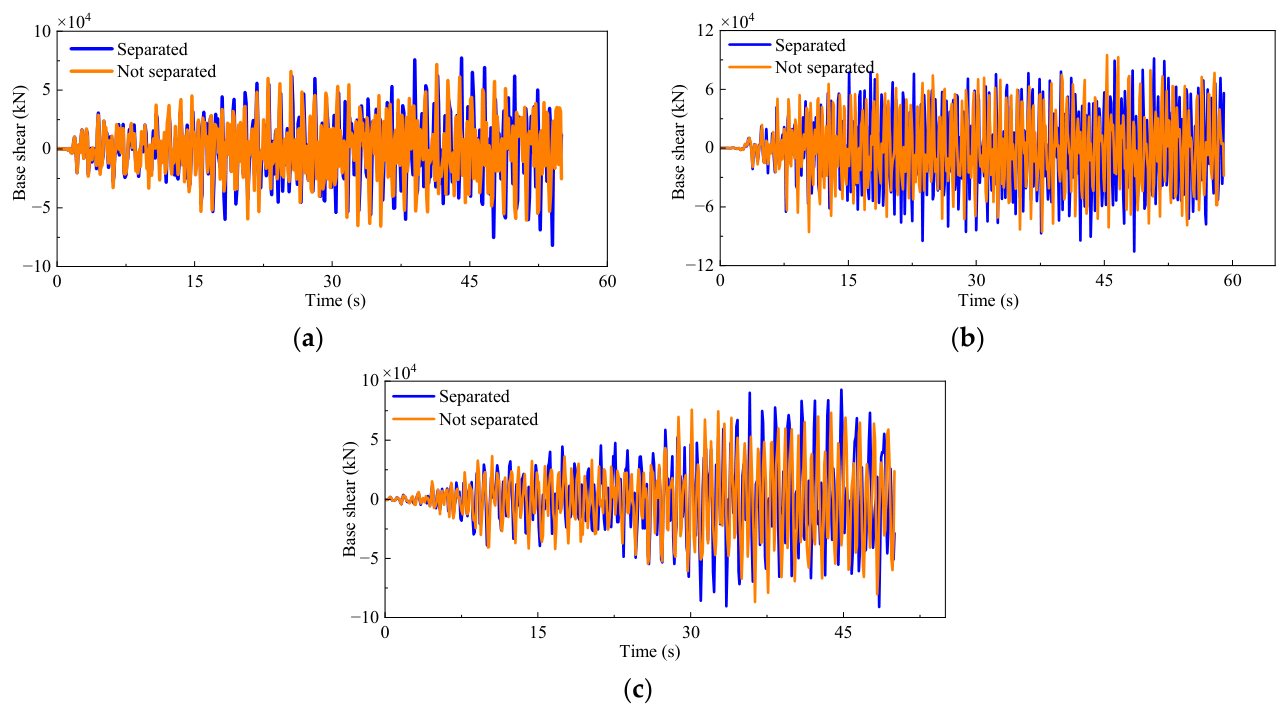
The base shear force under X-direction seismic waves can be obtained, as shown in Figure 22 and Table 15. The calculation indicates that the base shear force of the building in Shenzhen increases under the action of seismic waves after the CFST column is debonded. Under the action of EI Centro and Joshua waves, the amplitude of the base shear force before and after the debonding (the absolute value of the base shear force under the action of seismic waves) increases. Under the action of EI Centro waves, the maximum change rate of the forward base shear force of the structure before and after debonding is 24.89%, and the maximum change rate of amplitude is 14.27%. The debonding increases the base shear force of the structure under seismic action.
Under the Taft wave, the positive base shear force decreases by 3.9% after debonding, while the negative base shear force increases by 23.08%, and the absolute amplitude increases by 10.98%. This is attributed to the asymmetric stiffness degradation induced by debonding, which makes the positive and negative responses no longer symmetric. The increase in absolute amplitude indicates an overall rise in seismic demand, consistent with the reduction in structural stiffness.
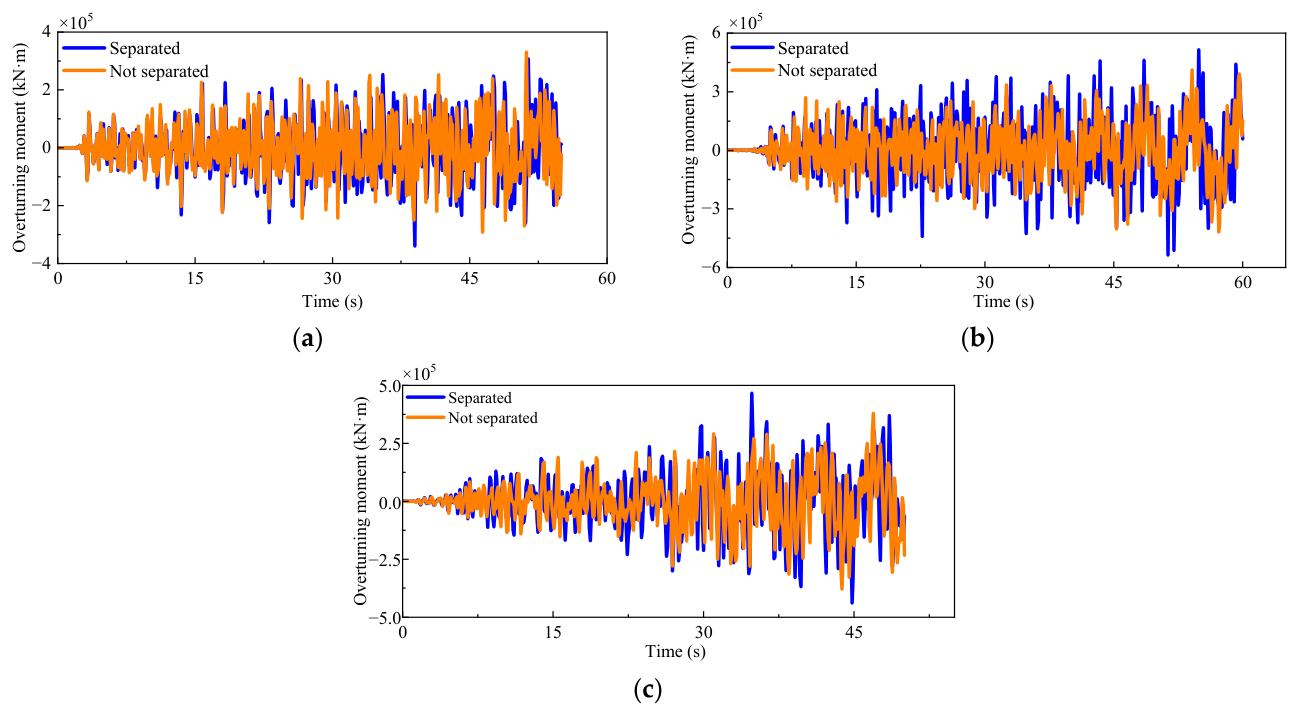
Overturning moment is an important factor that must be considered in the design of high-rise structures. Reasonable design and measures can effectively resist overturning moment, ensuring the safety and stability of buildings. The overturning moment of the building in Shenzhen under X-direction seismic waves can be obtained and compared through time-history analysis, as shown in Figure 23 and Table 16. Based on the calculation, the overall amplitude of the overturning moment of the SEG Building under seismic wave action increases after the CFST column is debonded. Under the action of Taft and Joshua waves, the overturning moment before and after the debonding increases. The overturning moment of the structure under the action of Taft waves varies greatly, with a maximum difference of 27.98% before and after debonding. Debonding increases the overturning moment of the structure under seismic action.

5. Conclusions

This study provides a mechanistic understanding of how localized debonding in CFST columns affects the global dynamic characteristics of super high-rise buildings. The main novelties include the analytical stiffness formula that explicitly incorporates the debonding angle and distance, and the thin-interlayer simulation method that enables efficient full-building dynamic analysis. Although the research is motivated by the 5·18 incident of the SEG Plaza, the proposed theoretical framework and numerical methodology are general in nature and can be applied to evaluate the dynamic characteristic degradation of other high-rise buildings employing CFST columns.
(1)
The effect of the debonding angle and the debonding distance on the bending stiffness of steel–concrete columns is theoretically derived. The structural stiffness gradually decreases as debonding defects develop in steel–concrete columns, affecting the structural force transmission and decreasing the distributed bending moment of the debonding column. The structural frequency steadily decreases with an increase in the debonding angle of the CFST column. The increase in the column debonding distance slightly decreases structural frequency.
(2)
The influences of debonding parameters on structural dynamic characteristics are studied through finite element simulation. The debonding angle of CFST has a significant effect on structural frequency. When the CFST column in a planar frame is debonded at 270°, the structural frequency decreases by 0.984%. When the debonding angle is fixed at 180°, the first-order frequency of the planar frame containing a 2 mm debonding distance CFST column with a clearance decreases by 0.141%. When the clearance distance of the CFST column is small, the influence of the clearance distance on the structural frequency is relatively small. Ansys is used for finite element simulation. The feasibility of the simulation method is demonstrated through the simulation of a single column and a spatial frame.
(3)
The effect of CFST column debonding on a real high-rise structure in Shenzhen is studied. After the CFST column debonding, the first-order frequency of the structure decreases by 0.987%, which verifies the effectiveness of the “thin interlayer” simulation method for CFST column debonding. The debonding defects increase the vertex displacement, base reaction force, overturning moment, and floor shear force of the structure, indicating that the stiffness of the steel tube concrete structure decreases after debonding. The maximum difference in the overturning moments before and after the debonding of the structure under the Taft wave reaches 27.98%, proving that the debonding of steel-reinforced concrete is detrimental to the seismic resistance of structures.

Author Contributions

S.T.: writing—review and editing, writing—original draft preparation, validation. C.Y.: data curation, writing—review and editing. Z.X.: methodology, investigation. J.T.: supervision, investigation, resources. W.H.: supervision, conceptualization, formal analysis, data curation, resources. Z.Z.: writing—review and editing. W.L.: validation, investigation. P.B.: conceptualization, investigation. C.G.: supervision, resources. All authors have read and agreed to the published version of the manuscript.

Funding

The authors acknowledge the financial support from the National Natural Science Foundation of China (52378296,52578357), the Key Program of the National Natural Science Foundation of China (52438004), the Higher Education Stable Support Program of Shenzhen (GXWD20220811163144001), the Shenzhen Key Industry R&D Program (Sustainable Development Special Project) (ZDCYKCX20250901092401002), and the Shenzhen Key Lab of Urban and Civil Engineering Disaster Prevention and Reduction (SYSPG20241211173608001).

Data Availability Statement

The original contributions presented in this study are included in the article. Further inquiries can be directed to the corresponding author.

Conflicts of Interest

The authors declare no conflicts of interest.

Appendix A

According to Figure 3 and Figure 4, the bearing capacity of the CFST column after debonding is the sum of the bearing capacities of the steel tube and concrete. The force on the concrete core column after debonding is assumed to change linearly. For simplifying the calculation, half of the debonding angle of the CFST column is selected; that is, half of the debonding angle is taken for calculation. The bearing capacity of the CFST column is expressed as
N = N c + N s
where   N c   is the bearing capacity of concrete. N s   is the bearing capacity of the steel pipe.
N c = 2 σ c i d A 1 + 2 σ c i d A 2 = 2 θ π [ f c + r ( 1 cos θ ) δ d δ ( σ c f c ) ] r 2 sin 2 θ d θ   +   2 0 θ [ f c + [ r ( r δ ) cos θ ] δ d δ ( σ c f c ) ] ( r δ ) 2 sin 2 θ d θ   = [ f c ( r δ ) 2 + σ c f c d δ ( r δ ) 3 ] ( θ 1 2 sin 2 θ ) + [ f c r 2 δ r 2 ( σ c f c ) d δ ] ( π θ + 1 2 sin 2 θ )   +   r 3 ( σ c f c ) d δ ( π θ + 1 2 sin 2 θ + 2 3 sin 3 θ ) 2 ( σ c f c ) 3 ( d δ ) ( r δ ) 3 sin 3 θ
where   σ c is the longitudinal stress of the concrete, δ is the debonding distance, and θ is the debonding angle.
σ c i = f c + σ c f c d δ y = f c + r ( 1 cos θ ) δ d δ ( σ c f c )
y 1 = r ( 1 cos θ ) δ
d A 1 = r sin θ d y 1 = r 2 sin 2 θ d θ
y 2 = [ r ( r δ ) cos θ ] δ
d A 2 = ( r δ ) sin θ d y 2 = ( r δ ) 2 sin 2 θ d θ
N s = 2 t σ s i d s = 2 t r 0 π [ σ s 1 + r ( 1 cos θ ) d ( σ s 2 σ s 1 ) ] d θ       = t r π ( σ s 1 + σ s 2 )
where   σ s 1   and σ s 2   are the longitudinal stresses of the steel pipes on the debonding side and the non-debonding side, respectively.
The bearing capacity of the CFST column after the occurrence of debonding defects is
N = N c + N s = [ f c ( r δ ) 2 + σ c f c d δ ( r δ ) 3 ] ( θ 1 2 sin 2 θ ) + [ f c r 2 δ r 2 ( σ c f c ) d δ ] ( π θ + 1 2 sin 2 θ ) +   r 3 ( σ c f c ) d δ ( π θ + 1 2 sin 2 θ + 2 3 sin 3 θ ) 2 ( σ c f c ) 3 ( d δ ) ( r δ ) 3 sin 3 θ + t r π ( σ s 1 + σ s 2 )
The bending moment of a CFST column is jointly borne by the steel tube and the concrete core column. After the CFST column debonds, the force-transmission mode of the CFST column changes, and the steel tube transfers the bending moment to the concrete core column. At this time, the bending moment borne by the column is the sum of the bending moments jointly borne by the steel tube and concrete, that is
M = M c + M s
where M c is the bending moment borne by the concrete, and M s is the bending moment borne by the steel pipe.
M c = 2 σ c i r cos θ d A 1 + 2 σ c i r cos θ d A 2   = 2 θ π [ f c + r ( 1 cos θ ) δ d δ ( σ c f c ) ] r 3 cos θ sin 2 θ d θ   +   2 0 θ [ f c + [ r ( r δ ) cos θ ] δ d δ ( σ c f c ) ] ( r δ ) 3 cos θ sin 2 θ d θ   = [ 2 3 f c ( r δ ) 3 2 3 f c r 3 + 2 ( σ c f c ) ( r δ ) 4 3 ( d δ ) + 2 ( σ c f c ) δ r 3 3 ( d δ ) ] sin 3 θ   +   r 4 ( σ c f c ) d δ ( 1 4 θ 2 3 sin 3 θ 1 4 π 1 16 sin 4 θ ) ( r δ ) 4 ( σ c f c ) d δ ( 1 4 θ 1 16 sin 4 θ )
M s = 2 t σ s i r cos θ d s = 2 t r 2 0 π [ σ s 1 + r ( 1 cos θ ) d ( σ s 2 σ s 1 ) ] cos θ d θ   = 2 t r 2 ( σ s 2 + σ s 1 )
The bending moment borne by the CFST column after the column is detached is
M = M c + M s = [ 2 3 f c ( r δ ) 3 2 3 f c r 3 + 2 ( σ c f c ) ( r δ ) 4 3 ( d δ ) + 2 ( σ c f c ) δ r 3 3 ( d δ ) ] sin 3 θ + r 4 ( σ c f c ) d δ ( 1 4 θ   2 3 sin 3 θ 1 4 π 1 16 sin 4 θ ) ( r δ ) 4 ( σ c f c ) d δ ( 1 4 θ 1 16 sin 4 θ ) + 2 t r 2 ( σ s 2 + σ s 1 )
According to the test results in Ref. [38], in real superhigh-rise building structures, the debonding distance of CFST columns is very small. In a certain building in Shenzhen, the debonding distance of CFST columns is 0.05–0.2 mm, which is relatively small compared with the radius (diameter) of steel tubes. To simplify the calculation, let   r δ r and d δ d . On the basis of the linear assumption, let σ s 2 = k σ s 1 , where k = ( 3 + c o s θ ) / 2 , then the simplified axial force and bending moment of the CFST column are
N = 1 2 f c r [ π r δ ( θ 1 2 sin 2 θ ) ] + 1 2 σ c r [ π r + δ ( θ 1 2 sin 2 θ ) ] + t r π σ s 1 ( 1 + k )
M = f c r 2 ( δ 3 sin 3 θ π r 8 ) + σ c r 2 ( π r 8 δ 3 sin 3 θ ) + 2 t r 2 σ s 1 ( k + 1 )
From Figure 4, the debonded CFST column can be regarded as an eccentric compression member. A correlation is assumed to exist between the bending moment and axial force borne by the CFST column, and it is characterized by M = η e 0 N . If η is the structural importance coefficient, the relationship between the steel pipe stress and the concrete stress is
f c r 2 ( δ 3 sin 3 θ π r 8 ) + σ c r 2 ( π r 8 δ 3 sin 3 θ ) + 2 t r 2 σ s 1 ( k + 1 ) = η e 0 { 1 2 f c r [ π r δ ( θ 1 2 sin 2 θ ) ] + 1 2 σ c r [ π r + δ ( θ 1 2 sin 2 θ ) ] + t r π σ s 1 ( 1 + k ) }
Accordingly,
σ s 1 = σ c η e 0 r 2 [ π r + δ ( θ 1 2 sin 2 θ ) ] r 2 ( π r 8 δ 3 sin 3 θ ) 2 t r 2 ( k + 1 ) η e 0 t r π ( 1 + k ) +   f c { η e 0 r 2 [ π r δ ( θ 1 2 sin 2 θ ) ] r 2 ( δ 3 sin 3 θ π r 8 ) } 2 t r 2 ( k + 1 ) η e 0 t r π ( 1 + k )
Assuming that the radial stress p distribution at the interface of the steel pipe–concrete column is uniform and applying the Lame equation [39] to the non-debonded area by treating the steel pipe as a thin-walled cylinder [40], we have r 1 = d c / 2 and r 2 = d s / 2 as the internal and external longitudinal stresses, respectively, q a = p as the internal pressure, and q b = 0 as the external pressure. The radial, lateral, and axial stresses of the steel pipe are 0, d c p / 2 t , and d σ s , respectively. In the non-debonded area, in consideration of deformation coordination, the axial, radial, and lateral stresses of the core concrete are σ c , p , and   p 1 , respectively, while the axial, radial, and lateral stresses of the steel pipe are σ s , 0, and d c p / 2 t , respectively. This assumption leads to the stress–strain relationship between the concrete and the steel pipe.
ε c 1 = 1 E c [ σ c μ c ( p + p 1 ) ]
ε c 2 = 1 E c [ p μ c ( σ c + p 1 ) ]
ε c 3 = 1 E c [ p 1 μ c ( σ c + p ) ]
ε s 1 = 1 E s ( σ s + μ s d c 2 t p )
ε s 2 = μ s E s ( σ s d c 2 t p )
ε s 3 = 1 E s ( d c 2 t p + μ s σ s )
where μ c and μ s   are the Poisson’s ratios of the concrete and steel pipe, respectively; E c and E s are the elastic moduli of the concrete and steel pipe, respectively.
In the non-debonded area, on the basis of the deformation coordination assumption, ε c 1 = ε s 1 , ε c 2 = ε s 2 , and ε c 3 = ε s 3 , then
σ s + μ s d c 2 t p = E s E c [ σ c μ c ( p + p 1 ) ]
μ s ( σ s d c 2 t p ) = E s E c [ p μ c ( σ c + p 1 ) ]
d c 2 t p + μ s σ s = E s E c [ p 1 μ c ( σ c + p ) ]
Let n = Es/Ec. Subtracting Equation (A24) from Equation (A25), we obtain
σ s = n ( 1 + μ c ) σ c + n ( 1 + μ c ) p 1 + μ s
After isolating   p 1 , we obtain Equation (A28). Through substituting and rearranging, we eliminate and obtain   p = σ c q 1 .
p 1 = n σ c ( n μ c + d c 2 t μ s ) p + σ s n μ c
q 1 = n + n ( 1   +   μ c ) 1   +   μ s + n μ c 2 μ s μ c n (   1   + μ c ) 1   +   μ s d c 2 t μ c + μ c μ s n ( 1   +   μ c ) 1   +   μ s + n μ c + d c 2 t μ s n ( 1   +   μ c ) 1   +   μ s + n μ c 2
As a result, the ratio of stress between the steel pipe and the concrete is
σ s 1 σ c = n ( 1 + μ c ) + n ( 1 + μ c ) q 1 k ( 1 + μ s )
In real superhigh-rise building structures, structural measures such as reinforced anchor rib plates at the connection nodes exist between CFST columns and steel beams. Therefore, the debonding situation at the beam–column node should be smaller than the midspan section of the column. A sine function [39] is proposed to characterize the strain situation of the debonding range of CFST columns. The strain can be represented by ε ( x ) , and the average strain ε ¯ and the nonuniformity coefficient ψ of the steel pipe can be solved as follows:
ε ( x ) = ε max sin ω x
ε ¯ = 0 l ε ( x ) d x l = ε max 0 l sin ω x d x l = 2 ε max π
ψ = ε ¯ ε max = 2 π
The moment of inertia I and the bending section coefficient W of the steel pipe section can be obtained by analyzing the component section using the method of material mechanics. Then, the strain of the steel pipe and the stiffness B of the component section can be determined.
I = π D 4 ( 1 α 4 ) 64
W = π D 3 ( 1 α 3 ) 32
ε 1 , 2 = σ 1 , 2 E s = 1 E s ( N s A s ± M s W s )
B = M ϕ = N η e 0 d c ψ ε 1 ε 2
Substituting Equations (A14), (A17), (A29), (A30), (A33) and (A36) into it yields
σ s 1 = σ c η e 0 r 2 [ π r + δ ( θ 1 2 sin 2 θ ) ] r 2 ( π r 8 δ 3 sin 3 θ ) 2 t r 2 ( k + 1 ) η e 0 t r π ( 1 + k ) + f c { η e 0 r 2 [ π r δ ( θ 1 2 sin 2 θ ) ] r 2 ( δ 3 sin 3 θ π r 8 ) } 2 t r 2 ( k + 1 ) η e 0 t r π ( 1 + k )
B = η e 0 d c E s { f c r [ π r δ ( θ 1 2 sin 2 θ ) ] + σ c r [ π r + δ ( θ 1 2 sin 2 θ ) ] + 2 t r π σ s 1 ( 1   +   k ) } 4 π [ ( 4 t r σ s 1 ( 1   +   k ) D 2     d 2 + 64 t r 2 σ s 1 ( 1   +   k ) π ( D 3     d 3 ) ] 2 [ ( 4 t r σ s 1 ( 1   +   k ) D 2     d 2 64 t r 2 σ s 1 ( 1   +   k ) π ( D 3     d 3 ) ]
Equation (A39) is identical to Equation (1) in the main text. This equation is the relationship between the debonding angle θ, debonding distance δ, and column section stiffness B of CFST columns after debonding removal, where
σ s 1 = C f c { η e 0 r 2 [ π r δ ( θ 1 2 sin 2 θ ) ] r 2 ( δ 3 sin 3 θ π r 8 ) } C [ 2 t r 2 ( 1 + k ) η e 0 t r π ( 1 + k ) ] k ( 1 + μ s ) { η e 0 r 2 [ π r + δ ( θ 1 2 sin 2 θ ) ] r 2 ( π r 8 δ 3 sin 3 θ ) }
σ c = k ( 1 + μ s ) f c { η e 0 r 2 [ π r δ ( θ 1 2 sin 2 θ ) ] r 2 ( δ 3 sin 3 θ π r 8 ) } C [ t r 2 ( 1 + k ) η e 0 t r π ( 1 + k ) ] k ( 1 + μ s ) { η e 0 r 2 [ π r + δ ( θ 1 2 sin 2 θ ) ] r 2 ( π r 8 δ 3 sin 3 θ ) }
C = n ( 1 + μ c ) + n ( 1 + μ c ) q 1
q 1 = n + n ( 1   +   μ c ) 1   +   μ s + n μ c 2 μ s μ c n ( 1   +   μ c ) 1   +   μ s d c 2 t μ c + μ c μ s n ( 1   +   μ c ) 1   +   μ s + n μ c + d c 2 t μ s n ( 1   +   μ c ) 1   +   μ s + n μ c 2

References

  1. Wu, S.; Liu, W.; Zhang, J.; He, W.; Guo, Y. Experimental and Analytical Investigation of Square-shaped Concrete-filled Steel Tube Columns. J. Constr. Steel Res. 2023, 201, 107737. [Google Scholar] [CrossRef]
  2. Fu, G.; Fu, G.; Yu, C.; Li, S.; Wang, F.; Yang, J. Behaviour of Rectangular Concrete-filled Steel Tubular Slender Column with Unequal Wall Thickness. Eng. Struct. 2021, 236, 112100. [Google Scholar] [CrossRef]
  3. Yu, M.; Hu, X.; Xu, L.; Cheng, S. A General Unified Method for Calculating Fire Resistance of CFST Columns Considering Various Types of Steel and Concrete. J. Build. Eng. 2022, 59, 105125. [Google Scholar] [CrossRef]
  4. Yuan, F.; Cao, L.; Li, H. Axial Compressive Behaviour of High-strength Steel Spiral-confined Square Concrete-filled Steel Tubular Columns. J. Constr. Steel Res. 2022, 192, 107245. [Google Scholar] [CrossRef]
  5. Liu, X.; Wu, W.; El Naggar, M.; Sun, J.; Tang, L. Theoretical Analysis of Dynamic Performance of Concrete-filled Steel Tube Pile under Vertical Load. Comput. Geotech. 2024, 165, 105884. [Google Scholar] [CrossRef]
  6. Kar, P.; Borsaikia, A.C.; Singh, K.D. Experimental Investigation of Partially Confined Concrete-filled Steel Tubular Square Columns under Lateral Cyclic Loading. J. Constr. Steel Res. 2023, 201, 107751. [Google Scholar] [CrossRef]
  7. Rong, B.; Li, S.; Chen, H. Application and future perspective of concrete fill steel tube column in tall buildings. Build. Struct. 2009, 39, 33–38. (In Chinese) [Google Scholar]
  8. Cao, H.; Li, Y. Nonlinear vibration characteristics and de-bonding recognition of concrete-filled steel tube columns. J. Vib. Shock. 2020, 39, 260–265. [Google Scholar]
  9. Han, L.-H.; Ye, Y.; Liao, F.-Y. Effects of Core Concrete Initial Imperfection on Performance of Eccentrically Loaded CFST Columns. J. Struct. Eng. 2016, 142, 04016132. [Google Scholar] [CrossRef]
  10. Xue, J.-Q.; Briseghella, B.; Chen, B.-C. Effects of Debonding on Circular CFST Stub Columns. J. Constr. Steel Res. 2012, 69, 64–76. [Google Scholar] [CrossRef]
  11. Schnabl, S.; Planinc, L. Circumferential Gap and Partial Debonding Effects on Buckling Loads and Modes of Slender CFST Circular Columns. Acta Mech. 2019, 230, 909–928. [Google Scholar]
  12. Liao, F.-Y.; Han, L.-H.; He, S.-H. Behavior of CFST Short Column and Beam with Initial Concrete Imperfection: Experiments. J. Constr. Steel Res. 2011, 67, 1922–1935. [Google Scholar] [CrossRef]
  13. Liao, F.Y.; Yao, G.H.; Zhang, W.J. Some Recent Research about Effects of Concrete Imperfection on the Behaviour of Concrete Filled Steel Tubular Members. In Proceedings of the The Fifteenth East Asia-Pacific Conference on Structural Engineering and Construction, Xi’an, China, 11–13 October 2017; pp. 567–575. [Google Scholar]
  14. Liao, F.; Zhang, C.; Zhang, W.; Wang, J. Analysis on the effects of gap on the mechanical properties of concrete filled steel tubes under torsion. Ind. Constr. 2019, 49, 37–42+69. (In Chinese) [Google Scholar]
  15. Ejaz, M.F.; Ahmad, H.; Aslam, M. Nonlinear Numerical Analysis and Proposed Equation for Axial Loading Capacity of Concrete Filled Steel Tube Column with Initial Imperfection. Struct. Monit. Maint. 2022, 1, 81–105. [Google Scholar]
  16. Manigandan, R.; Kumar, M. Effect of the Imperfection on the Axial Loaded Rectangular CFST Column. Proc. Indian Struct. Steel Conf. 2020, 2, 285–296. [Google Scholar]
  17. Yu, P.; Ren, Z.; Yun, W.; Zhao, Y.; Xu, J. Performance of Bolt-Welded CFST Short Columns with Different Initial Imperfections: Experimental and Numerical Studies. Buildings 2022, 12, 1352. [Google Scholar] [CrossRef]
  18. Wang, J.; Liu, W.; Shen, Q.; Li, J. Investigation of axially-loaded concrete-filled elliptical steel tubular short columns considering the effect of circumferential gap. J. Build. Struct. 2023, 44, 50–63. (In Chinese) [Google Scholar]
  19. Xue, J.-Q.; Huang, J.-P.; Fiore, A.; Briseghella, B.; Marano, G.C. Prediction of the Mechanical Performance of Compressed Circular CFST Columns with Circumferential Debonding Gap. J. Constr. Steel Res. 2023, 208, 107988. [Google Scholar] [CrossRef]
  20. Zhang, C.; Liao, F.; Wang, J.; Ruan, J.; Chen, Y. Effects of gap on the mechanical properties of concrete filled steel tube under combined compression- bending -torsion loading. Ind. Constr. 2019, 49, 19–24. (In Chinese) [Google Scholar]
  21. Liao, F.; Han, H.; Wang, Y. Cyclic behaviour of concrete-filled steel tubular (CFST) members with circumferential gap under combined compression-bending-torsion load. China Civ. Eng. J. 2019, 52, 57–68+80. (In Chinese) [Google Scholar]
  22. Han, H.; Liao, F.; Li, Y. Effect of spherical-gap gap on hysteretic behavior of concrete -filled steel tubular columns. Ind. Constr. 2017, 47, 146–151. (In Chinese) [Google Scholar]
  23. Zhang, J.; Liao, F.; Zhang, W. Cyclic behavior of concrete-filled steel tubular members with circumferential gap under combined compression-bending-shear loading. J. Build. Struct. 2019, 40, 251–256. (In Chinese) [Google Scholar]
  24. Hassam, M.; Guo, L.; Tahir, M.; Haq, M.A.U.; Jamil, R. Prediction of compressive strength of cross-shaped stub CFSTs under axial loading: Numerical and analytical study. Struct. Concr. 2024, 25, 3329–3346. [Google Scholar] [CrossRef]
  25. Hassam, M.; Guo, L.; Li, H.; Haq, M.A.U. Axial compression behavior of cruciform CFSTs stiffened by steel angles: Experiment, numerical analysis and design. J. Build. Eng. 2026, 118, 115063. [Google Scholar] [CrossRef]
  26. Chen, L. Research on Interface Separation Detection of Concrete-Filled Steel Structure Based on Partial Quantitative Excitation. Master’s Thesis, Dalian University of Technology, Dalian, China, 2013. (In Chinese) [Google Scholar]
  27. Hu, Y. Study on Vibration Characteristics and Damage Location of Concrete Filled Steel Tube Debonding. Master’s Thesis, Chongqing University, Chongqing, China, 2022. (In Chinese) [Google Scholar]
  28. Guo, C.; Lu, Z. Air Void and Cap Gap Composite Defects of Concrete-Filled Steel-Tube Arch Bridge Transverse Brace. J. Perform. Constr. Facil. 2020, 34, 04020073. [Google Scholar] [CrossRef]
  29. Guo, C.; Lu, Z. Effect of Temperature on CFST Arch Bridge Ribs in Harsh Weather Environments. Mech. Adv. Mater. Struct. 2022, 5, 732–747. [Google Scholar]
  30. Lu, Z.; Guo, C.; Li, G. Air Debonding and Ring Gap Effect on CFST Arch Bridges Dynamic Performance. J. Constr. Steel Res. 2021, 177, 106418. [Google Scholar] [CrossRef]
  31. Lu, Z.; Wang, Q. Dynamic Characteristics of Defective CFST Arch Bridge Based on ABAQUS. Sci. Technol. Ind. 2020, 20, 223–228. (In Chinese) [Google Scholar] [CrossRef]
  32. Lu, J.; Qin, P. Theoretical derivation of ultimate bearing capacity of concrete filled steel tube with interface defects under axial compression. J. Railw. Sci. Eng. 2018, 15, 2316–2326. (In Chinese) [Google Scholar]
  33. GB 50936-2014; Technical Code for Concrete Filled Steel Tubular Structures. China Construction Industry Press: Beijing, China, 2014. (In Chinese)
  34. Han, L. Concrete Filled Steel Tubular Structures: Theory and Practice, 4th ed.; Science Press: Beijing, China, 2016. (In Chinese) [Google Scholar]
  35. Hu, W.; Tang, D.; Li, J.; Xu, Z.; Wang, Y.; Lu, W.; Li, Z.; Teng, J. Structural dynamic parameter identification of Saige building based on distributed synchronous acquisition method. J. Build. Struct. 2022, 43, 98–106. (In Chinese) [Google Scholar]
  36. JGJ 3-2010; Technical Code for Concrete Structures of Tall Buildings. China Architecture & Building Press: Beijing, China, 2010. (In Chinese)
  37. GB 50011-2010; Code for Seismic Design of Buildings. China Construction Industry Press: Beijing, China, 2010. (In Chinese)
  38. Chen, Y.; Wang, G.; Hao, X.B.; Tan, G.H. Evaluation of the Mechanism and Influence Parameters of the Core Concrete Debonding in the Concrete-Filled Steel Tube. Steel Constr. (Chin. Engl.) 2022, 37, 20–30. (In Chinese) [Google Scholar]
  39. Xu, Z. A Concise Tutorial on Elasticity; Higher Education Press: Beijing, China, 2018. (In Chinese) [Google Scholar]
  40. Yu, S. Research on the Influence of Creep on the Bonding Performance of Steel-Concrete Components. Master’s Thesis, Beijing Jiaotong University, Beijing, China, 2015. (In Chinese) [Google Scholar]
Figure 1. Methodological framework of the study.
Buildings 16 02450 g001
Figure 2. Schematic of the beam–column force-transmission mechanism: (a) lateral force-resisting system; (b) diagram of beam–column joints.
Buildings 16 02450 g002
Figure 3. Classification of operating conditions for CFST columns: (a) fully bonded condition; (b) complete debonding condition; (c) partial debonding condition.
Buildings 16 02450 g003
Figure 4. Classification of operating conditions for CFST columns: (a) simplified diagram of longitudinal forces; (b) simplified diagram for concrete; (c) simplified diagram for steel tube.
Buildings 16 02450 g004
Figure 5. Relationships of debonding parameters (angle, distance) with sectional stiffness: (a) diagram of the relationship between debonding angle and sectional stiffness; (b) diagram of the relationship between debonding distance and sectional stiffness.
Buildings 16 02450 g005
Figure 6. Diagram of the relationship between eccentric ratio and sectional stiffness.
Buildings 16 02450 g006
Figure 7. Simulation diagram of force transfer in a planar frame under debonding: (a) planar frame; (b) condition 1; (c) conditions 2–4.
Buildings 16 02450 g007
Figure 8. Effect of debonding condition on the bending moment of a planar frame: (a) condition 1; (b) condition 2; (c) condition 3; (d) condition 4.
Buildings 16 02450 g008
Figure 9. Diagram of the influence of debonding on the bending moment of a planar frame column: (a) bending moment change in the column without debonding; (b) bending moment change in the column with debonding.
Buildings 16 02450 g009
Figure 10. Schematic of the planar frame of the building in Shenzhen: (a) planar frame; (b) parameters; (c) finite element model.
Buildings 16 02450 g010
Figure 11. Schematic of planar frame cross-sections with different debonding angles: (a) not separated; (b) 90° separation; (c) 180° separation; (d) 270° separation.
Buildings 16 02450 g011aBuildings 16 02450 g011b
Figure 12. Diagram of the frequency variation in a planar frame with respect to the debonding angle: (a) first-order frequency; (b) second-order frequency; (c) third-order frequency; (d) frequency change rate with respect to debonding angle.
Buildings 16 02450 g012
Figure 13. Diagram of the change in natural vibration frequency with the debonding distance of a 180° planar frame.
Buildings 16 02450 g013
Figure 14. Diagram of the custom composite section simulation of CFST debonding: (a) composite section; (b) full-bonding condition; (c) partial debonding condition; (d) circular debonding.
Buildings 16 02450 g014
Figure 15. Schematic of columns on the 69th floor: (a) location diagram of the CFST column; (b) finite element model.
Buildings 16 02450 g015
Figure 16. Diagram of the custom composite section simulation of space frame debonding under vibration mode. (a) X-direction first-order bending; (b) Y-direction first-order bending; (c) first-order torsion; (d) Y-direction second-order bending; (e) X-direction second-order bending; (f) second-order torsion.
Buildings 16 02450 g016
Figure 17. Schematic of the building in Shenzhen: (a) diagram of the building; (b) section of the building; (c) ETABS model.
Buildings 16 02450 g017
Figure 18. Schematic of the debonding section of an ETABS thin sandwich CFST column in the building in Shenzhen.
Buildings 16 02450 g018
Figure 19. Comparison of interstory drift angle before and after debonding of the building in Shenzhen: (a) comparison of X-direction interstory drift angle before and after debonding; (b) comparison of Y-direction interstory drift angle before and after debonding.
Buildings 16 02450 g019
Figure 20. Schematic of seismic wave selection for time-history analysis: (a) EI Centro wave; (b) Taft wave; (c) Joshua wave; (d) Selection of seismic wave response spectrum for time-history analysis.
Buildings 16 02450 g020aBuildings 16 02450 g020b
Figure 21. Diagram of the top displacement before and after debonding of the CFST columns of the building in Shenzhen. (a) EI Centro wave; (b) Taft wave; (c) Joshua wave.
Buildings 16 02450 g021
Figure 22. Diagram of the base shear before and after the debonding of the CFST columns of the building in Shenzhen. (a) EI Centro wave; (b) Taft wave; (c) Joshua wave.
Buildings 16 02450 g022
Figure 23. Diagram of the overturning moment before and after debonding of the CFST columns of the building in Shenzhen: (a) EI Centro wave; (b) Taft wave; (c) Joshua wave.
Buildings 16 02450 g023
Table 1. Parameter values for CSD10 steel-reinforced concrete columns.
ParameterParameter ValueParameterParameter Value
D 900 mm f c 27.5 M P a
d 872 mm μ c 0.2
t 14 mm E s 20,600 M P a
E c 32,500 M P a μ s 0.3
e 0 0.75 η 1.1
Table 2. Debonding detection results of core concrete in the CFST columns of the building in Shenzhen.
Column Location (Floor)Concrete Column Debonding Rate Within the Floor (Perimeter Ratio %)Debonding Distance (mm)
7166.290.05
7066.08
6397.910.05
4999.030.1
3495.830.05–0.2
1995.45
−221.040.1
Table 3. Comparison of equivalent section stiffness and bending stiffness of CFST.
CFST NumberBending Stiffness EI (N·mm2)Equivalent Sectional Stiffness B (N·mm2)Relative Error (%)
CSD101.80962 × 10151.80659 × 1015−0.167
CSD111.88449 × 10161.89314 × 10160.459
CSD121.17781 × 10151.18321 × 10150.459
CSD134.26979 × 10154.29792 × 10150.659
CSD141.83516 × 10161.83637 × 10160.066
CSD151.40996 × 10161.40972 × 1016−0.017
CSD164.58425 × 10154.65649 × 10151.576
CSD171.33582 × 10161.33094 × 1016−0.366
CSD184.0155 × 10154.02414 × 10150.215
CSD191.15166 × 10151.15817 × 10150.566
CSD201.03838 × 10161.03839 × 10160.001
Table 4. Column simulation working condition materials and dimensional properties.
Working
Condition
Outer Steel TubeThin SandwichCore Concrete
Dimension
(mm × mm)
MaterialThickness
(mm)
MaterialRadius
(mm)
Material
Condition 1D1300 × 18Q345————632C40
Condition 2D1300 × 18Q3452C40632C40
Condition 3D1300 × 18Q3452E = 3 × 10⁻²⁰ MPa
μ = 0.3 × 10⁻²⁰
ρ = 7.85 × 10⁻²⁰ kg/m3
630C40
Table 5. Comparison of frequency calculation results.
Rank
Condition
Condition 1 (Hz)Condition 2 (Hz)Rate of Change (%)Condition 3 (Hz)Rate of Change (%)
150.68050.373−0.60649.317−2.689
250.68050.373−0.60649.317−2.689
3143.64142.73−0.634144.030.272
4233.30231.90−0.600211.98−9.138
5233.30231.90−0.600211.98−9.138
6263.05261.45−0.608263.170.046
Table 6. Comparison of the calculation results of the spatial frame frequency.
Frequency
Working Condition
Condition 1 (Hz)Condition 2 (Hz)Rate of Change (%)Vibration Mode
14.73714.6704−1.408X-direction first bending
25.02694.9517−1.496Y-direction first bending
36.99246.8824−1.573First torsion
422.22121.439−3.519Y-direction second bending
523.38222.524−3.669X-direction second bending
629.20428.209−3.407Second torsion
Table 7. Comparison of the effect of debonding in CFST on the frequency of the building.
RankIntact DesignStiffness ReductionReduction in FrequencyThin SandwichReduction in Frequency
(Hz)(Hz)(%)(Hz)(%)
10.17230.17060.9870.17080.871
20.18110.17921.0490.17950.883
30.38070.37980.2360.38050.053
40.67270.66820.6690.66920.520
50.75780.75260.6860.75380.528
61.03961.03720.2311.03890.067
71.33971.33310.4931.33530.328
81.47181.46700.3261.46930.170
91.58021.57110.5761.57370.411
101.98291.97470.4141.97890.202
112.14562.13500.4942.13890.312
Table 8. Comparison of the influence of CFST debonding on the stiffness–weight ratio of the building.
EJ (×1011 kN·m2)G (×104 kN)Stiffness–Weight RatioRate of Change (%)
No DebondingDebondingNo DebondingDebonding
X-direction3.733.64262.461.781.742.24
Y-direction3.423.351.641.602.08
Table 9. Comparison of the influence of CFST debonding on the interlayer displacement angle of the building.
StoryX-Direction (×10−4)Y-Direction (×10−4)
No DebondingDebondingRate of Change (%)No DebondingDebondingRate of Change (%)
717.928.082.027.817.982.18
708.068.221.998.238.381.82
607.898.031.778.248.381.70
507.697.821.697.978.101.63
407.898.001.398.488.591.30
307.367.451.228.078.161.12
205.825.891.206.296.350.95
103.763.790.804.104.130.73
10.630.630.000.770.770.00
Table 10. Changes in torsional displacement ratio before and after CFST debonding, considering accidental eccentricity in the building in Shenzhen.
StoryX-DirectionY-Direction
No DebondingDebondingRate of Change (%)No DebondingDebondingRate of Change (%)
701.03781.0372−0.06111.03351.0330−0.0536
601.03631.0357−0.06431.03581.0352−0.0569
501.03951.0388−0.06711.03881.0382−0.0592
401.04351.0427−0.06901.04301.0423−0.0599
301.04831.0475−0.06961.04821.0476−0.0593
201.05311.0524−0.06691.05601.0553−0.0588
101.12251.1212−0.11011.13901.1383−0.0607
91.12681.1255−0.11221.13581.1352−0.0536
81.13111.1298−0.11481.13311.1325−0.0491
71.13581.1344−0.11741.12971.1292−0.0445
61.14081.1394−0.11991.12581.1253−0.0401
51.14631.1449−0.12231.12131.1209−0.0360
41.15251.1510−0.12451.11631.1159−0.0321
31.15951.1580−0.12601.09841.0981−0.0258
21.16791.1664−0.12431.05911.0589−0.0138
11.17161.1704−0.10281.10291.1024−0.0471
Table 11. Comparison of the changes in the positions and relative distances of the rigid and mass centers of the building in Shenzhen before and after debonding.
StoryRelative Position of
the No Debonding Column (m)
Relative Position of
the Debonding Column (m)
Relative Distance Change Rate (%)
Rigid CenterMass CenterRelative DistancesRigid CenterMass CenterRelative Distances
1231.080243.091−12.011231.080243.046−11.966−0.380
2242.556249.938−7.381242.556249.932−7.376−0.069
3239.421250.068−10.647239.421250.060−10.639−0.073
4237.520250.092−12.572237.520250.083−12.563−0.072
5237.520250.082−12.562237.520250.073−12.553−0.077
6237.520250.071−12.551237.520250.061−12.541−0.078
7237.571250.064−12.494237.571250.055−12.484−0.077
8237.567250.064−12.497237.567250.055−12.488−0.073
9237.768250.073−12.305237.768250.065−12.297−0.070
10237.521250.099−12.578237.521250.091−12.571−0.061
Table 12. Comparison of the influence of CFST debonding on the X-direction shear–weight ratio of the building.
StoryGravityNo Debonding ModelDebonding ModelRate of Change (%)
(kN)Shear (kN)Shear–Weight RatioShear (kN)Shear–Weight Ratio
7132,034.8692669.2780.08332663.8120.0830−0.2046
7059,121.1374536.2820.07674523.4120.0765−0.2837
60255,087.0118265.3740.03248213.0230.0322−0.6334
50483,053.97510,834.0720.022410,765.4890.0223−0.6331
40708,010.07613,119.4160.018513,028.3840.0184−0.6939
30939,075.80014,932.3500.015914,830.1430.0158−0.6845
201,168,069.27716,558.4370.014216,446.6810.0141−0.6749
101,454,072.49718,814.9330.012918,694.5510.0129−0.6398
12,008,761.93625,115.3730.012524,973.0880.0124−0.5665
Table 13. Maximum seismic acceleration time history used in the time-history analysis (cm/s2).
Seismic EffectDegree 6Degree 7Degree 8Degree 9
Frequent
earthquake
1835 (55)70 (110)140
Rare earthquake125220 (310)400 (510)620
Table 14. Comparison of the maximum vertex displacement change in the building in Shenzhen before and after CFST debonding.
Seismic Wave
Working Condition
EI Centro WaveTaft WaveJoshua Wave
Time (s)Displacement Time (s)DisplacementTime (s)Displacement
Maximum vertex displacement (mm)No debonding53.169.9049.5129.3447.795.2
44.5−63.5746−132.8444.4−102.13
Amplitude69.90Amplitude132.84Amplitude102.13
Debonding48.271.2649.1132.8336.897.98
44.7−66.2646.3−134.0739−106.20
Amplitude71.26Amplitude134.07Amplitude106.20
Rate of change (%)Positive 1.95%Positive 2.70%Positive 2.92%
Negative 4.23%Negative 0.93%Negative 3.99%
Amplitude1.95%Amplitude0.93%Amplitude3.99%
Table 15. Comparison of base shear force change in the building in Shenzhen before and after CFST debonding.
Seismic Wave
Working Condition
EI Centro WaveTaft WaveJoshua Wave
Time (s)ForceTime (s)ForceTime (s)Force
Base shear force (kN)
×103
No debonding41.471.7445.395.1330.175.86
35.3−65.6410.4−85.9236.3−86.87
Amplitude71.74Amplitude95.13Amplitude86.87
debonding44.177.4350.891.4244.892.84
54−81.9848.5−105.7548.5−91.18
Amplitude81.98Amplitude105.75Amplitude92.84
Rate of change (%)Positive 7.35Positive −3.90Positive 22.38
Negative 24.89Negative 23.08Negative 4.96
Amplitude14.27Amplitude10.98Amplitude6.87
Table 16. Comparison of base overturning moment changes in the building in Shenzhen before and after CFST debonding.
Seismic Wave
Working Condition
EI Centro WaveTaft WaveJoshua Wave
Time (s)MomentTime (s)MomentTime (s)Moment
Base overturning moment (kN·m)
×103
No debonding51.2331.2754.1412.4946.9380.05
46.4−292.5457.2−418.4743.8−378.88
Amplitude331.27Amplitude418.47Amplitude380.05
Debonding51.4307.2154.9514.8234.8466.13
39−340.0251.3−535.5444.8−439.51
Amplitude340.02Amplitude535.54Amplitude466.13
Rate of change (%)Positive −7.26Positive 24.81Positive 22.65
Negative 16.23Negative 27.98Negative 16.00
Amplitude2.64Amplitude27.98Amplitude22.65
Disclaimer/Publisher’s Note: The statements, opinions and data contained in all publications are solely those of the individual author(s) and contributor(s) and not of MDPI and/or the editor(s). MDPI and/or the editor(s) disclaim responsibility for any injury to people or property resulting from any ideas, methods, instructions or products referred to in the content.