Article

Quantitative Analysis of Urban Canyon Morphology Impacts on Summer Outdoor Thermal Comfort: A Case Study of Chongqing, China

1
School of Thermal Engineering, Shandong Jianzhu University, Jinan 250101, China
2
Joint International Research Laboratory of Green Buildings and Built Environments (Ministry of Education), Chongqing University, Chongqing 400045, China
3
Zhejiang Leapmotor Technology Co., Ltd., Hangzhou 310051, China
4
Qingdao Science and Technology Museum, Qingdao 266000, China
*
Author to whom correspondence should be addressed.
Buildings 2026, 16(12), 2399; https://doi.org/10.3390/buildings16122399
Submission received: 29 April 2026 / Revised: 8 June 2026 / Accepted: 11 June 2026 / Published: 16 June 2026

Abstract

In the context of global climate change and rapid urbanization, urban outdoor thermal environment issues in summer have become increasingly severe. Shading has been widely recognized as an effective strategy for improving outdoor thermal comfort, yet existing evaluation methods still suffer from limitations in adaptability and accuracy. Taking Chongqing, a typical hot-humid city in China, as a case study, this paper proposes an evaluation method that accounts for human thermal adaptation, introducing three complementary indicators, namely Universal Thermal Climate Index Load (UTCIL), cumulative UTCIL (cUTCIL), and Heat Stress Duration (HSD). Focusing on four shading-related urban canyon morphological factors—orientation, aspect ratio (H/W), building asymmetry, and leaf area index (LAI) of street trees—a series of simulation scenarios was designed to quantitatively explore their impacts on summer outdoor thermal comfort. The applicability and reliability of the ENVI-met model for block-scale outdoor thermal environment simulation were validated by comparing field-measured microclimate data with simulation results. The findings demonstrate that all four morphological factors substantially influence the outdoor thermal environment. Canyon orientation considerably affects thermal comfort, with a 30° clockwise deviation from the north–south yielding optimal conditions, whereas the east–west (90°) orientation produces the poorest thermal environment, with a maximum UTCI of approximately 48.9 °C. For aspect ratio, thermal comfort improves continuously as H/W increases, with the benefit stabilizing beyond H/W = 3.5. Building asymmetry also plays a notable role: raising building height on one side can effectively reduce outdoor thermal stress, and canyons with taller west-side buildings show better thermal performance under the same asymmetry ratio. Furthermore, street tree shading and aspect ratio exhibit a synergistic cooling effect, where high LAI (e.g., 4.77) reduces UTCImax by approximately 1.8 °C at H/W = 1, but this benefit diminishes as H/W increases. The optimal outdoor thermal environment is achieved through the combination of a high aspect ratio and high LAI. These findings provide a quantitative basis and design references for optimizing outdoor thermal comfort in Chongqing. In addition, the quantitative evaluation proposed method can offer a methodological reference for other hot-humid regions.

1. Introduction

Outdoor public spaces, essential for socializing, commuting, and leisure, have thermal comfort levels that directly influence human health and urban spatial utilization efficiency. However, with global climate change and rapid urbanization, outdoor thermal environment issues are increasingly prominent, especially during summer [1]. Thermal stress, defined as the integrated net heat load imposed on the human body by the external environment [2], not only degrades travel experiences and outdoor activity quality but also poses threats to physical health and can even lead to heat-related deaths [3]. The Intergovernmental Panel on Climate Change (IPCC) has stated that urbanization and global climate change are two primary factors impacting urban climates, and their interaction challenges outdoor thermal comfort [4]. Therefore, evidence-based adaptation strategies are urgently needed, especially in rapidly urbanizing environments [5].
To combat urban heat island effects and protect citizens from heat waves, many urban planning and design strategies have been proposed, as part of broader efforts to enhance outdoor environmental comfort [6,7]. Many studies have demonstrated that air temperature and solar radiation are the strongest potential indicators of heat stress [8], but modifying air temperature in outdoor spaces is difficult [9,10]. Shading has been identified as a key solution to enhancing human habitats in hot climates [11]. As an effective urban cooling strategy, shading can modify solar radiation within streetscapes and reduce the surface temperature of the surrounding ground areas, thereby affecting thermal comfort [12]. Shaded environments can be mainly categorized into building shading and tree shading, and their thermal effects vary with spatial configuration [13,14]. Many existing studies have investigated the thermal comfort under various shading scenarios and settings through field measurements or simulation tools such as ENVI-met and Ladybug, considering differences in canyon aspect ratio, orientation, and vegetation distribution [15,16,17]. These studies provide valuable insights for enhancing the adaptive capacity to climate change. However, their evaluation methods or criteria tend to consider only objective environmental changes and neglect human subjective initiative, leading to inaccurate evaluations.
According to the thermal adaptation theory [18], in real environments, occupants are not passive recipients of thermal stimuli, but active participants who maintain their thermal comfort. When people are exposed to an outdoor non-steady thermal environment, they can actively adapt to their environment via behavioral, physiological, and psychological adaptation, while correspondingly adjusting their own thermal perception thresholds. For instance, people still perceive different thermal sensations in early summer and late summer, even under identical shaded conditions [8], and the thermal comfort benefits of shade can vary by season [12]. To achieve dynamic thermal comfort, various indices have been developed to assess and quantify individuals’ comfort levels in different environments. Among them, the Physiologically Equivalent Temperature (PET) and the Universal Thermal Climate Index (UTCI) are the most commonly used metrics, as they incorporate physiological responses and behavioral adjustments [19]. However, they still ignore the temporal variability of thermal adaptation [20]. Current outdoor thermal comfort evaluation methods have two limitations. First, among numerous related studies, particularly those employing numerical simulation methods for outdoor thermal comfort evaluation, there is a deviation in the assessment benchmarks for outdoor thermal comfort. This is because the original evaluation benchmarks of PET and UTCI only reflect the relative magnitude of outdoor thermal stress from a physiological perspective, without fully accounting for changes in human thermal adaptation, and thus cannot be directly applied to outdoor thermal stress assessment in any climate zone or time period. When evaluating outdoor thermal comfort levels across different climate zones or within a specific time period, it is still necessary to modify the original evaluation benchmarks according to local climatic characteristics and determine temperature thresholds for different outdoor thermal stress levels [21]. Secondly, most existing studies adopt instantaneous values or extreme values to compare thermal stress across scenarios, but such single-point evaluation indicators cannot objectively reflect overall thermal stress over a period, and hourly comparisons are complex to interpret.
Given continuous climate change, the existing assessment methods need to incorporate temporal differences in human thermal adaptation. It is necessary to propose an evaluation method that integrates human thermal adaptation to accurately quantify the mitigation potential of shading on outdoor thermal stress. Therefore, this study aims to develop an adaptive thermal comfort evaluation framework to quantitatively assess the mitigation effect of shading environments on outdoor thermal stress under continuous climate change, using Chongqing as a case study to demonstrate its application.

2. Method

2.1. Study Area

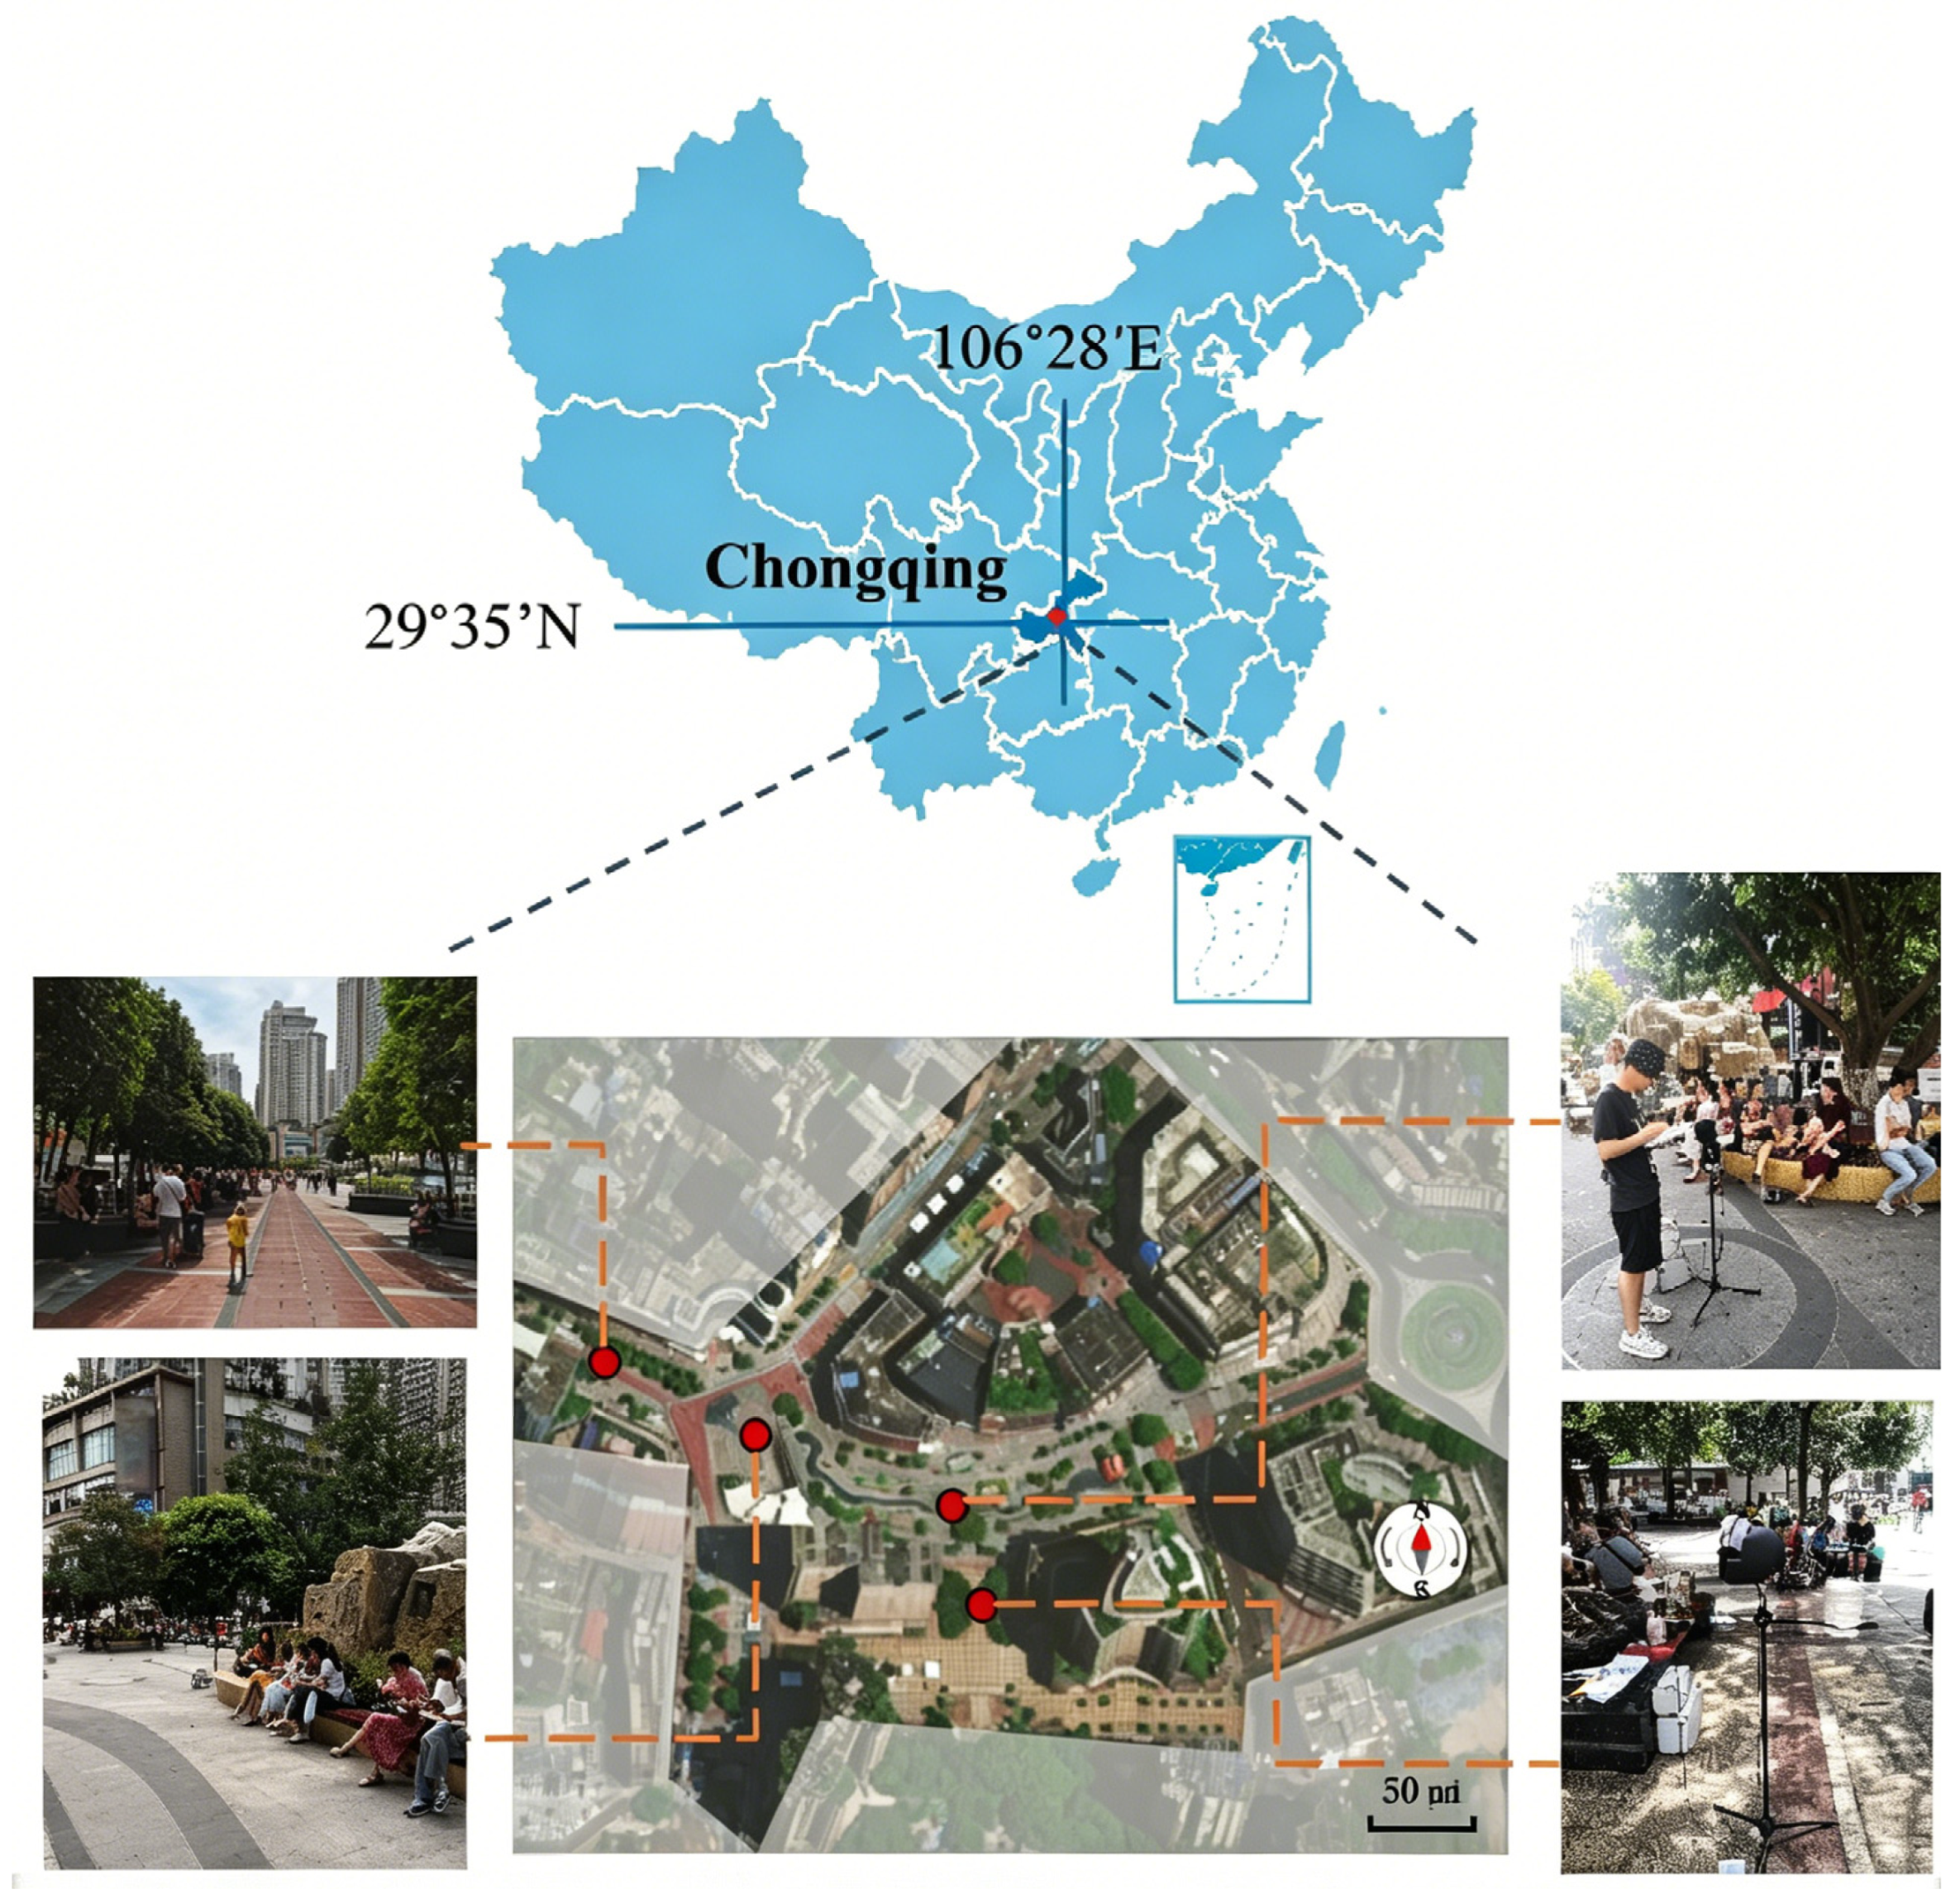
Chongqing (29°35′ N, 106°28′ E) is located in the southwest of China, and has a humid subtropical monsoon climate (Cfa) according to the Köppen climate classification. As one of China’s “four furnaces”, Chongqing has a hot summer lasting from June to September [22]. According to the historical meteorological data, the average air temperature (Ta) is the highest in August, at 32.3 °C, with the maximum air temperature reaching 42.0 °C in recent years. The mean relative humidity (RH) in summer ranges from 56% to 75%, making it one of the most humid cities in China.
To obtain the actual thermal demand of residents in hot and humid regions during summer, a series of field surveys was carried out in a public square in Shapingba District, Chongqing. The study period spanned from August 2020 to August 2021, covering different seasonal periods. All survey days were rain-free, including both sunny and cloudy conditions. Considering the main activity time of people in the public square in summer, survey data were collected in the daytime from 9:00 to 18:00. The locations and photos of the field survey sites are shown in Figure 1. Each selected measurement site was equipped with a mobile weather station to measure microclimate parameters.

2.2. Field Measurements

During the measurement campaigns, microclimate parameters, including air temperature (Ta), relative humidity (RH), wind speed (v), and globe temperature (Tg), were collected via four mobile weather stations. Among them, Ta and RH were recorded by HOBO Onset UX100-011A (ONSET, Bourne, MA, USA), and v and Tg were recorded by WFWZY-1 and HQZY-1 (Tianjian Huayi, Beijing, China). The time interval for parameter monitoring was 2 min. The resolution and accuracy of the instruments meet the requirements of ASHRAE Standard 55 [23] and ISO 7726 [24]. The specific models of the monitoring instruments are shown in Table 1. Each mobile weather station was placed on the sidewalk where the respondents were located, with sensors installed at a height of 1.5 m above the ground.

2.3. Questionnaire Survey

During the field survey, the study primarily focused on respondents who were engaged in sedentary activities such as chatting, relaxing, or using a mobile phone. Respondents selected for the questionnaire were within a 5 m range of the mobile weather station to ensure that the measured parameters accurately reflected their actual exposure environment. The questionnaire consists of two parts. Part 1 collects basic personal information, including gender, age, height, and weight. Part 2 captures respondents’ thermal perception of the current thermal environment, specifically thermal sensation and thermal acceptability. To more fully characterize the extreme thermal environments in both winter and summer, the study extends the standard 7-point Thermal Sensation Vote (TSV) scale to a 9-point scale by adding the categories “very cold” and “very hot” [25]. The resulting 9-point scale is as follows: −4 (very cold), −3 (cold), −2 (cool), −1 (slightly cool), 0 (neutral), +1 (slightly warm), +2 (warm), +3 (hot), and +4 (very hot). Thermal acceptability was directly assessed as ‘acceptable’ and ‘unacceptable’ [26], based on respondents’ willingness to accept the current environment. All participants were volunteers and were informed about the survey background of the research. A total of 2255 valid questionnaires were collected during the field survey.

2.4. ENVI-Met Simulations and Parameter Settings

ENVI-met is a three-dimensional computational fluid dynamics (CFD) model specifically designed to simulate dynamic changes in outdoor microclimates. Unlike traditional stationary models, ENVI-met accounts for complex interactions between urban forms, vegetation, and materials, making it a widely used tool for assessing local climate and thermal comfort [27]. For simulations, ENVI-met requires an area input file, which is a digital reflection of the physical model. The input area file contains the 3D physical model, geographical location details, surface materials, vegetation, and meteorological parameters. The virtual scenarios were digitized using the Spaces module. The grid configuration of the horizontal simulation domain was set to 84 × 84 units with a spatial resolution of 2.0 m in both the x and y directions. An additional 10 nested grid cells were extended beyond the model boundaries to ensure lateral stability. In the vertical direction, the total simulation height exceeded twice the height of the tallest building to ensure numerical stability, with a vertical resolution of 2.0 m in the z-direction. The near-ground layers were further refined into five uniform sublayers to enable high-detail simulations, and the grid was stretched with a 20% expansion ratio above 20 grid units. The surface and vegetation models in ENVI-met were also configured based on field observations to ensure realism and accuracy.
For the initial meteorological settings, a simplified forcing weather file was generated using the ENVI-guide module. Hourly meteorological data were obtained from the China Meteorological Data Service Center (CMDC) (http://data.cma.cn/). As this study focuses on daytime periods with intense heatwaves and frequent human activities, the simulation period was set from 7:00 a.m. to 8:00 p.m. on 30 July 2021, totaling 14 h, including a one-hour spin-up period. The selected date represents a typical hot and clear summer day in Chongqing. Detailed meteorological parameters are summarized in Table 2.

2.5. Design Simulation Scenarios

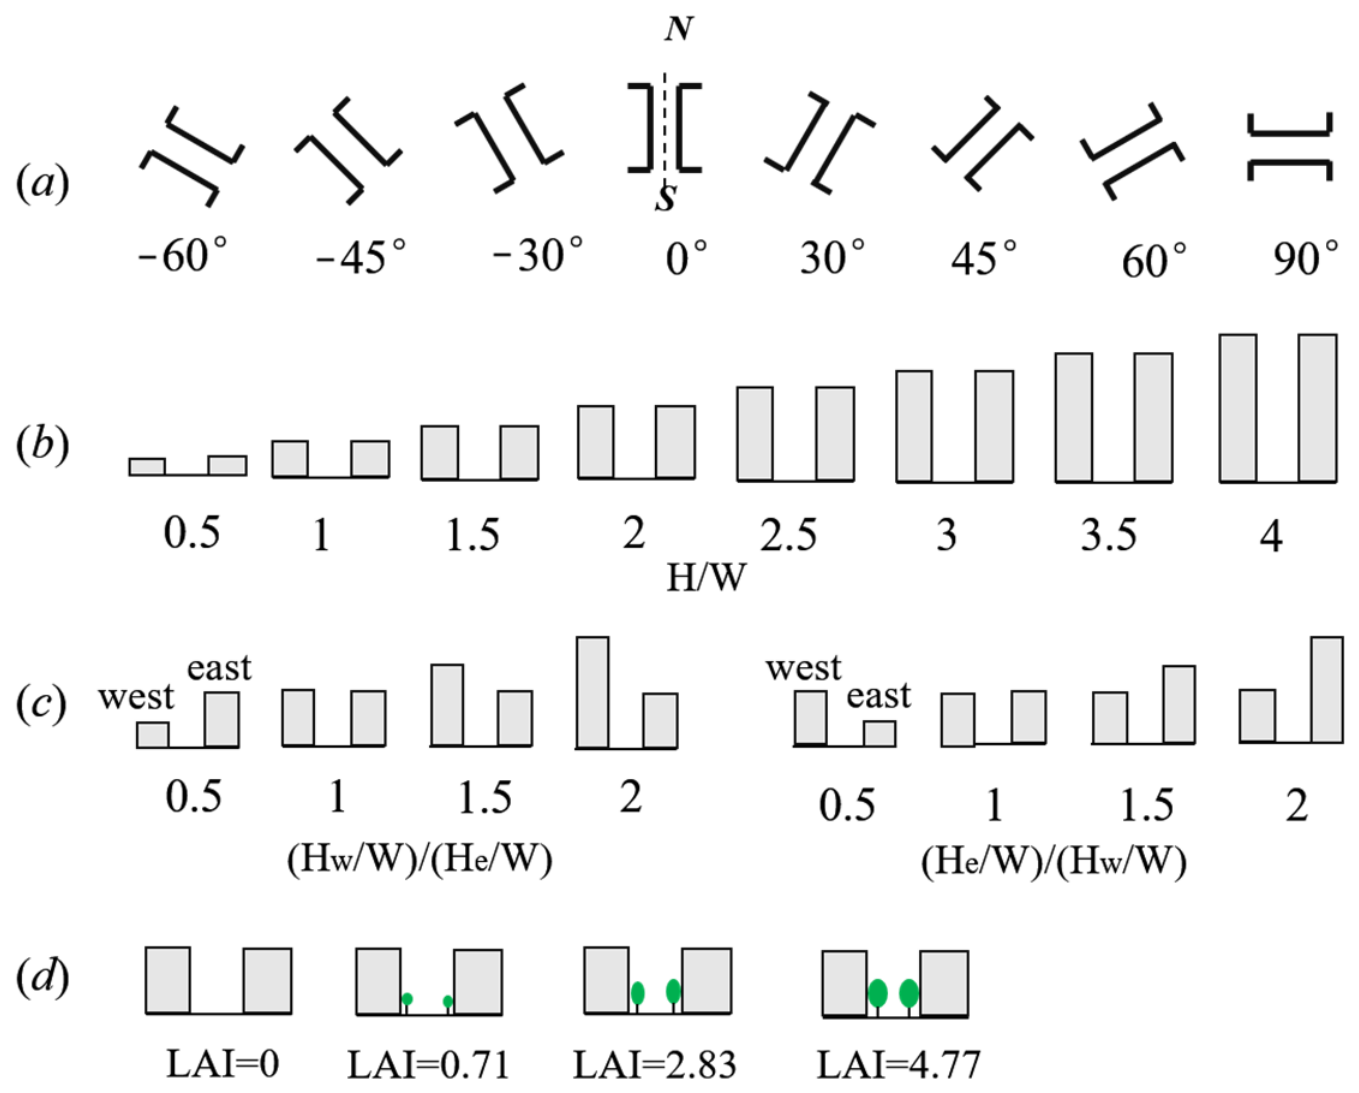
To investigate the effects of different urban spatial morphology on outdoor thermal comfort levels, the urban canyon features in Shapingba District, Chongqing were examined. These features, including orientation, height-to-width ratio (H/W), asymmetry, and street tree types were identified, based on Google 3D maps and on-site field surveys. Typical scenarios were established for numerical simulation, and detailed settings are described below, as shown in Figure 2.
(1)
For the street canyon orientation scenarios, a street canyon with H/W = 1.0 was used as the baseline. With the north–south orientation defined as 0°, a total of 8 typical scenarios were configured: −60°, −45°, −30°, 0°, 30°, 45°, 60°, and 90°. Negative values indicate counterclockwise rotation from the north–south axis, while positive values represent clockwise rotation.
(2)
At the urban block scale, H/W is widely recognized as a representative indicator of urban geometric spatial characteristics, which is defined as the ratio of building height (H) to street width (W) [28]. According to field surveys, H/W ranges from 0.5 to 4.0. With an interval of 0.5, the typical H/W scenarios are set to 0.5, 1.0, 1.5, 2.0, 2.5, 3.0, 3.5, and 4.0.
(3)
Asymmetric street canyons represent a common feature of urban morphology and exert substantial impacts on the urban microclimate [29]. Two types of asymmetric street canyon scenarios were established in this study. Firstly, the east building height (He) was fixed at a He/W ratio of 1.0, while the west building height (Hw) was gradually increased to achieve Hw/W ratios of 0.5, 1.0, 1.5, and 2.0; secondly, the west building height (Hw) was fixed at an Hw/W ratio of 1, while the east building height (He) was gradually increased to achieve He/W ratios of 0.5, 1.0, 1.5, and 2.0.
(4)
Based on local tree species characteristics, three typical tree species with distinct leaf area indices (LAI) were selected for the baseline canyon with H/W = 1.0: Ficus concinna Miq. (LAI = 4.77), Magnolia grandiflora Linn. (LAI = 2.83), and Platanus spp. (LAI = 0.71) [30]. In the model setup, the tree planting spacing was set to 8.0 m [31].

2.6. Model Validation

Although the accuracy and reliability of the ENVI-met numerical simulation method have been validated in numerous studies [32,33], its applicability still needs to be examined according to the actual conditions of case studies in different regions. To ensure methodological rigor, field measurements were integrated to validate the ENVI-met simulations. This validation process further enhanced the reliability of the model’s predictions within the specific context of this study.
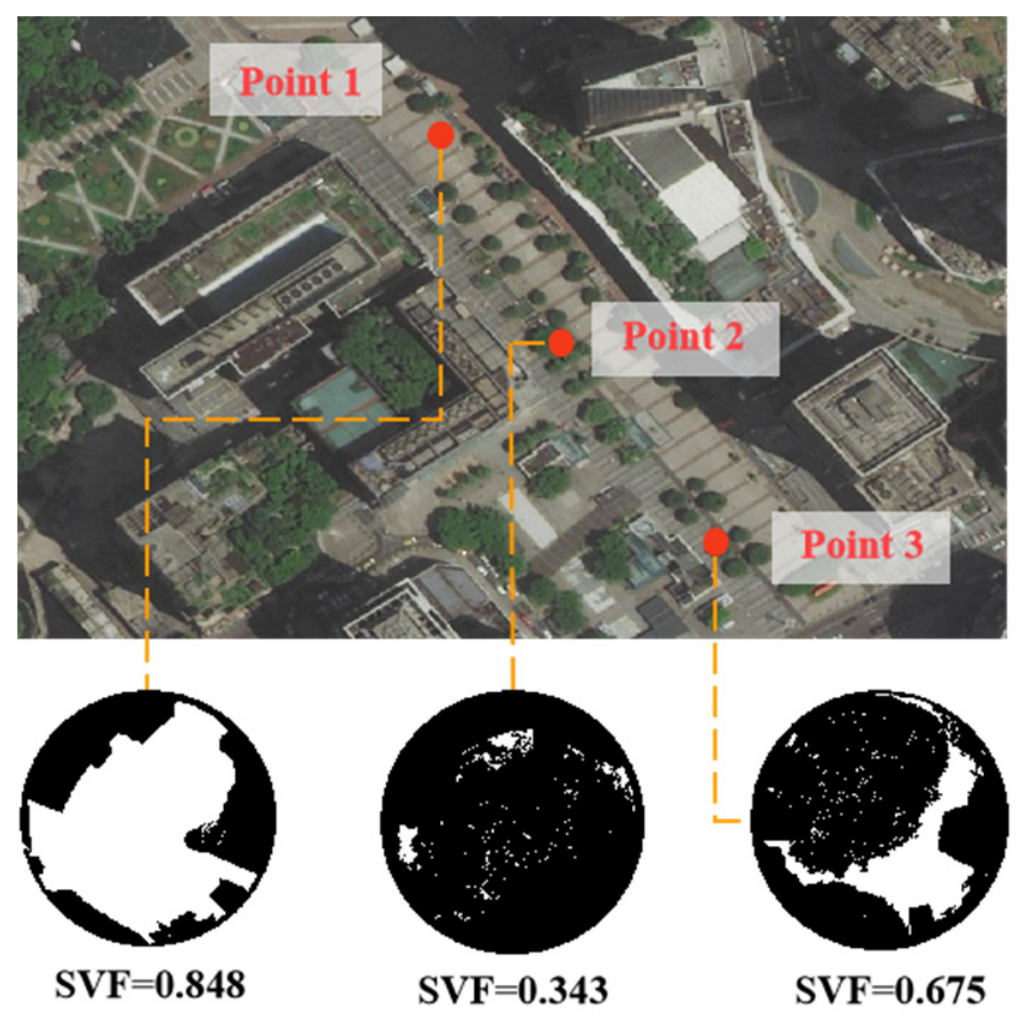
In this study, ENVI-met simulation validation was performed using a real outdoor open space as the physical model, constructed based on the actual orientation and physical characteristics of the neighborhood. The model covers a domain of 270 by 300 m, and to guarantee simulation accuracy, the height of the computational domain was set to more than twice that of the tallest building within the target block. Numerical simulations were run from 00:00 to 23:00 on 30 July 2021, representing a typical hot and clear summer day in Chongqing. Hourly meteorological data were acquired from weather stations near the study area and used as boundary input conditions. On the same day as the ENVI-met simulation, field measurements of the microclimate were carried out to collect field data on air temperature and relative humidity with portable meteorological stations. Three measurement points with distinct sky view factors (SVF) were set up in the outdoor open space, as shown in Figure 3. All points were located on impervious pavement. Point 1 was situated in an open area distant from surrounding buildings, with an SVF of 0.848. Point 2 was located in the central part of the block, where the landscape was dominated by tree–shrub assemblages. The dense canopy provides substantial shading and blocks direct solar radiation, resulting in an SVF of 0.343. Point 3 was dominated mainly by arbor vegetation, with an SVF of 0.675, which was higher than that of Point 2. The sky view factor characterizes the degree of sky exposure in three-dimensional space. The SVF values for these measurement points were calculated and analyzed using the SVF calculator in Rayman 1.2.
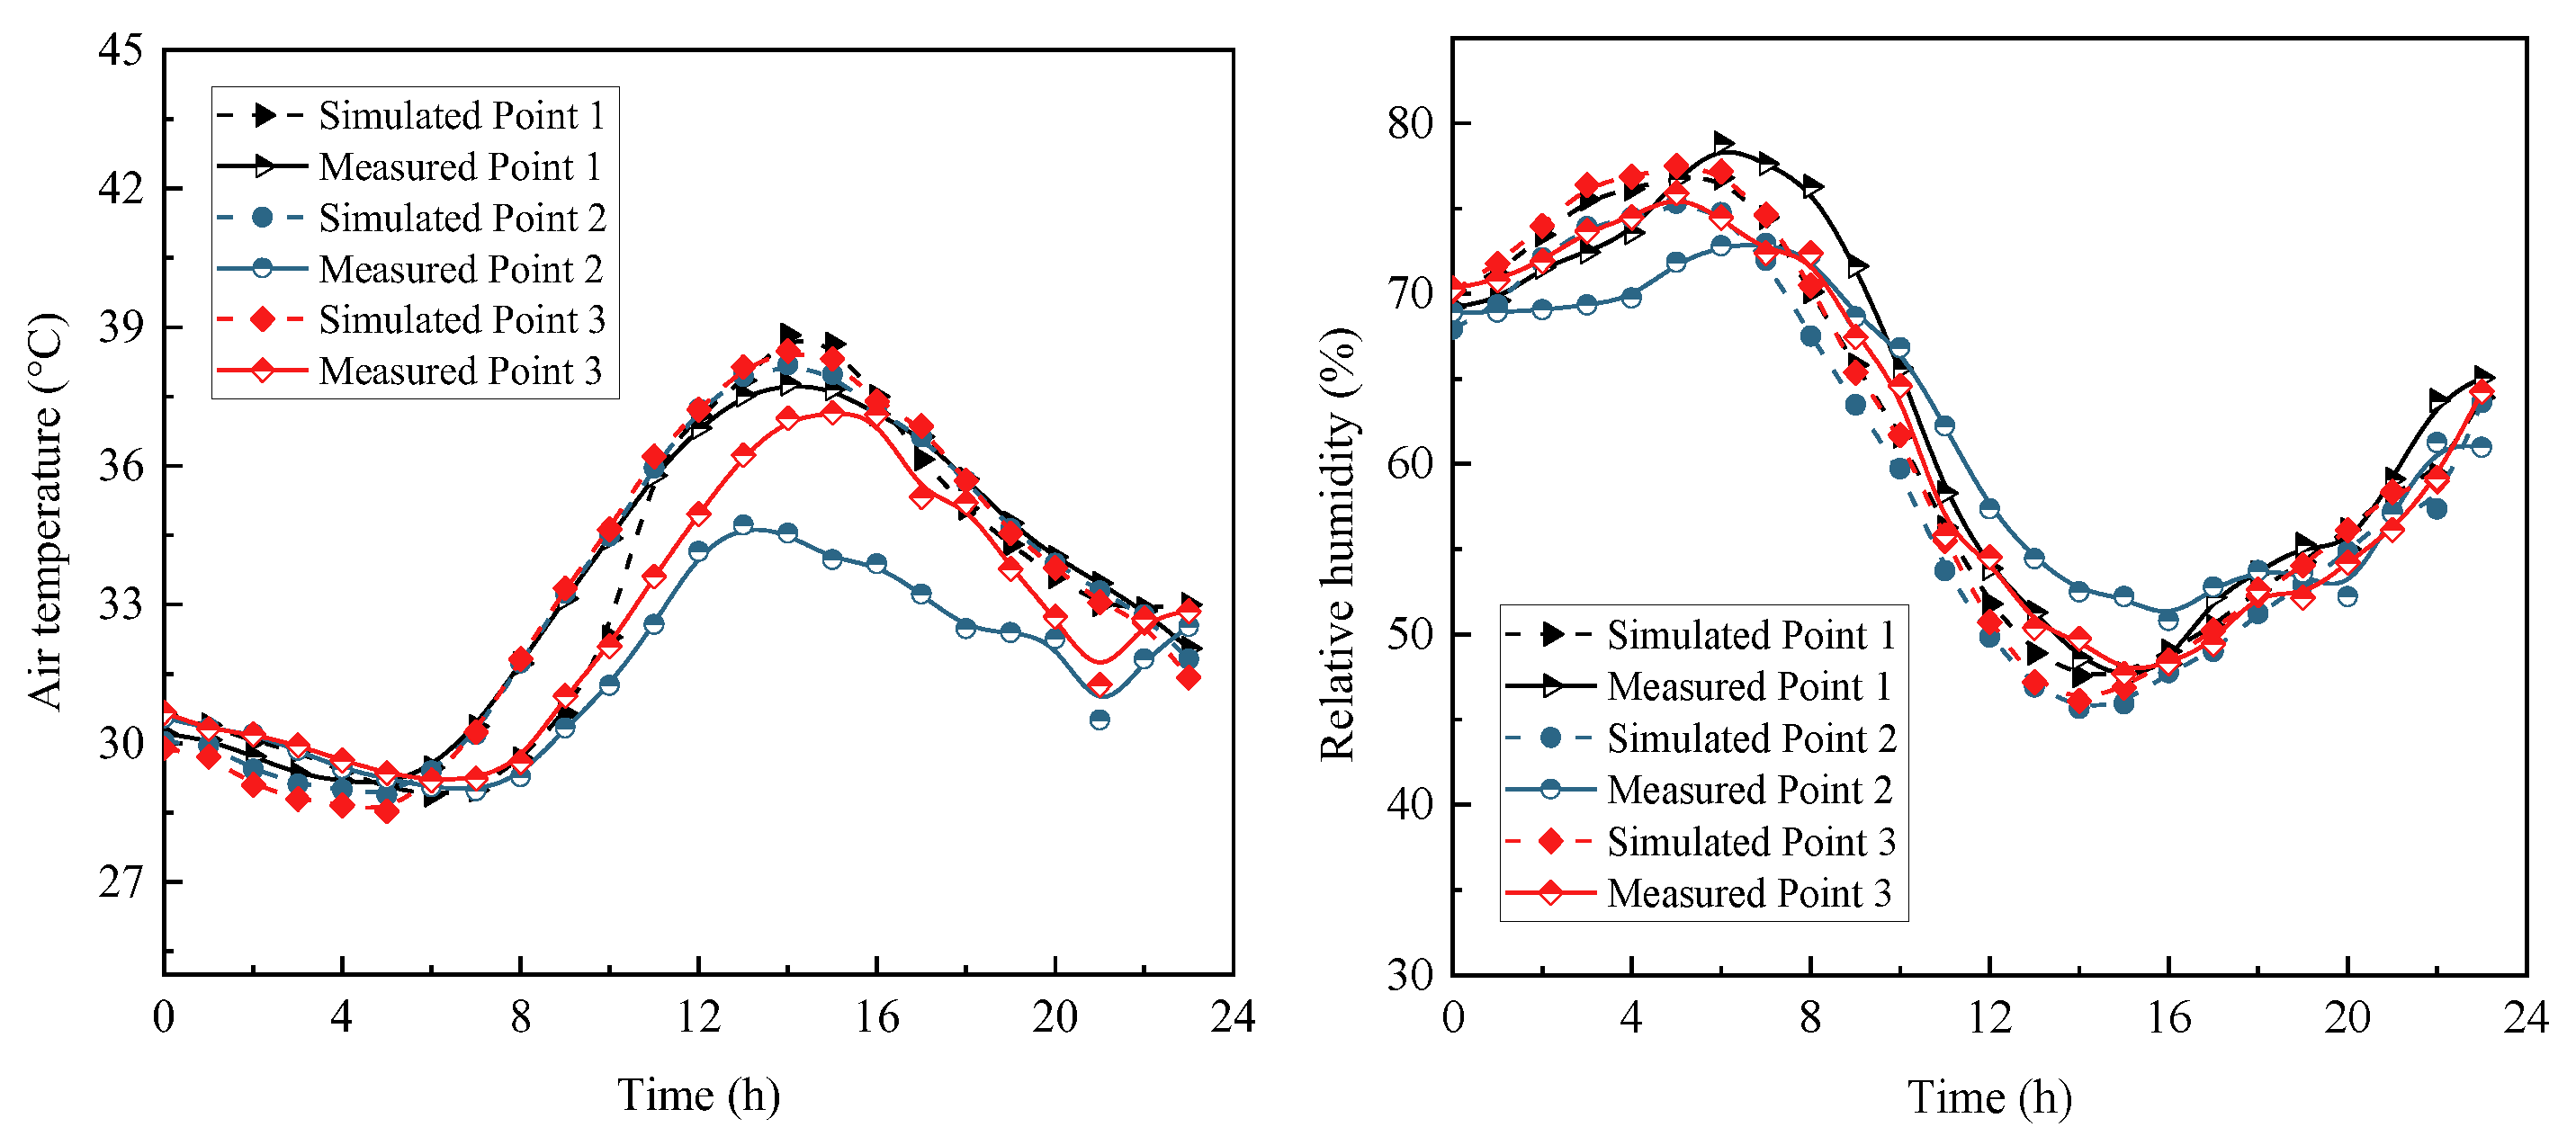
The hourly variation patterns of both measured and simulated meteorological parameters at the above three points are shown in Figure 4. From visual inspection, the overall trends of the curves are in generally good agreement, except for a few individual values at Point 2.
Subsequently, two statistical indicators were used to assess the goodness of fit between simulated and observed values: Root Mean Square Error (RMSE) and Mean Absolute Percentage Error (MAPE) [30,34]. The equations for calculating RMSE and MAPE are shown in Equations (1) and (2), respectively.
R M S E = 1 n j = 1 n ( y j y j ) 2
M A P E = 1 n j = 1 n y j y j y j × 100 %
where y j denotes the simulated value at the j-th point, and y j represents the measured value at the j-th point.
The two model reliability indicators were calculated at the three measurement points, as shown in Table 3. For air temperature, RMSE values ranged from 0.97 °C to 2.41 °C, while MAPE values ranged from 2.16% to 6.32%. For relative humidity, RMSE ranged from 2.06% to 4.57%, and MAPE ranged from 2.80% to 6.42%. Compared with the error levels reported in previous studies, the deviations between the simulated and measured values for both air temperature and relative humidity were relatively small. As per recent literature [32,33], recommended thresholds for RMSE values are below 4.30 °C for air temperature and 10.20% for relative humidity. Overall, these results indicate a satisfactory consistency between the simulations and field measurements, validating that the model reliably reproduces the actual outdoor thermal environment at the neighborhood scale.

2.7. Thermal Comfort Assessment

This study employed the ENVI-met model to calculate the Universal Thermal Climate Index (UTCI). UTCI is defined as an equivalent temperature that reflects the air temperature at which the human body would exhibit the same physiological response under multi-dimensional outdoor environmental conditions [35]. The description of the original UTCI assessment scale is associated with heat stress, and UTCI can be used to identify potentially dangerous regions and periods when humans respond physiologically to external stimuli [36]. It has been recognized and validated in various outdoor thermal environments, including extreme weather conditions [37]. However, the original evaluation criteria ignore the changes in thermal adaptation capacity induced by recent thermal experiences, and thus cannot be directly applied to the assessment of outdoor heat stress across arbitrary time periods. To address the limitation of conventional outdoor thermal comfort evaluations, this study proposes an adaptive thermal comfort evaluation framework based on three complementary indicators: the UTCI Load (UTCIL), cumulative UTCI Load (cUTCIL) and Different Heat Stress Duration (HSD). Specifically, UTCIL quantifies the deviation from adaptive thermal thresholds, cUTCIL captures cumulative heat stress exposure over time, and HSD characterizes the duration of different heat stress levels. Together, by extending the standard UTCI framework, these indicators can provide a more accurate and comprehensive evaluation of overall outdoor thermal comfort.
UTCIL is defined as the difference between the instantaneous UTCI and the baseline temperature, as shown in Equation (3).
UTCIL = UTCIh − UTCIBC
where UTCIh denotes the UTCI value at a given moment, and UTCIBC represents the baseline temperature corresponding to the upper limit of the outdoor no-heat-stress range, which varies dynamically with recent thermal experiences. The determination of UTCIBC adopts the adaptive threshold method from our previous work [20], in which recent thermal experiences are quantified by the MeanTrm index [38]. The calculation of MeanTrm follows Equation (4) [39].
MeanTrm = (1 − α)(meanTod-1 + α meanTod-2 + α2 meanTod-3 + α3 meanTod-4 + α4 meanTod-5 + ⋯ + αi−1 meanTod-i)
where α is the weighting coefficient, which is set to 0.8 according to GB/T 50785 standard [40]. meanTod-i denotes the daily mean air temperature of the i-th preceding day with the relevant data sourced from the China Meteorological Data Service Center (http://data.cma.cn/). In these standard documents mentioned above, as well as ASHRAE 55 standard [23], the calculation period of the reference outdoor air temperature was the 7 sequential days before the day in question.
Accordingly, by accounting for recent thermal experiences, UTCIL quantifies the degree to which instantaneous thermal conditions exceed the no-heat-stress threshold, enabling the evaluation of outdoor heat stress across different periods, such as early summer and late summer. A negative UTCIL value indicates that the instantaneous UTCI is below the upper limit of the no-heat-stress temperature, meaning the outdoor thermal environment is under no heat stress. Conversely, a positive UTCIL value suggests that the instantaneous UTCI exceeds this threshold, implying the outdoor thermal environment imposes a certain level of heat stress.
The cumulative value of UTCI Load over a given period is defined as the cumulative UTCI Load (cUTCIL), as presented in Equation (5):
cUTCIL = Σ(UTCIL × Δt)
where UTCIL represents the instantaneous UTCI Load, and Δt is the time interval (1 h in this study). Thus, cUTCIL denotes the cumulative heat stress exposure over the analysis period, with units of °C·h.
A lower cUTCIL indicates a smaller accumulated thermal load in the thermal environment and a higher overall thermal comfort level, and vice versa. This index can therefore be used to evaluate outdoor heat stress and overall thermal comfort over a period under a specific scenario. By comparing the difference (ΔcUTCIL) in cUTCIL between different scenarios and the baseline scenario, a quantitative assessment of outdoor thermal environments across various conditions can be achieved.
The HSD index is defined as the ratio of the duration within a specific heat stress level to the total duration, as expressed in Equation (6). A higher HSD value indicates that the outdoor thermal environment remains in that heat stress level for a longer period, and vice versa.
HSDi = (ti/T) × 100%
where HSDi is the duration proportion of a given heat stress level to the total duration, ti is the duration under that heat stress level, and T is the total duration. Specifically, HSD is calculated based on the hourly UTCI outputs. An hour is counted as belonging to a specific heat stress level if the UTCI value at the top of that hour exceeds the corresponding threshold.
Outdoor heat stress levels in summer can be determined according to the local thermal unacceptability rate among residents. The temperatures corresponding to 20%, 40%, 60%, and 80% thermal unacceptability rates are used as critical thresholds to classify outdoor thermal conditions into five levels: no heat stress, moderate heat stress, strong heat stress, very strong heat stress, and extreme heat stress [12]. The method for determining these critical thresholds has been established in our previous work [20] and is adopted in the present study to evaluate outdoor heat stress levels. It should be noted that while the adaptive threshold method is derived from prior studies, the novelty of the present study lies in the formulation of UTCIL as a deviation-based indicator, the development of cUTCIL and HSD for cumulative exposure and stress duration, and the application of this integrated framework to quantitatively assess the impacts of urban canyon morphology on outdoor thermal comfort.
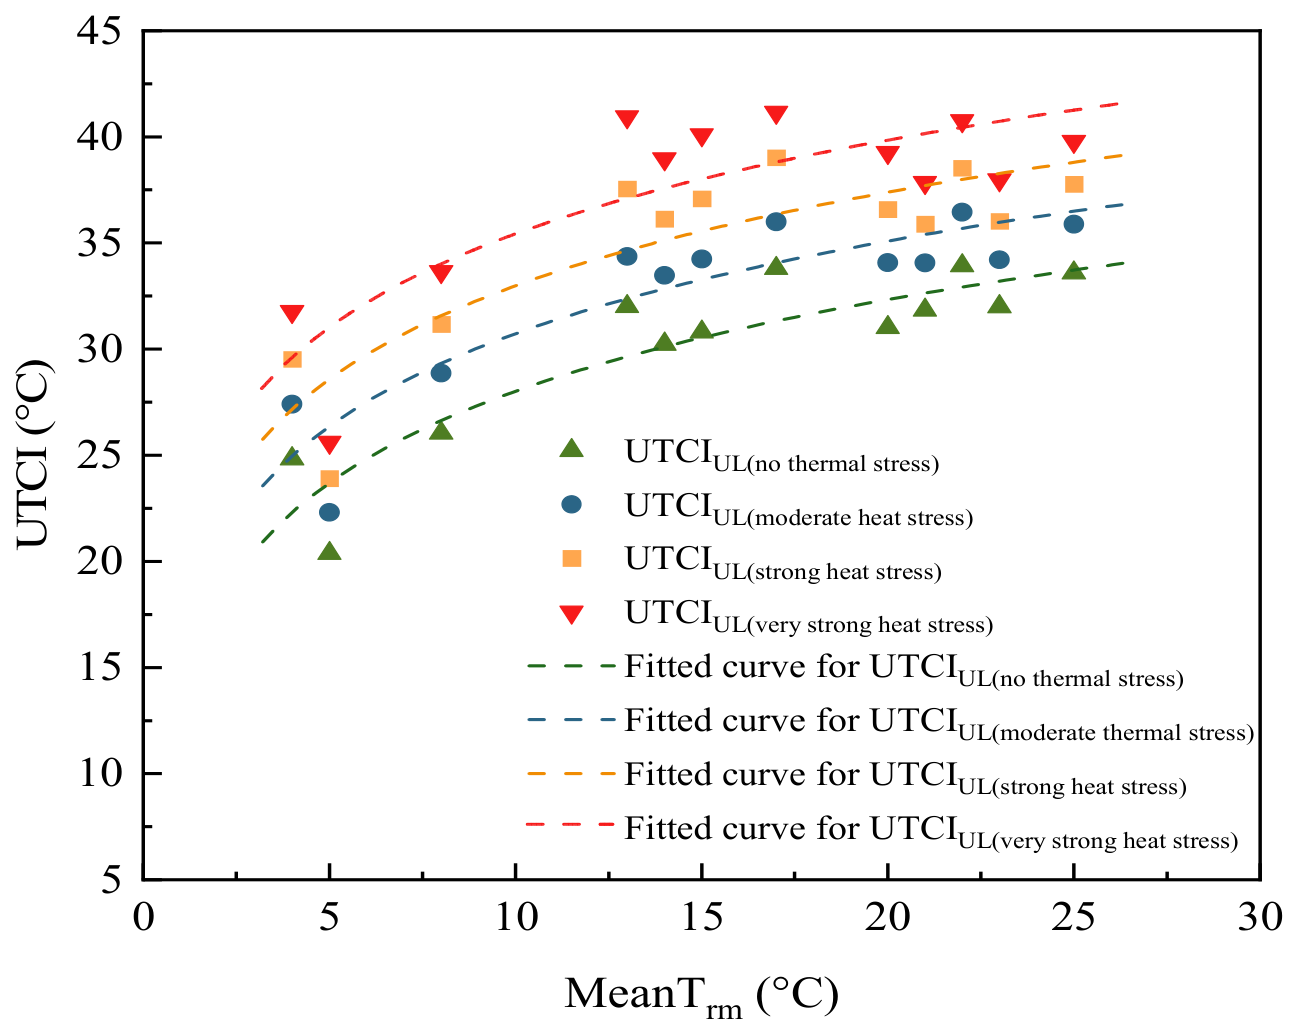
Based on the results of year-round outdoor thermal comfort surveys and following the same method established therein [20], the relationships between the critical temperatures for different outdoor heat stress levels in summer and MeanTrm are presented in Figure 5. The expressions for the critical temperatures corresponding to the no heat stress, moderate heat stress, strong heat stress, and very strong heat stress thresholds are given in Equations (7)–(10), respectively. These relationships and equations serve as the thermal threshold basis for applying our proposed indicator framework (UTCIL, cUTCIL, and HSD).
UTCIUL(no thermal stress) = 6.23 ln(MeanTrm) + 13.68 (R2 = 0.82)
UTCIUL(moderate heat stress) = 6.29 ln(MeanTrm) + 16.24 (R2 = 0.80)
UTCIUL(strong heat stress) = 6.35 ln(MeanTrm) + 18.36 (R2 = 0.74)
UTCIUL(very strong heat stress) = 6.39 ln(MeanTrm) + 20.65 (R2 = 0.69)
30 July 2021, a typical summer day, is taken as an example to demonstrate the application of the proposed indicators. Based on the daily average temperatures over the previous 7 days, the MeanTrm for the simulation day was calculated as 24.26 °C. Using Equations (7)–(10), the temperature ranges for no thermal stress, moderate heat stress, strong heat stress, very strong heat stress, and extreme heat stress were determined to be <33.55 °C, 33.55–36.30 °C, 36.30–38.61 °C, 38.61–41.03 °C, and >41.03 °C, respectively. Table 4 compares the original UTCI heat stress categories [41] with the modified UTCI categories developed in this study. Several observations can be made. First, the upper limit of the “no thermal stress” category increases from 26 °C in the original scale to 33.55 °C in the modified scale. This shift reflects the inclusion of recent thermal adaptation. In hot-humid Chongqing, residents’ prolonged exposure to high temperatures during summer elevates their thermal tolerance, so moderate thermal stress occurs at higher temperatures compared to populations in temperate climates [8]. Second, the threshold for “extreme heat stress” decreases from 46 °C to 41.03 °C, indicating that once the adaptive capacity is exceeded, the risk escalates rapidly. Third, the modified thresholds are not fixed but vary dynamically with MeanTrm, whereas the original UTCI thresholds are static. This dynamic adjustment allows the modified scale to more accurately reflect human thermal perception under changing weather conditions and across different climatic backgrounds.

3. Results and Discussion

3.1. The Effects of Street Canyon Orientation on Outdoor Thermal Comfort Level

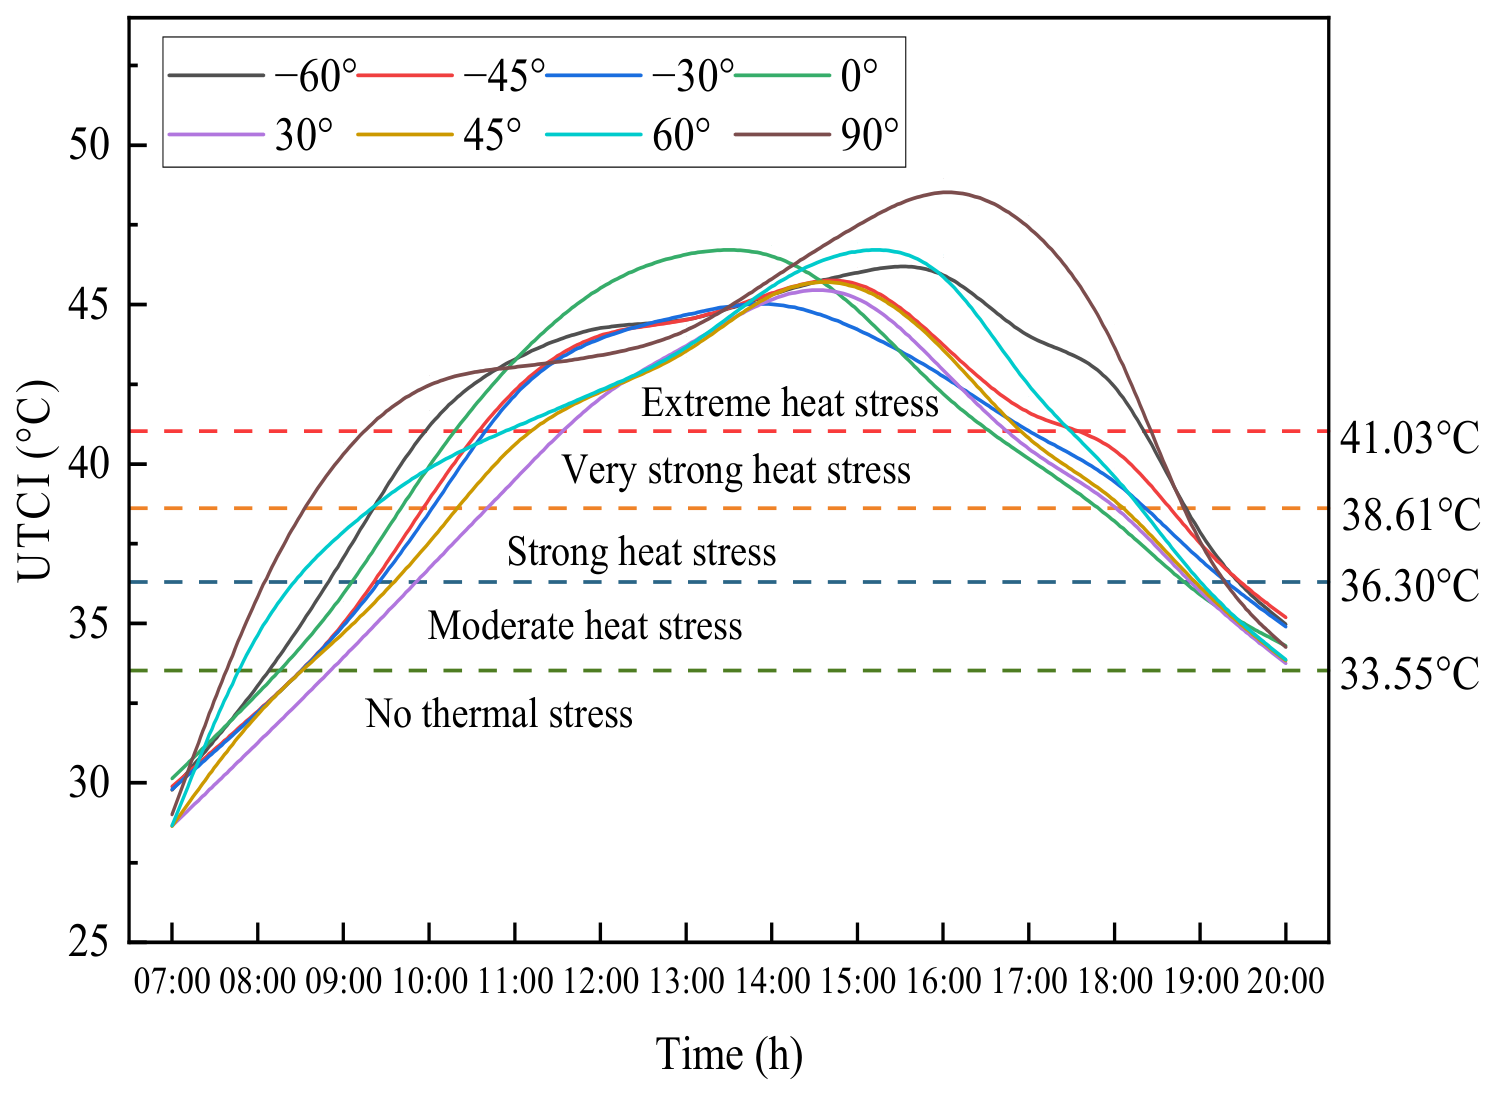
Orientation is a key factor influencing solar radiation penetration into street canyons. Variations in orientation can lead to corresponding changes in outdoor thermal comfort and thermal stress levels within the canyon. Figure 6 shows the temporal variation in the UTCI within a typical street canyon with H/W = 1.0 under different orientation scenarios during the period from 7:00 to 20:00. The temperature thresholds corresponding to different outdoor thermal stress levels are marked by dashed lines in different colors. As can be seen from Figure 6, the outdoor thermal stress in street canyons of all orientations shows a trend of increasing first and then decreasing over time, but there are substantial differences in the UTCI maximum value (UTCImax) and its occurrence time among street canyons with different orientations. For the UTCImax, among all orientation scenarios, the 90° (east–west) street canyon exhibits the highest UTCImax, approximately 48.9 °C. The street canyons oriented at −60° and 60° exhibit similar UTCImax values, approximately 46.5 °C and 46.9 °C, respectively. The UTCImax values of the street canyons oriented at 0° (south–north), ±45°, and ±30° decrease in sequence, with the −30° orientation showing the lowest UTCImax value of approximately 45.3 °C. This difference is primarily attributed to the diurnal variation in solar position. In east–west oriented canyons, both facades receive direct solar radiation during midday and afternoon hours, leading to prolonged and intense shortwave radiation absorption. Moreover, due to the asymmetry of solar geometry around solar noon at Chongqing’s latitude, north–south-oriented canyons (with a 30° deviation) experience self-shading during peak radiation hours, as the building walls block a substantial portion of direct sunlight, thereby reducing surface and air temperatures. In terms of the occurrence time of UTCImax value, the peak value in the 0° (north–south) street canyon appears at approximately 14:00. As the street canyon orientation deflects clockwise or counterclockwise from the north–south axis, the peak value is consistently delayed, with most scenarios exhibiting peak thermal stress between 15:00 and 16:00. Notably, the 90° (east–west) street canyon records the latest peak, occurring at around 16:00.
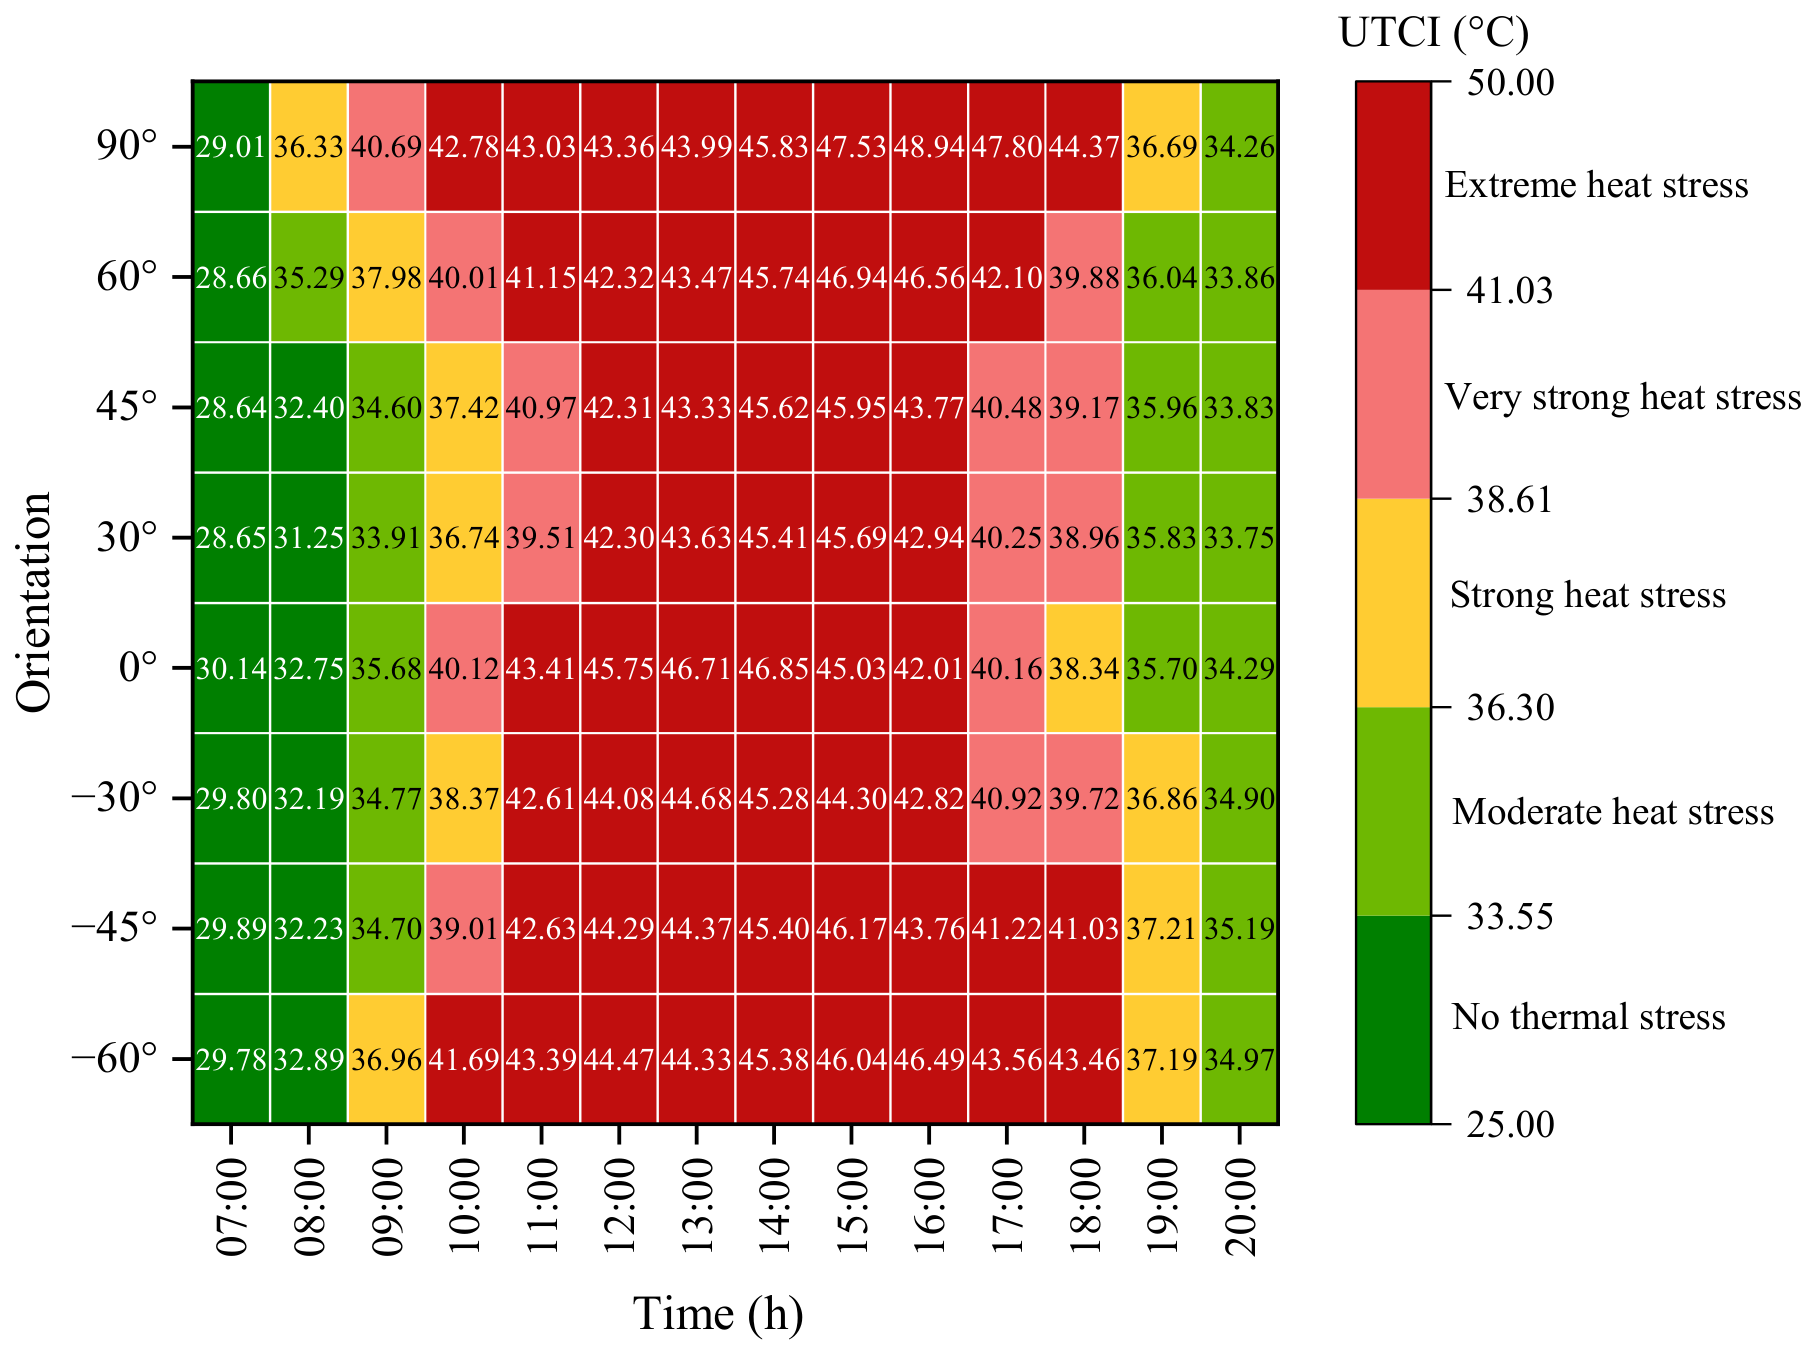
Figure 7 presents the heatmap distribution of UTCI across different orientations at various times. For any given time, there are differences in heat stress among street canyons with different orientations. According to the analysis of the total duration proportion of no thermal stress and moderate heat stress outdoors, the 90°-oriented street canyon shows the lowest proportion, at approximately 14.2%. The remaining orientations in ascending order are: −60° (about 21.4%), and −30°, ±45°, 60° (about 28.6%), 0° and 30° (about 35.7%). In terms of the duration proportion of extreme heat stress outdoors, the street canyon oriented at 90° and −60° account for the highest proportion, approximately 64.3%. The remaining orientations in descending order are: −45° (about 57.1%), 60° (about 50.0%), 0° and −30° (about 42.9%), and 45° and 30° (about 35.7%). These findings demonstrate that street canyon orientation not only substantially influences the magnitude of thermal stress peaks but also extends the duration of high-temperature thermal stress, thereby intensifying thermal discomfort in urban street canyons. It should be noted that the HSD analysis is based on hourly simulation outputs. Consequently, the reported duration percentages have a resolution of approximately 7.1% (1/14). Future studies with finer temporal resolution could reduce this uncertainty.
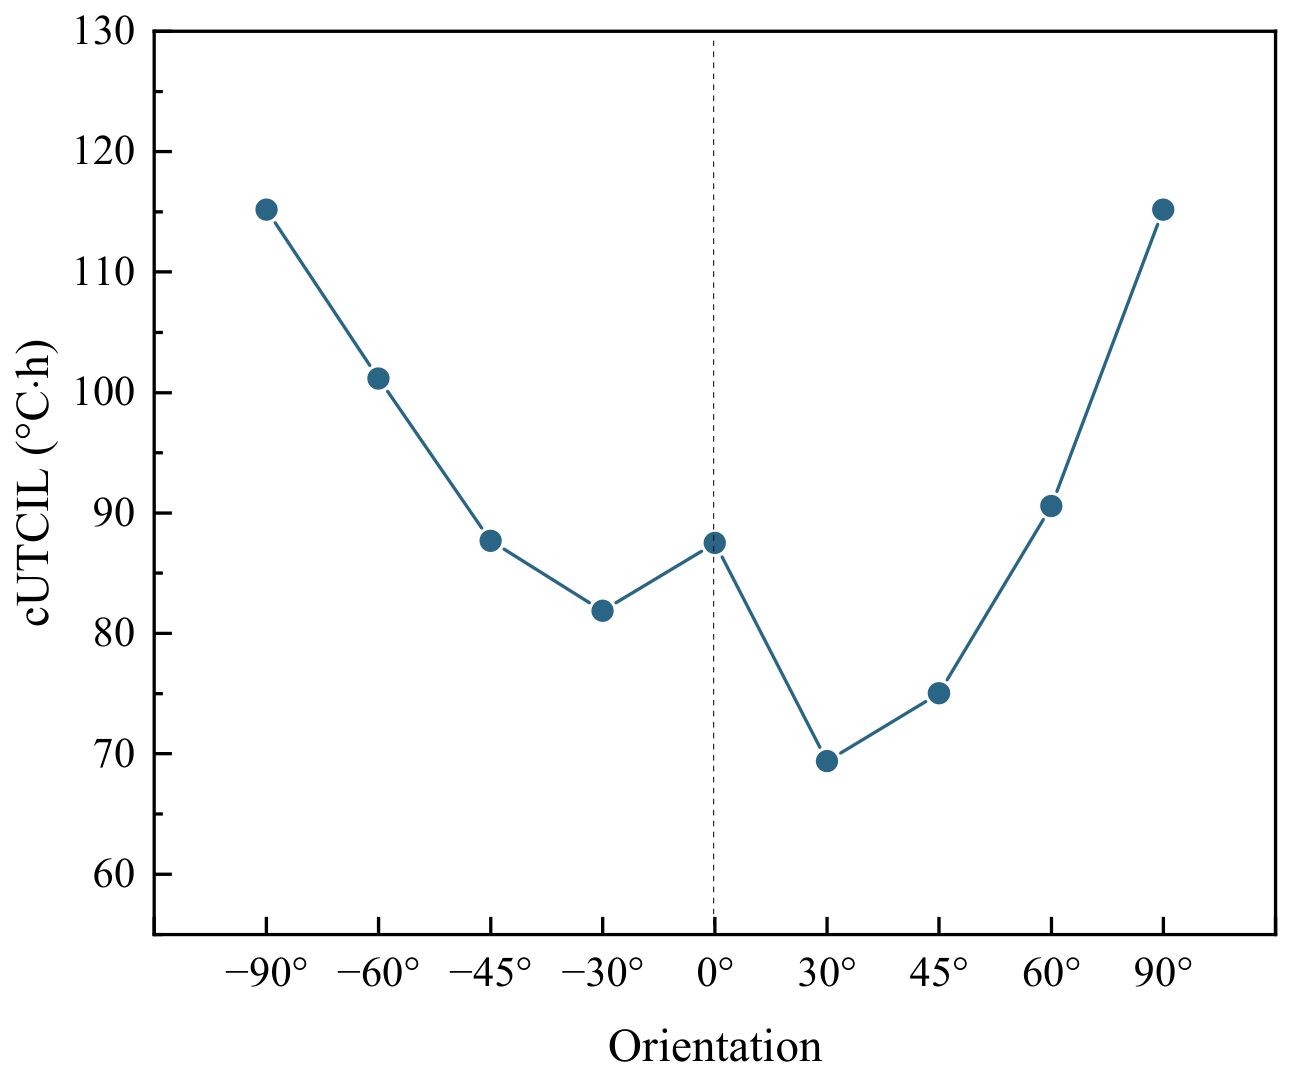
Figure 8 shows the variation in cUTCIL within the street canyon as a function of orientation. Taking the 0° orientation as the reference case, for equivalent clockwise and counterclockwise rotations, the cUTCIL values under clockwise deflection are consistently lower than those under counterclockwise deflection. Meanwhile, cUTCIL generally increases with the absolute magnitude of the orientation angle. Among all orientations, the 90° street canyon exhibits the highest cUTCIL value, approximately 115.2 °C·h, while the 30° street canyon has the lowest cUTCIL value, about 69.4 °C·h.

3.2. The Effects of Street Canyon Aspect Ratio on Outdoor Thermal Comfort

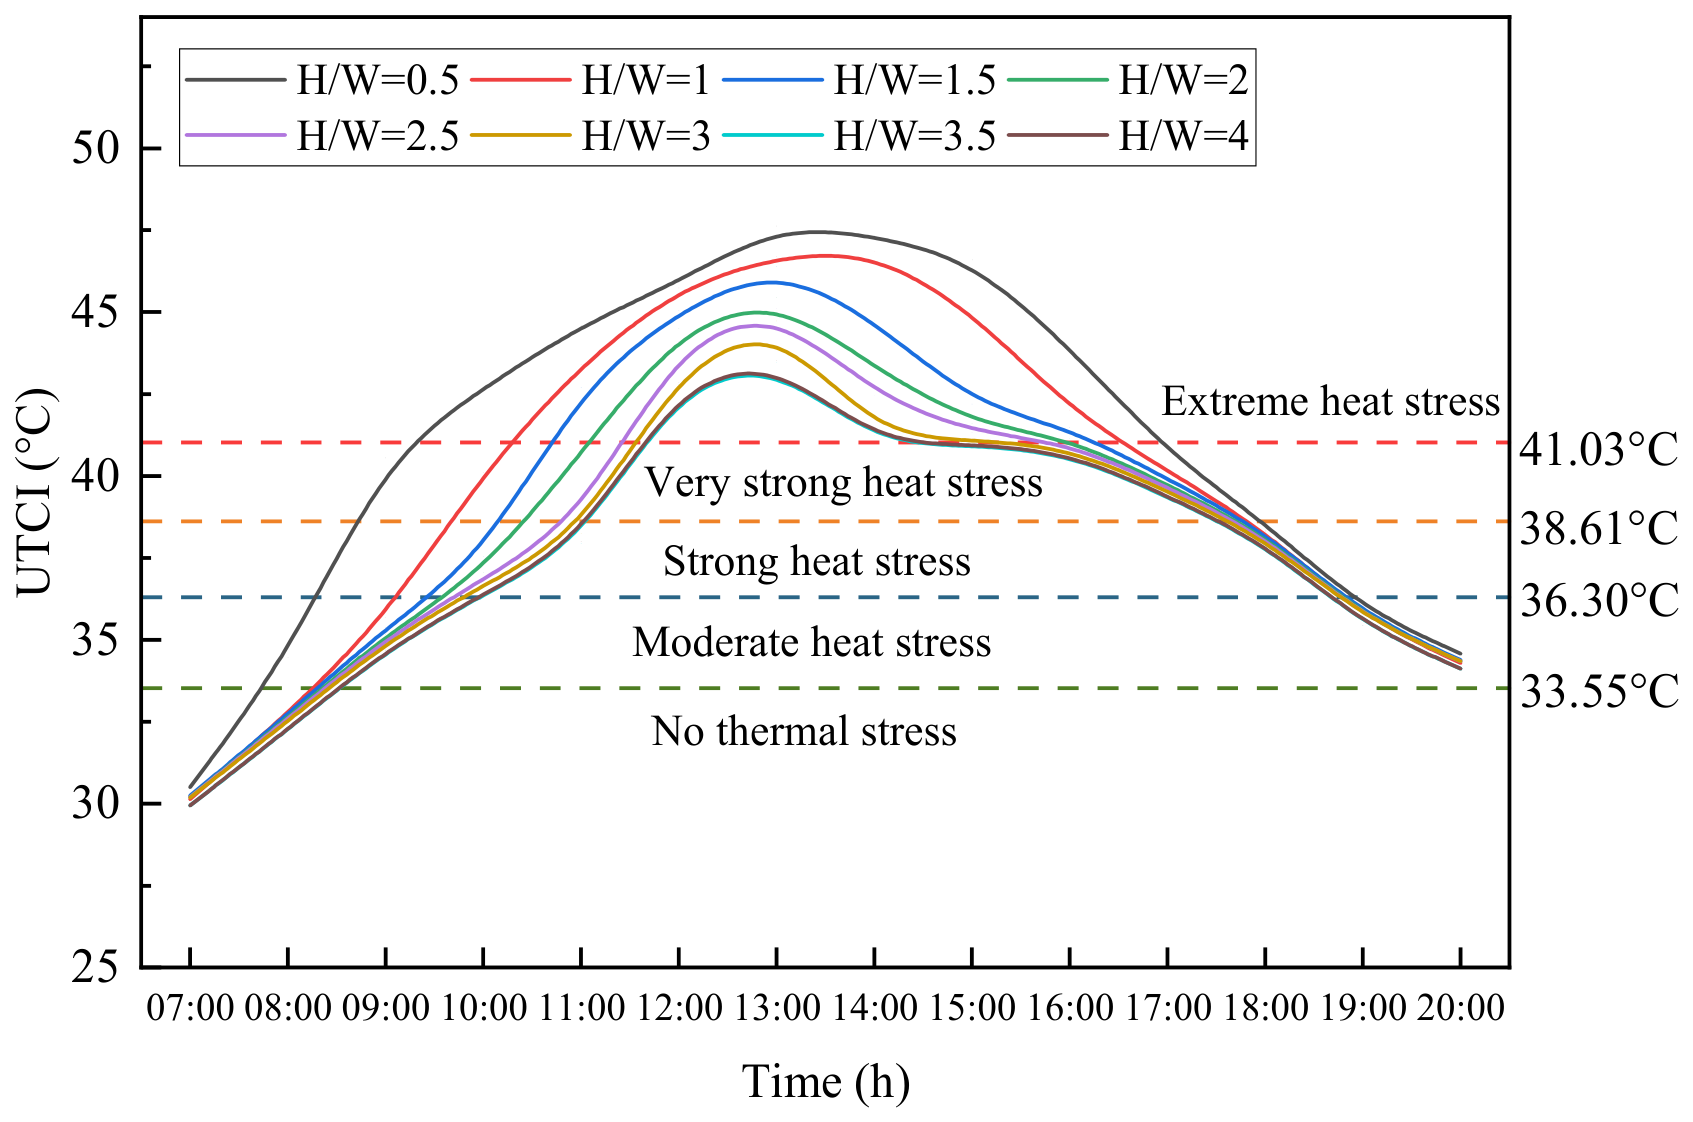
Taking the north–south-oriented street canyon as the reference case, Figure 9 shows the temporal variation in UTCI inside the canyon for different aspect ratios (H/W) during the period from 7:00 to 20:00. As observed, under all H/W conditions, outdoor heat stress shows an initial increase followed by a decrease over time. At a given time, the UTCI value decreases with increasing aspect ratio, and the magnitude of UTCI increment gradually diminishes as H/W rises. Notably, no substantial difference is found in the temporal evolution of UTCI between H/W = 3.5 and H/W = 4.0. Regarding the UTCImax value, its occurrence time is relatively consistent across all aspect ratios, concentrated around 13:00–14:00. And the highest UTCImax value reaches approximately 47.6 °C at H/W = 0.5, while the lowest UTCImax of about 43.5 °C appears at both H/W = 3.5 and H/W = 4.0.
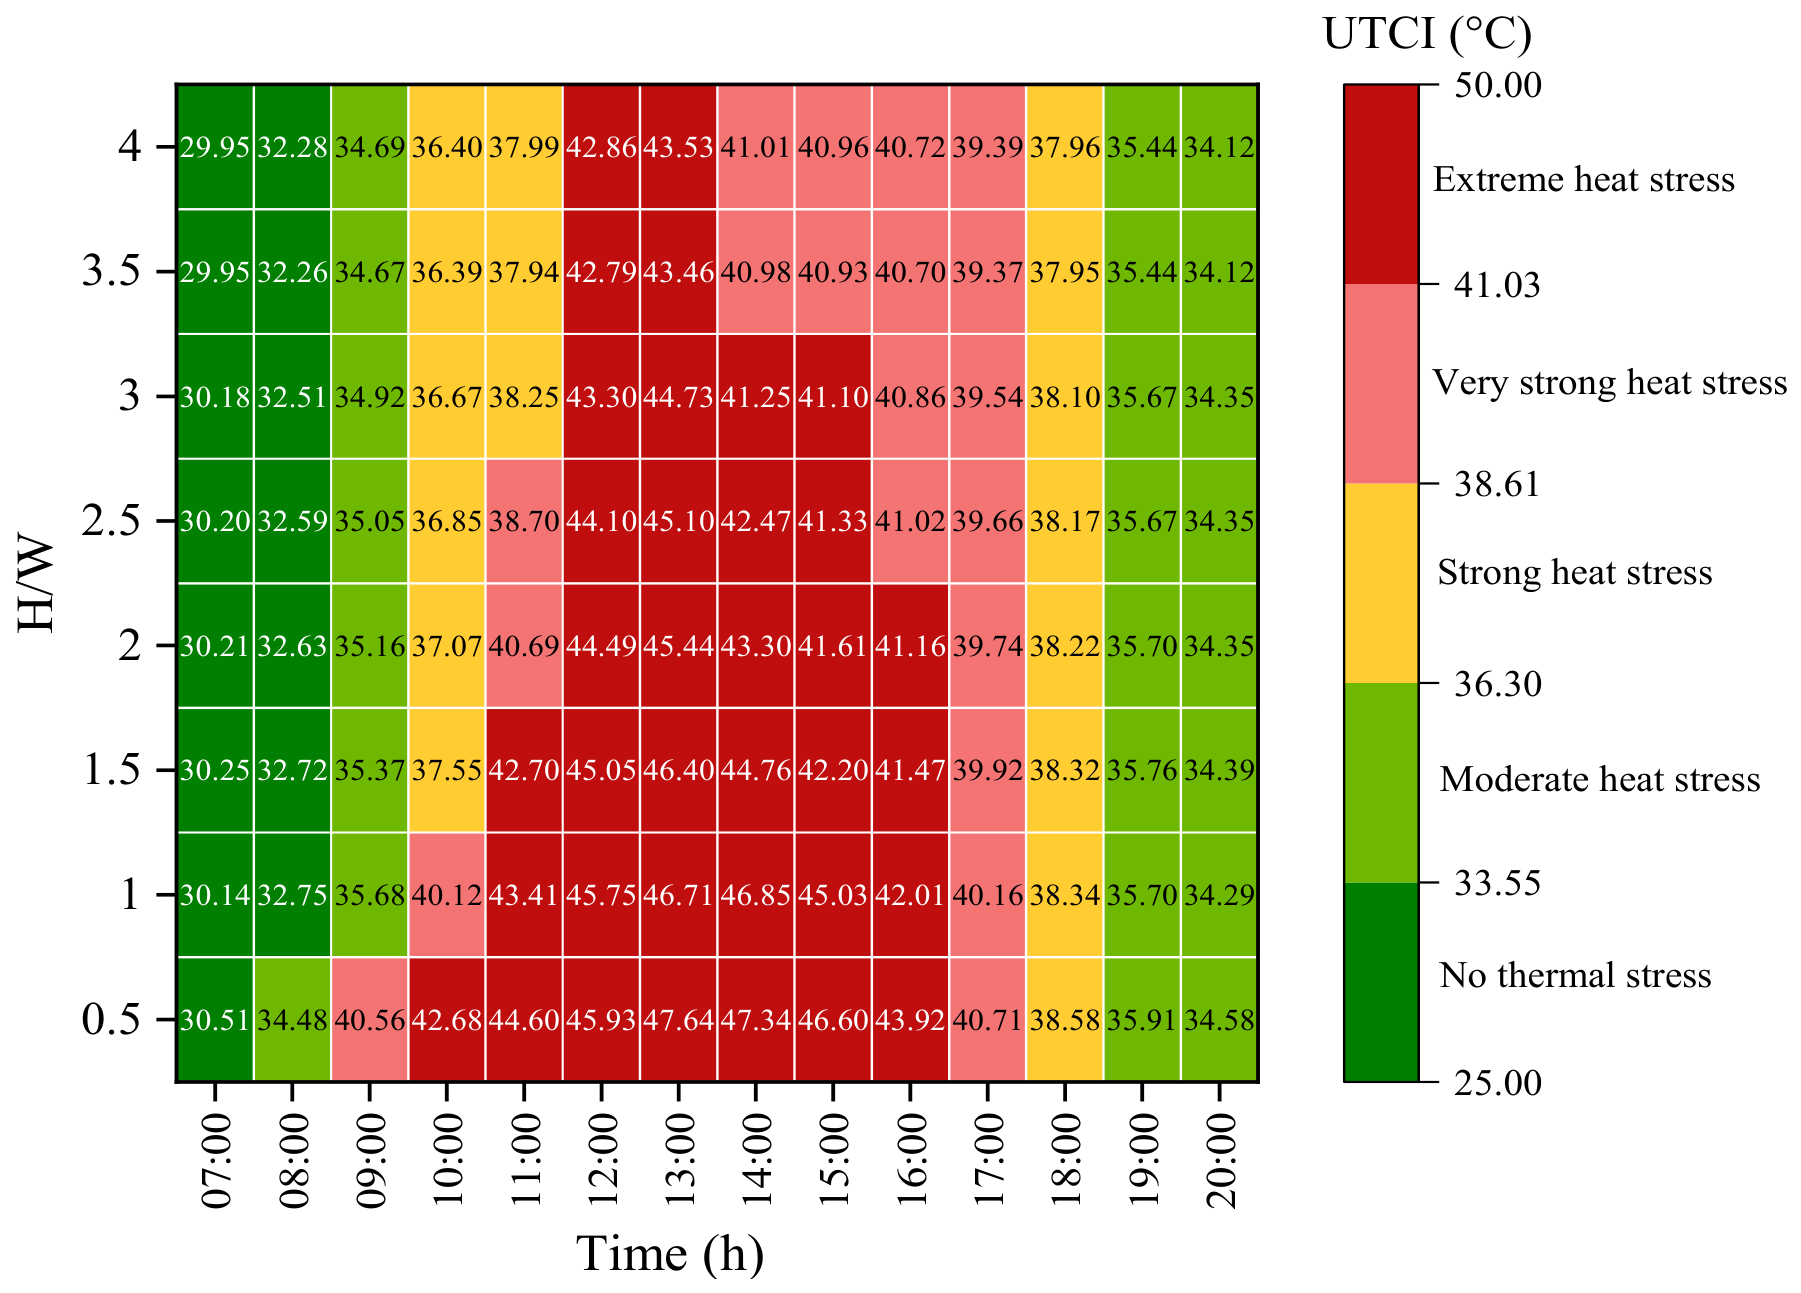
Figure 10 presents the heatmap distribution of UTCI across different H/W at various times. An analysis of the combined duration proportion of no thermal stress and moderate heat stress indicates that the proportion is minimized at the H/W of 0.5, at approximately 28.6%. With increasing H/W, the total duration proportion remains relatively stable at approximately 35.7%. For extreme thermal stress, its duration proportion peaks at H/W = 0.5, reaching roughly 50.0%. As H/W increases, this proportion decreases gradually and stabilizes at approximately 14.3% when H/W exceeds 3.5. Correspondingly, the total duration proportions of extreme heat stress at H/W of 1.0, 1.5, 2.0, 2.5 and 3.0 are about 42.9%, 42.9%, 35.7%, 28.6%, and 28.6%, respectively.
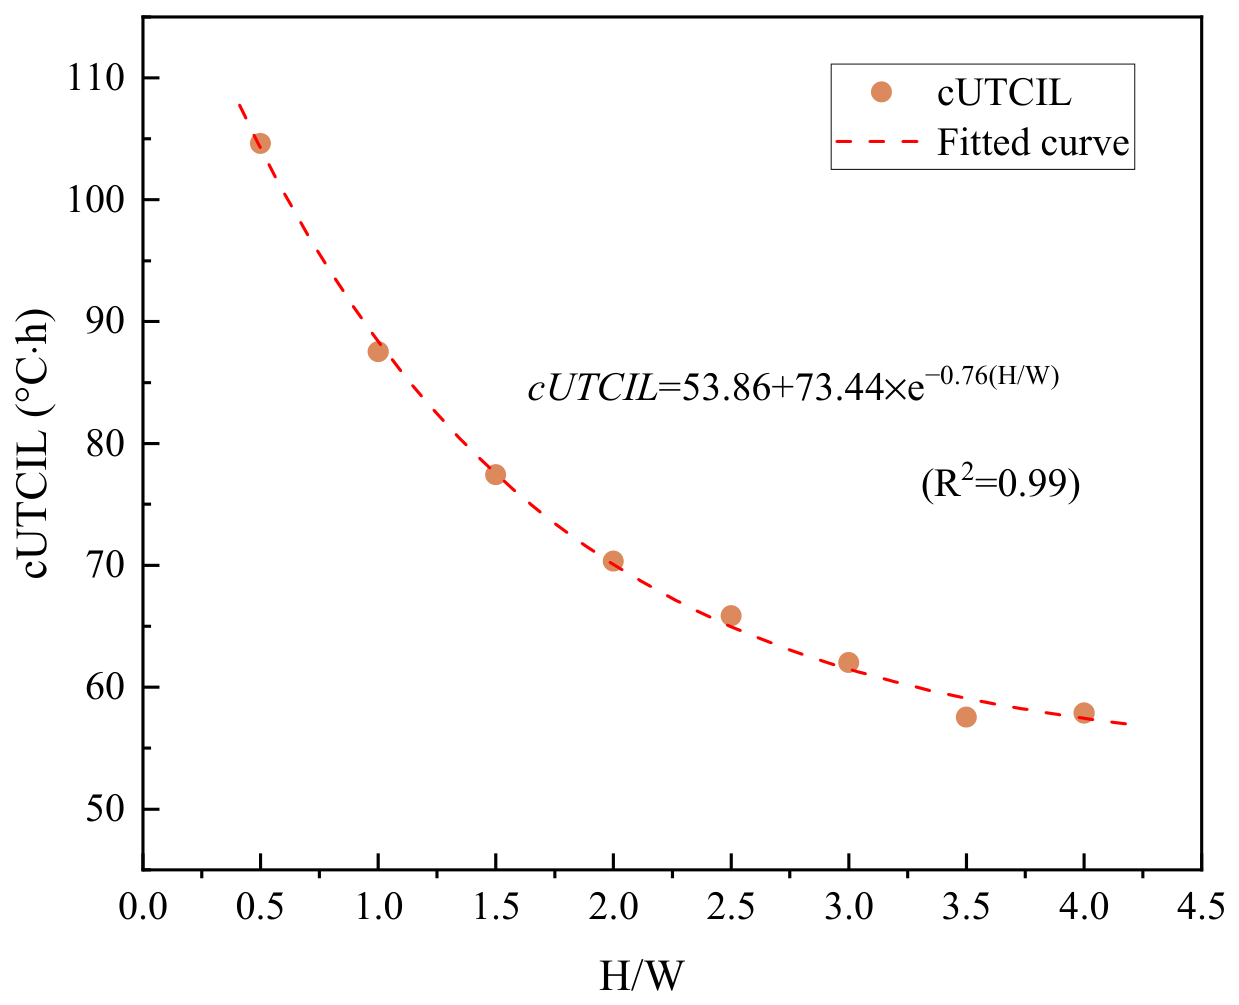
Figure 11 shows the variation in cUTCIL in street canyon with the increase in aspect ratios. To quantitatively describe the relationship between cUTCIL and H/W, an exponential decay model was fitted to the simulation data. The regression equation is expressed as:
cUTCIL = 53.86 + 73.44 e−0.76(H/W) (R2 = 0.99)
As shown, the cUTCIL value exhibits an exponential decay with increasing H/W. The cUTCIL reaches its maximum of approximately 104.6 °C·h at H/W of 0.5, and tends to stabilize at around 57.5 °C·h when H/W exceeds 3.5. This exponential decay can be explained by the reduction in Sky View Factor (SVF) as H/W increases. A lower SVF limits the amount of shortwave radiation reaching the canyon ground and reduces longwave radiative cooling loss to the sky. Beyond H/W = 3.5, the canyon ground is almost entirely shaded during peak solar hours, and further increases in H/W yield negligible additional shading benefit, as the sun’s direct beam is already fully blocked. For the north–south-oriented canyon under summer conditions in Chongqing, the optimal outdoor thermal comfort is observed at H/W = 3.5 and 4.0, as determined by the comparison of UTCImax, cUTCIL, and HSD indices above. It should be noted that the optimal aspect ratio may vary under different climatic conditions, geographic locations, or canyon orientations.

3.3. The Effects of Street Canyon Asymmetry on Outdoor Thermal Comfort Level

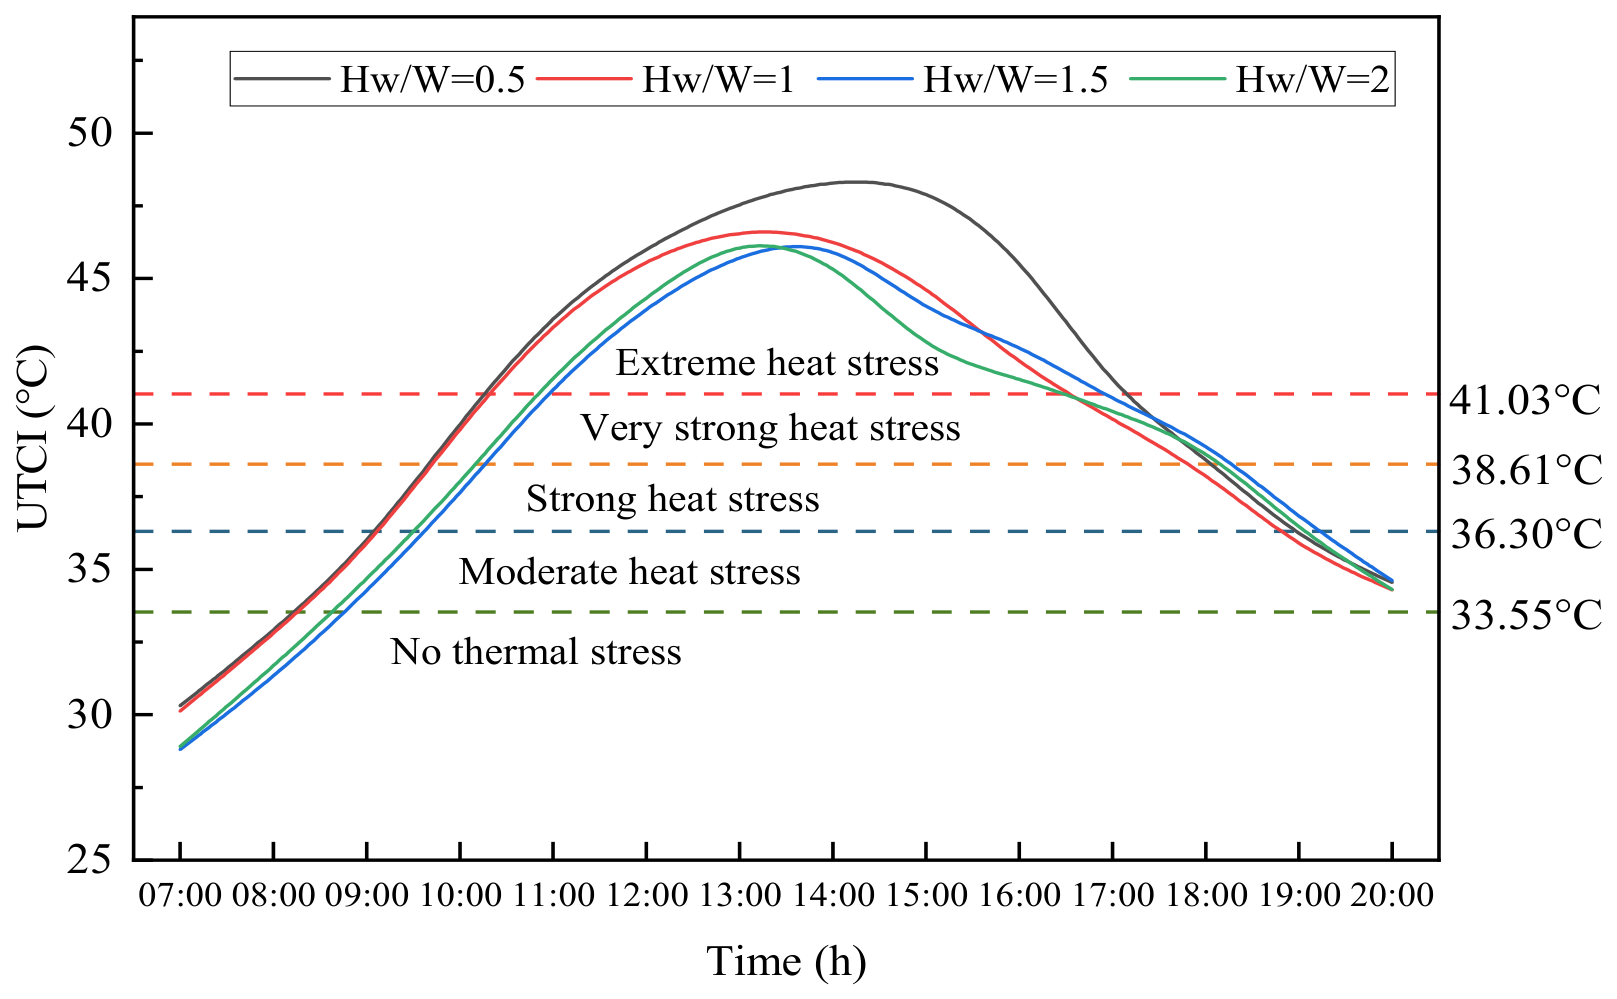
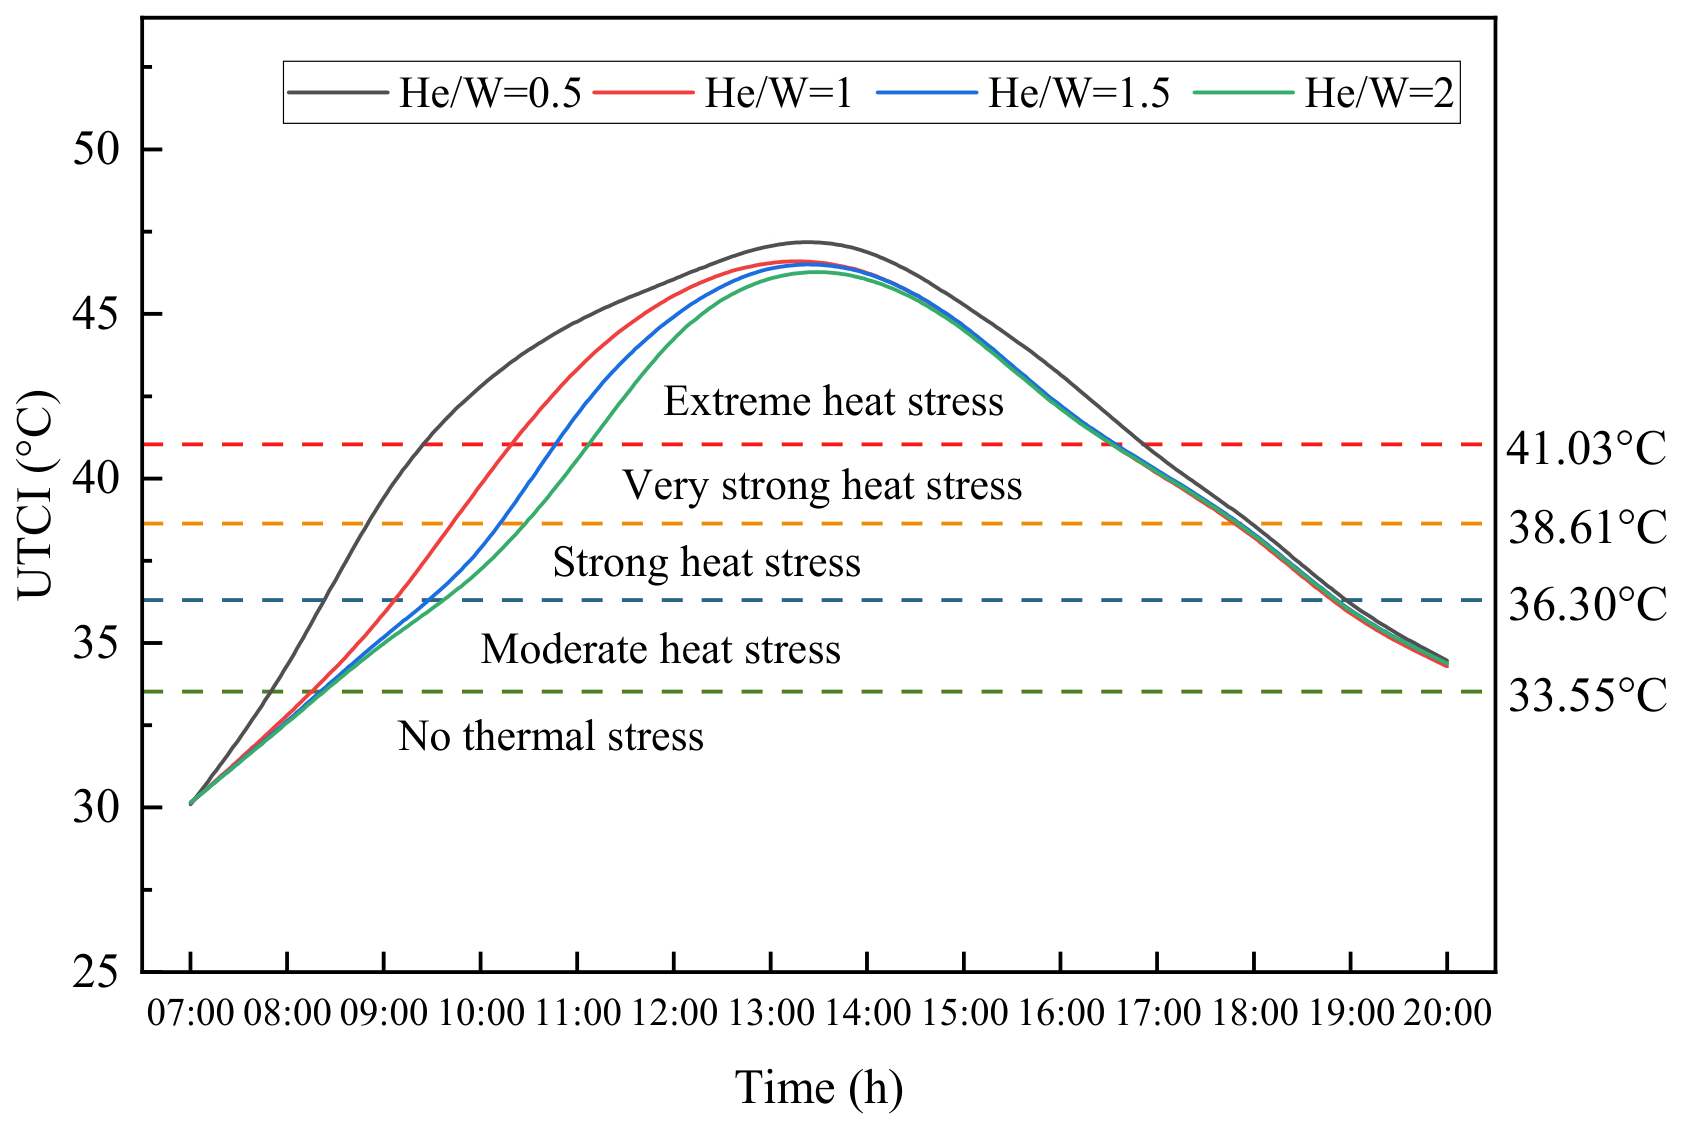
Taking the north–south-oriented street canyon as the reference case, Figure 12 shows the temporal variation in UTCI from 7:00 to 20:00 for different asymmetry ratios (by varying Hw/W), under the condition where the aspect ratio He/W equals 1. As shown, the outdoor thermal stress in all cases rises first and then decreases over time. In terms of the UTCImax value, the peak value of approximately 48.4 °C appears at around 15:00 when the asymmetry ratio is 0.5. For asymmetry ratios of 1 and above, the UTCImax value occurs between 13:00 and 14:00, and the peak value gradually decreases with increasing asymmetry ratio. With the He/W ratio fixed at 1, increasing Hw/W yields a substantial improvement in the outdoor thermal environment during the afternoon, while its beneficial effect is relatively limited in the morning. Figure 13 depicts the temporal evolution of UTCI from 7:00 to 20:00 for different asymmetry ratios (by varying He/W), with the aspect ratio Hw/W fixed at 1. For all investigated asymmetry ratios, UTCImax occurs between 13:00 and 14:00. UTCImax exhibits a slight decreasing trend with rising values of He/W, although the magnitude of reduction is negligible. Nevertheless, a gradual increase in He/W considerably improves the outdoor thermal environment during the morning period, even if its ameliorative effect on the thermal environment in the afternoon is relatively limited. By comparing UTCI values at the same time instants, it can be concluded that street canyons with a higher west-side building height exhibit a better overall thermal environment than those with a higher east-side building height.
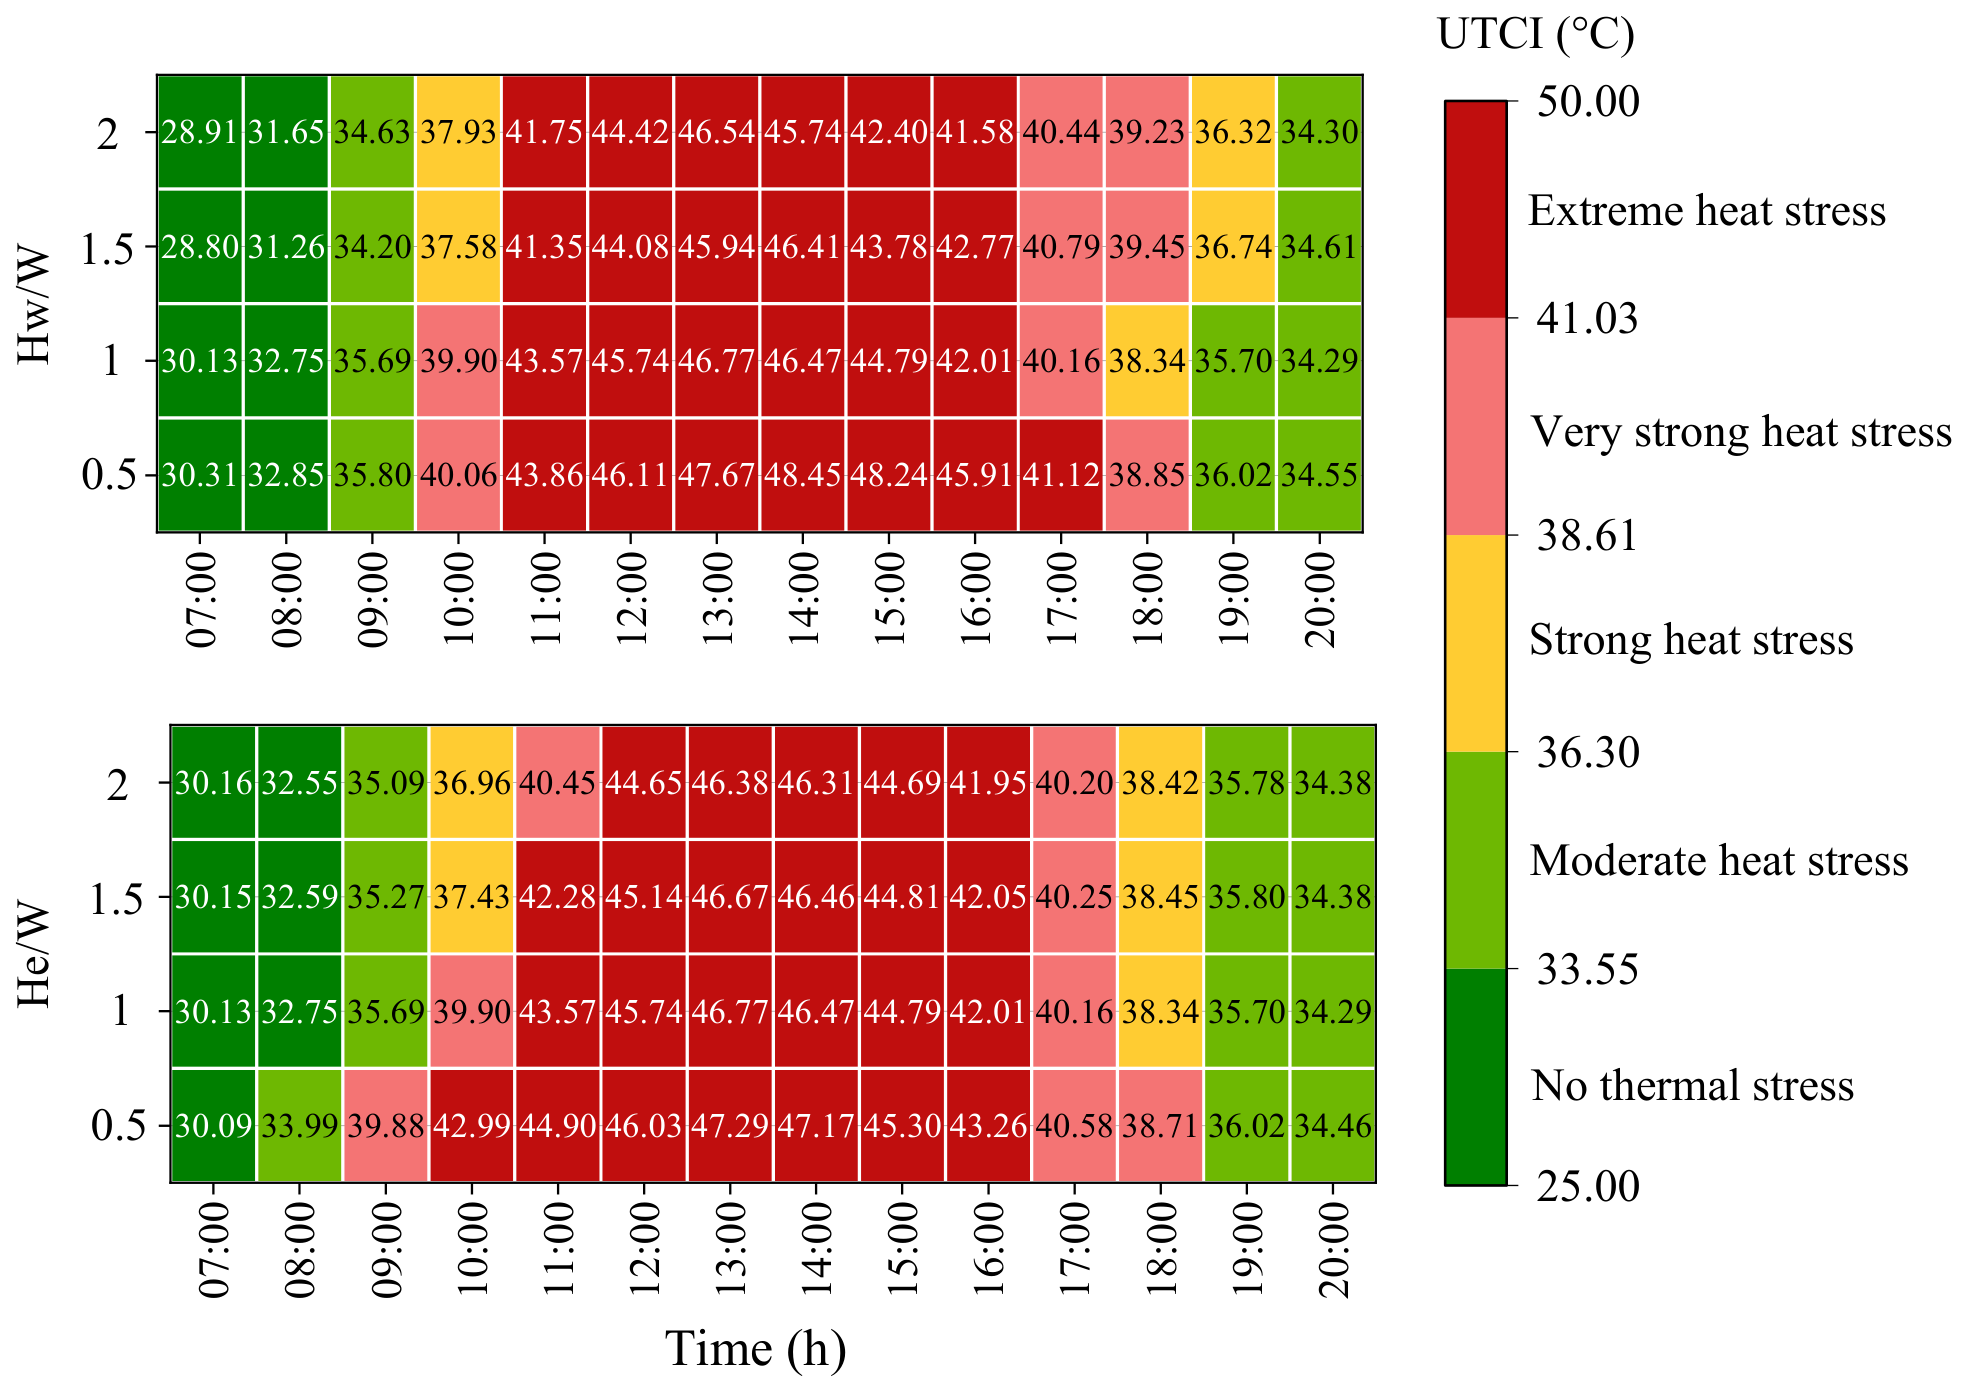
Figure 14 shows the UTCI heatmap distribution across different asymmetric ratios at various times. For the scenario of different asymmetric ratios by varying He/W value, the longest duration of extreme thermal stress (10:00–16:00) is observed at a He/W ratio of 0.5, accounting for approximately 50.0%. The proportion decreases to about 42.9% at ratios of 1 and 1.5, and reaches its minimum of roughly 35.7% at a ratio of 2.0. As the street canyon asymmetry ratio increases, the duration proportion of extreme outdoor thermal stress gradually declines, accompanied by a corresponding extension of comfortable periods in the morning. Regarding the combined duration proportion of no thermal stress and moderate thermal stress, the values are approximately 28.6%, 35.7%, 35.7%, and 35.7% at He/W ratios of 0.5, 1.0, 1.5, and 2.0 respectively, showing little pronounced variation with increasing asymmetry ratio. For the scenario of different asymmetric ratios by varying Hw/W value, the longest duration of extreme thermal stress (11:00–17:00, about 50.0%) also occurs at a Hw/W ratio of 0.5. With further increases in Hw/W, the duration proportion of extreme thermal stress stabilizes at 42.9%, corresponding to the period 11:00–16:00. For the Hw/W ratios of 0.5, 1.0, 1.5, and 2.0, the combined duration proportion of no thermal stress and moderate heat stress is about 35.7%, 35.7%, 28.6%, and 28.6% respectively. Although the overall comfortable duration slightly decreases with Hw/W increasing, the peak intensity of extreme thermal stress is markedly mitigated.
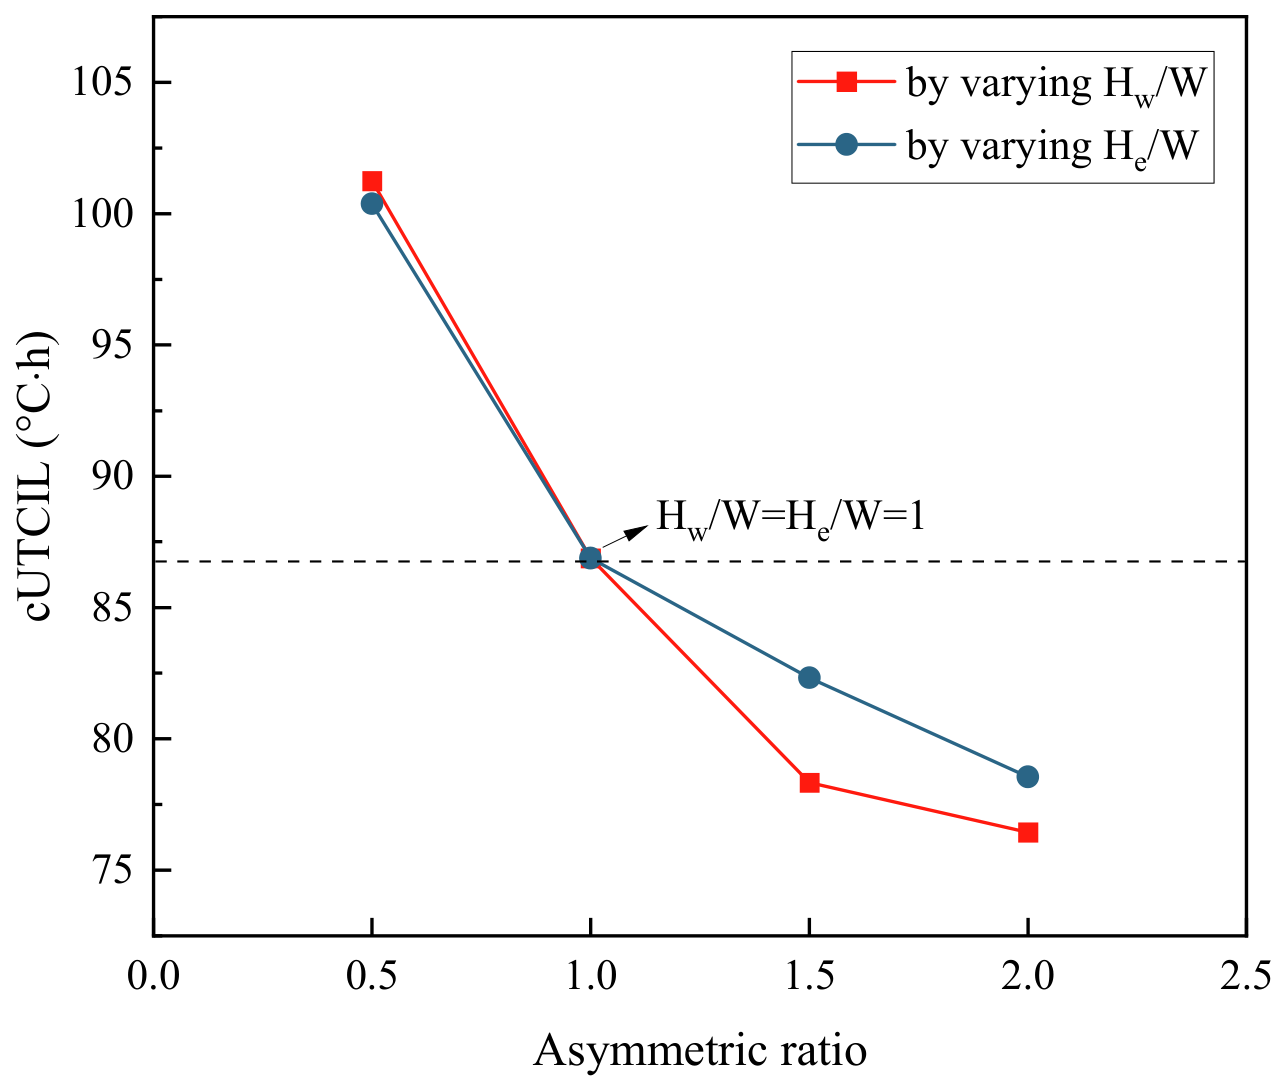
Figure 15 depicts the variation in cUTCIL with the asymmetry ratio for two types of asymmetric street canyons. The results demonstrate that cUTCIL decreases continuously with an increasing asymmetry ratio in both canyon types, indicating that raising the height of buildings on one side can effectively reduce the thermal load within the street canyon. At an asymmetry ratio of 0.5, the cUTCIL value in the canyon with Hw/W > He/W is approximately 100.4 °C·h, which is slightly lower than that in the canyon with Hw/W < He/W (around 101.2 °C·h). When the asymmetry ratio is 1.0, the streets canyon corresponds to the symmetric case (Hw/W = He/W = 1), with the cUTCIL value of roughly 86.7 °C·h. Within the range where the asymmetry ratio is greater than 1.0, the cUTCIL in the canyon with a taller western building is always lower than the cUTCIL in the canyon with a taller eastern building under the same proportion. Therefore, for asymmetric street canyons, increasing the height of west-side buildings yields a better thermal environment improvement than increasing the height of east-side buildings. This may be due to the solar trajectory in the Northern Hemisphere. In the afternoon (13:00–17:00), when solar radiation is most intense and heat stress peaks, the sun is positioned in the western sky. Taller west-side buildings generate extended shading on the canyon floor and eastern facade during this critical period, directly blocking high-angle and low-angle solar radiation. Conversely, taller east-side buildings provide shading primarily in the morning, when thermal stress is less severe, offering limited relief during peak afternoon hours.

3.4. The Effect of Street Trees Leaf Area Index (LAI) on Outdoor Thermal Comfort Level

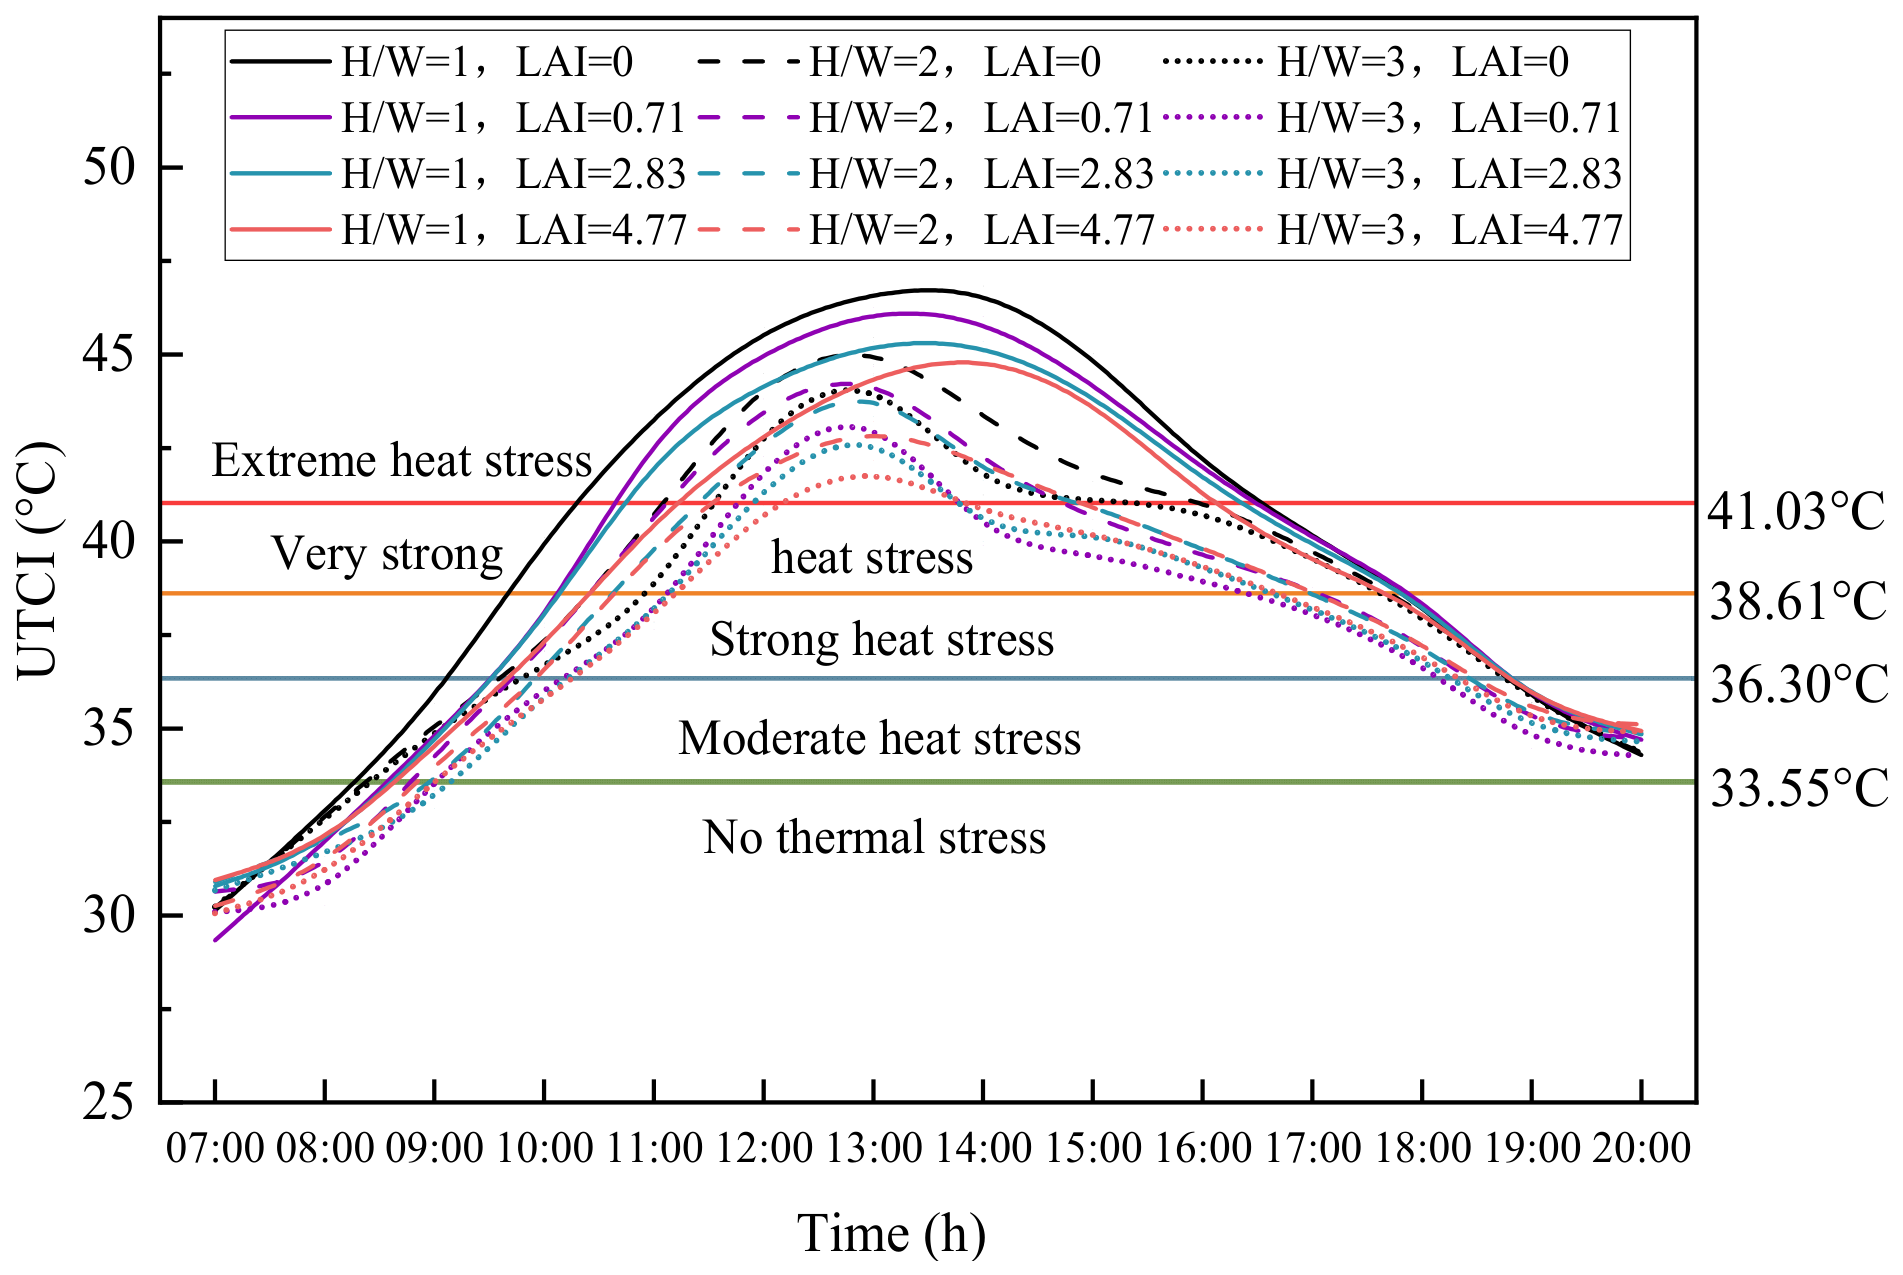
Figure 16 displays the diurnal variation in UTCI in symmetric street canyons under different combinations of street canyon aspect ratio (H/W) and leaf area index (LAI). The results show that UTCI exhibits a unimodal trend of increasing first and then decreasing under all conditions, with the peak value occurring between 13:00 and 14:00. Under the same LAI condition, UTCImax decreases continuously with the increase in H/W, indicating that increasing the street canyon aspect ratio can effectively reduce the heat stress in the street canyon by enhancing building shading. Under the same H/W condition, UTCImax decreases continuously with the increase in LAI, demonstrating that vegetation can improve the thermal environment through the dual effects of transpiration cooling and shading. Taking H/W = 1 as an example, the UTCImax values are approximately 46.5 °C (LAI = 0), 46.0 °C (LAI = 0.71), 45.0 °C (LAI = 2.83) and 44.8 °C (LAI = 4.77), respectively. Street tree with high LAI can reduce the UTCImax by approximately 1.8 °C. The combination of high H/W and high LAI achieves the optimal thermal environment, markedly reducing the intensity of extreme heat stress. For instance, the UTCImax of the condition with H/W = 3 and LAI = 4.77 is approximately 42 °C, which is far lower than that of the condition with low H/W and no vegetation (H/W = 1, LAI = 0).
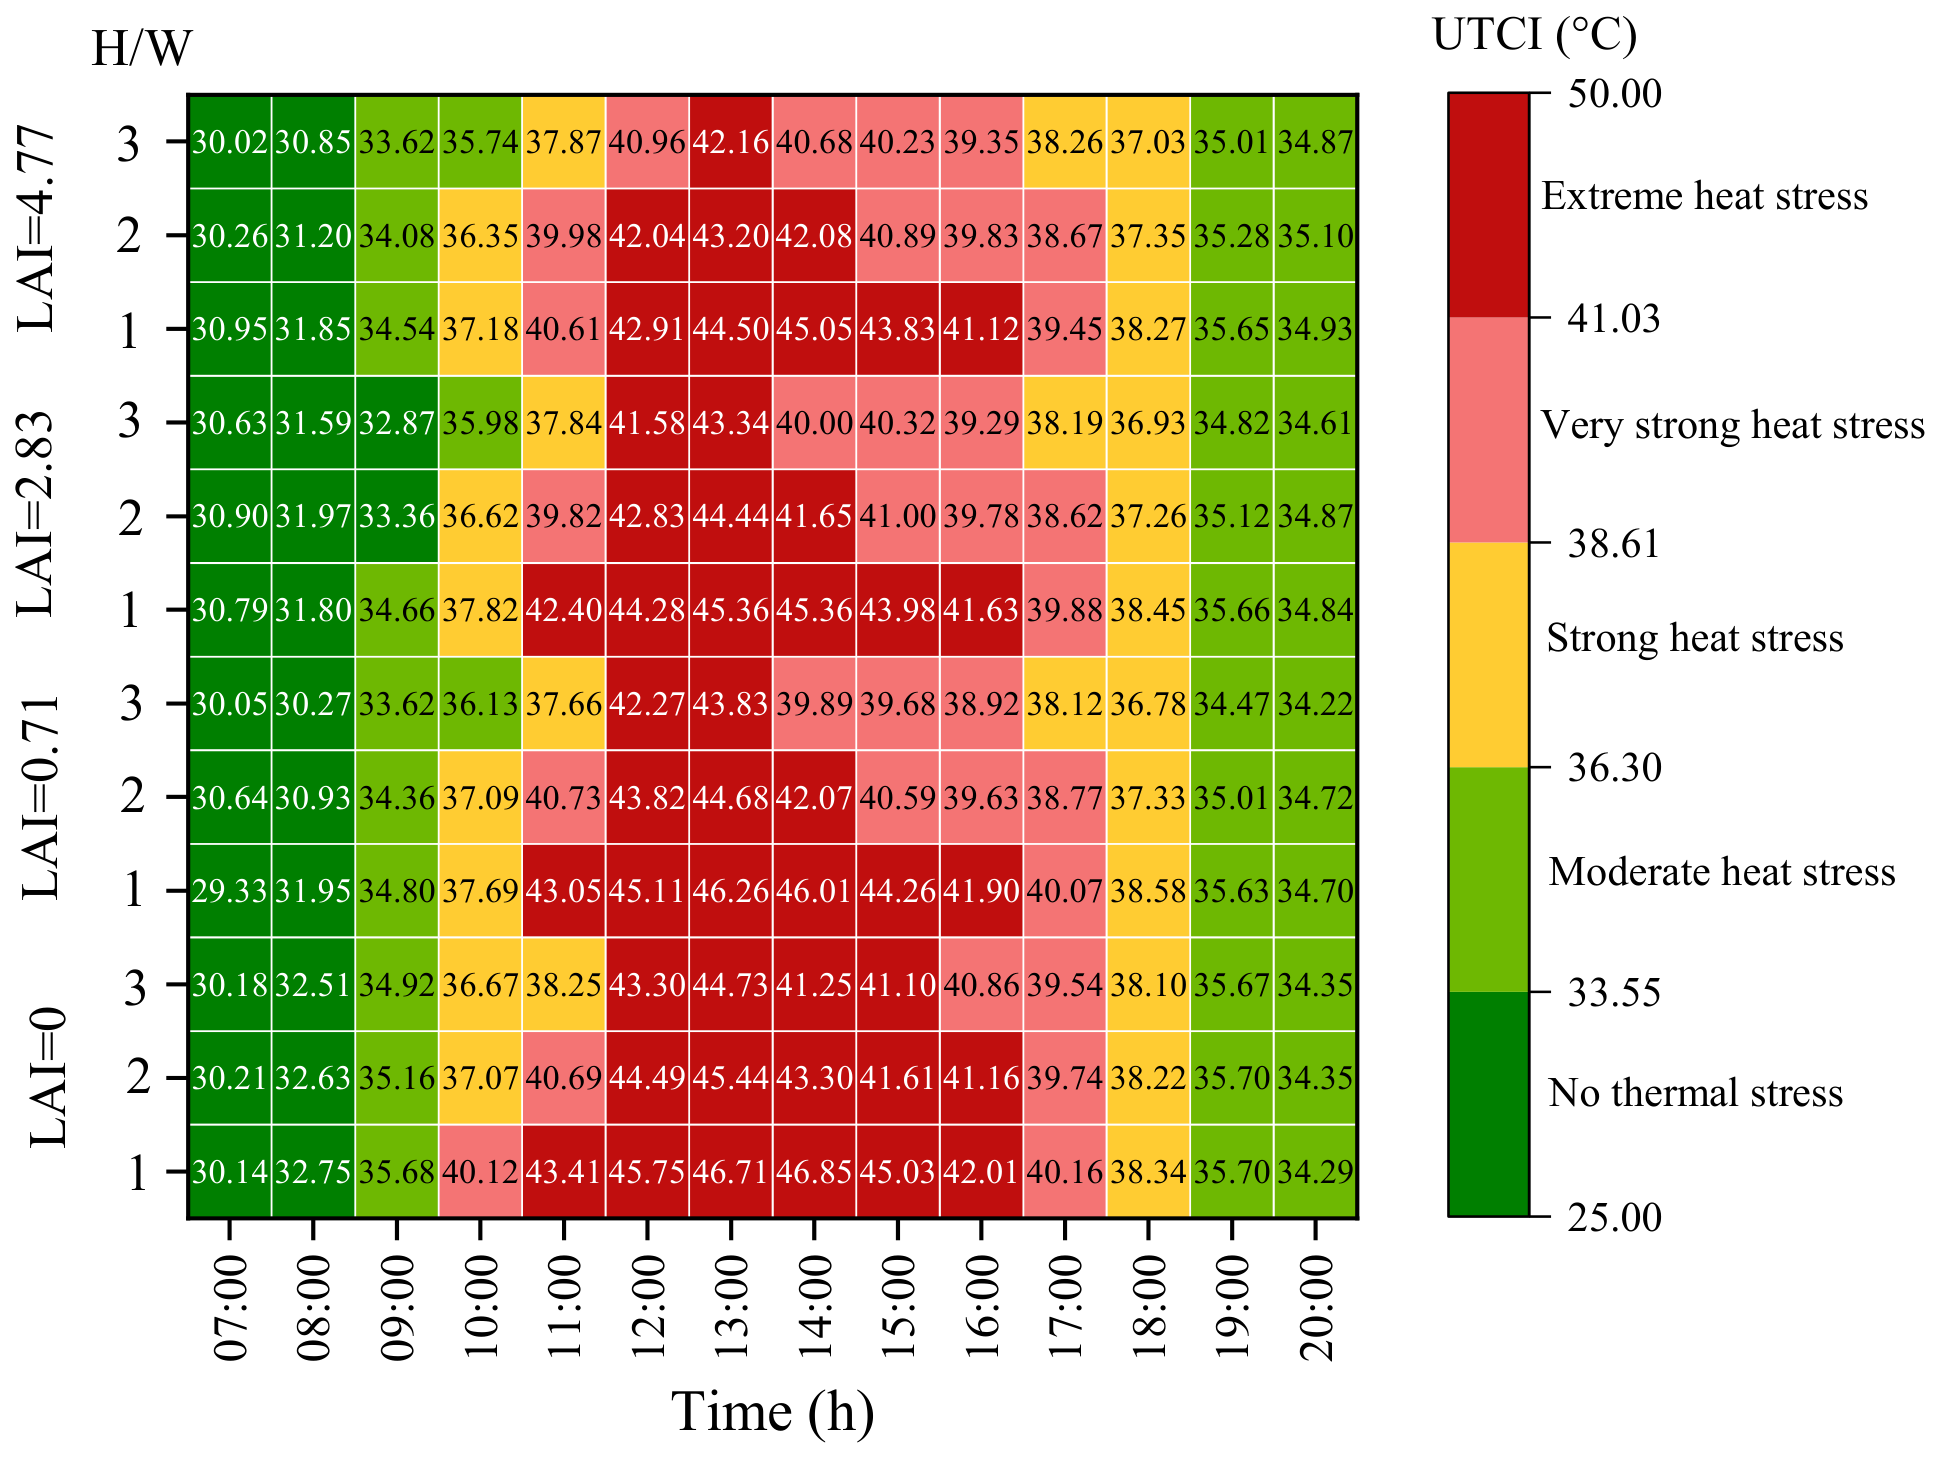
Figure 17 displays the UTCI heatmap distribution across different combinations of H/W and LAI at various times. An analysis of the duration proportion of extreme outdoor thermal stress reveals that, for street canyons with H/W of 1, the longest period of extreme heat stress (11:00–16:00, approximately 42.8%) is recorded at LAI values of 0, 0.71, and 2.83. When LAI reaches 4.77, the duration of extreme heat stress decreases to approximately 35.7%. For street canyons with H/W of 2, the duration proportion of extreme heat stress is approximately 35.7%, 28.6%, 28.6%, and 28.6% at LAI values of 0, 0.71, 2.83, and 4.77, respectively. For canyons with H/W of 3 and the corresponding LAI levels, the duration proportion of extreme heat stress is about 28.6%, 21.4%, 21.4%, and 7.1%, respectively. These findings clearly demonstrate that the duration proportion of extreme heat stress is negatively correlated with both H/W and LAI. Furthermore, enhancing H/W yields a more pronounced reduction in extreme thermal stress duration than enhancing LAI. Except for scenarios with H/W = 3 and LAI values of 0.71, 2.83, and 4.77, the combined duration proportion of no thermal stress and moderate thermal stress outdoors exhibits no substantial variation with H/W and LAI, remaining steady at approximately 35.7% and occurring mainly during 7:00–9:00 and 19:00–20:00. By contrast, the corresponding proportion rises to about 42.9% under the conditions of H/W = 3 and LAI values of 0.71, 2.83, and 4.77.
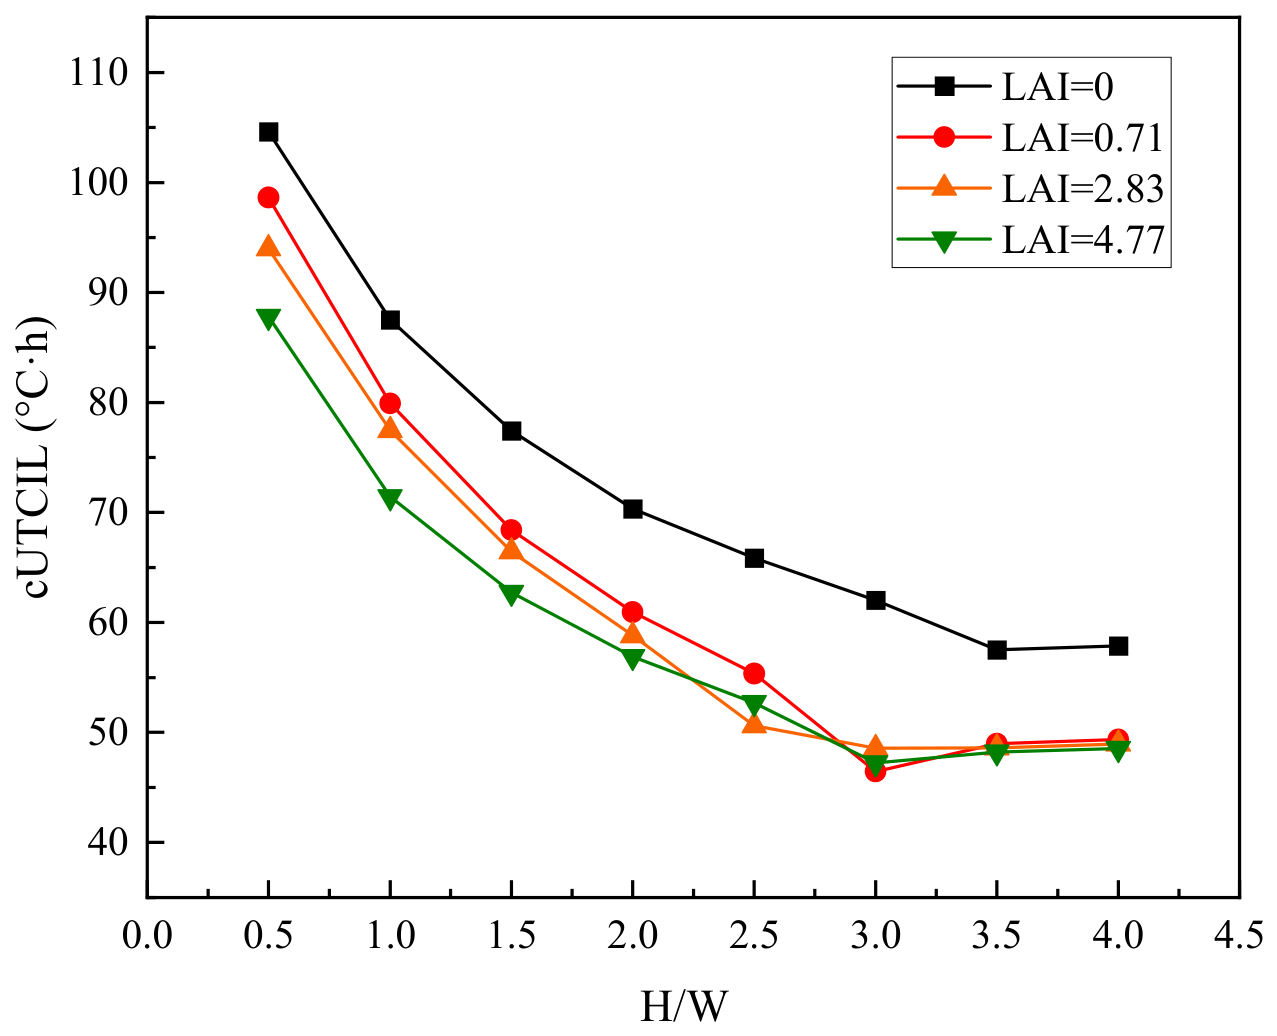
Figure 18 presents the variation in cUTCIL with H/W under different leaf area index conditions. The results show that cUTCIL decreases exponentially with increasing H/W for all LAI levels. For canyons with LAI = 0, cUTCIL reaches its maximum value of approximately 104.6 °C·h at the H/W of 0.5, and tends to stabilize at about 57.5 °C·h when H/W exceeds 3.5. For canyons with LAI values of 0.71, 2.83, and 4.77 respectively, cUTCIL also peaks at H/W of 0.5, with maximum values of approximately 98.6 °C·h, 94.0 °C·h, and 87.8 °C·h in sequence. When H/W exceeds 3, cUTCIL gradually levels off at a stable value of roughly 48.8 °C·h for all these scenarios. It can be concluded that as H/W increases continuously, the improvement effect of high LAI on the outdoor thermal environment becomes gradually insubstantial. This may be because street trees and building geometry both cool the environment primarily through shading. When H/W is low, the canyon receives substantial direct solar radiation, leaving substantial solar radiation available for trees to intercept. Thus, high-LAI trees provide marked cooling effects. However, when H/W is high, the canyon is already deeply shaded by building walls, and the marginal benefit of additional shading from trees diminishes.

3.5. Outdoor Optimal Design Strategy Based on Shading Effects

Climate is the primary factor governing regional outdoor thermal environments and human thermal comfort. The effects of microclimate parameters on outdoor thermal comfort differ significantly under distinct climatic conditions [42]. Although many studies have confirmed that air temperature is the most critical factor influencing outdoor thermal comfort [43,44], it remains challenging to effectively regulate outdoor air temperature through spatial optimization designs. In comparison, shading configurations exert a substantial impact on human thermal comfort levels. Consequently, most existing thermal environment optimization strategies based on street canyon morphology primarily focus on optimizing solar radiation conditions and wind environments [9]. The climate of the Chongqing region is characterized by low annual average wind speed, short sunshine duration in winter, and prolonged hot summers. Therefore, outdoor optimization design strategies based on shading effects can effectively improve the current state of outdoor thermal discomfort during summer.
The orientation of urban blocks directly affects the solar radiation received by block surfaces and facades, with blocks of different orientations experiencing distinct solar radiation conditions at different times [45]. Based on the trajectory of solar movement in the Northern Hemisphere, the interior of north–south (N-S)-oriented blocks is partially shaded, while east–west (E-W)-oriented blocks are fully exposed to sunlight during summer. Therefore, in urban planning and design, it is necessary to consider the impact of block orientation on the outdoor thermal environment. Existing studies have shown that the overall outdoor thermal environment of north–south (N-S)-oriented blocks is generally superior to that of east–west (E-W)-oriented blocks [46]. Through the simulation of outdoor thermal environments under different block orientations in the Chongqing region, the results show that the outdoor thermal environment of blocks with a 30° orientation is optimal in terms of evaluation indicators such as the proportion of duration at the extreme heat stress level, the total proportion of duration at the no thermal stress and moderate heat stress levels, and the cUTCIL value. This is followed by street canyons with a −30° orientation, while the overall thermal comfort level of blocks with a 90° orientation is the worst. Other studies also emphasized that street canyons oriented in the northwest-southeast (NW-SE) direction exhibit superior shading performance and a higher overall outdoor thermal comfort level [47], which is consistent with the findings in this study. Therefore, for new districts in this region, priority can be given to setting the block orientation within the range of −30° to 30° during the design stage.
In addition to the block orientation, increasing the H/W ratio is conducive to improving the outdoor thermal environment and enhancing the outdoor thermal comfort level in summer. For example, in Fuzhou, China [48] and Port Said, Egypt [49], which are located in hot and humid climate zones, as well as in the Ahvaz, Iran [50] and the Saudi Arabian region, which are located in arid-hot region [51], the outdoor thermal comfort level in street canyons with a larger H/W ratio is superior to that in street canyons with a smaller H/W ratio. However, there are certain differences in the optimal H/W ratio among different regions [52]. The results of this study indicate that the overall outdoor thermal comfort level improves substantially with the increase in the H/W ratio, and when the H/W ratio reaches 3.5, the overall outdoor thermal comfort level tends to stabilize. This is attributed to the fact that the street blocks with a higher H/W ratio offer a more favorable shading environment, which can effectively mitigate solar radiation. However, with the gradual increase in the H/W ratio, the solar radiation received tends to stabilize, and consequently, the improvement effect of this process becomes less pronounced. Though the shading benefit of deep canyons is clear from our results, two important boundary conditions should be noted. First, deep canyons are known to trap longwave radiation, potentially intensifying the nocturnal urban heat island effect [53]. This trade-off between daytime cooling and night-time warming should be considered in design practice, particularly for residential areas where night-time comfort matters. Second, shading that is advantageous in summer turns into a drawback in winter. Although access to winter solar radiation is not a primary concern for overcast, rainy Chongqing, it may prove critical in other climatic contexts. Consequently, this recommended H/W ratio is specific to summer conditions and highly dependent on the local context, warranting caution if applied to other regions or seasons.
As an urban spatial form strategy, the asymmetric street canyon can change the entry of solar radiation and air flow by flexibly controlling the height of buildings on both sides of the street, thereby improving the urban microclimate and alleviating the urban heat island effect [29]. The results of this study indicate that for asymmetric street canyons, the overall outdoor thermal comfort level is markedly superior in the blocks where the height of buildings on the west side (Hw) is higher than that on the east side (He). Existing studies have also shown that in asymmetric street canyons, buildings of different heights can enhance air circulation and improve the outdoor thermal environment, and the asymmetric street canyons that can block sunlight in the afternoon have a better effect on improving the thermal environment than those that block sunlight in the morning [54]. Therefore, during the design phase, it is recommended to give priority to increasing the height of buildings on the west side to enhance the shading effect. However, in other climatic regions with abundant winter sunshine, the potential winter penalty of taller west-side buildings, namely the obstruction of desirable solar gain, should be carefully evaluated before applying this design strategy.
By intercepting solar radiation and releasing latent heat via transpiration, street trees can effectively lower air and ground temperatures, thus enhancing outdoor thermal comfort [55,56]. The shape and size of leaves affect the shading effect of street trees and the amount of evaporative heat dissipation, thereby influencing the cooling capacity on the surrounding thermal environment [57]. Through simulations on different leaf area indices of street trees, the study found that with the increase in the H/W, the effect of increasing the leaf area index (LAI) of street trees on improving the outdoor thermal environment and enhancing the thermal comfort level gradually weakens. A study by Morakinyo et al. [58] also suggests that dense-leaved tree species should be configured in blocks with a small H/W ratio, while sparse-leaved tree species should be configured in canyons with a large H/W. Therefore, during the outdoor space design stage, priority should be given to building shading effects. Vegetation should then be strategically configured according to the characteristics of the surrounding buildings to achieve an optimal design for improving the outdoor thermal environment. For instance, high-LAI trees are recommended in canyons with a low H/W, whereas in deep canyons (high H/W), where building shading dominates, vegetation is assigned a secondary role.
To provide a clear and concise overview of the key findings from the four morphological factors investigated, Table 5 summarizes the optimal and worst scenarios for each factor, along with the corresponding UTCImax, cUTCIL, extreme heat stress duration, and the main design implications. This summary is intended to help designers and planners quickly identify the most effective strategies for improving summer outdoor thermal comfort in hot-humid climates.

4. Conclusions

This study addresses a limitation of traditional outdoor thermal comfort evaluation methods, which neglects human thermal adaptation over time. An adaptive evaluation framework is proposed by introducing three indices: UTCIL, cUTCIL, and HSD. Using ENVI-met simulations for a typical hot summer day in Chongqing, a typical city in the hot-humid region, the framework was applied to examine four urban canyon morphological parameters: orientation, aspect ratio (H/W), building asymmetry, and street tree leaf area index (LAI). Meanwhile, by analyzing the differences between measured outdoor thermal environment data and simulation results, the applicability and credibility of the ENVI-met model in reproducing the outdoor thermal environment at the block scale were verified. The adaptive evaluation framework will assist urban designers and planners more effectively design or optimize outdoor thermal environments, thereby improving pedestrian thermal comfort levels. Within the scope of this study, the following relationships are observed:
First, the aspect ratio (H/W) is the primary factor influencing cumulative heat stress. The relationship between H/W and cUTCIL follows an exponential decay pattern. Increasing H/W reduces UTCImax and the duration of extreme heat stress, with diminishing returns beyond H/W = 3.5.
Second, orientation modulates the thermal performance at a given H/W ratio. Under H/W = 1, the east–west oriented canyon shows the highest UTCImax (48.9 °C) and the longest extreme heat stress duration, whereas a 30° clockwise rotation from the north–south axis yields lower thermal stress.
Third, building asymmetry and vegetation provide secondary adjustments. When H/W ≤ 1, increasing LAI reduces UTCImax (by up to 1.8 °C for LAI = 4.77). This reduction is not observed when H/W > 3, where building shading dominates. Asymmetric canyon design, specifically with taller buildings on the west side, shows a reduction in cumulative heat stress compared to symmetric configurations, though the magnitude of this reduction is smaller than that achieved by increasing H/W or adjusting orientation.
Taken together, these findings support a three-step design hierarchy for the simulated hot-summer condition: (1) a sufficient aspect ratio (H/W ≥ 3.5) should be prioritized to maximize building-induced shading; (2) east–west canyon orientation should be avoided; (3) high-LAI street trees and asymmetric canyon profiles should be incorporated when H/W is moderate or low.
Several limitations should be acknowledged. Firstly, the primary focus of this study is the proposal and application of the adaptive thermal comfort evaluation framework. A full factorial interaction analysis among these urban canyon morphology factors was not conducted within the scope of this study and is planned for future research. Secondly, the UTCIL, cUTCIL, and HSD indices are time-dependent, and their values vary with meteorological conditions. The simulations are based on a single typical summer day in Chongqing, representing an extreme heat stress scenario. The quantitative results (including specific H/W thresholds, orientation angles, and LAI values) are therefore specific to the simulated condition. For other weather conditions or climatic contexts, additional simulations and validation are required. Thirdly, model validation was limited to air temperature and relative humidity; mean radiant temperature and wind speed were not validated due to the lack of established acceptance criteria. Within these boundaries, the proposed framework can provide a methodological basis and practical reference for outdoor thermal comfort assessment.

Author Contributions

Conceptualization, T.X. and C.D.; methodology, T.X. and Y.Z.; formal analysis, W.Z.; investigation, Y.Z.; data curation, W.Z. and X.C.; writing—review and editing, T.X. and W.Z.; supervision, T.X. and C.D. All authors have read and agreed to the published version of the manuscript.

Funding

This research was funded by the Natural Science Foundation of Shandong Province (grant number ZR2025QC1151) and the National Key Research and Development Program of China (grant number 2024YFE0106800).

Data Availability Statement

The data presented in this study are available on request from the corresponding author.

Conflicts of Interest

Author Yuening Zhu was employed by the company Zhejiang Leapmotor Technology Co., Ltd. The remaining authors declare that the research was conducted in the absence of any commercial or financial relationships that could be construed as a potential conflict of interest.

References

  1. Kim, E.S.; Bae, C.; Ko, S.Y.; Won, J.E.; Lee, J.H.; Paio, Y.; Lee, D.K. Enhancing the effectiveness of heat adaptation strategies through citizen science-based outdoor thermal comfort. Heliyon 2024, 10, e39413. [Google Scholar] [CrossRef] [Scilit]
  2. Lam, C.K.C.; Hang, J.; Zhang, D.; Wang, Q.; Ren, M.; Huang, C. Effects of short-term physiological and psychological adaptation on summer thermal comfort of outdoor exercising people in China. Build. Environ. 2021, 198, 107877. [Google Scholar] [CrossRef] [Scilit]
  3. Gai, Z.; Yin, H.; Kong, F.; Su, J.; Shen, Z.; Sun, H.; Yang, S.; Liu, H.; Middel, A. How does shade infrastructure affect outdoor thermal comfort during hot, humid summers? Evidence from Nanjing, China. Build. Environ. 2025, 267, 112320. [Google Scholar] [CrossRef] [Scilit]
  4. Dashti, A.; Mohammadsharifi, N.; Shokuhi, M.; Matzarakis, A. A comprehensive study on wintertime outdoor thermal comfort of blue-green infrastructure in an arid climate: A case of Isfahan, Iran. Sustain. Cities Soc. 2024, 113, 105658. [Google Scholar] [CrossRef] [Scilit]
  5. Cui, Y.; Yin, M.; Cheng, X.; Tang, J.; He, B.-J. Towards cool cities and communities: Preparing for an increasingly hot future by the development of heat-resilient infrastructure and urban heat management plan. Environ. Technol. Innov. 2024, 34, 103568. [Google Scholar] [CrossRef] [Scilit]
  6. Elkhayat, K.; Hassan Abdelhafez, M.H.; Altaf, F.; Sharples, S.; Alshenaifi, M.A.; Alfraidi, S.; Aldersoni, A.; Albaqawy, G.; Ragab, A. Urban geometry as a climate adaptation strategy for enhancing outdoor thermal comfort in a hot desert climate. Front. Archit. Res. 2025, 14, 525–544. [Google Scholar] [CrossRef] [Scilit]
  7. Lai, D.; Liu, W.; Gan, T.; Liu, K.; Chen, Q. A review of mitigating strategies to improve the thermal environment and thermal comfort in urban outdoor spaces. Sci. Total Environ. 2019, 661, 337–353. [Google Scholar] [CrossRef] [Scilit]
  8. Xu, T.; Yao, R.; Du, C.; Li, B. Outdoor thermal perception and heatwave adaptation effects in summer—A case study of a humid subtropical city in China. Urban Clim. 2023, 52, 101724. [Google Scholar] [CrossRef] [Scilit]
  9. Lai, D.; Lian, Z.; Liu, W.; Guo, C.; Liu, W.; Liu, K.; Chen, Q. A comprehensive review of thermal comfort studies in urban open spaces. Sci. Total Environ. 2020, 742, 140092. [Google Scholar] [CrossRef] [Scilit]
  10. Middel, A.; Krayenhoff, E.S. Micrometeorological determinants of pedestrian thermal exposure during record-breaking heat in Tempe, Arizona: Introducing the MaRTy observational platform. Sci. Total Environ. 2019, 687, 137–151. [Google Scholar] [CrossRef] [Scilit]
  11. Lam, C.K.C.; Weng, J.; Liu, K.; Hang, J. The effects of shading devices on outdoor thermal and visual comfort in Southern China during summer. Build. Environ. 2023, 228, 109743. [Google Scholar] [CrossRef] [Scilit]
  12. Xu, M.; Hong, B.; Jiang, R.; An, L.; Zhang, T. Outdoor thermal comfort of shaded spaces in an urban park in the cold region of China. Build. Environ. 2019, 155, 408–420. [Google Scholar] [CrossRef] [Scilit]
  13. Watanabe, S.; Nagano, K.; Ishii, J.; Horikoshi, T. Evaluation of outdoor thermal comfort in sunlight, building shade, and pergola shade during summer in a humid subtropical region. Build. Environ. 2014, 82, 556–565. [Google Scholar] [CrossRef] [Scilit]
  14. Lai, D.; Liu, Y.; Liao, M.; Yu, B. Effects of different tree layouts on outdoor thermal comfort of green space in summer Shanghai. Urban Clim. 2023, 47, 101398. [Google Scholar] [CrossRef] [Scilit]
  15. Lopez-Cabeza, V.P.; Loor-Vera, M.J.; Diz-Mellado, E.; Rivera-Gomez, C.; Galan-Marin, C. Decoding outdoor thermal comfort: The role of location in urban canyon microclimate. Sustain. Energy Technol. Assess. 2024, 72, 104095. [Google Scholar] [CrossRef] [Scilit]
  16. Nicholson, S.; Nikolopoulou, M.; Watkins, R.; Löve, M.; Ratti, C. Data driven design for urban street shading: Validation and application of ladybug tools as a design tool for outdoor thermal comfort. Urban Clim. 2024, 56, 102041. [Google Scholar] [CrossRef] [Scilit]
  17. Zhang, T.; Fu, X.; Qi, F.; Shen, Y.; Xu, P.; Tao, Y.; Liu, T.; Song, Y. Optimizing pedestrian thermal comfort in urban street canyons for summer and winter: Tree planting or low-albedo pavements? Sustain. Cities Soc. 2025, 120, 106143. [Google Scholar] [CrossRef] [Scilit]
  18. Yao, R.; Zhang, S.; Du, C.; Schweiker, M.; Hodder, S.; Olesen, B.W.; Toftum, J.; Romana d’Ambrosio, F.; Gebhardt, H.; Zhou, S.; et al. Evolution and performance analysis of adaptive thermal comfort models—A comprehensive literature review. Build. Environ. 2022, 217, 109020. [Google Scholar] [CrossRef] [Scilit]
  19. Potchter, O.; Cohen, P.; Lin, T.-P.; Matzarakis, A. A systematic review advocating a framework and benchmarks for assessing outdoor human thermal perception. Sci. Total Environ. 2022, 833, 155128. [Google Scholar] [CrossRef] [Scilit]
  20. Xu, T.; Yao, R.; Du, C.; Li, B.; Fang, F. A quantitative evaluation model of outdoor dynamic thermal comfort and adaptation: A year-long longitudinal field study. Build. Environ. 2023, 237, 110308. [Google Scholar] [CrossRef] [Scilit]
  21. Zhang, H.; Wang, Y.; Chen, B.; Bai, J.; Zhao, J.; Guo, F.; Zhu, P. Analyzing spatial disparities in thermal comfort in a coastal city: A multi-parameter comparative study based on local climate zones. Sustain. Cities Soc. 2026, 136, 107031. [Google Scholar] [CrossRef] [Scilit]
  22. Qin, H.; Ma, Y.; Niu, J.; Huo, J.; Wei, X.; Yan, J.; Han, G. Investigating differences of outdoor thermal comfort for the elderly among genders across seasons: A case study in Chongqing, China. Urban Clim. 2025, 61, 102398. [Google Scholar] [CrossRef] [Scilit]
  23. ASHRAE Standard 55; Thermal Environmental Conditions for Human Occupancy. ASHRAE: Atlanta, GA, USA, 2020.
  24. ISO 7726; Ergonomics of the Thermal Environment—Instruments for Measuring Physical Quantities. International Organization for Standardization (ISO): Geneva, Switzerland, 1998.
  25. Xu, T.; Yao, R.; Du, C.; Huang, X. A method of predicting the dynamic thermal sensation under varying outdoor heat stress conditions in summer. Build. Environ. 2022, 223, 109454. [Google Scholar] [CrossRef] [Scilit]
  26. Huang, B.; Hong, B.; Tian, Y.; Yuan, T.; Su, M. Outdoor thermal benchmarks and thermal safety for children: A study in China’s cold region. Sci. Total Environ. 2021, 787, 147603. [Google Scholar] [CrossRef] [Scilit]
  27. Elnabawi, M.H.; Hamza, N.; Ahmed, T.M.F.; Santamouris, M. Integrated passive cooling strategies for neighborhood-scale urban heat mitigation in a hot-arid city: ENVI-met simulations in Al Ain, UAE. Results Eng. 2026, 29, 109840. [Google Scholar] [CrossRef] [Scilit]
  28. Salal Rajan, E.H.; Amirtham, L.R. Impact of building regulations on the perceived outdoor thermal comfort in the mixed-use neighbourhood of Chennai. Front. Arch. Res. 2021, 10, 148–163. [Google Scholar] [CrossRef] [Scilit]
  29. Qaid, A.; Ossen, D.R. Effect of asymmetrical street aspect ratios on microclimates in hot, humid regions. Int. J. Biometeorol. 2015, 59, 657–677. [Google Scholar] [CrossRef] [Scilit] [PubMed]
  30. Shi, D.; Song, J.; Huang, J.; Zhuang, C.; Guo, R.; Gao, Y. Synergistic cooling effects (SCEs) of urban green-blue spaces on local thermal environment: A case study in Chongqing, China. Sustain. Cities Soc. 2020, 55, 102065. [Google Scholar] [CrossRef] [Scilit]
  31. CJJ 75-97; Code for Planning and Design of Urban Road Greening. China Academy of Urban Planning and Design: Beijing, China, 2014.
  32. Gregorčič, T.; Ogrin, M.; Repe, B.; Savić, S. Combining interdisciplinary field measurements and ENVI-met simulations for comparative assessment of outdoor human thermal comfort across local climate zones. Sustain. Cities Soc. 2026, 142, 107304. [Google Scholar] [CrossRef] [Scilit]
  33. Haeri, T.; Hassan, N.; Ghaffarianhoseini, A. Evaluation of microclimate mitigation strategies in a heterogenous street canyon in Kuala Lumpur from outdoor thermal comfort perspective using Envi-met. Urban Clim. 2023, 52, 101719. [Google Scholar] [CrossRef] [Scilit]
  34. López-Cabeza, V.P.; Galán-Marín, C.; Rivera-Gómez, C.; Roa-Fernández, J. Courtyard microclimate ENVI-met outputs deviation from the experimental data. Build. Environ. 2018, 144, 129–141. [Google Scholar] [CrossRef] [Scilit]
  35. Bröde, P.; Fiala, D.; Błażejczyk, K.; Holmér, I.; Jendritzky, G.; Kampmann, B.; Tinz, B.; Havenith, G. Deriving the operational procedure for the Universal Thermal Climate Index (UTCI). Int. J. Biometeorol. 2012, 56, 481–494. [Google Scholar] [CrossRef] [Scilit]
  36. Thapa, S.; Rijal, H.B.; Zaki, S.A. District-wise evaluation of meteorological factors and outdoor thermal comfort in India using UTCI—Insight into future climatic scenario. Sustain. Cities Soc. 2024, 116, 105840. [Google Scholar] [CrossRef] [Scilit]
  37. Fiala, D.; Havenith, G.; Bröde, P.; Kampmann, B.; Jendritzky, G. UTCI-Fiala multi-node model of human heat transfer and temperature regulation. Int. J. Biometeorol. 2012, 56, 429–441. [Google Scholar] [CrossRef] [Scilit]
  38. Yang, D.; Xiong, J.; Liu, W. Adjustments of the adaptive thermal comfort model based on the running mean outdoor temperature for Chinese people: A case study in Changsha China. Build. Environ. 2017, 114, 357–365. [Google Scholar] [CrossRef] [Scilit]
  39. Carlucci, S.; Bai, L.; Dear, R.D.; Yang, L. Review of adaptive thermal comfort models in built environmental regulatory documents. Build. Environ. 2018, 137, 73–89. [Google Scholar] [CrossRef] [Scilit]
  40. GB/T 50785; Evaluation Standard for Indoor Thermal Environment in Civil Buildings. Ministry of Housing and Urban-Rural Development (MOHURD): Beijing, China, 2012.
  41. Pantavou, K.; Theoharatos, G.; Santamouris, M.; Asimakopoulos, D. Outdoor thermal sensation of pedestrians in a Mediterranean climate and a comparison with UTCI. Build. Environ. 2013, 66, 82–95. [Google Scholar] [CrossRef] [Scilit]
  42. Feng, X.; Zheng, Z.; Yang, Y.; Fang, Z. Quantitative seasonal outdoor thermal sensitivity in Guangzhou, China. Urban Clim. 2021, 39, 100938. [Google Scholar] [CrossRef] [Scilit]
  43. Tian, Y.; Hong, B.; Zhang, Z.; Wu, S.; Yuan, T. Factors influencing resident and tourist outdoor thermal comfort: A comparative study in China’s cold region. Sci. Total Environ. 2022, 808, 152079. [Google Scholar] [CrossRef] [Scilit] [PubMed]
  44. Xie, Y.; Wang, X.; Wen, J.; Geng, Y.; Yan, L.; Liu, S.; Zhang, D.; Lin, B. Experimental study and theoretical discussion of dynamic outdoor thermal comfort in walking spaces: Effect of short-term thermal history. Build. Environ. 2022, 216, 109039. [Google Scholar] [CrossRef] [Scilit]
  45. Jamei, E.; Rajagopalan, P.; Seyedmahmoudian, M.; Jamei, Y. Review on the impact of urban geometry and pedestrian level greening on outdoor thermal comfort. Renew. Sustain. Energy Rev. 2016, 54, 1002–1017. [Google Scholar] [CrossRef] [Scilit]
  46. Achour-Younsi, S.; Kharrat, F. Outdoor thermal comfort: Impact of the Geometry of an urban street canyon in a Mediterranean Subtropical Climate—Case Study Tunis, Tunisia. Procedia-Soc. Behav. Sci. 2016, 216, 689–700. [Google Scholar] [CrossRef] [Scilit]
  47. Zhang, Y.; Du, X.; Shi, Y. Effects of street canyon design on pedestrian thermal comfort in the hot-humid area of China. Int. J. Biometeorol. 2017, 61, 1421–1432. [Google Scholar] [CrossRef] [Scilit]
  48. Lai, B.; Fu, J.-M.; Guo, C.-K.; Zhang, D.-Y.; Wu, Z.-G. Street Geometry Factors Influencing Outdoor Pedestrian Thermal Comfort in a Historic District. Buildings 2025, 15, 613. [Google Scholar] [CrossRef] [Scilit]
  49. Abd Elraouf, R.; Elmokadem, A.; Megahed, N.; Abo Eleinen, O.; Eltarabily, S. The impact of urban geometry on outdoor thermal comfort in a hot-humid climate. Build. Environ. 2022, 225, 109632. [Google Scholar] [CrossRef] [Scilit]
  50. Nasrollahi, N.; Namazi, Y.; Taleghani, M. The effect of urban shading and canyon geometry on outdoor thermal comfort in hot climates: A case study of Ahvaz, Iran. Sustain. Cities Soc. 2021, 65, 102638. [Google Scholar] [CrossRef] [Scilit]
  51. Bakarman, M.A.; Chang, J.D. The influence of height/width ratio on urban heat island in Hot-arid Climates. Procedia Eng. 2015, 118, 101–108. [Google Scholar] [CrossRef] [Scilit]
  52. Sanagar Darbani, E.; Sharifi, E.; Soebarto, V. Investigating the effect of emissivity of fully glazed façade on outdoor thermal comfort in low to high urban canyon ratios. Sustain. Cities Soc. 2026, 143, 107337. [Google Scholar] [CrossRef] [Scilit]
  53. Khalvandi, R.; Karimimoshaver, M. Urban street canyons and heat islands: A systematic review on morphological solutions. Results Eng. 2025, 27, 106542. [Google Scholar] [CrossRef] [Scilit]
  54. Emmanuel, R.; Rosenlund, H.; Johansson, E. Urban shading—A design option for the tropics? A study in Colombo, Sri Lanka. Int. J. Climatol. 2010, 27, 1995–2004. [Google Scholar] [CrossRef] [Scilit]
  55. Li, X.; Wang, B.; Yang, Y.; Yang, Y.; Yu, T.; Pei, K.; Zhong, Y.; Xie, Y. How street tree structure modulates thermal comfort during urban heat extremes: Evidence from LiDAR and micrometeorological data. Urban For. Urban Green. 2026, 118, 129309. [Google Scholar] [CrossRef] [Scilit]
  56. Che, W.; Zhuang, W. Integrated vegetation effects on thermal environment and air quality in urban street canyons. Urban Clim. 2025, 63, 102593. [Google Scholar] [CrossRef] [Scilit]
  57. Hami, A.; Abdi, B.; Zarehaghi, D.; Maulan, S.B. Assessing the thermal comfort effects of green spaces: A systematic review of methods, parameters, and plants’ attributes. Sustain. Cities Soc. 2019, 49, 101634. [Google Scholar] [CrossRef] [Scilit]
  58. Morakinyo, T.E.; Kong, L.; Lau, K.K.-L.; Yuan, C.; Ng, E. A study on the impact of shadow-cast and tree species on in-canyon and neighborhood’s thermal comfort. Build. Environ. 2017, 115, 1–17. [Google Scholar] [CrossRef] [Scilit]
Figure 1. Field survey location and measurement sites.
Buildings 16 02399 g001
Figure 2. Typical scenarios of urban canyon morphology. (a) street canyon orientation scenarios; (b) H/W scenarios; (c) asymmetric street canyons scenarios; (d) LAI scenarios with different street trees;
Buildings 16 02399 g002
Figure 3. Layout and sky view factor of the monitoring points.
Buildings 16 02399 g003
Figure 4. Comparison of simulated and measured meteorological parameters at different points.
Buildings 16 02399 g004
Figure 5. The variation in temperature critical values of different outdoor thermal stress levels with MeanTrm.
Buildings 16 02399 g005
Figure 6. UTCI variation with time within typical street canyons (H/W = 1) under different orientations.
Buildings 16 02399 g006
Figure 7. UTCI heatmap distribution across different orientations at various times.
Buildings 16 02399 g007
Figure 8. Variation in cUTCIL along with the orientation in typical street canyons (H/W = 1).
Buildings 16 02399 g008
Figure 9. Variation in UTCI values in street canyons with different aspect ratios over time.
Buildings 16 02399 g009
Figure 10. UTCI heatmap distribution across different H/W at various times.
Buildings 16 02399 g010
Figure 11. Variation in cUTCIL in street canyon with the increase in aspect ratios.
Buildings 16 02399 g011
Figure 12. The variation in UTCI in street canyon (He/W = 1) with time under different asymmetric ratios.
Buildings 16 02399 g012
Figure 13. The variation in UTCI in street canyon (Hw/W = 1) with time under different asymmetric ratios.
Buildings 16 02399 g013
Figure 14. UTCI heatmap distribution across different asymmetric ratios at various times.
Buildings 16 02399 g014
Figure 15. Variation in cUTCIL with asymmetric ratios of street canyon.
Buildings 16 02399 g015
Figure 16. Variation in UTCI with time under different combinations of H/W and LAI.
Buildings 16 02399 g016
Figure 17. UTCI heatmap distribution across different combinations of H/W and LAI at various times.
Buildings 16 02399 g017
Figure 18. Variation in cUTCIL with H/W under different leaf area indices.
Buildings 16 02399 g018
Table 1. Specifications of meteorological monitoring instruments.
ParameterInstrumentsAccuracyRangeResolution
TaOnset Hobo, UX100-011A±0.2 °C−20–70 °C0.1 °C
RHOnset Hobo, UX100-011A±2.0%1–95% RH0.1% RH
vWWFWZY-15% ± 0.05 m/s0.05–30 m/s0.1 m/s
TgHQZY-1±0.3 °C−20–80 °C0.1 °C
Table 2. Initial parameter settings.
Parameter NamesParameter Values
Start time7:00 a.m. on 30 July 2021
Simulation duration14 h
Average temperature36.04
Maximum temperature39.80 °C
Minimum temperature29.00 °C
Average relative humidity54.59%
Maximum relative humidity80.16%
Minimum relative humidity41.87%
10 m wind speed1.7 m/s
Dominant wind directionSouth wind
Roughness length0.1
Cloud cover0
Table 3. RMSE and MAPE calculation results.
PointAir Temperature (°C)Relative Humidity (%)
RMSEMAPERMSEMAPE
10.972.162.653.26
22.416.324.576.42
31.473.892.062.80
Table 4. The comparison of the original UTCI classes and modified UTCI classes.
Stress Category Original UTCI (°C) [41] Modified UTCI (°C)
No thermal stress9–26 °C<33.55 °C
Moderate heat stress26–32 °C33.55–36.30 °C
Strong heat stress32–38 °C36.30–38.61 °C
Very strong heat stress38–46 °C38.61–41.03 °C
Extreme heat stress>46 °C>41.03 °C
Table 5. Summary of optimal and worst scenarios for each urban canyon morphological factor.
FactorScenarioUTCImax (°C)cUTCIL (°C·h)Extreme Heat Stress Duration
OrientationOptimal (30°)about 45.3 °Cabout 69.4 °C·habout 35.7%
Worst (90°)about 48.9 °Cabout 115.2 °C·habout 64.3%
Key Design Implication: Prioritize orientation within −30° to 30° from N–S axis
H/WOptimal (≥3.5)about 43.5 °Cabout 57.5 °C·habout 14.3%
Worst (0.5)about 47.6 °Cabout 104.6 °C·habout 50.0%
Key Design Implication: Design H/W ≥ 3.5 to stabilize thermal comfort benefits
AsymmetryOptimal (taller west) 1about 46.4 °Cabout 78.3 °C·habout 42.9%
Worst (taller east) 1about 46.6 °Cabout 82.3 °C·habout 42.9%
Key Design Implication: Prioritize increasing west-side building height for afternoon shading
LAIOptimal (4.77) 2about 44.8 °Cabout 87.8 °C·habout 35.7%
Worst (0) 2about 46.5 °Cabout 104.6 °C·habout 42.8%
Key Design Implication: Prioritize dense-canopy trees in shallow canyons (H/W < 3); building shading dominates at deep H/W (H/W ≥ 3)
Notes: 1 refers to the scenario where the asymmetry ratio is 1.5, at which point the cUTCIL difference is the greatest; 2 refers to the typical scenario under the condition of H/W = 1.
Disclaimer/Publisher’s Note: The statements, opinions and data contained in all publications are solely those of the individual author(s) and contributor(s) and not of MDPI and/or the editor(s). MDPI and/or the editor(s) disclaim responsibility for any injury to people or property resulting from any ideas, methods, instructions or products referred to in the content.