Article

Modified Strut-and-Tie Model for RC Deep Beams Considering Size Effect and Longitudinal Reinforcement

1
College of Water Conservancy Engineering, Yellow River Conservancy Technical University, Kaifeng 475004, China
2
College of Water Conservancy, North China University of Water Resources and Electric Power, Zhengzhou 450045, China
*
Author to whom correspondence should be addressed.
Buildings 2026, 16(11), 2258; https://doi.org/10.3390/buildings16112258
Submission received: 14 April 2026 / Revised: 24 May 2026 / Accepted: 26 May 2026 / Published: 3 June 2026
(This article belongs to the Section Building Structures)

Abstract

Accurate prediction of the shear capacity of reinforced concrete (RC) deep beams remains challenging due to the complex interaction of multiple load transfer mechanisms and the pronounced size effect in quasi-brittle materials. Existing strut-and-tie-based models are widely used in practice; however, they often neglect the coupled influence of structural size and longitudinal reinforcement, leading to reduced reliability for large-scale members. In this study, a modified simplified strut-and-tie model (M-SSSTM) is proposed in order to achieve a fracture mechanics-inspired empirical enhancement in shear strength prediction; in the model, a size effect coefficient and a reinforcement-related term accounting for dowel action are explicitly incorporated. The size effect coefficient is calibrated using an extensive database comprising 572 test results collected from the literature, ensuring that the formulation captures the general trend of size-dependent behavior. To verify the predictive capability of the proposed model, nine RC deep-beam specimens were tested, and the comparison between predicted and measured results demonstrates improved accuracy and reduced scatter relative to existing methods. The results indicate that incorporating the coupled effects of size and longitudinal reinforcement is essential to rational shear design, and the proposed model provides a robust and practical tool for the analysis and design of RC deep beams, particularly for large-scale structures.

1. Introduction

According to the stress characteristics of the cross-sections, reinforced-concrete components can be divided into a B-zone and a D-zone. The B-zone refers to the structural area where the cross-sectional strain distribution basically obeys the plane hypothesis, which enables it to smoothly tackle its stress problem. The D-zone refers to the structural area where the cross-sectional strain distribution is obviously nonlinear, with the characteristics of force flow under disturbance. The plane hypothesis is no longer tenable in these areas from the elastic stage, which complicates stress calculations in the D-zone.
The shear of the inclined cross-section of a deep beam is associated with typical D-zone stress, for which the most broadly used calculation model is the strut-and-tie model developed on the basis of trusses. This is a D-zone truss model idealized from the elastic principal stress trajectories of a solid structure. The model consists of ties and struts intersecting at the node, which are able to transfer the load to the pedestal or adjacent B-zone. The force transmission path fits well the solid structure, and its mechanical concept is quite clear. At present, American ACI 318-19, European EC2 and Canadian CSA A23.3-19 codes [1,2,3] have already introduced the strut-and-tie model into the shear design of the deep-beam D-zone. However, Wu [4] and other scholars’ research showed that the conventional strut-and-tie model may sometimes overestimate the shear bearing capacity for large-scale full-size deep beams, which could potentially reduce the structural safety margin.
The size effect is pervasive in reinforced-concrete structures [5,6], since it is jointly affected by material properties, geometric dimensions, boundary conditions, loading methods, loading rates and other factors. In 1967, Kani [7] proved the existence of a “size effect” through substantial tests, showing that the nominal shear strength of reinforced-concrete beams without web reinforcement decreases with the increase in the effective cross-section height of the component. Subsequently, Walraven et al. [8], Tan et al. [9,10], Matsuo et al. [11], Zhang et al. [12], Birrcher [13] and other scholars researched the influence of size effect on the shear behavior of deep beams, finding that with the increase in cross-section size, the component’s nominal ultimate load decreases significantly, which indicates a significant size effect. Deep-beam components have a small ratio of span to height, a large-sized cross-section and a significant size effect, but conventional strut-and-tie approaches often face challenges in fully and explicitly capturing the pronounced size effect in such components. Scholars from different countries have sequentially based novel models on the strut-and-tie model, such as the models proposed by Tan-Tan [14] and Tan-Cheng [15], in addition to fracture zone theory and other models [16]. The majority of these typical calculation models and design methods were proposed according to the shear test results of a scaled model in the laboratory environment used to predict the shear behaviors of full-scale specimens, and their safety and applicability both need to be further discussed.
Given the aforementioned considerations, a need remains for a shear capacity model that consistently accounts for both the size effect and the contribution of longitudinal reinforcement within a unified framework. To address this, the present study proposes a modified simplified strut-and-tie model (M-SSSTM) which explicitly incorporates a size effect coefficient and a reinforcement-related term associated with dowel action. The size effect coefficient is calibrated based on a comprehensive database of 572 test results compiled from the literature, ensuring that the proposed formulation captures the fundamental characteristics of size-dependent behavior. Furthermore, experimental results from nine RC deep beam specimens are used to evaluate the predictive capacity of the model. The proposed model is further assessed through comparison with current design codes and conventional STM-based approaches [1,2,3,17,18], demonstrating its superior accuracy and applicability for the analysis and design of RC deep beams, particularly for large-scale members.

2. Model Introduction

Hwang [17] and other scholars developed the softened strut-and-tie model (SSTM) based on the conventional STM framework, which comprehensively considers the shear resistance of stirrups and horizontal web reinforcement. This model replaces the concrete efficiency factor with a concrete softening coefficient while simultaneously satisfying force equilibrium, deformation compatibility, and constitutive relationships. Although the mechanical concept of the model is clear and aligns well with physical reality, it involves numerous parameters, and the calculation includes an iterative process, rendering it less convenient for practical engineering applications. To address this, Hwang [17] and co-workers simplified the formulation without compromising calculation accuracy, thereby proposing the simplified softened strut-and-tie model (SSSTM). The calculation process is as follows.
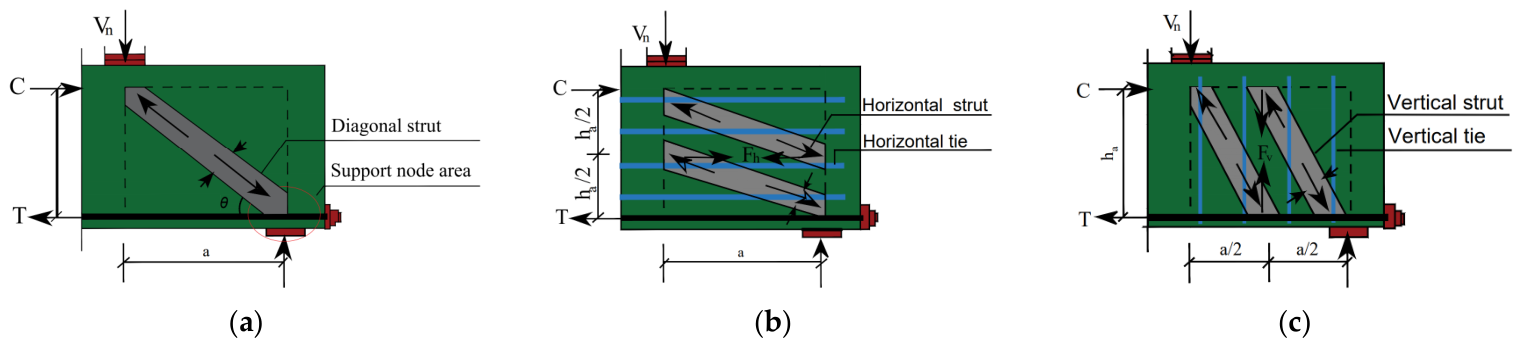
When cracks appear in a deep beam, the web reinforcement begins to be tensioned and acts as a tie, while the compressed concrete functions as a diagonal strut, thereby forming the strut-and-tie model mechanism. The simplified softened strut-and-tie model is composed of three parts: horizontal, vertical and diagonal mechanisms, as shown in Figure 1.
A compressed concrete diagonal strut’s dip angle θ can be expressed as
θ = arctan j h 0 a
V j v V j h = j h 0 a
j h 0 = h 0 k h 0 3
where jh0 is the distance from the centroid of compression concrete of the deep beam to the centroid of the tensile longitudinal reinforcement, i.e., the force arm; a is the horizontal distance from the load to the support center, i.e., the shear span; Vjv is the vertical shear force of the deep beam; Vjh is the horizontal shear force of the deep beam; h0 is the effective height of the deep beam; kh0 is the concrete height in the compression zone.
The value of coefficient k is related to factors like the reinforcement ratio and elastic modulus ratio, which can be expressed as
k = n ρ + ( n 1 ) ρ 2 + 2 n ρ + ( n 1 ) ρ h 0 / h 0 n ρ + ( n 1 ) ρ
where ρ, ρ′ refer to the individual reinforcement ratios of longitudinal tensile reinforcement and compressed reinforcement. The n is the elastic modulus ratio, i.e., EsEc, in which Es is the elastic modulus of longitudinal reinforcement and Ec is the elastic modulus of the concrete. The h0′ is the distance from the centroid of the longitudinal tensile reinforcement to the top of the concrete in the compression zone. Further, b is the width of the compression concrete diagonal strut, i.e., height width, and as is the height of the compressed concrete diagonal strut. This is determined by its boundary conditions, i.e., the compression joint area at the load point and the support.
The pressure of the reinforced-concrete inclined rod in the SSSTM model is defined as Cd, which meets the following requirements:
C d = ( K h + K v 1 ) ζ f c A str
ζ 3.35 f c 0.52
where Kh and Kv are the indicators of horizontal and vertical ties respectively and ζ is the softening coefficient of concrete. The effective cross-sectional area Astr of the compression concrete diagonal strut is expressed by the following formula:
A str = a s × b
where as is the height of the diagonal strut; b is the width of the diagonal strut.
The index of the horizontal tie is
K h = 1 + ( K h ¯ 1 ) × A t h f y h F ¯ h K h ¯
K h ¯ 1 1 0.2 ( γ h + γ h 2 )
F h ¯ = γ h × K h ¯ ζ f c A str × cos θ
γ h = 2 tan θ 1 3
where K h ¯ is the index of the elastic horizontal tie, Ath is the cross-sectional area of the horizontal tie, fyh is the yield strength of the horizontal tie, and F h ¯ is the equilibrium tension value of the horizontal tie; γh is the proportion of the horizontal shear force borne by the horizontal tie when the vertical mechanism does not participate in the action, and this accords with 0 ≤ γh ≤ 1.
The index of the vertical tie is
K v = 1 + ( K v ¯ 1 ) × A t h f y h F h ¯ K v ¯
K v ¯ 1 1 0.2 ( γ v + γ v 2 )
F V ¯ = γ v × K v ¯ ζ f c A str × cos θ
γ v = 2 cot θ 1 3
where K v ¯ is the index of the elastic vertical tie, Atv is the cross-sectional area of the vertical tie, fyv is the yield strength of the vertical tie, and F v ¯ is the equilibrium tension value of the vertical tie; γv is the proportion of vertical shear force borne by the vertical tie when the horizontal mechanism does not participate in the action, 0 ≤ γv ≤ 1.
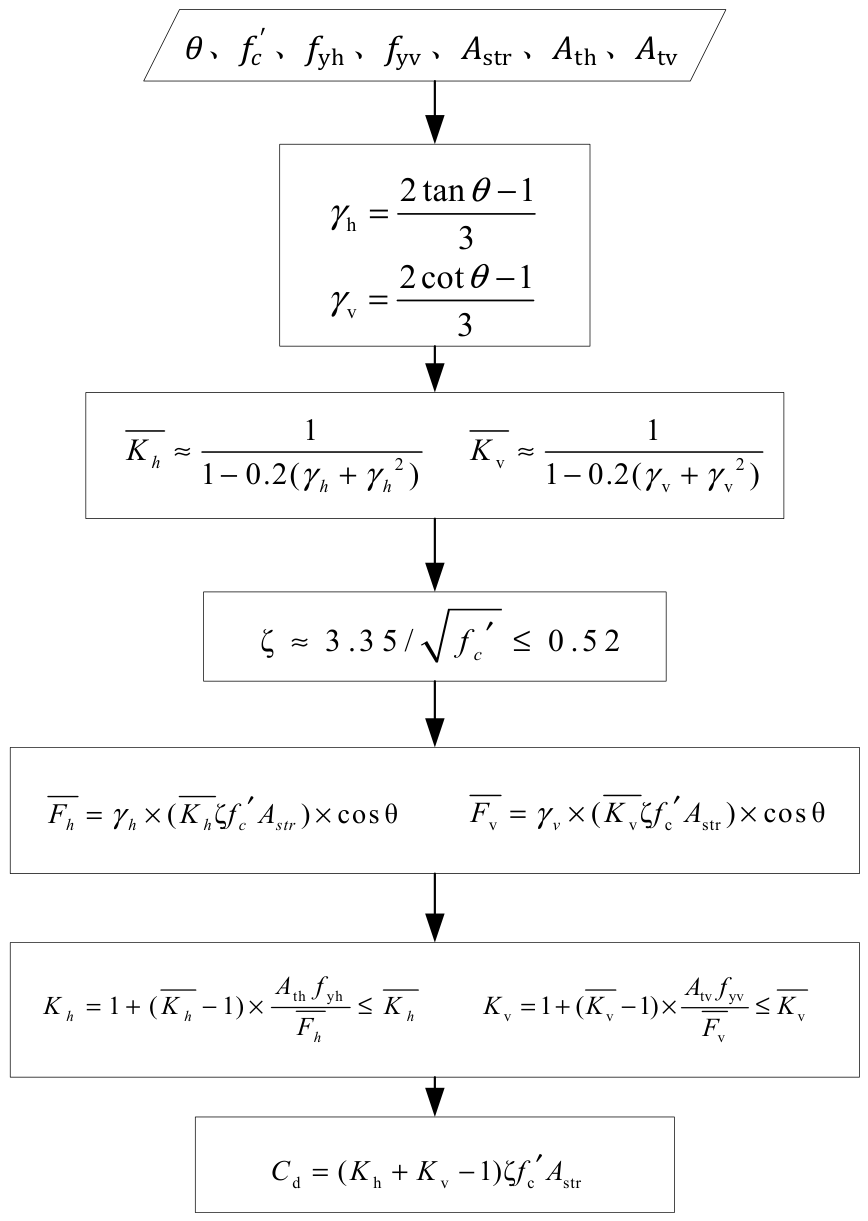
The SSSTM model’s calculation process is shown in Figure 2.

3. Model Modification

3.1. Modifications Considering the Effect of Longitudinal Reinforcement

After the deep beam cracks, if there is web reinforcement in the D-zone, the web reinforcement begins to be tensioned, and this limits the increase of tensile strain in the cracked concrete in the direction perpendicular to the compression direction. Meanwhile, other force transmission exists besides the transmission of diagonal pressure through the diagonal strut. In this way, more concrete in the core area can participate in the shear resistance, thereby increasing the shear strength of the D-zone. The effect of web reinforcement in the simplified softened strut-and-tie model is reflected in the coefficients Kv and Kh.
The role of longitudinal reinforcement in components is similar to that of horizontal web reinforcement. Although it does not directly provide a vertical tensile force in the shear direction, it can control the diagonal crack width through dowel action, limit the increase of tensile strain of concrete perpendicular to the compression direction, and contribute to shear resistance, especially in components with a large longitudinal reinforcement ratio. This is consistent with the views expressed in the literature [19]. On the basis of the crack zone theory, Taylor [20] made a quantitative analysis of the factors involved in the shear capacity of deep beams, in which the stress in the compression zone accounted for 20~40%, the aggregate interlock accounted for 35~50%, and the dowel action of longitudinal reinforcement accounted for 15~25%. Studies in the literature [21] also verified that an increase in the longitudinal reinforcement ratio significantly improves the shear capacity of deep beam components. This view has also been proven by substantial shear tests of simply-supported or continuous deep beams [22,23]. Therefore, it is suggested that the effect of longitudinal reinforcement on the shear capacity of deep beams should be considered in the simplified softened strut-and-tie model.
The horizontal mechanism of SSSTM considers the role of horizontal web reinforcement but does not include longitudinal reinforcement. Therefore, the horizontal tie index in SSSTM is modified, wherein the area of longitudinal reinforcement is equivalent to the area of horizontal web reinforcement in the specimen. The equivalent area of longitudinal reinforcement is added to the effective area of horizontal tie in the original SSSTM.
K h = 1 + ( K h ¯ 1 ) × A t h f y h + A s f y F h ¯ K h ¯
As: reinforcement area of longitudinal reinforcement. fy: yield strength.
Research by Hwang [17] and other scholars showed that not all vertical and horizontal reinforcement can be fully effective; specifically, the vertical and horizontal reinforcement near the center of the diagonal strut of a deep beam is more effective than that on both sides. Therefore, it is assumed that half of the horizontal web reinforcement near the horizontal center of the deep beam is fully effective, while the remaining 50% is partially effective. Similarly, half of the vertical reinforcement near the vertical axis between the support node and the loading node is fully effective, whereas the remaining 50% is partially effective. The contribution of longitudinal reinforcement is incorporated by calculating its effective area based on the number of bars that effectively participate in the load-transfer mechanism. Instead of using a single equation, the relationship between the total rows of reinforcement and the effective rows is defined by a discrete mapping, as detailed in Table 1 and Table 2. By identifying the effective rows from these tables, the corresponding area As (using the reinforcement yield strength fy) is then added to the effective area of the horizontal tie Ath within the SSSTM framework.

3.2. Modifications Considering the Size Effect

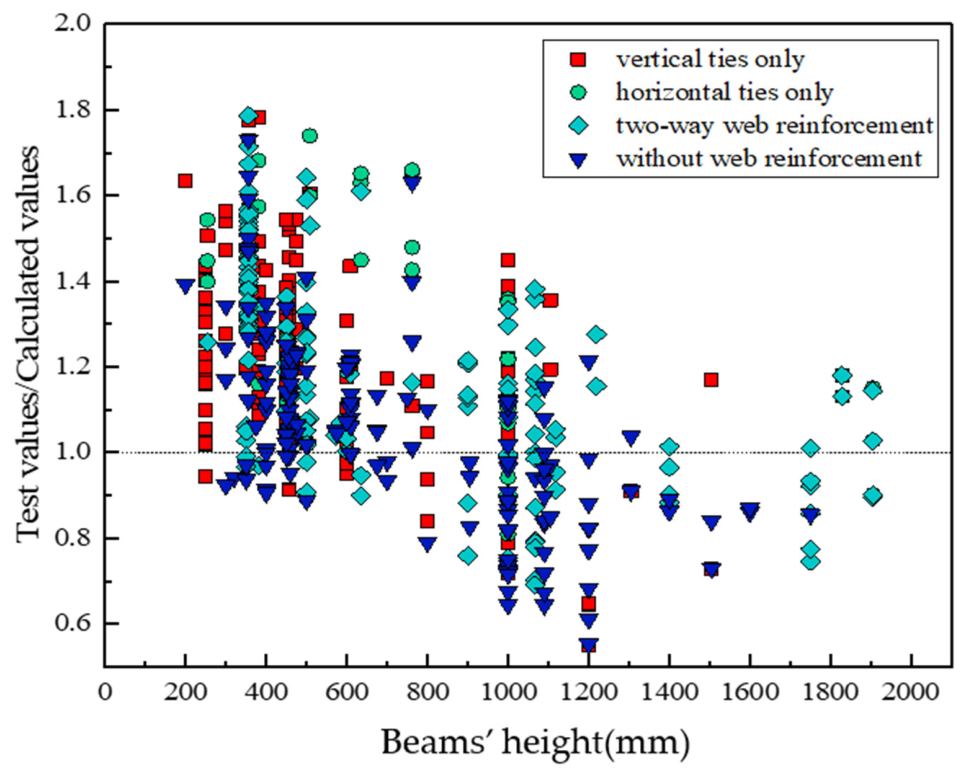
In the process of shear failure of a deep beam, with the increase in cross-sectional size, the crack width along the inclined cross-section increases, resulting in a reduction of the aggregate interlock, so the shear strength of a large-scale specimen is significantly lower than that of a small-scale component. Larger cracks need to release more energy while expanding and extending. Therefore, with the increase in cross-sectional size, the nominal ultimate strength of the specimen will be significantly reduced. Numerous scholars have proven the existence of the size effect in deep beam components through theoretical analysis or experimental verification. From the perspective of formulation format, the influence of the size effect is not considered in the SSSTM. When the cross-section height reaches a certain threshold, the predicted value may overestimate the measured value. Work in the literature [24] has pointed out that when the simplified softened strut-and-tie model was used to calculate the shear capacity of deep beam components with a beam height of 1250 mm, the ratio of the measured value to the predicted value was mostly lower than 1. A summary of the deep beam shear test data is shown in Table 3.
In order to verify the above view, 572 groups of deep beam test data from the literature were collected. During data selection, incomplete records missing essential geometric dimensions or material properties were excluded. Additionally, inconsistent data involving dynamic loading, prestressing, or non-shear failure modes were removed. The main basis for the selection of deep beams was that the shear span ratio of the specimens was less than 2, the span height ratio was less than 2, and the specimens exhibited shear failure. The height of the specimens is distributed between 200 mm and 1905 mm, and the main variables are the concrete compressive strength, shear span ratio, longitudinal reinforcement ratio, stirrup reinforcement ratio, and horizontal reinforcement ratio. See Table 2 for the specific range of influencing factors. The simplified softened strut-and-tie model is used to calculate the shear capacity of the 572 groups of deep beam components. The calculation results are shown in Figure 3.

3.3. Modified Model

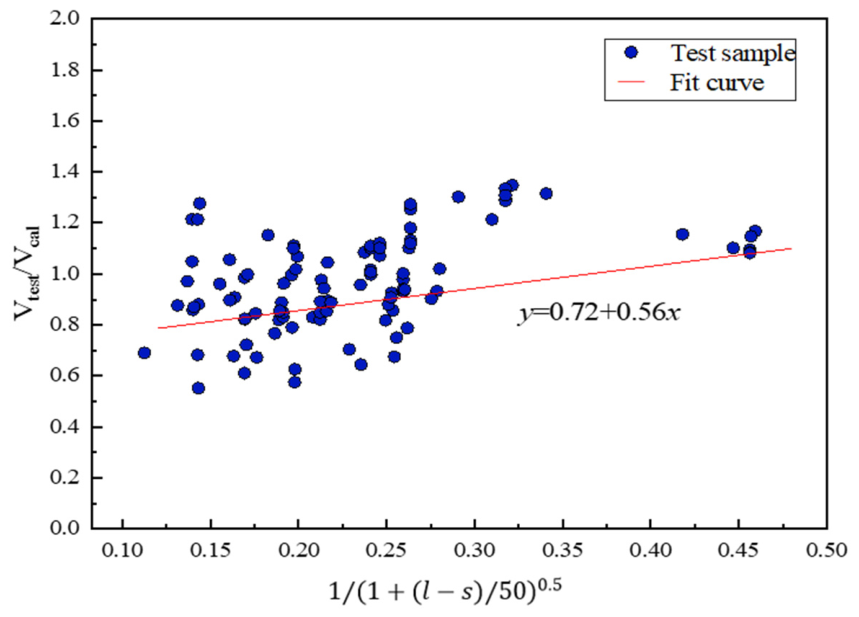
It can be clearly seen from Figure 3 that when the beam height is less than 800 mm, most of the predicted results of the SSSTM are within the safe range, only 6.2% of the predicted values for the components are greater than the experimental values, and the ratios of VtestVcal are all greater than 0.85. In the calculation process, the measured material properties of concrete are used to replace the standard characteristic value. The high inherent scatter in the concrete’s properties will lead to an overestimated predicted value for a small number of deep beams. When the beam height exceeds 800 mm, the predicted values of 60% of the components are greater than the experimental, with VtestVcal for 32.4% of these specimens falling between 0.5 and 0.8, indicating that the predicted value is much greater than the test value. The selection of h ≥ 800 mm as the critical threshold is based on statistical observations, code provisions, and recent fracture mechanics studies. Our analysis revealed a significant drop in the predictive safety margin for specimens beyond this height. Additionally, the Chinese Design Code (GB50010-2010) [64] strictly mandates this value as the threshold for modifying the shear size effect. This boundary is further supported by recent investigations [65,66], which demonstrate that the size effect relative to shear mechanisms—driven by fracture energy release and crack propagation—becomes highly pronounced in large-scale members of this depth. Consequently, these findings are combined with the studies of Bažant et al. [67] and Kim et al. [68], resulting in the shear size effect coefficient for deep beam, as shown in Equation (17), where l and s represent the length and width of the strut, respectively.
ξ = a + b 1 + l s 50
where ξ is the shear size effect coefficient; l and s are the length and width of the compressed concrete diagonal strut, respectively; a and b are regression coefficients; and the constant 50 in the denominator is a calibration factor representing the characteristic dimension influence of the strut on the size effect.
The 146 groups of deep beam data referencing a beam height greater than or equal to 800 mm out of the total 572 groups of data are listed separately, and the results are shown in Figure 4. Linear regression analysis of these data leads to a = 0.72, b = 0.56, with a coefficient of determination ( R 2 ) of 0.87. The standard errors for a and b were 0.048 and 0.062. These statistical indicators demonstrate that the regression model is reliable and the parameters are statistically significant. According to this, a modified SSSTM shear capacity calculation model (M-SSSTM) is proposed. It should be noted that rather than a fully mechanics-based analytical derivation utilizing explicit fracture parameters (e.g., fracture energy), the proposed model is more accurately characterized as a fracture-mechanics-inspired empirical enhancement. Its constants are calibrated via statistical regression, providing a practical semi-empirical tool for design purposes. When h ≥ 800 mm, Equation (18) (a) is used for calculations; when h < 800 mm, Equation (18) (b) will be used instead to calculate the value.
V u = 0.72 + 0.56 1 + l s 50 ( K h + K v 1 ) ζ f c A str sin θ , h 800 mm ( a ) ( K h + K v 1 ) ζ f c A str sin θ , h < 800 mm ( b )
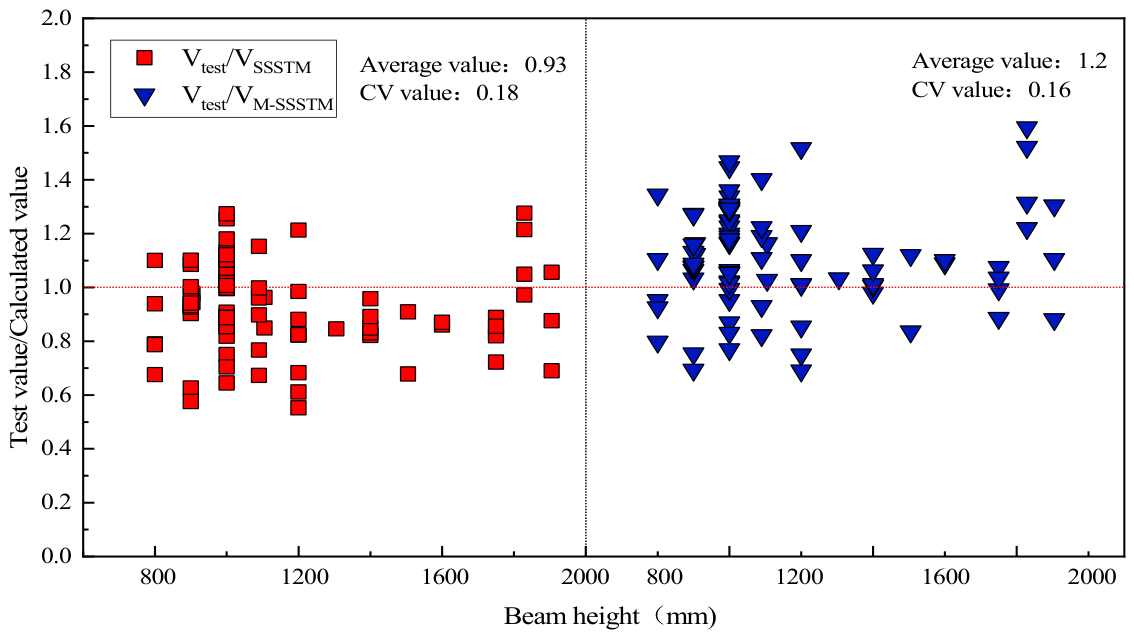
Compare the calculation results from the modified model M-SSSTM with those of the SSSTM; these are the results shown in Figure 5 and Table 4. Before the modification, the mean value of VtestVSSSTM was 0.93, and the coefficient of variation was 0.18. After the modification, the mean value of VtestVM-SSSTM became 1.2, and the coefficient of variation decreased to 0.16. The overall safety margin was improved, and the data scatter was smaller. This indicated that the proposed model eliminated the influence of the size effect and could effectively predict the shear capacity of large-scale deep beams. In addition, it should be noted that given the requirement that the deep beam height h ≥ 800 mm, the test data selected for Table 4 was limited to a certain extent. Therefore, it remains quite important to carry out experimental research on the shear failure of large-scale deep beam specimens.

4. Test Verification

To further explore the size effect in deep beam components and test the applicability of the modified formula in predicting the shear capacity of full-scale deep beams, four-point bending failure tests on deep beams in three series, S-DB, M-DB and L-DB, were completed, respectively.

4.1. Test Overview

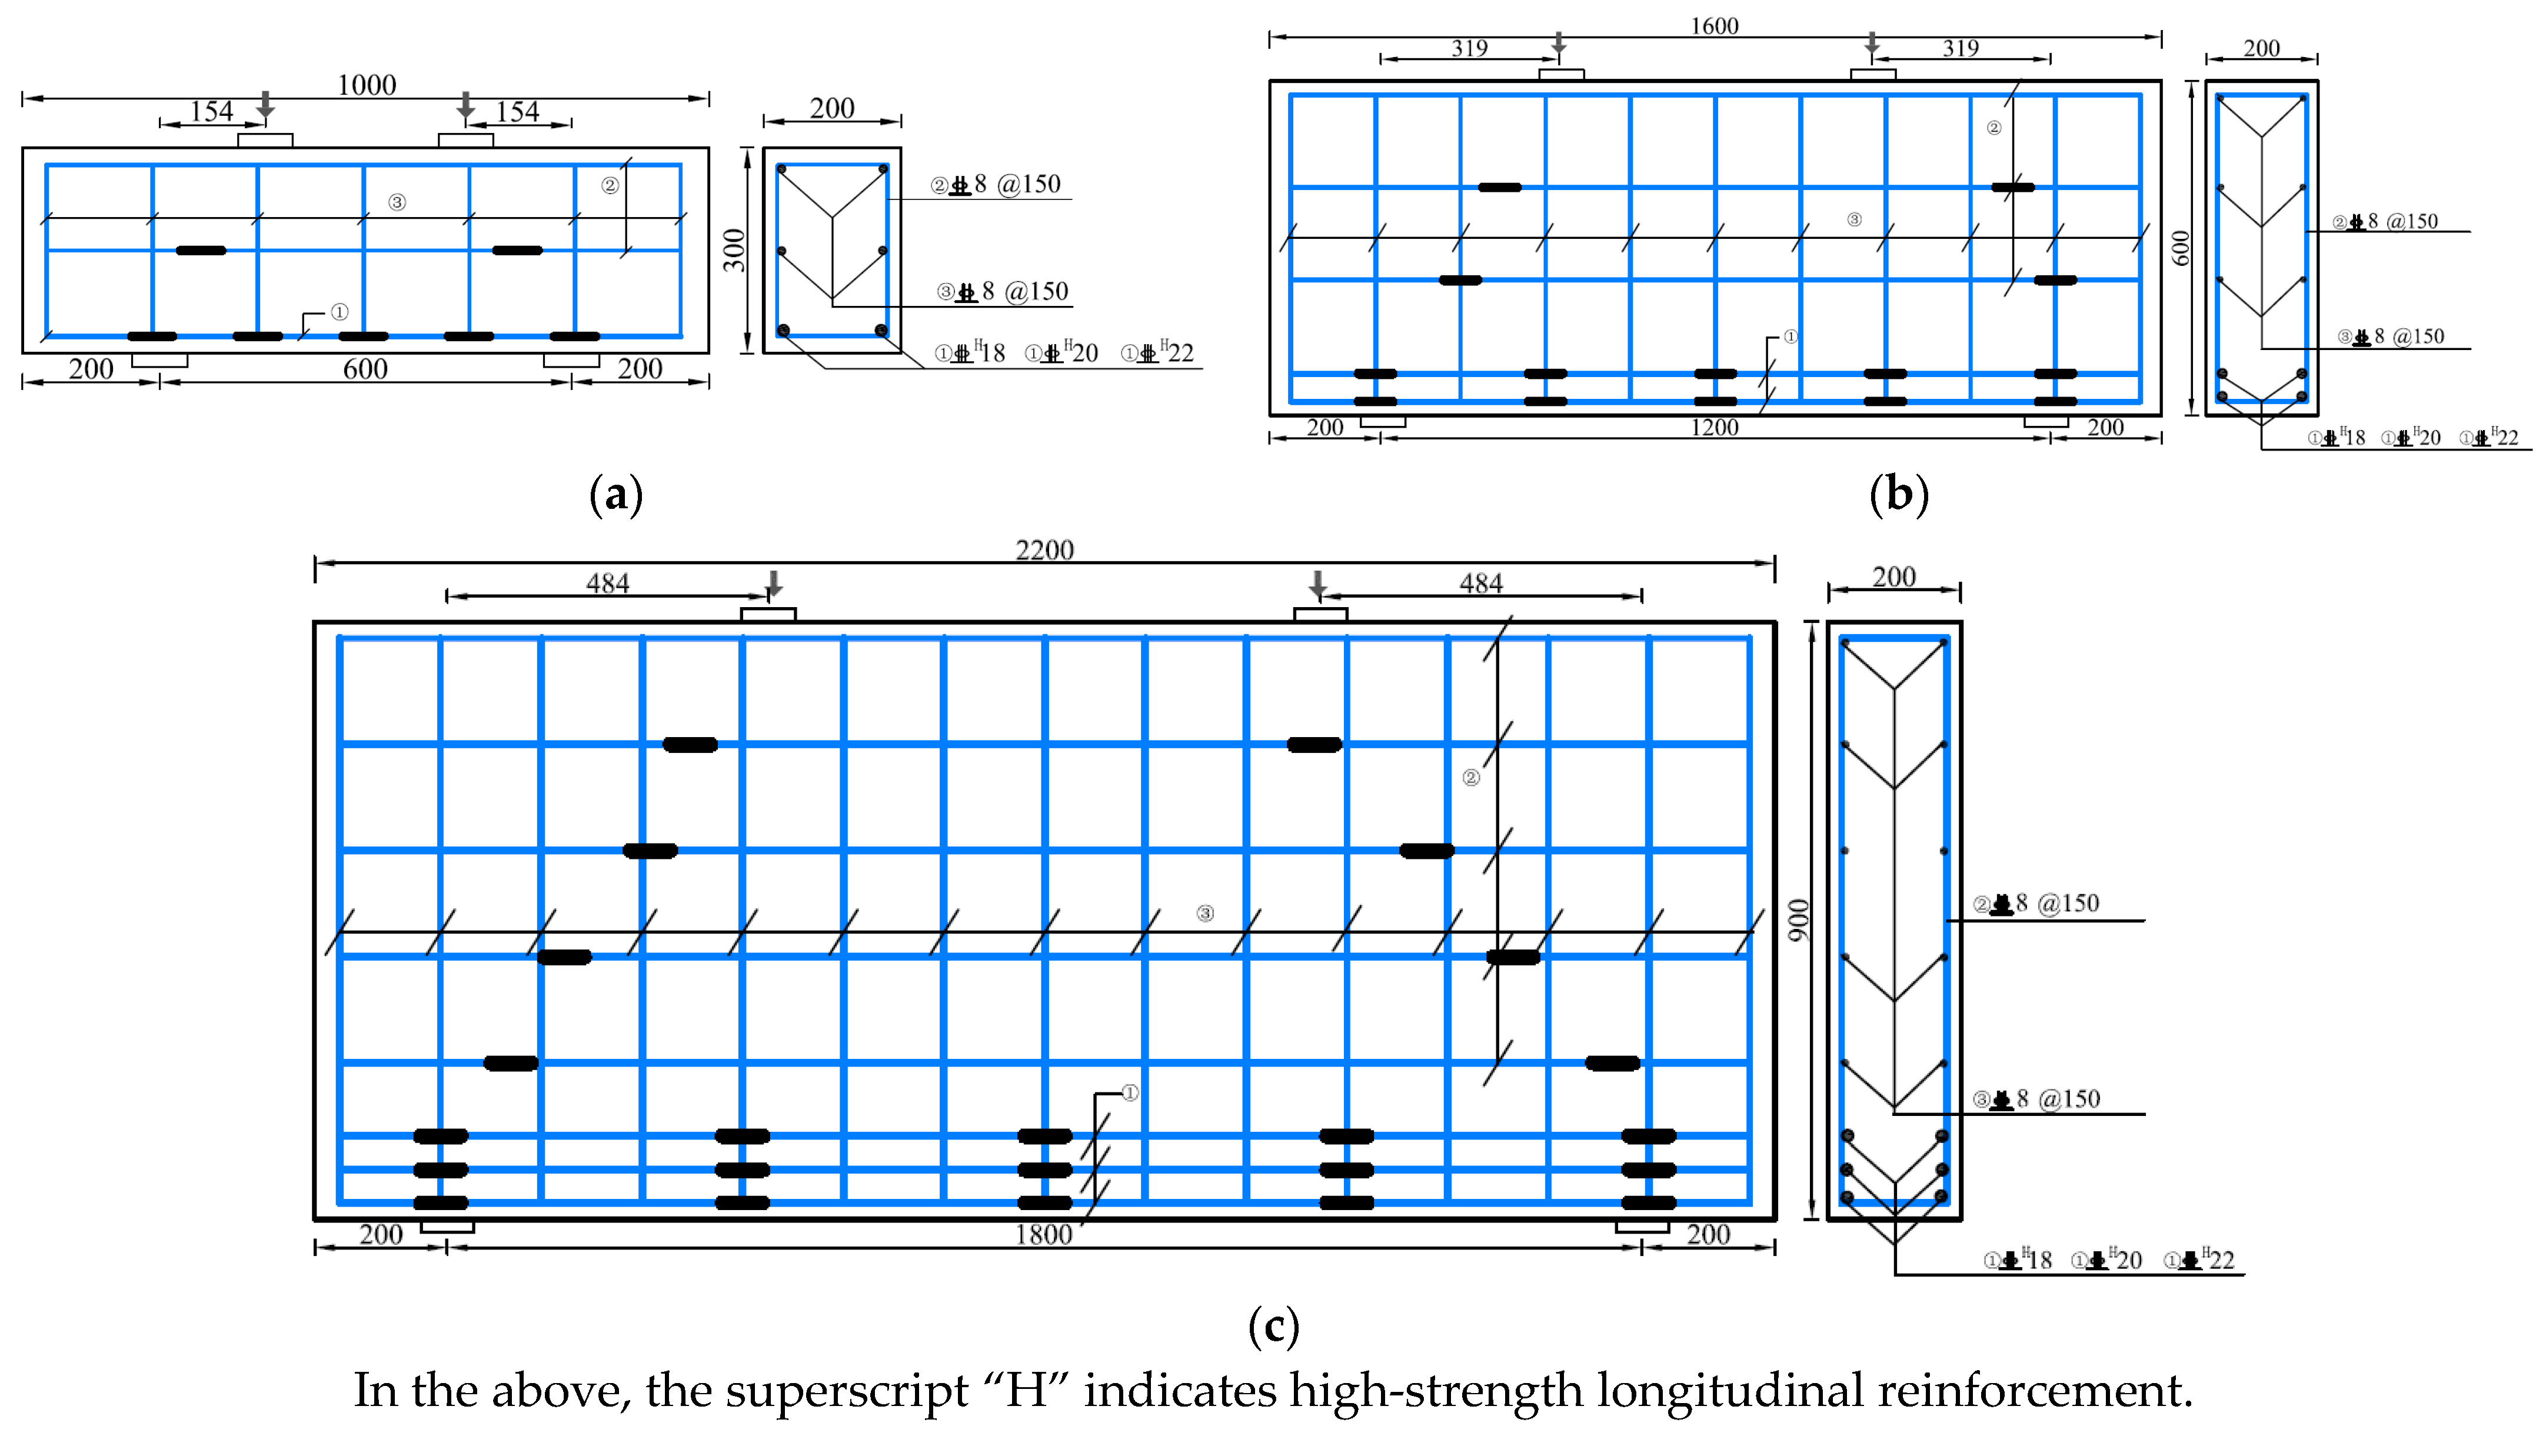
According to the cross-sectional height, the test specimens are divided into three groups: S-DB, M-DB and L-DB. The beam heights are 300 mm, 600 mm and 900 mm, respectively. The cross-section width is 200 mm. The shear span ratio is 0.6, and the span height ratio is 2. In each group of deep beams, the longitudinal reinforcement ratio is selected as the variable, which turns out to be ρ = 0.67%, ρ = 1.05%, ρ = 1.27%; this reinforcement ratio can be adjusted by configuring longitudinal bars with different diameters. See Table 5 and Figure 6 for the main parameters and reinforcement details.
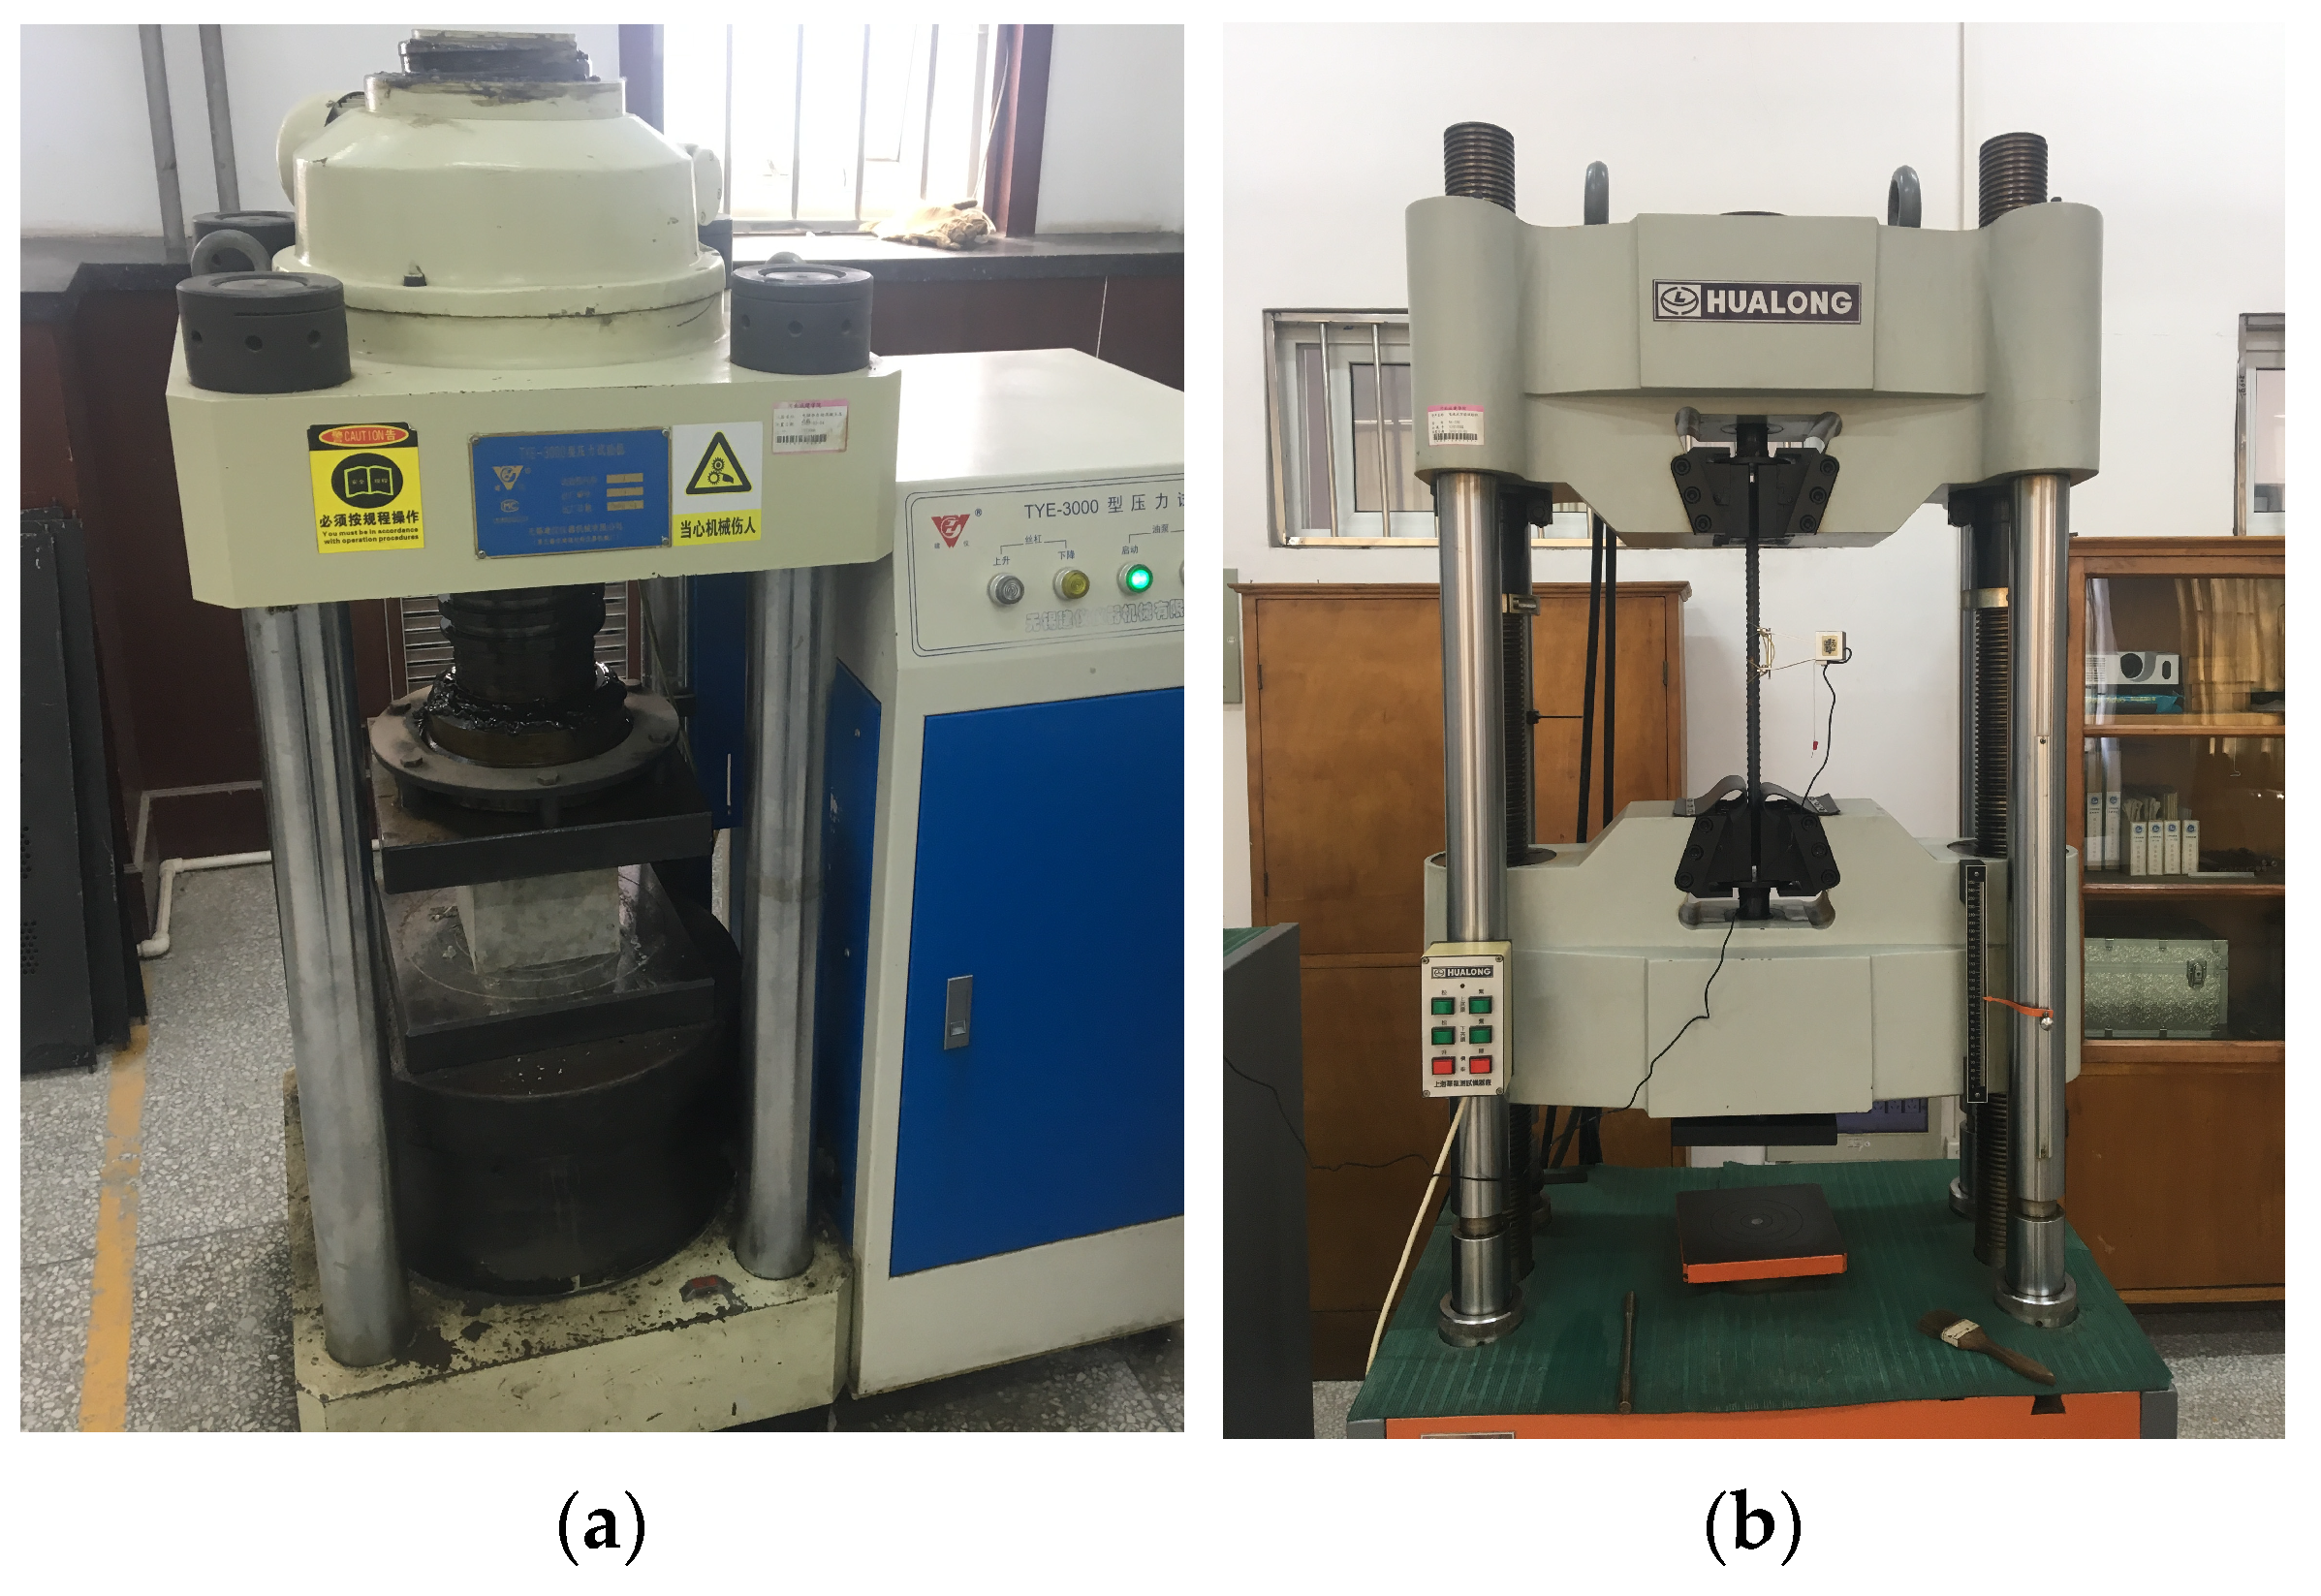
Commercial concrete with a strength grade of C50 was used in the tests. Six standard cube test blocks and six prism test blocks were prepared; these blocks were cured in accordance with the relevant provisions of the Standard for testing methods for concrete structures [70] (GB/T 50152-2002) and the Standard for test methods of mechanical properties of ordinary concrete [71] (GB/T50081-2012). See Table 6 for the concrete’s material properties. The bottom longitudinal reinforcement consisted of HRB600 grade bars, while the horizontal distribution reinforcement and stirrups were HRB400E grade bars. The HRB600 bars had diameters of 16 mm, 20 mm and 22 mm depending on the reinforcement ratio, whereas the diameter of the HRB400E reinforcement was 8 mm. See Table 7 for the material properties of the reinforcement. See Figure 7 for the material performance tests.
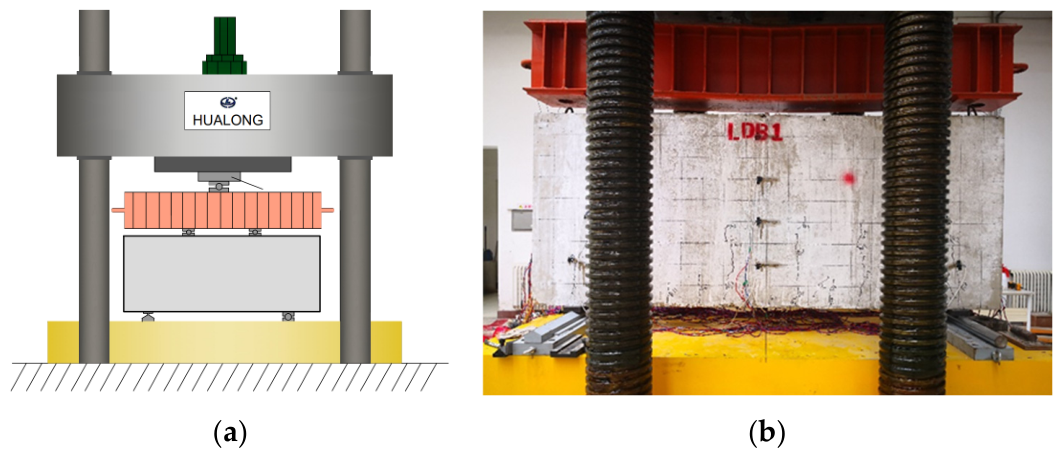
A YJW-10000 pressure testing machine was used for four-point bending loading, and the schematic diagram of the loading equipment is shown in Figure 8. To minimize experimental uncertainties, all loading devices and measurement instruments were strictly calibrated prior to the tests, ensuring that the measurement accuracy met standard laboratory requirements (with an error margin controlled within ±1%). The loading process was force-controlled. The loading rate was set to 1 kN/s, and each stage was loaded by 100 kN. Based on the prediction of the ultimate bearing capacity of the specimens before the tests, the loading procedure was divided into 10–20 steps. After the completion of each stage, a static load was maintained for 3 min to observe and record the data, as well as measure the width of the cracks, so as to facilitate the subsequent observation of crack propagation. The concrete cracks on the surface of the specimen were traced and recorded.

4.2. Test Results and Failure Patterns

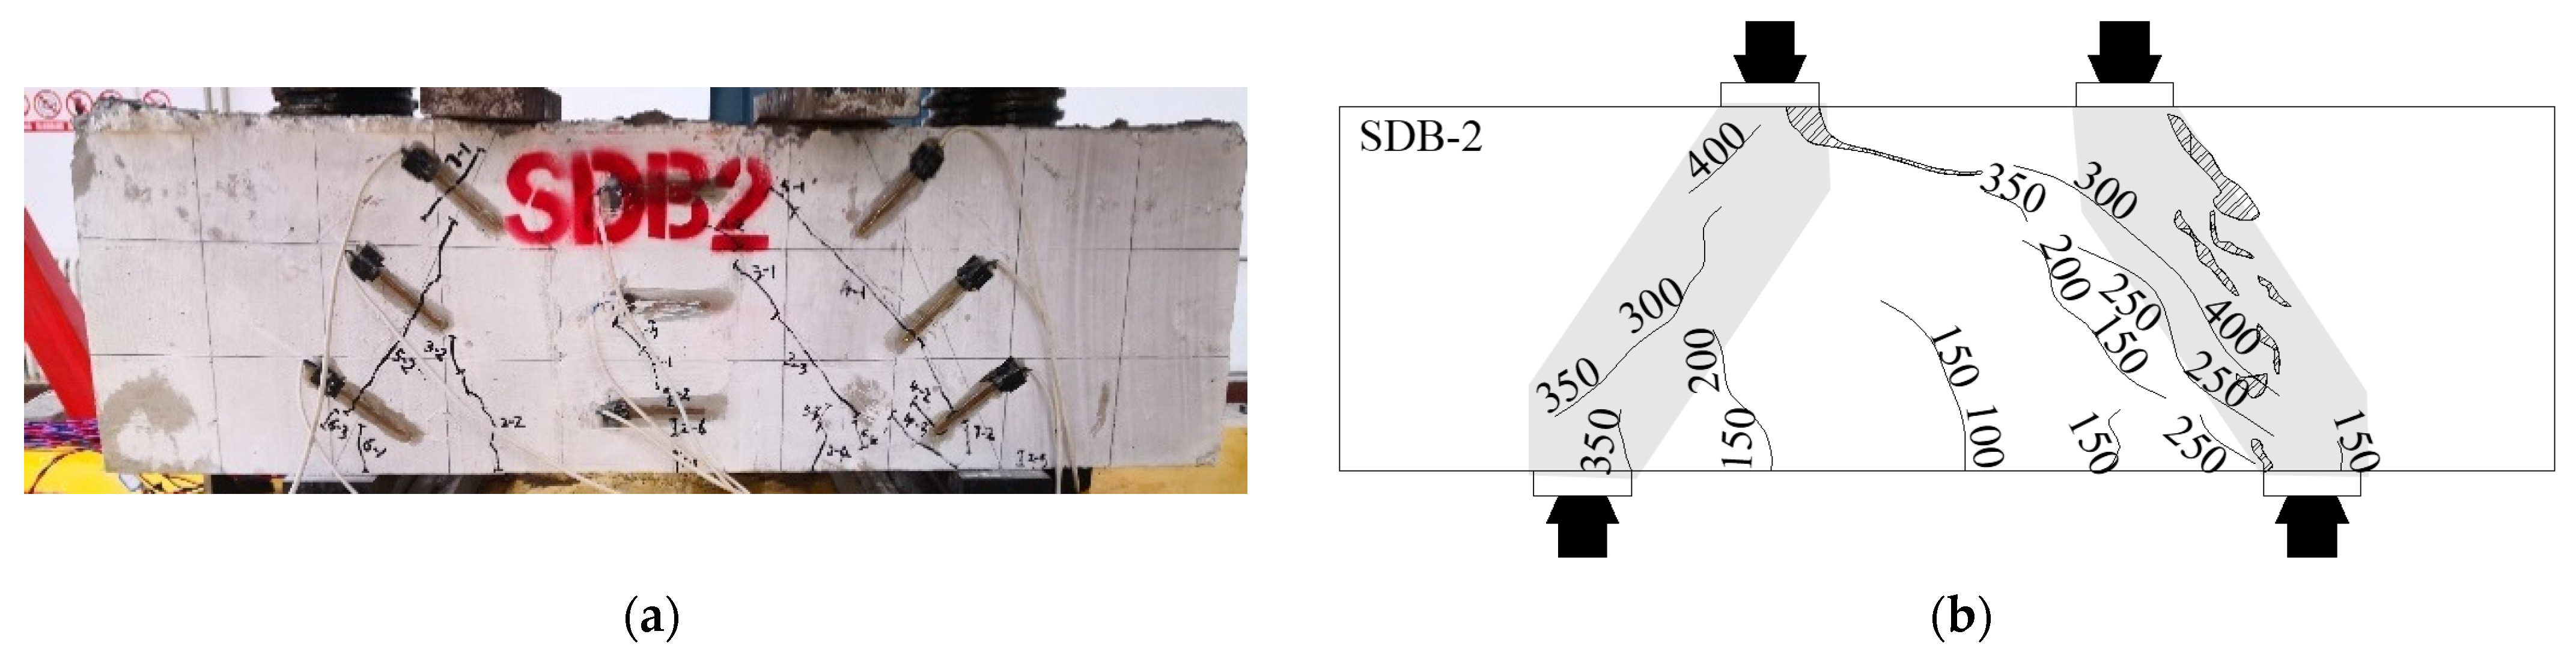
See Table 8 and Figure 9 for the main test results and failure patterns of the test specimens. The failure process of each specimen is similar. The failure process of the specimens is divided into three stages, namely: cracking, critical diagonal cracking and the ultimate limit state. The final failure mode exhibits diagonal compression failure. The number of parallel cracks in the shear span increases slightly with the increase in cross-sectional height. With the increase in the longitudinal reinforcement ratio, the failure patterns and failure pattern of the specimens show no obvious change.

4.3. Test Results and Analyses

4.3.1. Nominal Cracking Strength and Ultimate Strength

To reasonably consider the influence of the size effect on the characteristic loads of specimens, the characteristic loads are usually nominalized. For normal cross-sectional cracking and inclined cross-sectional cracking, it is considered that cracking occurs once the stress exceeds the concrete’s tensile strength f t and the failure occurs. The ultimate failure is considered to be caused by the stress of the inclined concrete strut exceeding its compressive strength. For the convenience of calculation and comparison with the research results at home and abroad, the compressive strength of concrete is usually taken as f c . Therefore, the nominal cracking strength of the normal cross-section is expressed as V cr N f t b h 0 , and the nominal cracking strength of inclined cross-section is expressed as V cr D f t b h 0 . The nominal shear strength of the specimen is V u f c b h 0 . The test results are listed in Table 9.
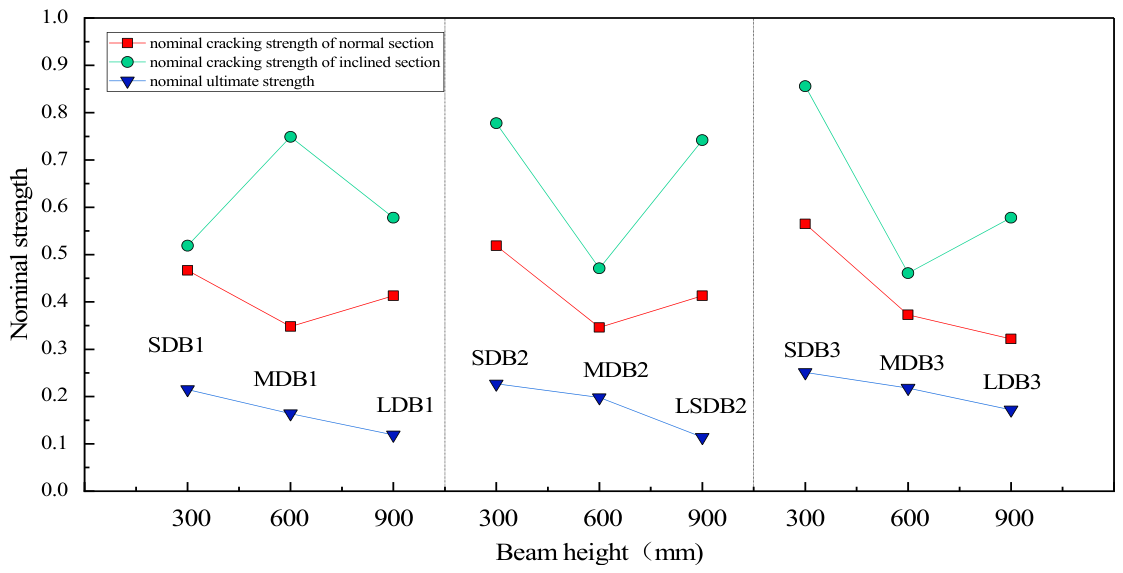
According to Figure 10, there is no significant size effect on the nominal cross-section or on the inclined cross-section of the specimens. The nominal ultimate load is significantly affected by the size effect, particularly as the cross-sectional height increases from 300 mm to 600 mm and 900 mm. Compared with S-DB1, the nominal ultimate strengths of M-DB1 and L-DB1 decreased by 23.72% and 44.65%, respectively. Contrasted with S-DB2, the ultimate nominal strengths of M-DB2 and L-DB2 decreased by 12.78% and 49.78%, respectively. In comparison with S-DB3, the ultimate nominal strengths of M-DB3 and L-DB3 decreased by 13.15% and 31.47%, respectively. According to this analysis, with the increase in the cross-sectional size of the specimens, the crack width increases, thereby decreasing the shear stress transmitted through the aggregate interlock mechanism at the failure surface; the degree of this reduction is positively correlated with the cross-sectional size of the specimen. When the cross-sectional height increases, the length of the concrete inclined strut increases, and the area of the internal energy release zone increases with the extension of the inclined crack, which reduces the crack-tip stress in full-scale deep beam specimens. Tan [15], through the experimental study of large-scale pre-stressed deep beam specimens, also concluded that there is a size effect on the ultimate strength of specimens, whereas there is no size effect on the cracking strength. Therefore, it is reasonable for the modification to introduce the size effect coefficient into the simplified softened strut-and-tie model.

4.3.2. Influences of Longitudinal Reinforcement Ratio

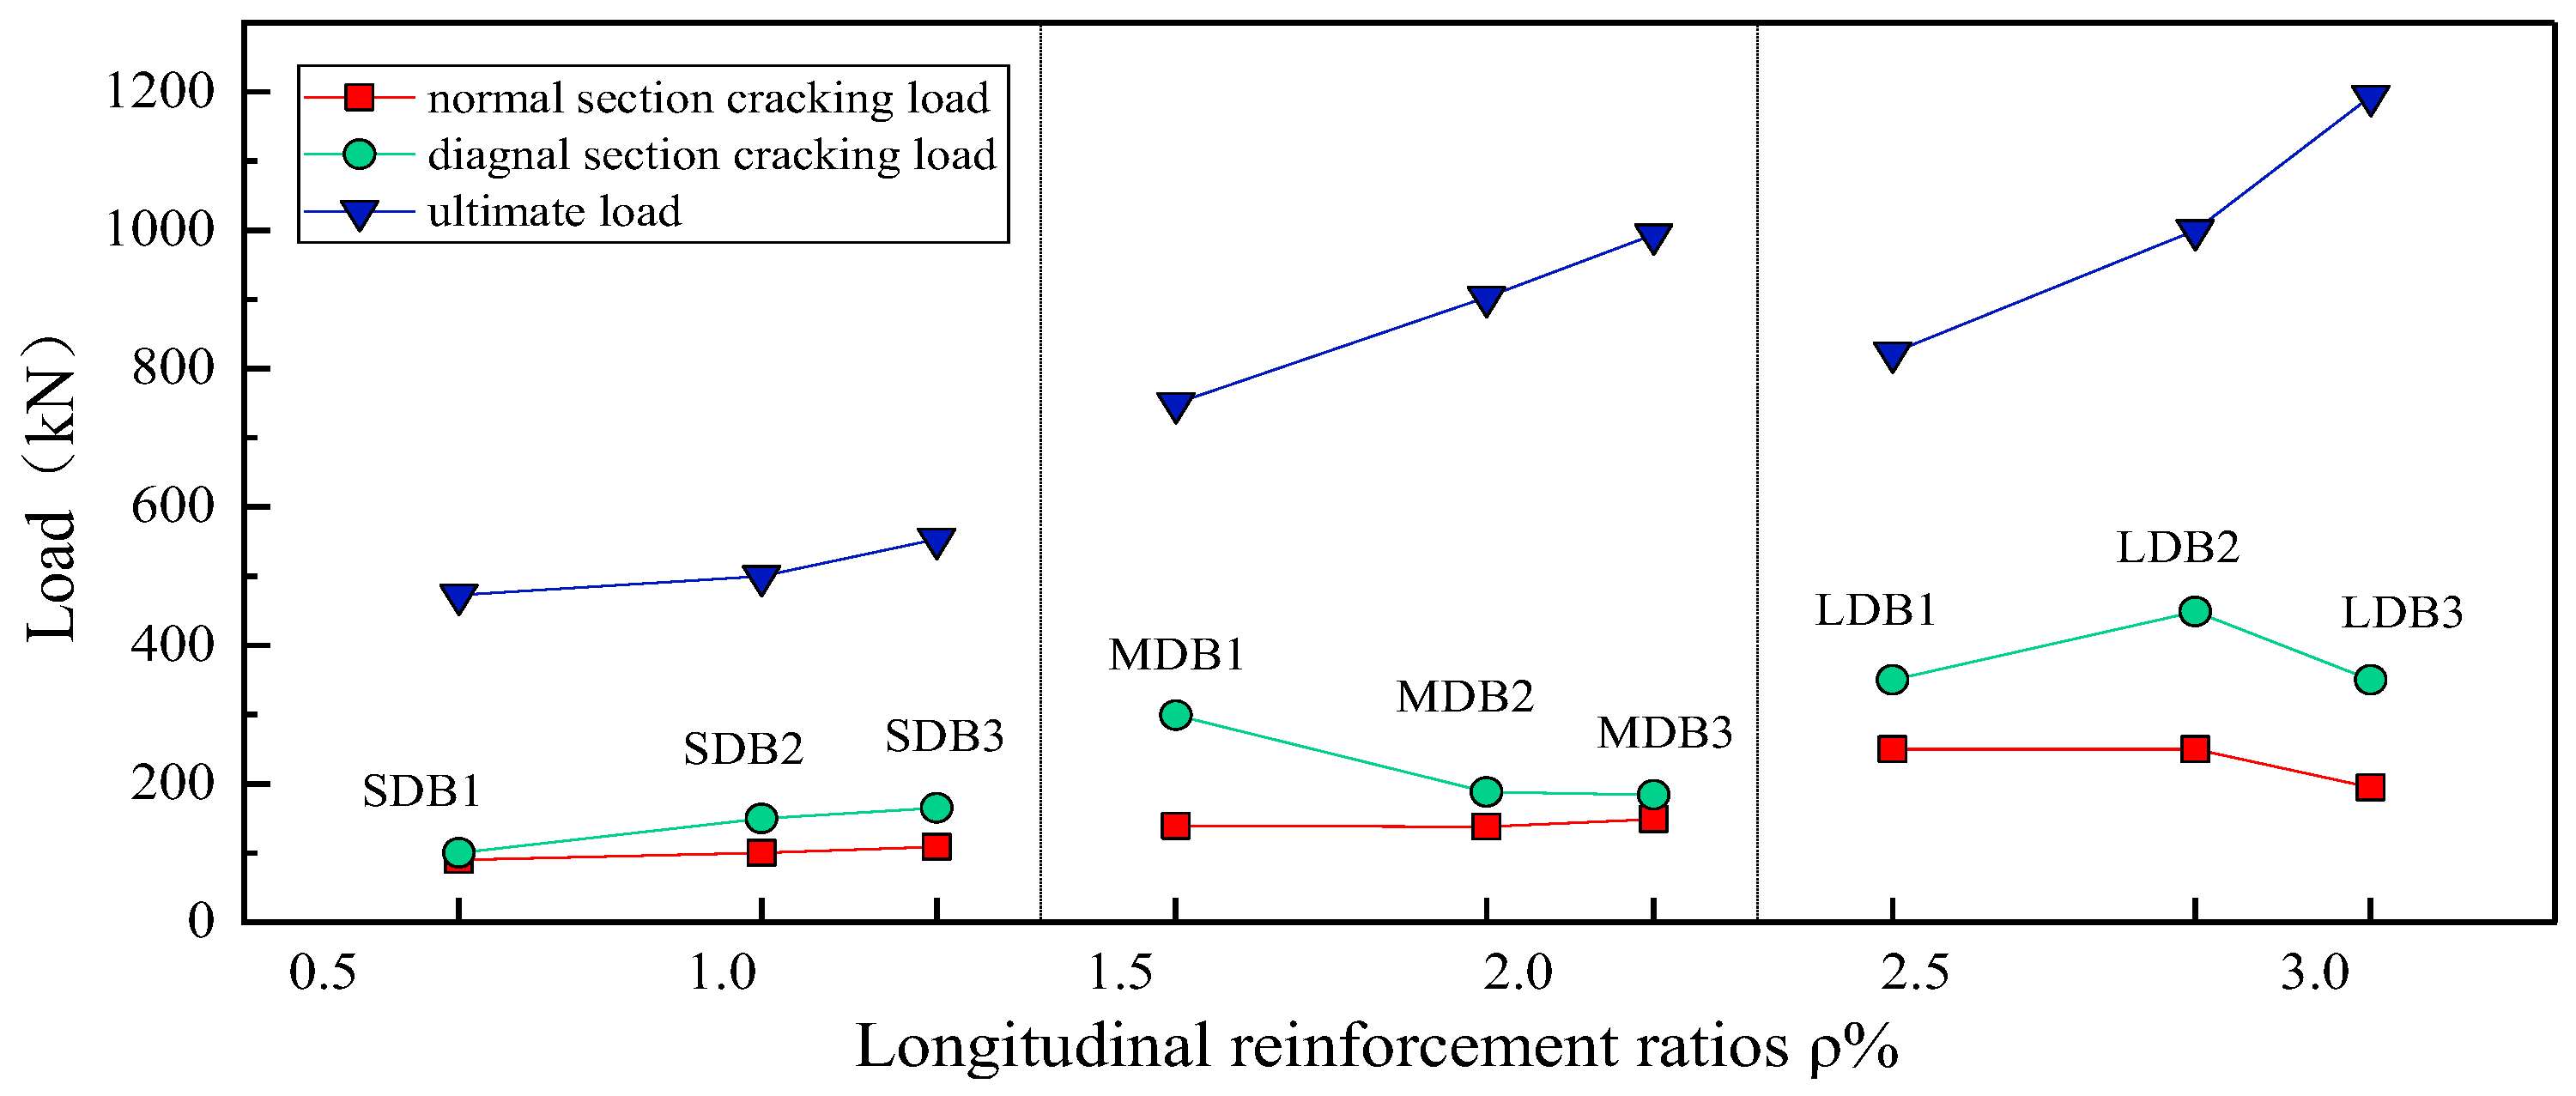
In the tests, the longitudinal reinforcement ratio of each group of deep beam components was 0.67%, 1.05%, and 1.27%, respectively, while other parameters remained unchanged. The influence of the longitudinal reinforcement ratio on the shear capacity of reinforced-concrete deep beam components was analyzed. As shown in Figure 11, with increase in the longitudinal reinforcement ratio from 0.67% to 1.27%, the cracking load of the normal cross-section remained basically unchanged across the three series, and the cracking load of the diagonal cross-section was also slightly affected by the reinforcement ratio of longitudinal reinforcement. Compared with S-DB1, the ultimate loads of S-DB2 and SDB3 individually increased by 11.06% and 23.01%, respectively. Compared with M-DB1, the ultimate loads of M-DB2 and M-DB3 separately increased by 20.46% and 32.49%, respectively. Compared with L-DB1, the ultimate loads of L-DB2 and L-DB3 increased by 21.51% and 45.01%, respectively.
Through the analysis of the test data, it can be seen that with the increase in the longitudinal reinforcement ratio, the failure mode of the specimens does not change, and they all exhibit inclined compression failure. The longitudinal reinforcement ratio has little effect on the normal cross-sectional cracking load and inclined cross-sectional cracking load of the specimens, whereas the ultimate load increases significantly with the increase in the longitudinal reinforcement ratio, which is consistent with the phenomenon observed in the literature [22]. The longitudinal reinforcement at the bottom of the beam mainly affects the shear capacity of the beam through dowel action. The longitudinal reinforcement not only inhibits the development of inclined cracks, but also improves the shear transfer performance between the inclined crack interfaces. Therefore, with the increase in the longitudinal reinforcement ratio, the ultimate load increases significantly. Quantitatively, as demonstrated by our test results, increasing the longitudinal reinforcement ratio from 0.67% to 1.27% provides a substantial 23.01% to 45.01% enhancement in the ultimate shear capacity. Similar quantitative observations regarding the critical role of longitudinal reinforcement and its coupled effect on shear transfer mechanisms have also been robustly documented in recent structural studies [65,66]. It should be noted that while the proposed M-SSSTM macroscopically simplifies the contribution of longitudinal reinforcement into an equivalent horizontal tie area ( A t h ) primarily representing dowel resistance, the actual physical mechanisms are highly multifaceted. Beyond pure dowel action, increased longitudinal reinforcement significantly enhances the overall tie stiffness and provides critical crack control. By restricting the widening of diagonal cracks, the longitudinal bars help maintain aggregate interlock and preserve the integrity of the main compressive strut. Furthermore, well-anchored longitudinal reinforcement effectively confines the lower nodal zones (C-C-T nodes) and facilitates the redistribution of internal forces, thereby sustaining the global arching action of the deep beam even after severe cracking. Therefore, the equivalent tie area in the proposed model should be interpreted as a practical macro-representation of these coupled mechanical benefits. However, this macro-equivalent model simplifies complex localized mechanics, as it does not explicitly track bond-slip interaction, crack-opening effects, and dowel stiffness degradation under severe cracking.

4.4. Comparative Analysis

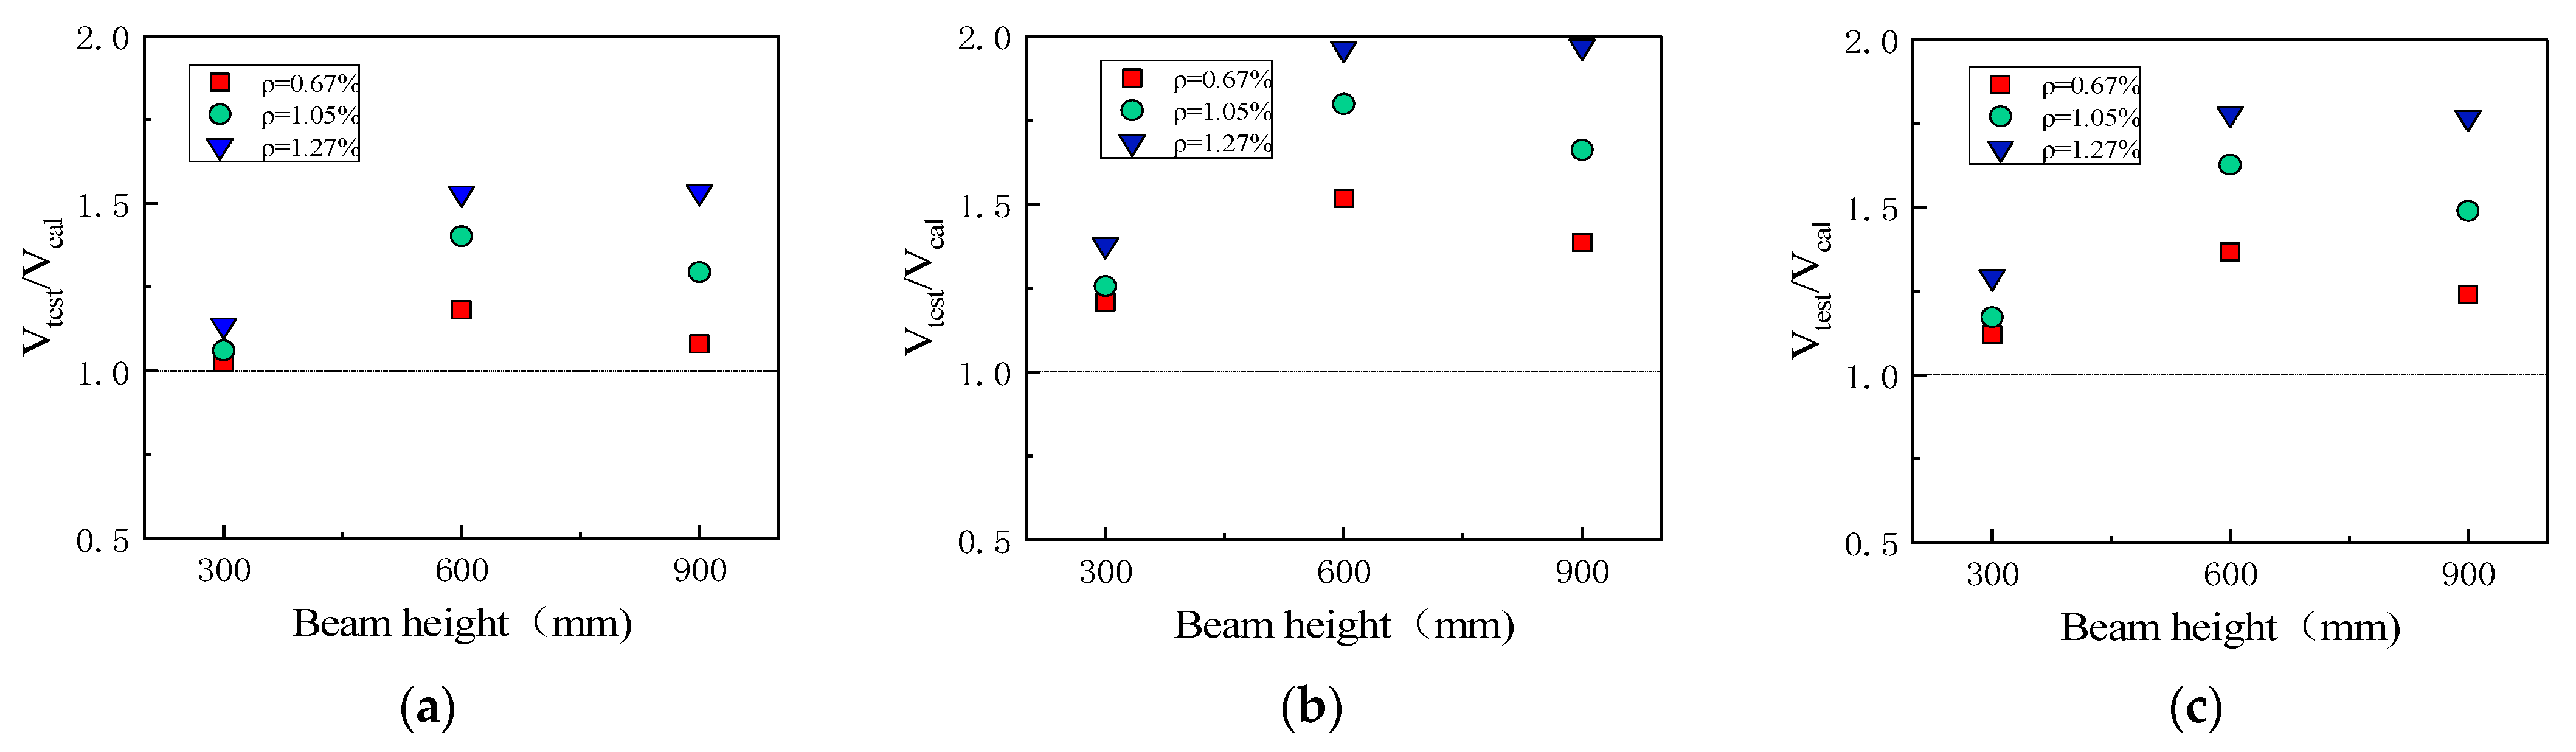
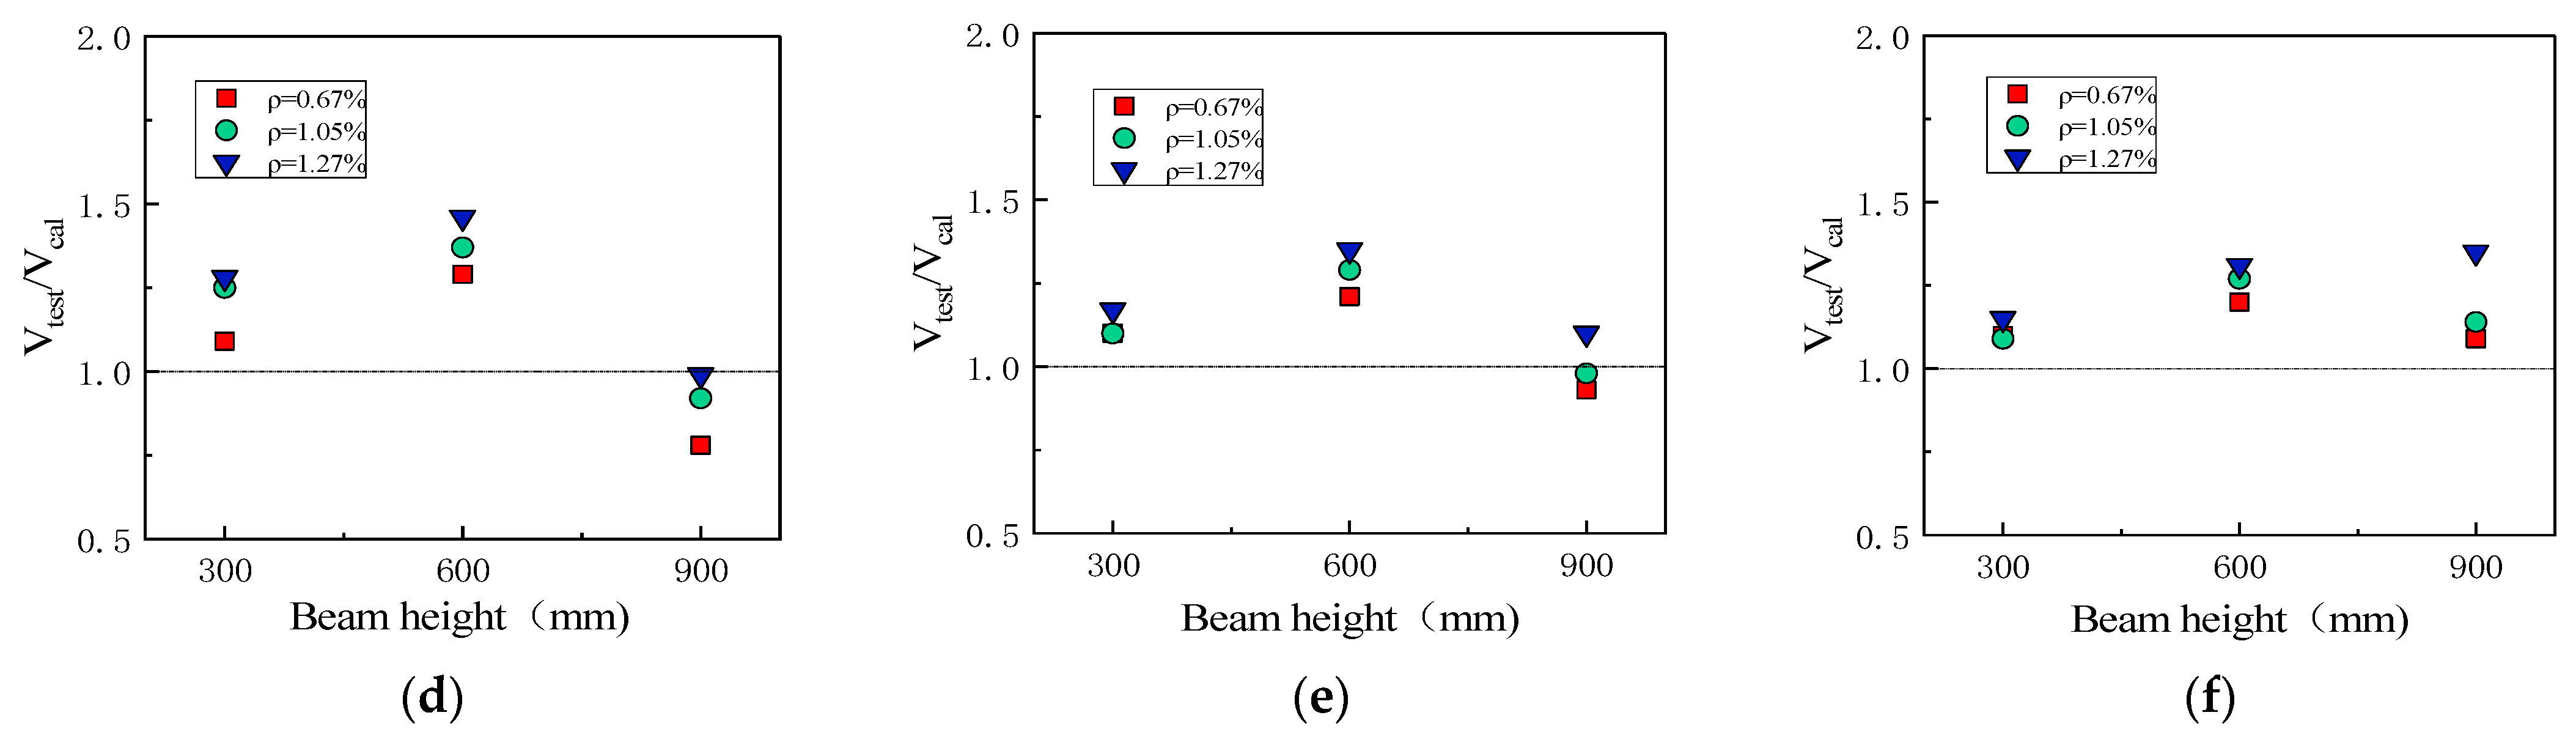
The SSSTM with the equivalent area of longitudinal reinforcement is used to calculate the ultimate shear capacity of the S-DB and M-DB series deep beam components, while the modified model M-SSSTM is adopted for the L-DB series. The final results are shown in Table 10. Meanwhile, Table 10 and Figure 12 also show the predicted results of the shear capacity of the tested deep beams, using ACI318-19, EC2, and CSA A23.3-19 [1,2,3,16,17], along with other relevant national codes and calculation models, which are compared within the test results in this study.
According to Figure 12, in the S-DB and M-DB, the EC2 is the most conservative code, followed by the CSA code, while the ACI provides a lower safety margin when calculating components with a beam height of 300 mm. The SSSTM is closer to the test value than the SSTM model, providing a better prediction. The modified M-SSSTM includes the equivalent area of longitudinal reinforcement when calculating the ultimate bearing capacity, which is more accurate than the national codes and the modified SSSTM, while exhibiting the least data scatter.
In the L-DB series, the predicted values of the three national codes are all within the safe range; and EC2 remains the most conservative, followed by the CSA code, while the ACI is the closest to the test value. The predicted values of the SSTM model for the deep beams with a 900 mm beam height are all higher than the test values, and the average value of V t e s t / V c a l is 0.897. When the longitudinal reinforcement ratio is 0.67% or 1.05%, the predicted values of the SSSTM are higher than the test values. However, when the longitudinal reinforcement ratio is 1.26%, the predicted value is slightly lower than the test value and the average value of V t e s t / V c a l   becomes 1.003. The predictions for full-scale reinforced-concrete deep beam components tend to be less conservative, highlighting the necessity of introducing a size-effect modification for such scale ranges. The calculated mean value of the modified M-SSSTM is 1.23, and the coefficient of variation is 0.087. Compared with the simplified-softened strut-and-tie model, the results calculated by the proposed model are within the safe range and closer to the test values. The proposed model integrates the strut-and-tie mechanism, considers the contributions of web reinforcement and longitudinal reinforcement as well as the influence of the size effect. It features a clear mechanical model concept and can more safely predict the shear capacity of full-scale deep beams, rendering it suitable for calculating the shear capacity of full-scale deep beam components.

4.5. Implications for Design and Model Applicability

The proposed model is developed based on a combined framework of database calibration and independent experimental validation. The size effect coefficient is calibrated using 572 test results, ensuring that the formulation captures the general trend of size-dependent behavior, while independent test results from nine specimens were used to verify the predictive capability of the model.
From a design perspective, neglecting the size effect may lead to overestimation of the shear capacity in large-scale members, whereas a simplified treatment of the reinforcement contribution may result in conservative predictions. By incorporating both the size effect and the longitudinal reinforcement contributions within a semi-empirical framework, the proposed model provides a more balanced estimation of the shear capacity. Specifically, the achieved average safety margin (predictive ratio of ~1.23) ensures high design reliability against sudden brittle shear failure, while avoiding extreme conservatism. This provides a robust and economically viable nominal strength basis before applying conventional strength reduction factors in engineering practice.
The model shows stable predictive capability across a wide range of structural sizes and reinforcement ratios, indicating its applicability to practical engineering problems, particularly for large-scale deep beams. Moreover, the formulation remains compatible with existing strut-and-tie approaches, facilitating its potential use in design practice.
However, several limitations should be noted. The current model does not explicitly consider certain factors, including the shear span-to-depth ratio, concrete strength variations, and transverse reinforcement, which may influence the shear behavior and require further investigation. Finally, these limitations of this study should be explicitly acknowledged. The experimental portion of this research serves strictly as a preliminary proof-of-concept validation rather than a comprehensive model verification. The sample size of nine newly tested specimens is relatively small and the research was limited to specific testing conditions. Considering the multitude of variables influencing deep beam shear capacity—such as concrete strength variations, shear span-to-depth ratios, web reinforcement ratios, diverse support conditions, and aggregate characteristics—the current experiments alone are insufficient to fully validate the proposed model. Therefore, to fully verify the generalized robustness of the M-SSSTM, broader future testing campaigns incorporating more variables and larger specimen populations are highly recommended. Additionally, regarding failure modes, the applicability of the proposed M-SSSTM is strictly bounded by shear-dominant mechanisms (i.e., diagonal strut crushing and tie yielding). The research did not intend to predict pure flexural failure, local bearing failure at the supports, or anchorage slip, which must be evaluated through separate standardized code provisions.

5. Conclusions

  • Based on the simplified-softened strut-and-tie model (SSSTM), this study introduces the contribution of longitudinal reinforcement through dowel action by modifying the effective area of the horizontal tie ( A t h ) in the horizontal load-transfer mechanism. Specifically, the equivalent effective area of longitudinal reinforcement is incorporated into the effective area of the horizontal tie A t h , resulting in a revised formulation that better reflects the actual shear transfer mechanism. Furthermore, considering the influence of the size effect, a fracture-mechanics-inspired semi-empirical shear capacity model is established for large-scale reinforced-concrete deep beams with h ≥ 800 mm. The predictions of the proposed model are compared with those from various design codes, as well as the SSTM and SSSTM frameworks. The results show that the proposed model provides a reasonable safety margin and yields predictions that are closer to experimental values than existing typical models, indicating improved accuracy and reliability.
  • To investigate the shear behavior and the size effect, a total of nine high-strength reinforced-concrete deep beams were tested, including small size (S-DB), medium size (M-DB), and large size (L-DB) specimens. The experimental results demonstrate a clear size-dependent trend in the shear capacity. When the beam height was increased from 300 mm to 600 mm, the ultimate nominal shear strength decreased by 12.78–23.72%, while a further increase to 900 mm resulted in a reduction of 31.47–49.78%. This reduction can be attributed to the development and localization of diagonal cracks, which weaken the integrity of the compression strut and reduce the effective shear transfer capacity. These observations provide direct experimental evidence supporting the incorporation of the size effect into the proposed model.
In addition, the influence of the longitudinal reinforcement was systematically examined by adopting reinforcement ratios of 0.67%, 1.05%, and 1.27% for each group of specimens. The results indicate that increasing the longitudinal reinforcement ratio significantly enhances the ultimate shear capacity of the deep beams. When the reinforcement ratio increased from 0.67% to 1.05%, the ultimate load increased by 11.06–21.51%, while an increase from 0.67% to 1.27% led to an improvement of 23.01–45.01%. This enhancement is mainly attributed to the increased dowel action of the longitudinal bars across inclined cracks, which provides an additional shear transfer mechanism and improves the overall load-carrying capacity. Therefore, the contribution of longitudinal reinforcement should be explicitly considered in shear capacity prediction models. Finally, it must be acknowledged that the nine tested specimens serve strictly as a preliminary proof-of-concept validation. To fully establish the generalization capability of the model across the wide range of variables influencing deep beam shear behavior—including variations in concrete strength, shear span ratios, web reinforcement ratios, and diverse support conditions—broader future experimental campaigns are highly recommended. Furthermore, its applicability remains uncertain for beams with unusual reinforcement configurations or severe pre-existing damage where localized interface degradation dictates the behavior.

Author Contributions

Conceptualization, Z.W.; Data curation, K.W.; Formal analysis, Z.W. and K.W.; Funding acquisition, W.X.; Investigation, K.W.; Validation, H.L.; Writing—original draft, Z.W. and H.L.; Writing—review and editing, Z.W. and H.L. All authors have read and agreed to the published version of the manuscript.

Funding

2024 Annual Kaifeng Municipal Science and Technology Development Plan Project, no. 2403105. Henan Provincial Key Science and Technology Project, no: 252102240135.

Institutional Review Board Statement

Not applicable.

Informed Consent Statement

Not applicable.

Data Availability Statement

All the data used in the manuscript is provided, or accessible in the cited works.

Conflicts of Interest

The authors declare no conflicts of interest.

References

  1. American Concrete Institute. ACI Committee 318: Building Code Requirement for Structure Concrete (ACI 318–19) and Commentary; American Concrete Institute: Farmington Hills, MI, USA, 2021. [Google Scholar]
  2. The European Standard EN 1992–1–1:2004; Eurocode 2, Design of Concrete Structures. British Standards Institution: Brussels, Belgium, 2004.
  3. CSA A23.3–19; Design of Concrete Structures. Canadian Standards Association: Mississauga, ON, Canada, 2019.
  4. Wu, T.; Wei, H.; Liu, X. Experimental investigation of shear models for lightweight aggregate concrete deep beams. Adv. Struct. Eng. 2018, 21, 109–124. [Google Scholar] [CrossRef]
  5. Li, S.S.; Zheng, J.Y.; Zhang, J.H.; Li, H.M.; Guo, G.Q.; Chen, A.J.; Xie, W. Experimental Investigation on Shear Capacity of Steel-Fiber-Reinforced High-Strength Concrete Corbels. Materials 2023, 16, 3055. [Google Scholar] [CrossRef] [PubMed]
  6. Jin, L.; Song, B.; Zhang, J.; Du, X. Experimental and analytical investigation of the influence of horizontal and vertical web reinforcement on shear failure and size effect in FRP-reinforced concrete deep beams. Eng. Struct. 2026, 350, 121938. [Google Scholar] [CrossRef]
  7. Kani, G.N.J. How safe are our large reinforced concrete beams? ACI J. Proc. 1967, 64, 128–141. [Google Scholar] [CrossRef] [PubMed]
  8. Walraven, J.; Lehwalter, N. Size effects in short beams loaded in shear. ACI Struct. J. 1994, 91, 585–593. [Google Scholar] [CrossRef]
  9. Tan, K.H.; Kong, F.K.; Teng, S. High strength concrete deep beams with effective sp an and shear span variations. ACI Struct. J. 1995, 92, 395–405. [Google Scholar]
  10. Tan, K.H.; Lu, H.Y. Shear behavior of large reinforced concrete deep beam and code comparisons. ACI Struct. J. 1999, 96, 836–845. [Google Scholar] [CrossRef]
  11. Matsuo, M.; Lertsrisakulrat, T.; Yanagawa, A. Shear behavior in RC deep beams with stirrups. Trans. Jpn. Concr. Inst. 2002, 23, 385–390. [Google Scholar]
  12. Zhang, N.; Tan, K.H. Size effect in RC deep beams: Experimental investigation and STM verification. Eng. Struct. 2007, 29, 3241–3254. [Google Scholar] [CrossRef]
  13. Birrcher, D.B.; Tuchscherer, R.G.; Huizinga, M. Depth effect in deep beams. ACI Struct. J. 2014, 111, 731–740. [Google Scholar] [CrossRef]
  14. Tang, C.Y.; Tan, K.H. Interactive mechanical model for shear strength of deep beams. J. Struct. Eng. 2004, 130, 1534–1544. [Google Scholar] [CrossRef]
  15. Tan, K.H.; Cheng, G.H. Size effect on shear strength of deep beams: Investigating with strut-and-tie model. J. Struct. Eng. 2006, 132, 673–685. [Google Scholar] [CrossRef]
  16. Yang, K.H.; Ashour, A.F. Strut-and-tie model based on crack band theory for deep beams. J. Struct. Eng. 2002, 137, 1030–1038. [Google Scholar] [CrossRef]
  17. Hwang, S.J.; Lu, W.Y.; Lee, H.J. Shear strength predication for deep beams. ACI Struct. J. 2000, 97, 367–376. [Google Scholar]
  18. Lu, W.Y.; Lin, J.; Yu, H.W. Shear strength of reinforced concrete deep beams. ACI Struct. J. 2013, 110, 671–680. [Google Scholar] [CrossRef]
  19. Garay, J.D.; Lu, A.S. Behavior of concrete deep beams with high strength reinforcement. In Structures Congress 2008: Crossing Borders; ASCE: Reston, VA, USA, 2008. [Google Scholar]
  20. Taylor, H.P.J. Investigation of forces carried across cracks in reinforced concrete beams by interlock of aggregates. Cracking 1970. [Google Scholar]
  21. Chen, H.; Yi, J.W.; Hwang, B. Research on shear capacity of continuous deep bending members based on Database. J. Build. Struct. 2016, 37, 273–283. [Google Scholar]
  22. Chen, H.; Yi, W.J.; Hwang, H.J. Cracking strut-and-tie model for shear strength evaluation of reinforced concrete deep beams. Eng. Struct. 2018, 163, 396–408. [Google Scholar] [CrossRef]
  23. Yang, K.H.; Chung, H.S.; Ashour, A.F. Influence of shear reinforcement on reinforce concrete continuous deep beams. ACI Struct. J. 2007, 104, 420–429. [Google Scholar] [CrossRef]
  24. Liu, X.; Wu, T.; Wei, H. Shear strength model for high-strength lightweight aggregate concrete deep flexural members. Eng. Mech. 2015, 32, 108–116. [Google Scholar]
  25. Moody, K.G.; Viest, I.M.; Elstner, R.C. Shear strength of reinforced concrete beams part 1 tests of simple beams. ACI J. Proc. 1954, 51, 317–332. [Google Scholar] [CrossRef]
  26. Mathey, R.G.; Watstein, D. Shear strength of beams without web reinforcement containing deformed bars of different yield strengths. ACI J. Proc. 1963, 60, 183–208. [Google Scholar] [CrossRef]
  27. Ramakrishnan, V.; Ananthanarayana, Y. Ultimate strength of deep beams in shear. ACI Struct. J. 1968, 65, 87–98. [Google Scholar]
  28. Kong, F.; Robins, P.J.; Cole, D.F. Web reinforcement effects on deep beams. ACI Struct. J. 1970, 67, 1010–1017. [Google Scholar]
  29. Smith, K.N.; Vantsiotis, A.C. Shear strength of deep beams. ACI Struct. J. 1982, 79, 201–213. [Google Scholar]
  30. Lee, D. An Experimental Investigation in the Effects of Detailing on the Shear Behavior of Deep Beams. Master’s Thesis, University of Toronto, Toronto, ON, Canada, 1982. [Google Scholar]
  31. Subedi, N.; Vardy, A.E.; Kubotat, N. Reinforced concrete deep beams some test results. Dep. Civ. Eng. 1986, 4, 206–219. [Google Scholar] [CrossRef]
  32. Rogowsky, D.M.; MacGregor, J.G. Tests of reinforced concrete deep beams. ACI J. Proc. 1986, 83, 614–623. [Google Scholar] [CrossRef] [PubMed]
  33. Subedi, N.K. Reinforced concrete deep beam: A method of analysis. Struct. Eng. 1988, 85, 1–30. [Google Scholar] [CrossRef]
  34. Fang, J.W. Experimental study on shear strength of Reinforced Concrete Deep Beams. J. Shijiazhuang Railw. Inst. 1990, 3, 15–24. (In Chinese) [Google Scholar]
  35. Shin, S.W.; Lee, K.S.; Moon, J.L. Shear strength of reinforced high-strength concrete beams with shear span-to-depth ratios between 1.5 and 2.5. ACI Struct. J. 1999, 96, 549–556. [Google Scholar]
  36. Liu, L.X.; Xie, L.L.; Chen, M. Study on shear behavior of reinforced concrete deep bending members. J. Build. Struct. 2000, 30, 19–28. (In Chinese) [Google Scholar]
  37. Adebar, P. One way shear strength of large footings. Can. J. Civ. Eng. 2000, 27, 553–562. [Google Scholar] [CrossRef]
  38. Rigotti, M. Diagonal Cracking in Reinforced Concrete Deep Beams an Experimental Investigation. Master’s Thesis, Concordia University, Montreal, QC, Canada, 2002. [Google Scholar]
  39. Yang, K.H.; Chung, H.S.; Lee, E.T. Shear characteristics of high-strength concrete deep beams without shear reinforcements. Eng. Struct. 2003, 25, 1343–1352. [Google Scholar] [CrossRef]
  40. Tan, K.H.; Cheng, G.H.; Cheong, H.K. Size effect in shear strength of large beams-behavior and finite element modeling. Mag. Concr. Res. 2005, 57, 497–509. [Google Scholar] [CrossRef]
  41. Yukihiro, T.; Tsutomu, S. Evaluation of shear strength of deep beams with stirrups. Q. Rep. RTRI 2005, 46, 53–58. [Google Scholar] [CrossRef]
  42. Salamy, M.R.; Kobayashi, H.; Unjoh, S. Experimental and analytical study on RC deep beams. Asian J. Civ. Eng. 2005, 104, 409–422. [Google Scholar]
  43. Quintero, F.C.G.; Parra, M.G.; Wight, J.K. Strength of struts in deep concrete members designed using strut-and-tie method. ACI Struct. J. 2006, 103, 577–586. [Google Scholar]
  44. Lin, H. The Effect of the Arrangement of Longitudinal Bars on the Shear Behavior of Reinforced Concrete Beams with a Shear Span Ratio of 1.5. Master’s Thesis, Chongqing University, Chongqing, China, 2006. (In Chinese) [Google Scholar]
  45. Tan, K.H.; Cheng, G.H.; Zhang, N. Experiment to mitigate size effect on deep beams. Mag. Concr. Res. 2007, 60, 709–723. [Google Scholar] [CrossRef]
  46. Brown, M.D.; Bayrak, O. Investigation of deep beams with various load configurations. ACI Struct. J. 2007, 104, 61l–620. [Google Scholar] [CrossRef]
  47. Praveen, N.; Pillai, T.M.M. Analysis and design of simply supported deep beams using strut and tie method. Adv. Struct. Eng. 2008, 11, 491–499. [Google Scholar] [CrossRef]
  48. Brena, S.F.; Roy, N.C. Evaluation of load transfer and strut strength of deep beams with short longitudinal bar anchorages. ACI Struct. J. 2009, 106, 678–689. [Google Scholar] [CrossRef]
  49. Birrcher, D.; Tuchscherer, R.; Huizinga, M. Depth effect in reinforced concrete deep beams. Struct. Congr. 2009, 1595–1603. [Google Scholar]
  50. Zhang, N.; Tan, K.H.; Leong, C.L. Single-span deep beams subjected to unsymmetrical loads. J. Struct. Eng. 2009, 135, 239–252. [Google Scholar] [CrossRef]
  51. Sagaseta, J.; Vollum, R.L. Shear design of short-span beams. Mag. Concr. Res. 2010, 62, 267–282. [Google Scholar] [CrossRef]
  52. Yang, K.H. Tests on lightweight concrete deep beams. ACI Struct. J. 2010, 107, 663–670. [Google Scholar] [CrossRef]
  53. Lin, Y. Experimental Study and Finite Element Analysis of Reinforced Concrete Simply Supported Deep Beam. Master’s Thesis, Hunan University, Changsha, China, 2011. (In Chinese) [Google Scholar]
  54. Mohammad, M.; Jumaat, M.Z.B.; Chemrouk, M. An experimental investigation of the stress-strain distribution in high strength concrete deep beams. Procedia Eng. 2011, 14, 2141–2150. [Google Scholar] [CrossRef][Green Version]
  55. Mihaylov, B.I.; Bentz, E.C.; Collins, M.P. Behavior of large deep beams subjected to monotonic and reversed cyclic shear. ACI Struct. J. 2010, 107, 726–734. [Google Scholar] [CrossRef]
  56. Liu, L.Q.; Wang, J.J.; Han, J.Y. Experimental study on static behavior of reinforced concrete simply supported deep beam and analysis of compression tie model. J. Build. Struct. 2013, 34, 137–141. (In Chinese) [Google Scholar]
  57. Amornpinnyo, P.; Teerawong, J. Shear Behavior of Reinforced Concrete Deep Beams with Various Horizontal to Vertical Reinforcements and Shear Span-to-Effective Depth Ratios. Adv. Mater. Res. 2014, 931, 473–477. [Google Scholar]
  58. Li, Y. Experimental Study on Size Effect of Shear Capacity of Concrete Deep Beams Without Web Reinforcement. Master’s Thesis, Hunan University, Changsha, China, 2016. (In Chinese) [Google Scholar]
  59. Ahmed, K.; El, S.A.K.; El, S. Size effect on shear resistance of high strength concrete deep beams. Mater. Struct. 2016, 49, 1871–1882. [Google Scholar]
  60. Ismail, K.B. Shear Behavior of Reinforced Concrete Deep Beams. Ph.D. Thesis, The University of Sheffield, Sheffield, UK, 2016. [Google Scholar]
  61. Zhang, H.Z.; Xu, W.T.; Jiang, Z. Experimental study on topology optimization design method of Reinforced Concrete Simply Supported Deep Beams. J. Civ. Environ. Eng. 2021, 43, 91–98. (In Chinese) [Google Scholar]
  62. Vanny, L.; Nakarai, K.; Saifullah, H.A. Experimental investigation of loading rate effects on the shear capacity of reinforced concrete deep beams. Innov. Sustain. Infrastruct. 2019, 573–578. [Google Scholar]
  63. Zhang, J.; Li, S.; Xie, W. Experimental study on shear capacity of high strength reinforcement concrete deep beams with small shear span-depth ratio. Materials 2020, 13, 1218. [Google Scholar] [CrossRef]
  64. GB50010–2010; Design Code for Concrete Structures. China Construction Industry Press: Beijing, China, 2010.
  65. Ilyas, S. The Numerical Simulation of Disturbed Region Corbels Containing Sustainable Concrete. Arab. J. Sci. Eng. 2023, 48, 5061–5086. [Google Scholar]
  66. Ilyas, S. Structural Optimization Behavior of Green Concrete Members. Arab. J. Sci. Eng. 2022, 47, 5033–5051. [Google Scholar] [CrossRef]
  67. Bažant, Z.P.; Xiang, Y.X. Size effect in compression fracture: Splitting crack band propagation. J. Eng. Mech. 1997, 123, 162–172. [Google Scholar] [CrossRef]
  68. Kim, J.K.; Yi, S.T.; Park, C.K. Size effect on compressive strength of plain and spirally reinforced concrete cylinders. ACI Struct. J. 1999, 96, 88–94. [Google Scholar] [CrossRef] [PubMed]
  69. Senturk, A.E.; Hieggins, C. Evaluation of Reinforced Concrete Deck Girder Bridge Bent Caps with 1950s Vintage Details: Laboratory Tests. ACI Struct. J. 2010, 107, 534–543. [Google Scholar] [CrossRef]
  70. GB/T50152-2012; Standard for Test Method of Concrete Structures. China Architecture & Building Press: Beijing, China, 2012.
  71. GB/T50081-2002; Standard for Test Methods of Mechanical Properties of Ordinary Concrete. China Architecture & Building Press: Beijing, China, 2002.
Figure 1. Composition of force transmission mechanism of softened strut-and-tie model: (a) Diagonal mechanism; (b) Horizontal mechanism; (c) Vertical mechanism.
Buildings 16 02258 g001
Figure 2. SSSTM solution’s flow chart.
Buildings 16 02258 g002
Figure 3. Comparison between test values and calculated values of deep beam components.
Buildings 16 02258 g003
Figure 4. Deep beam shear coefficient with the size effect.
Buildings 16 02258 g004
Figure 5. Comparative analysis of calculation results.
Buildings 16 02258 g005
Figure 6. Specimens’ structures and reinforcements: (a) S-DB-1.07-1, S-DB-1.07-2, S-DB-1.07-3; (b) M-DB-1.07-1, M-DB-1.07-2, M-DB-1.07-3; (c) L-DB-1.07-1, L-DB-1.07-2, L-DB-1.07-3.
Buildings 16 02258 g006
Figure 7. Materials’ mechanical property tests: (a) compression test of the concrete cube; (b) tensile test of the reinforcement.
Buildings 16 02258 g007
Figure 8. Diagram of test loading equipment. (a) Schematic diagram of loading setup; (b) Photograph of the actual loading test.
Buildings 16 02258 g008
Figure 9. Failure morphology of S-DB-1.06-2 specimen: (a) failure patterns; (b) fracture geometry.
Buildings 16 02258 g009
Figure 10. Nominal strength of test specimen.
Buildings 16 02258 g010
Figure 11. Relationship between longitudinal reinforcement ratios and loads.
Buildings 16 02258 g011
Figure 12. Comparisons of predicted values and test values of different national codes and calculation models: (a) American code ACI 318-19; (b) European code EC2; (c) Canadian code CSA A23.3-19; (d) Softened strut-and-tie SSSTM; (e) Simplified/Softened strut-and-tie SSTM; (f) Modified model.
Buildings 16 02258 g012aBuildings 16 02258 g012b
Table 1. Statistical analysis of the predicted values of the data set.
Horizontal mechanismTotal rows of horizontal web reinforcement1 2 3 4 5 6 7 8
Effective rows of horizontal web reinforcement1 2 2 3 4 5 5 6
Total rows of longitudinal reinforcement1 2 3 4 5 6
Effective rows of longitudinal reinforcement1 1 2 2 3 3
Table 2. Effective cross-sectional area of vertical tie.
Vertical mechanismTotal rows of vertically distributed reinforcement1 2 3 4 5 6 7 8 9
Effective rows of vertically distributed reinforcement1 2 3 3 4 5 5 6 6
Table 3. Summary of deep beam shear test data.
LiteratureNumberHeight h (mm)Shear Span Ratio λ Yield Strength of Longitudinal Reinforcement f y (MPa)Shear Bearing Capacity V (kN)
Moody et al. [25]14609.61.52302~315267.6~507.1
Mathey et al. [26]16457.21.51267~698179.5–312.9
Ramakrishnan et al. [27]13381–7620.30–0.9831755.8–189.2
Kong et al. [28]29254–7620.35–1.1828778–308
Smith et al. [29]523561.0–2.0843174–184
Lee et al. [30]410001.55–1.78498967.5–840.0
Subedi et al. [31]6450–8500.42–1.53303~493149.5–485.0
Rogowsky et al. [32]5500–10001.05–2.20380~455226–750
Subedi [33]5500–9000.31–1.53484~493175.0–797.5
Fang [34]5450–5000.75–0.84333434.0–472.0
Walraven et al. [8]25200–10001420165–665
Tan et al. [9]185000.27–2.16504.8150–675
Tan et al. [10]12500–17500.5–1.1520435–1636
Shin et al. [35]302501.5–2.541482.3–287.1
Liu et al. [36]11400–5000.5–3.0350138.9–431.0
Adebar [37]610901.42–2.2440330.0–771.0
Rigotti [38]123561.87–2.6644076–248
Yang et al. [39]21400–10000.53–1.08577~844192.1–1029.0
Tan et al. [40]4444–17501.69609~616340–690
Yukihiro et al. [41]494500.50–2.00458~750284–1958
Salamy et al. [42]19475–15050.5–1.5372~388351.5–4198.0
Quintero et al. [43]124600.82–1.57427~462196–484
Lin et al. [44]115001.5365~395185–520
Zhang et al. [12]12350–10001.1469~53485.0–672.0
Tan et al. [45]8500–17500.85534~547332.0–1305.0
Brown et al. [46]27621.11469352–410
Garay et al. [19]6501–6071.19–2.388801154–2747
Praveen et al. [47]53500.57–0.86425~430124–150
Brena et al. [48]9356–6351.0–2.0414149–371
Birrcher et al. [49]319051.20–2.50413.72269–5440
Zhang et al. [50]14500–6000.57–2.28484~495207.3–458.1
Sagaseta et al. [51]65001.51580326–602
Yang et al. [52]16400–10000.5–1.0541~720209.0–433.5
Lin et al. [53]4600–6800.46–1.06383~542620–920
Mohammad et al. [54]45000.85–0.88551~619306–550
Gedik et al. [55]83000.5–2.0372.265–232
Lu et al. [18]1610000.61–0.834391156–2018
Liu et al. [56]84000.8–1.4380406.6–634.6
Amornpinnyo et al. [57]64501.5–2.0353~621356.0–559.4
Birrcher et al. [13]12584–19051.20–2.5469~5031326.1–5442.3
Li et al. [58]8200–16002540.8340–1673
Ahmed et al. [59]12350–10001485407.0–1620
Ismail et al. [60]214000.91–1.67364~557292–920
Zhang et al. [61]26000.53409~448480.0–640.0
Vanny et al. [62]33201457515.29–571.87
Zhang et al. [63]86000.3–0.9670750.0–1100.0
The database was compiled from the published experimental studies covering a wide range of geometrical and material parameters. Data with incomplete information or inconsistent test conditions was excluded to ensure reliability.
Table 4. Comparisons of test data.
LiteratureBeam Height h (mm)Vtest/Vcal (SSSTM)Vtest/Vcal (M-SSSTM)
Tan et al. [9]1000~17500.82~1.020.99~1.16
Yang et al. [39]10000.75~0.810.90~0.97
Tan et al. [10]1000~17500.70~0.850.88~1.00
Tan et al. [45]1000~17500.84~0.901.01~1.07
Zhang et al. [12]10000.85~0.881.01~1.05
Lu et al. [18]10000.99~1.271.28~1.46
Adebar et al. [37]10900.67~1.150.93~1.40
Li Ye [58]800~16000.79~1.100.95~1.34
Rogowsky et al. [32]10000.89~1.041.06~1.24
Lee [30]14000.99~1.111.19~1.33
Salamy et al. [42]905~10500.67~0.970.83~1.16
Birrcher et al. [49]19050.69~1.050.88~1.30
Subedi et al. [31]9000.57~0.900.75~1.03
Walraven et al. [8]800~10000.64~0.930.67~1.10
Mihaylov et al. [55]12000.55~1.210.75~1.51
Senturk et al. [69]1828.80.97~1.211.21~1.59
Table 5. Design parameters of deep beams.
Test Specimen No.l × b × h (mm)h0 (mm)Longitudinal Reinforcement Ratio ρ (%)Stirrup Reinforcement Ratio ρsv (%)Horizontal Web Reinforcement Ratio ρsh (%)
S-DB-0.67-11000 × 200 × 3002570.670.330.33
S-DB-1.05-21000 × 200 × 3002571.050.330.33
S-DB-1.27-31000 × 200 × 3002571.270.330.33
M-DB-0.67-11600 × 200 × 6005320.670.330.33
M-DB-1.05-21600 × 200 × 6005321.050.330.33
M-DB-1.27-31600 × 200 × 6005321.270.330.33
L-DB-0.67-12200 × 200 × 9008070.670.330.33
L-DB-1.05-22200 × 200 × 9008071.050.330.33
L-DB-1.27-32200 × 200 × 9008071.270.330.33
Table 6. C50 concrete’s material properties.
fcu (MPa)fc (MPa)ft (MPa)Ec (GPa)
59.842.93.7534.6
fcu: cube compressive strength of concrete. fc: prism compressive strength of concrete. ft: tensile strength of concrete. Ec: elastic modulus of concrete.
Table 7. Mechanical properties of reinforcements.
Reinforcement TypeDiameter d (mm)fy (MPa)fu (MPa)Es (GPa)
HRB60016670865198.5
HRB60020653.7823.3196.6
HRB60022630800195.8
HRB400e8456.8647.7205.3
fy: specified yield strength for reinforcement. fu: ultimate strength for reinforcement. Es: modulus of elasticity of reinforcement.
Table 8. Test results of deep beam components.
Test Specimen No. V c r N   ( kN ) V c r D   ( kN ) V u   ( kN ) V c r N / V u V c r D / V u δ   ( m m ) Failure ModeFailure Mechanism
S-DB-0.67-19010047319.02%21.14%2.69Diagonal-
compression
Strut crushing
S-DB-1.05-210015050020.00%30%2.19Diagonal-
compression
Strut crushing
S-DB-1.27-3109165553.819.68%29.7%1.85Diagonal-
compression
Strut crushing
M-DB-0.67-113929975018.53%39.87%3.12Diagonal-
compression
Strut crushing
M-DB-1.05-2138188903.515.27%20.18%4.00Diagonal-
compression
Strut crushing
M-DB-1.27-3149184993.714.99%18.52%3.82Diagonal-
compression
Strut crushing
L-DB-0.67-125035082330.38%42.53%4.44Diagonal-
compression
Strut crushing
L-DB-1.05-2250449100025%44.90%4.66Diagonal-
compression
Strut crushing
L-DB-1.27-31953501193.516.34%29.33%4.60Diagonal-
compression
Strut crushing
  V c r N   :the cracking load of the normal section, which is defined as the load when the first vertical flexible crack occurs. V c r D : the diagonal cracking load, which is defined as the load when the first diagonal crack occurs. V u : the ultimate load.
Table 9. Main test results of deep beam specimen.
Test Specimen No. V c r N   ( kN ) V c r N f t b h 0 V c r D   ( kN ) V c r D f t b h 0 V u   ( kN ) V u f c b h 0 V c r N / V u V c r D / V u
S-DB-0.67-1900.4671000.5194730.21519.02%21.14%
S-DB-1.05-21000.5191500.778500.000.22720%30%
S-DB-1.27-31090.5651650.856553.80.25119.68%29.7%
M-DB-0.67-11390.3482990.7497500.16418.53%39.87%
M-DB-1.05-21380.3461880.471903.500.19815.27%20.81%
M-DB-1.27-31490.3731840.461993.70.21814.99%18.52%
L-DB-0.67-12500.4133500.5788230.11930.38%42.53%
L-DB-1.05-22500.4134490.7421000.000.11425%44.90%
L-DB-1.27-31950.3223500.5781193.50.17216.34%29.33%
Table 10. Comparisons of predicted values and test values from the application of different national codes and recommended models.
Test Specimen No.Test Value V t e s t / V c a l
ACIEC2CSASSTMSSSTMM-SSSTM
S-DB-0.67-14731.0251.2081.1201.091.101.10
S-DB-1.05-25001.0611.2551.1721.251.101.09
S-DB-1.27-3553.81.1361.3781.2921.281.171.15
Average value 1.0741.2801.9471.2071.1231.10
Variation coefficient 0.0520.0680.0740.0860.0350.034
M-DB-0.67-17501.1821.5161.3671.291.211.20
M-DB-1.05-2903.51.4021.7981.6271.371.291.27
M-DB-1.27-3993.71.5301.9631.7791.461.351.31
Average value 1.3711.7591.5911.3731.2831.26
Variation coefficient 0.1280.1280.1310.0610.0550.055
L-DB-0.67-18231.0801.3851.2390.780.931.09
L-DB-1.05-210001.2951.6611.4890.920.981.14
L-DB-1.27-31193.51.5351.9691.7670.991.101.35
Average value 1.3031.6721.4980.8971.0031.23
Variation coefficient 0.1750.1740.1760.1190.0870.087
Disclaimer/Publisher’s Note: The statements, opinions and data contained in all publications are solely those of the individual author(s) and contributor(s) and not of MDPI and/or the editor(s). MDPI and/or the editor(s) disclaim responsibility for any injury to people or property resulting from any ideas, methods, instructions or products referred to in the content.