Article

Local Instability and Optical-Serviceability Failure Mechanisms of Cold-Bent Triangular Tempered Glass Plates with Discrete Point Supports

School of Civil Engineering, Liaoning Technical University, Fuxin 123000, China
*
Author to whom correspondence should be addressed.
Buildings 2026, 16(11), 2176; https://doi.org/10.3390/buildings16112176
Submission received: 3 May 2026 / Revised: 22 May 2026 / Accepted: 25 May 2026 / Published: 29 May 2026
(This article belongs to the Special Issue Reliability and Risk Assessment of Building Structures)

Abstract

Cold bending provides a cost-effective method for fabricating triangular glass units for free-form architectural envelopes. Replacing conventional continuous edge constraints with discrete point clamps reduces over-constraint but introduces pronounced bending–membrane coupling in the unsupported spans between adjacent clamps. Consequently, the mechanisms governing local instability and optical-quality degradation remain insufficiently understood. In this study, cold-bending tests were performed on isosceles triangular fully toughened glass plates to measure out-of-plane deflection and surface-strain evolution. The experimental data were then used to establish and validate an Abaqus finite element model for systematic parametric analysis. Based on von Kármán’s large-deflection theory, a semi-empirical reduced-order framework that combines modal superposition with the response-surface method was developed to identify instability-sensitive configurations. The results show that, under weak constraints and large vertex angles, the panel response changes from a bending-dominated regime to a strongly nonlinear large-deflection regime governed by membrane effects; this transition is marked by a reversal of mid-span deflection and a compressive-to-tensile stress transition. Increasing the number of clamps from two to four substantially suppresses both global and local distortion by shortening the free spans and redistributing membrane strain energy, reducing peak mid-span deflection by 47–68%, and satisfying the EN 12150-1 limits for both bow deformation and local distortion. The height-to-base ratio is the dominant geometric parameter controlling instability. Under two-point support, a critical response turning point occurs at a height–base ratio of approximately 0.5 before the material fracture limit is reached, defining a geometric boundary below which optical serviceability failure accelerates. These findings provide a theoretical basis and quantitative engineering guidance for optimizing the cold-bending process of isosceles triangular fully toughened glass plates.

1. Introduction

Modern architectural forms have become increasingly dynamic, with the widespread use of complex free-form surfaces [1,2]. This trend imposes stringent requirements on the formability of cladding materials and on curtain-wall fabrication technologies [3,4,5]. Owing to its durability, mechanical performance, and transparency, glass has become a key material for modern free-form building envelopes [6,7]. Compared with conventional hot bending, cold bending enables glass panels to conform smoothly and accurately to curved surfaces at room temperature while reducing manufacturing costs. Cold bending has therefore become an important method for producing curved glass curtain walls [8,9,10,11]. Existing research on glass cold-bending processes and related theories has focused mainly on rectangular or quadrilateral panels. Galuppi et al. [12] found that diagonal buckling and curvature reversal occur when the displacement applied to the corners of rectangular glass plates reaches a critical value. Datsiou et al. [13] systematically evaluated the deformation behavior of square glass plates under different boundary conditions and demonstrated their susceptibility to buckling instability. Spagnoli et al. [14] clarified the linear relationship between glass thickness and critical displacement, examined the influence of geometric parameters on buckling modes, and highlighted the correlation between the cold-bending warping ratio and the resulting surface stresses. Quaglini et al. [15] investigated buckling in cold-bent vertical glass plates, identifying diagonal stiffening, snap-through risk under wind loading, and an optical-distortion-based evaluation method. Chen et al. [16] studied the anticlastic cold-bending stability of point-supported monolithic glass panels, revealing bifurcation instability and cold-bending distortion, and proposed load- and displacement-based formulas for predicting the critical instability state.
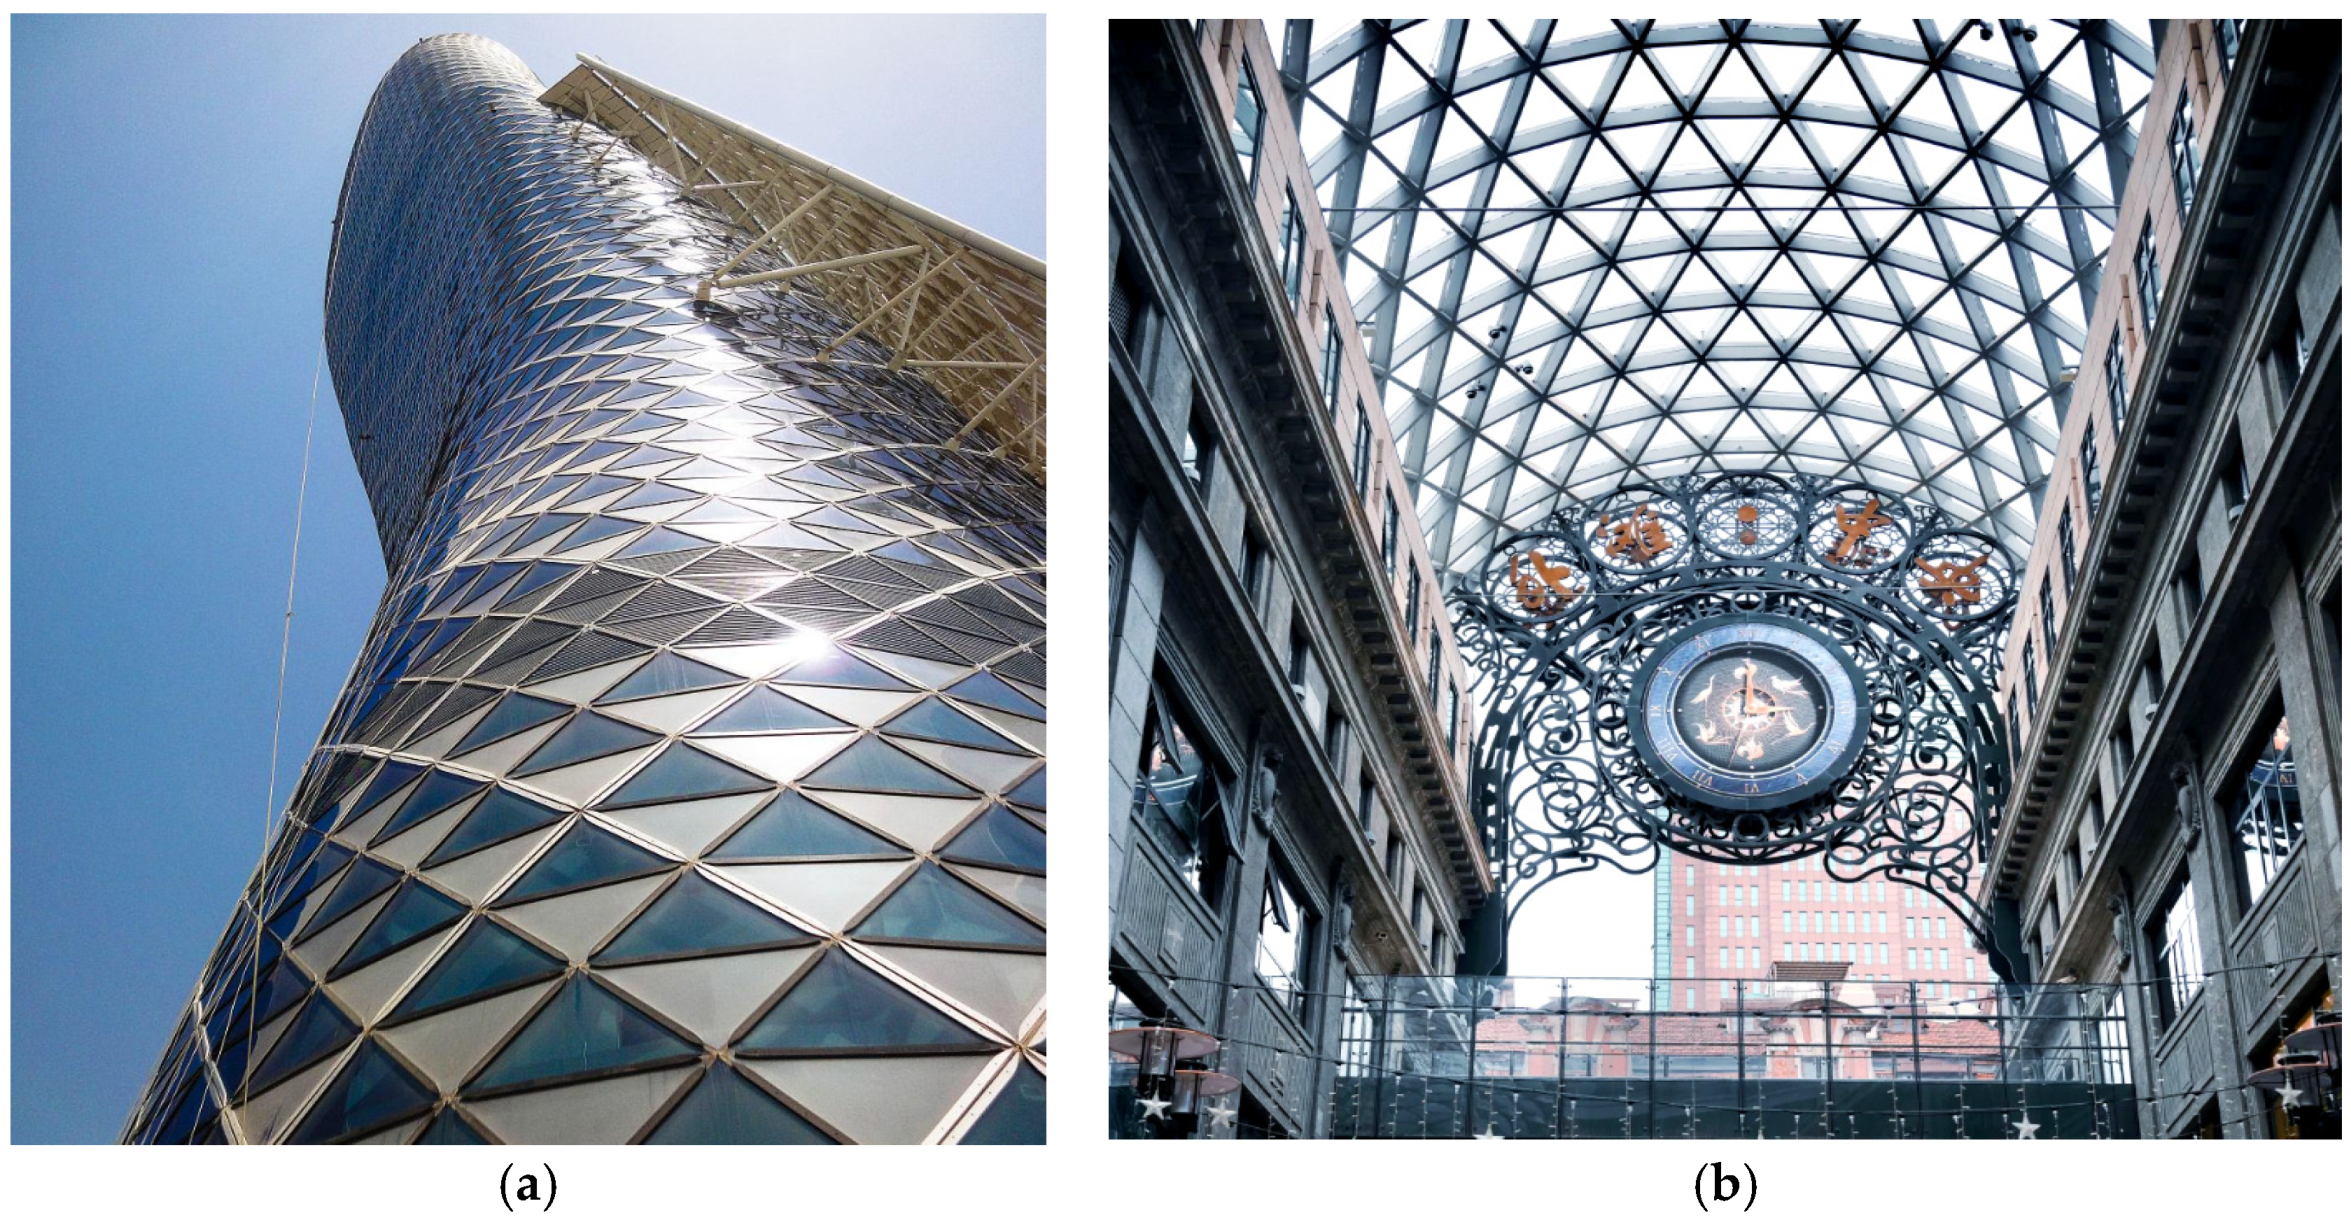
Because triangular meshes adapt well to complex topological surfaces, triangular glass panelization has been widely used in many large-scale modern engineering projects (Figure 1). Nevertheless, the cold bending of triangular glass panels presents distinct mechanical challenges. To lock a spatially curved shape into a planar triangular panel, conventional techniques generally impose continuous rigid clamps along all three edges [17,18]. For quasi-brittle materials such as tempered glass, such continuous, strong constraints place the panel in an over-constrained state. Small installation tolerances or thermally induced deformations are difficult for the support system to release, leading to stress concentrations near the clamped edges and increasing the risk of premature brittle fracture and seal failure [19]. To mitigate this problem, recent engineering practice has explored replacing continuous clamps with discrete point clamps arranged along one or two edges of the triangular panel, thereby providing localized in-plane degrees of freedom and reducing the overall constraint level [20]. However, this boundary release also changes the transfer path of in-plane membrane forces. During geometrically nonlinear large deflection, the quadratic terms of in-plane strain can intensify bending–membrane coupling in the free spans between supports, potentially triggering local instabilities and degrading optical quality [21].
Although the buckling, stress evolution, and optical distortion of rectangular or quadrilateral cold-bent glass plates have been systematically investigated [11,22,23,24], studies on cold-bent triangular glass under discrete point constraints remain limited. Compared with rectangular plates, triangular plates exhibit stronger geometric heterogeneity, which complicates boundary-constraint release and internal-force redistribution [25,26]. In particular, under discrete point supports, the free-span regions between adjacent supports are more susceptible to enhanced bending–membrane coupling, abrupt local curvature changes, and subsequent optical-quality degradation. Therefore, systematic experimental and theoretical evidence is still needed to determine whether discrete point supports can effectively preserve the optical quality of cold-bent triangular glass.
Accordingly, this study investigates the local instability and optical-quality failure mechanisms of cold-bent isosceles triangular tempered glass plates with discrete point supports. First, cold-bending tests were conducted on nine triangular tempered glass specimens to examine the effects of clamp number, vertex angle, and loading direction on deflection evolution and surface-stress redistribution. Second, an experimentally validated, three-dimensional, geometrically nonlinear finite element model was established, and parametric analyses were performed over a broader geometric parameter space to identify the key variables controlling local-instability sensitivity. Finally, using von Kármán’s large deflection plate theory as the theoretical basis, a reduced-order characterization framework was developed to describe the evolution of key morphological parameters and identify instability-sensitive configurations.

2. Experimental Program

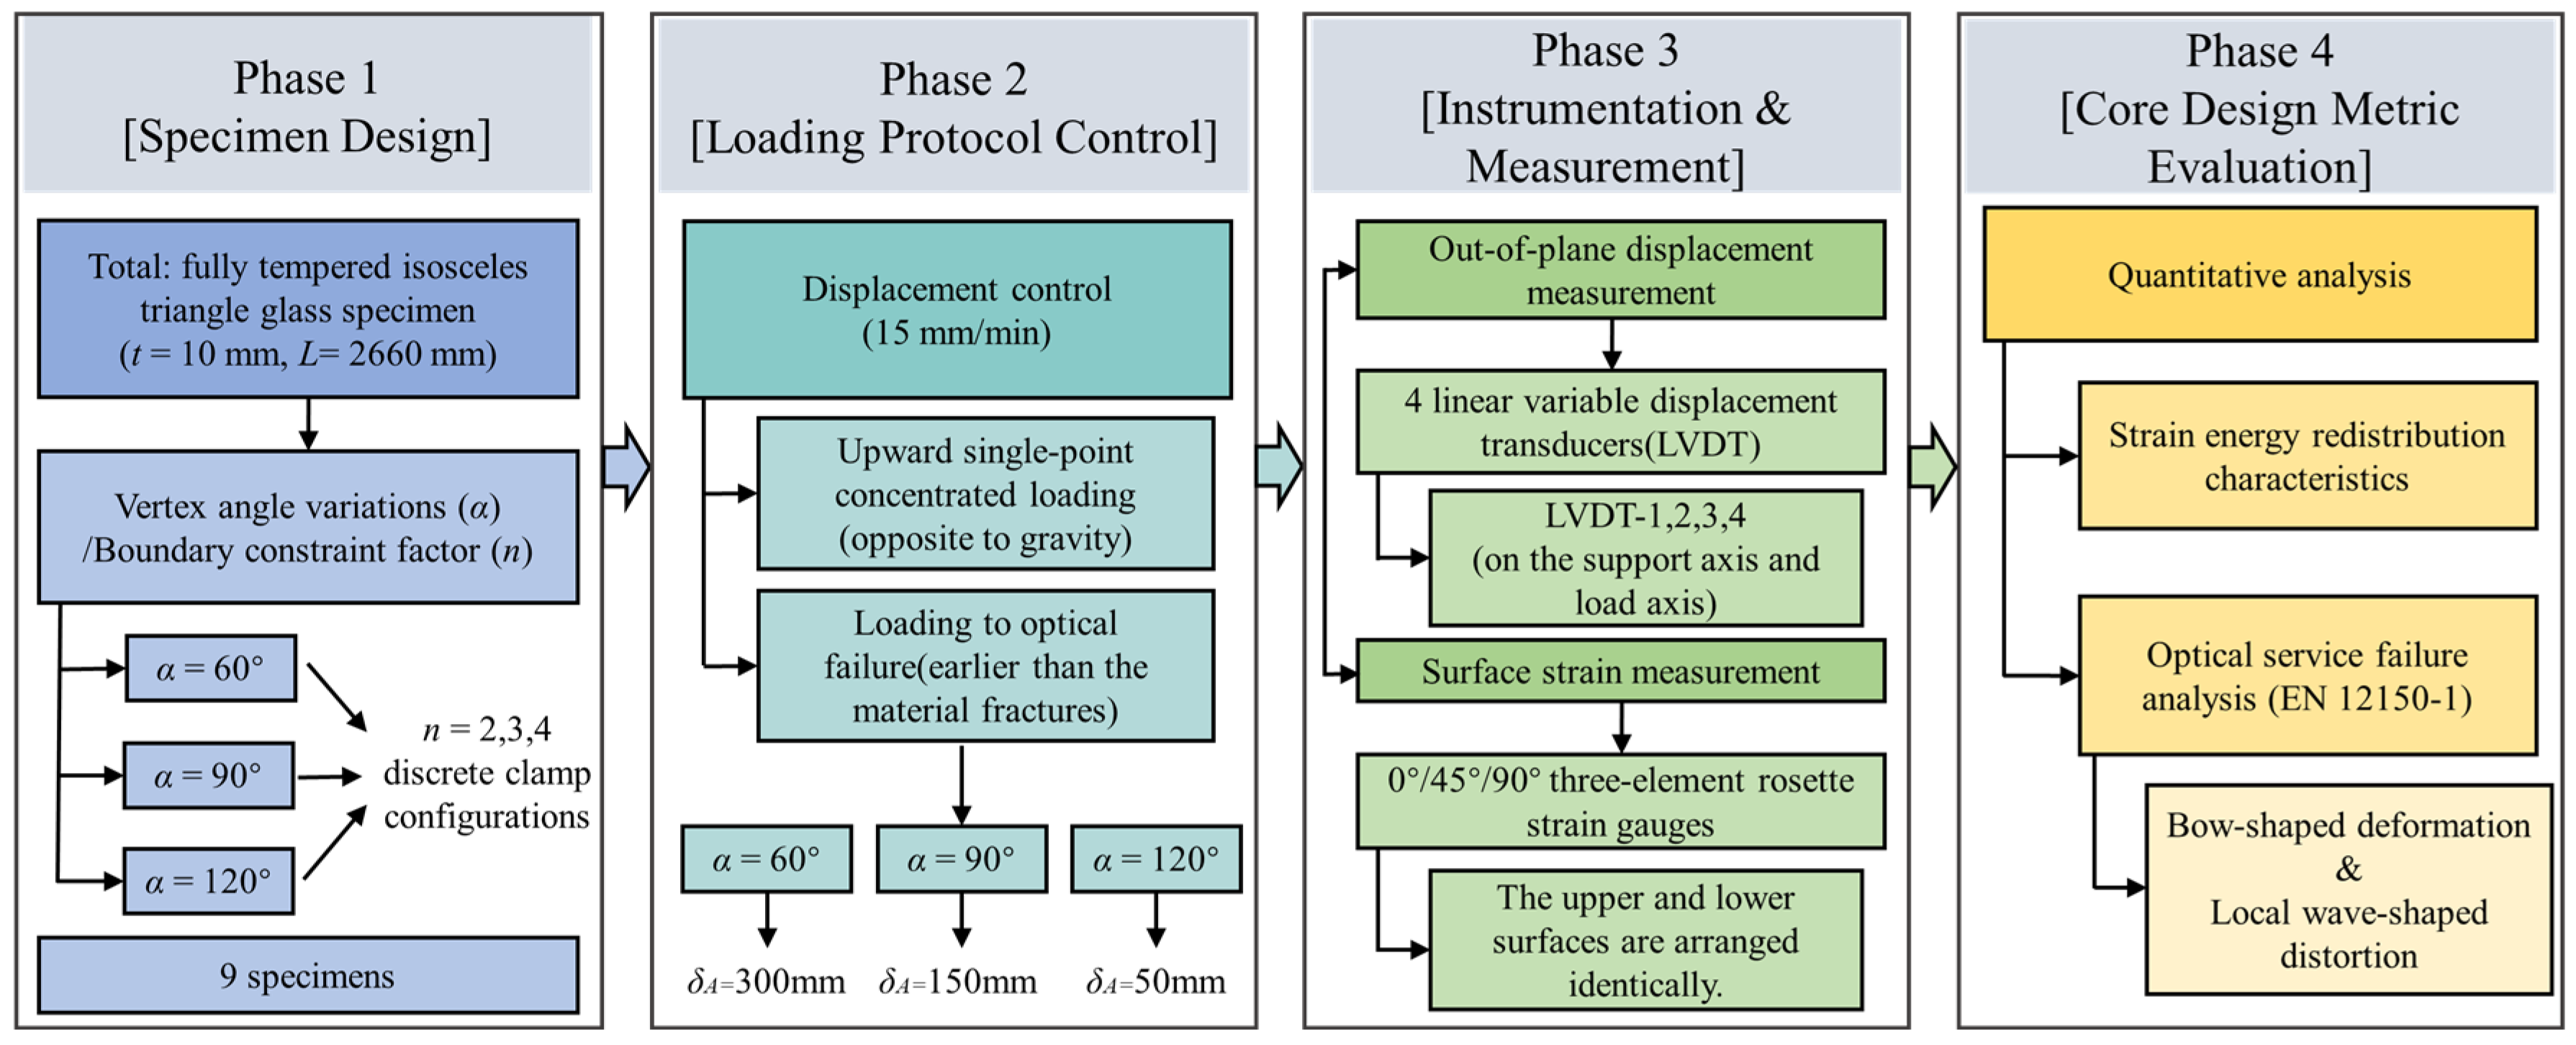
The experimental matrix, including specimen geometries, test variables, and key evaluation metrics, is summarized in the research flowchart shown in Figure 2. The flowchart lists the manufactured specimens, geometric parameters, variable factors, and core design-evaluation indicators, which are described in detail below.

2.1. Specimens and Support Configurations

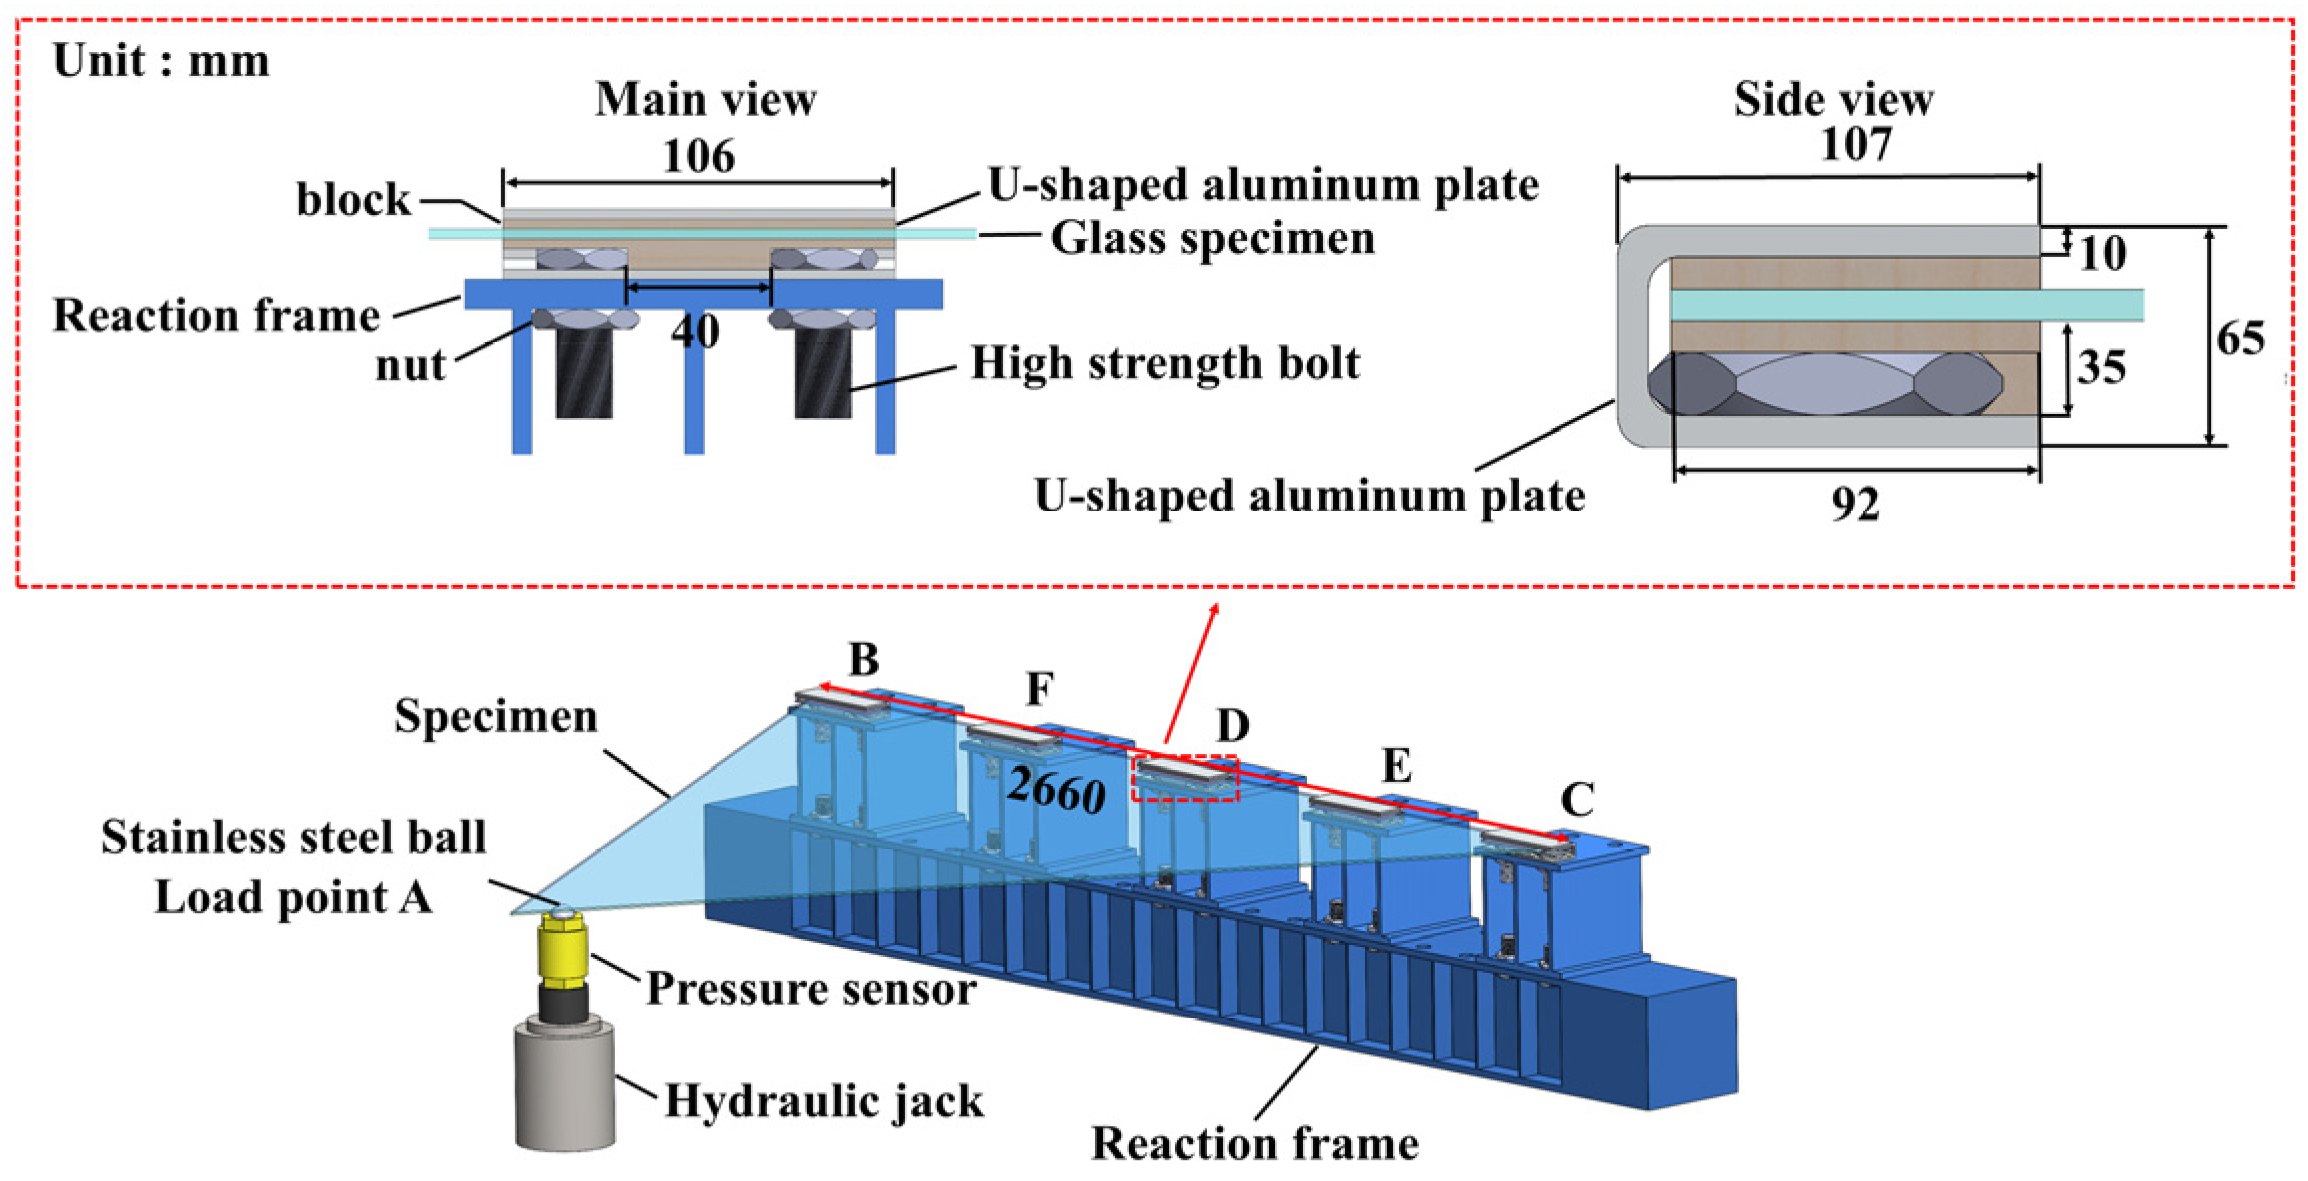
A total of nine isosceles triangular fully toughened glass specimens were designed and fabricated. The specimen base length, thickness, and vertex angle are denoted by L , t, and α , respectively. The detailed geometric dimensions and parameters are listed in Table 1. In the test setup, triangular vertex A served as the displacement-loading point, the base edge was defined as the support axis, and the geometric altitude passing through loading corner A and perpendicular to the support axis was defined as the load axis. Several candidate clamp positions (B–F) were preset along the support axis; for different specimens, two, three, or four of these positions were selected to form discrete support configurations (Figure 3). For clarity, specimens are designated as S( α )–(n), where α is the vertex angle and n is the number of discrete clamps along the base edge. Although multiple replicates are commonly used to characterize stochastic material failure, the large-deflection and local-buckling behaviors examined here are governed primarily by geometry and are therefore highly deterministic. Accordingly, one full-scale test for each configuration was sufficient to capture the global deformation trajectory.

2.2. Test Setup and Loading Protocol

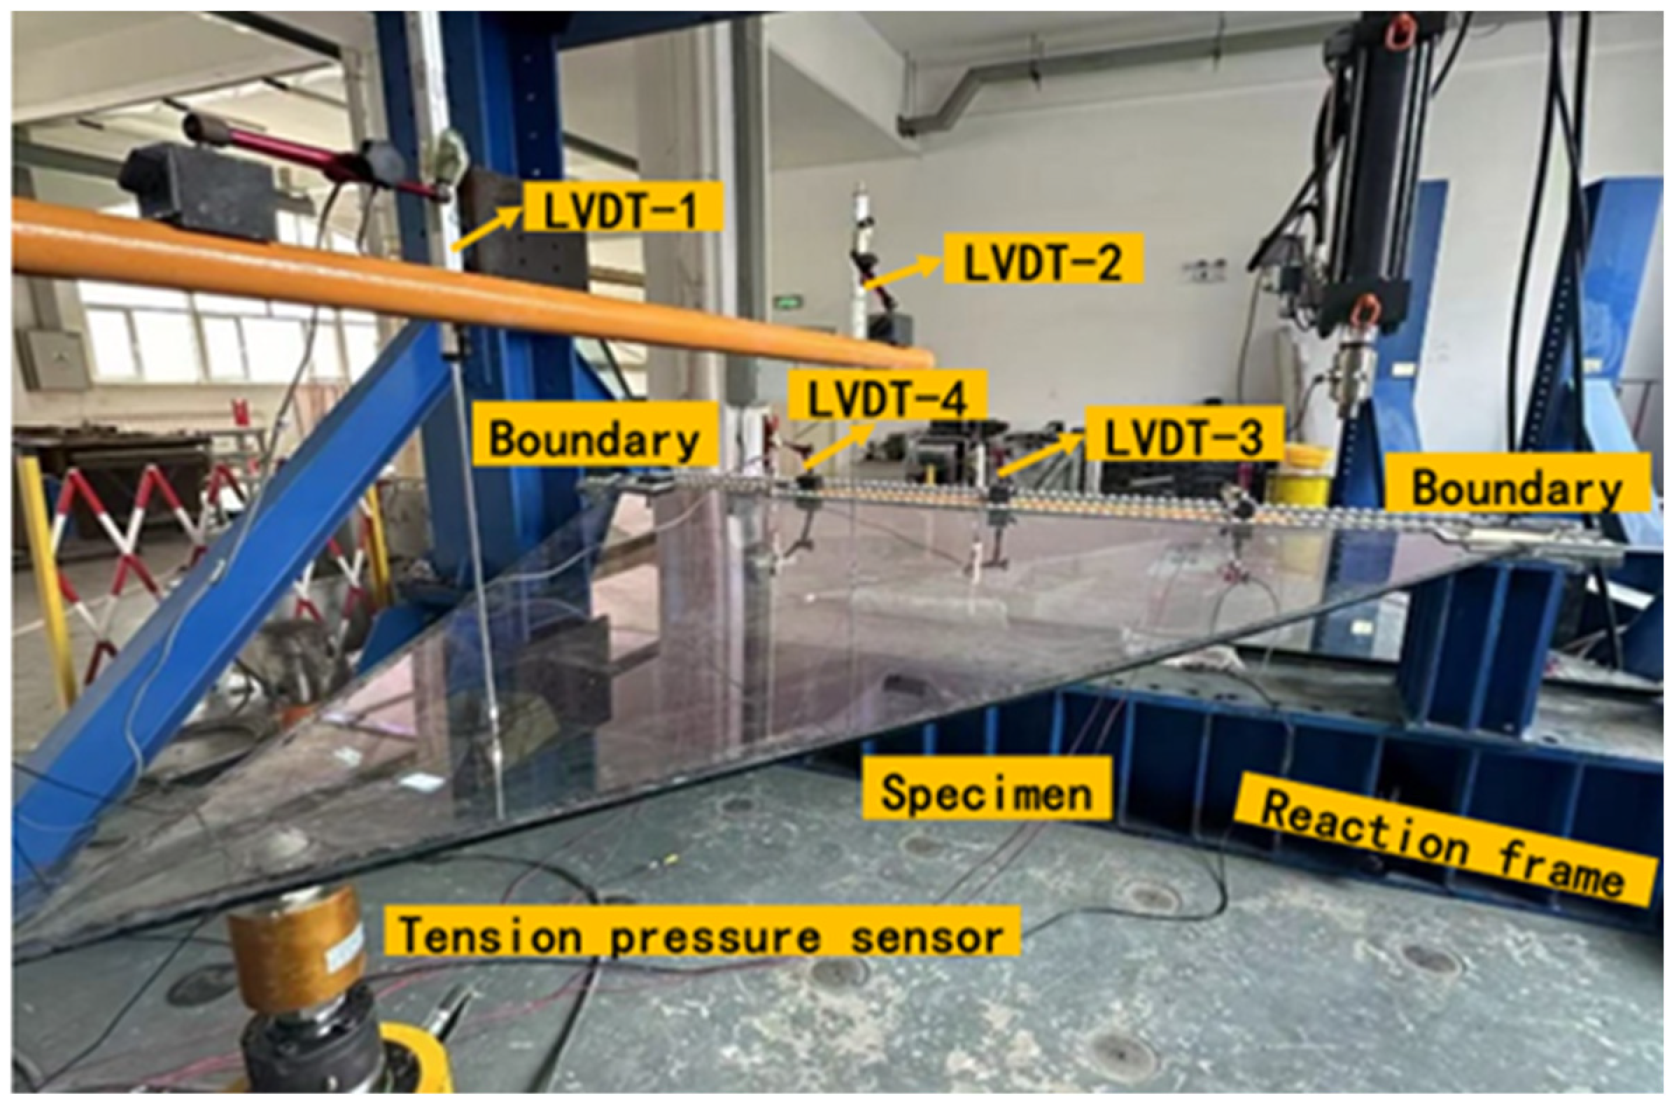
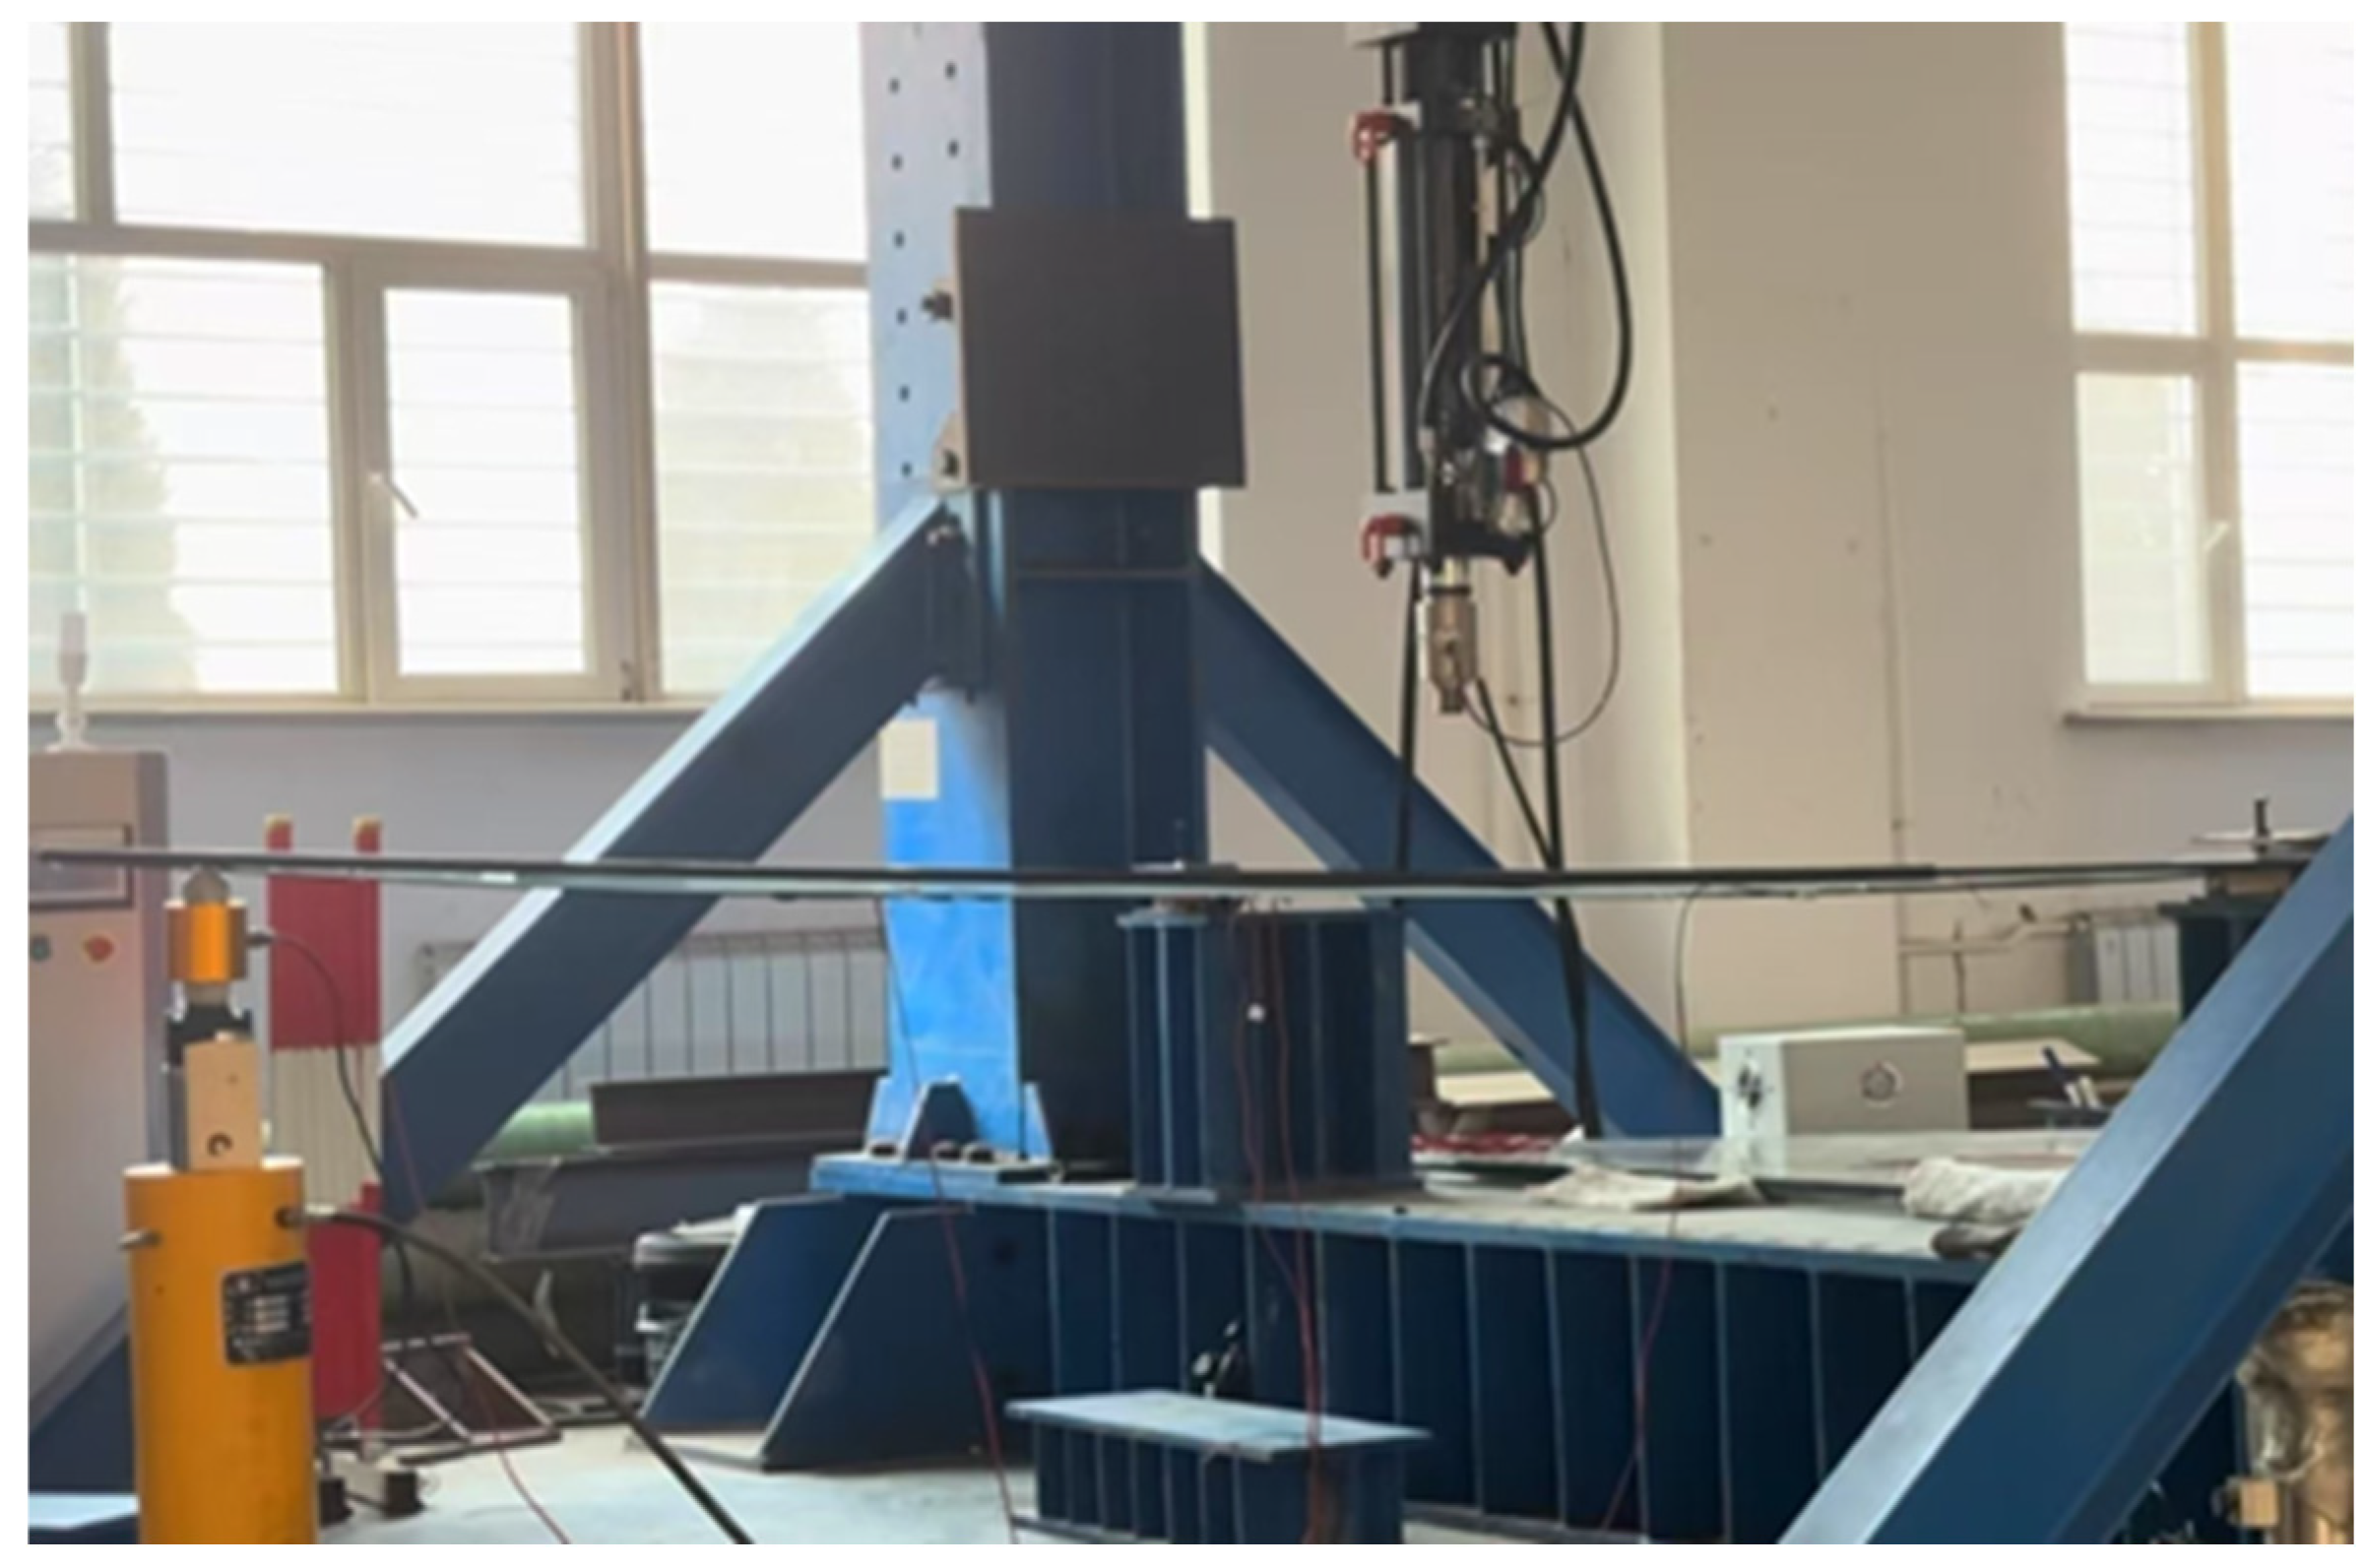
A specially designed cold-bending loading device was used in the tests (Figure 4). The reaction frame was anchored to the laboratory foundation, and the base edge of the glass plate was locally fixed to the frame using U-shaped aluminum-alloy clamps. M16 Grade 8.8 bolts were used, and the tightening torque was calibrated through preliminary tests to 225 N·m, corresponding to an approximate preload of 70 kN for a torque coefficient of 0.2. The preliminary tests confirmed that no macroscopic slip occurred in the clamped region under this torque (Figure 5). Oak gaskets were placed between the glass and the metal clamps to reduce local stress concentrations caused by direct contact. The load was applied by a hydraulic actuator under displacement control. Loading point A was connected to the actuator through a spherical hinge with a diameter of 35 mm to ensure displacement transfer while releasing additional local rotational constraints. The loading rate was 15 mm/min. For safety, each test was stopped before glass fracture. The target cold-bending displacements at the vertex were 300, 150, and 50 mm for specimens with vertex angles of 60°, 90°, and 120°, respectively. In this study, “failure” refers specifically to serviceability failure caused by local or global optical distortion exceeding allowable limits, rather than to material fracture [27,28]. According to EN 12150-1 [29], two types of distortion may occur: (i) bow deformation, defined as the maximum deviation from the reference plane along the baseline length, with its limit expressed as B d i s t δ m a x L = 0.004 , where δ m a x is the maximum deformation of the support axis (mm) and L is the span between adjacent clamps (mm); and (ii) local wave distortion, defined as wave-like features along the baseline, for which the peak-to-valley deformation amplitude ( A d i s t ) within a 300 mm gauge length must not exceed 0.5 mm.

2.3. Instrumentation and Data Reduction

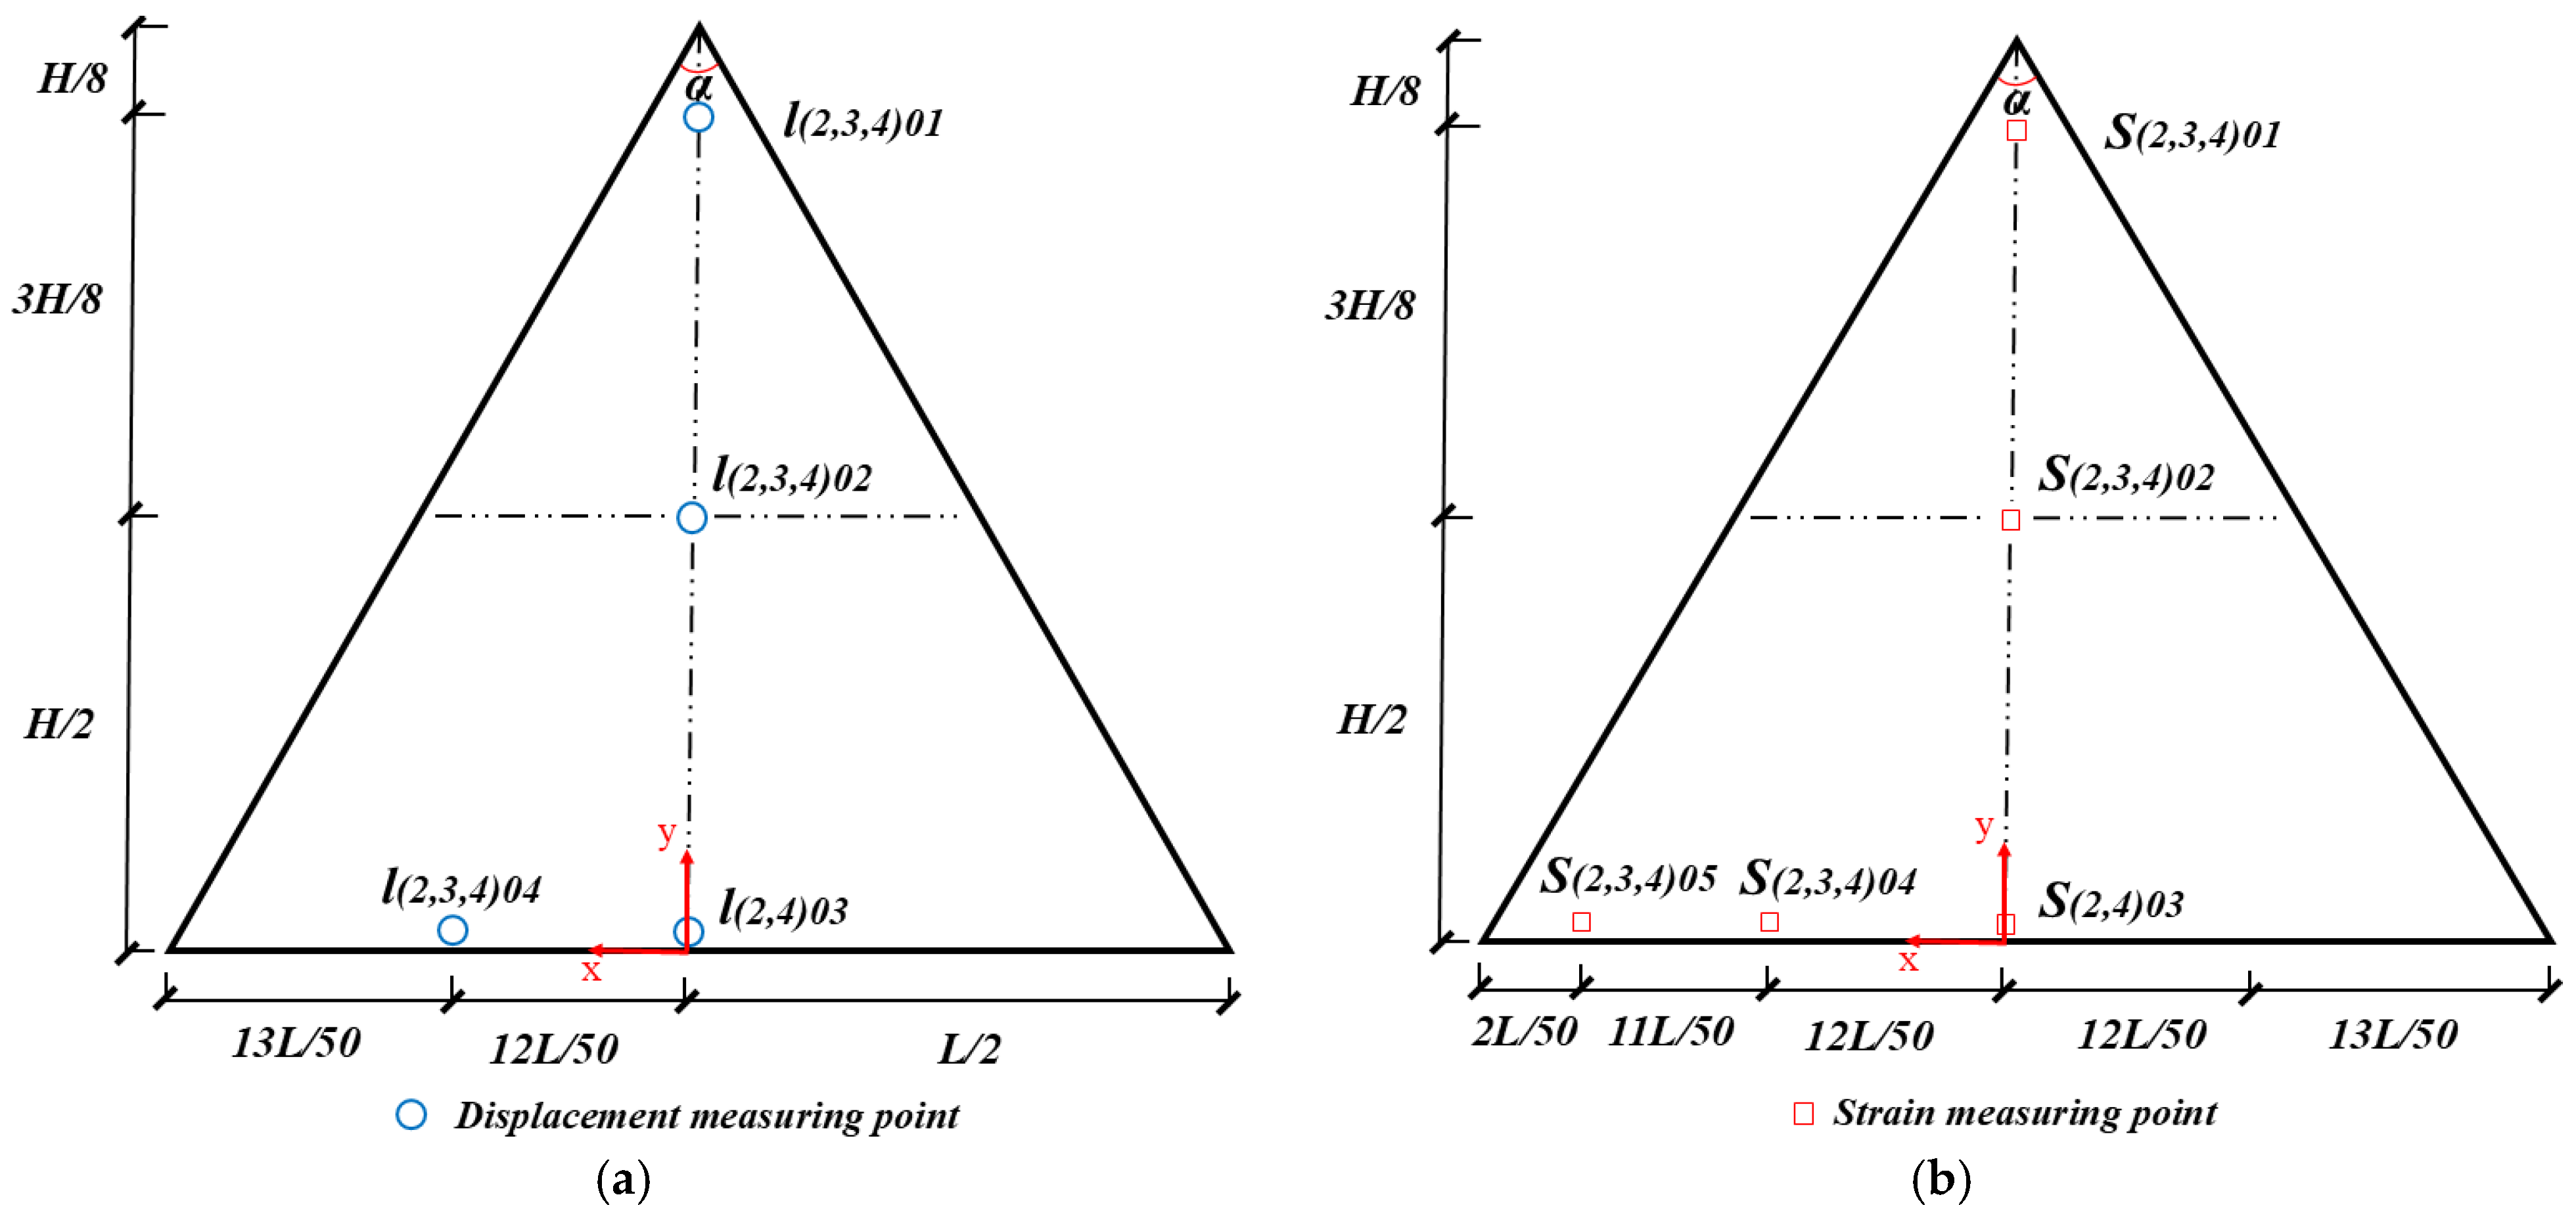
To monitor the large-deflection response and surface-strain evolution during cold bending, linear variable displacement transducers with measuring ranges of 300 and 50 mm were used to measure out-of-plane displacements at key locations. The displacement measurement points were arranged mainly along the support and load axes to capture global deflection (Figure 6). Strain was measured using 0°/45°/90° three-element rosette strain gauges installed in estimated high-stress regions and at representative positions on the two characteristic axes: the x-direction was parallel to the support axis. To distinguish strain responses on the two surfaces of the plate, paired rosette gauges were attached to the upper and lower surfaces. Surface stresses were subsequently calculated from the measured strains under the assumption of isotropic linear elasticity. A unified notation was used for displacement measurement points and rosette gauges. For example, “ l ( 2 ) 01 ” in the figure denotes the first displacement measurement point arranged under the 2-clamp condition, and “ S ( 2 ) 01 ” denotes the first rosette strain gauge arranged under the 2-clamp condition. Initial gravitational effects were explicitly considered; therefore, the initial readings of the displacement transducers and strain gauges were retained rather than reset to zero before formal cold-bend loading.

2.4. Experimental Observations

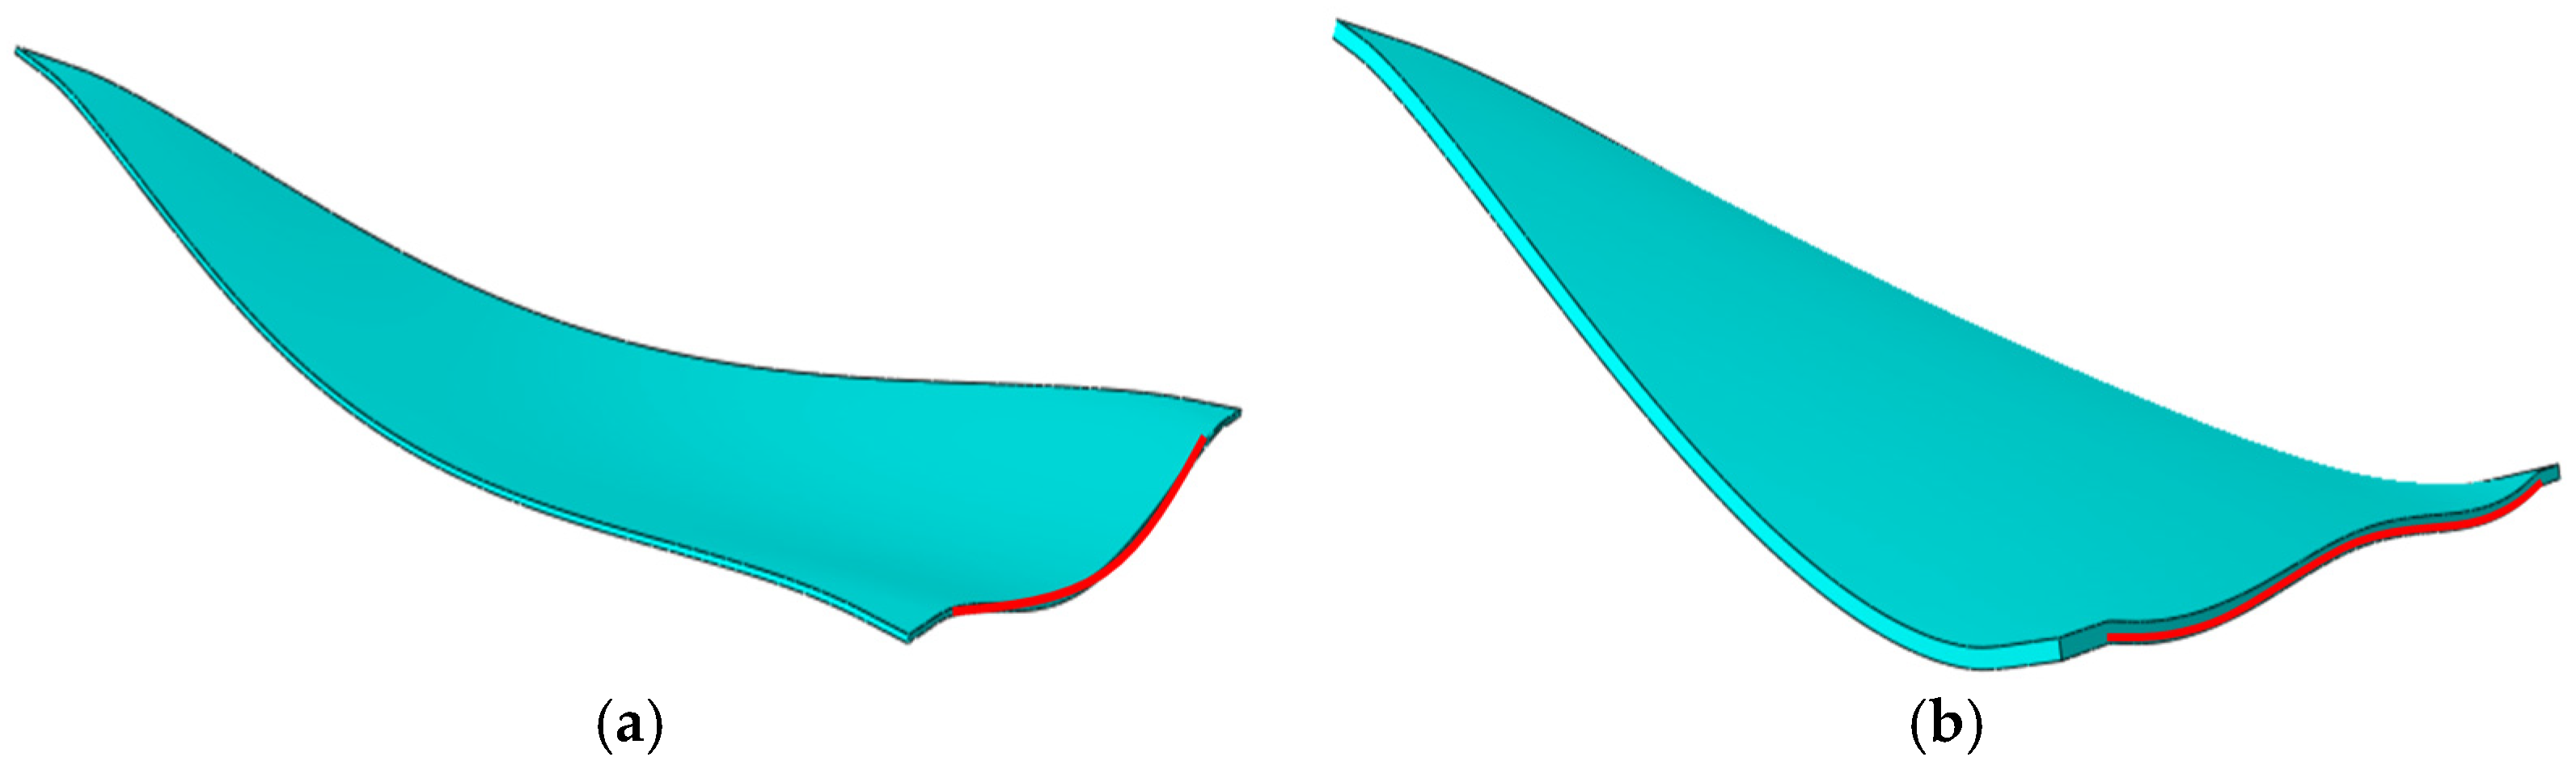
The test results show that the cold-bending response of triangular glass plates with discrete point supports is governed jointly by geometric parameters and boundary constraints. Under strong constraints or favorable geometries, the panels mainly exhibited stable global bending (Figure 7a). Under weak constraints and unfavorable geometries, however, local waveform amplification near the support axis, deflection sign reversal, and surface-stress reversal occurred, indicating local instability (Figure 7b). The following sections discuss these observations in terms of deflection evolution and surface-stress evolution.

2.4.1. Deflection Analysis

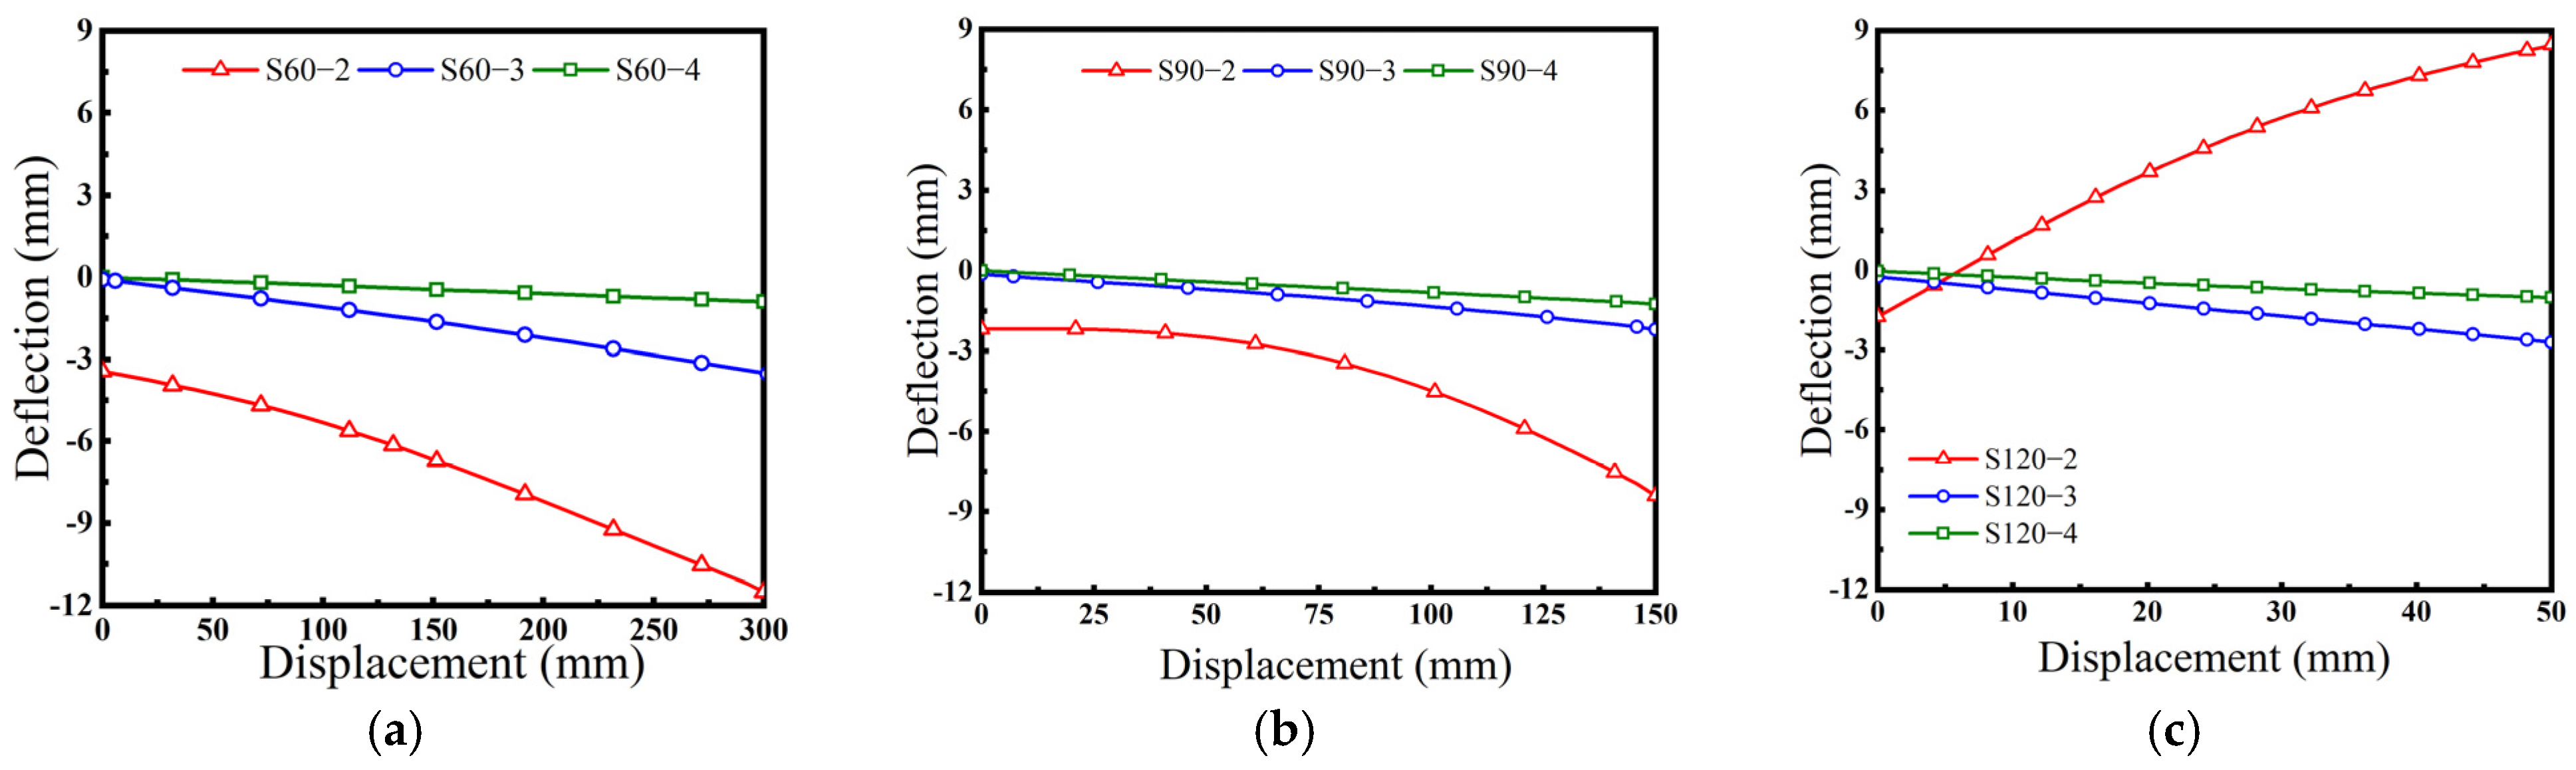
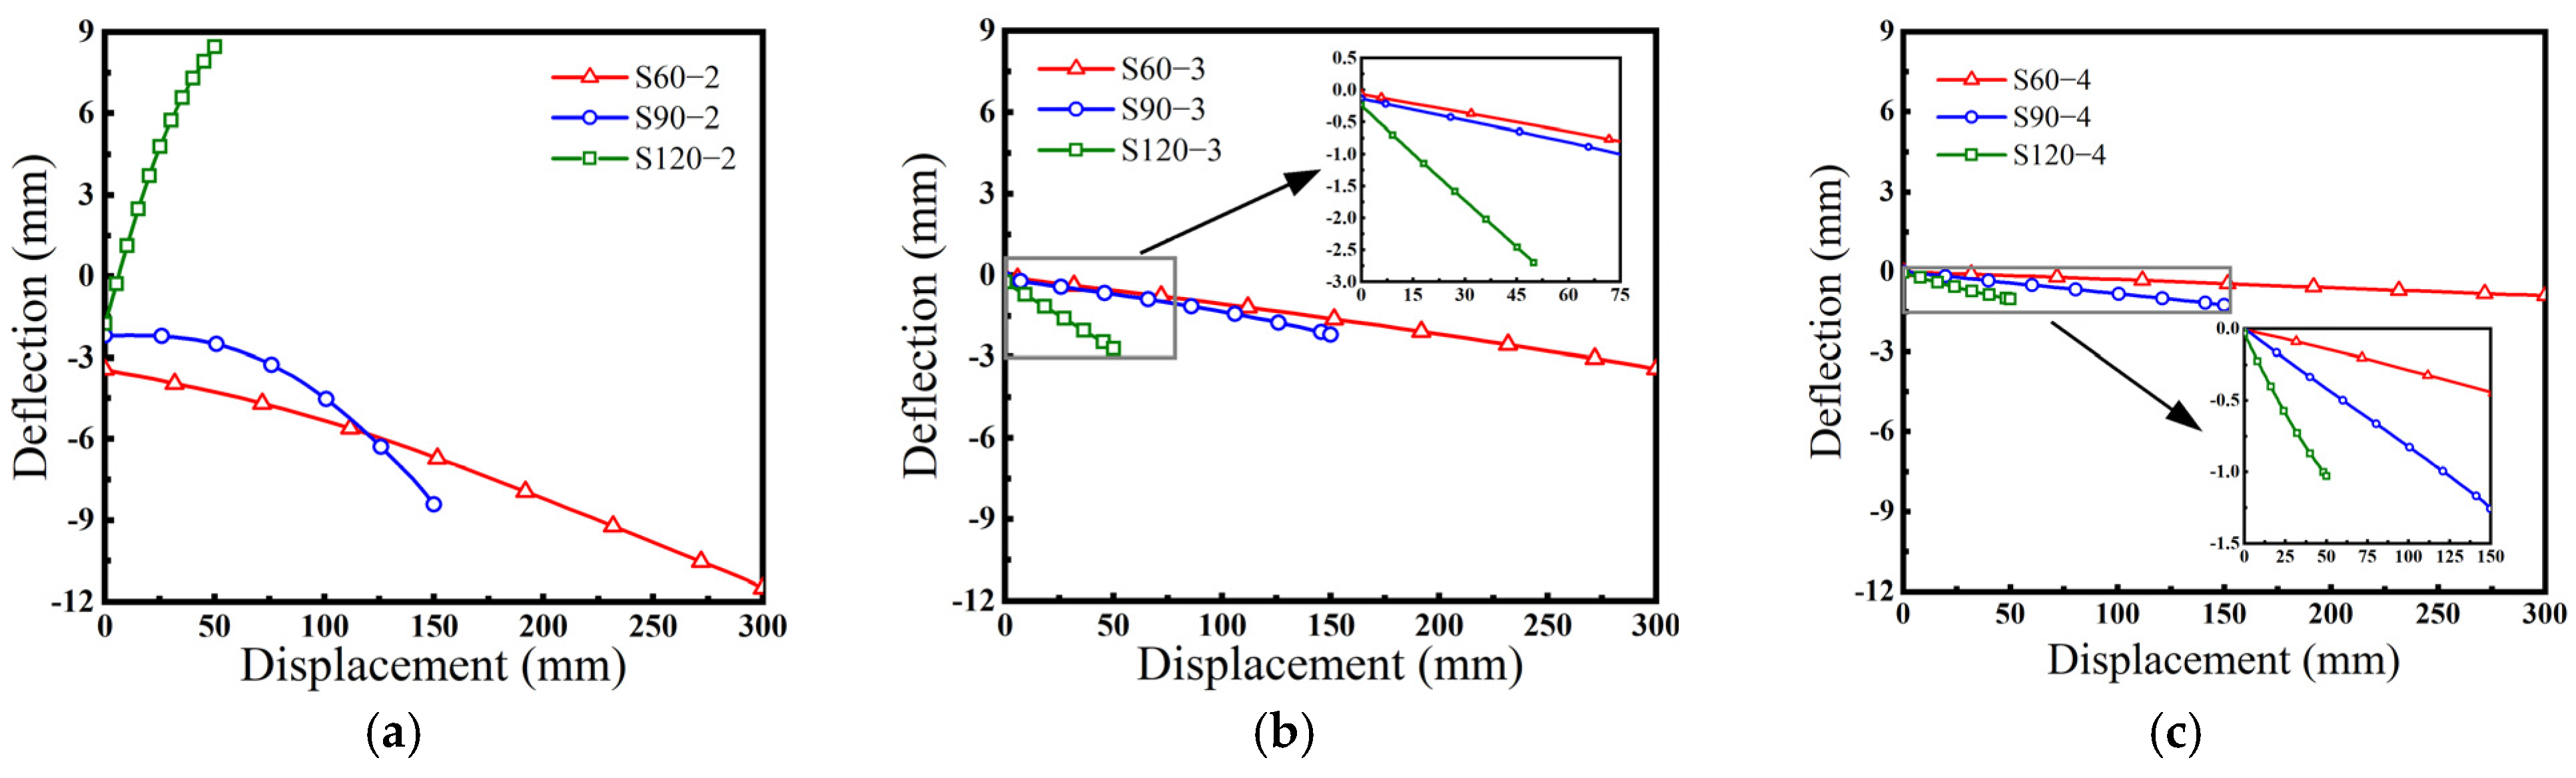
Measurement points were primarily arranged on the support axis and load axis to capture global deflection. Specifically, the “mid-span deflection along the support axis” is uniquely defined as the vertical displacement recorded by transducer l(2, 4)03 (Figure 6a), which is positioned exactly halfway along the baseline and operated parallel to the support axis. Figure 8 shows the evolution of the mid-span deflection along the support axis for specimens with different vertex angles and clamp numbers. For the α = 60 ° and α = 90 ° specimens, the support-axis mid-span generally maintained downward deflection throughout loading, and the absolute mid-span deflection decreased substantially as the number of clamps increased from two to four. This indicates that increasing the number of discrete supports reduces the free span and enhances the equivalent flexural rigidity along the support axis, thereby suppressing global out-of-plane deflection (Figure 8a,b).
The two-point supported α = 120 ° specimen (S120-2) exhibited markedly different behavior. At a loading displacement of approximately 5 mm, the mid-span deflection of the support axis abruptly changed from negative to positive. This sign reversal indicates that the structure passed through a critical equilibrium state and entered a new deformation path associated with local instability. In contrast, when the number of clamps increased to three or four (S120-3 and S120-4), the mid-span deflection evolved monotonically and smoothly throughout loading, indicating that the additional clamps suppressed local instability by shortening the free span.
Figure 9 further compares the effect of vertex angle on the mid-span deflection of the support axis. Under the same support condition, the deflection response gradually changes from approximately linear to strongly nonlinear as the vertex angle increases, with the α = 120 ° specimen showing the greatest sensitivity to instability. This result indicates that a larger vertex angle strengthens the coupling between out-of-plane bending and in-plane stretching, thereby increasing the risk of local instability.

2.4.2. Surface Stress Analysis

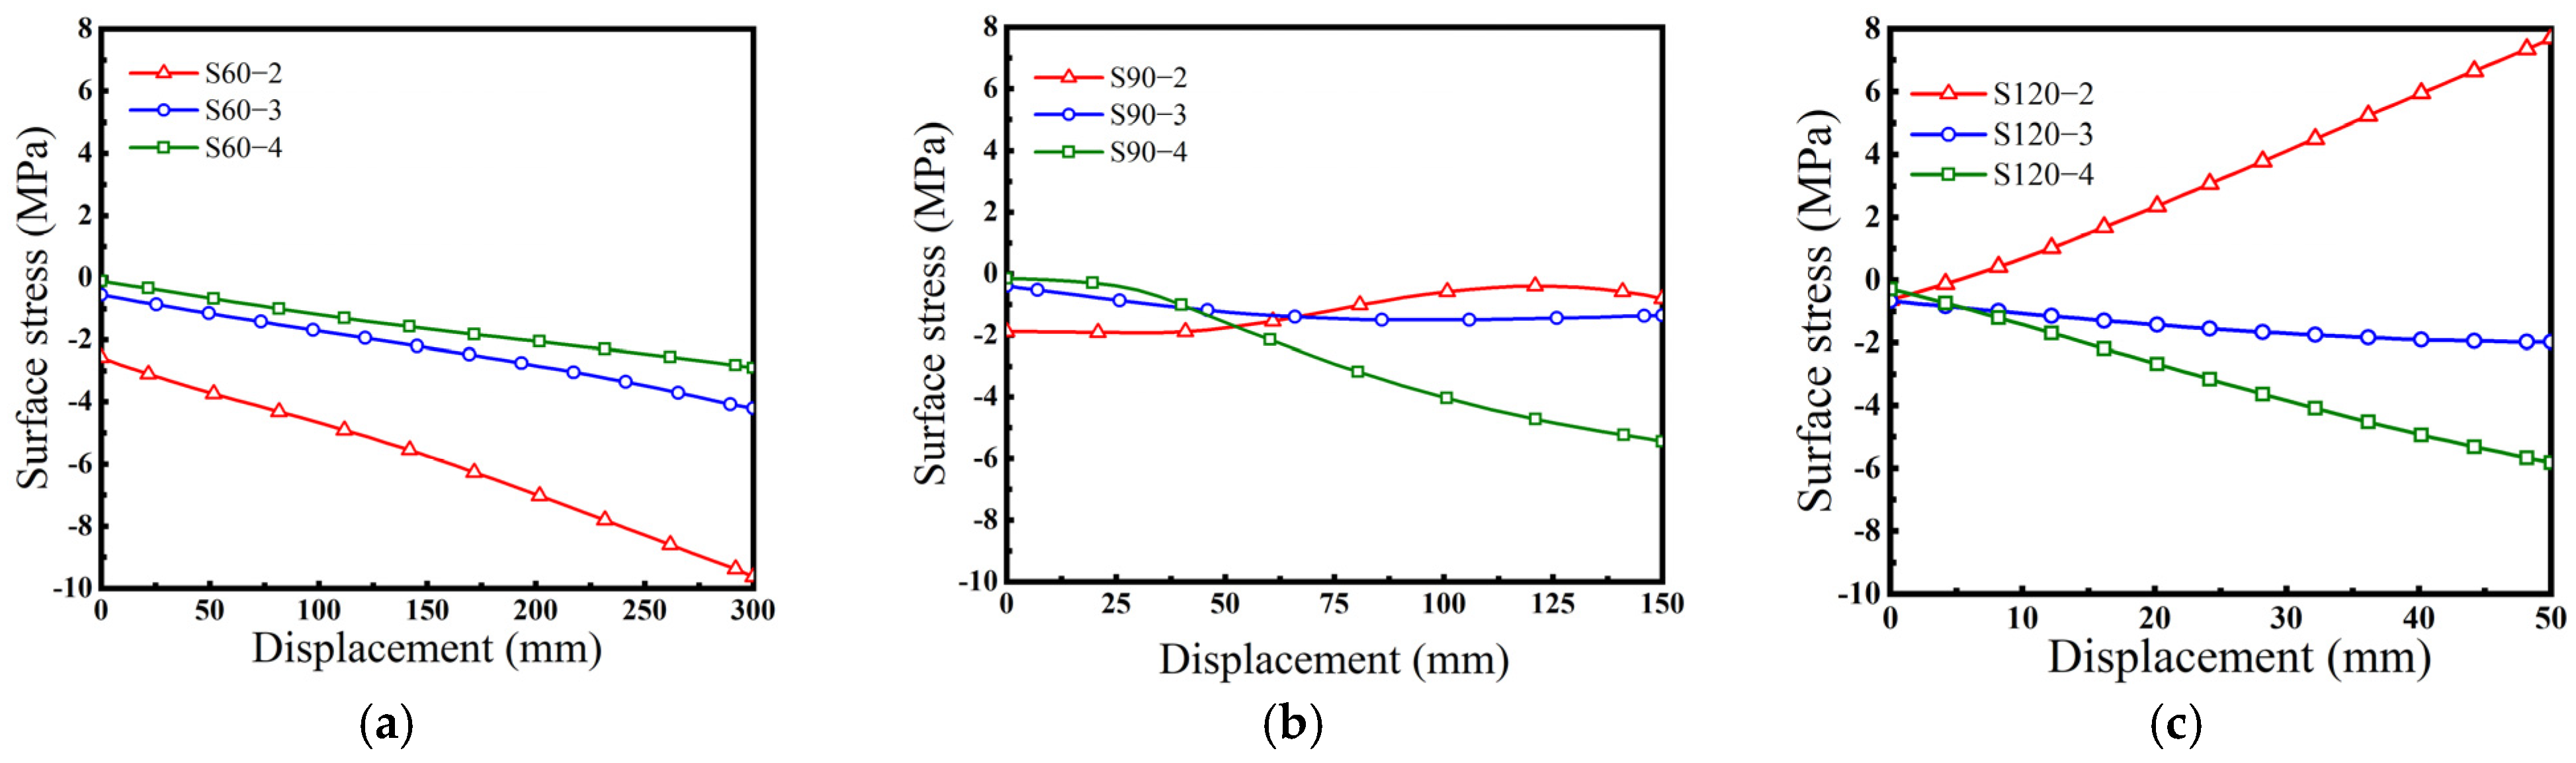
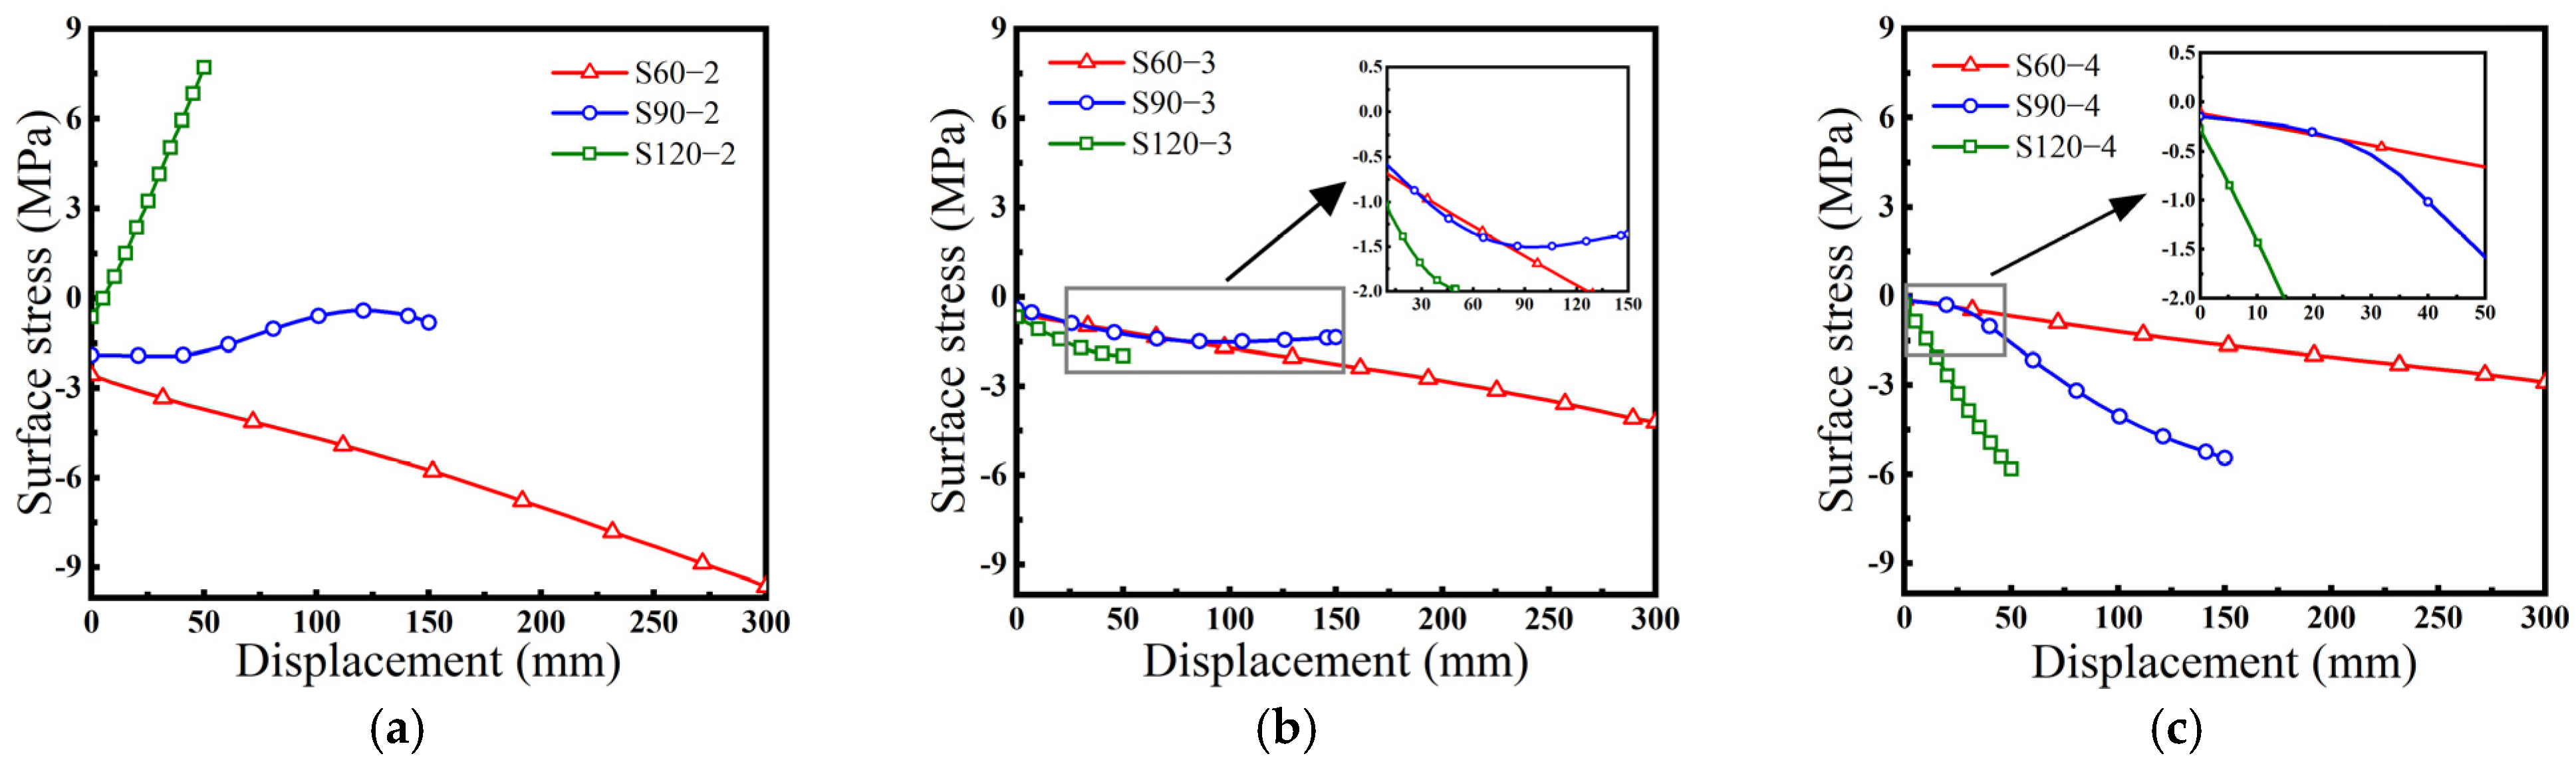
Figure 10 shows the effect of clamp number on the surface stress at the mid-span of the support axis. Overall, increasing the number of discrete clamps reduced stress peaks and improved the uniformity of stress distribution. For the α = 90 ° and α = 120 ° specimens, multi-point supports not only reduced the stress amplitude at the support-axis mid-span but also delayed the onset of nonlinear stress evolution, indicating that additional supports effectively suppressed the membrane-effect enhancement induced by large deflection.
Figure 11 presents the stress evolution of specimens with different vertex angles under the same support conditions. For the α = 60 ° specimens, the mid-span surface stress generally appeared as a steadily increasing compressive stress during loading, indicating a response governed primarily by global bending. For the α = 90 ° specimens, the stress curves became distinctly nonlinear in the middle and later loading stages, suggesting that membrane effects began to contribute to load bearing. The most pronounced response occurred in the α = 120 ° specimen: the mid-span stress rapidly changed from compression to tension at a small displacement, accompanied by deflection sign reversal. This correspondence between stress reversal and deflection mutation indicates that the structure had shifted from a stable bending path to a post-instability deformation branch.

3. Finite Element Modeling and Validation

3.1. Numerical Model

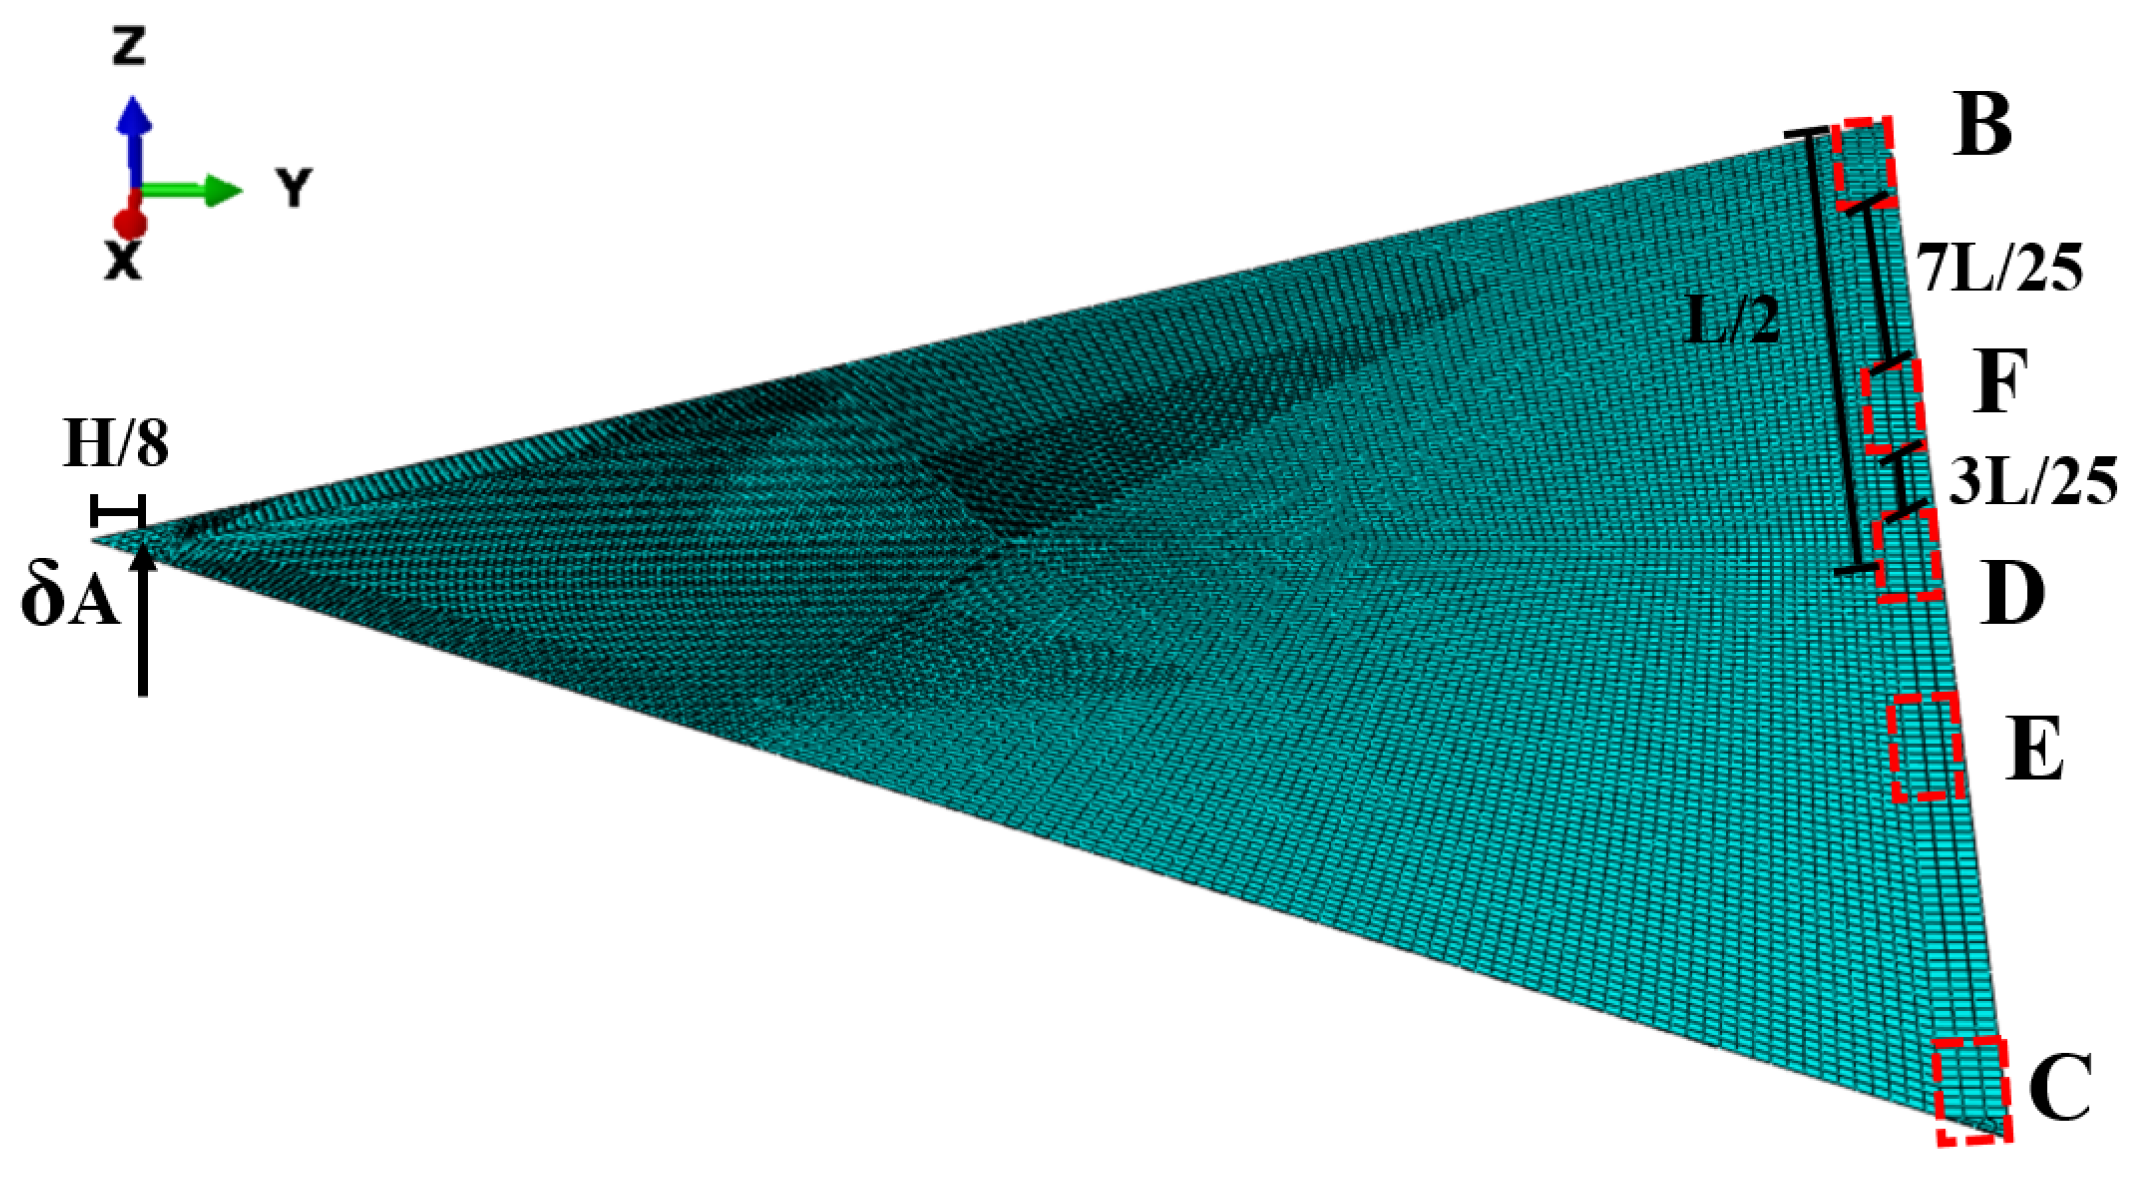
A three-dimensional finite element model corresponding to the experiments was established in Abaqus/CAE 6.22-1 (Figure 12). Because cold bending involves significant geometric nonlinearity, a static general analysis step with the large-deformation option enabled was used. The glass was discretized using C3D8R elements to capture the through-thickness stress gradient caused by bending–membrane coupling. The material was modeled as isotropic and linear elastic, with elastic modulus E = 70   G P a and Poisson’s ratio ν = 0.22 . Residual compressive stress in the surface layer of the tempered glass was not included; consequently, the model stress output was zero in the unloaded post-processing state. Because this study focuses on the geometrically nonlinear service response rather than on the fracture limit, this simplification does not materially affect instability identification [30]. Physically, residual surface stress shifts the fracture threshold but does not change the elastic flexural-membrane stiffness or the geometric bifurcation load under service conditions. A mesh-sensitivity analysis was performed using deflection at key measurement points and total strain energy as convergence criteria, with the in-plane global mesh size refined from 40 to 10 mm. In regions prone to instability, local curvature convergence and S11 stress concentration near the discrete rigid fixtures were also monitored. A 20 mm global mesh combined with 8 mm local refinement in the contact region was finally adopted. Relative to a 10 mm global mesh, deviations in key displacements and peak S11 stress were less than 2% and 3%, respectively, confirming mesh independence for the macroscopic buckling profile and localized stress response. The fixture region was simplified as a discrete rigid contact surface. Normal contact was defined as hard contact, and tangential behavior was described using a Coulomb friction model with friction coefficient μ = 0.2 . The wooden gasket was not modeled explicitly; its stress-relief effect was represented indirectly through the friction and contact-surface parameters [31,32]. Sensitivity checks showed that the rigid frictional boundary was sufficient to represent macroscopic in-plane sliding and rotational constraints and did not artificially initiate local instability. The loading end was kinematically coupled to a reference point near the top-corner region, and vertical displacement was applied at that reference point. Self-weight was applied before formal loading to reproduce the initial experimental state.

3.2. Validation Against Experiments

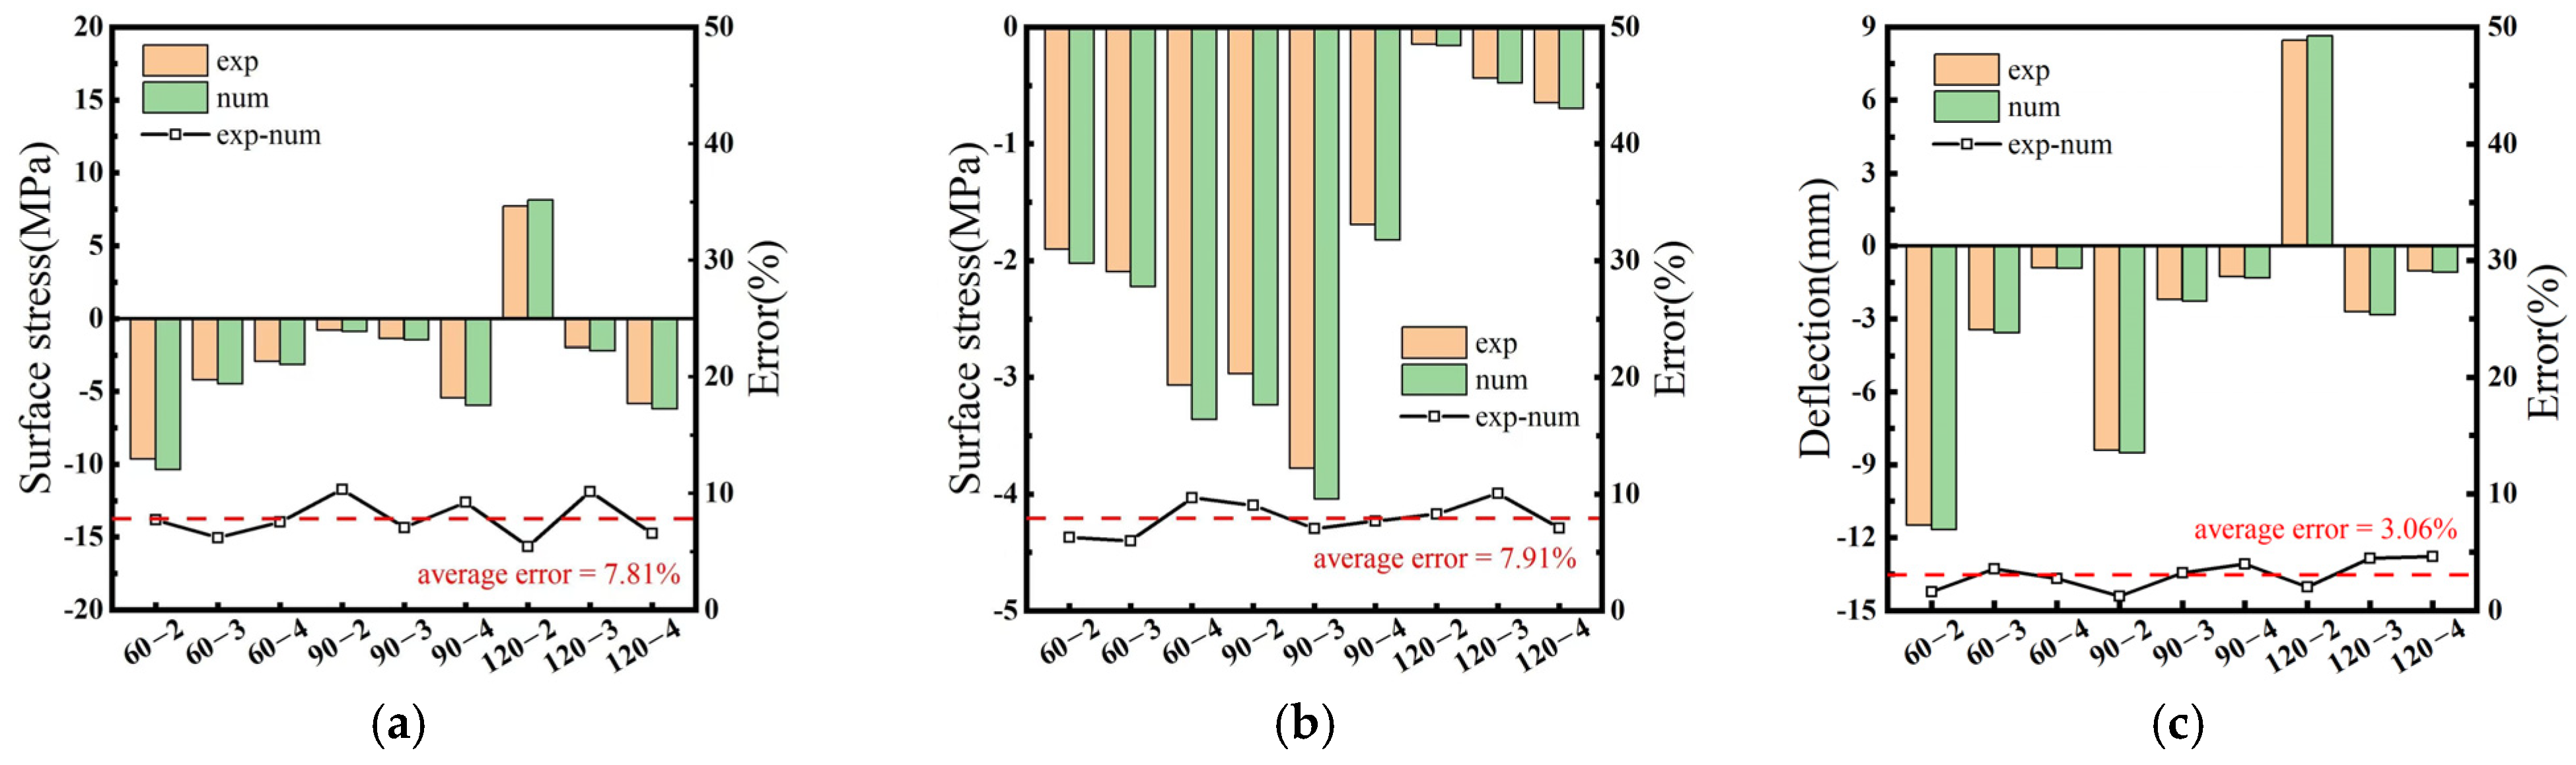
To verify the reliability of the finite element model, experimental and numerical results were compared in terms of support-axis mid-span deflection and surface stress at key measurement points (Figure 13). Across all measurement points for the nine specimens, the average relative errors for S11 (along the support axis) and S22 (along the load axis) were 7.81% and 7.91%, respectively. The average relative error in support-axis mid-span deflection was only 2.89%. The model successfully reproduced two key features of the unfavorable S120-2 case: (a) the abrupt transition of support-axis mid-span deflection from negative to positive, and (b) the reversal of mid-span surface stress from compression to tension. These results indicate that the model can describe both smooth bending responses under general conditions and local-instability events in weakly constrained obtuse-angle specimens. The validated model was therefore used for parametric analysis and extraction of key morphological parameters.

3.3. Numerical Observations of Deformation and Optical Distortion

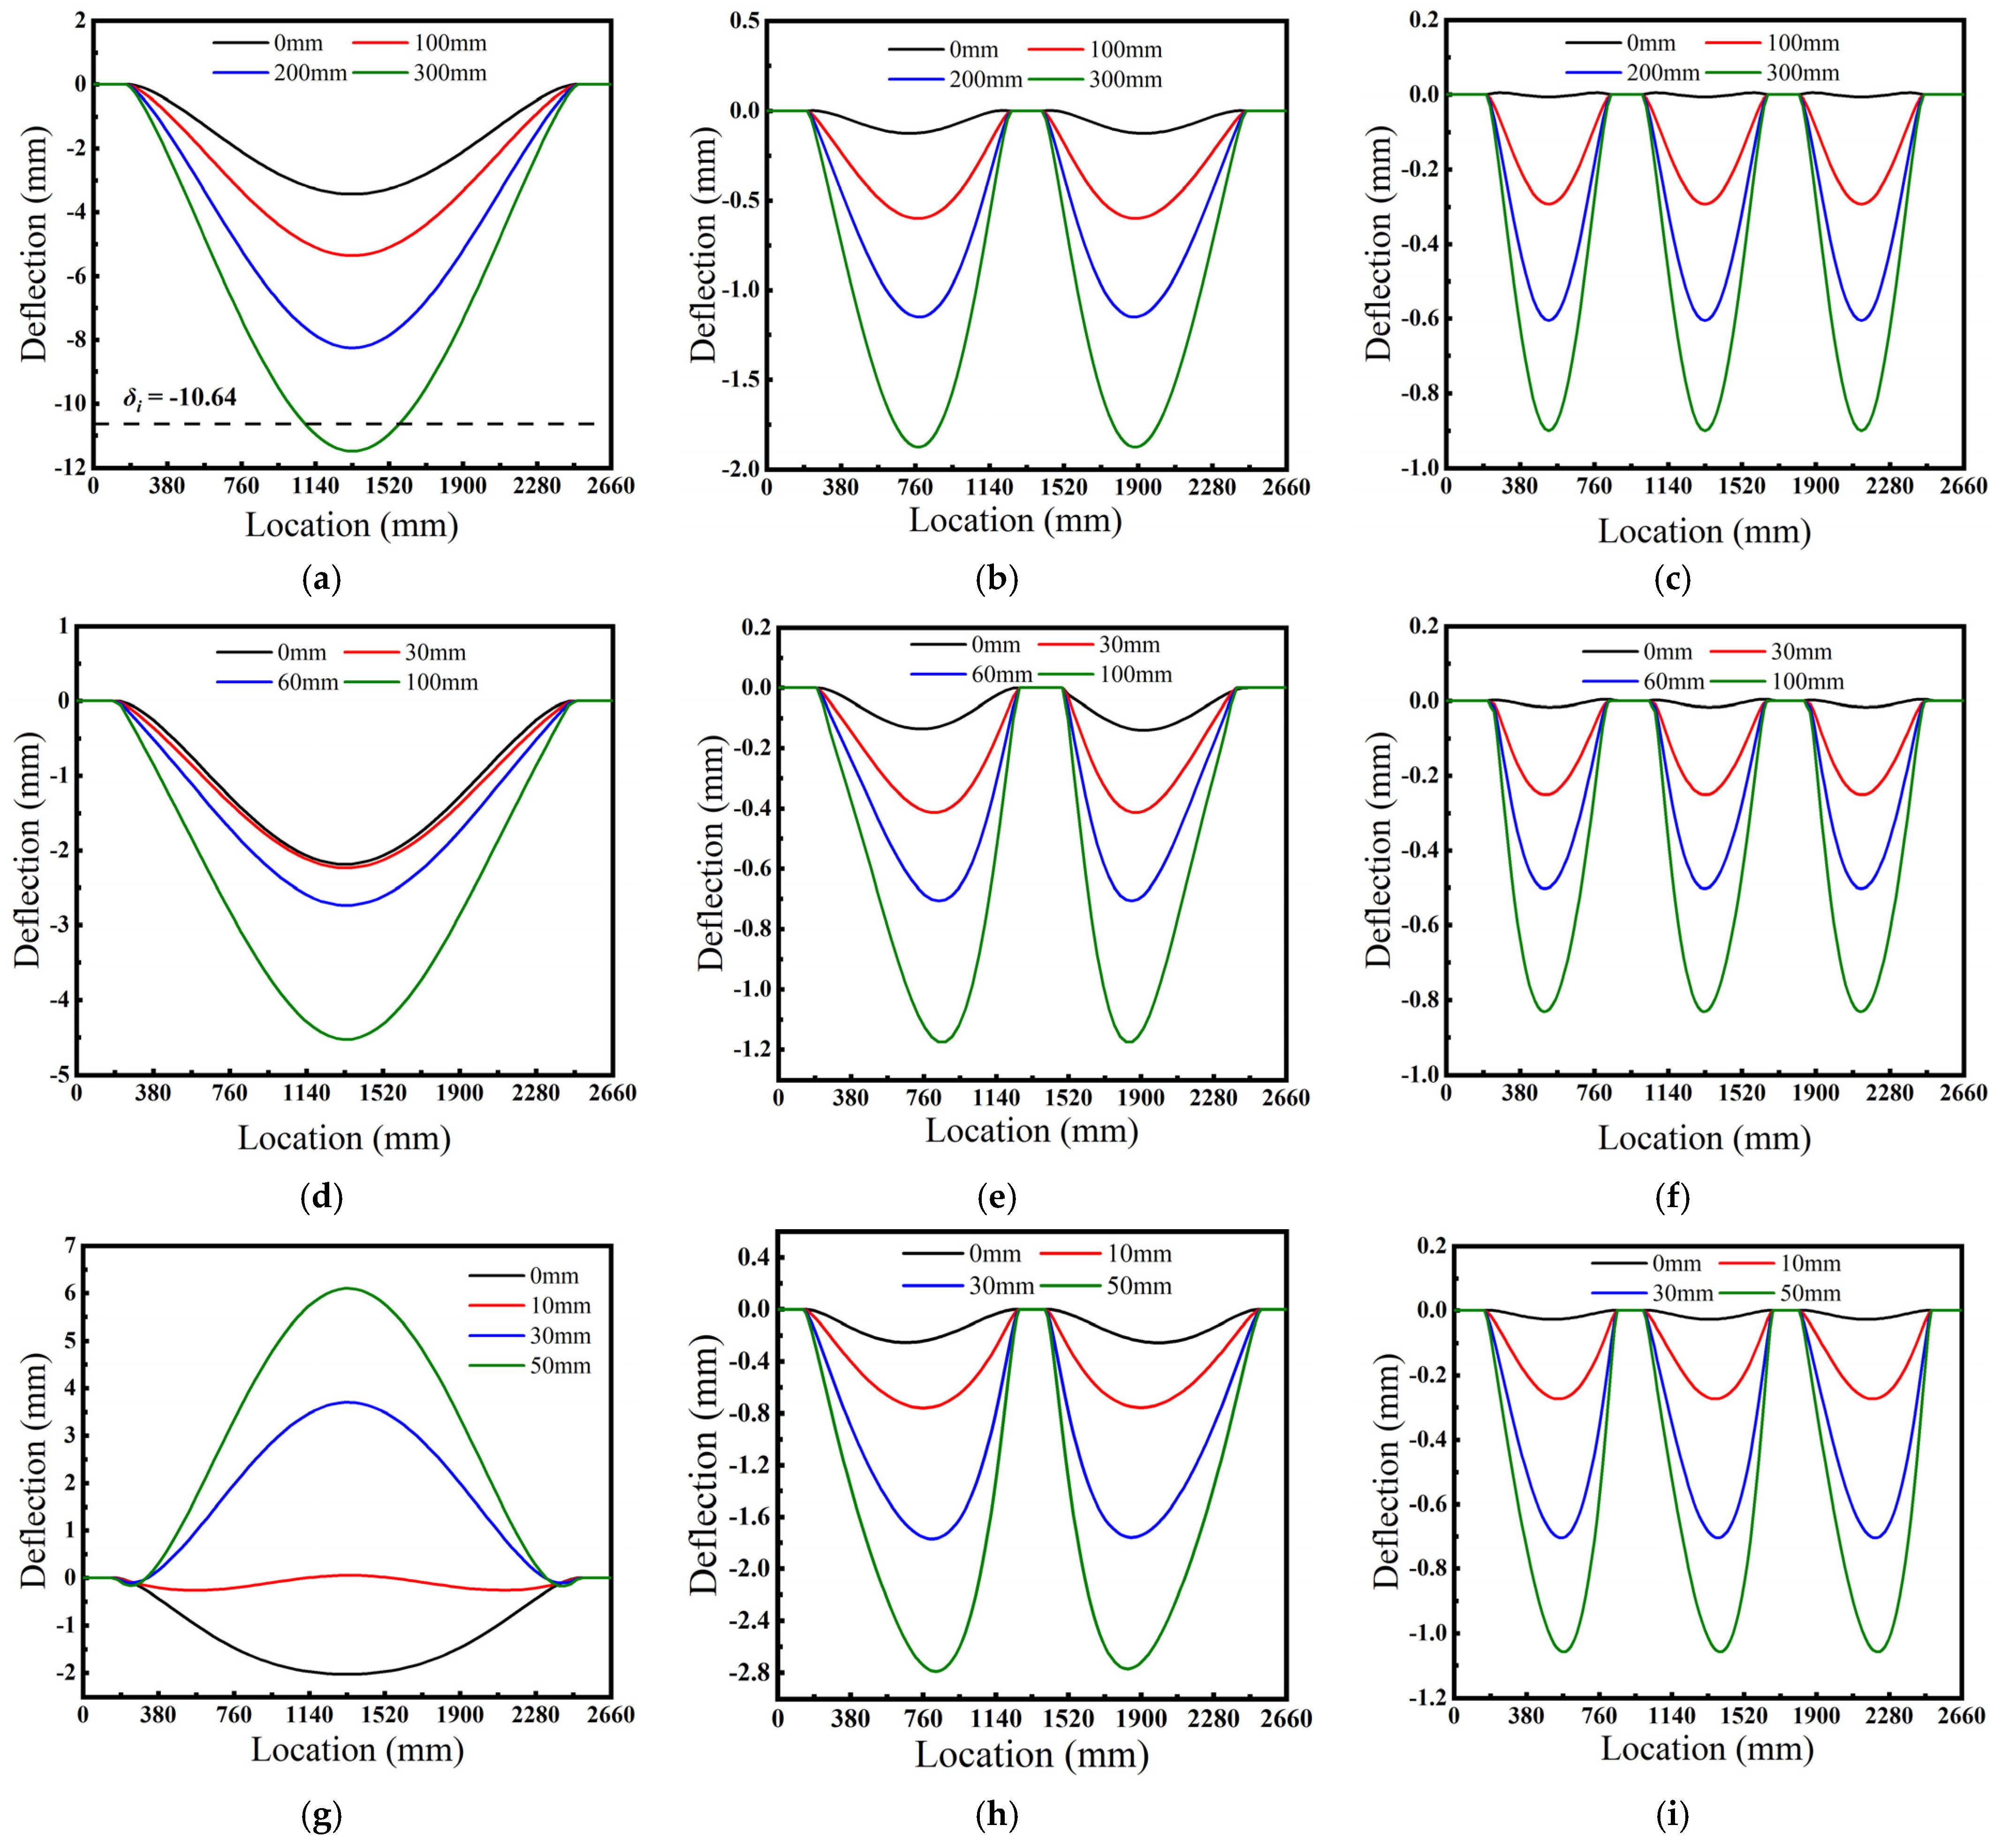
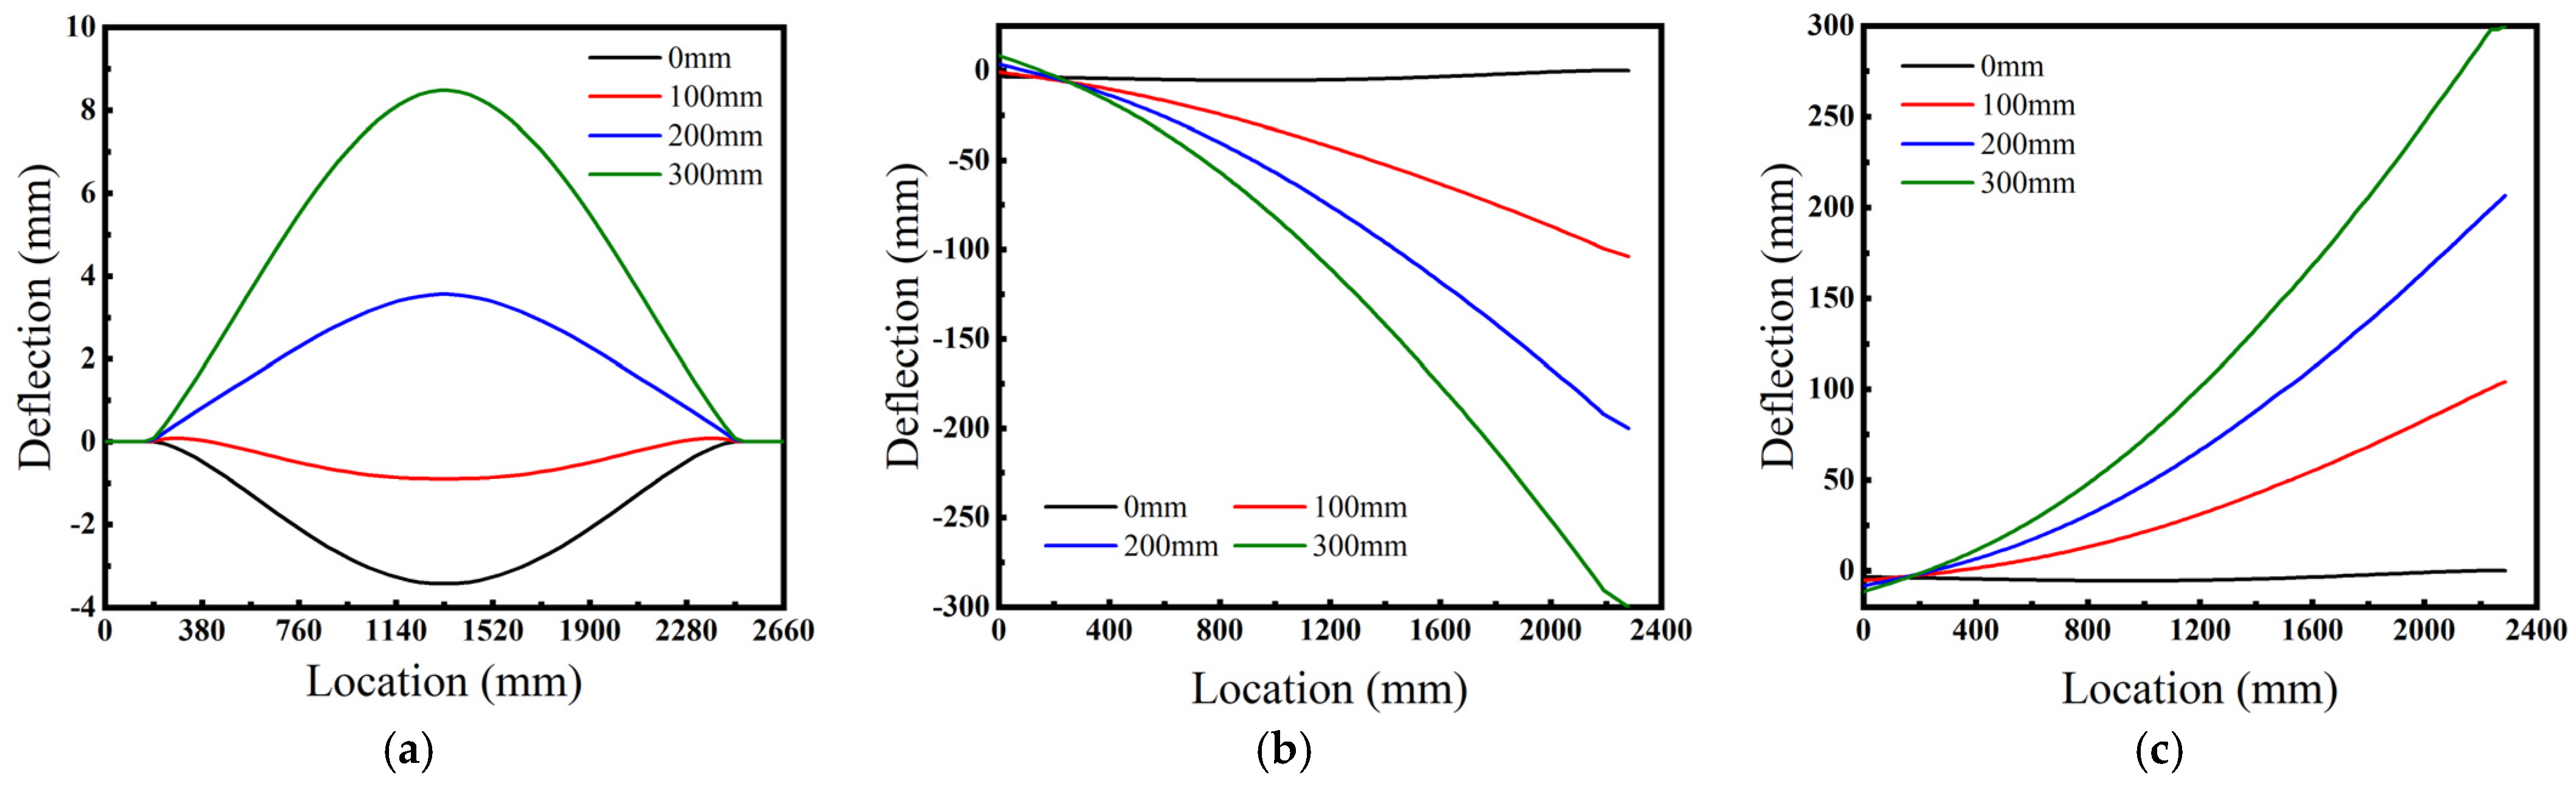
The numerical simulations, combined with the experimental observations, show that clamp number n primarily affects the global cold-bending behavior of triangular glass plates by constraining support-axis deformation. For the α = 60 ° and α = 90 ° specimens (Figure 14a–f), the support axes generally maintained downward deflection as the imposed displacement δ A increased, exhibiting piecewise waveform characteristics that varied with clamp number. The deformation amplitude of each wave segment increased monotonically with loading displacement. This continuous support-axis undulation induced by out-of-plane loading is consistent with the global bow deformation defined in standards for architectural tempered glass [33]. The simulations further show that each additional clamp excites an additional deformation wave peak along the support axis; however, because the free span between adjacent supports is shortened, the absolute amplitude of each individual wave peak is substantially reduced. For the experimental adjacent clamp span of 2660 mm, the corresponding absolute tolerance is 10.64 mm. The numerical results indicate that specimen S60-2 exceeded the global bow-distortion ( B d i s t ) limit at the later stage of large-displacement loading ( δ A > 280   m m ), whereas all other specimens satisfied the global optical-quality requirement throughout cold bending. This confirms that increasing the number of clamps is an effective engineering measure for suppressing global deformation and improving optical quality.
In contrast, the two-point supported α = 120 ° specimen (S120-2) exhibited a markedly different response. When δ A 5 , deflection sign reversal and a sudden increase in local wave amplitude occurred near the support axis, indicating that the structure had shifted from a stable bending path to a new post-instability deformation branch. When three or four clamps were used, this mutation was greatly weakened or eliminated, demonstrating the decisive role of additional clamps in suppressing local instability. The optical evaluation criterion ( A d i s t ) specifies that the absolute distortion drop over a 300 mm measurement length must not exceed 0.5 mm [29]. To remove the influence of global curvature induced by large deflection, a fixed-distance 300 mm sliding-window algorithm was used: (i) for the FE support-axis deflection curve w ( x ), positions at which the local second derivative 2 w / x 2 changes sign were taken as candidate peak/valley locations; when no sign change occurred over the entire curve (as in the S60 series), the geometric center of symmetry was used as the search origin; and (ii) a 300 mm window was slid along the x-direction in 10 mm steps, the peak-to-valley drop within each window was calculated Δ w ( 300 ) = w m a x w m i n , and the maximum value over all windows was defined as the local distortion index. Based on this criterion, the S120-2 specimen maintained acceptable optical quality only up to a loading displacement of approximately 15 mm; beyond this value, optical serviceability failure occurred. These limits are used solely to evaluate optical quality and aesthetic serviceability, not structural collapse. In facade engineering, exceeding the serviceability limit causes visible reflection distortion, whereas the corresponding tensile stresses remain well below the fracture limit of fully toughened glass.

4. Parametric Analysis

Based on the experimentally validated finite element model, parametric analyses were further conducted to examine the effects of geometric proportions, plate thickness, and loading direction on the cold-bending response (Table 2). To facilitate quantitative comparison, a length ratio L R = L b / L is defined (where L b represents the base length of the tested board, L = 2660   m m is the base length of the experimental specimen) along with a height–base ratio H B R = H / L . H B R directly corresponds to the vertex angle α ; for instance, H B R = 0.87, 0.5, 0.29 corresponds to α 60 ° , 90 ° , 120 ° respectively. It should be noted that all parametric conclusions are confined to the material parameters, boundary conditions, and loading paths utilized in this study. To ensure statistical comparability in the parametric study, the basic geometric configuration was fixed at L R = 1 , t = 10   m m , H B R = 0.87 (the experimental S60 series). From this baseline, L R , t , H B R , and loading direction were perturbed individually, and three discrete support configurations ( n = 2 , 3 , 4 ) were examined for each combination. The amplitude of the local wave-shaped distortion in the parameters is measured using the 300-mm sliding window algorithm defined in Section 3.3.

4.1. Effect of Height-to-Base Ratio

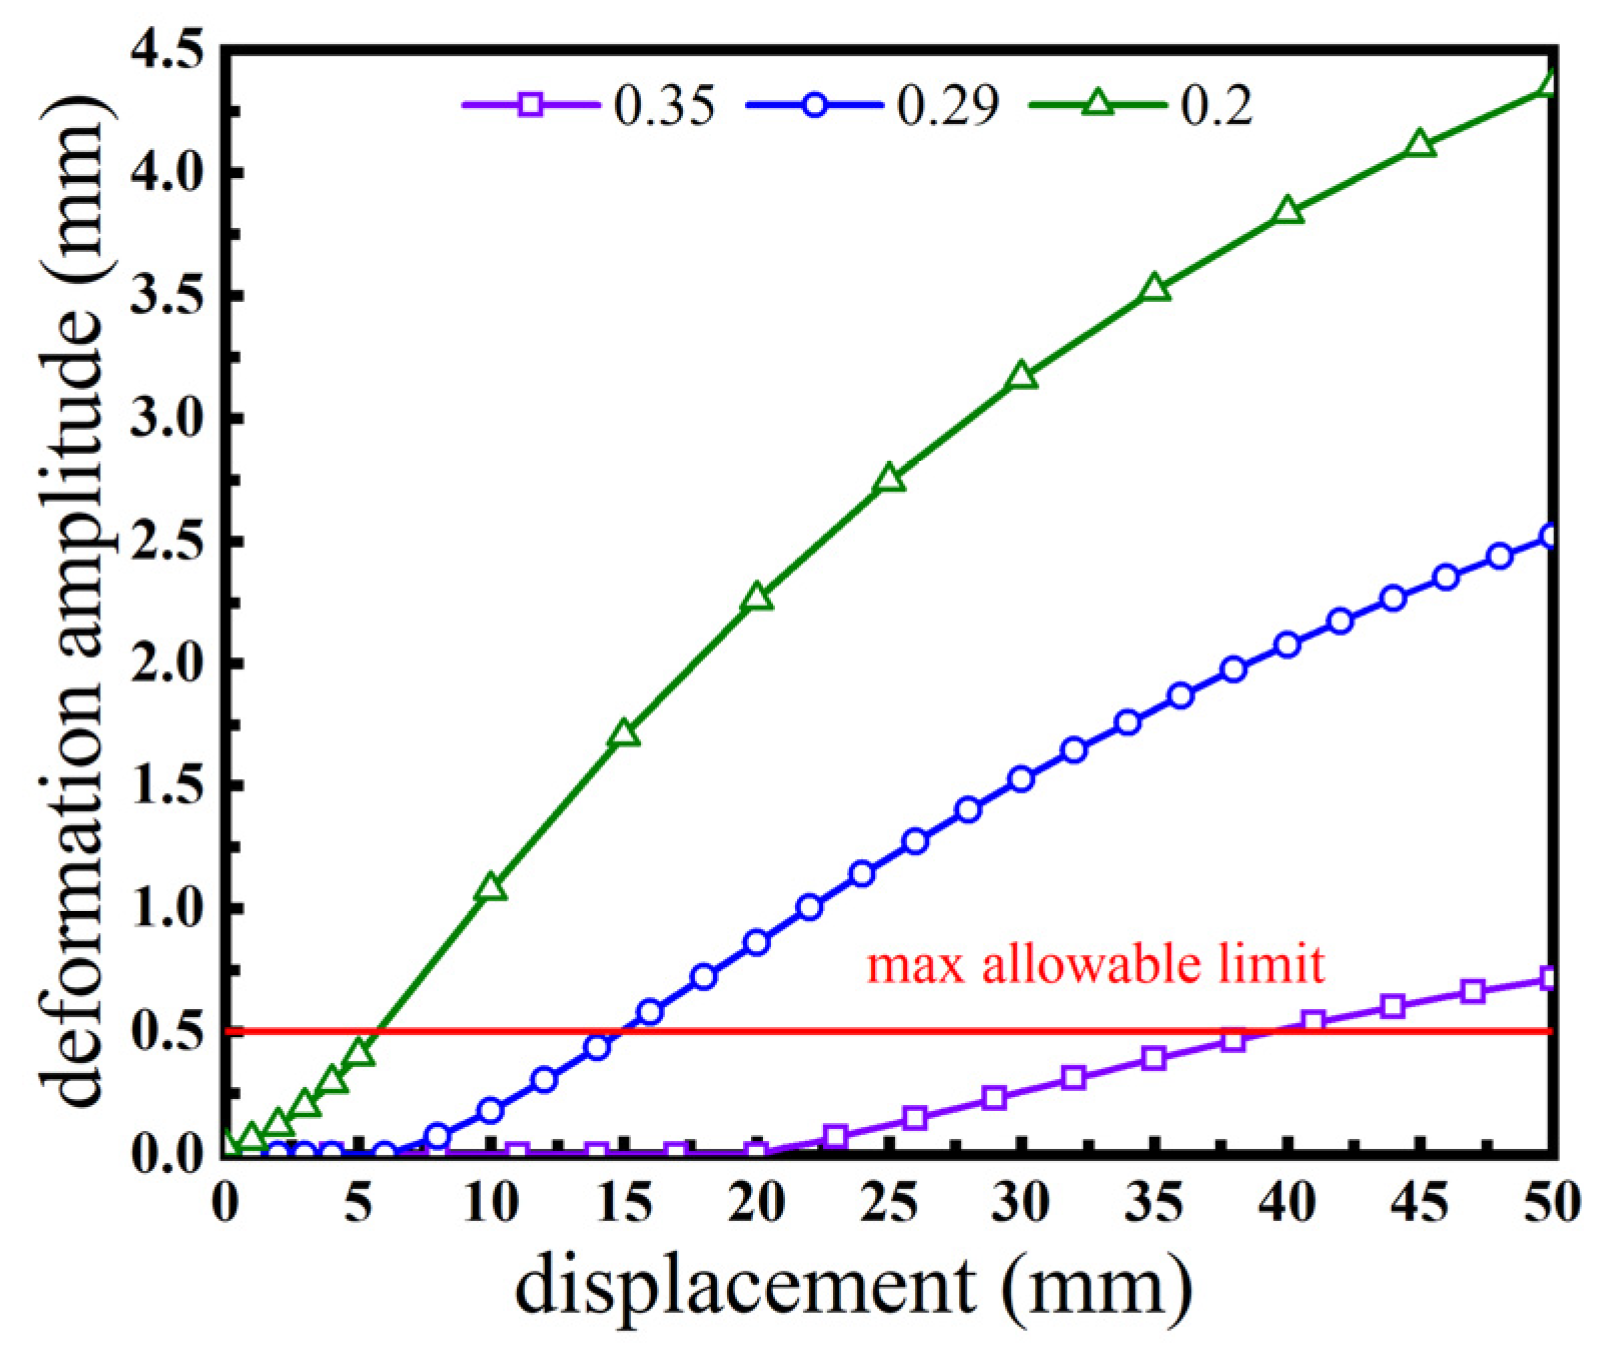
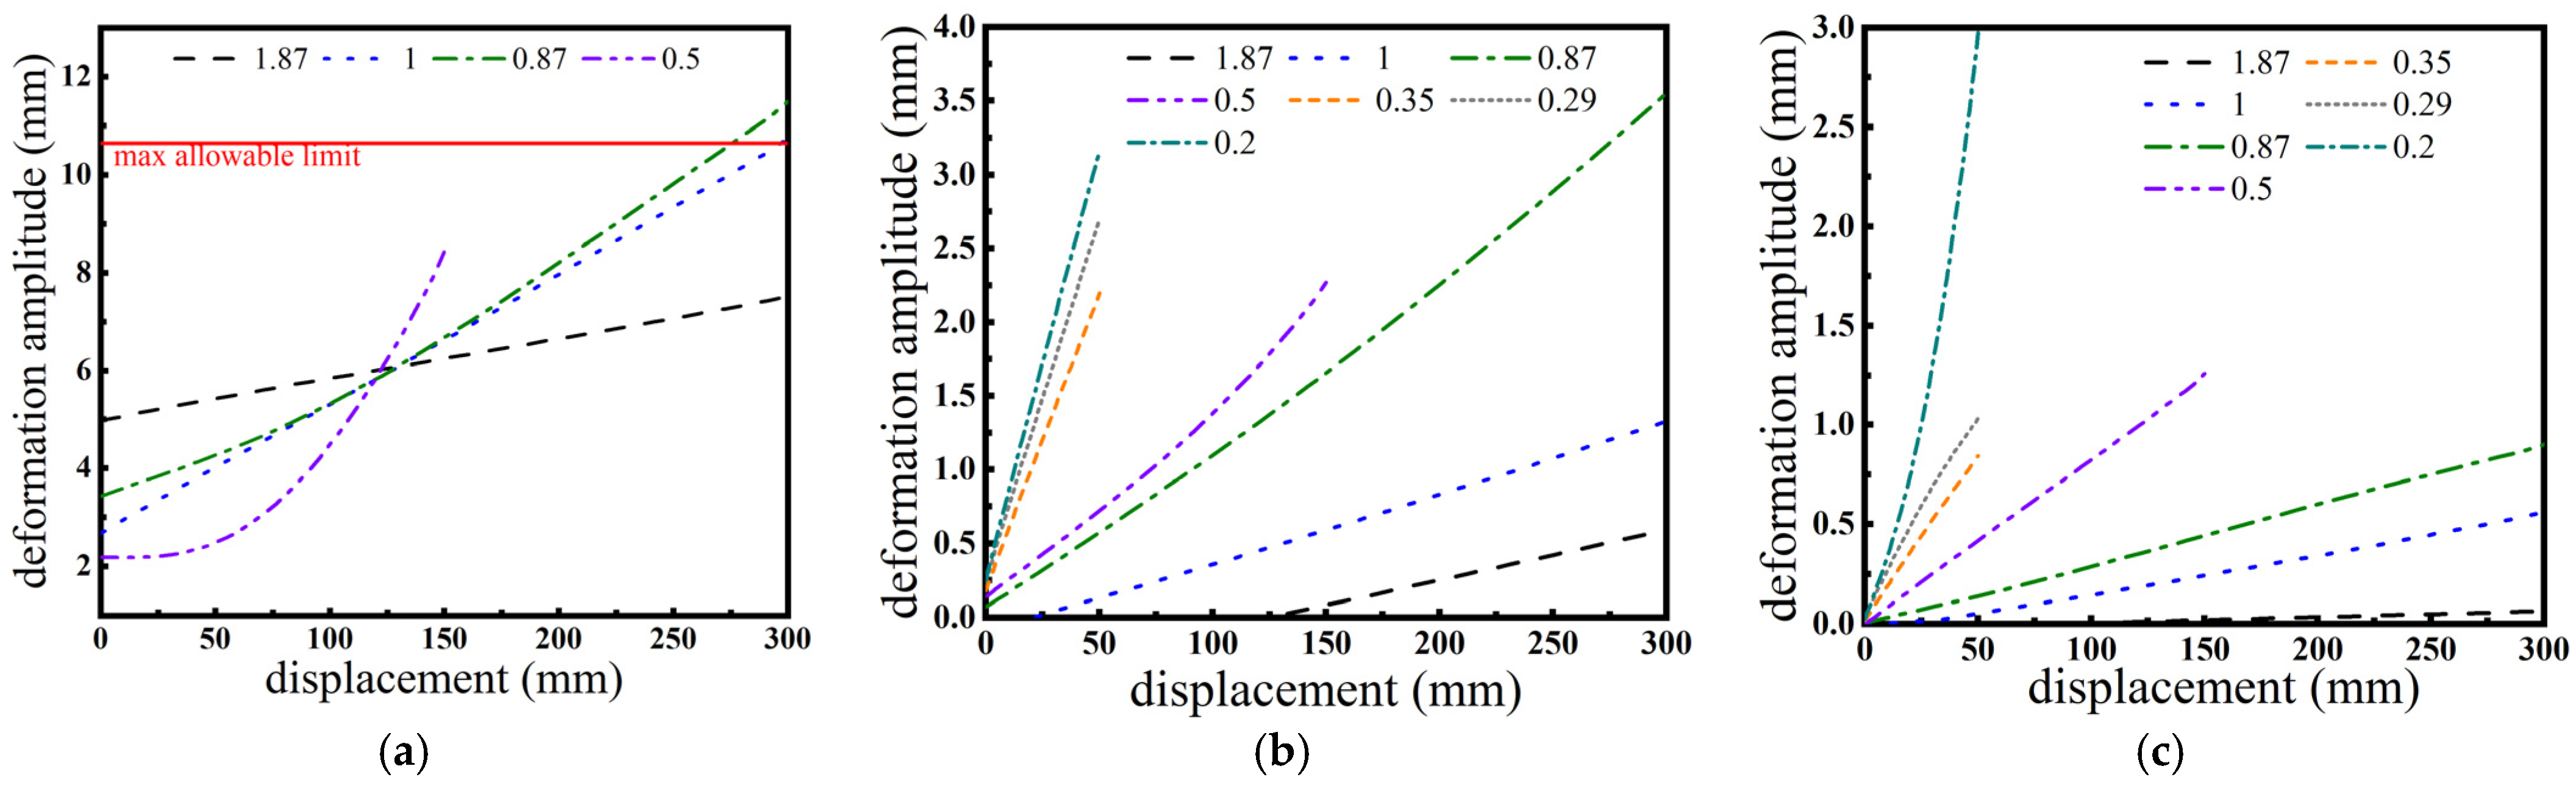
The parametric analysis shows that, within the scope of this study, H B R is the most important geometric parameter governing sensitivity to local instability. Figure 15 indicates that, under two-point support, specimens with lower H B R values exhibit faster distortion growth at smaller loading displacements, suggesting that they have less capacity to dissipate deformation energy through global bending. As H B R increases, the support-axis deformation response becomes milder. Although increasing the number of clamps substantially reduces distortion amplitude, it does not change the overall trend that low- H B R specimens are more prone to instability.
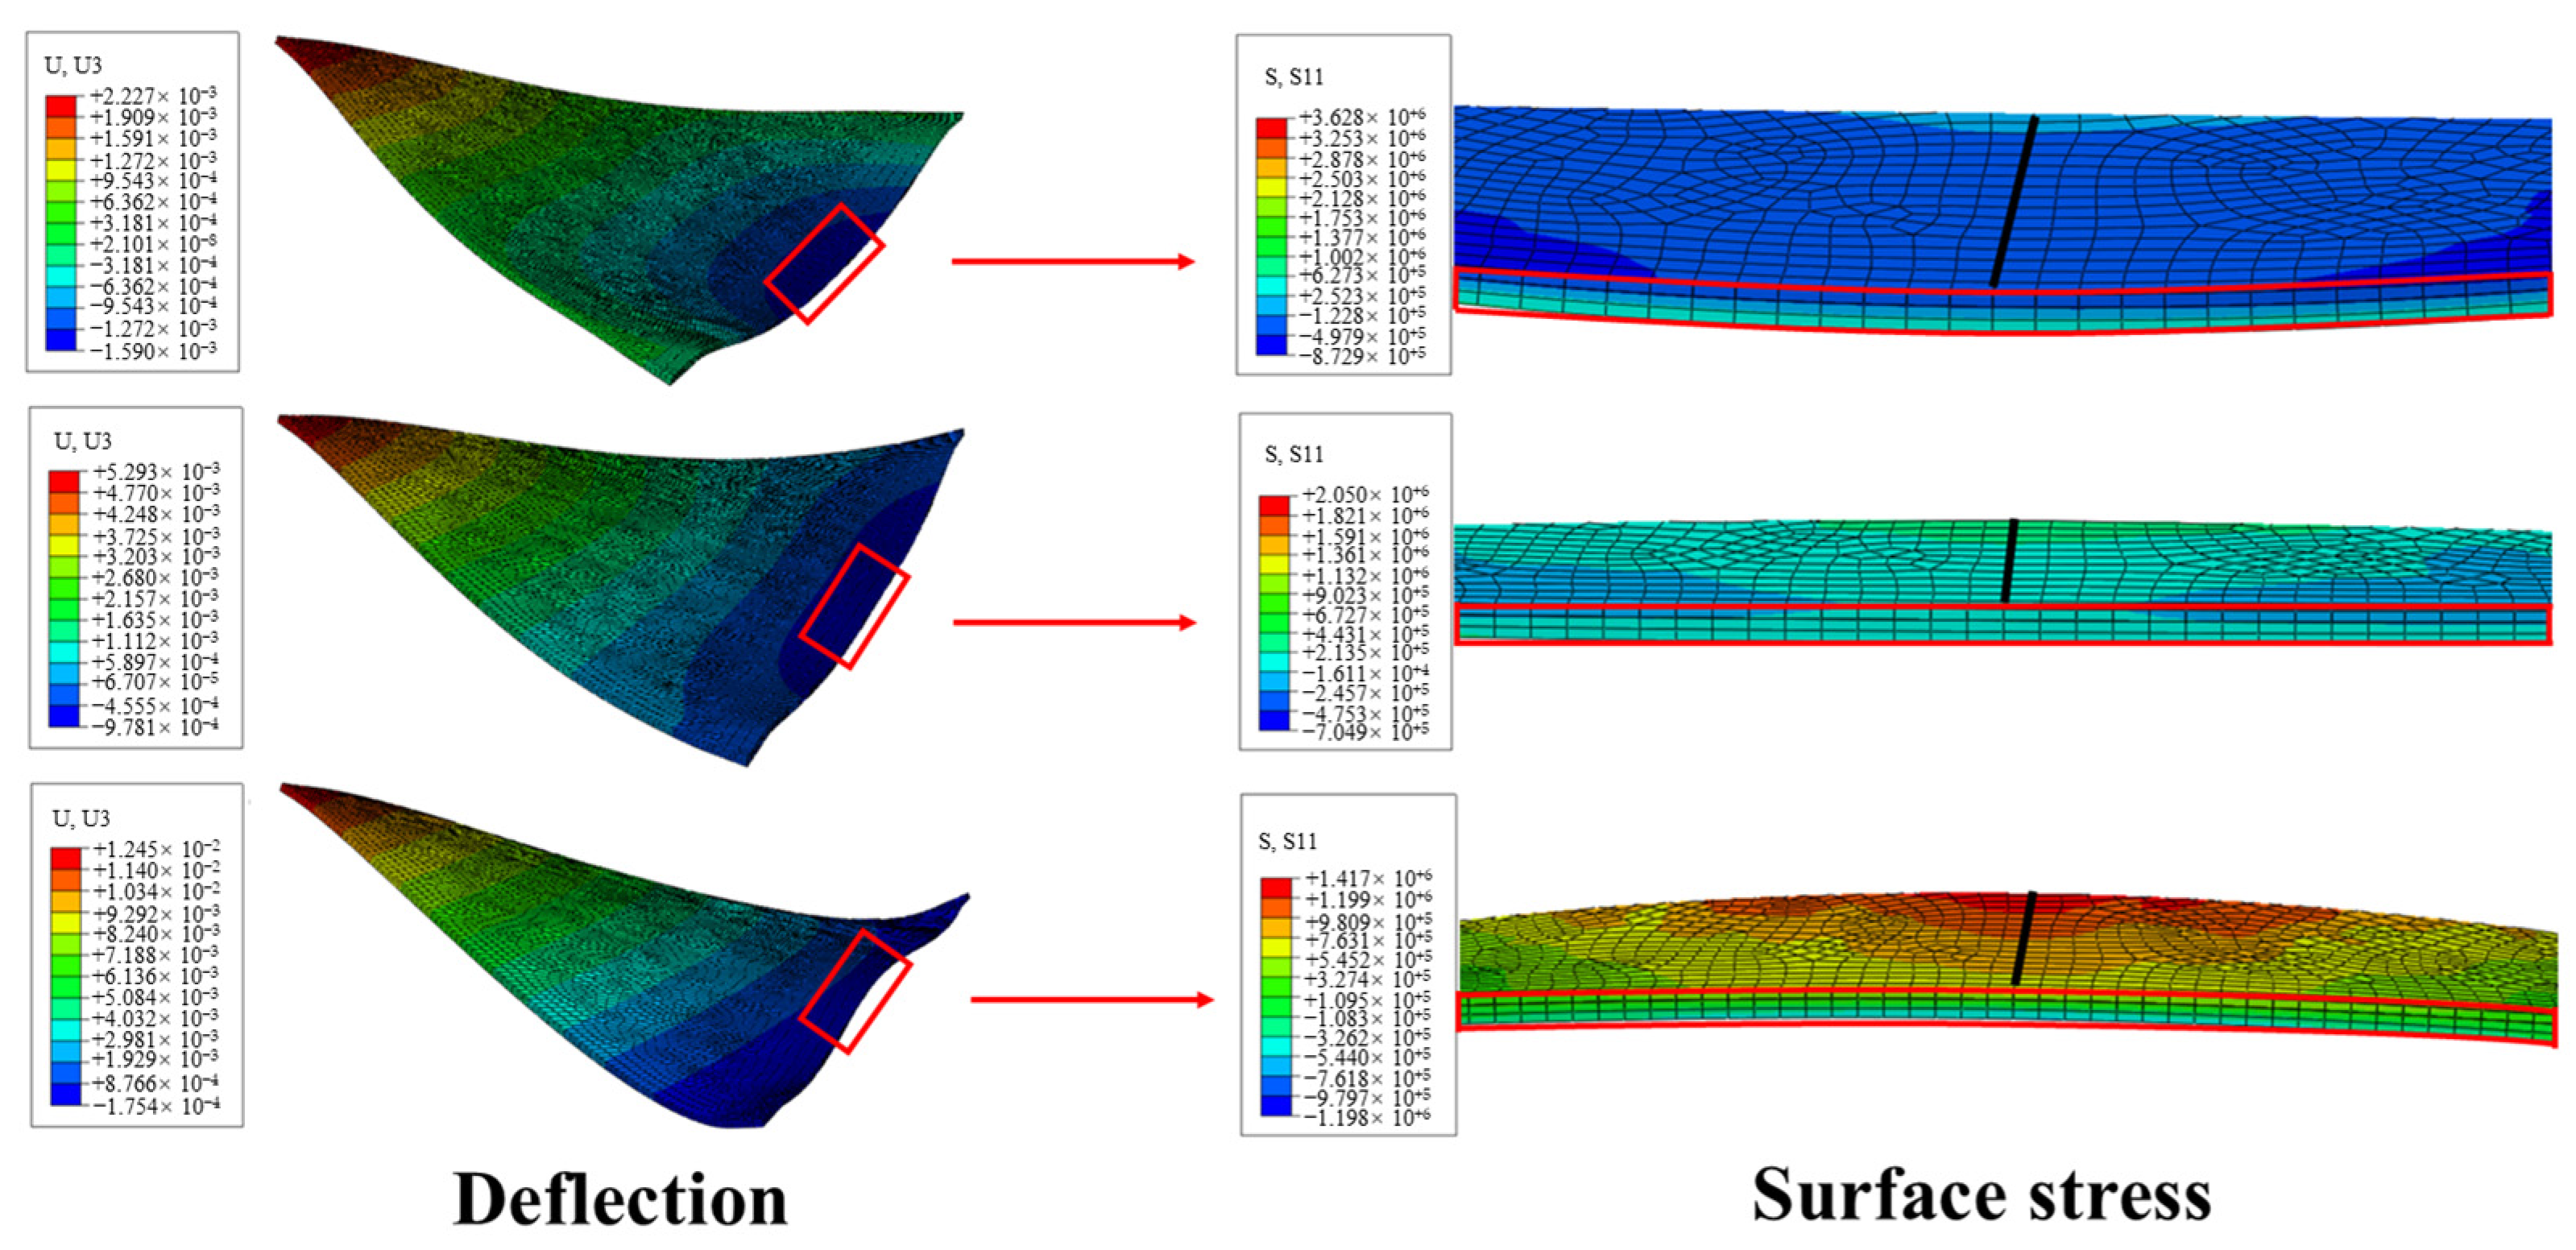
More importantly, when H B R falls below approximately 0.5, the two-point supported specimens exhibit response characteristics that differ distinctly from those of the other configurations (Figure 16). Local waveforms along the support axis amplify rapidly at small displacements, accompanied by deflection sign reversal and local distortion exceeding the allowable limit. Under these conditions, the panel is less able to dissipate deformation energy through global bending and instead tends to form localized membrane-force concentrations near the support axis, thereby triggering local instability. To illustrate the geometric nonlinearity associated with membrane-energy concentration, the contour plots in Figure 17 focus on stress redistribution and vertical-displacement evolution for the representative low- H B R configuration ( H B R = 0.29).

4.2. Effect of Length Ratio

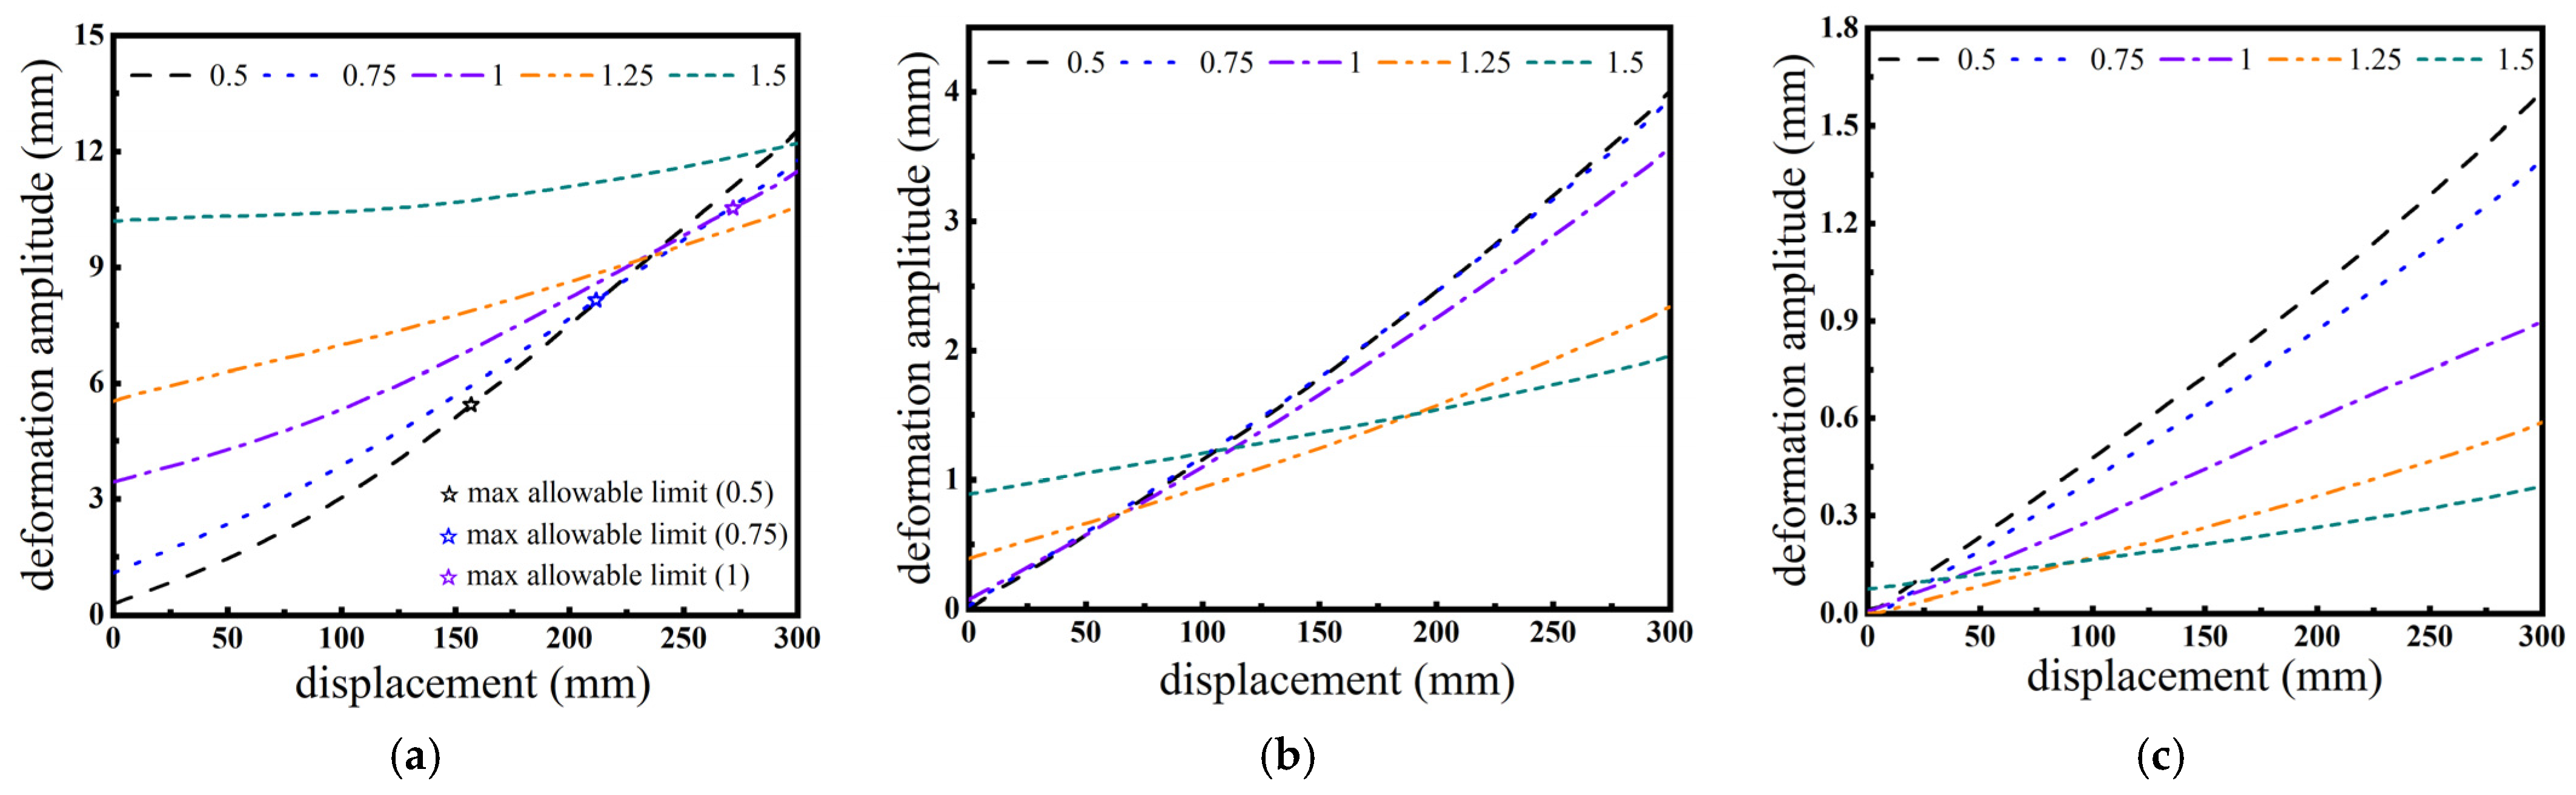
The length ratio also affects the cold-bending deformation mode. Under two-point support, specimens with larger length ratios exhibit more pronounced initial deflection because of self-weight. However, as the prescribed displacement increases, specimens with smaller length ratios show an accelerated deformation growth rate (Figure 18a). This behavior indicates that smaller geometric boundaries reduce the panel’s ability to dissipate structural energy through global flexural deformation, making deformation concentration near the support axis more likely. As the number of clamps increases, the overall deformation amplitude decreases for all length-ratio groups, demonstrating that discrete supports effectively control global bow deformation. Nevertheless, even under multi-point support, specimens with smaller length ratios remain more response-sensitive (Figure 18b,c).

4.3. Effects of Thickness and Loading Direction

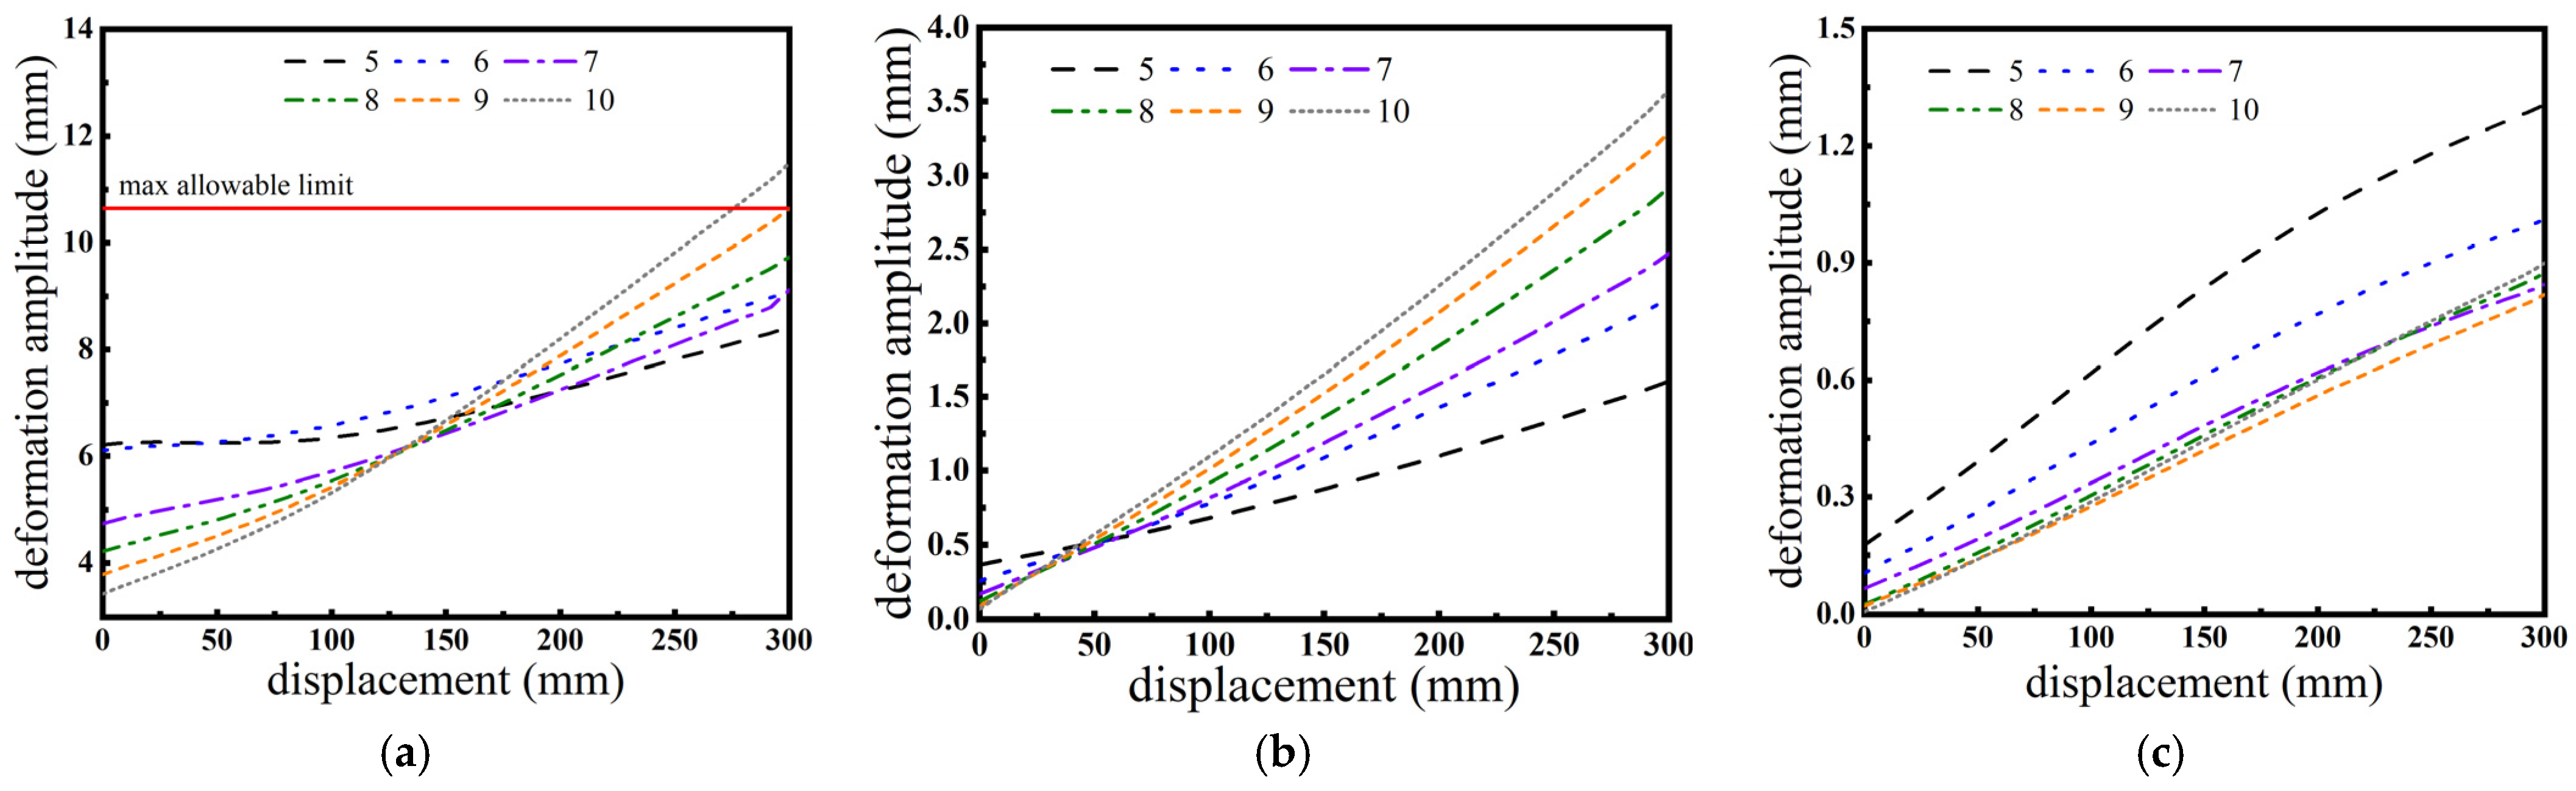
Plate thickness has a significant influence on the cold-bending response. The numerical results (Figure 19) show that, under displacement control, thinner specimens (t = 5–6 mm) are more sensitive to self-weight during the initial stage and therefore exhibit larger initial deflections along the support axis. Conversely, thicker specimens (t = 9–10 mm) show more pronounced bending–membrane coupling at larger imposed displacements, resulting in clearer geometrically nonlinear growth. Thus, plate thickness affects not only bending stiffness but also the competition between bending and membrane effects during large deflection. Increasing the number of clamps significantly suppresses out-of-plane large-deflection distortion for panels of all thicknesses (Figure 19b,c).
The interaction between loading direction and gravity markedly influences curvature evolution (Figure 20). Under forward loading, in which the loading direction is aligned with gravity and vertex A is pulled downward, the initial gravitational pre-deformation provides a complementary initial curvature. As the imposed displacement increases, this pre-deformation accumulates, causing the unsupported edges to enter the geometrically nonlinear large-deformation state rapidly. This accelerates membrane-stress accumulation and triggers early bifurcation, forming a W-shaped local wave pattern (Figure 20a,b). Under reverse loading, in which vertex A is pushed upward opposite to gravity, gravity acts as a stabilizing restoring potential that counteracts the out-of-plane cold-bending field. This stabilizing effect delays the onset of bending–membrane coupling and produces a monotonic and stable curvature-evolution path (Figure 14a and Figure 20c).
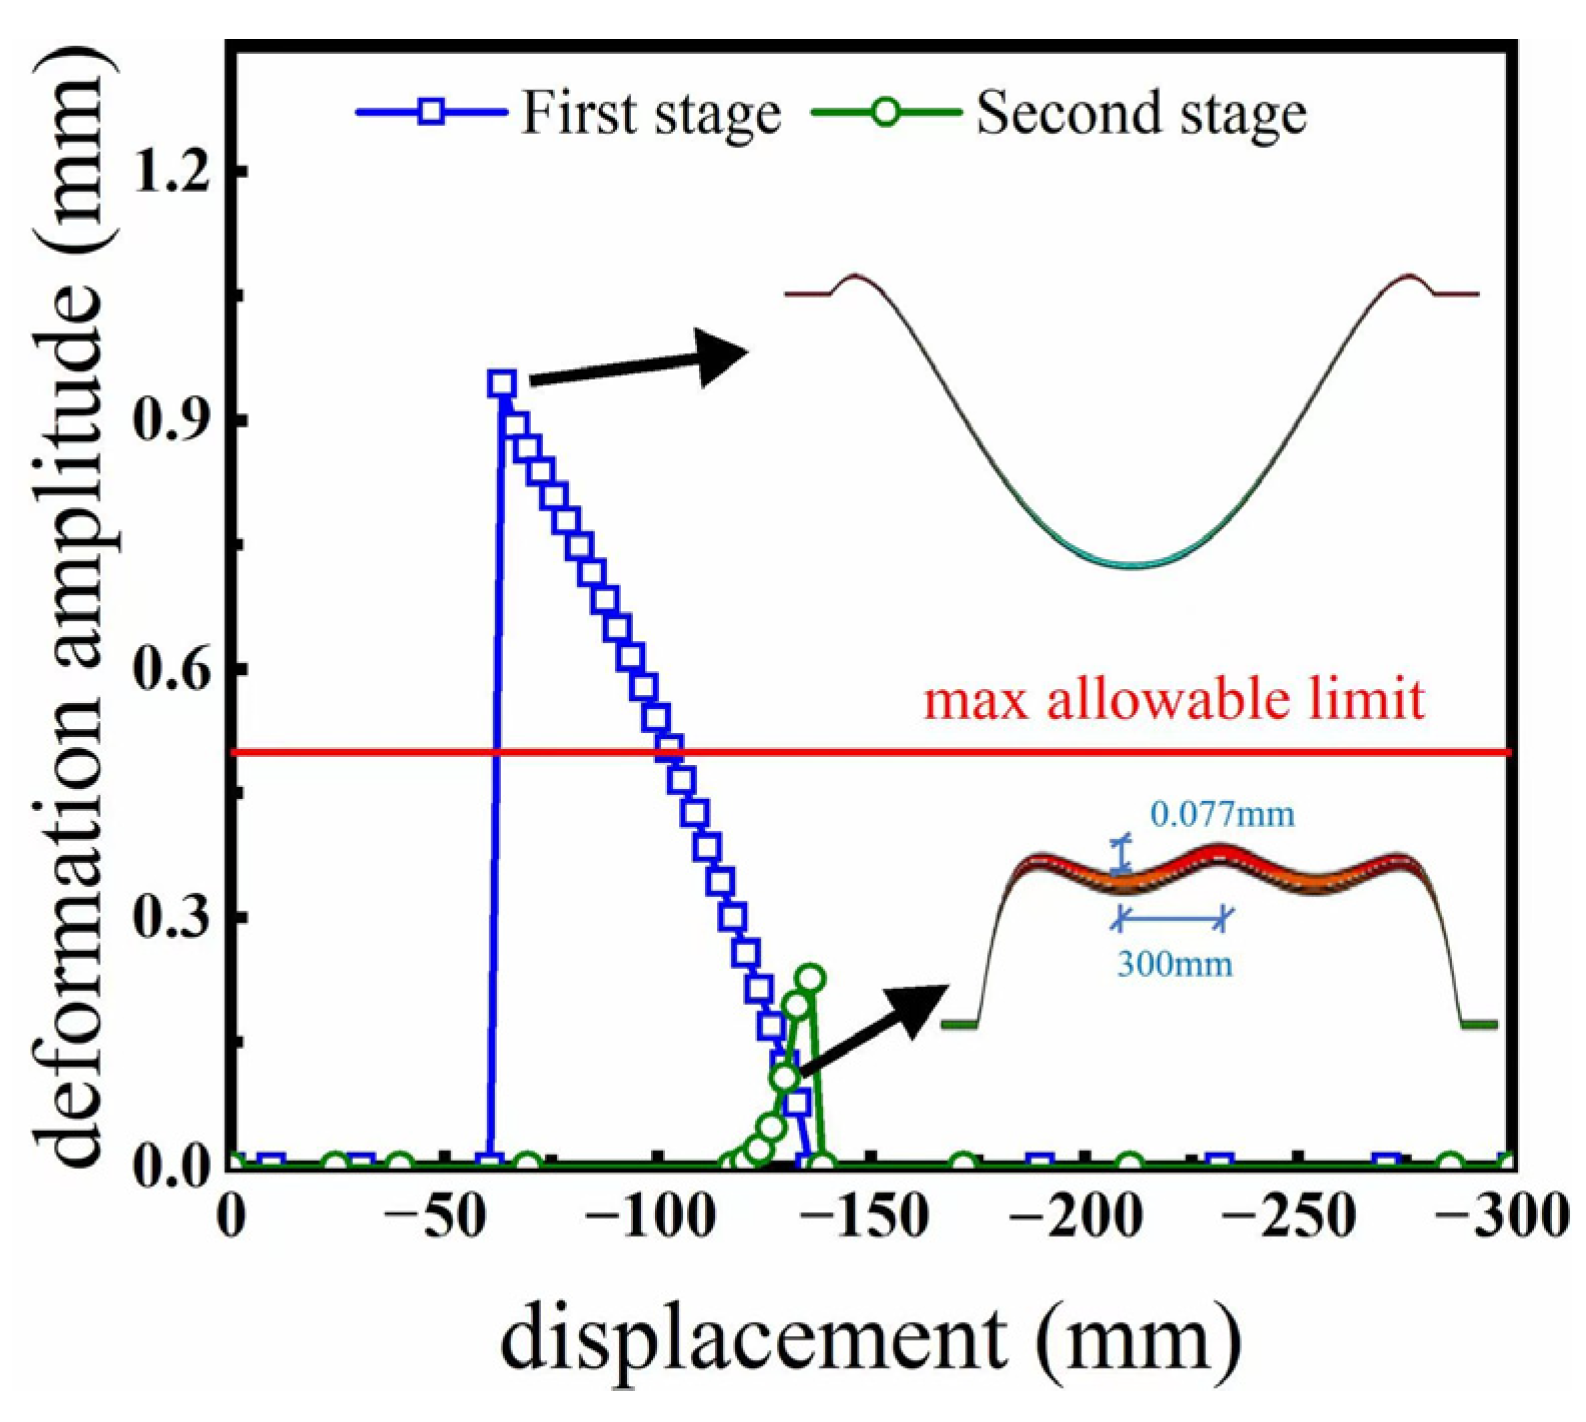
For the complex instability path induced by forward loading, the support-axis distortion exhibits distinct staged peak formation. In the first stage, during the initial phase of curvature reversal, the two discrete clamps impose strong normal-displacement constraints. Under the coupled effects of gravity and forward cold-bending load, pronounced incompatible deformation develops in the free spans between clamps. Driven by the strong membrane effects induced by large out-of-plane deflection, compressive membrane stress accumulates rapidly near the free edges and reaches the critical level for local instability. This localized strain-energy concentration excites a prominent initial wave peak in the free span near the constrained boundary. This wave peak is a physical instability feature of a thin plate under large deformation rather than a numerical artifact caused by idealized boundary conditions. The simulation results show that, during this stage, the local wave-distortion amplitude rapidly increases to approximately 0.95 mm, exceeding the 0.5 mm optical-quality limit over a 300 mm measurement window specified in EN 12150-1. This indicates that forward loading can induce early local optical failure at very small displacements.
In the second stage, as the imposed displacement increases further, the structure can no longer maintain the highly energized local-instability state of the first stage and undergoes a nonlinear transition to higher-order modes. Figure 21 shows that a second distinct wave peak develops in the support-axis mid-span region, forming a symmetric dual-peak (W-shaped) morphology. Meanwhile, the distortion energy initially concentrated in the local free span is redistributed over a wider region, causing the local wave peak to evolve from sharp to gradual and reducing the absolute local drop within the 300 mm sliding window to approximately 0.25 mm. This reduction in local distortion amplitude does not indicate that the structure has returned to a safe state; rather, it reflects the diffusion of instability energy from local concentration to global distribution. Within the investigated range, local wave distortion associated with forward loading is more pronounced and therefore more detrimental to optical quality.

5. Discussion

The nonlinear mechanical response and localized waveform behavior observed in this study differ substantially from the cold-bending mechanisms reported for conventional rectangular facades. The classical benchmarks of Galuppi et al. [12] and Datsiou et al. [13] showed that square or quadrilateral plates subjected to corner displacement undergo symmetric diagonal buckling or global curvature reversal once membrane action becomes dominant. By contrast, the triangular geometries examined here, together with their highly constrained vertex configurations, introduce pronounced geometric heterogeneity. Because the boundary constraints act only along the base support axis, the resulting flexural-membrane interaction limits energy dissipation through global shell-like action and forces strain concentration into the unsupported spans. This mechanism increases the susceptibility to sudden localized snap-through or micro-wave distortion before the macroscopic material stress boundary is reached.
From a structural-mechanics and engineering perspective, the discrete point-clamping configuration validated in this study offers clear construction and technical advantages over conventional continuous rigid framing. Continuous boundary locking can make glass facades overly sensitive to thermal expansion and installation deviations, producing localized stress concentrations that may lead to premature brittle fracture. By replacing continuous framing with discrete clips, the localized multi-point release configuration provides sufficient in-plane degrees of freedom. This suppresses stress-peak amplification while maintaining a practical balance between shape-control stability and structural safety. For modern architectural and parametric design, the findings provide explicit guidance for using dynamic free-form triangular meshes without introducing over-constraint failure, thereby defining safe operational limits for cost-effective cold-bent architectural envelopes.

6. A Semi-Empirical Reduced-Order Representation Inspired by Von Kármán Plate Theory

6.1. Kinematic Representation of Out-of-Plane Deformation

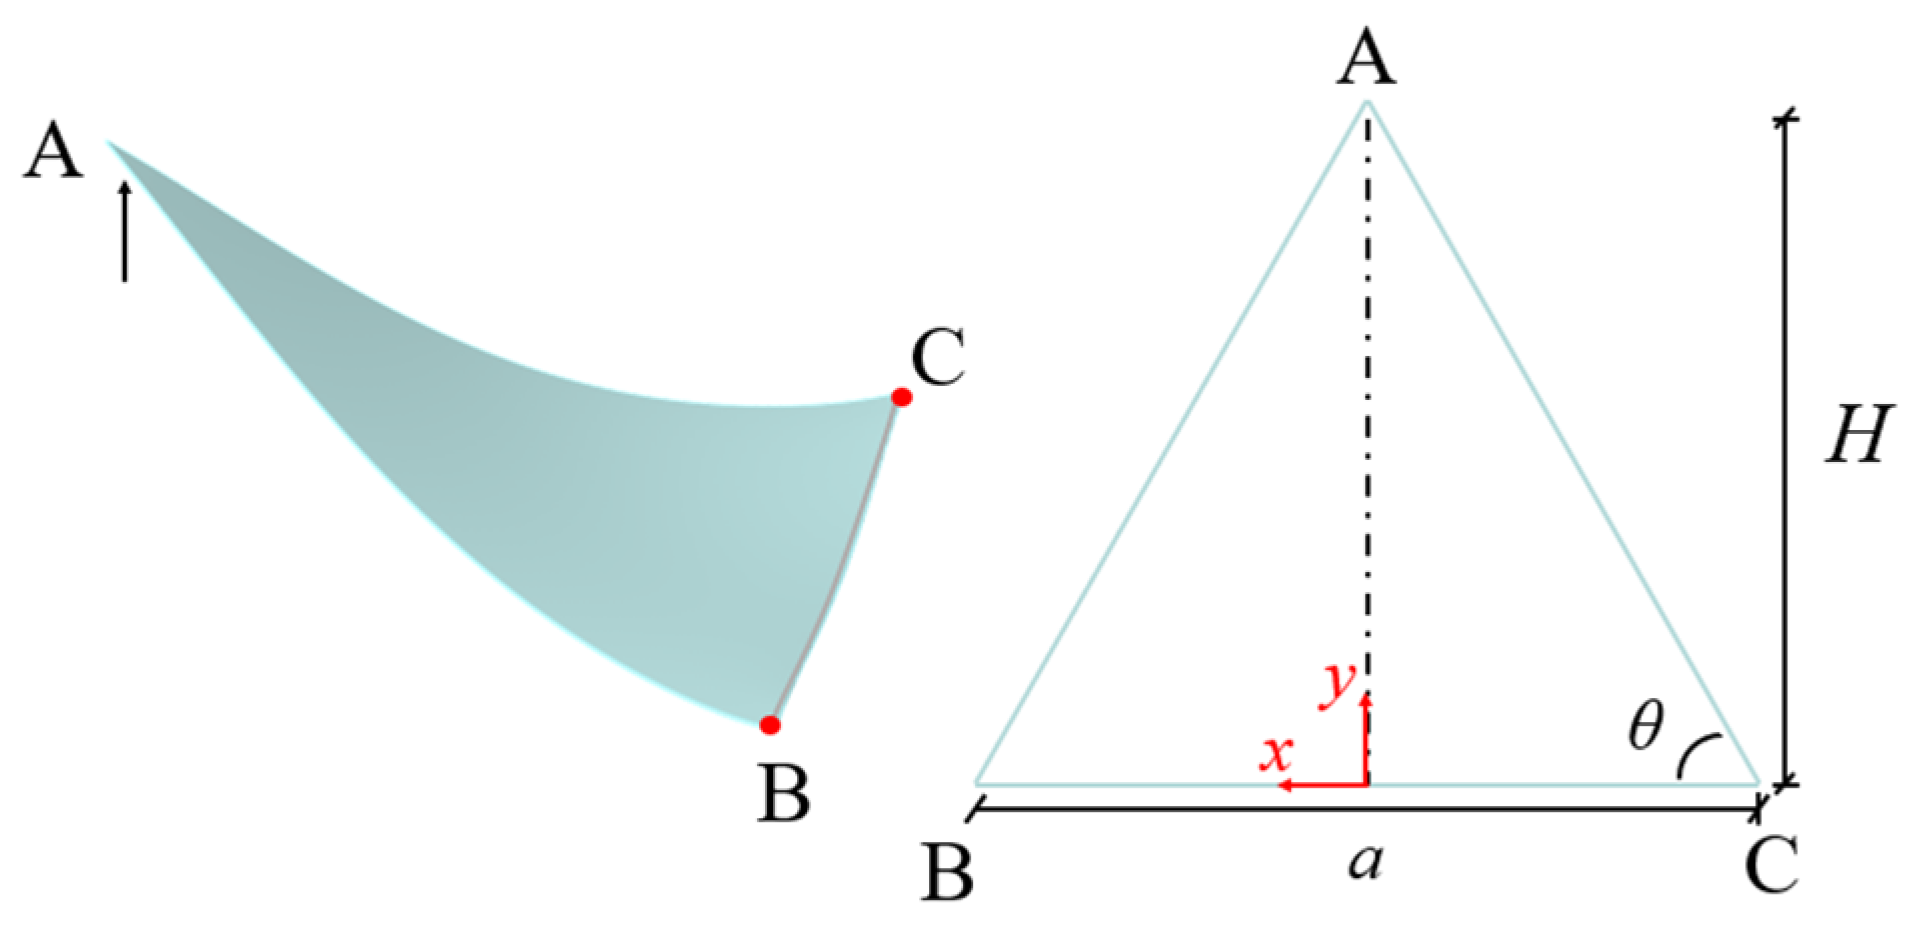
For the isosceles triangular glass plate, a local Cartesian coordinate system is established. The support axis serves as the x -axis, with its midpoint acting as the origin. The altitude direction along the base is the y -axis, the base length is a , and the height is H (Figure 22). Gravitational loads and an upward concentrated force ( P ) at vertex A are explicitly incorporated into the formulation. To simplify the analytical derivation, the constraint boundary conditions imposed by the discrete clamps are idealized as localized displacement constraints along the support axis. This approach aims to extract the dominant kinematic traits rather than precisely reconstructing the local stress–strain fields within the immediate fixture contact zones.
For the support axis of the panel, modal superposition is used to construct a shape function that can represent both global bow deformation and local wave deformation. The formulation superposes the fundamental mode and symmetric higher-order wave modes. The fundamental arching mode represents the overall bending response before instability and is expressed as:
f b x = C 0 1 4 x 2 a 2 2
where C 0 represents the amplitude characteristic parameter of the basic arch-shaped mode. At the discrete boundaries of the fixed points ( x   =   ± a / 2 ), the motion constraint conditions ( f b ± L / 2 = 0 , f b ± L / 2 = 0 ) are satisfied.
To capture the W-shaped multi-peak symmetric curves derived after the critical instability point, wave modes multiplied by higher-order even functions are introduced, and an amplitude parameter C 1 for higher-order modes is assigned. This higher-order function mathematically guarantees complete orthogonality and zero-displacement/zero-slope traits at the clamp zones ( f w ± L / 2 = 0 , f w ± L / 2 = 0 ) while providing the mathematical degrees of freedom required to delineate localized wrinkling.
f w x = 4 C 1 x 2 a 2 1 4 x 2 a 2 2
The support axis function f ( x ) of the final plate can be expressed as:
f x = 1 4 x 2 a 2 2 C 0 + C 1 4 x 2 a 2
To analyze the physical nature of the morphological framework, the modal coefficients C 0 and C 1 control the different components of the energy redistribution path. Specifically, C 0 represents the overall bending effect during pre-buckling. Conversely, C 1 indicates the higher-order wave components triggered by the accumulation of plane membrane strain energy. The nonlinear growth and mutual coupling of C 0 and C 1 mathematically depict the bifurcation process of the structure from a stable bending state to a locally waveform unstable state.
Based on the tests and finite element predictions, the loading-axis curve of the panel can be approximated by a quadratic polynomial. Therefore, the loading-axis shape function is assumed to consist of a linear component and a quadratic correction term. The linear component is expressed as:
g l i n e a r y = C 0 1 + w A C 0 C 0 H y
where the forced displacement at the loading point A of the apex of w A , when y = 0 , satisfies g ( 0 ) = C 0 ; and when y = H , it satisfies g ( H ) = w A .
For the second correction term, there is:
g c u r v a t u r e y = β y 1 y H
where β is the curvature correction coefficient, which is responsible for considering the bending concavity along the load axis caused by the non-coordinated boundary, thereby ensuring that the displacements within the triangular plane are consistent. This correction term is always zero at y = 0 and y = H , thus strictly ensuring the displacement coordination boundary conditions of g ( 0 ) and g ( H ) .
Therefore, the final shape function is:
g y = C 0 1 y H + w A y H + β y 1 y H
To achieve the coupling of in-plane coordinates, the support axis function f ( x ) is first normalized to eliminate the absolute amplitude, resulting in a basis function whose value range is distributed in [−1, 1]. Then, it is orthogonally mapped with the load axis displacement function g ( y ) . The normalized support axis shape function f ¯ ( x ) can be expressed as:
f ¯ x = 1 4 x 2 a 2 2 1 + C 1 C 0 4 x 2 a 2
The displacement field formula of the plate w ( x , y ) is expressed as:
w x , y = f ¯ x C 0 1 y H + w A y H + C 0 β y 2 H y

6.2. Energy Interpretation Based on Von Karman Plate Theory

Because the out-of-plane deflection under weakly constrained cases significantly exceeds its own thickness, this paper adopts the von Karman large deflection plate theory to interpret the competitive relationship between bending energy and membrane energy. Within this framework, local instability can be understood as follows: as forced displacement increases, the panel gradually transitions from a bending-dominated response to a response where membrane effects significantly participate. When local membrane energy concentrates near the support axis to a certain degree, the original stable deformation path loses its advantage, and the structure shifts into a new local wavy branch [34,35]. The total potential energy of the system is composed of the bending strain energy U b , the membrane strain energy U m , and the external force potential energy e x t :
Π = U b + U m + Π e x t
According to Kirchhoff’s plate theory, the bending strain energy U b is:
U b = D 2 Ω κ x + κ y 2 2 1 ν κ x κ y κ x y 2 d Ω
where D = E t 3 12 ( 1 v 2 ) represents the flexural rigidity of the plate, K x = 2 w x 2 represents the curvature in the x-axis direction, K y = 2 w y 2 represents the curvature in the y-axis direction, K x y = 2 w x y represents the torsional curvature, and the integration domain Ω is defined as y   ϵ [ 0 , H ] and x   ϵ a 2 1 y H , a 2 ( 1 y H ) .
Substitute the assumed function w ( x , y ) :
U b = D 2 Ω f ¯ x g ( y ) 2 + f ¯ x g ( y ) 2 + 2 v f ¯ x g ( y ) f ¯ x g ( y ) + 2 f ¯ x g ( y ) + 2 1 v f ¯ x g ( y ) 2
During the cold-bending process of the triangular glass plate, when the magnitude of the out-of-plane deflection exceeds the plate thickness, the tensile deformation of the plate’s middle surface can no longer be ignored. At this time, the Kirchhoff plate theory based on the small deflection assumption is no longer applicable, and the von Karman large deflection plate theory considering geometric nonlinearity must be introduced. According to this theory, the in-plane strain is not only related to the linear gradient of the in-plane displacement, but also highly coupled with the nonlinear quadratic term of the out-of-plane deflection gradient. Its geometric equation can be expressed as:
ε x = u x + 1 2 w x 2
ε y = v y + 1 2 w y 2
γ x y = u y + v x + w x w y
Furthermore, the study introduces the Airy stress function Φ ( x , y ) . The complex in-plane mechanical response is transformed into solving a single scalar function Φ . According to elasticity theory, in a plane stress state without body forces (or constant body forces), the membrane stress components within the plate can be accurately expressed via the second-order partial derivatives of the stress function Φ ( x , y ) :
σ x = 2 Φ y 2 , σ y = 2 Φ x 2 , τ x y = 2 Φ x y
To ensure that the continuum inside the glass plate does not tear or overlap when undergoing large-deflection cold-bending deformation, its strain field must satisfy the Saint-Venant compatibility equations. By taking the second-order partial derivatives of the aforementioned nonlinear geometric equations respectively and eliminating the in-plane displacement components u and v , a compatibility equation containing only strain components and out-of-plane deflections can be obtained:
2 ε x y 2 + 2 ε y x 2 2 γ x y x y = 2 w x y 2 2 w x 2 2 w y 2
Under the assumption of an isotropic linear elastic material, substituting the expression of the Airy stress function into the generalized Hooke’s Law for a plane stress state, and thereby replacing the strain components in the aforementioned compatibility equation, allows the derivation of the von Karman compatibility equation:
4 Φ = E 2 w x y 2 2 w x 2 2 w y 2
where 4 = 4 x 4 + 2 4 x 2 y 2 + 4 y 4 represents the biharmonic operator, and E is the elastic modulus of the glass material.
Therefore, the film strain energy U m can be expressed as:
U m = t 2 E Ω 2 Φ 2 2 1 + v 2 Φ x 2 2 Φ y 2 2 Φ x y 2 d x d y
The external potential energy e x t is expressed as:
e x t = P w A + ρ g t Ω w x , y d x d y
where ρ represents the density of the glass, g represents the gravitational acceleration, t represents the thickness of the glass plate, and P represents the vertex force.
In principle, given the boundary conditions of discrete supports and substituting the aforementioned shape functions into the total potential energy functional, the controlling system of nonlinear algebraic equations can be obtained by solving the compatibility equation and applying the Rayleigh–Ritz method to extremize the total potential energy functional. However, for an isosceles triangular panel with discrete point supports, a closed-form solution to the compatibility equation is difficult to derive due to the coupling of the non-rectangular domain, the local rigid constraints of discrete clamps, and the concentrated displacement loading at the vertex. Consequently, this paper does not attempt to provide a closed-form critical instability solution, but instead utilizes the von Karman framework as a carrier to interpret the physical meaning of the morphological parameters ( C 0 , C 1 , β ). The genuine evolutionary rules of ( C 0 , C 1 , β ) with respect to geometric parameters ( L R , H B R , t ) and loading displacement δ A will be calibrated in the following section via nonlinear inversion regression and response surfaces upon the experimentally validated finite element database.
C 0 = 0 , C 1 = 0 , β = 0

6.3. Response-Surface Representation of Instability-Sensitive Shape Parameters

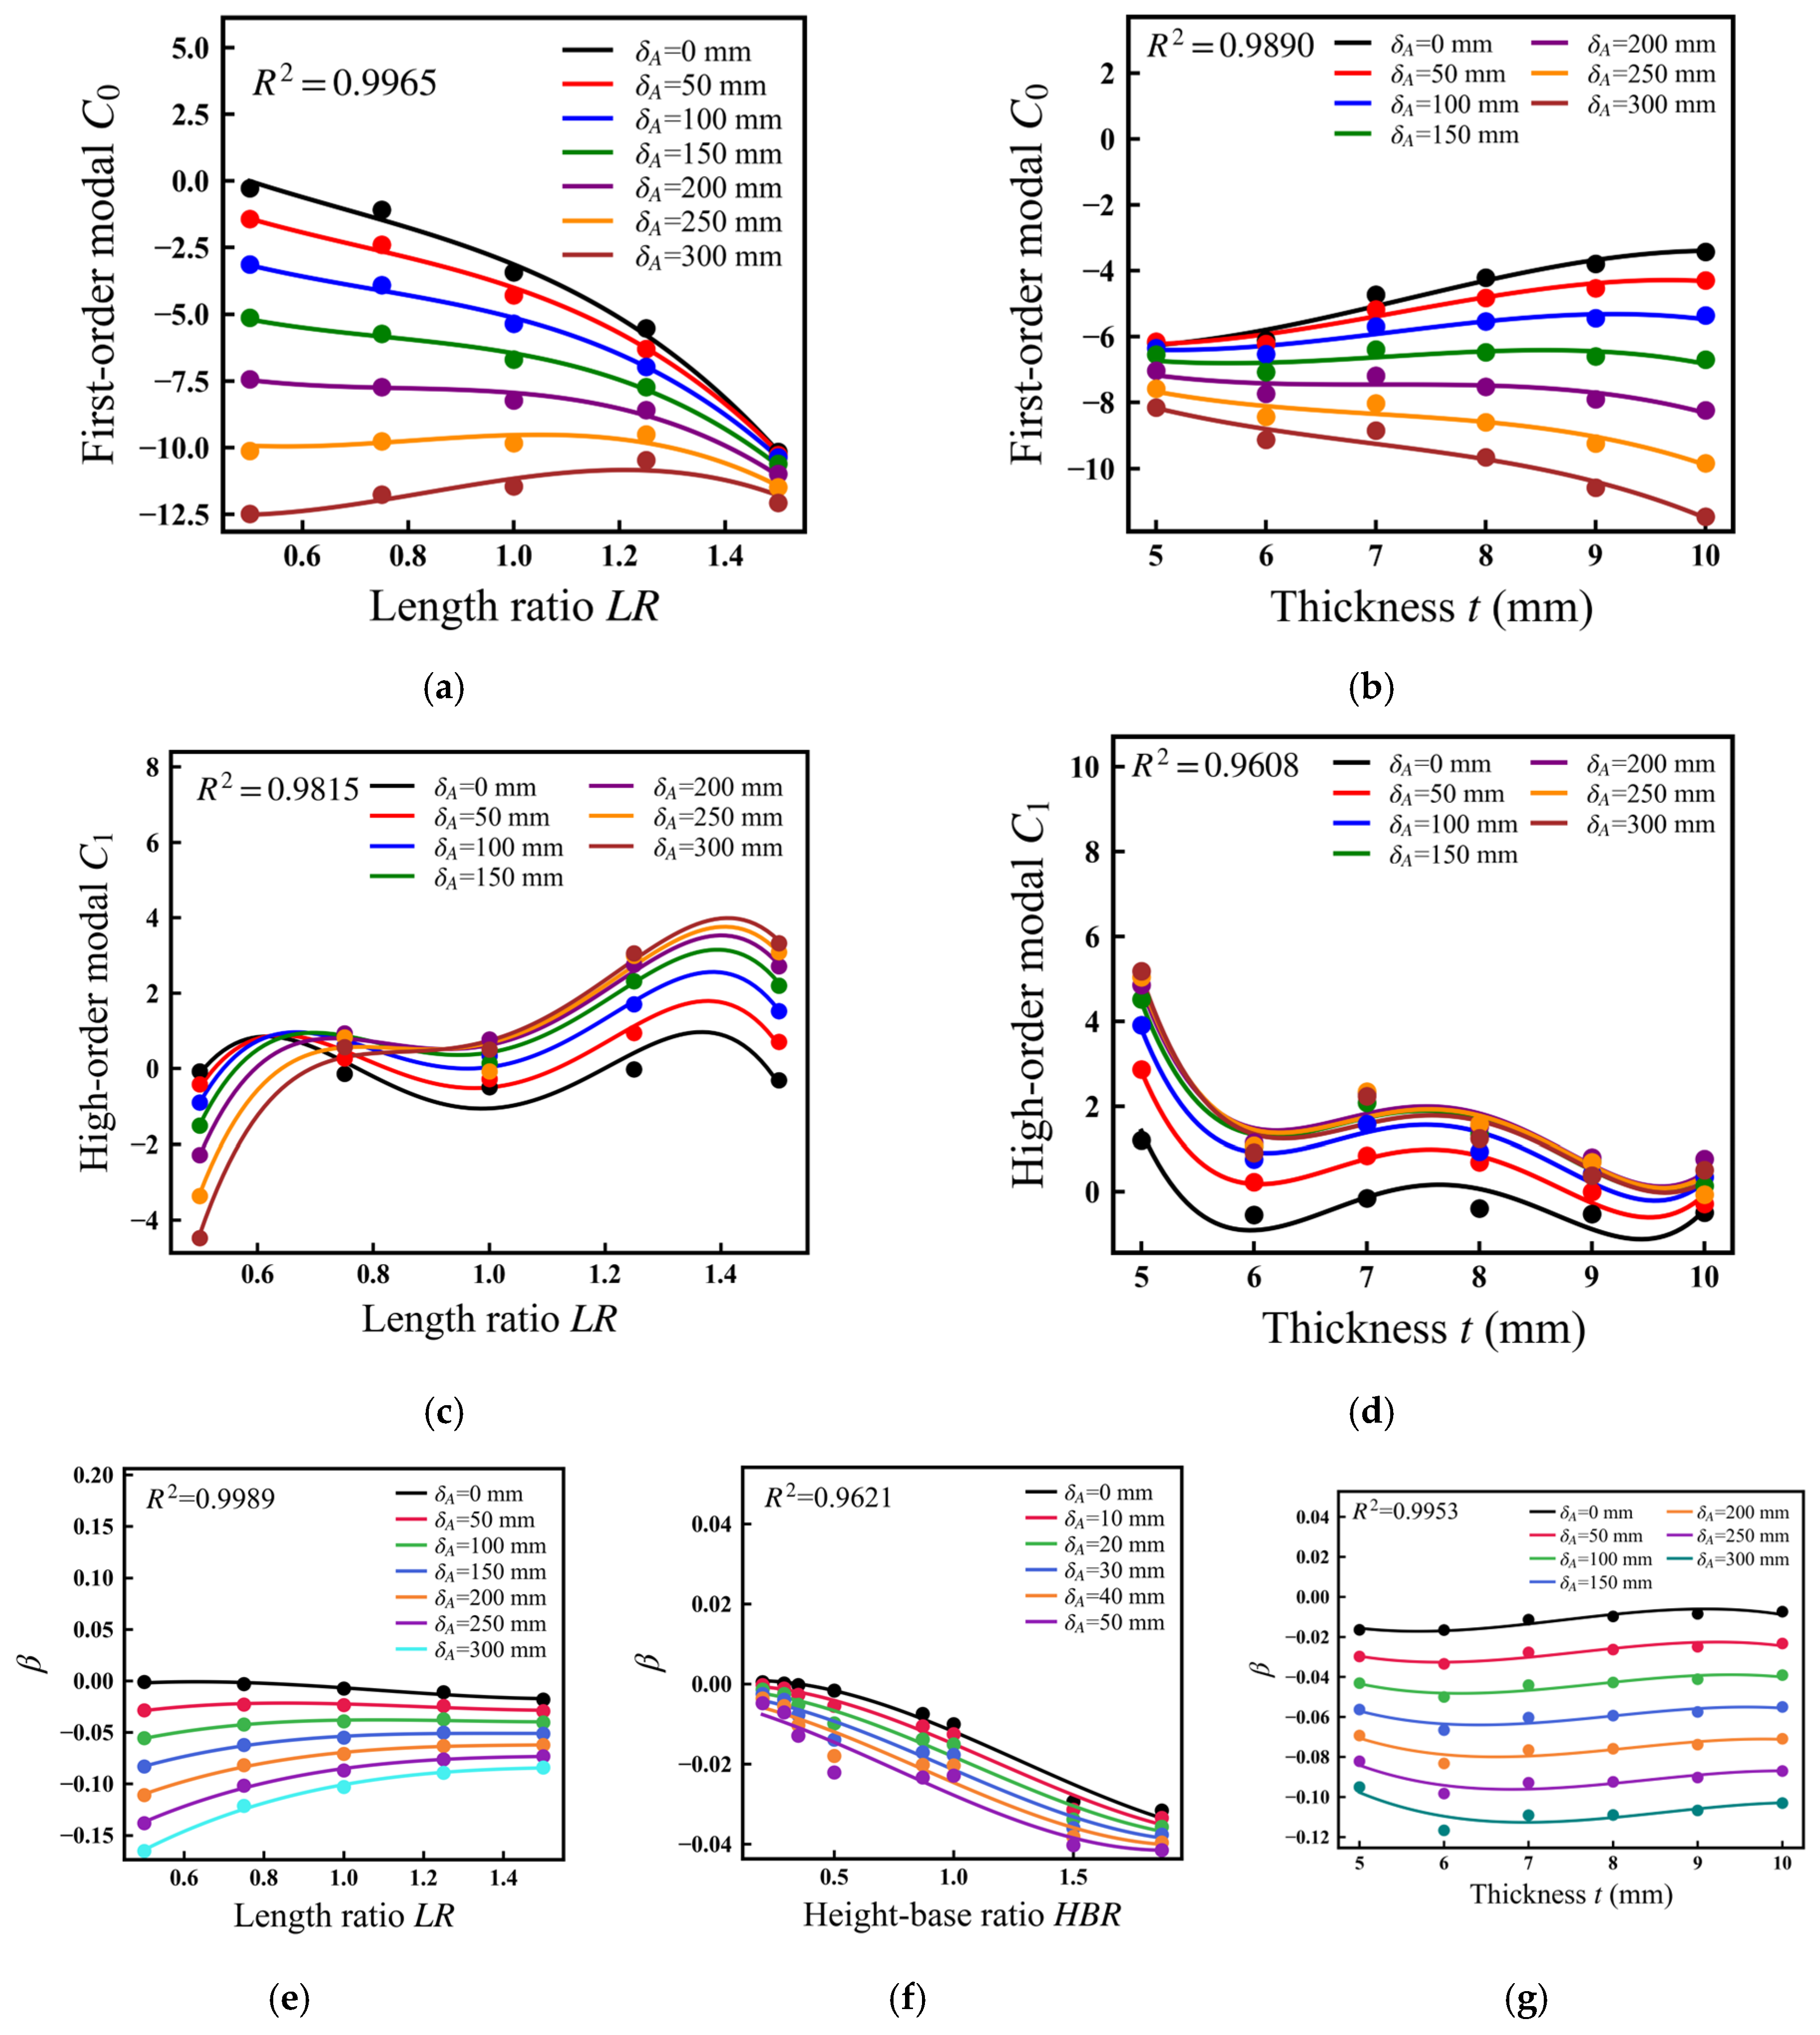
For two-point clamp load cases, the system extracts spatial morphological evolution data of the support axis and load axis under each parameter combination. Employing the previously derived shape functions as a basis (Equations (3) and (6)), nonlinear least-squares inversion is performed to extract morphological characteristic parameters ( C 0 , C 1 , β ) case-by-case and step-by-step. To depict the global evolution trends of these parameters within the multidimensional geometry-load space, a bivariate polynomial response surface is introduced [36]:
Ψ ξ , δ A = i = 0 n j = 0 m p i , j ξ i δ A j
where ψ  represents the shape variable to be predicted ( C 0 , C 1 , β ), ξ  mapping to generalized geometric independent variables ( L R , H B R , t ); p i ,   j  are response surface coefficients determined by nonlinear numerical optimization, with specific values detailed in Appendix A; and ( n , m ) represent the truncation orders of the response surface, determined by progressively increasing the order via R 2  convergence comparison.
For C 0  and β  under geometric independent variables L R  and t , as well as β  under H B R , their evolution trajectories are relatively smooth and continuous across the parameter space (Figure 23a,b,e–g), and excellent fits with R 2 > 0.95  can be obtained using third-order bivariate polynomials ( n = m = 3 ). The higher-order mode C 1 , which dictates local distortion, exhibits continuous nonlinear evolution (Figure 23c,d), requiring n = m = 4  to simultaneously satisfy global R 2 > 0.97  and prevent divergence at local extremums. It is worth noting that in the modal superposition method, C 1  inherently represents the symmetric higher-order components in true deformation that cannot be independently explained by the fundamental bow mode C 0 . Thus, the nonlinear growth of C 1  with δ A  is one of the necessary conditions for local instability, but not a sufficient condition. When the panel experiences stable bending deformation due to geometric proportion or thickness extremes (e.g., L R =  0.5 or 1.5, ultra-thin plate t =  5 mm) to satisfy boundary compatibility conditions, it will also excite the nonlinear growth of C 1 ; however, this is not accompanied by sign reversal and deflection mutation in C 0 , and therefore does not qualify as local instability.
Based on the above physical understanding, this paper explicitly establishes the engineering criterion for identifying local instability as the simultaneous fulfillment of the following two conditions: (i) C 1  exhibits discontinuous jumps with δ A ; (ii) Concurrently, C 0  undergoes a sign reversal and displays significant discontinuous inflection points with C 0 . Local instability is determined to have occurred only when (i)  (ii) is satisfied.
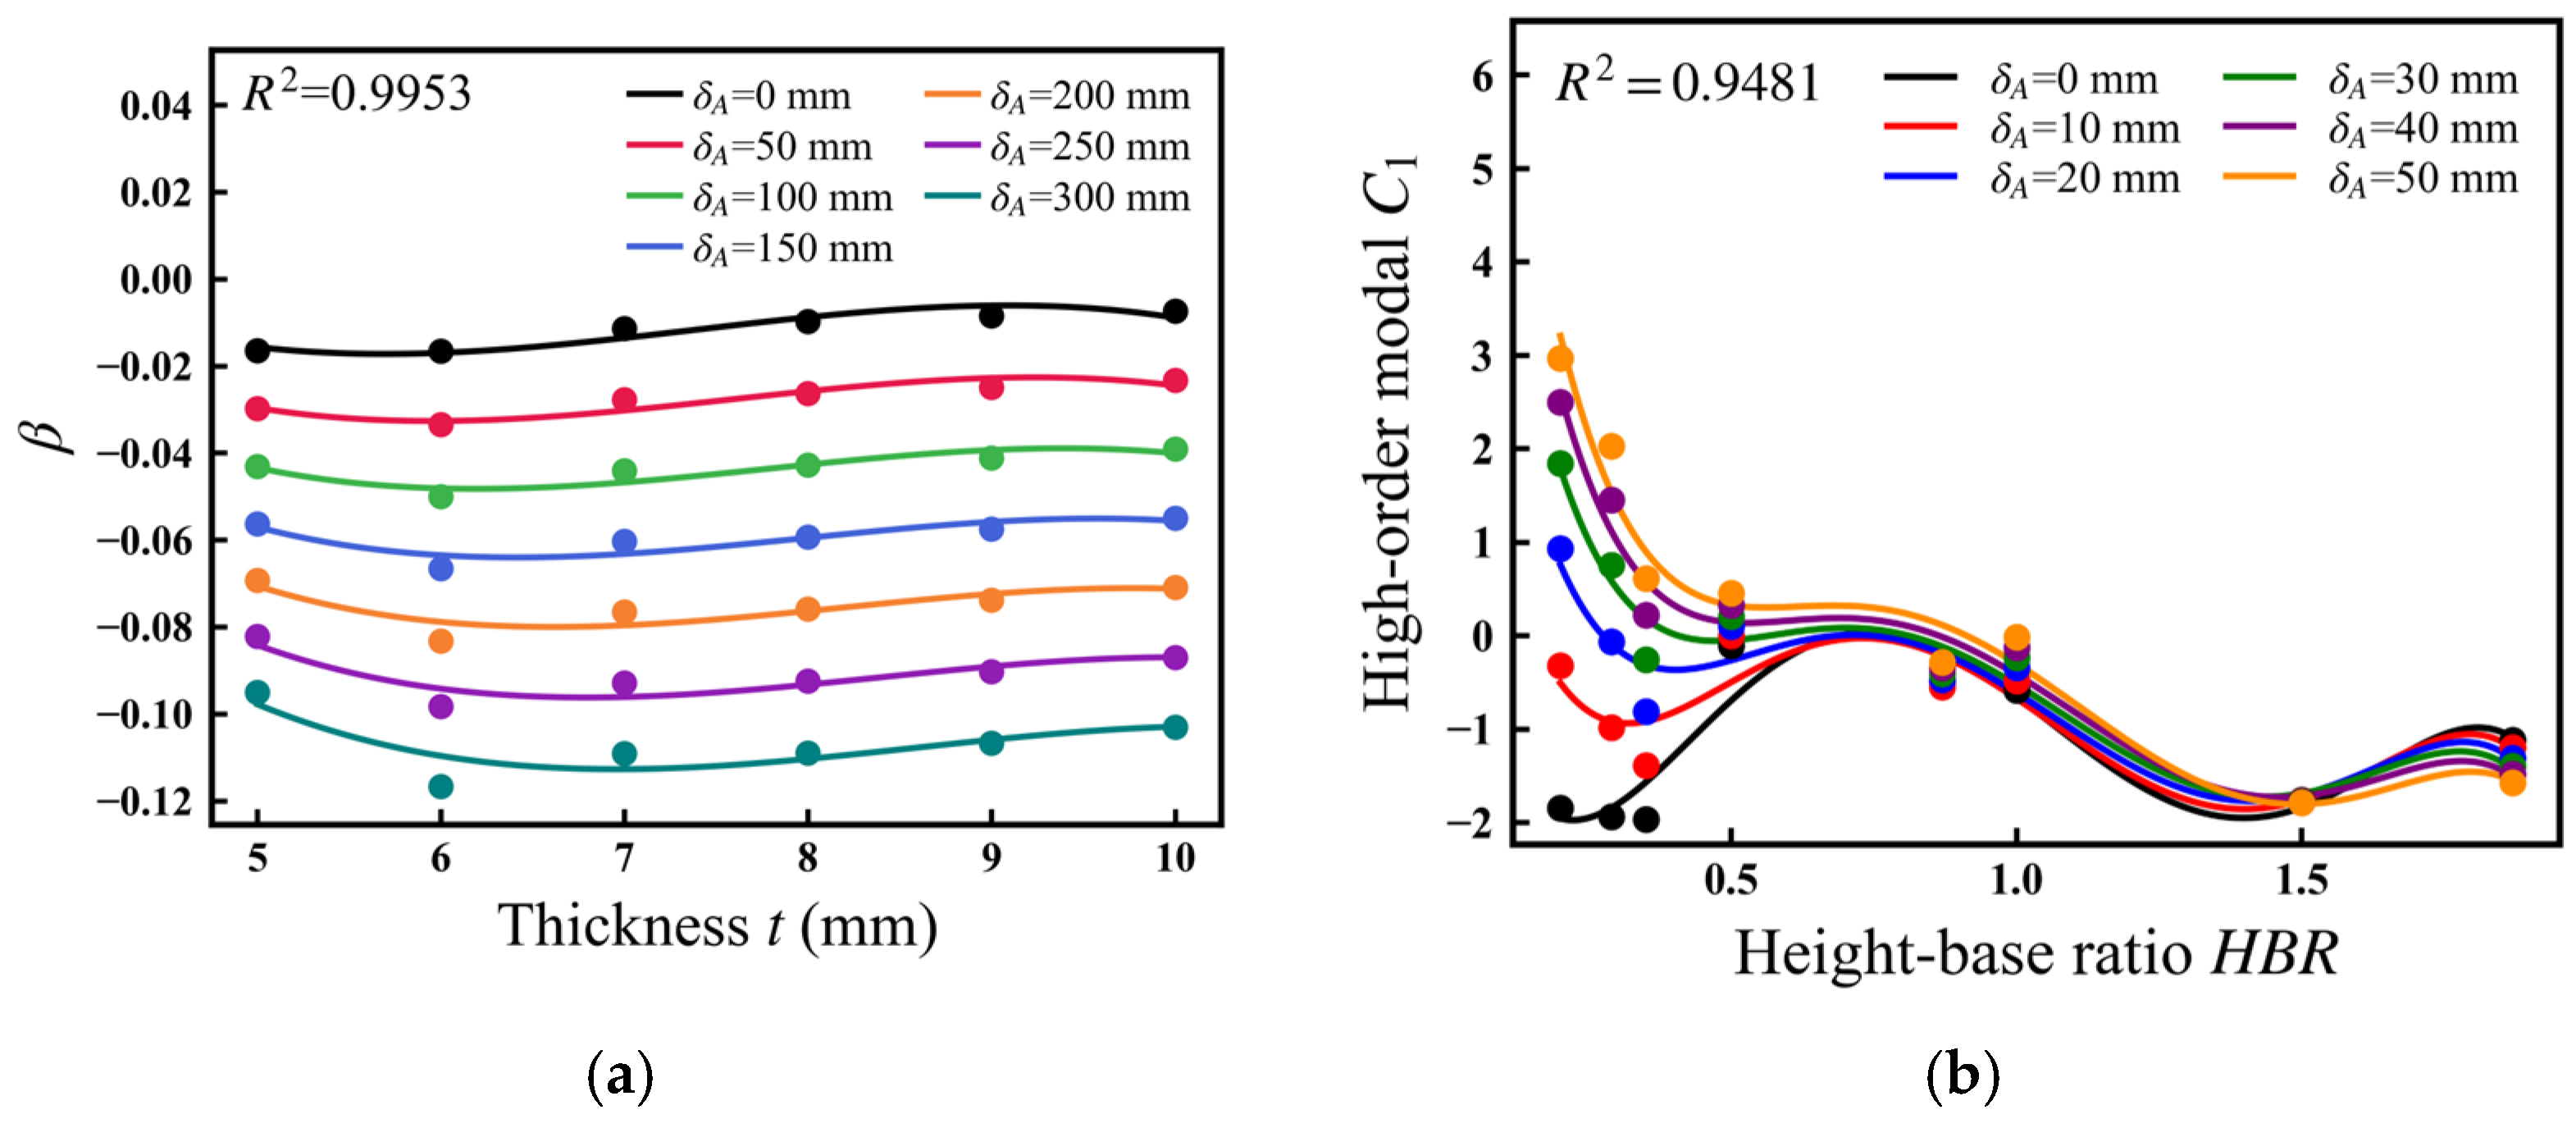
For H B R , C 0  can be accurately described using an n = m = 4  order response surface; however, extremely low H B R  induces severe nonlinear features in C 1 , necessitating an escalation to n = m = 5  order to precisely track its trend without sacrificing global convergence. For panels with extremely low height-to-base ratios ( H B R  < 0.5), the response surface displays a pronounced dual-surge characteristic (Figure 24); specifically, as δ A  increases, not only does C 1 , representing the higher-order mode, experience a discontinuous jump (satisfying condition i ), but the fundamental mode C 0  also displays a discontinuous surge (satisfying condition i i ), thereby simultaneously fulfilling the aforementioned local instability criteria. This result signifies that two-point supported triangular glass plates experience a distinct local instability response turning point near H B R 0.5 . It should be emphasized that this 0.5 threshold relies on the L R  and t  ranges utilized in this study ( L R = 1 , t = 10   m m ), and its universality requires further verification over a broader parameter space. Nonetheless, within the typical scales of free-form glass curtain walls examined here, H B R 0.5  can serve as an engineering reference for identifying unfavorable geometric configurations and guiding support layouts.

7. Conclusions

This paper comprehensively investigated the local instability and optical service performance failure mechanisms of cold-bent isosceles triangular tempered glass under discrete point supports through experiments, finite element analysis, and theoretically inspired reduced-order characterization. The main conclusions are as follows:
(1)
Under weakly constrained load cases, the mechanical response of cold-bent triangular glass plates with discrete point supports gradually transitions from a linear stage dominated by global bending to a geometrically nonlinear large deflection stage where membrane effects significantly participate. The concurrent occurrence of a deflection sign reversal at the mid-span of the support axis, a compressive-to-tensile stress transition, and rapid local wave amplification serves as a robust engineering criterion for identifying local instability.
(2)
Increasing the number of discrete clamps n  significantly suppresses both bow-shaped deformation and local wave-shaped distortion by shortening free spans and redistributing membrane-strain energy. In the experimental configurations evaluated, increasing clamps from 2 to 4 reduced the peak mid-span deflection of the support axis by 47–68%, simultaneously satisfying the EN 12150-1 bow limits and A d i s t  local distortion limits.
(3)
Under the conditions of L R = 1 , t = 10   m m  explored herein, H B R  acts as the dominant parameter controlling sensitivity to local instability. For two-point support configurations, a distinct response turning interval exists around an H B R  of 0.5. Unfavorable configurations, such as obtuse triangles with a height-to-base ratio below 0.5, exceed optical serviceability limits at minor displacements well before reaching the material’s fracture threshold, warranting careful consideration in engineering design.
(4)
Calibrated against the finite element database using the response surface methodology, the theoretically inspired semi-analytical characterization framework formulated from von Karman large deflection theory and modal superposition effectively delineates the evolutionary laws of the morphological parameters ( C 0 , C 1 , β ). Employing the simultaneous emergence of a discontinuous jump in C 1  and a discontinuous surge in C 0  as the diagnostic criterion for local instability establishes a viable methodology for identifying the instability sensitivity of cold-bent triangular glass with discrete point supports.
Future research should further investigate the mechanical behavior of cold-bent laminated glass, with particular attention to the influence of the polymer interlayer between glass plies during cold bending. In addition, coupling machine learning optimization algorithms with multi-objective response surfaces may enable automatic planning of discrete interlayer or clamp spacing, thereby improving building-cladding performance in complex free-form installations.

Author Contributions

X.W.: Resources, Conceptualization, Methodology, Formal Analysis, and Writing—Original Draft. Z.Z.: Software, Data Curation, and Writing—Original Draft. P.J.: Visualization and Investigation. Z.J.: Data curation. Y.Y.: Software and Validation. H.Z.: Visualization and Writing—Review and Editing. Y.X.: Validation. All authors have read and agreed to the published version of the manuscript.

Funding

This research was funded by the [Mechanical Performance Test Research on Polyurethane Sandwich Tempered Glass]; [Liaoning Provincial Education Department]; grant number [LJKMZ20220702].

Data Availability Statement

The original contributions presented in this study are included in the article. Further inquiries can be directed to the corresponding author.

Conflicts of Interest

The authors declare that they have no known competing financial interests or personal relationships that could have appeared to influence the work reported in this paper.

Appendix A

Table A1. Values of the surface coefficients p i , j .
p i , j L R H B R t
C 0 C 1 β C 0 C 1 β C 0 C 1 β
p 0 , 0 5.23−680.0357.760.702.55 × 10−42.274060.18
p 1 , 0 −16.573280.13−59−298.10 × 10⁻³−4.52−223−0.088
p 0 , 1 −0.03−0.08−9 × 10−40.620.34−5.81 × 10−50.0160.168.94 × 10−5
p 2 , 0 16.20−553−0.14103104−0.0270.7345.120.012
p 0 , 2 −9.5 × 10−52.3 × 10−5−1.5 × 10⁻⁸−2.9 × 10⁻³−1.5 × 10⁻³−1.1 × 10⁻⁶−4.6 × 10⁻⁵−1.4 × 10−48.5 × 10−8
p 1 , 1 6.7 × 10−40.238.6 × 10−4−1.67−1.24−4.6 × 10⁻⁴−2 × 10⁻³−0.048−1.1 × 10⁻⁴
p 3 , 0 −7.993910.043−71.57−134.537.2 × 10−3−0.033−3.98−5.7 × 10⁻⁴
p 0 , 3 6.8 × 10⁻⁸−4 × 10−79.7 × 10−12−6.6 × 10⁻⁶−3.9 × 10−59.8 × 10−96.9 × 10−81 × 10−7−9.2 × 10⁻¹¹
p 2 , 1 0.013−0.20−2.8 × 10−41.321.492.2 × 10−4−1.1 × 10−45.9 × 10−36.8 × 10⁻⁶
p 1 , 2 3.4 × 10−55 × 10−51.1 × 10−85.6 × 10−38.2 × 10−33 × 10−7−1.2 × 10−68.5 × 10−6−5.7 × 10⁻⁹
p 4 , 0 −98 16.6272.71 0.13
p 3 , 1 0.059−0.32−0.73−2.6 × 10⁻⁴
p 2 , 2 −3.4 × 10⁻⁵−2.2 × 10⁻³−7.8 × 10−35.4 × 10−7
p 1 , 3 3.9 × 10−81.5 × 10−61.7 × 10⁻⁶−2.3 × 10⁻⁸
p 0 , 4 6 × 10−104.7 × 10−86.6 × 10−72.1 × 10⁻¹⁰
p 5 , 0 −14.93
p 4 , 1 0.12
p 3 , 2 2.1 × 10⁻³
p 2 , 3 6.3 × 10⁻⁶
p 1 , 4 −1.4 × 10⁻⁷
p 0 , 5 −3.5 × 10⁻⁹

References

  1. Glymph, J.; Shelden, D.; Ceccato, C.; Mussel, J.; Schober, H. A parametric strategy for free-form glass structures using quadrilateral planar facets. Autom. Constr. 2004, 13, 187–202. [Google Scholar] [CrossRef]
  2. Küçük, M.; Arslan, H.I. Investigation of Diagrid Structures Over Gherkin Tower. Proc. Int. Conf. Contemp. Aff. Archit. Urban.-ICCAUA 2020, 3, 2–22. [Google Scholar] [CrossRef]
  3. Szolomicki, J.; Golasz-Szolomicka, H. Technological Advances and Trends in Modern High-Rise Buildings. Buildings 2019, 9, 193. [Google Scholar] [CrossRef]
  4. Moon, K. Supertall Asia/Middle East: Technological Responses and Contextual Impacts. Buildings 2015, 5, 814–833. [Google Scholar] [CrossRef]
  5. Jóźwik, A. Application of Glass Structures in Architectural Shaping of All-Glass Pavilions, Extensions, and Links. Buildings 2022, 12, 1254. [Google Scholar] [CrossRef]
  6. Veer, F.A.; Wurm, J.; Hobbelman, G.J. The design, construction and validation of a structural glass dome. In Proceedings of the Glass Processing Days, Tampere, Finland, 15–18 June 2003. [Google Scholar]
  7. Müller-Braun, S.; Brokmann, C.; Schneider, J.; Kolling, S. Strength of the individual glasses of curved, annealed and laminated glass used in automotive windscreens. Eng. Fail. Anal. 2021, 123, 105281. [Google Scholar] [CrossRef]
  8. Hakala, H. Analysis of Overall Bow Phenomenon in Glass Heat Treatment Process; Cerise Cherry Publications: Meerut, India, 2024. [Google Scholar]
  9. Laurs, M.; Feldmann, M. Contribution to the design of cold bent glass. Glass Struct. Eng. 2025, 10, 2. [Google Scholar] [CrossRef]
  10. Fildhuth, T.; Schieber, R.; Oppe, M. Design and Construction with Curved Glass. ce/papers 2018, 2, 369–381. [Google Scholar] [CrossRef]
  11. Van Herwijnen, F.; Staaks, D.; Eekhout, M. Cold bent glass sheets in façade structures. Struct. Eng. Int. 2004, 14, 98–101. [Google Scholar] [CrossRef]
  12. Galuppi, L.; Massimiani, S.; Royer-Carfagni, G. Buckling phenomena in double curved cold-bent glass. Int. J. Non-Linear Mech. 2014, 64, 70–84. [Google Scholar] [CrossRef]
  13. Datsiou, K.C.; Overend, M. The mechanical response of cold bent monolithic glass plates during the bending process. Eng. Struct. 2016, 117, 575–590. [Google Scholar] [CrossRef]
  14. Spagnoli, A.; Brighenti, R.; Biancospino, M.; Rossi, M.; Roncella, R. Geometrically non-linear bending of plates: Implications in curved building façades. Constr. Build. Mater. 2019, 214, 698–708. [Google Scholar] [CrossRef]
  15. Quaglini, V.; Cattaneo, S.; Pettorruso, C.; Biolzi, L. Cold-bending of vertical glass plates: Wind loads and geometrical instabilities. Eng. Struct. 2020, 220, 110983. [Google Scholar] [CrossRef]
  16. Hao, X.; Chen, S.; Zhang, D. Anticlastic cold bent behavior and instability prediction of point-supported monolithic glass plates. Eng. Struct. 2025, 343, 121079. [Google Scholar] [CrossRef]
  17. El-Shami, M.M.; Kandil, S.A.; Halim, M.A. Experimental Behavior of Triangular Laminated Glass Lites. In Proceedings of the AEI 2008, American Society of Civil Engineers, Denver, CO, USA, 24–27 September 2008; pp. 1–10. [Google Scholar] [CrossRef]
  18. Chowdhury, A.N.R.; Wang, C.M. Bending, Buckling, and Vibration of Equilateral Simply Supported or Clamped Triangular Plates with Rounded Corners. J. Eng. Mech. 2016, 142, 04016074. [Google Scholar] [CrossRef]
  19. Wang, Y.; Wu, Y.; Wang, Q.; Liew, K.M.; Chen, H.; Sun, J.; He, L. Numerical study on fire response of glass facades in different installation forms. Constr. Build. Mater. 2014, 61, 172–180. [Google Scholar] [CrossRef]
  20. Dayyani, I.; Moore, M.; Shahidi, A. Unilateral buckling of point-restrained triangular plates. Thin-Walled Struct. 2013, 66, 1–8. [Google Scholar] [CrossRef]
  21. Shayanfar, J.; Barros, J.A.O.; Abedi, M.; Rezazadeh, M. Unified Compressive Strength and Strain Ductility Models for Fully and Partially FRP-Confined Circular, Square, and Rectangular Concrete Columns. J. Compos. Constr. 2023, 27, 04023053. [Google Scholar] [CrossRef]
  22. Belis, J.; Inghelbrecht, B.; Van Impe, R.; Callewaert, D. Cold-bending of laminated glass panels. Heron 2007, 52, 123–146. Available online: https://www.heronjournal.nl/52-12/6.pdf (accessed on 21 May 2026).
  23. El-Shami, M.M.; Kareim, S.A.E.; Alnagar, M. Experimental Study of Bent Glass Curtain Walls. J. Eng. Res. 2023, 7. Available online: https://digitalcommons.aaru.edu.jo/erjeng/vol7/iss6/2 (accessed on 21 May 2026).
  24. Yusa, M.; Misawa, Y.; Asakawa, T.; Sasatani, M. Basic research on stress deformation analysis and buckling analysis of thin chemically tempered bent glass. In Proceedings of the IASS Annual Symposia, Guildford, UK, 24–28 August 2020. [Google Scholar]
  25. Mazur, O.; Bhaskar, A. Nonlinear vibration of small-scale simply supported right triangular plates on Winkler foundation. Mech. Res. Commun. 2025, 150, 104544. [Google Scholar] [CrossRef]
  26. Shahidi, A.R.; Shahidi, S.H.; Anjomshoae, A.; Estabragh, E.R. Vibration analysis of orthotropic triangular nanoplates using nonlocal elasticity theory and Galerkin method. J. Solid Mech. 2016, 8, 679–692. [Google Scholar]
  27. Henriksen, T.; Stokes, E.; Louter, C.; Overend, M. Optical distortions in architectural glass: Review of categorization, evaluation and measurement methods. Glass Struct. Eng. 2026, 11, 1. [Google Scholar] [CrossRef]
  28. Yang, C.; Nan, Z.; Huo, Y.; Liu, J.; Xu, L.; Huang, H. Research on the wind pressure resistance and fracture capacity of windshield glass for rail vehicles. Results Eng. 2024, 24, 103403. [Google Scholar] [CrossRef]
  29. EN 12150-1:2015; Glass in Building. Thermally Toughened Soda Lime Silicate Safety Glass—Part 1: Definition and Description. CEN (European Committee for Standardization): Brussels, Belgium, 2015.
  30. Amadio, C.; Bedon, C. A buckling verification approach for monolithic and laminated glass elements under combined in-plane compression and bending. Eng. Struct. 2013, 52, 220–229. [Google Scholar] [CrossRef]
  31. Alañón, A.; Cerro-Prada, E.; Vázquez-Gallo, M.J.; Santos, A.P. Mesh size effect on finite-element modeling of blast-loaded reinforced concrete slab. Eng. Comput. 2018, 34, 649–658. [Google Scholar] [CrossRef]
  32. Bonari, J.; Paggi, M.; Dini, D. A new finite element paradigm to solve contact problems with roughness. Int. J. Solids Struct. 2022, 253, 111643. [Google Scholar] [CrossRef]
  33. Zhang, Z.; Xiao, Y.; Xie, Y.; Su, Z. Effects of contact between rough surfaces on the dynamic responses of bolted composite joints: Multiscale modeling and numerical simulation. Compos. Struct. 2019, 211, 13–23. [Google Scholar] [CrossRef]
  34. Von Karman, T.; Tsien, H.-S. The Buckling of Thin Cylindrical Shells Under Axial Compression. J. Aeronaut. Sci. 1941, 8, 303–312. [Google Scholar] [CrossRef]
  35. Tolotti, E.G. Stability of the Von Kármán regime for thin plates under Neumann boundary conditions. ESAIM Control. Optim. Calc. Var. 2025, 31, 61. [Google Scholar] [CrossRef]
  36. Rezaeian, A.; Davoodi, M.; Jafari, M.K.; Bagheri, M.; Asgari, A.; Jafarian, H. Kafshgarkolaei, Optimization of Earth Dam Cross-Sections Using the Max–Min Ant System and Artificial Neural Networks with Real Case Studies. Buildings 2026, 16, 501. [Google Scholar] [CrossRef]
Figure 1. Engineering applications of triangular glass curtain walls: (a) The Abu Dhabi Capital Gate, United Arab Emirates; (b) Shanghai Bund Central Plaza, China.
Buildings 16 02176 g001
Figure 2. Flowchart of the experimental research plan.
Buildings 16 02176 g002
Figure 3. Three-dimensional schematic diagram of the cold-bending loading device.
Buildings 16 02176 g003
Figure 4. Cold-bending loading arrangement in the laboratory.
Buildings 16 02176 g004
Figure 5. Cold-bending loading process.
Buildings 16 02176 g005
Figure 6. Layout of displacement transducers and strain rosettes: (a) Displacement; (b) Strain.
Buildings 16 02176 g006
Figure 7. Two representative bending characteristics of the panel: (a) global bending; (b) local instability.
Buildings 16 02176 g007
Figure 8. Effect of clamp number on mid-span deflection along the support axis: (a) α = 60 ° ; (b) α = 90 ° ; (c) α = 120 ° .
Buildings 16 02176 g008
Figure 9. Effect of vertex angle on mid-span deflection along the support axis: (a) n = 2 ; (b) n = 3 ; (c) n = 4 .
Buildings 16 02176 g009
Figure 10. Effect of clamp number on surface stress at the mid-span of the support axis: (a) α = 60 ° ; (b) α = 90 ° ; (c) α = 120 ° .
Buildings 16 02176 g010
Figure 11. Effect of vertex angle on surface stress at the mid-span of the support axis: (a) n = 2; (b) n = 3; (c) n = 4.
Buildings 16 02176 g011
Figure 12. Finite element mesh and boundary conditions.
Buildings 16 02176 g012
Figure 13. Comparison between measured and simulated stresses and mid-span deflection: (a) S11; (b) S22; (c) Midpoint deflection.
Buildings 16 02176 g013
Figure 14. Evolution of support-axis deflection from FE analysis: (a) S60-2; (b) S60-3; (c) S60-4; (d) S90-2; (e) S90-3; (f) S90-4; (g) S120-2; (h) S120-3; (i) S120-4.
Buildings 16 02176 g014
Figure 15. Effect of height-to-base ratio on bow distortion under different support configurations: (a) n = 2; (b) n = 3; (c) n = 4.
Buildings 16 02176 g015
Figure 16. Evolution of local wave distortion for specimens with H B R < 0.5.
Buildings 16 02176 g016
Figure 17. Stress and displacement contours for the plate when H B R = 0.29.
Buildings 16 02176 g017
Figure 18. Evolution of bow distortion under the coupled effects of LR and discrete supports: (a) n = 2 ; (b) n = 3 ; (c) n = 4 .
Buildings 16 02176 g018
Figure 19. Evolution of bow distortion under the coupled effects of thickness and discrete supports: (a) n = 2; (b) n = 3; (c) n = 4.
Buildings 16 02176 g019
Figure 20. Comparison of deflection evolution under forward and reverse loading: (a) support-axis response under forward loading; (b) load-axis response under forward loading; (c) support-axis response under reverse loading.
Buildings 16 02176 g020
Figure 21. Local wave distortion and staged mode transition induced by upward loading.
Buildings 16 02176 g021
Figure 22. Coordinate system and geometry of the isosceles triangular plate.
Buildings 16 02176 g022
Figure 23. Response surfaces of C 0 , C 1 and β with respect to L R , H B R , t : (a) L R - C 0 ; (b) t - C 0 ; (c) L R - C 1 ; (d) t - C 1 ; (e) L R - β ; (f) H B R - β ; (g) t - β .
Buildings 16 02176 g023
Figure 24. Response surfaces of C 0 and C 1 with respect to H B R : (a) H B R - C 0 (b) H B R - C 1 .
Buildings 16 02176 g024
Table 1. Specimen matrix.
Specimen L (mm) t (mm) α ( ° )Number of Clamps ( n )Fixture PointLoading Direction
S60-2266010602B, CUp
S60-3266010603B, D, CUp
S60-4266010604B, F, E, CUp
S90-2266010902B, CUp
S90-3266010903B, D, CUp
S90-4266010904B, F, E, CUp
S120-22660101202B, CUp
S120-32660101203B, D, CUp
S120-42660101204B, F, E, CUp
Table 2. Parametric cases considered in the FE analysis.
Serial NumberLRt (mm)HBRNumber of Clamps (n)Loading Direction
10.5100.872, 3, 4Up
20.75100.872, 3, 4Up
31.25100.872, 3, 4Up
41.5100.872, 3, 4Up
5150.872, 3, 4Up
6160.872, 3, 4Up
7170.872, 3, 4Up
8180.872, 3, 4Up
9190.872, 3, 4Up
101100.22, 3, 4Up
11 *1100.292, 3, 4Up
121100.352, 3, 4Up
13 *1100.52, 3, 4Up
14 *1100.872, 3, 4Up
1511012, 3, 4Up
161101.872, 3, 4Up
171100.872Down
* denotes the model corresponding to the experimental setup.
Disclaimer/Publisher’s Note: The statements, opinions and data contained in all publications are solely those of the individual author(s) and contributor(s) and not of MDPI and/or the editor(s). MDPI and/or the editor(s) disclaim responsibility for any injury to people or property resulting from any ideas, methods, instructions or products referred to in the content.