Article

Experimental Study on Multi-Layer Composite Confinement Structures with Different Energy-Absorbing Layers Subjected to Internal Explosion

1
School of Engineering Science, Shandong Xiehe University, Jinan 250109, China
2
State Key Laboratory of Disaster Prevention & Mitigation of Explosion & Impact, Army Engineering University of PLA, Nanjing 210007, China
*
Author to whom correspondence should be addressed.
Buildings 2026, 16(11), 2114; https://doi.org/10.3390/buildings16112114
Submission received: 26 April 2026 / Revised: 18 May 2026 / Accepted: 22 May 2026 / Published: 25 May 2026

Abstract

Traditional single-layer reinforced concrete (RC) internal blast containment structures face challenges in blast resistance, crack control, and sealing integrity. Multi-layer composite configurations leveraging energy-absorbing interlayers have emerged as a promising alternative. However, the coupled wave-attenuation mechanisms, dynamic load-transfer pathways, and strain-to-damage evolution in such systems remain insufficiently quantified. To address this gap, this study designed and fabricated two multi-layer composite confinement structures with energy-absorbing layers made of foamed concrete and dense sandy soil, respectively. A series of internal explosion tests with varying TNT charge masses (0.15 kg to 0.80 kg) was conducted. The magnitude and distribution of the load acting on the inner wall of the structure during internal explosion were analyzed, and the deformation characteristics and mechanical mechanisms of the multi-layer composite confinement structure under internal blast loading were investigated. The results indicate that the foamed concrete layer possesses superior blast wave attenuation and energy absorption performance. For instance, under the 0.8 kg charge, the peak contact pressure transferred to the outer layer was approximately 23% lower, and the peak hoop strain in the outer layer was about 7% less compared to the structure with the sandy soil layer. The test results can provide a basis for theoretical analysis and numerical calculation.

1. Introduction

The development of society, economy, and technology has placed higher demands on the blast resistance, sealing integrity, and safety reliability of structures against internal explosions. Reinforced concrete (RC) structures are commonly used for internal blast containment, finding widespread application in areas such as nuclear reactor containment vessels, and storage facilities for weapons, ammunition, and explosive hazardous materials [1,2,3]. To improve the internal blast resistance of RC structures, extensive research has been conducted by scholars domestically and internationally. Cheng Fengsheng et al. [4] used numerical simulation combined with experimental studies to analyze the distribution of shock wave overpressure load on the inner wall of a box-type RC confinement structure under internal explosion. Guo et al. [5] conducted internal explosion tests and finite element analysis on RC structures. Their research showed that the internal blast load increases as the venting area decreases. Liu Jiening et al. [6] constructed a full-scale RC structure test model and used a combination of testing and numerical simulation to study the anti-explosion performance of RC structures under internal blast loading.
However, due to the performance characteristics of concrete materials having different tensile and compressive strengths, traditional single-layer RC structures still face difficult-to-overcome problems such as low resistance, susceptibility to cracking, and poor structural sealing and safety [7]. Foam materials such as foamed concrete, aluminum foam, and polyurethane foam are characterized by low density and a relatively long yield stress plateau [8,9]. Multi-layer composite structures using foam materials as core layers can effectively attenuate explosion shock waves [10,11,12] and have become a research hotspot in explosion protection engineering. Liu Yining et al. [13] used LS-DYNA software to calculate the dynamic blast response of a composite blast wall containing an aluminum foam energy-absorbing layer, analyzing the influence of structural parameters and relative density of the aluminum foam sandwich panel on its blast resistance. Zhang Yong [14] conducted explosion tests on composite structures composed of polyurethane foam, aluminum and concrete. The results showed that the explosion protection performance of polyurethane foam aluminum is superior to that of aluminum foam. Fang Qin et al. [15,16] used experimental and numerical simulation methods to study the influence of foamed concrete thickness and strength on the blast resistance of composite protective structures, analyzing the blast wave attenuation characteristics of foamed concrete under blast wave action. In recent years, research on multi-layer composite structures for blast protection has advanced significantly, encompassing both engineering applications and theoretical/scientific investigations. Engineering research has focused on innovative configurations and materials, such as novel composite containment vessels with multi-layer linings [17], advanced sandwich panels for internal explosion [18], and cylindrical structures with new core designs [19]. The development of enhanced energy-absorbing materials, like nanoparticle-stabilized foam concrete [20] and novel auxetic composites [21], has also progressed. On the theoretical and computational front, significant efforts have been made in high-fidelity modeling for damage assessment [22], advanced fluid–structure interaction frameworks [23], and refined analytical models for blast mitigation in cylindrical vessels [24] and sandwich cylinders [25]. Combined theoretical–numerical studies continue to elucidate the internal blast response of cylindrical shells [26,27]. Furthermore, the rise of data-driven techniques has opened new avenues; machine learning (ML) algorithms, for instance, have been successfully applied to predict damage in structures under dynamic loads [28,29]. These studies demonstrate the potential of advanced computational methods, including data-driven techniques, to complement experimental investigations in understanding and predicting complex structural dynamic responses. These works collectively highlight the ongoing efforts in blast protection research.
In fields such as high-risk ammunition storage, there are extremely high requirements for the sealing and safety of structures against internal explosions, which traditional single-layer RC structures struggle to meet. Leveraging the high resistance characteristic of multi-layer composite structures with energy-absorbing layers, this paper proposes a rigid–flexible combined multi-layer composite confinement structure for internal explosion protection. The novelty of the proposed system lies in its specific configuration designed for cylindrical confinement and the direct experimental comparison between two fundamentally different, yet practically common, energy-absorbing interlayer materials: foamed concrete and dense sandy soil. The main body of the multi-layer confinement structure consists of inner and outer RC layers and a sandwich energy-absorbing layer. Under internal blast loading, the goal is to dissipate internal explosion energy through the deformation of the inner structural layer and the wave-attenuation and energy-absorption of the absorbing layer, thereby reducing the load acting on the outer structural layer, protecting the outer layer to remain in an elastic state undamaged, while improving structural resistance and sealing.
The novelty of this experimental study lies in the investigation of a cylindrical, rigid–flexible-rigid multi-layer composite confinement system under internal explosion. Unlike previous studies focusing on planar sandwich panels or load analysis alone, this work provides comprehensive, synchronized data on the internal blast field, interlayer dynamic interaction, and global structural response, aiming to reveal the synergistic blast mitigation mechanism specific to this configuration for enclosed cylindrical vessels. However, as highlighted in the recent literature, most of these studies focus on separate analyses of either the internal explosion load or the structural dynamic response, often employing simplified geometries (e.g., plates, beams) or single material cores. Particularly, there is a lack of reported experimental research that directly compares the dynamic response and protective efficacy of different, readily available energy-absorbing materials (such as foamed concrete versus dense soil) within a full-scale, cylindrical, multi-layer composite confinement structure under internal blast loading. To address this gap and study the internal blast resistance performance of multi-layer composite confinement structures, this paper designed and fabricated two test models of multi-layer confinement structures with energy-absorbing layer materials of foamed concrete and dense sandy soil, respectively. Internal explosion tests were conducted on both models using centrally placed charges. The magnitude and distribution of the load acting on the inner wall of the structure during internal explosion were analyzed, and the deformation characteristics and mechanical mechanisms of the multi-layer composite confinement structure under internal blast loading were studied, providing a basis for numerical calculation and theoretical analysis.

Prior Publication Context and Originality Statement

While the experimental campaign was originally conducted as part of the corresponding author’s doctoral research [30], the present article represents a distinct and substantially expanded contribution. Portions of the raw datasets were previously tabulated in a related collaborative report [31]. Crucially, this work extends far beyond the original documentation: it provides (1) a completely rewritten narrative with updated literature synthesis; (2) new material characterization data (Tables 3 and 4); (3) a dedicated comparative framework quantifying the mechanistic differences between foamed concrete and sandy soil energy-absorbing layers; and (4) original discussions on end-plate impulsive loading and scale-effect limitations for cylindrical containment design. The reuse of these foundational measurements is fully disclosed to support the novel analytical contributions presented herein.

2. Test Overview

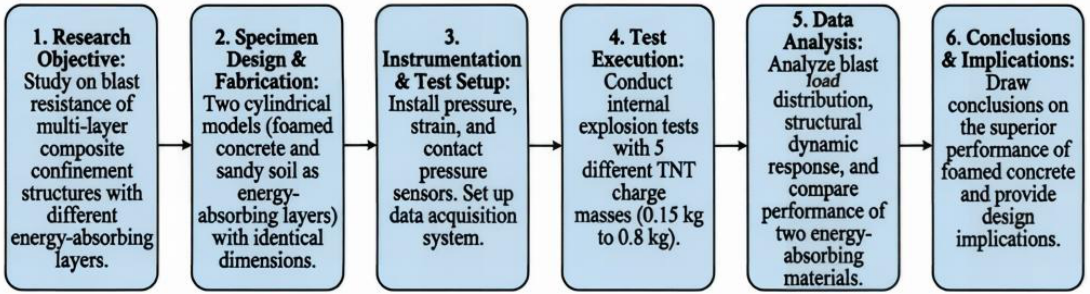
The overall experimental procedure followed in this study is systematically summarized in the flowchart shown in Figure 1. The research primarily consists of six stages, starting from defining the research objective and specimen design, followed by instrumentation setup, test execution, and data analysis.

2.1. Test Model

To analyze the dynamic response of the multi-layer confinement structure under internal blast loading, two test models with identical geometric dimensions were designed and fabricated. The models adopted a three-layer structural form: RC layer–energy-absorbing layer–RC layer. Two energy-absorbing materials commonly used in protective engineering, foamed concrete and dense sandy soil, were selected to fill the interlayer of Model 1 and Model 2, respectively.
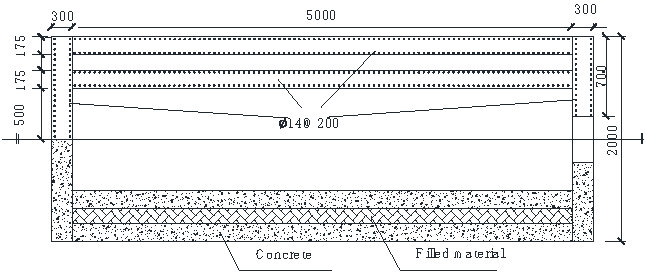
The test model consists of a cylindrical main body and circular RC end plates at both ends, with an inner radius of 0.5 m, an outer radius of 1 m, and an internal clear length of 5 m. The main body is divided into three layers: both the inner and outer layers are 0.175 m thick RC structures, and the middle 0.15 m thick interlayer is filled with energy-absorbing material. Both ends of the model are 0.3 m thick RC end plates, connected to the main body of the structure via embedded bolts. The dimensions of each part are shown in Figure 2. For personnel access to install testing equipment and explosives inside the structure, an entrance/exit of 0.4 m × 0.6 m (width × height) was created at one end of the test model. A steel protective door is installed at the entrance to simulate a confined explosion space and reduce interference with the external environment. The test models were designed based on geometric similarity principles, with a characteristic length (inner radius, R = 0.5 m) representing a scaled-down version of typical cylindrical containment structures (e.g., with prototype inner radii often ranging from 2 m to 2.5 m in industrial applications, implying a scale factor λ between 0.2 and 0.25). This approach follows established practices in blast testing where scaled models are used to investigate fundamental load-transfer and dynamic response mechanisms under controlled conditions.
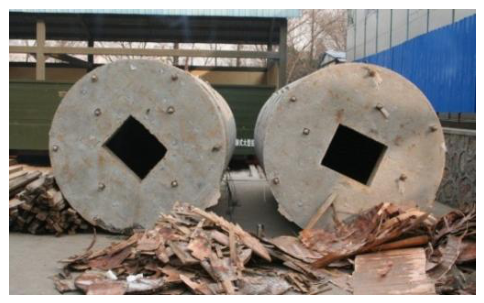
Due to the small size of the test models, fabrication was relatively difficult. During the fabrication of the test models, the cylindrical main body and the two RC end plates were made separately. One RC end plate of the model was first fabricated and cast. After hardening, the reinforcement was tied, formwork was erected, and the inner layer of concrete of the main cylindrical structure was cast. The cylindrical part of the main body was cast vertically. After the inner layer concrete of the cylindrical part hardened, the original formwork was removed, the outer formwork was erected, the energy-absorbing material was filled into the interlayer, and then the outer concrete layer of the structure was cast. Finally, the structural formwork was removed, and the other end plate of the structure was assembled. The test model after formwork removal and hoisting into position is shown in Figure 3.
The main body and end plates of the test model were cast using C40 concrete. The inner layer, outer layer of the main body structure, and the two RC end plates all had double-layer reinforcement. Both the circumferential and axial reinforcement used Φ14 rebar with a spacing of 200 mm. The performance parameters of the two energy-absorbing materials, foamed concrete and sandy soil, filled in the test models are shown in Table 1 and Table 2, respectively. The quasi-static compressive behavior of the two energy-absorbing materials was characterized, providing key inputs for interpreting their blast response. The foamed concrete exhibited a distinct yield plateau, as detailed in Table 3. The pressure–volumetric strain relationship for the dense sandy soil, obtained from confined compression tests, is given in Table 4. It is noted that the high-strain-rate properties of these materials, crucial for precise blast analysis, are not characterized here and warrant separate investigation.

2.2. Test Measurement Point Layout and Measurement System

2.2.1. Pressure Measurement Point Layout

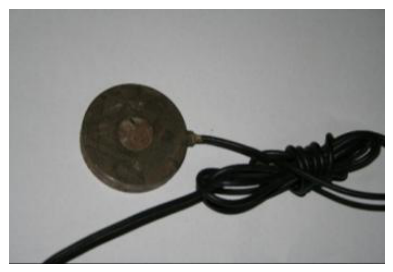
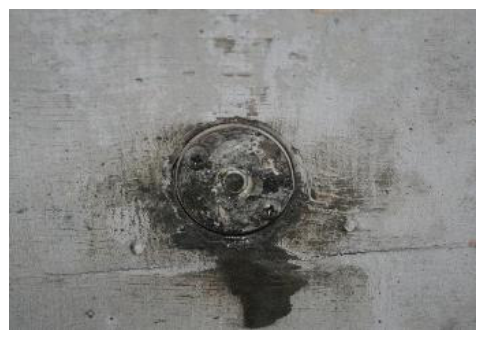
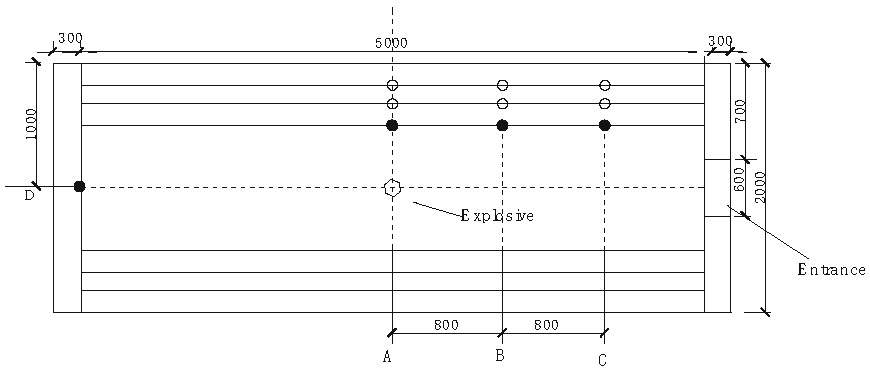
Ten pressure sensors were installed in each model. Strain-gauge pressure sensors (see Figure 4) were pre-embedded at the interface between the energy-absorbing material and the inner/outer structural layers during model fabrication, with pre-embedded steel tubes guiding out the measurement leads. During the casting of the inner layer concrete of the structure, installation bases and conduit tubes for wiring were pre-embedded. After the model was fabricated and hoisted into position, piezoelectric pressure sensors (CY-YD-205, manufactured by Jiangsu Lianneng) were installed to measure the explosion shock wave load on the inner wall surface of the structure. The reflecting surface of the pressure sensor was flush with the inner surface of the structure after installation, as shown in Figure 5. Pressure measurement points were arranged along the model axis. The layout positions of each pressure measurement point are shown in Figure 6, and their numbers and descriptions are listed in Table 5.

2.2.2. Strain Measurement Point Layout

To investigate the dynamic response characteristics of the multi-layer composite confinement structure under internal blast loading and analyze its deformation features, strain gauges attached to the reinforcement bars were used to measure the strain at various points of the test model. For each test model, one circumferential strain measurement point and one axial strain measurement point were set on the inner and outer circumferential reinforcement bars, and on the inner and outer axial reinforcement bars, respectively, at the central cross-section A of the structure. This resulted in a total of 8 strain measurement points per test model. The circumferential (axial) strain measurement points of the multi-layer confinement structure are numbered sequentially from inside to outside as A-H(J)-1, A-H(J)-2, A-H(J)-3, and A-H(J)-4, where H denotes circumferential strain measurement points and J denotes axial strain measurement points.

2.2.3. Test Measurement System

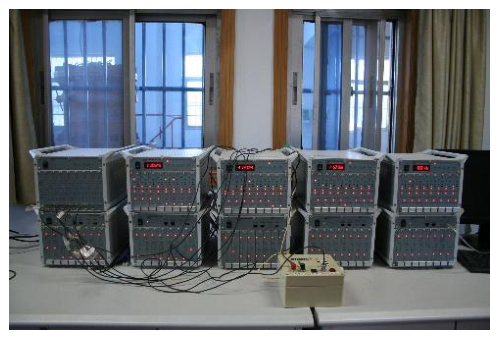
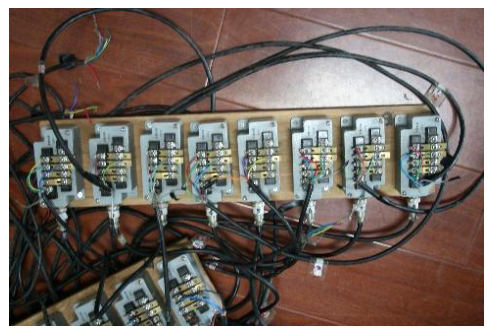
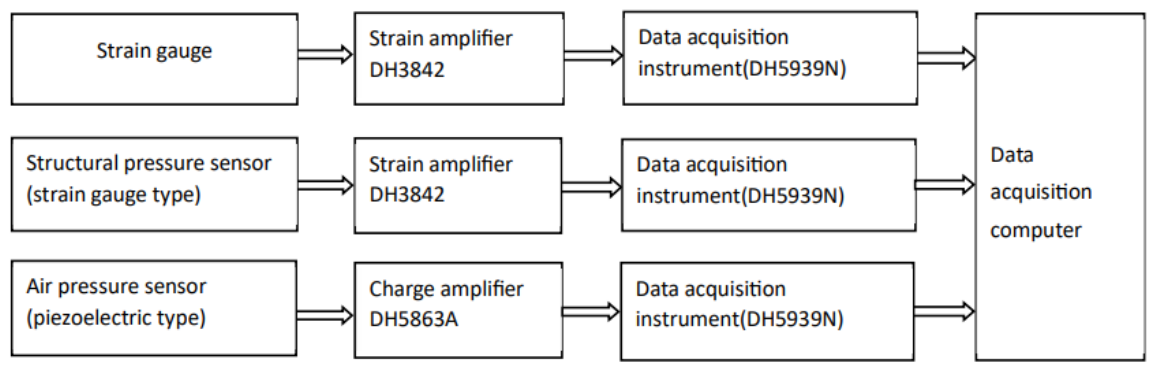
All sensors were connected via cables to the test equipment room. Figure 7 and Figure 8 show the test data acquisition instruments and the terminal junction box, respectively. The test measurement system was the Jiangsu Donghua dynamic test measurement system, with a maximum data sampling frequency of 3 MHz. The test measurement system is shown in Figure 9, where the models of the corresponding instruments used are noted below the strain amplifier, charge amplifier, and data acquisition instrument. The pressure sensors were calibrated with an estimated accuracy of ±3% FS. The data acquisition system sampled at 3 MHz, far exceeding the signal frequency to avoid aliasing.

2.3. Test Conditions

Each test model underwent 5 internal explosion tests. TNT was used as the explosive charge for each test. After each shot, the protective steel door was opened, ventilation was enhanced using a blower, and the wall-mounted reflection pressure sensors were inspected. A hook was installed at the highest point at the center of the test model. The test charge was suspended from the hook using a steel wire rope. The length of the steel wire rope was precisely adjusted to ensure the explosive center was located at the geometric center of the test model. The test charge was initiated by an electric detonator at the center, which simultaneously triggered the data acquisition equipment to record data. The test conditions are listed in Table 6. In the table, “Standoff distance” refers to the distance from the explosive center to the explosion shock wave load measurement point on the inner wall surface at cross-section A of the multi-layer confinement structure test model, which is essentially the inner radius of the test model.

3. Results

3.1. Internal Explosion Load

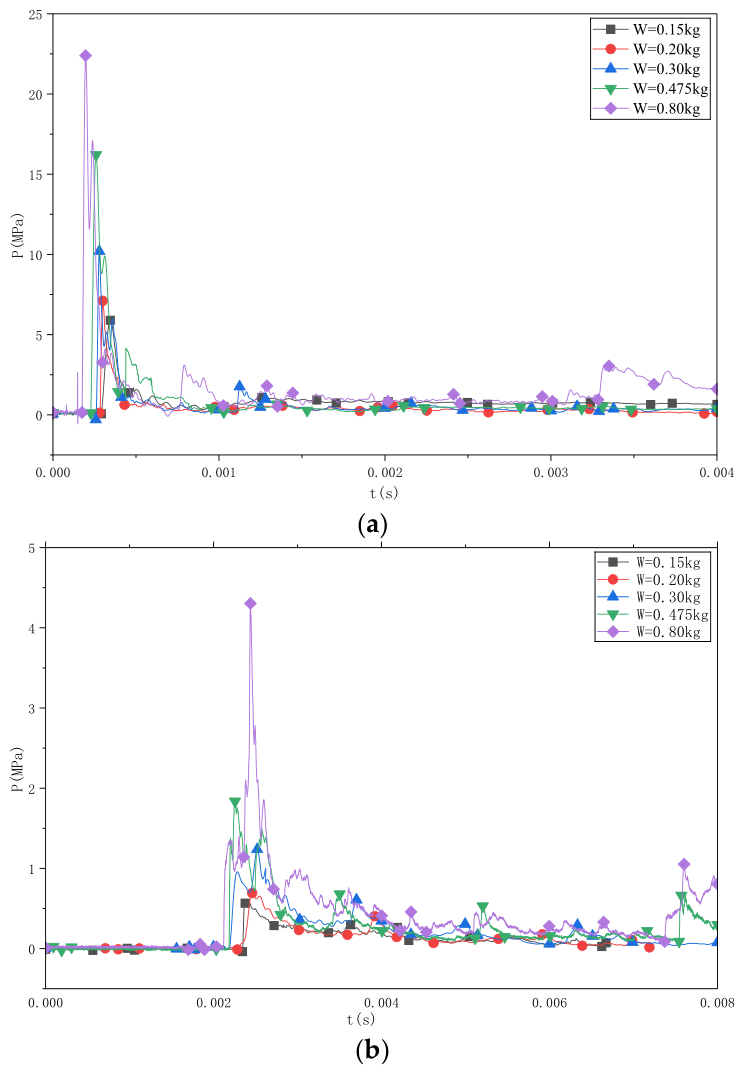
There are 4 measurement points for the explosion shock wave load on the inner wall surface: P-A-1, P-B-1, P-C-1, and P-D-1. Figure 10 shows the explosion shock wave load waveforms at measurement point P-A-1 (detonation center cross-section) and measurement point P-D-1 (end plate center) for each charge mass during internal explosion. The arrival time of the shock wave at both measurement points decreases as the charge mass increases. The load waveform at point P-A-1 exhibits a first pulse with a larger peak, followed by several subsequent pulses with smaller peaks. At point P-D-1, due to the continuous reflection of the explosion shock wave on the inner wall surface and its convergence along the axis, the first shock wave pulse appears as an aggregation of several pulses.
The explosion shock wave load is generally characterized by peak overpressure and specific impulse. Table 7 and Table 8 present the reflected peak overpressure (PR) and specific impulse (IR) at each measurement point for each internal explosion test. The peak overpressure at all measurement points increases with the increase in charge mass. For Model 1 and Model 2, the peak overpressure at measurement point P-A-1 on the inner wall surface at the detonation center cross-section for the 0.8 kg charge is 3.82 times and 4.65 times that for the 0.15 kg charge, respectively. The variation in peak overpressure at points P-B-1 and P-C-1 with charge mass is relatively smaller compared to point P-A-1. Among the four explosion shock wave load measurement points on the inner wall surface, point P-A-1 at the detonation center ring plane has the largest peak overpressure. The peak overpressure decays rapidly along the axial direction of the structure with increasing distance from the detonation center cross-section, especially more pronounced at closer distances. Measurement point P-B-1 is 0.8 m from the detonation center cross-section, and its peak overpressure under various charge masses is about 11.36% to 15.33% of that at point P-A-1. As the distance from the detonation center increases, the decay rate of the wall blast load peak overpressure slows down. Measurement point P-C-1 is 1.6 m from the detonation center cross-section; at the same charge mass, its peak overpressure is about 52.98% to 70.67% of that at point P-B-1. The explosion load measurement point P-D-1 at the center of the multi-layer confinement structure end plate is 2.5 m from the detonation center cross-section, but its peak overpressure under all charge masses is higher than that at point P-C-1, which is closer to the detonation center. For the other four charge masses besides 0.15 kg, it is even higher than that at point P-B-1.
Similar to the variation pattern of the explosion peak overpressure, the specific impulse at all measurement points increases with the increase in charge mass. The specific impulse of the explosion load decreases along the axial direction of the structure as the distance from the detonation center cross-section increases, but the reduction magnitude is smaller compared to the decay of peak overpressure; the attenuation of specific impulse is relatively slower. For the same charge mass, the specific impulse of the explosion load at point P-B-1 is about 24.35% to 33.86% of that at point P-A-1. This indicates that as the distance from the detonation center increases (i.e., the scaled distance increases), the positive pressure duration of the explosion shock wave load on the inner wall surface of the structure is prolonged. Notably, at measurement point P-D-1 at the center of the structural end plate, which is farthest from the detonation center, its specific impulse is even larger than that at the detonation center cross-section point P-A-1. This is consistent with the experimental and computational results regarding internal explosion loads in cylindrical explosion vessels reported in references [32,33]. The main reasons for this phenomenon are the formation of axial jets due to the collision of reflected shock waves from the cylindrical wall surface after reflection and enhancement on the central axis, and the collision enhancement of reflected waves from adjacent inner surfaces [32]. This indicates that for cylindrical multi-layer confinement structures under internal explosion, failure is not necessarily controlled by the deformation at the detonation center cross-section; sometimes, the end plates at both ends of the structure may fail first. This is an issue that must be noted in the research and application of cylindrical multi-layer anti-internal-explosion structures.
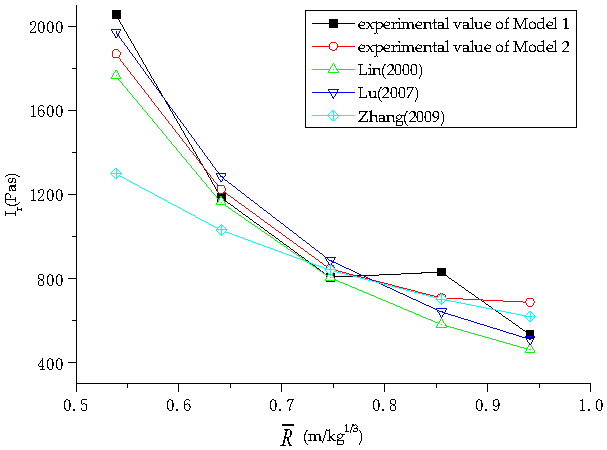
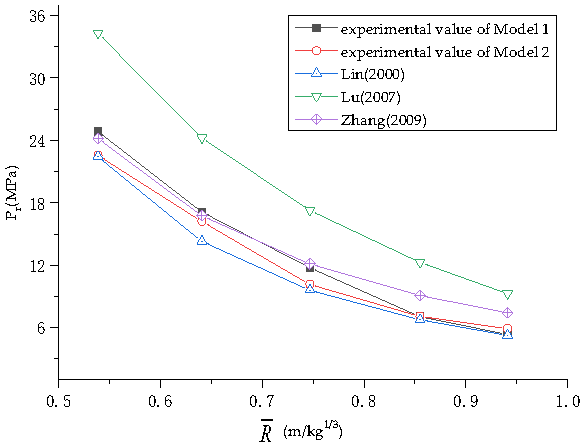
Due to the complex flow field inside a confined structure caused by the repeated reflection of explosion shock waves on the inner wall surface and the interaction between reflected waves, current research on internal explosion loads in confined structures generally focuses only on the detonation center cross-section. The experimental data from measurement point P-A-1 at the detonation center cross-section of the test models were compared with calculation results from empirical formulas proposed in references [32,33,34] for the reflected load on the wall of a confined structure under internal explosion. The comparison results for reflected pressure peak and specific impulse are shown in Figure 11 and Figure 12, respectively. The experimental results show good agreement with the results calculated by the various empirical formulas. As shown in Figure 12, the reflected impulse for both models generally exhibits an increasing trend with charge mass. However, a notable anomaly is observed for Model 1: the impulse value at the 0.20 kg charge (831.11 Pa·s) is higher than that at the 0.30 kg charge (807.17 Pa·s), which contradicts the expected monotonic increase. Given this inconsistency with the physical trend, the specific data point for Model 1 at 0.20 kg is considered likely affected by experimental error and is treated as an outlier in the subsequent analysis. The underlying data are provided in Table 8.

3.2. Structural Strain

The peak strain values at each strain measurement point for Model 1 and Model 2 in each test are shown in Table 9 and Table 10, respectively. In the tables, “/” indicates that test data for that item was not acquired. For both Model 1 and Model 2, at the same measurement point and under the same charge mass, the peak circumferential strain is greater than the peak axial strain. In the hoop (circumferential) strain diagram, positive and negative values represent tensile and compressive strains, respectively, consistent with standard sign conventions in structural dynamics. The hoop direction refers to the circumferential axis of the cylindrical containment structure, perpendicular to the axial and radial directions. Under all charge masses, the peak circumferential and axial strains in the inner structural layer are much larger than those in the outer structural layer. For the 0.8 kg charge, the peak circumferential strain at the inner reinforcement of the inner layer (point A-H-1) for Model 1 and Model 2 is 19.20 times and 15.23 times that at the inner reinforcement of the outer layer (point A-H-3), respectively. The peak circumferential and axial strains in the inner structural layer increase rapidly with increasing charge mass. For the 0.8 kg charge, the peak circumferential strain at the inner reinforcement of the inner layer (point A-H-1) for Model 1 and Model 2 is 5.04 times and 4.23 times that for the 0.15 kg charge, respectively. The peak circumferential and axial strains in the outer structural layer change relatively little, indicating that the energy-absorbing layer can effectively reduce the deformation of the outer layer by increasing the deformation of the inner layer.
The experimental data used for comparison in Table 9 and Table 10 were originally obtained from the author’s previous work [30] and were later reported in [31]. Comparing Table 9 and Table 10, it can be found that under the 0.15 kg TNT charge, the peak values of circumferential and axial strain at each measurement point for Model 1 and Model 2 are very close. This is mainly because, under a small charge mass, the inner RC layer primarily bears the internal blast load, and the circumferential deformation of the inner RC layer is very small at this time. Therefore, the influence of the energy-absorbing layer on the dynamic response of the multi-layer confinement structure is not obvious. However, as the charge mass increases, the peak circumferential and axial strains in the inner layer of Model 1 are greater than those of Model 2, while the peak circumferential and axial strains in the outer layer of Model 1 are less than those of Model 2. For the 0.8 kg charge, the peak circumferential strain at the inner layer point A-H-1 and the outer layer point A-H-3 of Model 1 are 1.17 times and 93.2% of those at the same points in Model 2, respectively. This indicates that as the internal explosion charge mass increases, the sandy soil energy-absorbing layer in Model 2 is less effective in regulating the deformation of the inner and outer layers compared to the foamed concrete energy-absorbing layer in Model 1.
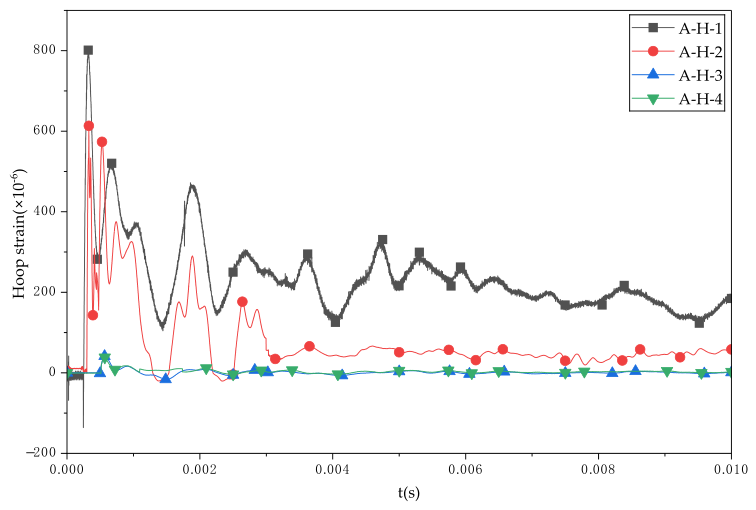
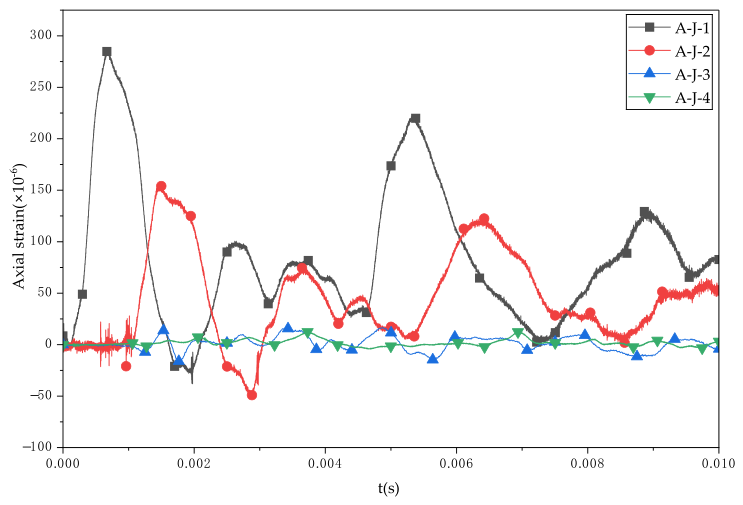
Figure 13 and Figure 14 show the circumferential and axial strain waveforms, respectively, at measurement points on cross-section A of Model 1 under the 0.8 kg charge. For different charge masses, both the circumferential and axial strains at various points of the multi-layer composite confinement structure reach their peak values in the first vibration cycle and then decrease rapidly after reaching the peak.

3.3. Structural Mechanical Characteristics

The contact pressure between layers of the multi-layer confinement structure is an important indicator reflecting the effect of the energy-absorbing layer. Table 11 presents the peak contact pressures at the measurement points between structural layers for each test condition.
For both Model 1 and Model 2, when the charge mass is small, the contact pressures between the energy-absorbing layer and the inner/outer structural layers are very small. For the 0.15 kg charge, the peaks at measurement point P-A-3 for Model 1 and Model 2 are only 22.06 kPa and 46.52 kPa, respectively. At this time, the force and deformation of the multi-layer confinement structure under internal blast loading are mainly borne by the inner RC layer, and as known from the structural strain analysis, the deformation of the inner layer is small at this stage. The pressure peaks at all measurement points increase rapidly with increasing charge mass, most notably at the detonation center cross-section A measurement points. For the 0.8 kg charge, the pressure peaks at measurement point P-A-2 for Model 1 and Model 2 are 13.25 and 14.43 times those for the 0.15 kg charge, respectively.
For different charge masses, the contact pressure measurement points between layers of the multi-layer confinement structure all have the largest peak at the detonation center cross-section measurement points. The farther the cross-section of the measurement point is from the detonation center, the smaller the contact pressure peak, and the magnitude of change in pressure peak with increasing charge mass also decreases. For the 0.8 kg charge, the pressure peaks at measurement point P-C-3 for Model 1 and Model 2 are 6.85% and 7.96% of their respective pressure peaks at point P-A-3. This is mainly caused by the rapid decrease in internal explosion load and the deformation of the inner layer of the multi-layer confinement structure with increasing distance from the detonation center cross-section.
For both Model 1 and Model 2, the peak contact pressure at the interface between the inner RC layer and the energy-absorbing layer at each cross-section is greater than that at the interface between the energy-absorbing layer and the outer RC layer. Moreover, the larger the internal explosion charge mass, the smaller the ratio of the peak contact pressure at the interface between the energy-absorbing layer and the outer structural layer relative to that at the interface between the inner layer and the energy-absorbing layer, i.e., the wave attenuation effect of the energy-absorbing layer becomes more pronounced. For the 0.8 kg charge, the pressure peaks at measurement point P-A-3 for Model 1 and Model 2 are 53.79% and 40.94% of the pressure peaks at point P-A-2, respectively. This indicates that the energy-absorbing layers in both Model 1 and Model 2 can effectively attenuate the intensity of the stress wave and the magnitude of the load transmitted from the inner layer to the outer layer of the multi-layer confinement structure.
Comparing the pressure peaks of Model 1 and Model 2 under the same charge mass, it is found that at the same location, the pressure peaks of Model 2 are generally higher than those of Model 1, especially under larger charge masses and at contact pressure measurement points on the structural detonation center cross-section. This is consistent with the variation pattern of strain peaks in the inner and outer layers of the two test models. This is primarily due to the lower density and distinct yield plateau of the foamed concrete.
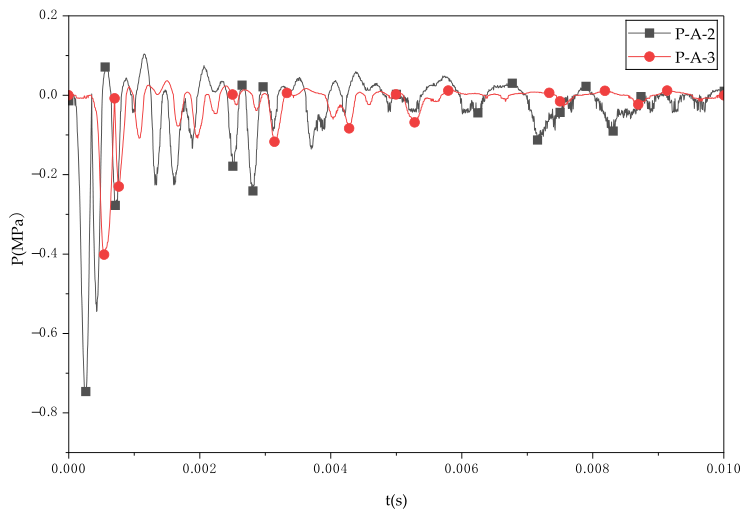
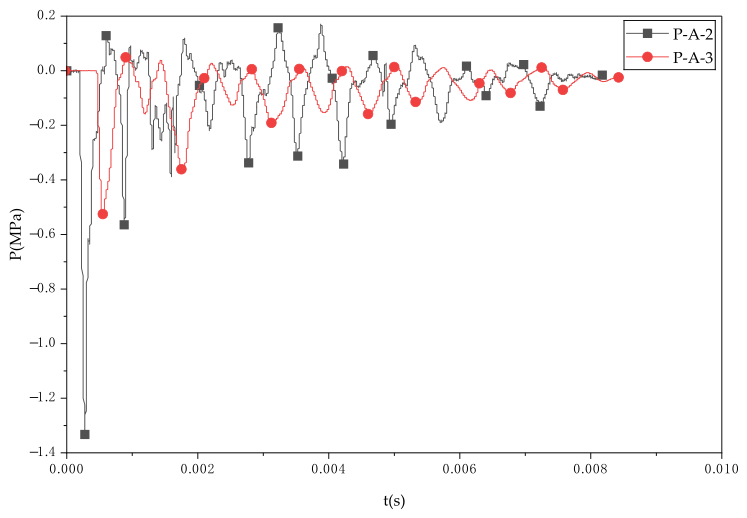
Figure 15 and Figure 16 show the contact pressure time-history curves at measurement points P-A-2 and P-A-3 on the detonation center cross-section A for Model 1 and Model 2, respectively, under the 0.8 kg charge. For both test models, the pressure arrival time and peak achievement time at point P-A-2 are earlier than those at point P-A-3. After the explosion, the contact pressure at each measurement point rapidly reaches its peak, then declines and transforms into an oscillating curve containing several smaller peaks.

4. Discussion

The experimental results clearly demonstrate the performance differences between the two energy-absorbing materials. The data on strain and interlayer contact pressure consistently show that the foamed concrete layer (Model 1) is more effective than the sandy soil layer (Model 2) in attenuating the blast load and protecting the outer structural layer, especially under higher charge masses. This can be attributed to the intrinsic material properties of foamed concrete, such as its lower density and porous structure, which provide a more efficient energy absorption mechanism through crushing and plastic deformation compared to the denser, frictional energy dissipation of sandy soil. This performance difference is corroborated by post-test inspections. For charge masses up to 0.475 kg, only minor hairline cracks were observed on the inner RC surface of both models. After the 0.8 kg test, more extensive micro-cracking was visible on the inner layer of the structure with foamed concrete, while the structure with sandy soil showed comparatively less cracking. Importantly, neither model exhibited through-thickness cracking, significant permanent deformation, or loss of containment integrity. This visual assessment confirms that the energy-absorbing layer, particularly the foamed concrete, effectively protected the outer RC layer, which remained elastic and undamaged, aligning perfectly with the quantitative strain data.
The finding that the specific impulse at the end plate (P-D-1) can exceed that at the detonation center (P-A-1) is significant for design. It highlights that for cylindrical confinement structures, the end plates may be critical failure points due to wave focusing and reflection phenomena, not just the region closest to the charge. Consequently, this necessitates specific reinforcement or design considerations for the end closures in such structures, such as increased thickness, enhanced reinforcement detailing, or the use of higher-strength materials to resist the amplified impulsive loading, which might be underestimated by conventional design methods focusing solely on the detonation-center section.
The good agreement between the measured blast loads at the detonation center and established empirical formulas validates the experimental setup and measurement techniques. However, the significant amplification of specific impulse at the end plate (P-D-1), which exceeds that at the detonation center (P-A-1), highlights a critical limitation of these simplified empirical approaches. These formulas, typically developed for or calibrated against detonation-center conditions, fail to capture the complex three-dimensional wave dynamics in confined cylindrical chambers, such as wave focusing and axial jet formation, that lead to enhanced loading on the end closures. This discrepancy, coupled with the observed axial load variation, demonstrates that reliance solely on empirical methods focused on the detonation center is insufficient for the complete assessment and design of cylindrical confinement structures. Consequently, the end plates must be recognized as potential critical failure points and require specific reinforcement in design. For accurate prediction of these complex load distributions, advanced numerical simulations capable of capturing the full 3D fluid–structure interaction are an essential complement to empirical approaches.
When interpreting the experimental results, the sources of uncertainty and the basis for data reliability must be considered. The inherent uncertainty of the pressure sensors is estimated to be within ±3% of the full scale. To minimize the effects of experimental variability, the relatively large scale of the test model helped reduce the sensitivity to minor imperfections in charge placement and initiation symmetry, which were carefully controlled during setup. However, some inherent scatter due to these factors is acknowledged. Due to the destructive nature and high cost of each test, and to ensure that the structural condition was pristine for each charge mass, only a single test was conducted for each unique model and charge mass combination. The reliability of the presented data is therefore assessed based on the physical consistency of the measurements (e.g., smooth spatial decay of pressure, logical strain distributions) and the systematic trends observed across different charge masses, rather than on statistical repeatability.
It is important to note that while geometric similarity provides a foundational framework, direct extrapolation of the quantitative results (e.g., absolute strain or displacement values) to full-scale prototypes requires caution. Scale effects, arising from factors such as the non-scalability of material properties (e.g., strain-rate sensitivity, fracture behavior) and the potential change in failure modes with size, may lead to deviations. The current study primarily validates the relative performance and mechanistic superiority of the foamed concrete interlayer compared to sandy soil within this multi-layer configuration. For accurate prediction of prototype behavior, future work should incorporate distorted scaling laws that account for strain-rate effects and conduct validation tests on larger-scale models.


5. Conclusions

This study experimentally investigated the blast resistance of cylindrical multi-layer composite confinement structures with two different energy-absorbing interlayers: foamed concrete (Model 1) and dense sandy soil (Model 2). Internal explosion tests with varying TNT charge masses were conducted, and synchronized data on internal blast load, structural strain, and interlayer contact pressure were obtained. The main conclusions drawn from the analysis are as follows:
  • Internal Blast Load Distribution: The peak overpressure and specific impulse of the explosion shock wave at various points on the inner wall surface are mainly influenced by the scaled distance. However, the specific impulse at the end plate can exceed that at the detonation center, identifying the end plates as critical zones requiring specific reinforcement in cylindrical confinement design.
  • Structural Response and Damage Mitigation: The energy-absorbing layer effectively protected the outer RC structure, which remained elastic. The foamed concrete layer was more effective than the sandy soil in reducing the strain and damage in the outer layer.
  • Wave Attenuation Performance: The wave attenuation effect of the energy-absorbing layer became more pronounced with increasing charge mass. Foamed concrete demonstrated superior blast wave attenuation and energy absorption, transferring significantly lower contact pressure to the outer layer compared to sandy soil.
Due to limitations in test conditions, destructive tests with larger charge masses were not conducted in this study. Future work should focus on (1) conducting tests on larger-scale or full-scale prototypes to validate scaling effects and field performance; (2) developing and implementing high-strain-rate constitutive models for foamed concrete and sandy soil in numerical simulations for more accurate prediction; (3) investigating the structural performance under repeated or combined (e.g., blast followed by fire) loads; and (4) exploring the optimization of layer thickness, material properties, and configuration for cost-effective design. The findings and data from this experimental study provide a solid basis for these future theoretical, numerical, and applied investigations.

Author Contributions

Conceptualization, P.N. and D.T.; methodology, P.N.; software, P.N.; validation, P.N. and D.T.; formal analysis, P.N.; investigation, P.N.; resources, D.T.; data curation, P.N.; writing—original draft preparation, P.N.; writing—review and editing, D.T. and P.N.; visualization, P.N.; supervision, D.T.; project administration, D.T.; funding acquisition, D.T. All authors have read and agreed to the published version of the manuscript.

Funding

This research was funded by the Shandong Xiehe University High-Level Talent Scientific Research Startup Funding Project (Grant No. SDXHQD2025008).

Data Availability Statement

The data presented in this study are available on request from the corresponding author.

Conflicts of Interest

The authors declare no conflicts of interest.

References

  1. Zhao, C.; Chen, J. Dynamic responses of reinforced concrete containment subjected to internal blast loading. Explos. Shock. Waves 2013, 33, 667–672. [Google Scholar] [CrossRef]
  2. Zhao, C.; Wang, Q.; Wang, J. Numerical study on dynamic behaviors of NRC slabs in containment dome subjected to close-in blast loading. Thin-Walled Struct. 2019, 135, 269–284. [Google Scholar] [CrossRef]
  3. Li, J.; Lu, Y.; Feng, X.; Hao, W. Analysis of internal explosion load characteristics and dynamic behavior in RC box structures. Explos. Shock. Waves 2026, 46, 133–153. [Google Scholar] [CrossRef]
  4. Cheng, F.; Song, P.; Gu, X. Study on overpressure distribution of internal explosion in reinforced concrete confined vessel. J. Proj. Rocket. Missiles Guid. 2012, 32, 99–102. [Google Scholar]
  5. Guo, X.; Li, Y.; McCrum, D.P.; Hu, Y.; Bai, Z.; Zhang, H.; Li, Z.; Wang, X. A reinforced concrete shear wall building structure subjected to internal TNT explosions: Test results and numerical validation. Int. J. Impact Eng. 2024, 190, 104950. [Google Scholar] [CrossRef]
  6. Liu, J.; Wang, W.; Li, Y.; Xu, Z.; Zhou, Y. Blast resistance of reinforced concrete single room under internal explosive load. Explos. Shock. Waves 2025, 1–16. [Google Scholar] [CrossRef]
  7. Qi, G.; Lei, J.; Liang, Z. Review on damage behavior of reinforced concrete structures subjected to typical blast and impact loads. J. Ordnance Equip. Eng. 2025, 46, 282–294. [Google Scholar]
  8. Gu, W.; Xu, J.; Liu, J.; Chen, J.; Hu, Y. Blast resistance of multi-layer aluminum foam sandwich plates. Chin. J. Energetic Mater. 2017, 25, 240–247. [Google Scholar] [CrossRef]
  9. Gao, Y.; Zu, X.; Huang, Z.; Huang, C. Study on dynamic response and energy absorption characteristics of foamed concrete under blast loading. J. Ballist. 2025, 37, 85–92. [Google Scholar]
  10. Wang, J.; Gao, Q.; Lu, H.; Liang, S.F.; Huang, B.; Yang, Z. Impact response tests of layered medium with SHPB. J. Vib. Shock. 2015, 34, 192–198. [Google Scholar] [CrossRef]
  11. Tarlochan, F.; Ramesh, S.; Harpreet, S. Advanced composite sandwich structure design for energy absorption applications: Blast protection and crashworthiness. Compos. Struct. 2012, 43, 2198–2208. [Google Scholar] [CrossRef]
  12. Zhou, H.; Ren, H.; Wu, X.; Yi, Z.; Huang, K.; Mu, C.; Wang, H. Review on scattering layers in graded protective structures. Explos. Shock. Waves 2022, 42, 3–28. [Google Scholar] [CrossRef]
  13. Niu, Y.; Wu, Y.; Wang, T.; Li, G. Anti-explosion performance of composite blast-resistant walls containing an aluminum foam energy-absorbing layer. Chin. J. High Press. Phys. 2025, 39, 104101. [Google Scholar] [CrossRef]
  14. Zhang, Y. Blast resistance and energy absorption test and numerical simulation analysis of polyurethane foam aluminum composite structure. Explos. Shock. Waves 2022, 42, 045101. [Google Scholar]
  15. Fang, Q.; Gao, C.; Kong, X.; Yang, Y. A new composite protective structure based on the controllability of blast load on the structure layer (I): Blast resistance mechanism. Explos. Shock. Waves 2024, 44, 3–15. [Google Scholar]
  16. Fang, Q.; Gao, C.; Kong, X.; Yang, Y. A new composite protective structure based on the controllability of blast load on the structure layer (II): Influence factors and design concept. Explos. Shock. Waves 2025, 45, 18–29. [Google Scholar] [CrossRef]
  17. Wang, Z.; Chen, H.; Yuan, Q.; Gu, W.; Xie, X.; Li, H. Anti-explosion performance and dynamic response of an innovative multi-layer composite explosion containment vessel. Def. Technol. 2024, 36, 100009. [Google Scholar] [CrossRef]
  18. Peng, Y.; Zhang, Q.; Jiang, H.; Lu, Q.; Cheng, H.; Zhang, K.; Li, X. Blast resistance performance of ru-nc-ru sandwich structures subject to internal explosion: Experiment and simulations. Constr. Build. Mater. 2025, 493, 20. [Google Scholar] [CrossRef]
  19. Hu, X.; Yan, K.; Wu, H.; Qi, S.; Yuan, M. Dynamic response of cylindrical sandwich panels with coaxial and concentric honeycombs under blast loads. Eng. Struct. 2025, 343, 120942. [Google Scholar] [CrossRef]
  20. Li, Z.; Chen, W.; Sun, G.; Chen, Y.; Li, Z.; Li, H.; Hao, H. Dynamic mechanical properties of nanoparticle-stabilized foam concrete (NFC). Case Stud. Constr. Mater. 2025, 22, e04805. [Google Scholar] [CrossRef]
  21. Song, G.; Liu, Z.; Jia, X.; Jiang, J. Penetration-explosion resistance of novel steel fiber reinforced concrete-foam concrete composites reinforced by Re-entrant auxetic cellular frame. Int. J. Impact Eng. 2026, 211, 105613. [Google Scholar] [CrossRef]
  22. Li, J.; Zheng, Y.; Li, P.; Liu, Y.; Zhang, J.; Wang, H. Damage assessment of multi-layered concrete under internal explosion: A coupled numerical approach. Int. J. Impact Eng. 2026, 209, 105540. [Google Scholar] [CrossRef]
  23. Narkhede, A.; Islam, S.; Wang, K. Coupled Fluid-Structural Analysis of Explosion Containment Using Crushable Sandwich Structures. In Proceedings of the Volume 4: Fluid-Structure Interaction; High Pressure Technology, Montreal, QC, Canada, 20–25 July 2025; ASME: New York, NY, USA, 2025. [Google Scholar] [CrossRef]
  24. Yang, L.; Wang, T.; Bian, X.; Huang, G. Blast mitigation enhancement in cylindrical vessels: Two-stage theoretical modeling of water-metal interaction under internal blast loading. Int. J. Impact Eng. 2026, 207, 105485. [Google Scholar] [CrossRef]
  25. Su, B.; Cui, T.; Peng, H.; Pei, X.; Li, J.; Guo, K.; Zhang, W.; Qin, Q. The Resistance of Sandwich Cylinders with Density-Graded Foam Cores to Internal Blast Loadings. J. Appl. Mech. 2025, 92, 031007. [Google Scholar] [CrossRef]
  26. Chen, Z.-F.; Wang, H.-J.; Sang, Z.; Wang, W.; Yang, H.; Meng, W.-M.; Li, Y.-X. Theoretical and Numerical Analysis of Blasting Pressure of Cylindrical Shells under Internal Explosive Loading. J. Mar. Sci. Eng. 2021, 9, 1297. [Google Scholar] [CrossRef]
  27. Liu, X.; Gu, W.; Liu, J.; Xu, J.; Hu, Y.; Hang, Y. Dynamic response of cylindrical explosion containment vessels subjected to internal blast loading. Int. J. Impact Eng. 2020, 135, 103389. [Google Scholar] [CrossRef]
  28. Lazaridis, P.C.; Kavvadias, I.E.; Demertzis, K.; Iliadis, L.; Vasiliadis, L.K. Structural Damage Prediction of a Reinforced Concrete Frame under Single and Multiple Seismic Events Using Machine Learning Algorithms. Appl. Sci. 2022, 12, 3845. [Google Scholar] [CrossRef]
  29. Zhang, H.; Yu, D.; Li, G.; Dong, Z. A real-time seismic damage prediction framework based on machine learning for earthquake early warning. Earthq. Eng. Struct. Dyn. 2024, 53, 593–621. [Google Scholar] [CrossRef]
  30. Ning, P.F. Study on Multi-Layer Explosive Confinement Structure Subjected to Internal Explosion. Ph.D. Thesis, PLA University of Science and Technology, Nanjing, China, 2012. [Google Scholar]
  31. Xue, Y.L.; Tang, D.G.; Li, Z.Z.; Shao, L.Z.; Liao, Z.; Chen, W.X.; Zhen, R.L. A Study on Internal Explosion Testing of the “Rigid-Flexible-Rigid” Three-Layer Sealed Structure. Shock. Vib. 2018, 1909872. [Google Scholar] [CrossRef]
  32. Lin, J. Blast Load and Deformation Response of Cylindrical Steel Vessel with Central Explosion; Northwest Institute of Nuclear Technology: Xi’an, China, 2000. [Google Scholar]
  33. Lu, Y.; Xu, K. Prediction of debris launch velocity of vented concrete structures under internal blast. Int. J. Impact Eng. 2007, 34, 1753–1767. [Google Scholar] [CrossRef]
  34. Zhang, D.Z.; Li, Y.; Wang, D.W.; Wang, C.L.; Zhong, F.P.; Lin, J.D. Experiment investigations on normal reflected blast wave near the spherical explosive. Acta Armamentarii 2009, 30, 1663–1667. [Google Scholar]
Figure 1. Schematic diagram of the experimental procedure for multi-layer composite confinement structures.
Buildings 16 02114 g001
Figure 2. Dimension sketch map of experimental model (mm).
Buildings 16 02114 g002
Figure 3. Test models.
Buildings 16 02114 g003
Figure 4. Strain gauge pressure sensor.
Buildings 16 02114 g004
Figure 5. Piezoelectric Pressure Sensor.
Buildings 16 02114 g005
Figure 6. Location of pressure transducer (mm). Legend: •—reflected pressure measurement point, 4 locations in total; —contact pressure measurement point between different structural layers, 6 locations in total.
Buildings 16 02114 g006
Figure 7. Test data acquisition equipment.
Buildings 16 02114 g007
Figure 8. Terminal junction box.
Buildings 16 02114 g008
Figure 9. Schematic diagram of the measurement system.
Buildings 16 02114 g009
Figure 10. Time history of blast wave load in model 1. (a) P-A-1 point. (b) P-D-1 point.
Buildings 16 02114 g010
Figure 11. Comparison of peak overpressure and empirical formulas. The experimental data are compared with the empirical models proposed by Lin [32], Lu [33], and Zhang [34].
Buildings 16 02114 g011
Figure 12. Comparison of impulse and empirical formulas. Note: The data point for Model 1 exhibits a slight deviation from the monotonic trend, likely due to experimental scatter, and is therefore considered an outlier. The empirical curves correspond to Lin [32], Lu [33], and Zhang [34].
Buildings 16 02114 g012
Figure 13. Hoop Strain Waveform of Model 1 with 0.8 kg Charge. The curve is plotted from high-frequency sampled data. Key data points (e.g., peaks) are marked. A smoothing spline interpolation is applied for clarity.
Buildings 16 02114 g013
Figure 14. Axial Strain Waveform of Model 1 with 0.8 kg Charge. The curve is plotted from high-frequency sampled data. Key data points (e.g., peaks) are marked. A smoothing spline interpolation is applied for clarity.
Buildings 16 02114 g014
Figure 15. Contact Pressure at Cross-section A of Model 1 with 0.8 kg Charge. The curve is plotted from high-frequency sampled data. Key data points (e.g., peaks) are marked. A smoothing spline interpolation is applied for clarity.
Buildings 16 02114 g015
Figure 16. Contact Pressure at Cross-section A of Model 2 with 0.8 kg Charge. The curve is plotted from high-frequency sampled data. Key data points (e.g., peaks) are marked. A smoothing spline interpolation is applied for clarity.
Buildings 16 02114 g016
Table 1. Material parameters of foam concrete.
Density (kg/m3)Elastic Modulus E (MPa)Poisson’s RatioYield Stress
6102700.101.0
Table 2. Material parameters of sandy soil.
Density (kg/m3)Elastic Modulus E (MPa)Friction Angle φ (°)Cohesion C (kN)
156027.3821.620
Table 3. Volumetric strain–yield stress relation for foamed concrete.
Volumetric Strain (v/v0)0.020.300.450.52
Yield Stress (MPa)1.01.01.52.0
Table 4. Pressure–volumetric strain relation for dense sandy soil.
Vol. Strain0.0050.040.110.150.19
Pressure (MPa)0.423.536.7612.7420.8
Note: The data in Table 3 and Table 4 are derived from quasi-static tests. The high-strain-rate properties under blast loading may differ and are a subject for future study.
Table 5. Illustration of pressure measuring points.
Point NumberLocation and Description
P-A-1Inside the inner layer at cross-section A, measuring the explosion shock wave load on the inner surface at section A.
P-A-2Outside the inner layer at cross-section A, measuring the contact pressure at the interface between the inner layer and the energy-absorbing layer at section A.
P-A-3Inside the outer layer at cross-section A, measuring the contact pressure at the interface between the energy-absorbing layer and the outer layer at section A.
P-B-1Inside the inner layer at cross-section B, measuring the explosion shock wave load on the inner surface at section B.
P-B-2Outside the inner layer at cross-section B, measuring the contact pressure between the inner layer and the energy-absorbing layer at section B.
P-B-3Inside the outer layer at cross-section B, measuring the contact pressure between the energy-absorbing layer and the outer layer at section B.
P-C-1Inside the inner layer at cross-section C, measuring the explosion shock wave load on the inner surface at section C.
P-C-2Outside the inner layer at cross-section C, measuring the contact pressure between the inner layer and the energy-absorbing layer at section C.
P-C-3Inside the outer layer at cross-section C, measuring the contact pressure between the energy-absorbing layer and the outer layer at section C.
P-D-1Center of the end plate of the multi-layer confinement structure test model, measuring the explosion shock wave load at the center of the end plate.
Table 6. Illustration of internal blast experiments.
Shot Number Charge   Mass   W  (kg)Scaled Distance (m/kg1/3)
10.150.94
20.200.85
30.300.74
40.4750.64
50.800.53
Table 7. Peak overpressure of internal blast load (MPa).
Measuring PointP-A-1P-B-1P-C-1P-D-1
W  (kg) Model 1Model 2Model 1Model 2Model 1Model 2Model 1Model 2
0.155.9045.3450.9050.7160.5720.5060.6390.567
0.207.0717.0861.0220.9110.7350.5231.0420.742
0.3011.77910.1611.2171.1540.8000.8491.4211.234
0.47516.22117.1361.9231.7271.2740.9151.6391.886
0.8022.57524.8813.3513.8792.0822.2214.9174.391
Table 8. Impulse of internal blast load (Pa·s).
Measuring PointP-A-1P-B-1P-C-1P-D-1
W  (kg) Model 1Model 2Model 1Model 2Model 1Model 2Model 1Model 2
0.15535.33697.61140.23135.86104.72112.56621.09721.48
0.20831.11708.42209.55182.33182.31146.59780.56778.52
0.30807.17846.54260.52272.41192.58191.441395.471320.21
0.4751186.671224.80401.76377.18286.71249.371436.591629.42
0.802054.951868.38500.47506.29349.26356.832254.512561.5
Table 9. Peak strain value of model 1 ( × 10−6).
W (kg)0.150.200.300.4750.80
Test Point
A-H-1115.36143.70226.83335.22792.13
A-H-2100.58126.63195.43270.84602.89
A-H-34.617.629.7319.23241.25
A-H-43.036.948.2515.91637.84
A-J-146.2961.8192.55166.22251.91
A-J-244.4654.3080.21132.69154.44
A-J-3/4.576.238.82816.57
A-J-4/4.156.037.58712.35
Note: The data presented in this table were originally compiled in the author’s PhD thesis [30]. Subsequently, these data were formally published in a related article by our research group [31]. The present analysis and interpretation are original contributions of this work.
Table 10. Peak strain value of model 2 ( × 10−6).
W (kg)0.150.200.300.4750.80
Test Point
A-H-1110.94148.79200.8326.67674.23
A-H-2102.67121.41157.86259.09489.76
A-H-35.438.3710.2522.55944.26
A-H-43.927.018.5920.04438.69
A-J-140.5549.3589.06140.46240.07
A-J-238.0644.6552.04126.52205.14
A-J-32.044.227.569.36616.01
A-J-4/3.936.087.65713.58
Note: The data presented in this table were originally compiled in the author’s PhD thesis [30]. Subsequently, these data were formally published in a related article by our research group [31]. The present analysis and interpretation are original contributions of this work.
Table 11. Contact pressure of multi-layer structure (kpa).
W (kg)0.150.200.300.4750.80
Test Point
P-A-2Model 156.1595.25138.26220.99744.05
Model 268.42188.26281.42433.881276.26
P-A-3Model 122.0646.9352.74106.08400.26
Model 246.5267.4691.78164.27522.49
P-B-2Model 122.0431.2836.9549.22185.45
Model 240.1364.5680.42104.66334.33
P-B-3Model 115.4517.6824.3124.94120.06
Model 216.9826.4436.0152.88162.70
P-C-2Model 1/12.8115.5617.0267.57
Model 212.8816.7234.3343.39138.24
P-C-3Model 1//8.238.4250.95
Model 212.4515.1420.0825.02121.49
Disclaimer/Publisher’s Note: The statements, opinions and data contained in all publications are solely those of the individual author(s) and contributor(s) and not of MDPI and/or the editor(s). MDPI and/or the editor(s) disclaim responsibility for any injury to people or property resulting from any ideas, methods, instructions or products referred to in the content.