Article

Research on Thermal Sensation Prediction in Shoulder Seasons Using Machine Learning Based on Infrared Thermal Imaging


1
Key Laboratory of Efficient & Clean Energy Utilization, The Education Department of Hunan Province, School of Energy and Power Engineering, Changsha University of Science and Technology, Changsha 410114, China
2
School of Infrastructure Engineering, Dalian University of Technology, Dalian 116024, China
*
Author to whom correspondence should be addressed.
Buildings 2026, 16(11), 2070; https://doi.org/10.3390/buildings16112070
Submission received: 13 March 2026 / Revised: 11 May 2026 / Accepted: 19 May 2026 / Published: 22 May 2026
(This article belongs to the Special Issue Thermal Comfort and Energy Efficiency in Built Environments)

Abstract

Existing thermal sensation prediction models typically examine the relationship between skin temperature and thermal sensation during cooling or heating seasons. However, due to significant fluctuations in indoor thermal environments during shoulder seasons and considerable individual variation in clothing preferences, traditional thermal sensation prediction models demonstrate poor predictive performance during shoulder seasons. This study aims to investigate the relationship between facial skin temperature and clothing insulation versus thermal sensation under shoulder seasonal conditions and to establish a predictive model for human thermal sensation influenced by clothing insulation. First, facial temperature data under different clothing conditions are collected online using infrared thermal imaging equipment. Subjective thermal sensations are obtained through questionnaires, enabling analysis of the influence of relationships among clothing insulation, facial temperature, and thermal sensation. Subsequently, correlation analysis is used to identify the facial temperature zones closely related to human thermal sensation. Finally, a random forest algorithm is employed to establish a thermal sensation prediction model. Research findings indicate that during shoulder seasons, the left and right cheeks and lips exhibit a higher correlation with thermal sensation. Due to variations in clothing insulation, thermal sensation models based solely on facial temperature characteristics demonstrate lower predictive accuracy and struggle to overcome interference caused by individual clothing differences. After incorporating clothing insulation as a key input feature parameter, the model’s Root Mean Square Error decreased from 0.869 to 0.533, representing a 38.7% improvement in prediction accuracy. This demonstrates that the clothing insulation parameter plays a crucial role in enhancing the precision of human thermal sensation prediction models during shoulder seasons.

1. Introduction

The building thermal environment is not only a collection of physical parameters but also a core factor determining occupants’ quality of life, physical and mental well-being, and work efficiency. Studies indicate that prolonged exposure to uncomfortable thermal environments can significantly induce “Sick Building Syndrome”, causing occupants to experience symptoms such as fatigue and headaches. Furthermore, thermal discomfort can trigger illnesses; for instance, lower temperatures may lead to elevated blood pressure [1]. Maintaining a comfortable indoor thermal environment can enhance office workers’ productivity and improve their cognitive focus [2]. Therefore, optimizing indoor thermal environments is crucial for safeguarding public health and enhancing social productivity. Thermal sensation prediction models play a crucial role in this process, capable of forecasting occupants’ subjective perceptions of the thermal environment based on multiple factors including indoor and outdoor environmental parameters, human physiological characteristics, and activity levels. Integrating thermal sensation prediction models into building environmental control processes enables the adjustment of indoor environmental parameters based on forecast results. This maintains indoor conditions within the range perceived as comfortable by occupants, significantly enhancing thermal comfort and meeting personalized needs.
Person-centered thermal comfort has become an important topic [3]. In recent years, researchers have primarily employed contact-type temperature sensors to monitor human physiological parameters, thereby enabling the measurement of human thermal sensation. Feng et al. [4] employed wearable wristbands to continuously measure individuals’ skin temperature, electrodermal activity (EDA), and heart rate. They demonstrated that contact-based physiological parameters effectively reflect fluctuations in thermal preferences. The machine learning prediction model they developed achieved over 94% accuracy in real-life scenarios. Li et al. [5] employed wrist-worn devices to collect real-time heart rate, wrist skin temperature, and their time-dependent rates of change. Based on this data, they constructed an evaluation model that successfully achieved the precise prediction of human thermal sensation across various activity intensities. Lee et al. [6] continuously monitored and analyzed individual physiological signals such as skin temperature, skin conductance, and heart rate. By integrating these with metabolic rate and environmental indicators, they quantitatively validated the effectiveness of incorporating the metabolic rate into a personal thermal comfort model. Although contact sensors (such as hot-wire thermocouples [7], thermistors [8,9], skin temperature sensors [10], etc.) offer significant advantages over non-contact sensors in terms of measurement accuracy and application maturity for human thermal sensation, their reliance on single-point temperature measurement and the requirement for active sensor wear by individuals limit their widespread practical application. Therefore, some studies employ non-contact methods such as video and image recognition technology to investigate the relationship between physiological parameters and thermal comfort. For example, Tian et al. [11] demonstrated that seasonal adaptation effects must be considered when using facial skin temperature to assess thermal comfort. Their extended evaluation model achieved an accuracy rate of up to 86% in predicting individual thermal neutrality. Li et al. [12] proposed a non-invasive perception framework based on deep learning that can simultaneously extract key individual characteristics such as age and gender from thermal imaging. This addresses the limitation of traditional models, whose prediction accuracy is constrained by the lack of individual variation parameters. Heravi et al. [13] developed a thermal-image-driven intelligent estimation system that captures subtle thermal characteristics in the infrared spectrum. This system enables the real-time, accurate quantification of an individual’s clothing insulation level (light, medium, or heavy) without collecting visible light images. Choi et al. [14] proposed a vision-driven adaptive control strategy, demonstrating that real-time acquisition of clothing insulation information through non-contact means is key to achieving human-centered, precision thermal environment regulation. Zhang et al. [15] employed infrared thermal imaging technology to capture facial features, combined environmental parameters to construct an ensemble tree model, and introduced the SHapley Additive exPlanations interpretation framework to perform quantitative analysis of prediction results. This approach optimized the energy efficiency of air conditioning systems while ensuring human thermal comfort.
Regarding methods for establishing thermal sensation prediction models, they are primarily divided into two categories. The first category consists of white-box models based on physical mechanisms. White-box models, represented by Fanger’s predicted mean vote (PMV) model [16] and Gagge’s two-node model [17], have established the physical foundation for research on thermal comfort in buildings. However, PMV is a steady-state model and cannot accurately predict thermal sensation during temperature fluctuations in shoulder seasons. The traditional two-node model suffers from severe homogenization, assuming all individuals possess physiological parameters identical to those of a standard person. This simplification overlooks significant individual variations in age, gender, and body mass index (BMI), causing the model’s predictive accuracy to decline substantially when applied to non-standard populations or extreme environments. To overcome the limitations of traditional two-node models in predicting local thermal sensations, Takahashi et al. [18] developed the improved multi-node thermal regulation model JOS-3 based on JOS-2. This model divides the human body into a discrete system composed of multiple physiological nodes, clearly describing the thermal equilibrium of each local region and dynamically adjusting thermal physiological parameters according to the subject’s age, gender, height, and weight. To address the limitations of the traditional Gagge two-node model, which relies on overly idealized parameter settings, Liu et al. [19] proposed an extended personalized two-node mechanism model. Tailored for high-temperature work environments, this model employs the subject’s initial measured state as the temperature setpoint. It revises the calculation equations for the metabolic rate and convective heat transfer coefficient, effectively resolving the traditional two-node model’s inadequate adaptability under extreme heat exposure conditions. However, such white-box models are often structurally complex and difficult to parameterize, and they struggle to establish accurate physical equations when handling random behaviors such as dynamic clothing adjustments during shoulder seasons. In contrast, data-driven black-box models demonstrate higher predictive accuracy for individuals with pronounced variability during shoulder seasonal conditions. For instance, Zhou et al. [20] developed a two-stage thermal sensation prediction framework based on deep learning neural networks (DLNNs) for complex in-vehicle thermal environments. This framework achieved a prediction accuracy of 95.8% on the test set, significantly outperforming traditional machine learning models. Hu et al. [21] employed a convolutional neural network (CNN) to analyze facial micro-expression sequences, capturing neural response features associated with transient thermal discomfort, thereby establishing an accurate joint evaluation model for thermal and acoustic environmental comfort. Zhao et al. [22] compared over ten algorithms, including SVM, XGBoost, and logistic regression, and found that random forests achieved the highest overall accuracy in predicting human thermal sensation.
In addition, although existing research on thermal comfort has largely focused on typical extreme conditions such as summer cooling and winter heating [23,24], research on predictive models for dynamic environments during shoulder seasons has also gradually attracted widespread attention in the academic community. In their study on thermal comfort prediction during shoulder seasons, Jones et al. [25] noted that traditional PMV models overlook physiological diversity because they are based on the standard human assumption. Consequently, the Arup team adopted a multi-node thermoregulatory model that can be dynamically adjusted according to individual parameters; this model is capable of handling the non-uniform and time-varying transient environments commonly found during shoulder seasons. Song et al. [26] employed machine learning algorithms to conduct an in-depth analysis of multidimensional physiological and psychological parameters in indoor environments during the shoulder seasons; through dimensionality reduction and algorithm comparison, they achieved accurate modeling for the assessment of complex thermal environments.
Due to significant fluctuations in indoor thermal environments during shoulder seasons and pronounced individual variations in clothing habits, most current thermal sensation prediction models either fail to incorporate clothing insulation or neglect individual clothing adjustments. For instance, Schiavon and Lee [27] proposed a clothing insulation prediction model based solely on outdoor air temperature. Such approaches remain fundamentally static predictions, reflecting only average clothing trends at the group level and failing to capture real-time thermal adaptation adjustments made by individuals in response to indoor temperature changes during shoulder seasons. Consequently, the predictive accuracy of these models is limited in non-steady-state environments.
Based on the above analysis, this study aims to address the challenge of modeling human thermal sensation under conditions of uncertainty in clothing insulation during shoulder seasons. By integrating facial skin temperature identified through infrared thermal imaging with clothing insulation parameters, a machine learning approach is employed to establish a thermal sensation prediction model adapted to the natural temperature variations of shoulder seasons. The remainder of this paper is structured as follows: Section 2 describes the experimental conditions, including the laboratory, experimental equipment, experimental procedures, and statistical analysis methods. Section 3 analyzes the experimental results, investigates the relationship between multiple parameters and thermal sensation, and establishes a thermal sensation prediction model. Section 4 discusses the experimental findings and the existing shortcomings and limitations of this study. Section 5 presents the conclusions of this paper.

2. Methodology

2.1. Laboratory and Equipment

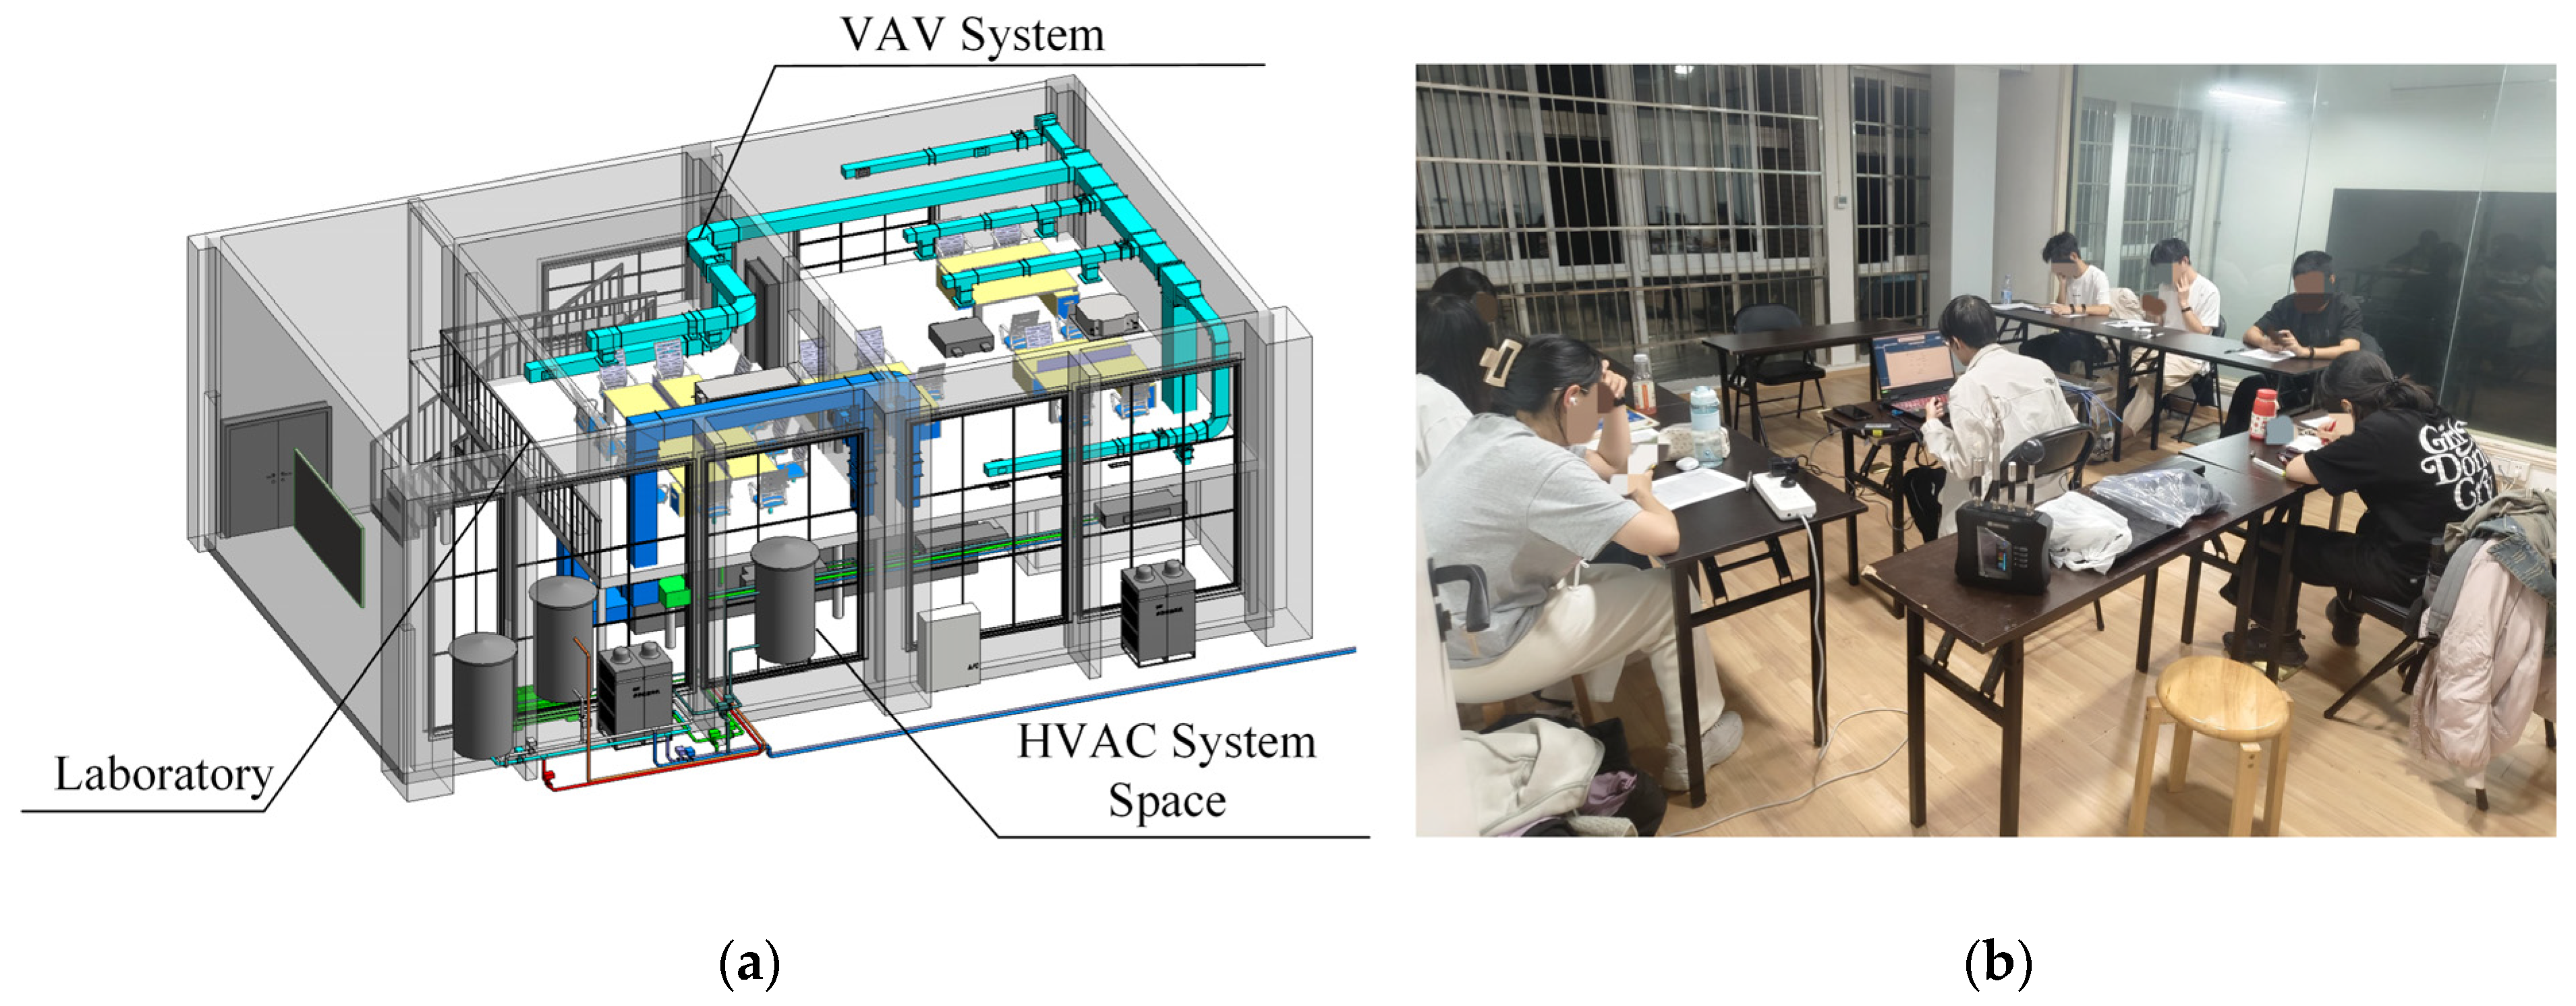
The human thermal sensation experiments were conducted in the Artificial Environment Laboratory at the Changsha University of Science and Technology in China, where human thermal sensation and thermal characteristic parameters were collected. The laboratory contains two air-conditioned rooms, a variable air volume (VAV) air conditioning system, and a heating, ventilation, and air conditioning (HVAC) system, as shown in Figure 1. The experiment was conducted during shoulder seasons, utilizing natural ventilation to regulate the indoor thermal environment and air quality. Additionally, the laboratory was equipped with numerous sensors, including air temperature and humidity sensors, as well as wind speed sensors. Data obtained from these sensors was recorded during the experiment. Infrared thermal imaging equipment was employed to capture and extract skin temperatures from different facial regions. Selected equipment models and specifications are listed in Table 1.

2.2. Experimental Design

Prior to the experiment, we recruited participants by distributing an online questionnaire link, collecting basic demographic information including height, weight, age, and gender. The specific information of the subjects is shown in Table 2.
The experiments with human subjects were performed according to the world medical association’s code of ethics, and informed consent was obtained for experimentation with subjects. This experiment recruited a total of 20 participants aged 18 to 23, all of whom were enrolled students at the Changsha University of Science and Technology, with 10 males and 10 females. All subjects had resided in Changsha for over one year, eliminating the influence of heat acclimatization. All subjects were in good health with no history of cardiovascular disease, hypertension, or hyperglycemia. Subjects exhibited stable psychological conditions with no significant emotional fluctuations during the experiment. Within 24 h prior to the experiment, subjects maintained normal rest and sleep patterns and were prohibited from consuming coffee, alcohol, or other stimulants. Throughout the entire experiment, all subjects were required to maintain consistent facial information. This included removing eyeglasses as instructed during specific phases, refraining from wearing makeup, and avoiding jewelry such as earrings or studs.
Participants wore their own clothing during the experiment but were required to coordinate their outfits (typical shoulder season attire). The first set of experiments included a short-sleeved shirt, casual trousers, and sneakers, with an approximate clothing insulation of 0.5 clo. The second set of experiments included a short-sleeved shirt, a light jacket, casual trousers, and sneakers, with an approximate clothing insulation of 0.7 clo. The third set of experiments included a short-sleeved shirt, a thin down jacket, casual trousers, and sneakers, with an approximate clothing insulation of 0.9 clo. The fourth experimental group included a short-sleeved shirt, a light jacket, a thin down jacket, casual trousers, and sneakers, with an approximate clothing insulation of 1.2 clo. Prior to the experiment, each participant was thoroughly briefed on the experimental procedures, the physiological parameters to be measured, the subjective questionnaires, and important precautions.
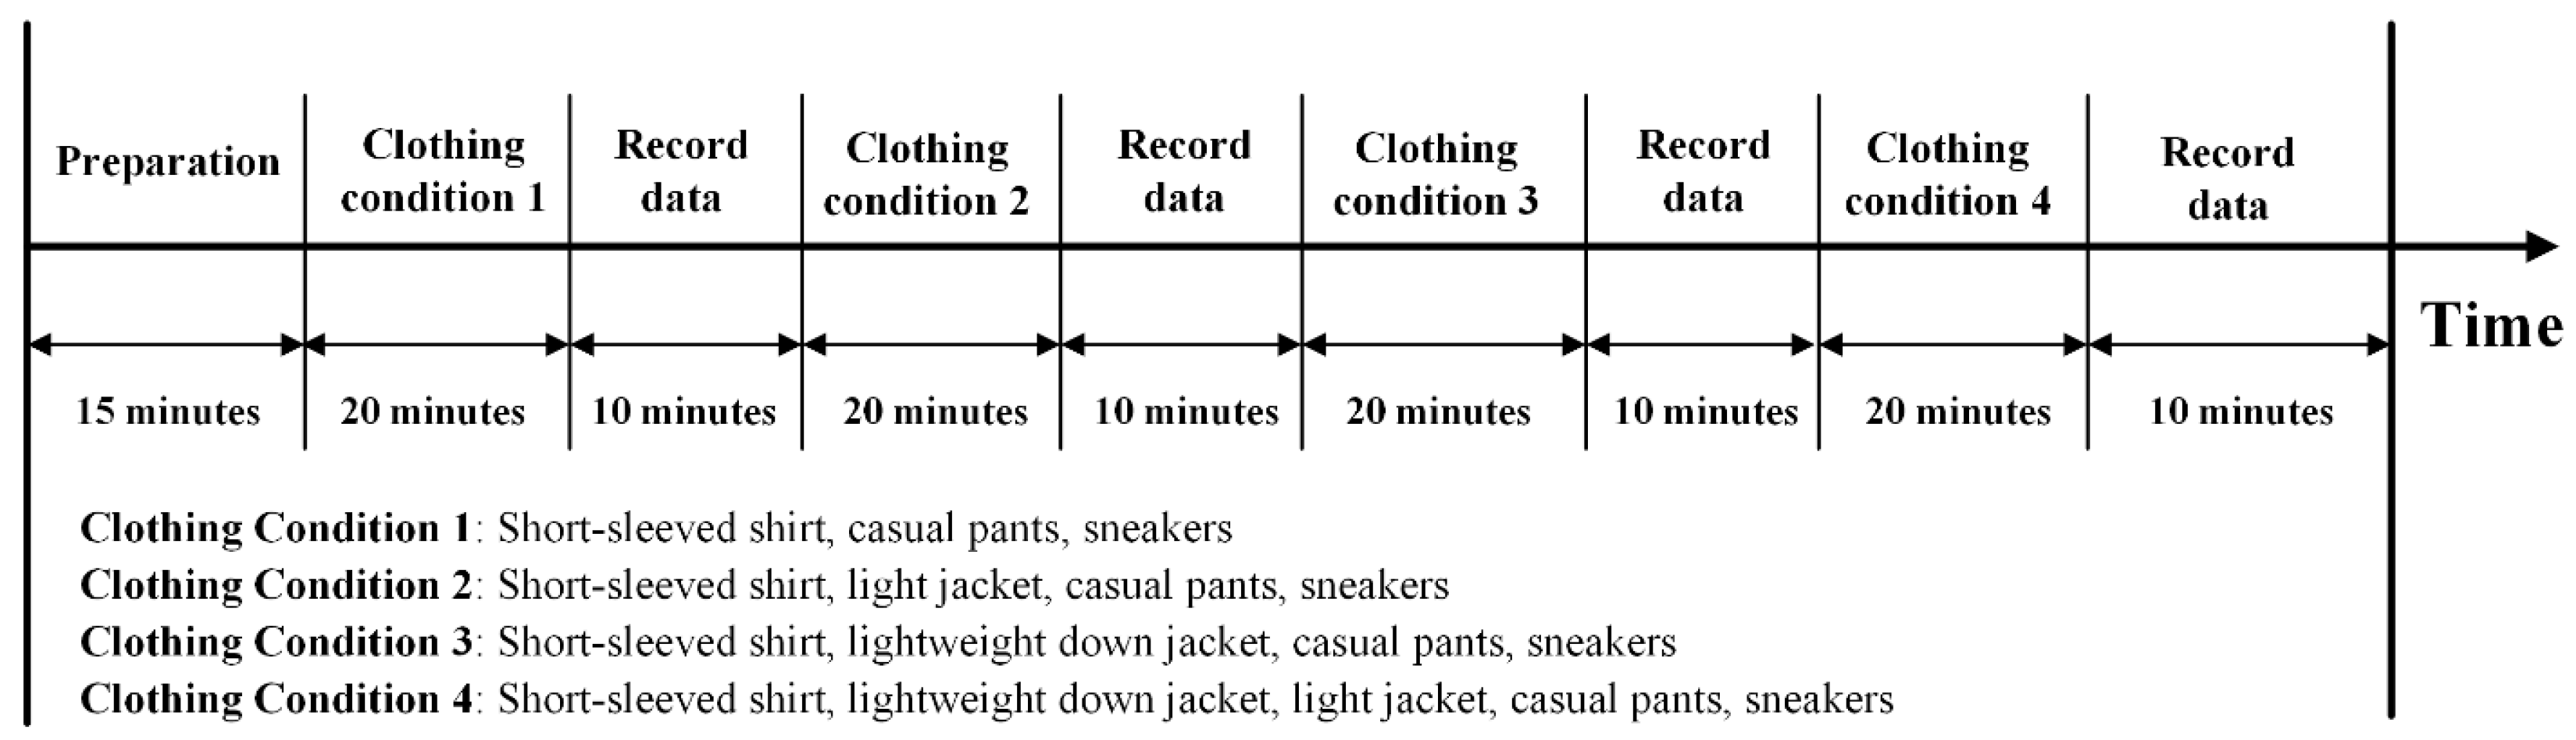
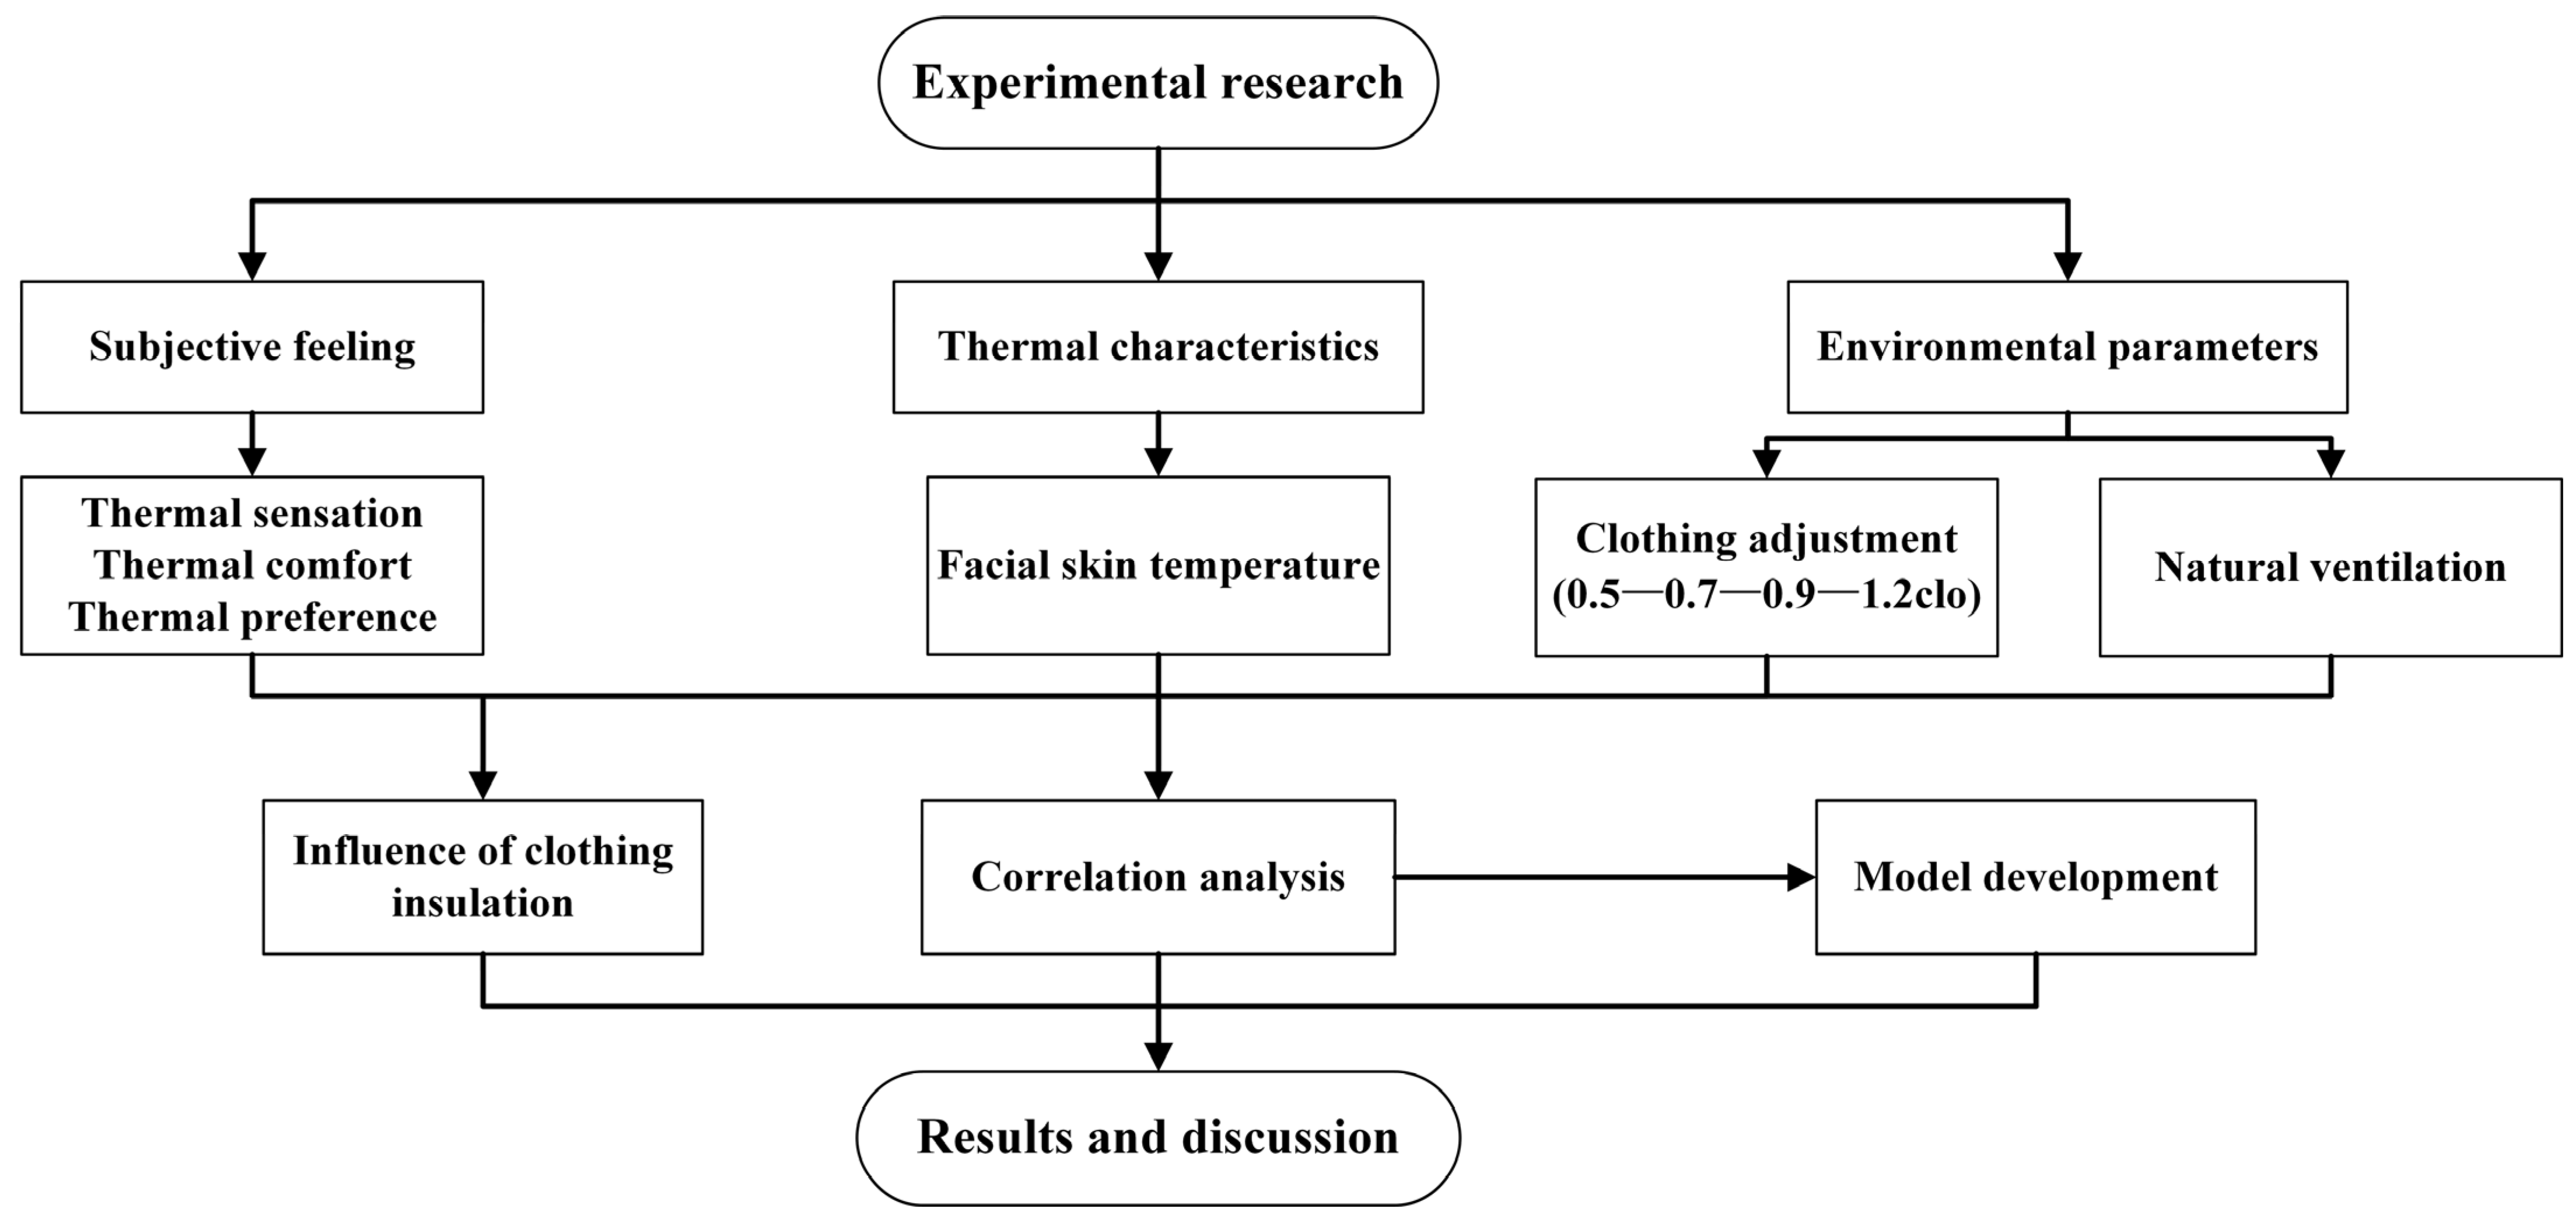
The experiments were performed every other day for a total of 12 days. Each day’s experiments were divided into two batches, with 10 participants in each batch. The detailed schedule for each batch of experimental procedures is shown in Figure 2. Before the experiment began, the subjects were to arrive at the laboratory in advance and sit quietly in a chair for 15 min to acclimate to the environment. Subsequently, participants performed low-energy activities such as office work or sitting while wearing garments with varying clothing insulation as instructed. To ensure the accuracy and objectivity of the PMV model evaluation, this study performed precise adjustments to the thermal comfort tester during the experiment. First, given that the subjects were in a seated, studying state, the metabolic rate (Met) was uniformly set to the standard value of 1.0 met. Second, as the experiment progressed, we sequentially entered the insulation values of the clothing actually worn by the subjects in each experimental batch (0.5, 0.7, 0.9, and 1.2 clo) into the instrument. By combining these dynamic human parameters with the environmental physical parameters monitored in real time by the instrument, we obtained precise PMV prediction data. Under the first experimental condition, participants wore one short-sleeved top on their upper body. After acclimating indoors for 20 min, the current indoor temperature was recorded, and the JT2180 Indoor Environmental Comfort Tester measured the PMV and related environmental parameters for the current conditions. Researchers captured facial images of Participant 1 using a handheld device. Participant 1 randomly completed a pre-prepared thermal sensation questionnaire, as shown in Table 3. The questionnaire included the ASHRAE 7-point thermal sensation scale (TSV) [28], thermal comfort voting (TCV), and thermal preference voting (TPV). Subsequently, facial photographs were taken of Participants 2 through 10 in sequence. Following photography, each participant completed the questionnaire. Immediately after questionnaire completion, participants changed into the attire required for the second experimental set and repeated the above procedure until the experiment concluded. To minimize the influence of indoor environmental conditions, all participants were required to complete the tests simultaneously. The overall experimental flowchart is depicted in Figure 3.

2.3. Statistical Analysis Methods

Thermal sensation is influenced by multiple factors, including environmental parameters, physiological parameters, and clothing insulation, with complex nonlinear coupling relationships among these variables. Traditional linear regression models struggle to capture these nonlinear characteristics. Therefore, this study employs a random forest algorithm to establish a predictive model for human thermal sensation.
Random forest is an ensemble learning algorithm based on the Bagging concept [29]. It constructs multiple decision trees and integrates their prediction results to enhance the model’s predictive accuracy and generalization capability. Its fundamental principle involves randomly sampling k samples from the original training set using bootstrap sampling to build k regression decision trees. During the node splitting process of each tree, the algorithm randomly selects a subset of features to compute the optimal split point, thereby increasing the model’s diversity.
Assume the original dataset is D = { ( x 1 , y 1 ) , ( x 2 , y 2 ) , ( x N , y N ) } , where x i represents the input feature vector (e.g., clothing insulation, left/right cheek temperature) and y i denotes the target variable (TSV). The random forest generates B training subsets D b by randomly sampling N samples with replacement.
For each subset D b , a regression tree T b ( x ) is conducted. During the splitting process at each node, the algorithm does not search all features but randomly selects m features for search.
For regression problems (TSV prediction), the splitting criterion is typically minimizing the Mean Squared Error (MSE). Suppose at a certain node, the data is split into left subtree L and right subtree R. The optimal splitting point s and feature j are selected to minimize the following objective function:
L ( j , s ) = x i R L ( j , s ) ( y i y ¯ L ) 2 + x i R R ( j , s ) ( y i y ¯ R ) 2
where y ¯ L and y ¯ R represent the average target sample values (TSVs) in the left and right child nodes, respectively.
After constructing all base regression trees, the random forest aggregates outputs to produce the final prediction. For regression predictions on continuous variables like the TSVs, the model employs simple averaging to integrate outputs from all decision trees. Assuming the model consists of a B regression tree, for any new environmental and physiological parameter input vector x , if the b tree predicts a value of T b ( x ) , the final prediction output Y ^ R F ( x ) of the random forest is calculated as follows:
Y ^ R F ( x ) = 1 B b = 1 B T b ( x )
To objectively evaluate the predictive performance of the model, eliminate the impact of randomness in dataset partitioning on evaluation results, and effectively prevent model overfitting, this study employs a 5-fold cross-validation method for model training and validation.
The specific process is as follows: This study first performs data preprocessing, including standardization and missing value handling. The entire preprocessed dataset is randomly shuffled and evenly divided into five mutually exclusive subsets. Subsequently, five independent training and testing cycles are conducted: in each iteration, one subset is sequentially selected as the test set for model validation, while the remaining four subsets serve as the training set for model construction.
During each fold validation process, the dataset is split into an 80% training set and a 20% validation set. First, a regression model is constructed using the training set data, and the model’s internal prediction metrics are calculated. Subsequently, the model is applied to predict the remaining 20% validation set data, and the external prediction metrics are computed. We focus on selecting the RMSE. By comparing internal and external metrics, we can effectively validate the model’s fit: if the external metric is smaller than the internal metric or the difference between them is minimal, it indicates that the model fits well and has a low degree of overfitting. Finally, the average of the five validation results is taken as the comprehensive evaluation metric for model performance.
Although the algorithm internally optimizes the MSE, this study employs RMSE as the primary metric for evaluating the fitting performance and predictive accuracy of the random forest model during the final assessment phase. This is because minimizing the MSE is equivalent to minimizing the RMSE, and the RMSE shares the same units as the TSVs, enabling a more intuitive reflection of the model’s deviation magnitude in actual thermal comfort predictions.
RMSE is commonly used as a comprehensive metric to measure the deviation between model predictions and actual observed values:
RMSE = 1 N i = 1 N ( y i y ^ i ) 2
Here, N represents the total number of samples in the test or validation set, y ^ i denotes the model’s predicted value, and y i denotes the actual sample value. The RMSE value is in the range of 0 ≤ RMSE ≤ ∞. A smaller RMSE value indicates a better model fit.
To quantify the degree of multicollinearity among the input variables, this study employs the Variance Inflation Factor (VIF) as a statistical test metric. The VIF reflects the redundancy of information contained in a variable by measuring the extent to which that variable can be linearly represented by other variables. For the i feature variable X i in the feature set, the formula for calculating its VIF value is as follows:
V I F i = 1 1 R i 2
Here, R i 2 represents the coefficient of determination for the auxiliary regression. Specifically, it is the R 2 value obtained when performing a linear regression on all other input features in the model (such as clothing insulation and facial skin temperature), with the feature X i as the dependent variable.
The value of R i 2 ranges from 0 to 1. When a feature X i is highly correlated with other features, R i 2 approaches 1, resulting in a significant increase in VIFi. This study adopts a relatively stringent evaluation criterion in statistics.
When V I F i < 5 , it indicates that the feature has good independence and that the model does not suffer from severe multicollinearity.
When V I F i 5 , it is determined that the feature exhibits significant multicollinearity and must be eliminated through feature screening or dimensionality reduction (such as the averaging of left and right cheek temperatures performed in this study) to ensure the objectivity and physical accuracy of the feature importance assessment in the random forest model.

3. Results

3.1. Correlation Analysis Between Facial Skin Temperature and Thermal Sensation

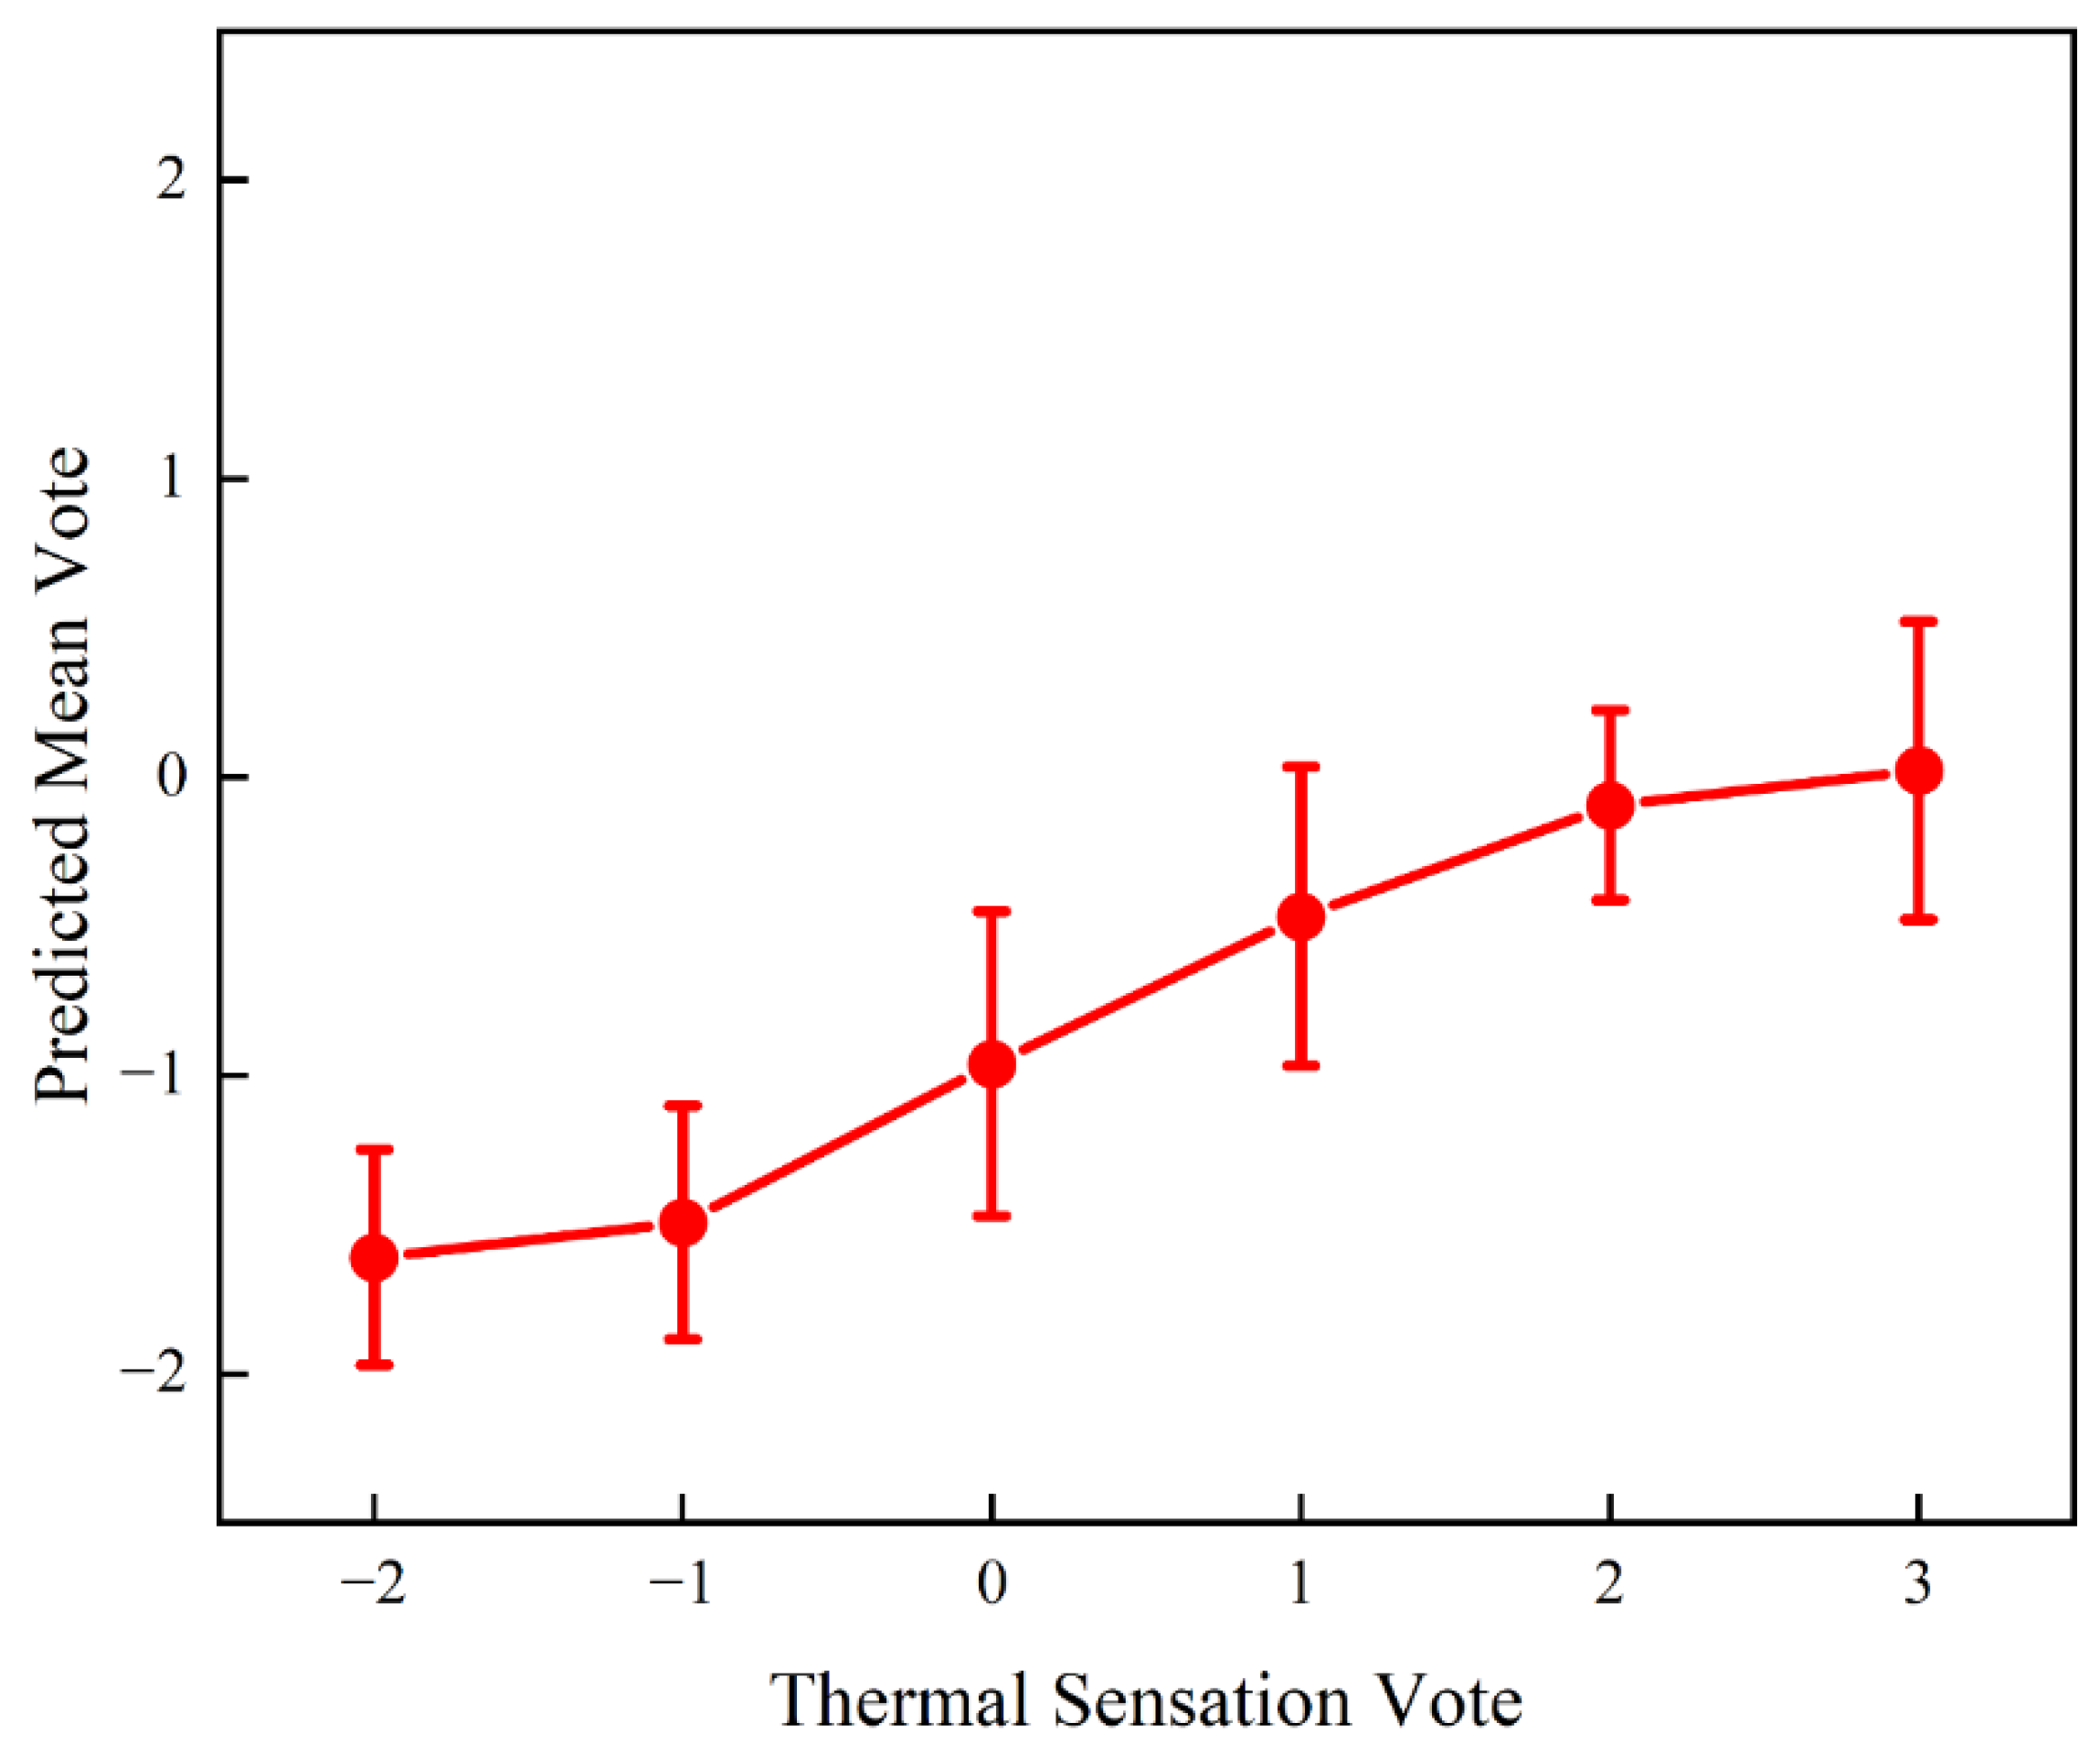
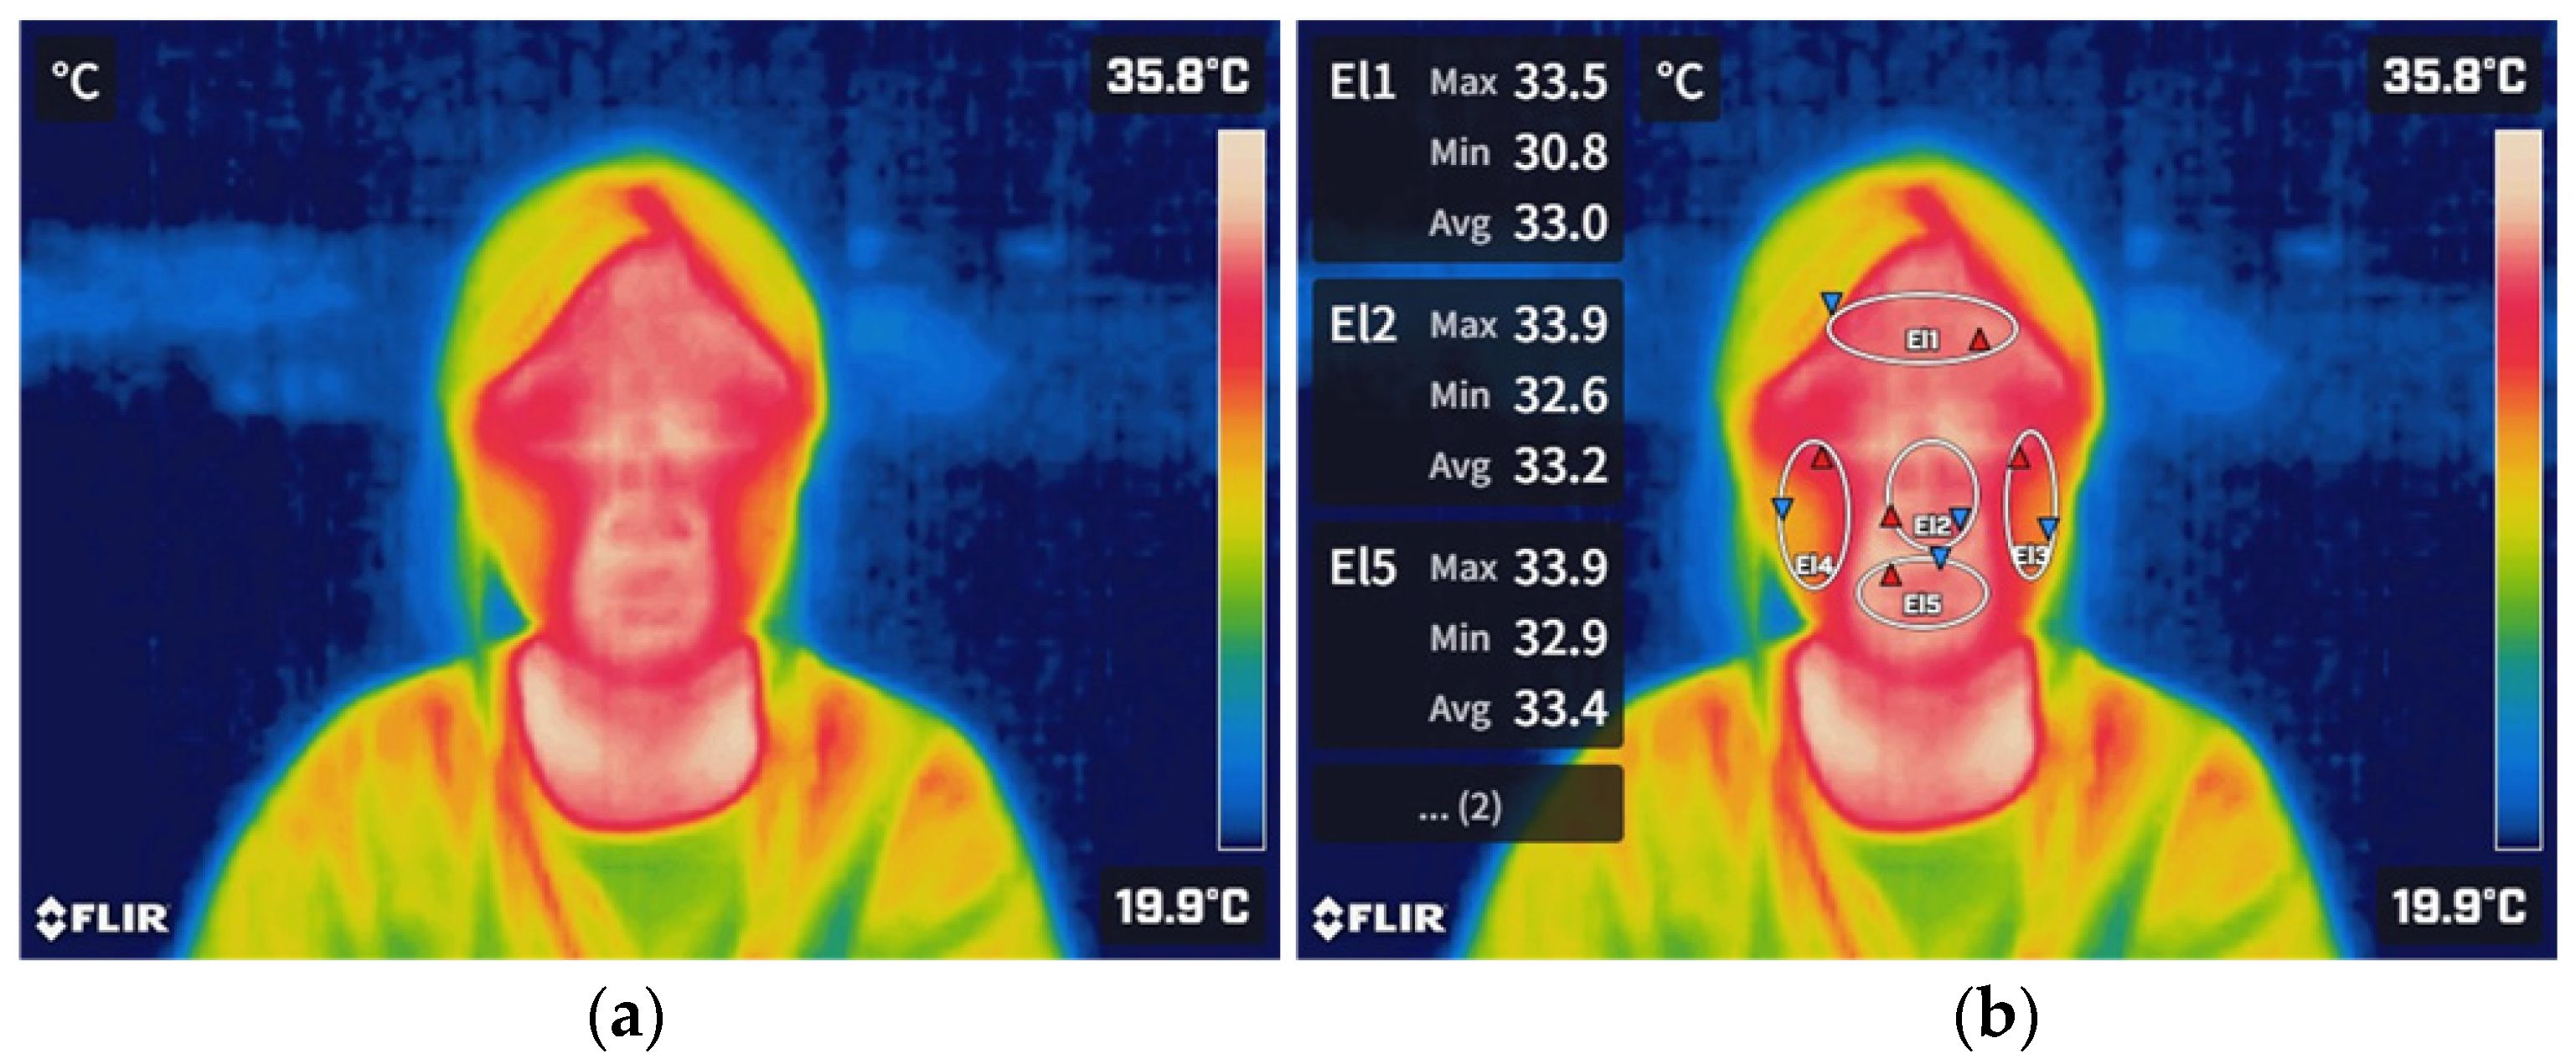
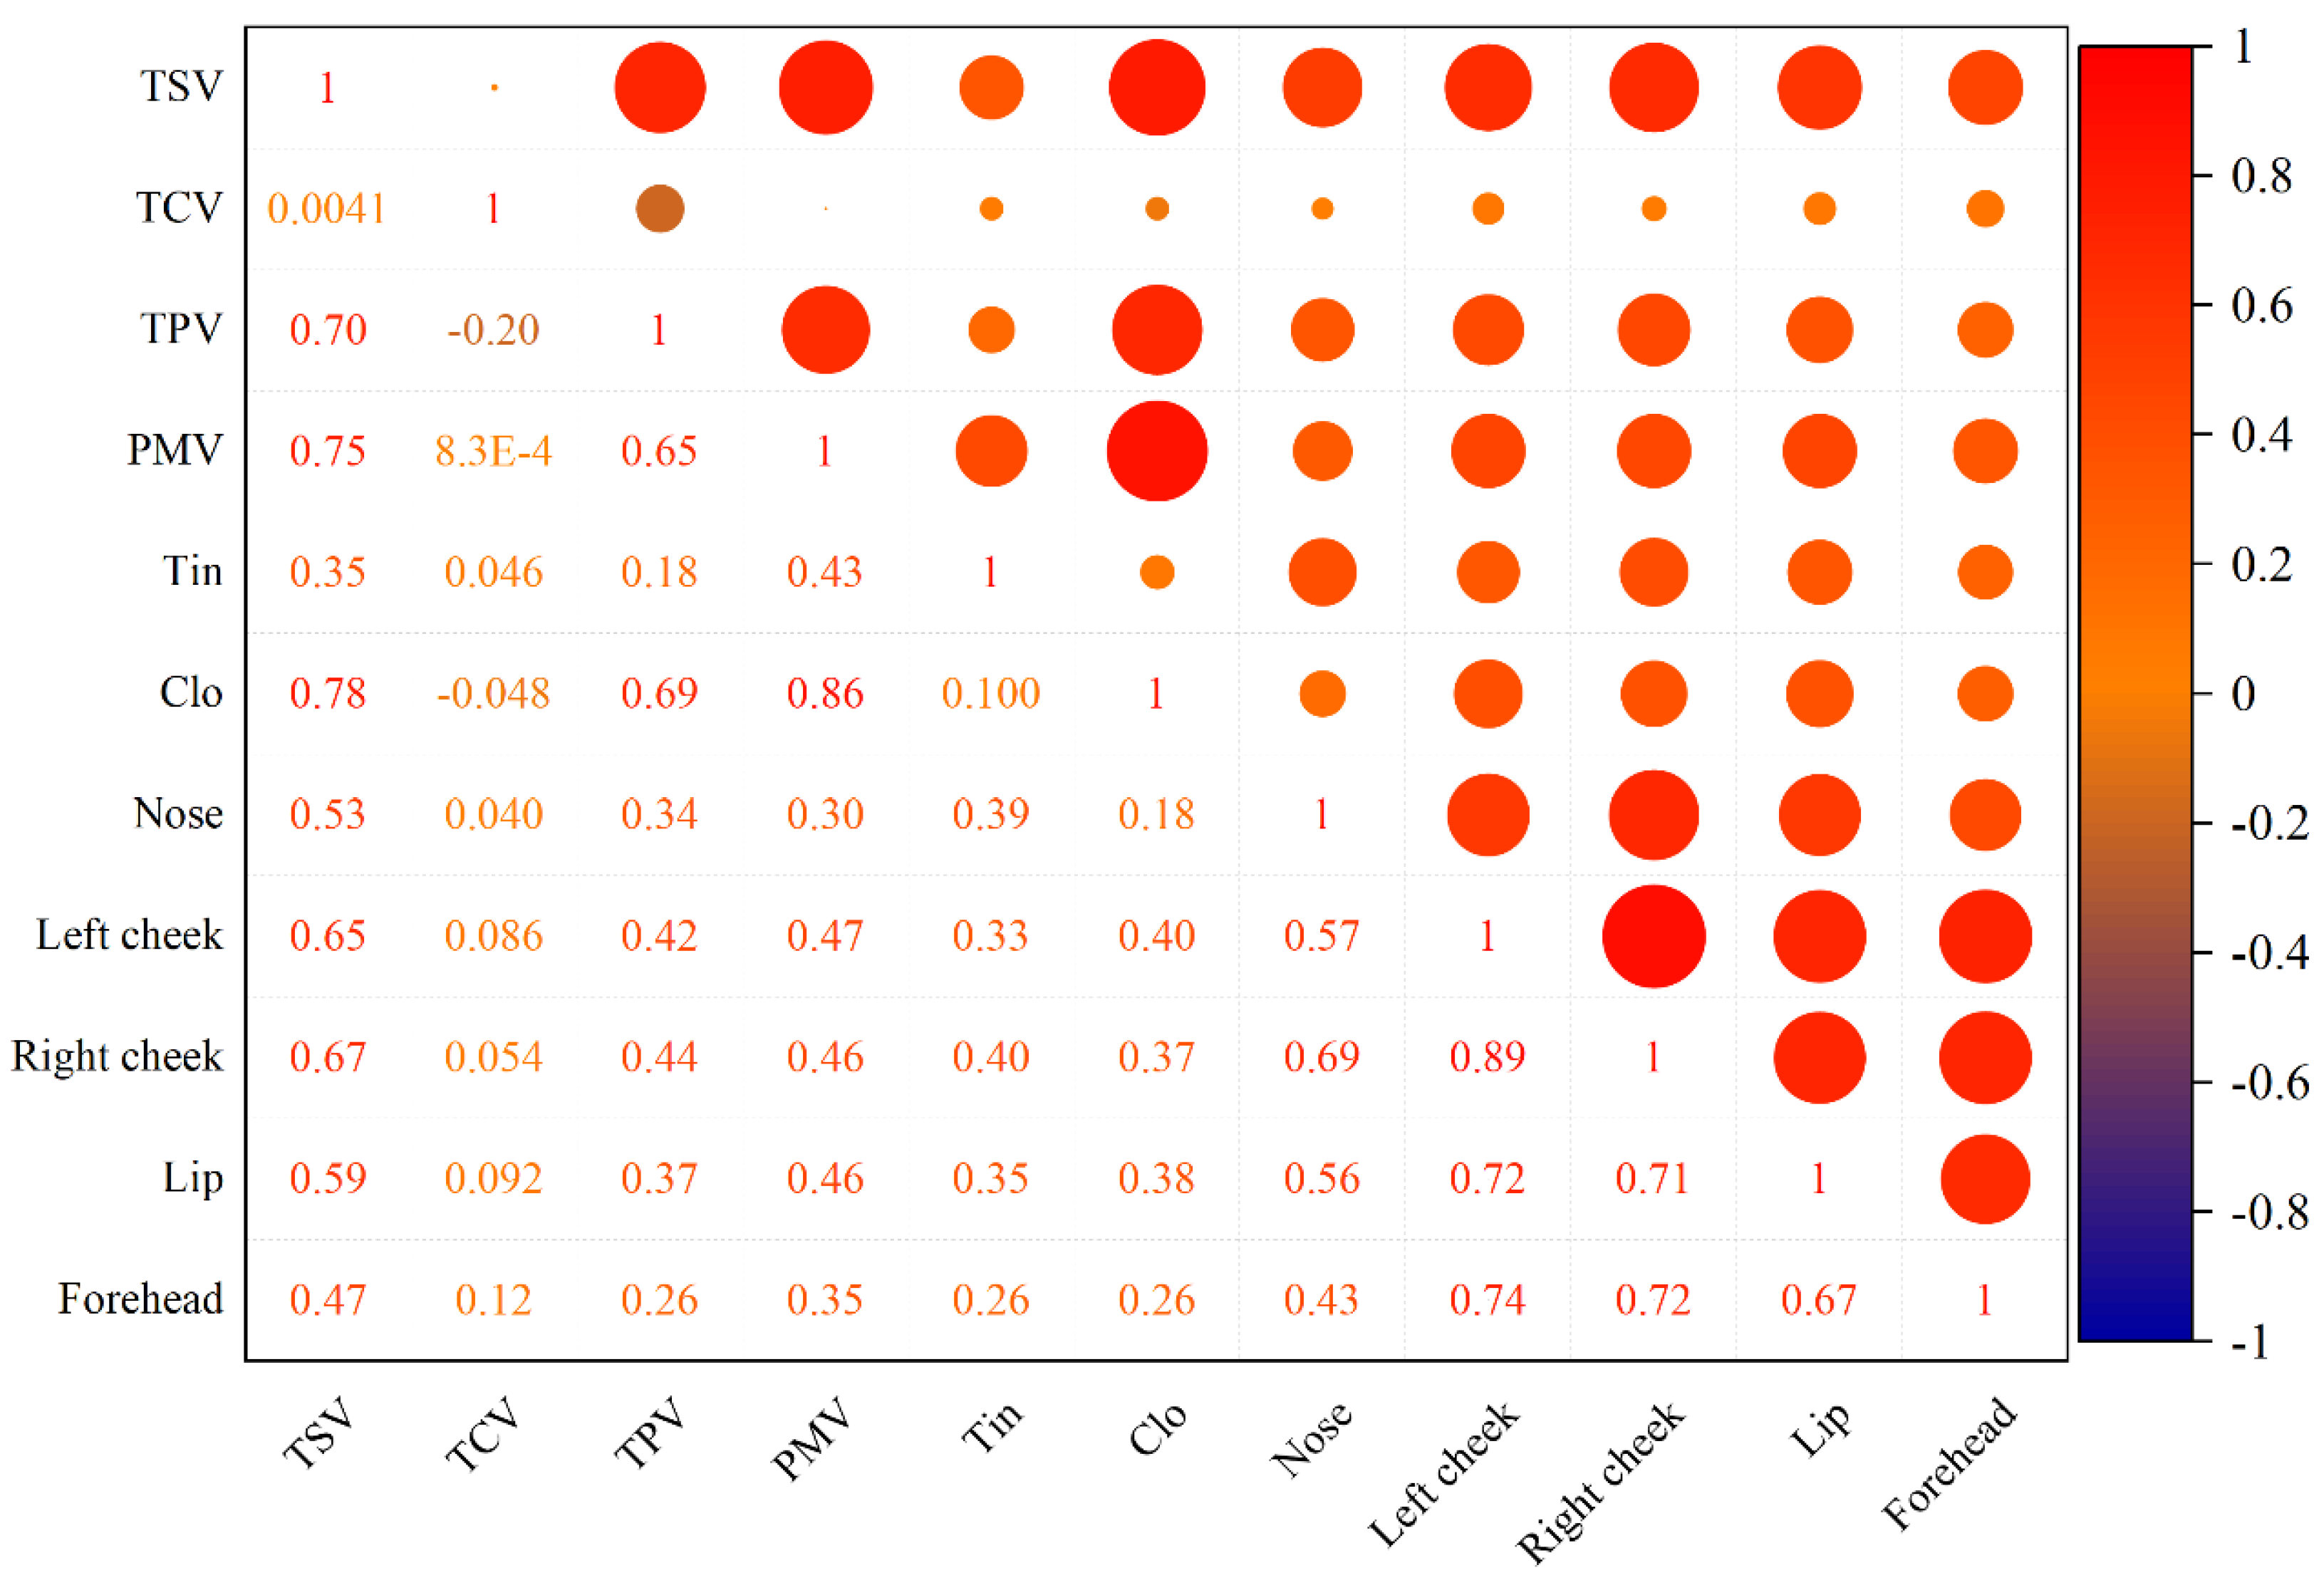
During the experiment, the outdoor temperature fluctuated between 16 °C and 23 °C. However, due to the thermal inertia of the building envelope, the indoor temperature remained relatively stable, staying within a narrow range of 18 °C to 22 °C. Figure 4a shows the facial temperature of a human subject captured by an infrared camera, with the facial area divided into the forehead, lips, nose, and left/right cheeks, as illustrated in Figure 4b. During the experiment, a total of 480 sets of facial temperature data and 480 sets of questionnaire responses were collected using the FLIP C3-X infrared device. To analyze the relationship between thermal sensation and relevant parameters, this study employed Pearson correlation analysis to examine the correlations among the TSV, TCV, TPV, PMV, indoor temperature (TIN), and temperatures across different facial regions. Correlation heatmaps were generated, as shown in Figure 5. Darker red indicates a stronger correlation, while darker blue indicates a weaker correlation. As shown in Figure 5, among the correlations between facial region temperatures and TSV, the correlation coefficients for the left and right cheek temperatures were 0.65 and 0.67, respectively, representing the highest correlations among facial temperatures. This was followed by the lip temperature with a correlation of 0.59, while the nose and forehead temperatures exhibited the lowest correlations at 0.53 and 0.47, respectively. The correlation between the room temperature and TSV is only 0.35. This is because the experiment was conducted under natural ventilation conditions, where the local outdoor temperature remained relatively stable during the experiment, resulting in minimal indoor temperature variation. Although the correlation between the PMV and TSV is as high as 0.75, Figure 6 shows that the PMV values measured by the machine differ significantly from the volunteers’ subjective thermal sensations. This is because, under naturally ventilated conditions during the shoulder seasons, dynamic fluctuations in the indoor thermal environment cause the human body’s thermal balance to be in a non-steady state, which exceeds the steady-state application assumptions of the PMV model. Therefore, it is essential to establish a thermal sensation prediction model based on facial skin temperature for the shoulder seasons.

3.2. The Effect of Clothing Insulation on Thermal Sensation and Facial Skin Temperature

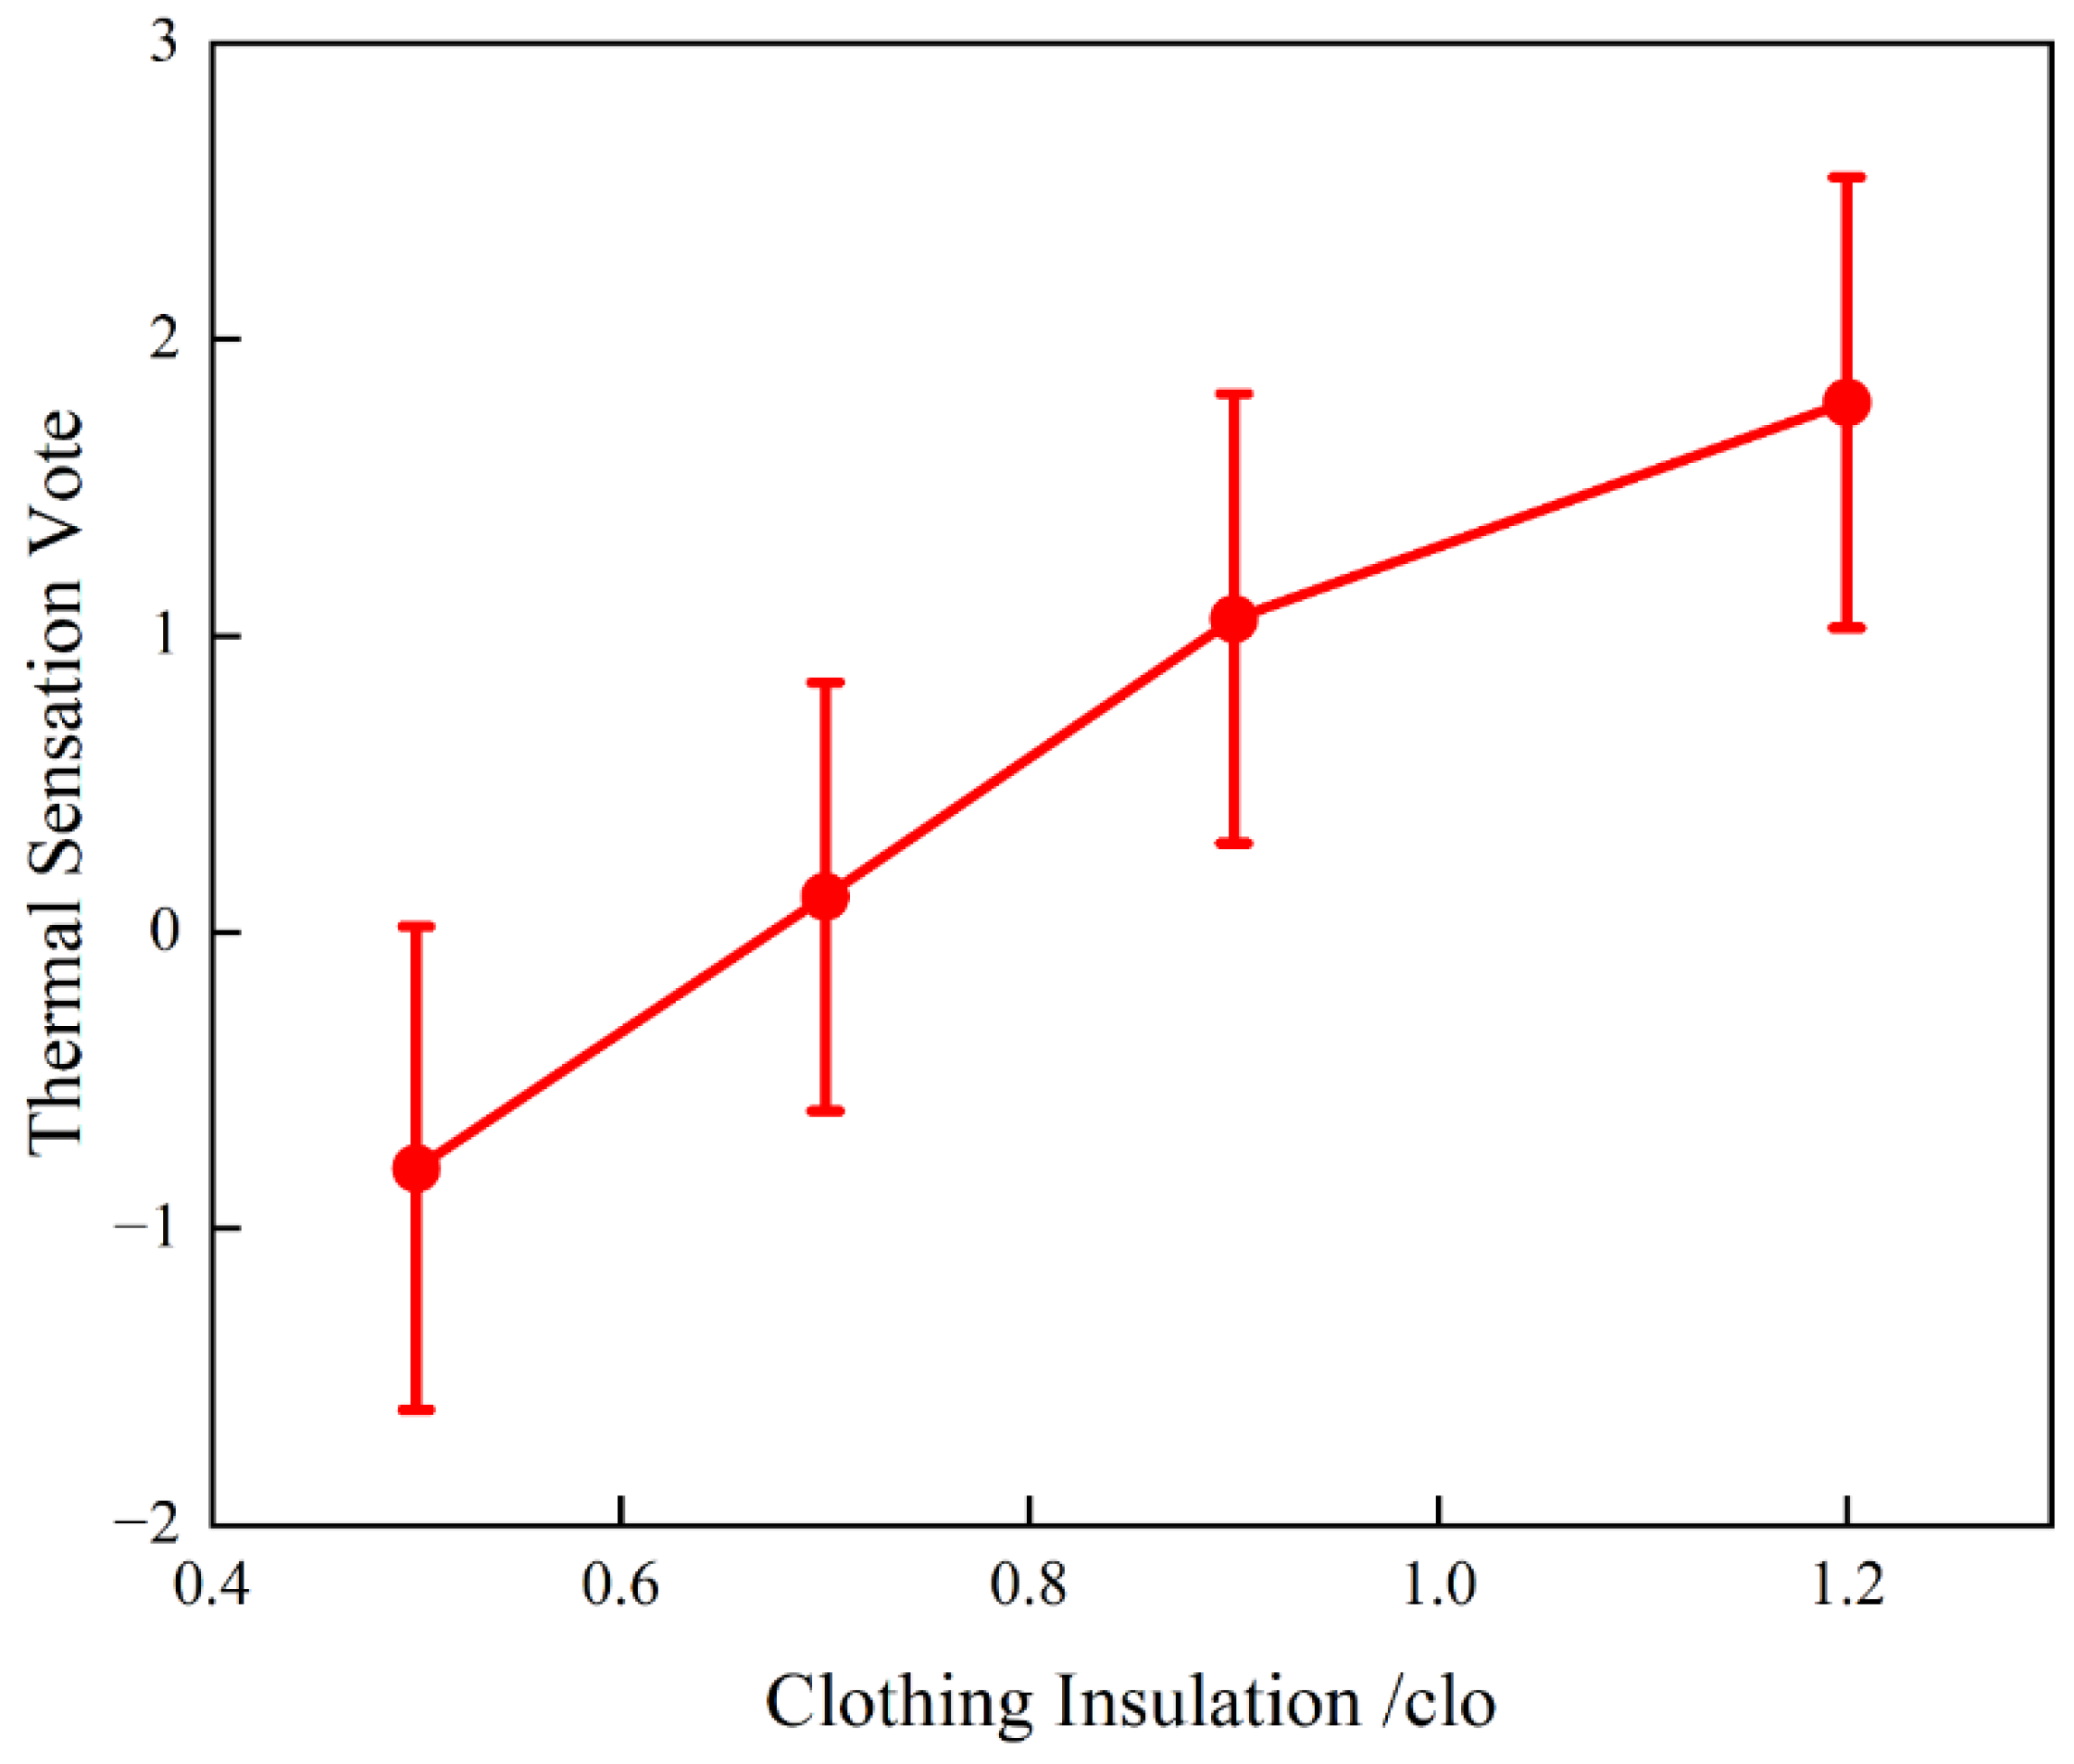
Figure 7 shows the error bar chart for clothing insulation versus the TSV. As shown, the TSV average increases from −0.8 to 1.8 as clothing insulation rises from 0.5 clo to 1.2 clo. This indicates that as clothing insulation increases, the human body’s thermal sensation gradually becomes warmer. The correlation coefficient between the TSV and clothing insulation is 0.78, indicating a strong correlation. This demonstrates that clothing insulation significantly influences human thermal sensation when the ambient temperature remains relatively stable, suggesting that clothing insulation can serve as an input parameter for human thermal sensation prediction models.
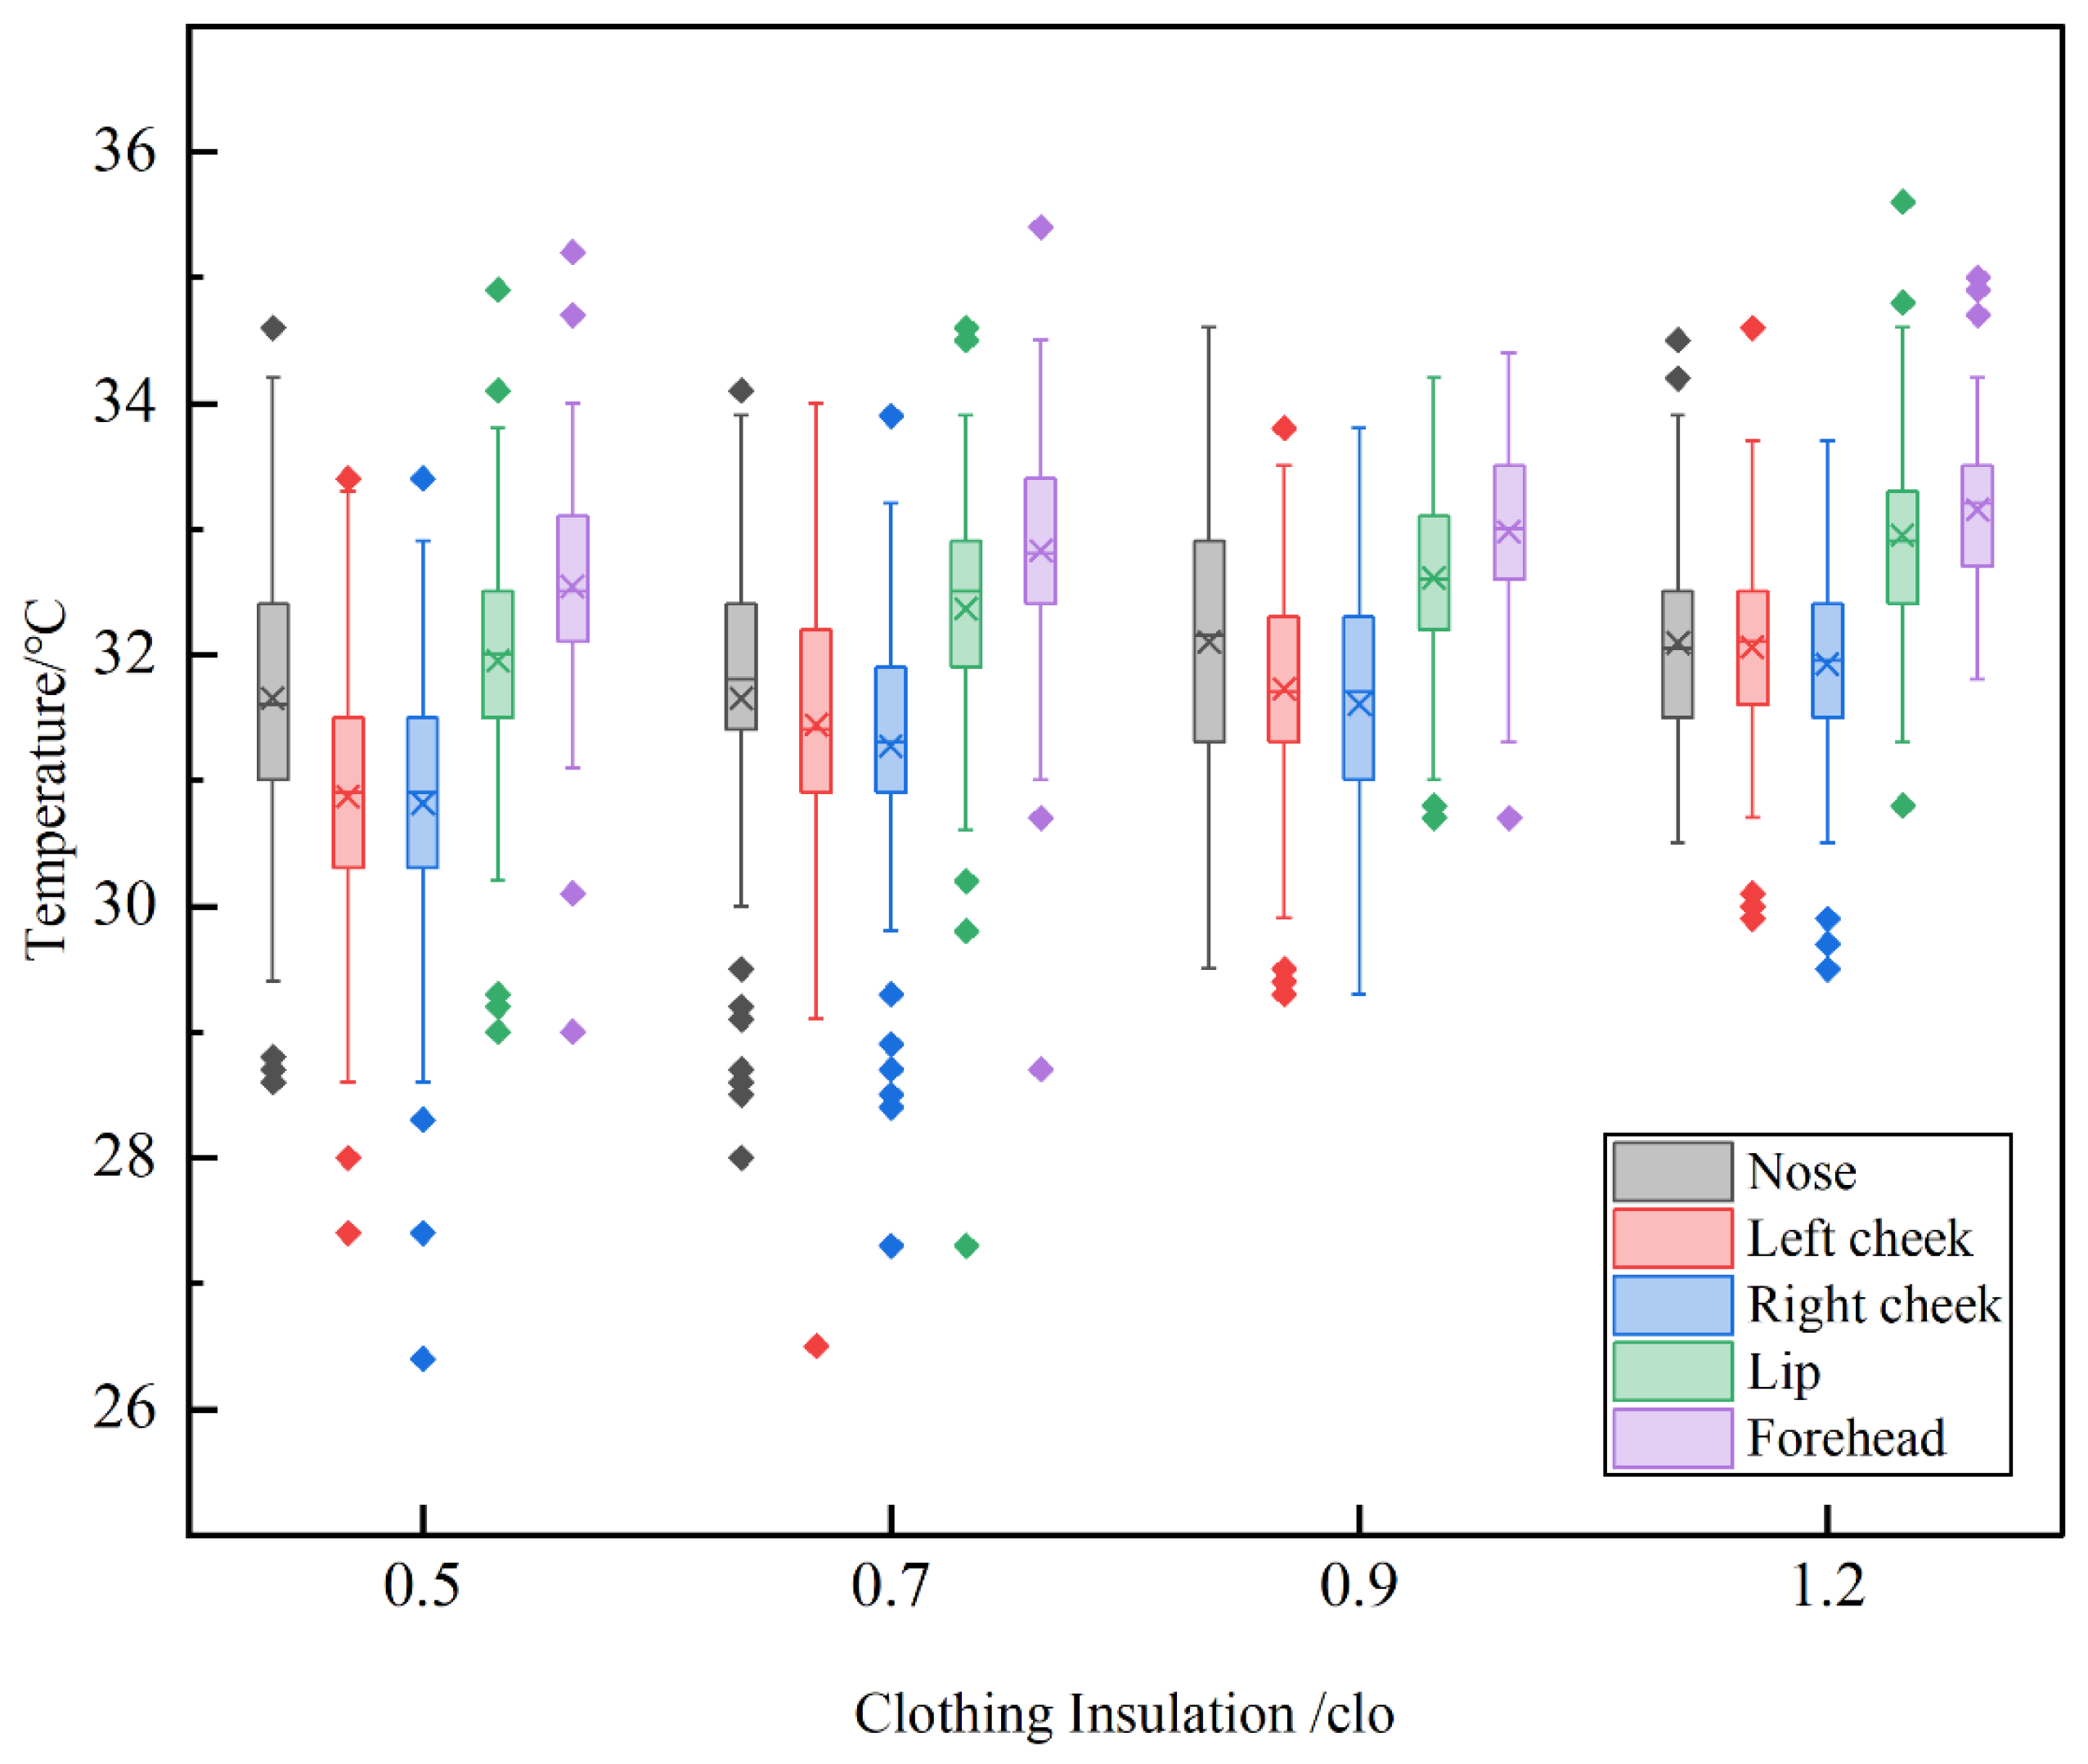
Figure 8 displays a box plot illustrating changes in skin temperature across different facial regions under varying clothing insulation values. As shown in Figure 8, overall, skin temperatures in the five facial areas—nose, left cheek, right cheek, lip, and forehead—gradually increase with rising clothing insulation, exhibiting a positive correlation. This occurs because enhanced insulation of the torso reduces heat dissipation to the environment, leading to a slight rise in facial temperatures.
Among different clothing insulation levels, the forehead consistently exhibits the highest temperature with minimal dispersion and few outliers. This indicates that the forehead is less affected by clothing insulation and remains relatively stable. This may be attributed to the forehead being a hairy skin area lacking abundant arteriovenous anastomoses (AVAs), where blood flow regulation is primarily governed by metabolic demands rather than thermoregulation [30]. Consequently, forehead temperature is relatively unaffected by environmental and clothing influences. Nasal temperatures were lower, with greater variability and numerous outliers concentrated below the dispersion threshold. This indicates significant individual differences and a high susceptibility to hypothermia. This may stem from the unique characteristics of nasal tip skin, which is rich in AVAs directly innervated by the sympathetic nervous system. As key effectors of thermoregulation, AVAs rapidly modulate blood flow through vasoconstriction and vasodilation, enabling sensitive responses to thermal environmental changes [31]. When stimulated, the nasal region exhibits stronger vasoconstriction and more pronounced responses to temperature changes. Both cheeks show lower temperatures across different clothing insulation levels, with most outliers occurring below the threshold, particularly at 0.7 clo. The left cheek maintains higher temperatures than the right, while the right cheek exhibits more outliers. Lip temperatures remain relatively stable and show a certain correlation with clothing insulation.
At 0.5 clo and 0.7 clo, overall facial temperatures were lower, with numerous outliers appearing, particularly in the lower regions. This indicates that at lower clothing insulation levels, some subjects may have experienced cold discomfort, amplifying individual differences: subjects with lower cold tolerance exhibited significant drops in facial temperatures, especially on the cheeks. At 0.9 clo, facial temperatures slightly increased, with the fewest outliers among all clothing insulation levels. This indicates that at this clo level, the garment’s insulation balanced metabolic heat production with environmental heat loss, placing most subjects in thermal equilibrium. At 1.2 clo, the average facial temperature reached its maximum. Extreme outliers decreased in the lower region while increasing in the upper region. However, the right cheek and lips exhibited greater dispersion and more outliers, suggesting that different skin areas possess varying thermoregulatory capabilities in response to ambient temperatures.

3.3. Development of a Human Thermal Sensation Prediction Model

The experimental results indicate that among the skin temperatures across different facial regions, the skin temperatures of the left and right cheeks and lips exhibit a stronger correlation with human thermal sensation. Furthermore, in naturally ventilated environments or during shoulder seasons, environmental parameters fluctuate. Since most of the body is covered by clothing, there is a significant time lag in skin temperature changes, and the face is typically unobstructed by clothing and exposed to the air, allowing for skin temperature monitoring via non-contact infrared imaging equipment. Facial skin temperature has been demonstrated to serve as an indicator of an individual’s overall thermal comfort [30,32]. Given the multicollinearity among facial features, particularly the high correlation of 0.89 between the left and right cheeks, which could skew the feature importance rankings in the random forest model, we conducted a rigorous VIF analysis on all input features. Preliminary analysis showed VIF values of 6.04 and 6.96 for the left and right cheek temperatures, respectively (both exceeding the standard threshold of 5). Therefore, to eliminate multicollinearity, we constructed a new feature by averaging the temperatures of the left and right cheeks, combining them into a single “average cheek temperature” feature. After construction, the VIF for the average cheek temperature was 3.97, the VIF for the lips was 2.74, the VIF for the forehead was 2.51, and the VIF for the clothing heat group was 2.40; all feature VIF values were below 5. Therefore, this study first established a human thermal sensation prediction model using only the skin temperatures of these three facial regions, without considering clothing insulation. As shown in the first row of Table 4, the model’s RMSE was 0.869, indicating poor prediction accuracy. When further incorporating the influence of clothing insulation, separate thermal sensation prediction models were developed for different clothing insulation conditions. The results are shown in rows 2–5 of Table 4. The RMSE of the thermal sensation prediction models under the four clothing insulation conditions was below 0.5, indicating that the models all possess good predictive accuracy.
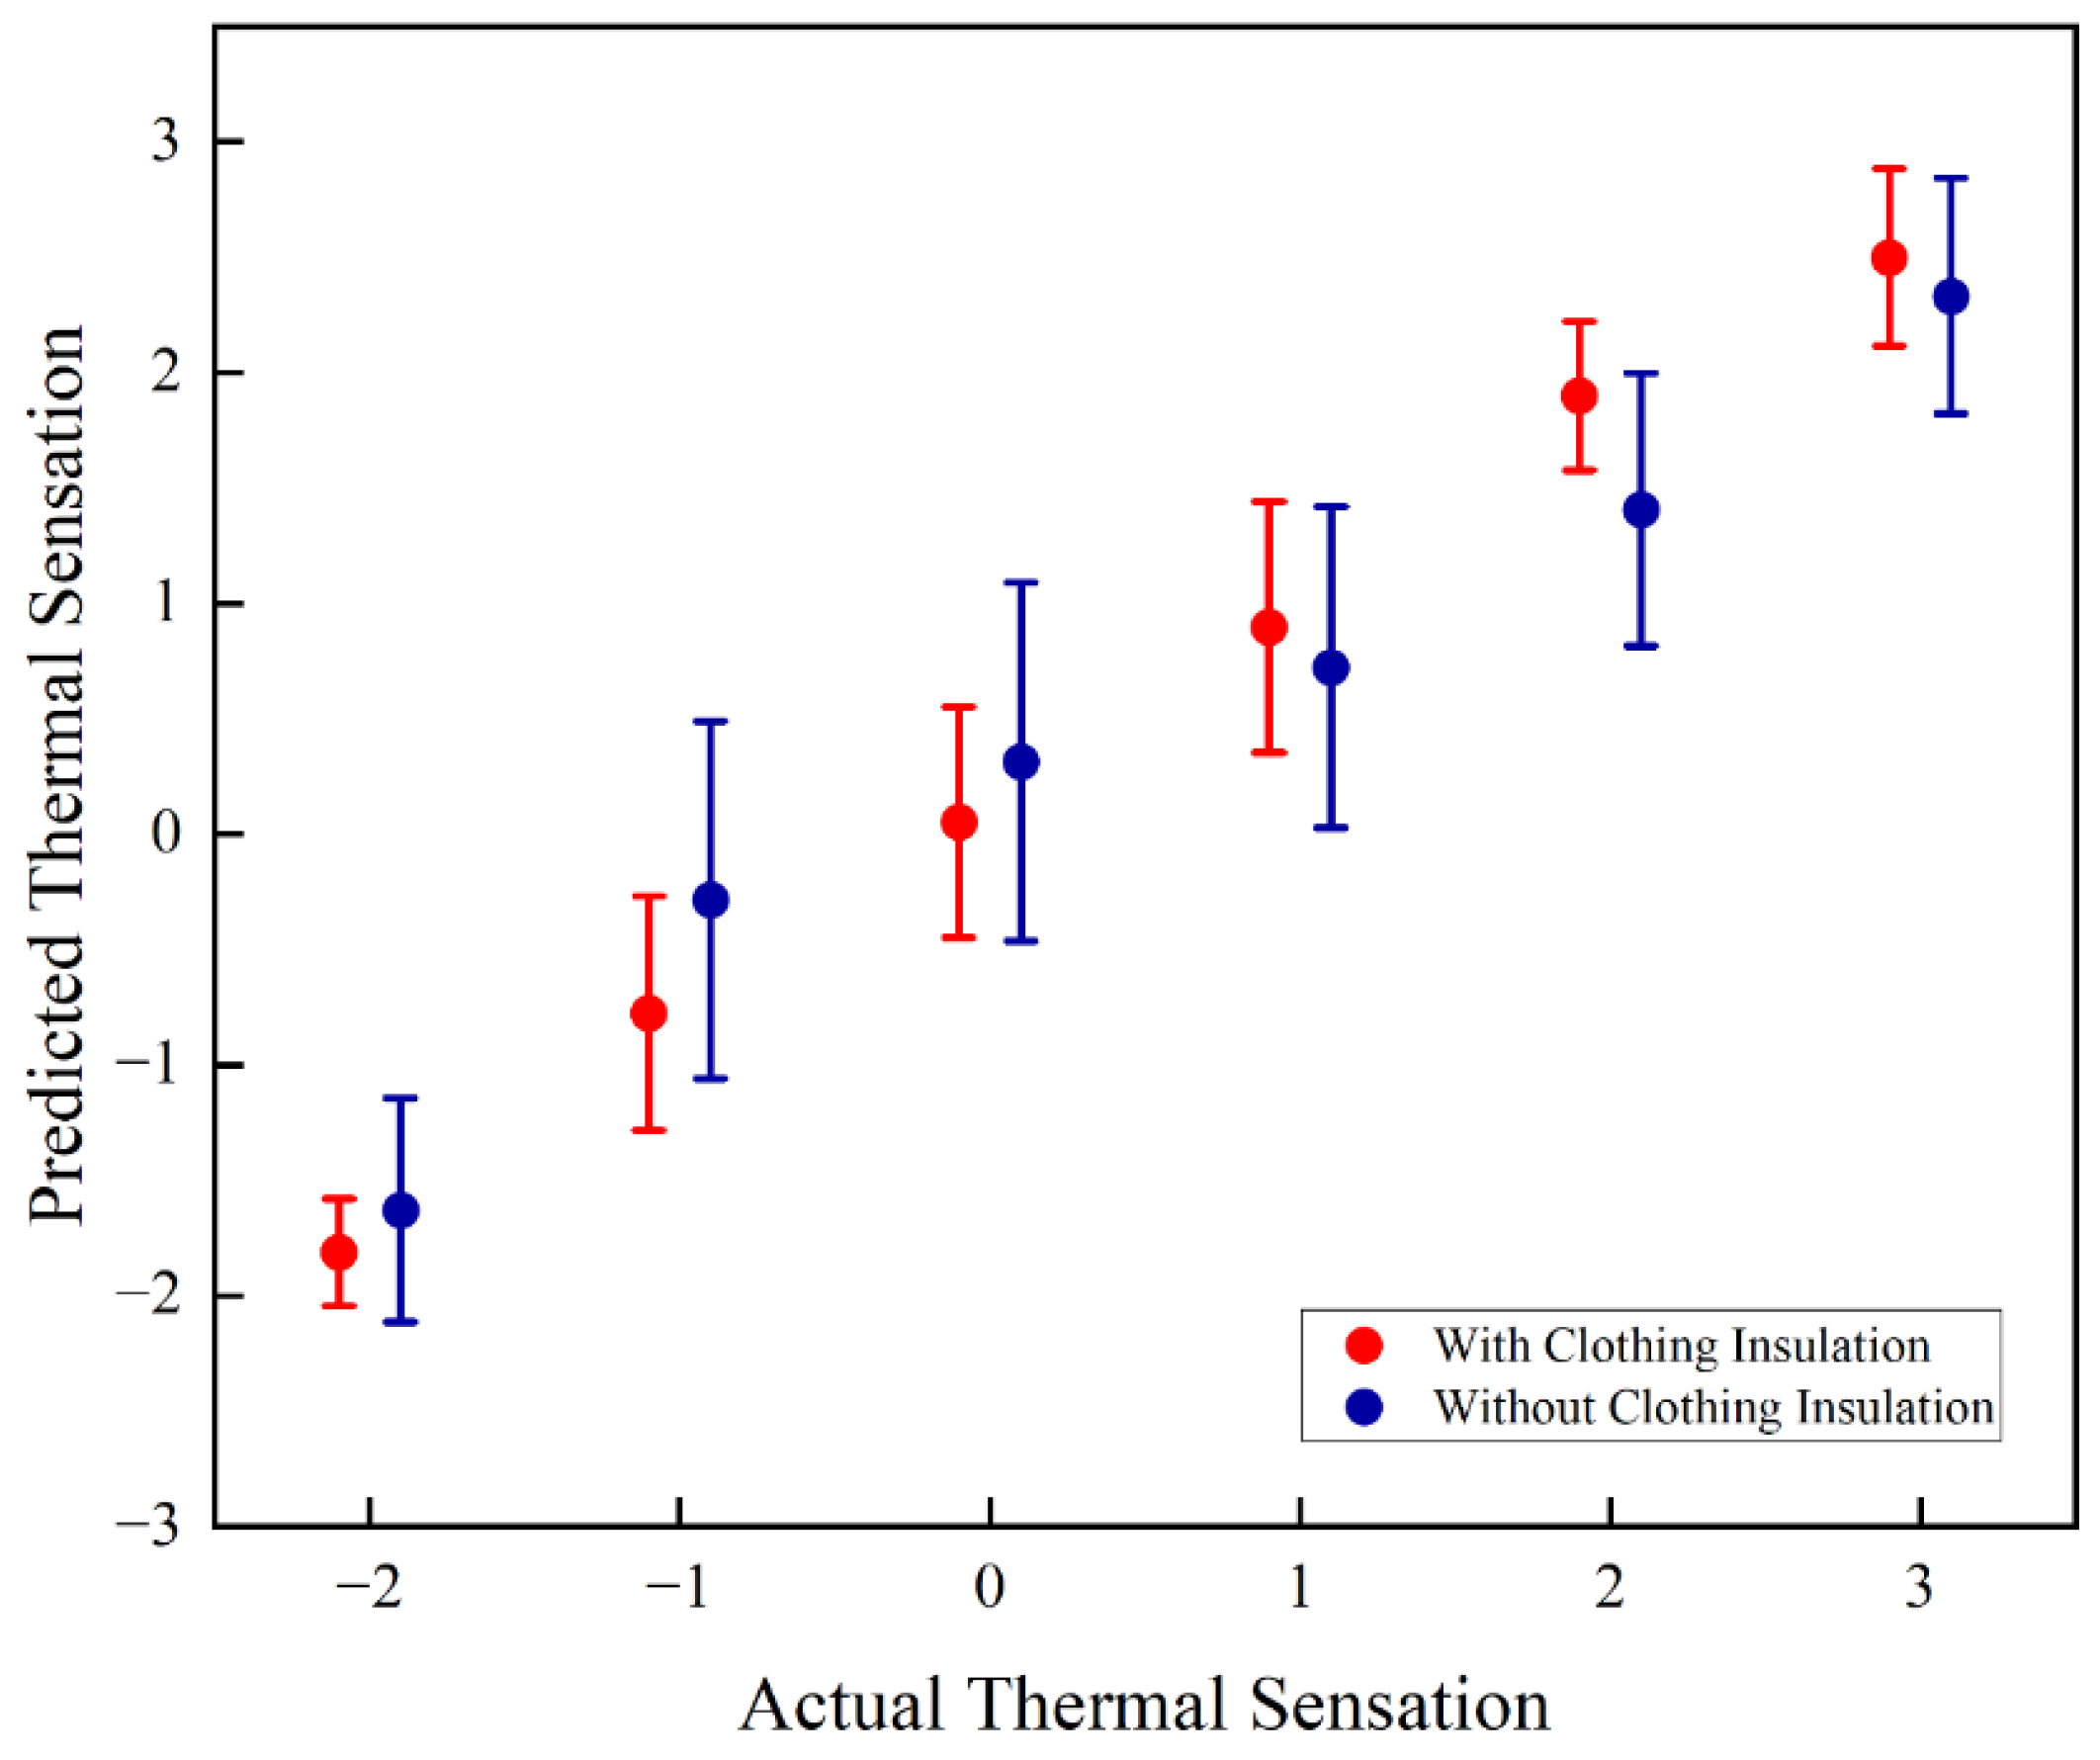
Clothing serves as a “shield” for heat exchange between the human body and the external environment, determining the rate of thermal interaction and thus significantly influencing thermal sensation. Analysis indicates that clothing insulation correlates strongly with the TSV (0.76), exhibiting a clear upward trend as insulation increases. Consequently, clothing insulation can be incorporated as an input variable in human thermal sensation prediction models. This study further employs a random forest method to establish a human thermal sensation prediction model based on clothing insulation and facial skin temperature. Figure 9 compares the prediction errors (error bars) between models with and without clothing insulation. Without clothing insulation, the model exhibits pronounced neutrality bias, with predictions clustering near neutral values and failing to accurately capture extreme thermal sensations. Conversely, incorporating clothing insulation corrects this error, yielding a near-linear relationship between predicted and actual values. Moreover, incorporating clothing insulation significantly shortens the error bars. This reduction in prediction variance indicates substantially diminished model uncertainty. When Clo is included as an input parameter, the RMSE drops to 0.533, representing a 38.7% improvement in prediction accuracy compared to models without Clo. This confirms clothing insulation as a critical variable influencing thermal sensation prediction precision, demonstrating that its inclusion enables more accurate thermal sensation forecasting.

4. Discussion

This study proposes a non-contact method for predicting human thermal sensation based on infrared thermal imaging technology, addressing the complex and variable thermal environment of natural ventilation during shoulder seasons. By capturing facial skin temperature characteristics via infrared thermal imaging equipment and incorporating clothing insulation as input parameters, a random forest algorithm was employed to establish a human thermal sensation prediction model, achieving high predictive accuracy. The findings not only validate the feasibility of non-contact thermal comfort assessment under transient conditions during shoulder seasons but also provide a methodology for predicting human thermal sensation in naturally ventilated environments during these periods.
As analyzed in Section 3, during shoulder seasons with unchanged activity levels, clothing insulation exhibits the strongest correlation with thermal sensation on the left and right cheeks and lips, while showing low correlation with the forehead, nose, and room temperature. The error bar chart comparing clothing insulation and TSV indicates a positive correlation between clothing insulation and thermal sensation during natural ventilation in shoulder seasons. This further confirms the significant influence of clothing insulation on thermal sensation, particularly under natural ventilation conditions in shoulder seasons, consistent with the findings of Zhao et al. [22]. As shown in Figure 8, facial temperature increases significantly with rising clothing insulation. The forehead remains relatively stable, while the nose and right cheek exhibit greater sensitivity. This demonstrates that during shoulder seasons, adjusting clothing not only markedly alters subjective thermal perception but also induces significant physiological parameter changes. In model development, for mixed clothing conditions, incorporating clothing insulation as a variable significantly improved prediction accuracy compared to excluding it, confirming its critical importance as a feature parameter under these conditions. For single clothing conditions, the RMSE value was lowest at 0.5 clo, yielding optimal model prediction performance. As clothing insulation increases, the model’s predictive accuracy gradually decreases. This may be attributed to the limited increase in facial temperature despite enhanced thermal insulation of the torso, potentially related to participants’ clothing combinations. As the number of garments increases, variations in clothing insulation among participants may introduce discrepancies, leading to biased human thermal sensation ratings. Although indoor thermal environments exhibit limited variability, unlike traditional models that are highly sensitive to fluctuations in indoor air temperature, this random forest model captures occupants’ dynamic physiological and behavioral adaptations through real-time facial skin temperature and clothing insulation. Consequently, the model learns the intrinsic nonlinear mapping between the physiological state and TSV. Furthermore, the 5-fold cross-validation implemented during the training phase strictly ensures that the model extracts patterns with generalization capabilities rather than overfitting to stable thermal conditions during a specific experimental period. In terms of the feasibility of deployment in real-world building systems, the prediction framework proposed in this study, which combines infrared thermal imaging with random forests, demonstrates distinct advantages. Compared to RGB cameras, infrared imaging technology does not capture facial identification details, thereby fundamentally alleviating occupants’ privacy concerns and enabling large-scale, unobtrusive deployment in office or residential spaces. Although developing high-precision visual models for estimating the clothing insulation may face challenges such as limited edge computing resources or cloud latency, as demonstrated by recent research [13], the integration of lightweight edge models or multimodal large models into smart building IoT systems is becoming increasingly mature, providing a reliable path for the practical implementation of this model. In terms of energy conservation, traditional PMV models often rely on static assumptions about seasonal clothing insulation, completely ignoring individual variations in daily attire—and even intraday clothing adjustments—during shoulder seasons. These static assumptions can cause PMV predictions to deviate from actual thermal sensations, leading to unnecessary overcooling or overheating by HVAC systems. The random forest model developed in this study captures individuals’ dynamic clothing insulation and facial skin temperature in real time, accurately reflecting the body’s adaptive regulation. This approach prevents energy waste caused by static system settings, thereby significantly improving overall energy consumption optimization efficiency.

4.1. Limitations

Despite the significant findings of this study, several limitations remain: First, the predictive model uses clothing insulation as an input parameter; however, automatically and accurately identifying a user’s clothing insulation poses a challenge in practical applications. Addressing the technical challenges associated with the contactless, dynamic measurement of clothing insulation, this study proposes that analyzing infrared thermal images using a fine-tuned multimodal large language model (MLLM) is a highly promising solution. As demonstrated by the framework proposed by Heravi et al. [13], when trained on the Thermal Cloth500 dataset, the MLLM can accurately classify the clothing insulation of individual garments while leveraging the characteristics of infrared imaging to mitigate the privacy risks associated with RGB cameras. Second, the sample size comprised only 20 human participants, all undergraduate students residing in Changsha for over one year. While this sample size is viable for statistical and correlation analyses yielding meaningful data, the results may not be transferable to other regions due to geographical variations. Increasing the number of participants would enhance the validity and accuracy of the findings. Additionally, the study did not include participants from different age groups. Since thermal sensation may vary significantly across age groups, the corresponding thermal sensation prediction models would also require adjustments. Third, the indoor temperatures observed during data collection were relatively stable and did not fully capture the extreme temperature fluctuations typical of shoulder seasons. Although the use of physiological indicators and cross-validation techniques has enhanced the model’s robustness, it remains necessary to thoroughly validate its performance under highly variable environmental conditions.

4.2. Future Research

Future research can explore the following directions: First, non-contact measurement methods can be adopted to accurately obtain the clothing insulation. Second, integrating more physiological and environmental indicators can further optimize the combination of model input parameters. Third, considering the impact of different room temperatures on thermal sensation during shoulder seasons can enhance the prediction accuracy of the model and expand its application scenarios. Fourth, applying the model to actual building environmental control systems can validate its effectiveness in enhancing energy efficiency and comfort levels. These research directions will contribute to a more comprehensive evaluation of the predictive model’s efficacy and advance the development of personalized thermal comfort control technologies.

5. Conclusions

This study employed non-contact infrared thermal imaging technology to collect facial thermal imaging data and subjective thermal sensation votes from subjects wearing garments with varying clothing insulation levels (0.5–1.2 clo) under natural ventilation conditions. It systematically investigated the effects of clothing insulation and facial regional temperatures on thermal sensation. Combining a random forest algorithm, a human thermal sensation prediction model based on clothing insulation and facial skin temperature was established for shoulder seasons. Based on this research, we draw the following conclusions:
(1)
During shoulder seasons with natural ventilation, different facial regions exhibit varying thermal regulation capabilities. The temperatures of the left and right cheeks and the lips show higher correlations with thermal sensation, with correlation coefficients of 0.65, 0.67, and 0.59, respectively. The PMV values measured by the instrument differed significantly from the volunteers’ subjective thermal sensations. This is because, under naturally ventilated conditions during shoulder seasons, dynamic fluctuations in the indoor thermal environment cause the human body’s thermal balance to deviate from a steady state, which exceeds the steady-state assumptions underlying the PMV model. This indicates that traditional PMV models do not provide sufficiently accurate predictions in naturally ventilated environments during shoulder seasons.
(2)
The overall facial temperature increases with rising clothing insulation. The correlation coefficient between thermal sensation votes and clothing insulation is 0.78, indicating a strong correlation. This demonstrates that clothing insulation significantly influences human thermal sensation when ambient temperature remains relatively stable, suggesting it can serve as an input parameter for human thermal sensation prediction models.
(3)
Without considering clothing insulation, the RMSE of the thermal sensation prediction model based solely on facial skin temperatures from three regions was 0.869. When the input parameters included Clo, the RMSE decreased to 0.533, representing a 38.7% improvement in prediction accuracy compared to the model without Clo. This indicates that clothing insulation is a key variable affecting thermal sensation prediction accuracy, and incorporating it enables more precise thermal sensation forecasting. It should be noted that the current model’s applicability is strictly limited to the young adult demographic (aged 18–23), and its universality in real-world building applications remains to be verified for other age groups.

Author Contributions

Conceptualization and design, W.L. (Wei Li) and Q.L.; Methodology, W.L. (Wei Li) and J.Z.; Software, Q.L. and W.L. (Weizhen Liu); Validation, W.L. (Wei Li) and K.M.; Formal analysis, Q.L.; Investigation, J.L.; Resources, K.M.; Data organization, Q.L., J.L. and W.L. (Weizhen Liu); Writing—Drafting, Q.L.; Writing—Review and Editing, W.L. (Wei Li), K.M., X.S., W.L. (Weizhen Liu) and J.Z.; Visualization, Q.L. and J.L.; Supervision, W.L. (Wei Li); Project management, X.S.; Funding acquisition, W.L. (Wei Li). All authors have read and agreed to the published version of the manuscript.

Funding

This research was funded by National Natural Science Foundation of China grant number [52508101].

Institutional Review Board Statement

The experiments were conducted at Changsha University of Science and Technology. All participants were informed about the experimental procedures and provided written informed consent to participate in the study. The study received ethical approval from the Institutional Ethics Committee of Changsha University of Science and Technology.

Data Availability Statement

The data presented in this study are available on request from the corresponding author due to privacy and ethical restrictions. The data are not publicly available as they contain physiological measurements and individual participant responses that could compromise participant confidentiality.

Acknowledgments

The authors greatly appreciate the subjects who participated in the experiments.

Conflicts of Interest

The authors declare that they have no known competing financial interests or personal relationships that could have appeared to influence the work reported in this paper.

References

  1. Li, S.; Zhang, X.; Li, Y.; Gao, W.; Xiao, F.; Xu, Y. A comprehensive review of impact assessment of indoor thermal environment on work and cognitive performance—Combined physiological measurements and machine learning. J. Build. Eng. 2023, 71, 106417. [Google Scholar] [CrossRef]
  2. Liu, W.; Wu, Y.; Shi, L.; Li, J.; Wang, Z.; Tian, X. The relationship between thermal comfort, performance, and electroencephalogram during cognitive tests at normal indoor temperatures in summer. Build. Environ. 2024, 257, 111567. [Google Scholar] [CrossRef]
  3. Xie, J.; Li, H.; Li, C.; Zhang, J.; Luo, M. Review on occupant-centric thermal comfort sensing, predicting, and controlling. Energy Build. 2020, 226, 110392. [Google Scholar] [CrossRef]
  4. Feng, Y.; Wang, J.; Wang, N.; Chen, C. Alert-based wearable sensing system for individualized thermal preference prediction. Build. Environ. 2023, 232, 110047. [Google Scholar] [CrossRef]
  5. Li, W.; Zhang, J.L.; Zhao, T.Y.; Liang, R.B. Experimental research of online monitoring and evaluation method of human thermal sensation in different active states based on wristband device. Energy Build. 2018, 173, 613–622. [Google Scholar] [CrossRef]
  6. Lee, J.; Ham, Y. Physiological sensing-driven personal thermal comfort modelling in consideration of human activity variations. Build. Res. Inf. 2021, 49, 512–524. [Google Scholar] [CrossRef]
  7. Jin, Q.; Li, X.; Duanmu, L.; Shu, H.; Sun, Y.; Ding, Q. Predictive model of local and overall thermal sensations for non-uniform environments. Build. Environ. 2012, 51, 330–344. [Google Scholar] [CrossRef]
  8. Choi, J.-H.; Loftness, V. Investigation of human body skin temperatures as a biosignal to indicate overall thermal sensations. Build. Environ. 2012, 58, 258–269. [Google Scholar] [CrossRef]
  9. Choi, J.-H.; Yeom, D. Study of data-driven thermal sensation prediction model as a function of local body skin temperatures in a built environment. Build. Environ. 2017, 121, 130–147. [Google Scholar] [CrossRef]
  10. Chaudhuri, T.; Zhai, D.; Soh, Y.C.; Li, H.; Xie, L. Thermal comfort prediction using normalized skin temperature in a uniform built environment. Energy Build. 2018, 59, 426–440. [Google Scholar] [CrossRef]
  11. Tian, X.; Shi, L.; Wang, Z.; Liu, W. A thermal comfort evaluation model based on facial skin temperature. Build. Environ. 2023, 235, 110244. [Google Scholar] [CrossRef]
  12. Li, P.; Dai, P.; Cao, D.; Liu, B.; Lu, Y. Non-intrusive comfort sensing: Detecting age and gender from infrared images for personal thermal comfort. Build. Environ. 2022, 219, 109256. [Google Scholar] [CrossRef]
  13. Heravi, M.Y.; Jeong, I.; Jang, Y. Thermal image-driven clothing insulation estimation using a fine-tuned multimodal large language model. Energy Build. 2026, 351, 116720. [Google Scholar] [CrossRef]
  14. Choi, E.J.; Choi, Y.J.; Kim, N.H.; Moon, J.W. Seasonal effects of thermal comfort control considering real-time clothing insulation with vision-based model. Build. Environ. 2023, 235, 110255. [Google Scholar] [CrossRef]
  15. Zhang, S.; Yao, R.; Wei, H.; Li, B. Prediction of occupant thermal state via infrared thermography and explainable AI. Energy Build. 2024, 312, 114153. [Google Scholar] [CrossRef]
  16. Fanger, P.O. Calculation of thermal comfort: Introduction of a basic comfort equation. ASHRAE Trans. 1967, 73, III.4.1–III.4.20. [Google Scholar]
  17. Gagge, A.P.; Fobelets, A.P.; Berglund, L.G. A standard predictive index of human response to the thermal environment. ASHRAE Trans. 1986, 92, 709–731. [Google Scholar]
  18. Takahashi, Y.; Nomoto, A.; Yoda, S.; Hisayama, R.; Ogata, M.; Ozeki, Y.; Tanabe, S.-I. Thermoregulation model JOS-3 with new open source code. Energy Build. 2021, 231, 110575. [Google Scholar] [CrossRef]
  19. Liu, D.; Tong, X.; Wang, H.; Yang, J. An extended individualized two-node human thermal model for high-temperature environments. Int. J. Ind. Ergon. 2025, 109, 103792. [Google Scholar] [CrossRef]
  20. Zhou, X.; Miao, Z.; Yuan, M.; Li, K.; Guo, H.; Lin, X.; Zeng, Y.; Tu, R.; Zhong, J. Dual-phase prediction model of passenger thermal sensation using facial thermal imaging and environmental factors. Case Stud. Therm. Eng. 2024, 58, 104439. [Google Scholar] [CrossRef]
  21. Hu, S.; Sun, J.; Zhang, J.; Liu, G.; Zhao, S. Thermoacoustic environment comfort evaluation method based on facial micro-expression recognition. Build. Environ. 2022, 221, 109263. [Google Scholar] [CrossRef]
  22. Zhao, H.; Xia, B.; Zhao, J.; Zhao, S.; Kuai, H.; Zhang, X.; Yan, G. Comparative study on the correlation between human local and overall thermal sensations based on supervised machine learning. Energy Build. 2025, 328, 115061. [Google Scholar] [CrossRef]
  23. Liu, W.; Li, S.; Yang, D.; Xu, J.; Sun, L.; Lin, W. The differences in thermal physiological parameters, thermal comfort, and thermal acceptability under the same thermal sensation in air-conditioned environments between winter and summer. Energy Build. 2025, 333, 115486. [Google Scholar] [CrossRef]
  24. He, W.; Yin, D.; Li, K.; Zhan, J.; Wang, S. Thermal sensation prediction model for the elderly in rural areas of cold regions under winter conditions. Energy Build. 2025, 337, 115657. [Google Scholar] [CrossRef]
  25. Jones, N.; Chaires, I.; Mackenzie, I.; Arioto, T.; Goehring, A. Predicting thermal comfort for diverse populations. In Proceedings of the Building Simulation 2021: 17th Conference of IBPSA, Bruges, Belgium, 1–3 September 2021. [Google Scholar]
  26. Song, G.; Ai, Z.; Zhang, G.; Peng, Y.; Wang, W.; Yan, Y. Using machine learning algorithms to multidimensional analysis of subjective thermal comfort in a library. Build. Environ. 2022, 212, 108790. [Google Scholar] [CrossRef]
  27. Schiavon, S.; Lee, K.H. Dynamic predictive clothing insulation models based on outdoor air and indoor operative temperatures. Build. Environ. 2013, 59, 250–260. [Google Scholar] [CrossRef]
  28. 55-2020; Thermal Environmental Conditions for Human Occupancy (Includes ANSI/ASHRAE Addenda Listed in Appendix N). American Society of Heating, Refrigerating, and Air Conditioning Engineers (ASHRAE): Peachtree Corners, GA, USA, 2020.
  29. Breiman, L. Random forests. Mach. Learn. 2001, 45, 5–32. [Google Scholar] [CrossRef]
  30. Ghahramani, A.; Castro, G.; Becerik-Gerber, B.; Yu, X. Infrared thermography of human face for monitoring thermoregulation performance and estimating personal thermal comfort. Build. Environ. 2016, 109, 1–11. [Google Scholar] [CrossRef]
  31. Diaz-Piedra, C.; Gomez-Milan, E.; Di Stasi, L.L. Nasal skin temperature reveals changes in arousal levels due to time on task: An experimental thermal infrared imaging study. Appl. Ergon. 2019, 81, 102870. [Google Scholar] [CrossRef]
  32. Yi, B.; Choi, J.-H. Facial skin temperature as a proactive variable in a building thermal comfort control system. In Sustainable Human–Building Ecosystems; American Society of Civil Engineers: Reston, VA, USA, 2015; pp. 117–125. [Google Scholar]
Figure 1. Experimental layout diagram: (a) laboratory model; (b) field experiment.
Buildings 16 02070 g001
Figure 2. Experimental timeline.
Buildings 16 02070 g002
Figure 3. Overall experimental flowchart.
Buildings 16 02070 g003
Figure 4. Facial temperature map: (a) before segmentation; (b) after segmentation.
Buildings 16 02070 g004
Figure 5. Heatmap of correlations between thermal sensation and various physiological parameters.
Buildings 16 02070 g005
Figure 6. Error bar chart for TSV and PMV.
Buildings 16 02070 g006
Figure 7. Error bar chart for clothing insulation and TSV.
Buildings 16 02070 g007
Figure 8. Box plots of local facial skin temperatures under different clothing insulation levels.
Buildings 16 02070 g008
Figure 9. Comparison of error bars between predicted and actual thermal sensation.
Buildings 16 02070 g009
Table 1. Model numbers and specifications for sensors.
Measurement ParametersEquipment ModelMeasurement RangePrecision
Average indoor temperature22DTH-13M253.15~353.15 K0.1 K
Average indoor humidity22DTH-13M0~100%0.1%
Facial skin temperatureFLIP C3-X263.15~323.15 K0.1 K
Table 2. Subject information table (Mean + Standard Deviation).
GenderHeight (cm)Weight (kg)BMI
Male172.70 ± 4.9067.10 ± 6.3022.51 ± 2.15
Female164.60 ± 4.5552.50 ± 6.1019.37 ± 2.01
Total168.65 ± 6.2059.80 ± 9.6220.94 ± 2.59
Table 3. Thermal sensation questionnaire.
Thermal Sensation VoteHot
(+3)
Warm
(+2)
Slightly warm
(+1)
Neutral
(0)
Slightly cool
(−1)
Cool
(−2)
Cold
(−3)
Thermal comfort voteComfortable
(0)
Slightly uncomfortable
(1)
Uncomfortable
(2)
Very uncomfortable
(3)
Unbearable
(4)
Thermal preference voteWarmer (1)No change (0)Cooler (−1)
Table 4. Model prediction accuracy under different garment operating conditions.
Clothing Insulation Conditions/cloInput ParametersRMSE
0.5, 0.7, 0.9, 1.2Average cheek, lip0.869
0.5Average cheek, lip0.435
0.7Average cheek, lip0.483
0.9Average cheek, lip0.446
1.2Average cheek, lip0.492
0.5, 0.7, 0.9, 1.2Clo, average cheek, lip0.533
Disclaimer/Publisher’s Note: The statements, opinions and data contained in all publications are solely those of the individual author(s) and contributor(s) and not of MDPI and/or the editor(s). MDPI and/or the editor(s) disclaim responsibility for any injury to people or property resulting from any ideas, methods, instructions or products referred to in the content.